Article

Towards a Climate-Resilient Metropolis: A Neighborhood-Scale Nature-Based Urban Adaptation Planning Approach

by
Merve Kalaycı Kadak
Department of Landscape Architecture, Faculty of Engineering and Architecture, Kastamonu University, Kastamonu 37150, Türkiye
Sustainability 2025, 17(16), 7356; https://doi.org/10.3390/su17167356
Submission received: 19 July 2025 / Revised: 2 August 2025 / Accepted: 12 August 2025 / Published: 14 August 2025
(This article belongs to the Special Issue Sustainable Built Environment: From Theory to Practice)

Abstract

This study aims to classify the Heat Risk Index (HRI), a critical component in climate change adaptation efforts, and to demonstrate how the cooling effect of trees influences HRI levels in areas suitable for afforestation. Istanbul, a global metropolis, was selected as the study area. Spatial analyses were conducted at the neighborhood scale. Within this scope, an afforestation scenario was implemented for a selected neighborhood to explore how HRI values could be reduced. The neighborhood-level approach constitutes the distinctive aspect of this study. The HRI analysis was classified into five levels using three interrelated variables: lack of tree canopy, population density, and land surface temperature (LST). ArcGIS Pro 3.5.2, a geographic information systems software, was employed as the primary analytical tool. The analysis revealed that 24.97% of Istanbul’s neighborhoods fell into the “relatively high” risk category, while 36.45% fell into the “higher–intermediate” risk category. In this context, a critical neighborhood sample from the higher–intermediate risk group, representing the largest proportion, was selected for scenario testing. The scenario demonstrated that a 6% increase in afforestation within the neighborhood lowered its HRI classification by one level. As a result, the method applied in this scenario was proven applicable for use in climate adaptation planning.

1. Introduction

Climate change refers to long-term alterations in meteorological variables such as temperature and precipitation, primarily driven by human activities. According to the United Nations Framework Convention on Climate Change [1], it is defined as “a change of climate which is attributed directly or indirectly to human activity that alters the composition of the global atmosphere and which is in addition to natural climate variability observed over comparable time periods”. Global climate change, particularly in the form of rising temperature trends, is increasingly leading to severe environmental and social challenges, especially in metropolitan areas [2,3].
The intensification of air temperatures and the frequency and severity of heatwaves are being acutely felt worldwide, especially in metropolitan zones characterized by high population density and extensive artificial surfaces [4]. Approximately 40% of the global population resides in regions where daytime temperatures regularly exceed 30 °C [5]. Exposure to high temperatures in urban areas notably increases the levels of thermal stress among city dwellers [6]. One of the most tangible manifestations of this phenomenon is the urban heat island (UHI) effect, which evidences that urban populations are more exposed to thermal stress compared to rural counterparts [7,8]. The UHI effect is exacerbated by the dense built environment, scarcity of tree canopy, and high population concentrations commonly found in metropolises [8]. This, in turn, contributes to environmental inequalities, disproportionately affecting vulnerable ecosystems and socially disadvantaged population groups, particularly the elderly and children [9]. The adverse impacts of climate change are more acutely experienced in urban areas, where risks are amplified by the spatial configuration of the built environment [7]. In this context, assessing climate-related risks specific to urban settings is essential for understanding current vulnerabilities and informing future projections [7,10]. One such diagnostic tool is the Heat Risk Index (HRI), which allows for the identification of temperature-related risk levels across different urban zones. The HRI is influenced not only by meteorological variables, such as temperature, humidity, precipitation, and solar radiation [2], but also by a range of anthropogenic and sociospatial factors. These include population density, levels of demographic vulnerability, the proportion of impervious surfaces, green space availability, and socioeconomic disparities [11]. Population density contributes to the proliferation of impervious surfaces, which in turn exacerbates urban heat island (UHI) formation due to their capacity to retain heat [12]. From a social perspective, it also increases the number of individuals exposed to high temperatures that pose threats to human health [13]. Existing studies have focused on both rural and urban areas; however, the findings cannot be categorically classified based on the nature of the area alone [14]. In this context, it is well-established that individuals with low income levels—regardless of whether they reside in rural or urban settings—are more likely to experience extreme thermal stress [15,16,17,18]. Therefore, population density serves as a combined indicator of both the physical presence of heat and the number of people exposed to it, making it a critical input in climate change adaptation processes [19,20]. IPCC reports also emphasize the need to prioritize disadvantaged populations within the framework of SSPs, particularly in the development of adaptation strategies [21]. Limited vegetative cover, high population concentrations, and an abundance of artificial or bare surfaces that elevate land surface temperature (LST) exacerbate heat-related health outcomes and can even lead to mortality [22,23,24,25]. Multifactorial assessments enable a more comprehensive and integrative understanding of these risks [26,27]. Within this framework, predictive indices such as the HRI [28] are beneficial when incorporated into urban decision-making processes, especially in metropolises characterized by heterogeneous demographic structures and diverse land use–land cover types [29,30,31,32]. Among the key components of such multi-dimensional spatial risk assessments is land surface temperature (LST), which can be effectively mapped through remote sensing technologies [33,34]. Accordingly, LST data serve as one of the most critical variables in the classification of the HRI, offering a reliable proxy for heat exposure at high spatial resolution. Moreover, LST data can also be employed to detect UHI effects. In metropolises with a high density of artificial surfaces and built structures, the intensification of heat risk in urban areas is directly linked to this parameter [35,36,37]. LST is strongly associated with a lack of tree canopy, extensive impervious surface coverage, and high population density. An increase in tree cover reduces LST, thereby contributing to a spatial decrease in heat-related risk levels. In this context, the relationship between the presence or absence of tree canopy and LST is of critical importance in spatially assessing heat risk [33,38,39]. Heat risk is not solely determined by physical environmental factors. Social vulnerability must also be considered. Accordingly, socio-demographic variables, such as population density and income level, should be integrated into spatial heat risk assessments [9,40].
In addition to these insights, the most recent global climate change scenarios—Shared Socioeconomic Pathways (SSPs)—developed by the IPCC emphasize the need to incorporate spatial scenario-based planning not only for assessing current conditions but also for anticipating future climate risks [21,41,42]. For instance, SSP3, which reflects the current global trajectory, projects a worsening climate future marked by rapid population growth, unregulated urbanization, and low levels of environmental awareness. Under this scenario, global temperatures are expected to rise significantly [21,43,44]. The IPCC’s Sixth Assessment Report further notes that approximately half of Europe’s population will be at heightened risk of heat-related stress during summer months. Vulnerable populations, such as the elderly, pregnant individuals, young children, people with preexisting health conditions, and low-income groups, are expected to experience disproportionately severe impacts from heatwaves. The report also highlights the importance of implementing adaptation measures to mitigate the risks associated with future extreme heat events [21,45]. In this context, conducting HRI analysis based on population density, the presence or absence of tree canopy, and LST is critical for identifying the potential spatial manifestations of climate change impacts [46,47,48]. By integrating projections from global climate scenarios, this study aims to conduct a spatially explicit analysis at a finer urban scale—namely, within metropolitan districts—while also offering targeted recommendations for climate adaptation. The primary objective of this study is to develop and map HRI classifications within the Istanbul metropolitan area, which is characterized by intense urbanization, using neighborhood-level data on population density, lack of tree canopy, and mean land surface temperature. This study differs from previous research by conducting the analysis at the neighborhood scale, thereby addressing a notable gap in the existing literature. This study also proposes a spatially grounded approach that can be operationalized at the neighborhood scale, which is the most granular administrative unit of urban systems, as a planning tool in the climate change adaptation process.

2. Materials and Methods

High temperatures and sudden weather events, observed globally as consequences of climate change, are among the most significant climate related threats. With rising temperatures, the number of hot days is also increasing, and cities, ecosystems, and even entire living systems are being adversely affected worldwide. To mitigate these adverse effects, it is critical to develop detailed adaptation plans at a localized scale. In this context, the present study aimed to generate an HRI map to support strategic and localized spatial adaptation planning in response to the impacts of global climate change. The HRI serves as a tool for identifying climate-related risks at the spatial level, helping to prioritize vulnerable locations and even communities in need of targeted interventions. This study was conducted in Istanbul, the most populous city in Türkiye and a global metropolis, using neighborhood-level analysis. The projected risks call for climate sensitive adaptation measures. Accordingly, this study also aimed to demonstrate how the cooling effect of trees influences LST and the HRI in areas suitable for afforestation. A scenario was developed for a single neighborhood to show how HRI values could be reduced through increased tree cover.

2.1. Study Area

Istanbul is located in the northwestern region of Türkiye, between latitudes 40°55′ N and 41°29′ N and longitudes 27°58′ E and 29°57′ E (Figure 1). It was selected as the study area due to its status as a global metropolis, its high population density and rate of urbanization, and the presence of pronounced socioeconomic inequalities and environmental challenges. Situated at the intersection of the continents of Asia and Europe, Istanbul covers a surface area of 5461 square kilometers and has a total population of 15,701,602 [49].
Approximately one quarter of Türkiye’s urban population resides in and around Istanbul [50]. The citywide average LST is approximately 28 degrees Celsius. Additionally, the Köppen climate classification identifies Istanbul as having a Mediterranean climate type (Csa), and its geographic position also places it within a transitional zone that includes humid subtropical characteristics (Cfa). Summers are typically hot and dry, while winters are mild and rainy [51]. Administratively, Istanbul comprises 965 neighborhoods. The city has a tree canopy coverage rate of 52.21 percent [52]. Elevation in Istanbul ranges from sea level to 500 m. When moving inland from the coastal areas of the Marmara and Black Sea regions towards forested zones such as Belgrad Forest and Polonezköy, elevation increases progressively.

2.2. Methodology and Data Preparation

The spatial assessment of the HRI in this study was conducted through six main stages. First, the administrative boundaries of all neighborhoods in Istanbul were obtained, and their surface areas were calculated. Second, LST and tree canopy maps were generated at the neighborhood level. Third, areas lacking tree canopy were identified. Finally, population data were integrated into the maps at the neighborhood level, allowing for the calculation of population densities. Additionally, a seventh supplementary stage was introduced, in which an afforestation scenario was applied to a strategically significant neighborhood, selected based on its location and urban characteristics, to assess its potential impact (Figure 2).
Step 1: Mapping of Study Area Boundaries
The selected study area, metropolitan Istanbul, is classified as a Level 3 region according to the Nomenclature of Territorial Units for Statistics (NUTS) system established by the European Union. In Türkiye, Level 3 corresponds to the provincial administrative level. Using this regional boundary as a reference, the broader boundaries of the Istanbul metropolitan area were defined. For a more granular analysis, neighborhood-level boundaries were obtained through the web-based interface Overpass Turbo, using OpenStreetMap (OSM) data.
Step 2: Tree Canopy Coverage Data
In areas characterized by intense urbanization and extensive artificial surfaces, the lack of tree canopy tends to increase proportionally. Insufficient tree coverage results in higher land surface temperatures, thereby exacerbating heat-related risks [53,54,55]. For this reason, identifying areas lacking tree canopy within the study area is a critical component of the HRI assessment.
Satellite-derived land cover data with a spatial resolution of 10 m, produced by the European Space Agency (ESA) in 2021 using combined Sentinel-1 and Sentinel-2 imagery, served as the primary dataset in this study. The WorldCover 2021 dataset, which reports an overall global accuracy of 74.4 percent, is widely accepted for use in land use and land cover analyses due to its high spatial resolution and globally standardized methodology [43]. This dataset includes eleven land cover classes and is consistent with the Land Cover Classification System (LCCS) developed by the Food and Agriculture Organization of the United Nations (FAO). Each land cover class is numerically coded from 10 to 100 [52,56]. The dataset was accessed via the ArcGIS Living Atlas of the World, a web-based service provided by ArcGIS Pro.
In the present study, the land cover class used to represent tree canopy is coded as “10” and refers to areas with a minimum tree cover of 10 percent and tree height greater than 5 m. Using ArcGIS Pro, the Zonal Statistics as Table tool was employed to calculate the percentage of tree canopy within each neighborhood. These percentages were then used to derive the proportion of surfaces lacking tree canopy, a key variable contributing to HRI levels.
Step 3: Identification of Forestry Areas
After identifying areas lacking tree canopy, it was necessary to determine where afforestation could realistically be implemented to benefit from the cooling effect of trees and thereby reduce LST and ultimately the HRI. To identify such areas, data from the General Directorate of Forestry under the Ministry of Agriculture and Forestry of the Republic of Türkiye were utilized. Specifically, the forest stand map prepared by the Directorate was employed to delineate areas classified as forest land or suitable for afforestation.
Step 4: Population Density Data
In areas experiencing population growth, the demand for housing, education, and social infrastructure leads to increased urban development. As artificial surfaces expand, green infrastructure such as tree canopy is often reduced. Therefore, population density is generally positively correlated with the lack of tree canopy [57,58]. In this context, the calculation of population density data became essential.
Neighborhood-level surface areas in Istanbul were calculated in square kilometers using ArcGIS Pro. Subsequently, updated population data for 2023 and 2024 were retrieved from the address-based population registration system of the Turkish Statistical Institute. All population data were integrated into the neighborhood boundary layer using ArcGIS Pro. Once the integration was completed, population density values were calculated at the neighborhood level using the following formula: density = population/area.
Step 5: Land Surface Temperature (LST) Data
LST is one of the most influential variables affecting the HRI [59,60]. In this study, LST was calculated using ArcGIS Pro by processing thermal data from Landsat imagery, with all images containing more than 5 percent cloud cover excluded. The multispectral Landsat imagery layer used in the analysis includes data from Landsat 8 and Landsat 9 and is updated daily with new imagery [61].
The calculation followed the USGS procedure [62], which comprises a series of operations executed in the background of the software. After obtaining brightness temperature ( T B ) from the thermal band of Landsat imagery, a correction is applied based on surface emissivity ( ε ) [61].
In the first step of this procedure, spectral radiance (unit: ( W / ( m 2 · s r · μ m ) ) was derived from the digital numbers ( Q c a l ) of the Landsat 8 thermal band using Equation (1), which converts raw digital values into Top of Atmosphere (TOA) Radiance ( L λ ):
L λ = M L × Q c a l + A L
where M L is the radiance multiplicative rescaling factor, and A L is the reflectance additive rescaling factor.
In the second step of the procedure, brightness temperature ( T B ) in Kelvin was calculated using the inverse Planck function provided in Equation (2):
T B = K 2 ln K 1 L λ + 1
where K 1 and K 2 are calibration constants specific to the thermal band.
In the third step of the procedure, surface emissivity ( ε ) was calculated using a formula based on the Normalized Difference Vegetation Index (NDVI), as shown in Equation (3) [63]. The first part of this step involves calculating the vegetation proportion ( P v ), which ranges from 0 to 1 [64].
P v = N D V I     N D V I m i n N D V I m a x   N D V I m i n 2 ε = 0.004 × P v + 0.986
In the fourth and final step of the procedure, LST in Kelvin was calculated using Equation (4). The resulting values were then converted into degrees Celsius, completing the LST computation process:
L S T = T B 1   +   λ T B ρ ln ε
where ρ = h · c σ = 1.438 × 10 2 m · K , including Planck’s constant, the speed of light, and the Stefan–Boltzmann constant.
λ : Wavelength of the thermal band.
To convert the final LST values from Kelvin to Celsius, the following transformation was applied: L S T 273.15 .
As a result of this procedure, ArcGIS Pro provides the Band 10 Surface Temperature in Celsius layer through the ArcGIS Living Atlas, enabling the extraction of LST values directly in degrees Celsius [61].
Step 6: The Creation of the Heat Risk Index (HRI)
The HRI map was created using three core variables, each represented as detailed neighborhood-level layers. These variables included the proportion of areas lacking tree canopy, population density, and mean land surface temperature. As a first step, all datasets were consolidated into a single layer to enable standardized processing. This was accomplished through a series of operations in ArcGIS Pro. First, the Join Field tool was used to merge the attribute columns of each variable into a unified geospatial layer. Second, due to the differing value ranges of the variables, the Standardize Field tool was applied to normalize all data to a common scale between 0 and 1. This ensured that each variable contributed equally to the composite index. As a result, the theoretical range of HRI values was set between 0 (lowest risk) and 3 (highest risk). In practice, the calculated HRI values in this study ranged approximately from 0.20 to 2.50.
The standardized values were visualized in ArcGIS Pro using a custom Arcade expression. Arcade is a scripting language developed specifically for ArcGIS applications, enabling mathematical operations and logical expressions for dynamic map content generation [65]. These expressions were created using the Expression Builder tool. Accordingly, a unique symbology was applied to the resulting map to reflect areas of relatively low to high HRI levels. However, visualization based solely on standardized values was not considered sufficient for informing extreme heat adaptation planning. Therefore, the full range of HRI scores was identified and divided into five distinct risk classes: relatively low, lower–intermediate, intermediate, higher–intermediate, and relatively high.
Step 7: Scenario—Increasing Tree Canopy at the Neighborhood Level and Its Impact on the HRI
This scenario aimed to utilize the cooling effect of tree canopy to support climate adaptation at the neighborhood level. A priority neighborhood was selected based on its vulnerability to environmental urban pressures. In this selected neighborhood, areas suitable for afforestation were identified, and the potential impact of the proposed intervention on the HRI was analyzed as part of a localized heat adaptation strategy. The datasets required for this scenario had been previously prepared:
-
Existing tree canopy areas were identified in Step 2.
-
Forest lands designated by the General Directorate of Forestry were obtained in Step 3.
Using these data, a spatial scenario was developed for the Baklalı Neighborhood in the Arnavutköy district of Istanbul, which was categorized in the higher–intermediate HRI class. Baklalı is located near (2.08 km) Istanbul Airport, making it a strategically significant area (Figure 1). According to official records, Istanbul Airport was identified as the busiest airport in Europe in 2024, with a daily average of 1401 flights [66]. Although it retains a largely rural and natural character, its classification in a high-risk category is likely due to increasing environmental pressure from urban development. One of the most influential variables in the HRI—the expansion of artificial surfaces—is presumed to be a contributing factor, which justifies a further investigation of this neighborhood. Afforestation efforts in rural-characterized areas adjacent to urban zones not only generate a localized cooling effect but also help mitigate UHI impacts in the surrounding areas [67].
To better illustrate how increasing tree canopy alone could affect the composite HRI, which is composed of population density, LST, and tree canopy cover, a scenario impact map was created using Arcade expressions in ArcGIS Pro. This visualization made the scenario outcome more interpretable by mapping the proportional impact of afforestation at the neighborhood level.

3. Results and Discussion

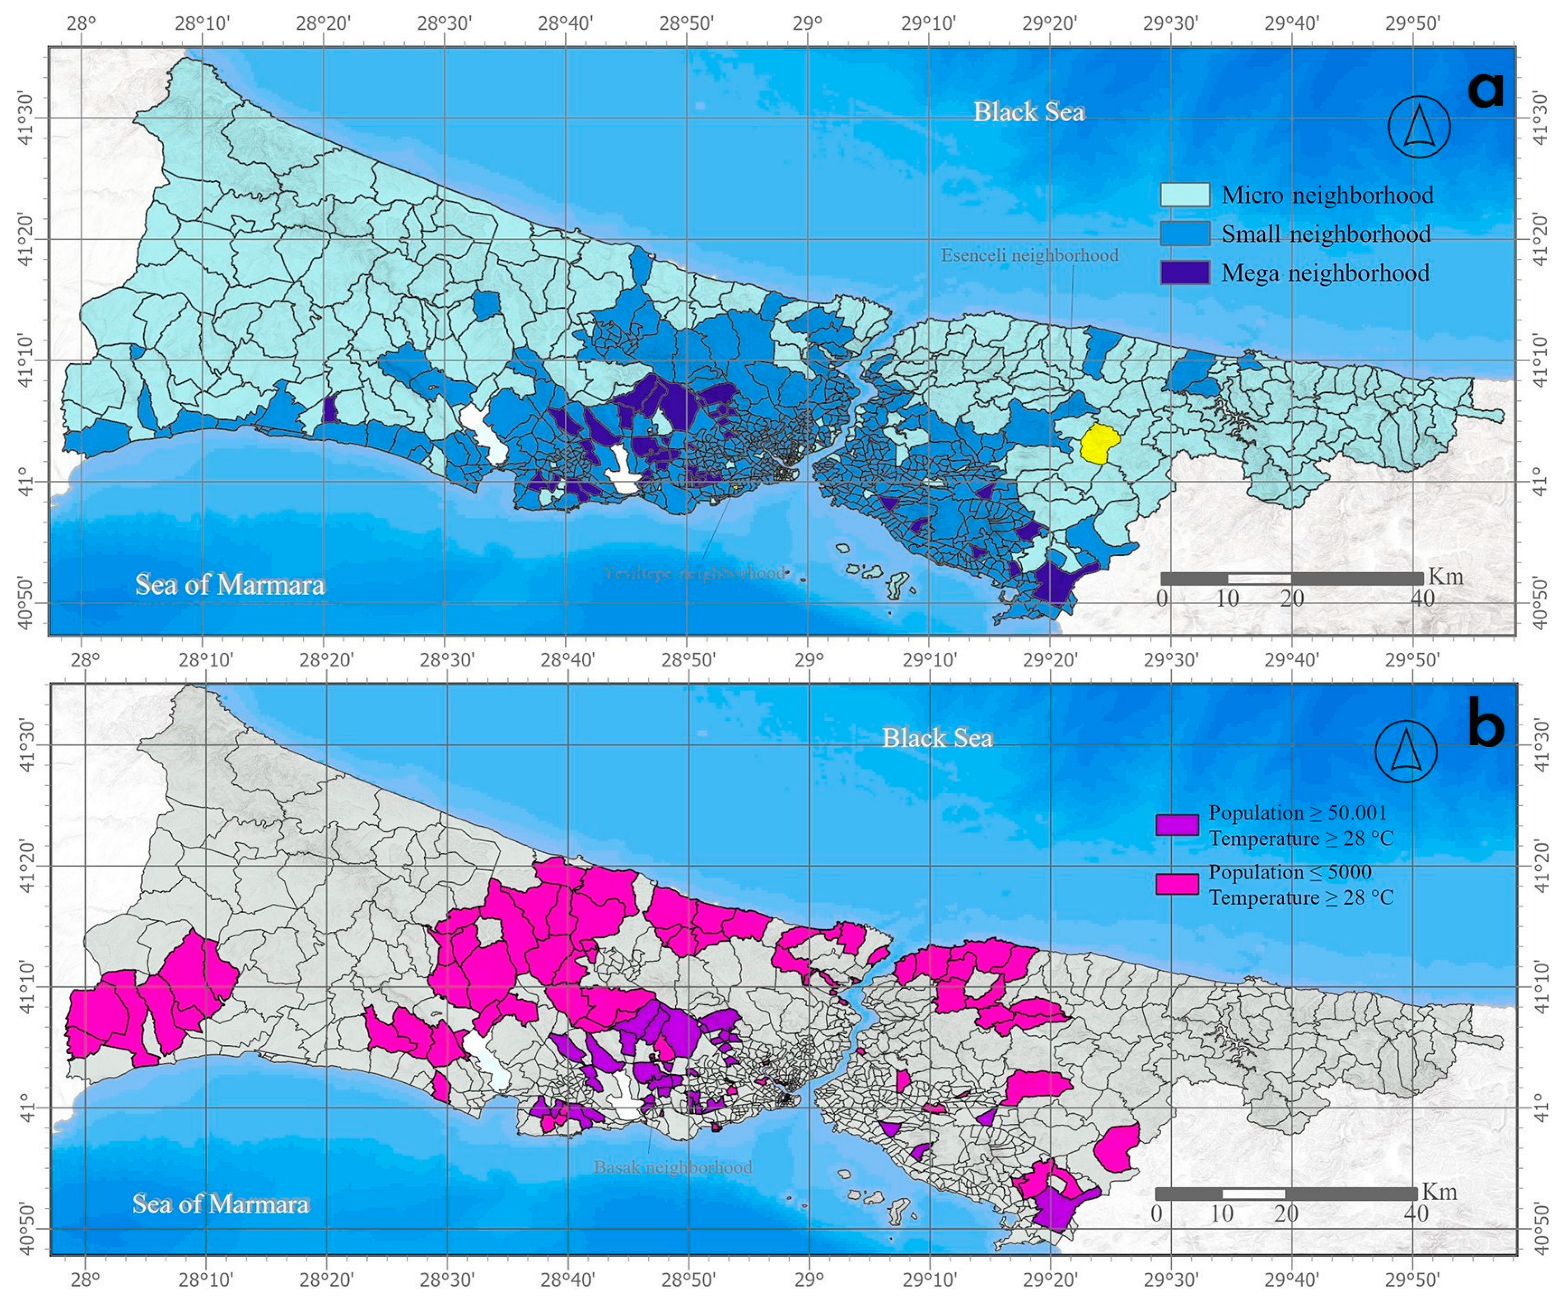
Istanbul comprises 965 neighborhoods distributed across 39 administrative districts [68]. Based on population size, these neighborhoods were classified into three types of urban units at varying scales: micro, small, and mega neighborhoods. Among them, 304 neighborhoods have populations below 5000 and are designated as micro neighborhoods; 621 neighborhoods have populations between 5001 and 50,000 and are classified as small neighborhoods; and 40 neighborhoods, each with a population exceeding 50,000, are categorized as mega neighborhoods (Figure 3).
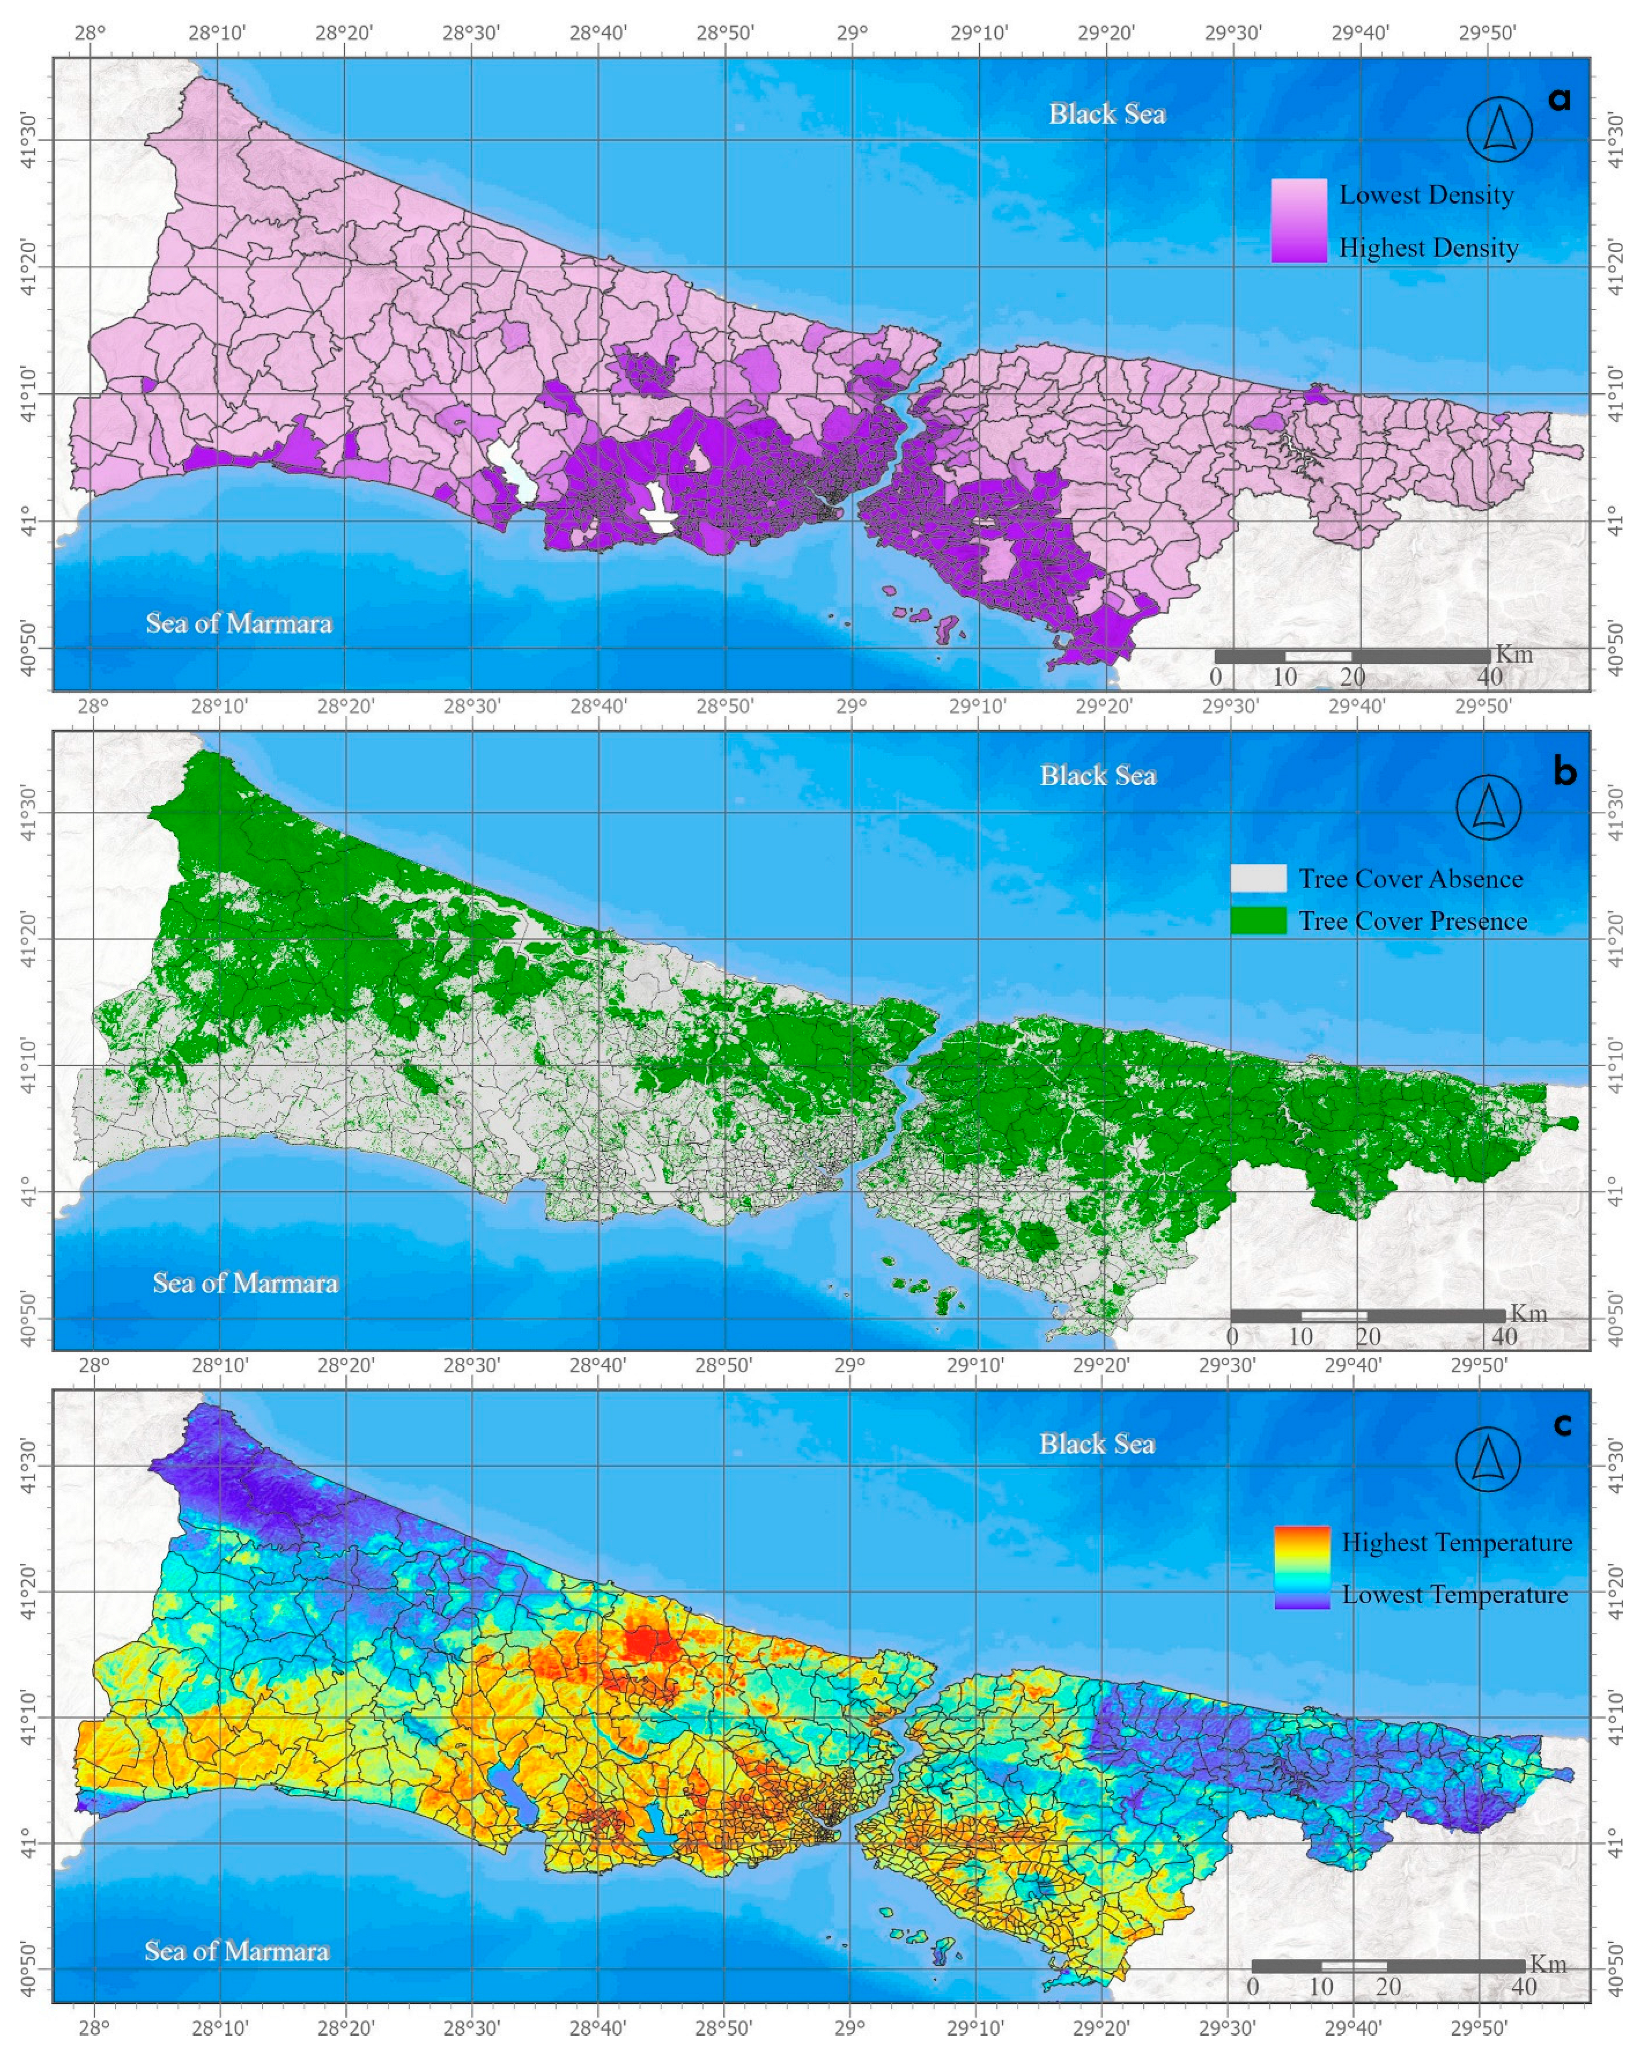
Micro neighborhoods represent very small-scale settlement units and are generally located in rural or low-density zones. In contrast, small neighborhoods typically represent moderately urbanized districts, while mega neighborhoods correspond to large-scale, high-density zones that characterize metropolitan urban structure [69]. In terms of population density, the Esenceli Neighborhood in the Şile district was identified as the least densely populated, whereas the Yeşiltepe Neighborhood in the Zeytinburnu district was identified as the most densely populated (see Figure 3a). There are 83 neighborhoods in Istanbul with populations below 5000 that exhibit average land surface temperatures above the citywide mean of 28 degrees Celsius. Additionally, 34 neighborhoods have both an average temperature above 28 degrees Celsius and a population exceeding 50,000 (see Figure 3b). Among these mega neighborhoods, all, except for the Başak Neighborhood in the Başakşehir district, which has a population of 70,658, are characterized by a lack of tree canopy. Furthermore, the average LST in these areas reaches approximately 31 degrees Celsius. These findings indicate a positive correlation among population increase, lack of tree canopy, and mean land surface temperature. This relationship is supported by a remote sensing study in Denmark, which demonstrated that land cover loss significantly contributed to LST increase [70]. Similarly, a study in South Karkheh revealed a negative correlation between LST and vegetation cover, further supporting the results of this study [71]. From another perspective, it is also important to note that forest areas in Istanbul have suffered substantial degradation due to anthropogenic pressures [72] and that the city’s population is increasing by 1.6 percent annually [73]. These trends contribute to rising LST and the intensification of the urban heat island effect over time. As population grows, urban development expands, leading to a reduction in natural cooling surfaces, such as vegetation and permeable soils [74]. This situation underscores the growing size of the population in the Istanbul metropolitan area that will be exposed to increasingly severe heatwaves in the future. Consequently, the necessity of tools such as the Heat Risk Index (HRI) becomes even more evident for enhancing adaptation and resilience to extreme heat events [11]. A recent study conducted in 2025 in New Assiut and Assiut City in Egypt, which proposed a new approach to heatwave adaptation, also emphasized the critical role of such risk analysis indices in guiding local adaptation strategies [59].
In this study, a lack of tree canopy, population density, and mean land surface were treated as the primary variables (Figure 4).
These variables were derived using a combination of remote sensing techniques and GIS-based methods. ArcGIS Pro version 3.5.2 was used as the primary analytical tool for generating and analyzing the Heat Risk Index (Figure 5).
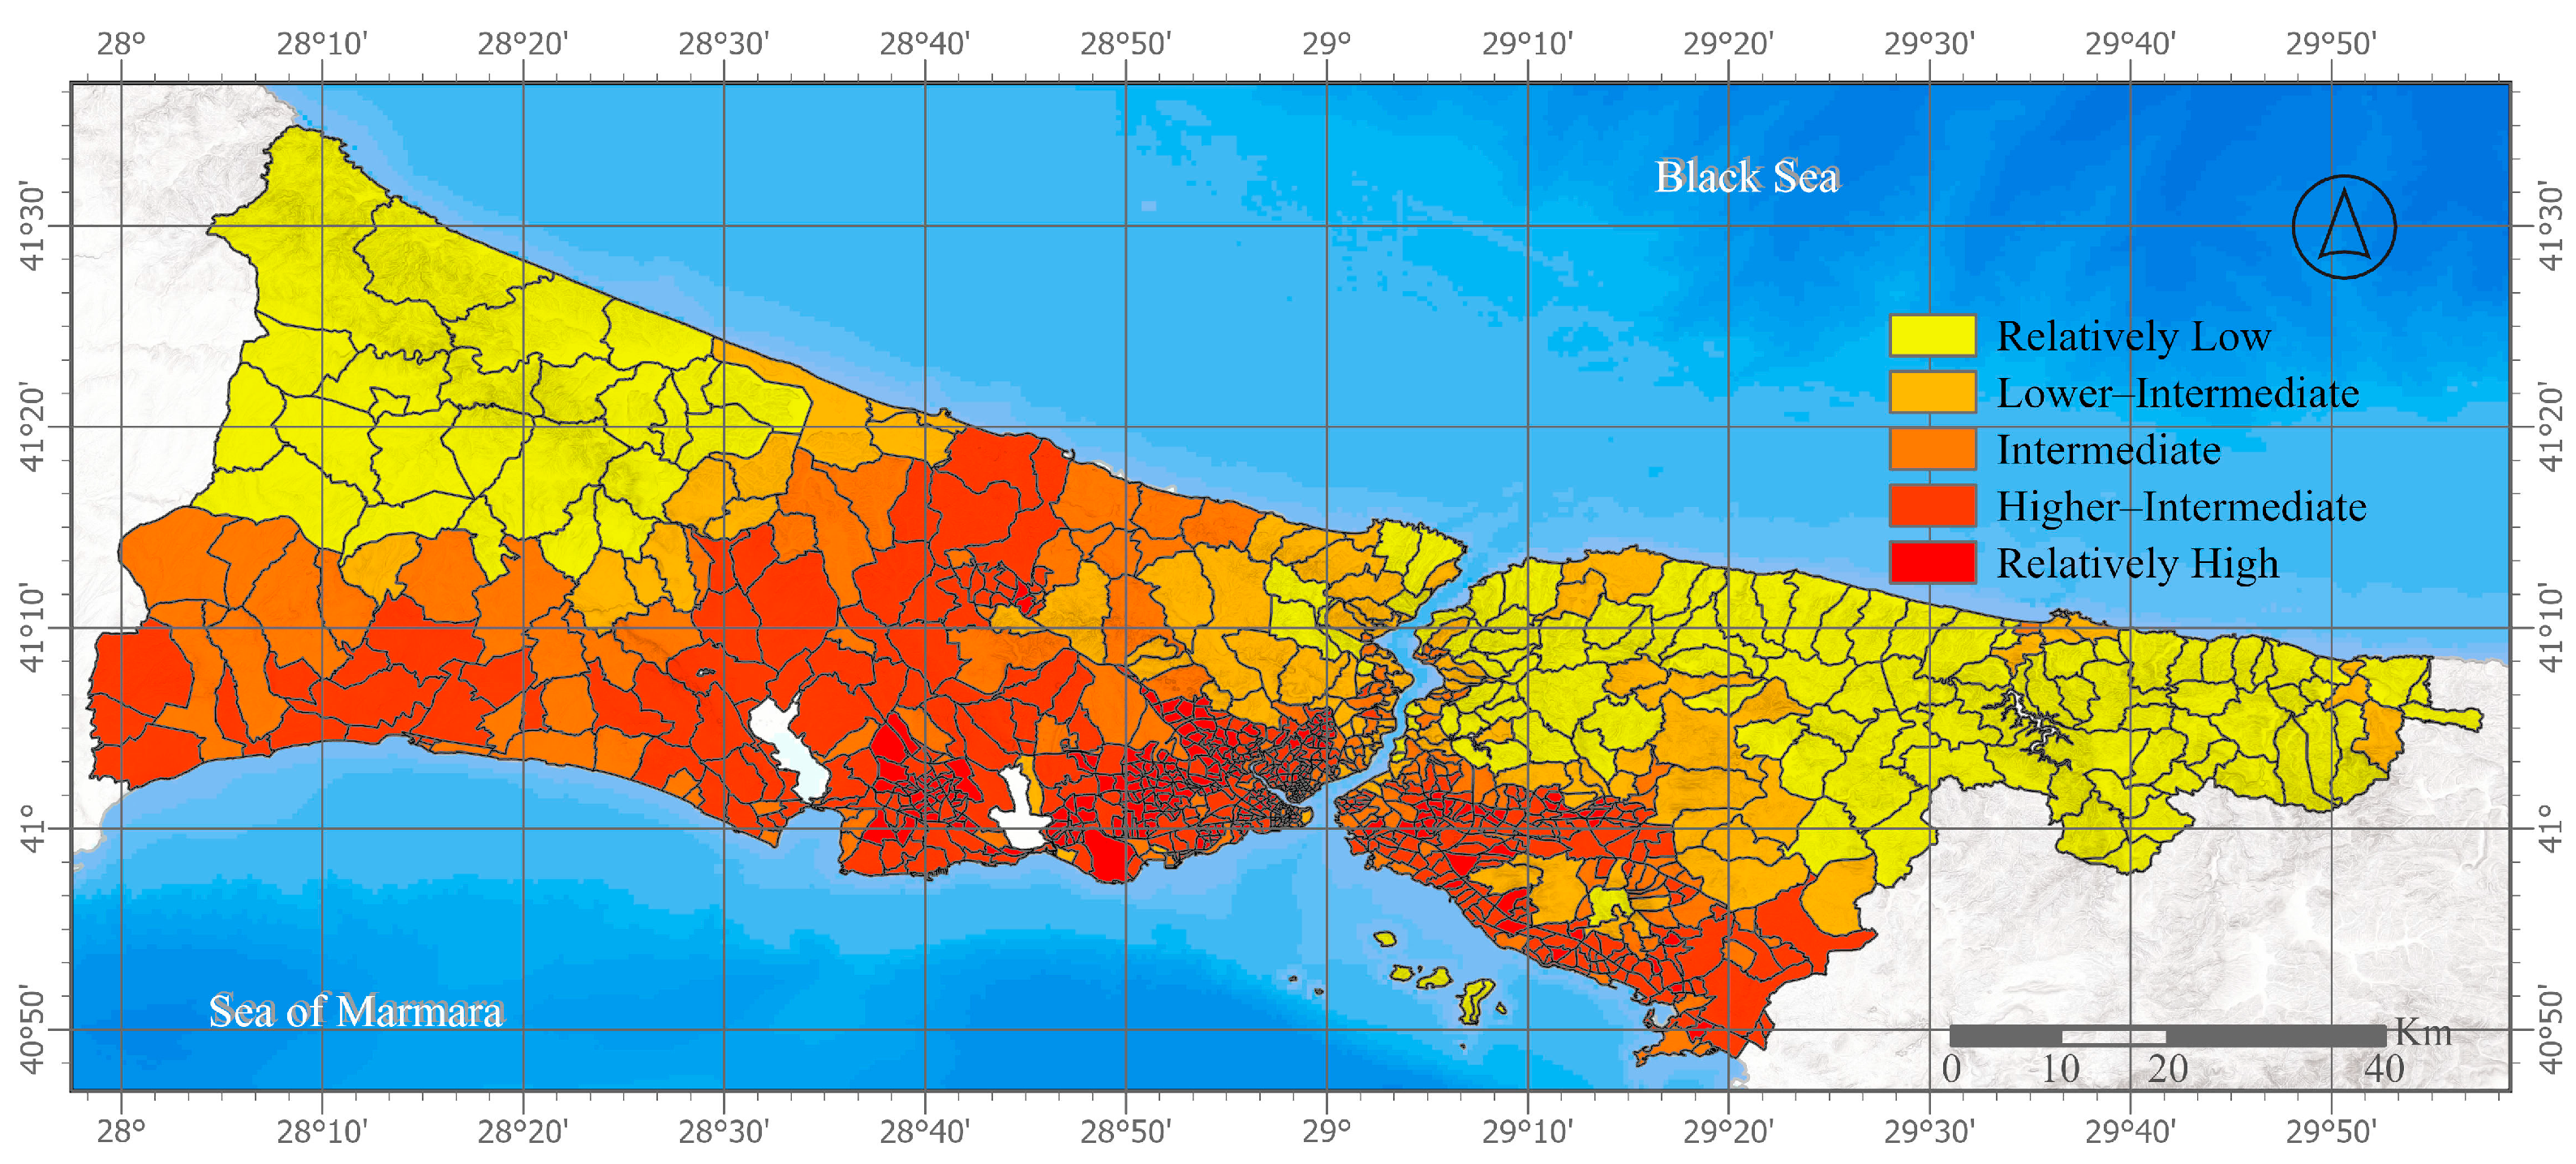
The HRI was classified into five distinct levels. Among the neighborhoods falling into the highest risk category, labeled “relatively high”, a total of 241 neighborhoods were identified. Notably, 202 of these were concentrated on the European side of Istanbul. On the Asian side, the highest risk levels were observed particularly in the southeastern and southern districts, though the distribution of risk appeared more moderate compared to the European side (see Figure 5). The risk level was found to increase markedly towards the southwestern part of the European side. It was also determined that approximately 93.13 percent of the total area of neighborhoods in the relatively high risk category lacked tree canopy. In addition, the lowest recorded mean LST across all neighborhoods was approximately 27 degrees Celsius, while the highest value reached approximately 38 degrees Celsius, which was observed in the Altıntepsi Neighborhood, located in the Bayrampaşa district. This represents the highest LST recorded in the citywide analysis. Collectively, these findings demonstrate that climate change-induced risks are significantly more pronounced in areas where green infrastructure is lacking [2,8,21,43,59,70,72,74,75]. Furthermore, it is widely acknowledged that heatwaves are projected to increase in both frequency and intensity in the coming decades [45]. If proactive measures are not taken, this will significantly elevate health risks, particularly for vulnerable populations residing in urban areas [23,26,42,76,77,78]. Numerous academic studies and scientific reports have confirmed that mortality rates due to past heatwaves have been higher in urban areas and disproportionately impacted disadvantaged groups [79,80,81,82]. For instance, during extreme heat events in Istanbul in 2015, 2016, and 2017, temperature-related mortality rates were reported to have increased by 6 to 21 percent. In addition, a climate risk report for Türkiye, developed as part of the G20 Climate Risk Atlas by the Euro-Mediterranean Center on Climate Change (CMCC), projected that by 2050, heatwaves in Türkiye would last 42 percent longer, potentially leading to nationwide disruptions and an estimated 2.26 percent loss in GDP [50]. Similarly, the Istanbul Climate Change Action Plan, developed in 2021 by the Istanbul Metropolitan Municipality, emphasized that to enhance the climate resilience of the city’s ecosystem, social fabric, and economy, robust adaptation strategies must be implemented [73]. Aligned with this vision, the present study aims to provide a spatially informed roadmap for prioritization in urban adaptation planning, contributing to climate change mitigation and resilience strategies [73,77,83,84,85].
The HRI analysis conducted in this study aligns with key national and metropolitan climate adaptation frameworks, specifically the Istanbul Climate Change Action Plan prepared by the Istanbul Metropolitan Municipality in 2021 and the Climate Change Adaptation Strategy and Action Plan (2024–2030) issued by the Directorate of Climate Change under the Ministry of Environment, Urbanization and Climate Change of the Republic of Türkiye [73,86]. However, performing risk classification based solely on HRI analysis was deemed insufficient. Therefore, an afforestation scenario was implemented for the Baklalı Neighborhood, a micro-scale rural settlement that lies in a strategically important area near Istanbul Airport. It is also adjacent to the Tayakadın, Terkos, Dursunköy, and Boyalık neighborhoods and is subject to increasing urban development pressure. In the scenario, forest-designated areas identified from the General Directorate of Forestry (OGM) were targeted for afforestation, especially areas lacking tree canopy. The proposed intervention involved increasing tree canopy in Baklalı by 6 percent through the afforestation of OGM lands. As a result of this scenario, the HRI classification for the Baklalı Neighborhood improved from the highest risk class (relatively high) to the next lower class (higher–intermediate) (Figure 6).
Given that the HRI is calculated based on three equally weighted variables, including population density, lack of tree canopy, and LST, this outcome demonstrates the measurable benefit of increasing vegetative cover. The cooling effect of enhanced tree canopy and its capacity to reduce LST has been documented in prior studies [71,87,88,89], suggesting that further reductions in the HRI may be possible under extended afforestation interventions. Moreover, in contrast to previous HRI studies [11,90], this research offers a distinct perspective by focusing specifically on the cooling effect of localized afforestation at the neighborhood scale, thus contributing a novel scenario-based approach to spatial adaptation planning.

Limitations

In this study, the analysis was based on the annual average LST calculated from Landsat multispectral imagery covering all 12 months. For future research, to more clearly capture extreme summer temperatures, it may be beneficial to filter the data to include only the summer months in the Northern Hemisphere (June, July, and August) and conduct the analysis based on the average LST during that period.
The results could have been interpreted from a broader perspective if data such as hospital admissions or individual health impact reports had been available. However, in Türkiye, such information is classified as personal data and is not shared with third parties due to data privacy regulations. As a result, it was not possible to access data at this level of specificity.
In the context of strengthening urban resilience to climate change, stakeholder participation is critically important. From this perspective, broader engagement with relevant stakeholders, particularly those involved in decision-making and urban planning, could have enhanced the public value and policy relevance of this study. Therefore, it is recommended that future research incorporate stakeholder evaluation and participation, which would contribute to the development of more inclusive and actionable climate adaptation strategies.

4. Conclusions

This article was designed to support strategic and localized spatial adaptation planning in response to the increasing frequency and intensity of heatwaves driven by climate change. As part of this study, an HRI analysis was conducted at the neighborhood level for Istanbul, a major global metropolis. The analysis incorporated three core variables, including the lack of tree canopy, population density, and land surface temperature (LST), which were found to be positively correlated with one another. Neighborhoods were then classified into five distinct risk levels. Among Istanbul’s 965 neighborhoods, 240 were identified in the highest risk category (relatively high) and 352 in the higher–intermediate category. To explore the potential for reducing these risk levels, a spatial scenario-based analysis was developed. Areas suitable for afforestation were identified using data from the General Directorate of Forestry under the Ministry of Agriculture and Forestry of the Republic of Türkiye. A neighborhood with critical locational and structural characteristics—Baklalı, categorized under higher–intermediate risk—was selected as the pilot area. In this scenario, tree canopy coverage was increased by 6 percent through targeted afforestation. The results showed that this intervention was sufficient to shift the neighborhood’s HRI classification down by one level, from higher–intermediate to intermediate.
As previously discussed and supported by the literature, a positive relationship exists among the core variables. Accordingly, increasing afforestation reduces the lack of tree canopy, which in turn contributes to a decrease in LST. Therefore, the second key variable directly influencing the HRI is also instrumental in lowering the overall risk level.
What distinguishes this study from prior risk assessments and adaptation plans conducted for the Istanbul metropolitan area is its neighborhood-scale approach. This level of spatial resolution remains underexplored in the literature, and thus this study offers a significant contribution by addressing a critical gap.
The findings demonstrate that the HRI can serve as a spatial guide for climate adaptation strategies aimed at enhancing urban climate resilience. The 6% afforestation proposed in the scenario represents a cost-effective, feasible, and impactful intervention for reducing heat risk levels. In this regard, it constitutes an improvement that can be readily implemented even by administrative units operating at the neighborhood scale. Accordingly, collaboration with district municipalities—higher-level local administrative units—and the General Directorate of Forestry may be necessary for the allocation of areas suitable for afforestation. It is considered that such collaborations could support decision-making mechanisms responsible for climate change adaptation in developing spatial strategies. Moreover, this study highlights the need to include areas located on the urban periphery, where urbanization pressure is intense, yet rural characteristics are still preserved, in climate-resilient spatial planning efforts. It also reveals that semi-rural areas frequently inhabited by socioeconomically disadvantaged and vulnerable age groups, and currently under urbanization pressure, can contribute to mitigating surrounding UHI effects through micro-scale planning interventions. The results of this study are therefore noteworthy for decision-makers in terms of both promoting human well-being and supporting environmental protection. Furthermore, risk assessments could be enriched by incorporating context-specific characteristics of cities. Variables such as proximity to coastal areas, the availability of open and green urban spaces, and distance from dense urban cores may offer additional insight into vulnerability patterns and enable the development of more targeted planning approaches. It is also recommended that future studies integrate demographic variables such as vulnerable age groups and household income levels, which would enhance the predictive value of the HRI and support the design of more realistic and socially responsive adaptation measures for addressing the increasing heat-related risks associated with climate change.

Funding

This research received no external funding.

Institutional Review Board Statement

Not applicable.

Informed Consent Statement

Not applicable.

Data Availability Statement

The original contributions presented in the study are included in the article; further inquiries can be directed to the corresponding author.

Acknowledgments

Special thanks to Ahmet Mert for his valuable contributions.

Conflicts of Interest

The author declares no conflicts of interest.

Abbreviations

The following abbreviations are used in this manuscript:
HRIHeat Risk Index
LSTLand Surface Temperature
GISGeographic Information System
UNFCCCUnited Nations Framework Convention on Climate Change
NUTSNomenclature of Territorial Units for Statistics
ESAEuropean Space Agency
CMCCEuro-Mediterranean Center on Climate Change

References

  1. UNFCCC. United Nations Framework Convention on Climate Change-Full Text of the Convention; UNFCCC: Bonn, Germany, 1992. [Google Scholar]
  2. Kalayci Kadak, M.; Ozturk, S.; Mert, A. Predicting Climate-Based Changes of Landscape Structure for Turkiye via Global Climate Change Scenarios: A Case Study in Bartin River Basin with Time Series Analysis for 2050. Nat. Hazards 2024, 120, 13289–13307. [Google Scholar] [CrossRef]
  3. Mert, A.; Tavuç, İ.; Özdemir, S.; Ulusan, M.D. Future Responses of the Burdur Lake to Climate Change and Uncontrolled Exploitation. J. Indian Soc. Remote Sens. 2025, 53, 1025–1036. [Google Scholar] [CrossRef]
  4. Harlan, S.L.; Brazel, A.J.; Prashad, L.; Stefanov, W.L.; Larsen, L. Neighborhood Microclimates and Vulnerability to Heat Stress. Soc. Sci. Med. 2006, 63, 2847–2863. [Google Scholar] [CrossRef]
  5. Yazdanirad, S.; Golbabaei, F.; Foroushani, A.R.; Monazzam, M.R.; Dehghan, H. Development and Validation of an Environmental Heat Strain Risk Assessment (EHSRA) Index Using Structural Equation Modeling Based on Empirical Relations. Environ. Health Prev. Med. 2020, 25, 63. [Google Scholar] [CrossRef] [PubMed]
  6. Lowry, S.J.; Blecker, H.; Camp, J.; De Castro, B.; Hecker, S.; Arbabi, S.; Traven, N.; Seixas, N.S. Possibilities and Challenges in Occupational Injury Surveillance of Day Laborers. Am. J. Ind. Med. 2010, 53, 126–134. [Google Scholar] [CrossRef] [PubMed]
  7. Tomlinson, C.J.; Chapman, L.; Thornes, J.E.; Baker, C.J. Including the Urban Heat Island in Spatial Heat Health Risk Assessment Strategies: A Case Study for Birmingham, UK. Int. J. Health Geogr. 2011, 10, 42. [Google Scholar] [CrossRef]
  8. Kalayci Kadak, M. Examination of Botanical Gardens as Urban Green and Open Spaces in Terms of Ecosystem Services: The Case of Iasi Botanical Garden, Romania. Anatol. J. For. Res. 2025, 11, 180–190. [Google Scholar] [CrossRef]
  9. Sarkar, S.M.; Dhar, B.K.; Fahlevi, M.; Ahmed, S.; Hossain, M.J.; Rahman, M.M.; Gazi, M.A.I.; Rajamani, R. Climate Change and Aging Health in Developing Countries. Glob. Chall. 2023, 7, 2200246. [Google Scholar] [CrossRef]
  10. Luber, G.; McGeehin, M. Climate Change and Extreme Heat Events. Am. J. Prev. Med. 2008, 35, 429–435. [Google Scholar] [CrossRef]
  11. Elmarakby, E.; Elkadi, H. Prioritising Urban Heat Island Mitigation Interventions: Mapping a Heat Risk Index. Sci. Total Environ. 2024, 948, 174927. [Google Scholar] [CrossRef]
  12. Ramírez-Aguilar, E.A.; Lucas Souza, L.C. Urban Form and Population Density: Influences on Urban Heat Island Intensities in Bogotá, Colombia. Urban Clim. 2019, 29, 100497. [Google Scholar] [CrossRef]
  13. Gokce, D.; Pancar, Z.B.; Turk, A. Determining the Spatial Vulnerability and Adaptation Capacity to Climate Change: A Case Study of Alanya. J. Grad. Sch. Nat. Appl. Sci. Mehmet Akif Ersoy Univ. 2018, 9, 119–128. [Google Scholar] [CrossRef]
  14. Liu, D.; Zhou, R.; Ma, Q.; He, T.; Fang, X.; Xiao, L.; Hu, Y.; Li, J.; Shao, L.; Gao, J. Spatio-Temporal Patterns and Population Exposure Risks of Urban Heat Island in Megacity Shanghai, China. Sustain. Cities Soc. 2024, 108, 105500. [Google Scholar] [CrossRef]
  15. Hoehne, C.G.; Hondula, D.M.; Chester, M.V.; Eisenman, D.P.; Middel, A.; Fraser, A.M.; Watkins, L.; Gerster, K. Heat Exposure during Outdoor Activities in the US Varies Significantly by City, Demography, and Activity. Health Place 2018, 54, 1–10. [Google Scholar] [CrossRef]
  16. Eisenman, D.P.; Wilhalme, H.; Tseng, C.H.; Chester, M.; English, P.; Pincetl, S.; Fraser, A.; Vangala, S.; Dhaliwal, S.K. Heat Death Associations with the Built Environment, Social Vulnerability and Their Interactions with Rising Temperature. Health Place 2016, 41, 89–99. [Google Scholar] [CrossRef]
  17. Bernhard, M.C.; Kent, S.T.; Sloan, M.E.; Evans, M.B.; McClure, L.A.; Gohlke, J.M. Measuring Personal Heat Exposure in an Urban and Rural Environment. Environ. Res. 2015, 137, 410–418. [Google Scholar] [CrossRef]
  18. Odame, E.A.; Li, Y.; Zheng, S.; Vaidyanathan, A.; Silver, K. Assessing Heat-Related Mortality Risks among Rural Populations: A Systematic Review and Meta-Analysis of Epidemiological Evidence. Int. J. Environ. Res. Public Health 2018, 15, 1597. [Google Scholar] [CrossRef] [PubMed]
  19. Lim, J.; Skidmore, M. Heat Vulnerability and Heat Island Mitigation in the United States. Atmosphere 2020, 11, 558. [Google Scholar] [CrossRef]
  20. Harlan, S.L.; Declet-Barreto, J.H.; Stefanov, W.L.; Petitti, D.B. Neighborhood Effects on Heat Deaths: Social and Environmental Predictors of Vulnerability in Maricopa County, Arizona. Environ. Health Perspect. 2013, 121, 197–204. [Google Scholar] [CrossRef] [PubMed]
  21. IPCC. Sixth Assessment Report (First Draft); IPCC: Geneva, Switzerland, 2021. [Google Scholar]
  22. Ebi, K.L.; Capon, A.; Berry, P.; Broderick, C.; de Dear, R.; Havenith, G.; Honda, Y.; Kovats, R.S.; Ma, W.; Malik, A.; et al. Hot Weather and Heat Extremes: Health Risks. Lancet 2021, 398, 698–708. [Google Scholar] [CrossRef]
  23. Faurie, C.; Varghese, B.M.; Liu, J.; Bi, P. Association between High Temperature and Heatwaves with Heat-Related Illnesses: A Systematic Review and Meta-Analysis. Sci. Total Environ. 2022, 852, 158332. [Google Scholar] [CrossRef]
  24. Gronlund, C.J.; Sullivan, K.P.; Kefelegn, Y.; Cameron, L.; O’Neill, M.S. Climate Change and Temperature Extremes: A Review of Heat- and Cold-Related Morbidity and Mortality Concerns of Municipalities. Maturitas 2018, 114, 54–59. [Google Scholar] [CrossRef]
  25. Yang, X.; Xu, X.; Wang, Y.; Yang, J.; Wu, X. Heat Exposure Impacts on Urban Health: A Meta-Analysis. Sci. Total Environ. 2024, 947, 174650. [Google Scholar] [CrossRef]
  26. Xu, C.; Wei, R.; Tong, H. A Systematic Review of Methodological Advances in Urban Heatwave Risk Assessment: Integrating Multi-Source Data and Hybrid Weighting Methods. Sustainability 2025, 17, 3747. [Google Scholar] [CrossRef]
  27. Shiva, J.S.; Chandler, D.G.; Kunkel, K.E. Mapping Heat Wave Hazard in Urban Areas: A Novel Multi-Criteria Decision Making Approach. Atmosphere 2022, 13, 1037. [Google Scholar] [CrossRef]
  28. Freitas, C.R.; Grigorieva, E.A. A Comparison and Appraisal of a Comprehensive Range of Human Thermal Climate Indices. Int. J. Biometeorol. 2017, 61, 487–512. [Google Scholar] [CrossRef]
  29. Johnson, D.P.; Wilson, J.S.; Luber, G.C. Socioeconomic Indicators of Heat-Related Health Risk Supplemented with Remotely Sensed Data. Int. J. Health Geogr. 2009, 8, 57. [Google Scholar] [CrossRef] [PubMed]
  30. Conti, S.; Meli, P.; Minelli, G.; Solimini, R.; Toccaceli, V.; Vichi, M.; Beltrano, C.; Perini, L. Epidemiologic Study of Mortality during the Summer 2003 Heat Wave in Italy. Environ. Res. 2005, 98, 390–399. [Google Scholar] [CrossRef] [PubMed]
  31. Maragno, D.; Fontana, M.D.; Musco, F. Mapping Heat Stress Vulnerability and Risk Assessment at the Neighborhood Scale to Drive Urban Adaptation Planning. Sustainability 2020, 12, 1056. [Google Scholar] [CrossRef]
  32. Groot-Reichwein, M.A.M.; van Lammeren, R.J.A.; Goosen, H.; Koekoek, A.; Bregt, A.K.; Vellinga, P. Urban Heat Indicator Map for Climate Adaptation Planning. Mitig. Adapt. Strateg. Glob. Change 2018, 23, 169–185. [Google Scholar] [CrossRef] [PubMed]
  33. An, H.; Cai, H.; Xu, X.; Qiao, Z.; Han, D. Impacts of Urban Green Space on Land Surface Temperature from Urban Block Perspectives. Remote Sens. 2022, 14, 4580. [Google Scholar] [CrossRef]
  34. Chen, Q.; Ding, M.; Yang, X.; Hu, K.; Qi, J. Spatially Explicit Assessment of Heat Health Risk by Using Multi-Sensor Remote Sensing Images and Socioeconomic Data in Yangtze River Delta, China. Int. J. Health Geogr. 2018, 17, 15. [Google Scholar] [CrossRef]
  35. Aung, T.H.; Tongleamnak, S.; Suwanwerakamtorn, R. Spatiotemporal Patterns of Land Surface Temperature, Urban Heat Island, and Potential Heat Stress Risk Areas Assessment for Tropical Inland City and Coastal City in Thailand. Appl. Environ. Res. 2024, 46, 43. [Google Scholar] [CrossRef]
  36. Abulibdeh, A. Analysis of Urban Heat Island Characteristics and Mitigation Strategies for Eight Arid and Semi-Arid Gulf Region Cities. Environ. Earth Sci. 2021, 80, 259. [Google Scholar] [CrossRef] [PubMed]
  37. Dechao, C.; Xu, X.; Sun, Z.; Liu, L.; Qiao, Z.; Huang, T. Assessment of Urban Heat Risk in Mountain Environments: A Case Study of Chongqing Metropolitan Area, China. Sustainability 2020, 12, 309. [Google Scholar] [CrossRef]
  38. Rahimi, E.; Barghjelveh, S.; Dong, P. Quantifying How Urban Landscape Heterogeneity Affects Land Surface Temperature at Multiple Scales. J. Ecol. Environ. 2021, 45, 22. [Google Scholar] [CrossRef]
  39. Taloor, A.K.; Parsad, G.; Jabeen, S.F.; Sharma, M.; Choudhary, R.; Kumar, A. Analytical Study of Land Surface Temperature for Evaluation of UHI and UHS in the City of Chandigarh India. Remote Sens. Appl. Soc. Environ. 2024, 35, 101206. [Google Scholar] [CrossRef]
  40. Harlan, S.L.; Ruddell, D.M. Climate Change and Health in Cities: Impacts of Heat and Air Pollution and Potential Co-Benefits from Mitigation and Adaptation. Curr. Opin. Environ. Sustain. 2011, 3, 126–134. [Google Scholar] [CrossRef]
  41. Acarer, A.; Mert, A. 21st Century Climate Change Threatens on the Brown Bear. Cerne 2024, 30, e-103305. [Google Scholar] [CrossRef]
  42. IPCC. Climate Change 2022: Impacts, Adaptation and Vulnerability; IPCC: Geneva, Switzerland, 2022. [Google Scholar]
  43. Gul, E. On the Edge of Survival: The Fragile Fate of Scots Pine (Pinus sylvestris L.) in Central Anatolia, Türkiye Under Climate Change. BioResources 2025, 20, 3628–3652. [Google Scholar] [CrossRef]
  44. Acarer, A.; Mert, A. Mapping Habitat Suitability of the Brown Bear in Artvin-Şavşat Region, Turkey. Ursus 2025, 2025, 1–15. [Google Scholar] [CrossRef]
  45. Hopke, J.E. Connecting Extreme Heat Events to Climate Change: Media Coverage of Heat Waves and Wildfires. Environ. Commun. 2020, 14, 492–508. [Google Scholar] [CrossRef]
  46. Bai, T.; Fan, L.; Song, G.; Song, H.; Ru, X.; Wang, Y.; Zhang, H.; Min, R.; Wang, W. Effects of Land Use/Cover and Meteorological Changes on Regional Climate under Different SSP-RCP Scenarios: A Case Study in Zhengzhou, China. Remote Sens. 2023, 15, 2601. [Google Scholar] [CrossRef]
  47. Tian, L.; Tao, Y.; Li, M.; Qian, C.; Li, T.; Wu, Y.; Ren, F. Prediction of Land Surface Temperature Considering Future Land Use Change Effects under Climate Change Scenarios in Nanjing City, China. Remote Sens. 2023, 15, 2914. [Google Scholar] [CrossRef]
  48. Hong, T.; Wu, J.; Kang, X.; Yuan, M.; Duan, L. Impacts of Different Land Use Scenarios on Future Global and Regional Climate Extremes. Atmosphere 2022, 13, 995. [Google Scholar] [CrossRef]
  49. TÜİK Address-Based Population Registration System. Available online: https://biruni.tuik.gov.tr/medas/?kn=95&locale=tr (accessed on 1 July 2025).
  50. CMCC. G20 Climate Risk Atlas: Impacts, Policy, Economics; CMCC: Lecce, Italy, 2021. [Google Scholar]
  51. Boluk, E.; Eskioglu, O.; Çalık, Y.; Yagan, S. Köppen İklim Sınıflandırmasına Göre Türkiye İklimi; 2023. Available online: https://www.mgm.gov.tr/files/iklim/iklim_siniflandirmalari/koppen.pdf (accessed on 20 June 2025).
  52. ESA WorldCover 2021 Product User Manual (PUM). Available online: https://worldcover2021.esa.int/data/docs/WorldCover_PUM_V2.0.pdf (accessed on 18 May 2025).
  53. Edmondson, J.L.; Stott, I.; Davies, Z.G.; Gaston, K.J.; Leake, J.R. Soil Surface Temperatures Reveal Moderation of the Urban Heat Island Effect by Trees and Shrubs. Sci. Rep. 2016, 6, 33708. [Google Scholar] [CrossRef]
  54. Ziter, C.D.; Pedersen, E.J.; Kucharik, C.J.; Turner, M.G. Scale-Dependent Interactions between Tree Canopy Cover and Impervious Surfaces Reduce Daytime Urban Heat during Summer. Proc. Natl. Acad. Sci. USA 2019, 116, 7575–7580. [Google Scholar] [CrossRef]
  55. Armson, D.; Stringer, P.; Ennos, A.R. The Effect of Tree Shade and Grass on Surface and Globe Temperatures in an Urban Area. Urban For. Urban Green. 2012, 11, 245–255. [Google Scholar] [CrossRef]
  56. ESA WorldCover Algorithm Theoretical Basis Document (ATBD). Available online: https://climate.esa.int/media/documents/CCI-LAKES-0024-ATBD-v2.3.pdf (accessed on 18 May 2025).
  57. Cheng, Z.; Nesbitt, L.; Girling, C.; Sheppard, S.; Konijnendijk, C.; Nitoslawski, S. Urban Density and the Urban Forest: How Well Are Cities Balancing Them in the Context of Climate Change? Cities 2024, 149, 104962. [Google Scholar] [CrossRef]
  58. Bille, R.A.; Jensen, K.E.; Buitenwerf, R. Global Patterns in Urban Green Space Are Strongly Linked to Human Development and Population Density. Urban For. Urban Green. 2023, 86, 127980. [Google Scholar] [CrossRef]
  59. Mohammed, A.M.S. The Heat Adaptation Priority Index (HAPI): A Practical Tool for Urban Heat Risk Assessment and Mitigation Priority. Sustain. Cities Soc. 2025, 126, 106420. [Google Scholar] [CrossRef]
  60. Kestens, Y.; Brand, A.; Fournier, M.; Goudreau, S.; Kosatsky, T.; Maloley, M.; Smargiassi, A. Modelling the Variation of Land Surface Temperature as Determinant of Risk of Heat-Related Health Events. Int. J. Health Geogr. 2011, 10, 7. [Google Scholar] [CrossRef] [PubMed]
  61. ESRI Inc. Multispectral Landsat. Available online: https://landsat2.arcgis.com/arcgis/rest/services/Landsat/MS/ImageServer (accessed on 8 July 2025).
  62. U.S. Geological Survey. Landsat 8 (L8) Data Users Handbook; U.S. Geological Survey: Sioux Falls, SD, USA, 2019.
  63. Ermida, S.L.; Soares, P.; Mantas, V.; Göttsche, F.M.; Trigo, I.F. Google Earth Engine Open-Source Code for Land Surface Temperature Estimation from the Landsat Series. Remote Sens. 2020, 12, 1471. [Google Scholar] [CrossRef]
  64. Sobrino, J.A.; Raissouni, N. Toward Remote Sensing Methods for Land Cover Dynamic Monitoring: Application to Morocco. Int. J. Remote Sens. 2000, 21, 353–366. [Google Scholar] [CrossRef]
  65. ESRI Inc. ArcGIS Arcade. Available online: https://developers.arcgis.com/arcade/ (accessed on 8 July 2025).
  66. General Directorate of State Airports Authority Istanbul Havalimanı Zirvede. Available online: https://www.dhmi.gov.tr/Sayfalar/Haber/istanbul-havalimani-zirvede.aspx (accessed on 30 June 2025).
  67. Yang, M.; Ren, C.; Wang, H.; Wang, J.; Feng, Z.; Kumar, P.; Haghighat, F.; Cao, S.-J. Mitigating Urban Heat Island through Neighboring Rural Land Cover. Nat. Cities 2024, 1, 522–532. [Google Scholar] [CrossRef]
  68. Turkish Statistical Institute Population and Demography. Turkish Statistical Institute Data Portal for Statistics. Available online: https://data.tuik.gov.tr/Kategori/GetKategori?p=nufus-ve-demografi-109&dil=2 (accessed on 20 June 2025).
  69. Alessandrini, A.; Deuster, C.; Dijkstra, L.; Ghio, D.; Natale, F. Rethinking City Population Growth: How Reclassification Matters. Popul. Dev. Rev. 2024, 50, 997–1015. [Google Scholar] [CrossRef]
  70. Alexander, C. Influence of the Proportion, Height and Proximity of Vegetation and Buildings on Urban Land Surface Temperature. Int. J. Appl. Earth Obs. Geoinf. 2021, 95, 102265. [Google Scholar] [CrossRef]
  71. Ghobadi, Y.; Pradhan, B.; Shafri, H.Z.M.; Kabiri, K. Assessment of Spatial Relationship between Land Surface Temperature and Landuse/Cover Retrieval from Multi-Temporal Remote Sensing Data in South Karkheh Sub-Basin, Iran. Arab. J. Geosci. 2015, 8, 525–537. [Google Scholar] [CrossRef]
  72. Khorrami, B.; Heidarlou, H.B.; Feizizadeh, B. Evaluation of the Environmental Impacts of Urbanization from the Viewpoint of Increased Skin Temperatures: A Case Study from Istanbul, Turkey. Appl. Geomatics 2021, 13, 311–324. [Google Scholar] [CrossRef]
  73. Istanbul Metropolitan Municipality. İstanbul İklim Değişikliği Eylem Planı; Istanbul Metropolitan Municipality: İstanbul, Turkey, 2021. [Google Scholar]
  74. Kara, Y.; Yavuz, V. Urban Microclimates in a Warming World: Land Surface Temperature (LST) Trends Across Ten Major Cities on Seven Continents. Urban Sci. 2025, 9, 115. [Google Scholar] [CrossRef]
  75. Kalayci Kadak, M. A Suitable Model Proposal via Remote Sensing and Geographic Information Systems in the Bartın Stream Basin for Climate Change Scenarios; Kastamonu University Graduate School of Natural and Applied Sciences: Kastamonu, Turkey, 2021. [Google Scholar]
  76. Turkes, M. IPCC’nin Yeni Yayımlanan İklim Değişikliğinin Etkileri, Uyum ve Etkilenebilirlik Raporu Bize Neler Söylüyor? Resilience 2022, 6, 197–207. [Google Scholar] [CrossRef]
  77. Hirsch, A.L.; Ridder, N.N.; Perkins-Kirkpatrick, S.E.; Ukkola, A. CMIP6 MultiModel Evaluation of Present-Day Heatwave Attributes. Geophys. Res. Lett. 2021, 48, e2021GL095161. [Google Scholar] [CrossRef]
  78. Funsten, C.; Di Franco, C.; Borsellino, V.; Surano, N.; Asciuto, A.; Schimmenti, E. The Recreational Value of Botanic Garden Events: A Case Study of the Zagara Plant Fair in Palermo, Italy. J. Outdoor Recreat. Tour. 2022, 39, 100565. [Google Scholar] [CrossRef]
  79. Fischer, E.M.; Oleson, K.W.; Lawrence, D.M. Contrasting Urban and Rural Heat Stress Responses to Climate Change. Geophys. Res. Lett. 2012, 39, L03705. [Google Scholar] [CrossRef]
  80. Unal, Y.S.; Sonuc, C.Y.; Incecik, S.; Topcu, H.S.; Diren-Ustun, D.H.; Temizoz, H.P. Investigating Urban Heat Island Intensity in Istanbul. Theor. Appl. Climatol. 2020, 139, 175–190. [Google Scholar] [CrossRef]
  81. Kong, J.; Zhao, Y.; Carmeliet, J.; Lei, C. Urban Heat Island and Its Interaction with Heatwaves: A Review of Studies on Mesoscale. Sustainability 2021, 13, 10923. [Google Scholar] [CrossRef]
  82. Kiarsi, M.; Amiresmaili, M.; Mahmoodi, M.R.; Farahmandnia, H.; Nakhaee, N.; Zareiyan, A.; Aghababaeian, H. Heat Waves and Adaptation: A Global Systematic Review. J. Therm. Biol. 2023, 116, 103588. [Google Scholar] [CrossRef] [PubMed]
  83. Connelly, R.I.; Bal, P.G. Local Networks of Resilience and Climate Adaptation: The Case of Istanbul. In Climate Change Adaptation, Resilience and Hazards; Springer: Cham, Switzerland, 2016; pp. 109–123. ISBN 9783319398792. [Google Scholar]
  84. Kuru, A.; Begen Okay, B. Investigating the Relationship between Urban Growth Pattern and Urban Heat Islands: The Case of Istanbul, Turkey. Environ. Earth Sci. 2025, 84, 43. [Google Scholar] [CrossRef]
  85. Rizwan, A.M.; Dennis, L.Y.C.; Liu, C. A Review on the Generation, Determination and Mitigation of Urban Heat Island. J. Environ. Sci. 2008, 20, 120–128. [Google Scholar] [CrossRef]
  86. MoEUCC-DCC. İklim Değişikliğine Uyum Stratejisi ve Eylem Planı (2024–2030); 2024. Available online: https://iklim.gov.tr/db/turkce/icerikler/files/%C4%B0klim%20De%C4%9Fi%C5%9Fikli%C4%9Fine%20Uyum%20Stratejisi%20ve%20Eylem%20Plan_%202024-2030.pdf (accessed on 8 July 2025).
  87. Wang, J.; Zhou, W.; Li, H.; Xu, L.; Wang, H. Cooling Benefits from Urban Planting Depend on Local Background Canopy Cover: A Continental Cross-City Comparison. Sci. Total Environ. 2024, 955, 176864. [Google Scholar] [CrossRef] [PubMed]
  88. Guo, A.; He, T.; Yue, W.; Xiao, W.; Yang, J.; Zhang, M.; Li, M. Contribution of Urban Trees in Reducing Land Surface Temperature: Evidence from China’s Major Cities. Int. J. Appl. Earth Obs. Geoinf. 2023, 125, 103570. [Google Scholar] [CrossRef]
  89. Yang, Q.; Huang, X.; Tong, X.; Xiao, C.; Yang, J.; Liu, Y.; Cao, Y. Global Assessment of Urban Trees’ Cooling Efficiency Based on Satellite Observations. Environ. Res. Lett. 2022, 17, 034029. [Google Scholar] [CrossRef]
  90. Mandvikar, K.; Kumar, N.; Supe, H.; Singh, D.; Gupta, A.; Kumar, P.; Meraj, G.; Khan, I.D.; Kouser, A.; Pandey, S.K.; et al. Evaluating Heat Health Risk in Indian Cities: Geospatial and Socio-Ecological Analysis. World Dev. Sustain. 2024, 5, 100180. [Google Scholar] [CrossRef]
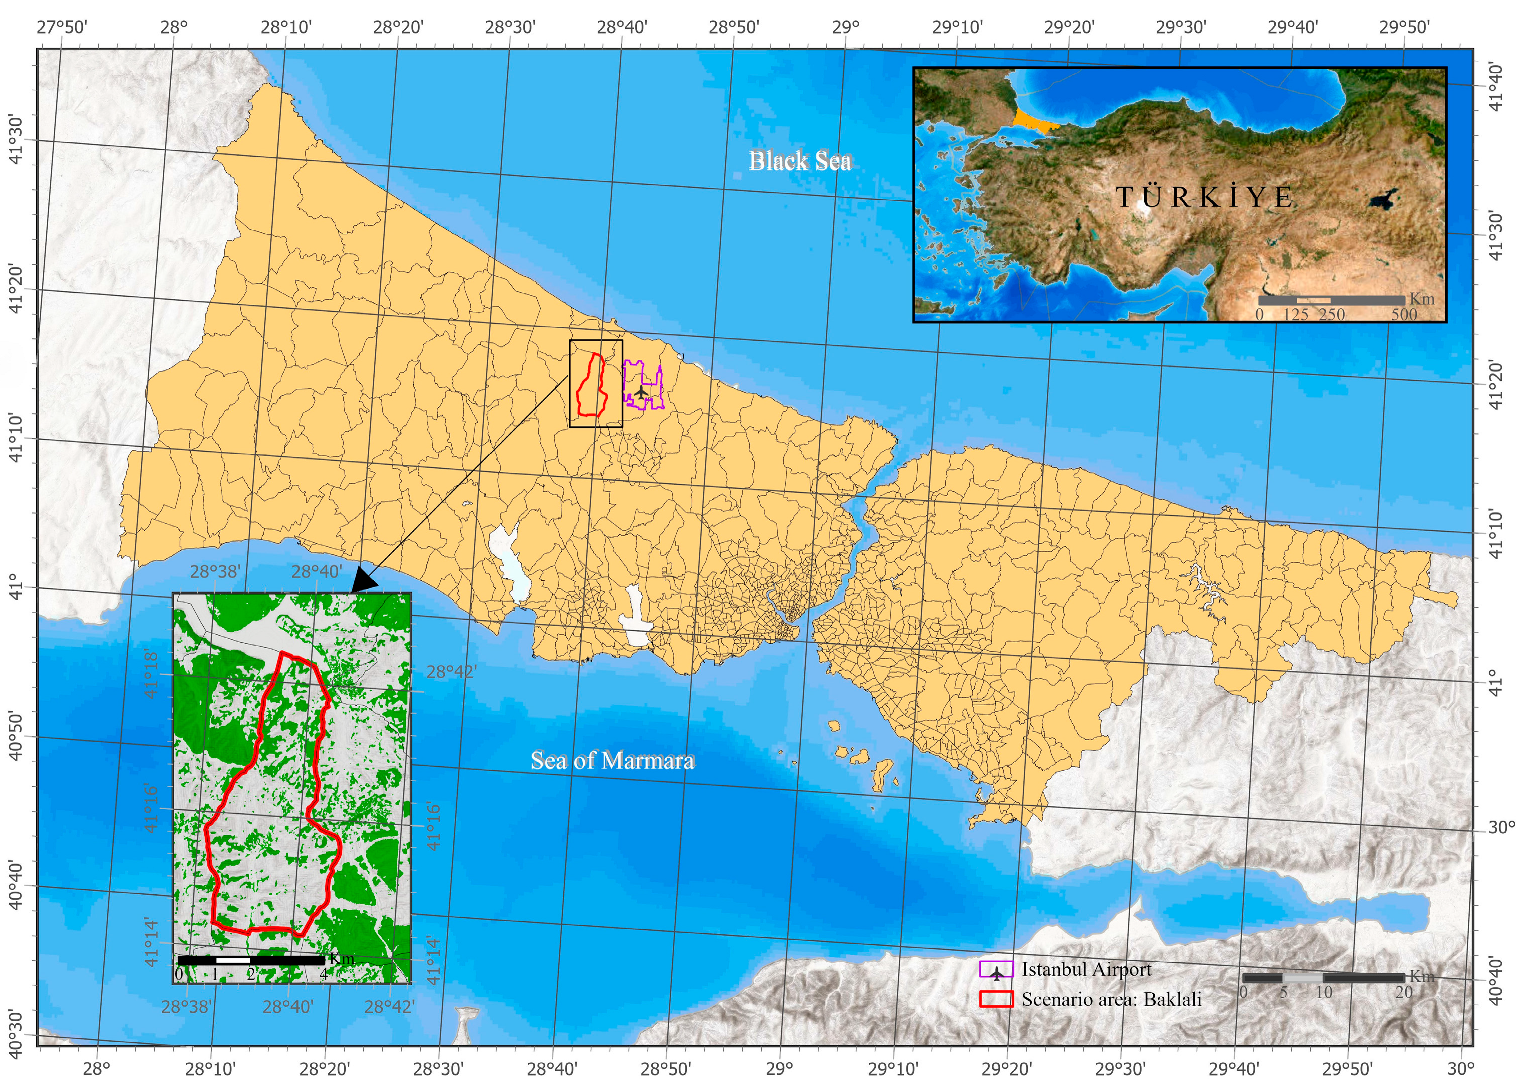
Figure 1. The geographical location of the study area.
Sustainability 17 07356 g001
Figure 2. Workflow chart of this research.
Sustainability 17 07356 g002
Figure 3. Neighborhood-scale (micro, small, mega) classification of Istanbul (a). Classification based on population size and temperature (b).
Sustainability 17 07356 g003
Figure 4. Population density (a). Status of tree canopy (b). LST (c).
Sustainability 17 07356 g004
Figure 5. HRI map of Istanbul.
Sustainability 17 07356 g005
Figure 6. Scenario application and its effect on HRI level.
Sustainability 17 07356 g006
Disclaimer/Publisher’s Note: The statements, opinions and data contained in all publications are solely those of the individual author(s) and contributor(s) and not of MDPI and/or the editor(s). MDPI and/or the editor(s) disclaim responsibility for any injury to people or property resulting from any ideas, methods, instructions or products referred to in the content.