Article

Optimizing the Ecological Network to Construct an Ecological Security Pattern in a Metropolitan Area: A Case Study of the Jinan Metropolitan Area, China

1
College of Forestry, Shandong Agricultural University, Tai’an 271018, China
2
College of Landscape Architecture and Horticulture Sciences, Southwest Forestry University, Kunming 650224, China
3
College of Water Conservancy and Civil Engineering, Shandong Agricultural University, Tai’an 271018, China
*
Author to whom correspondence should be addressed.
These authors contributed equally to this work.
Sustainability 2025, 17(16), 7342; https://doi.org/10.3390/su17167342 (registering DOI)
Submission received: 11 July 2025 / Revised: 10 August 2025 / Accepted: 12 August 2025 / Published: 14 August 2025

Abstract

Constructing an ecological security pattern (ESP) represents an effective strategy for alleviating regional landscape fragmentation, which is crucial for maintaining regional ecological health. This study focuses on the Jinan metropolitan area as a case study, employing morphological spatial pattern analysis (MSPA), ecosystem services evaluation, and circuit theory to construct the ecological network (EN). This study optimizes the EN by considering connectivity and spatial distribution, with reference to priority areas and ecological protection red lines (EPRLs). Additionally, the robustness of the EN was evaluated, and the ESP for the Jinan metropolitan area was constructed. The results show the following: (1) The initial EN of the study area comprises 40 ecological sources (ESs) and 84 ecological corridors (ECs). Four types of priority areas were identified. There is a noticeable imbalance in the spatial distribution of ESs and ECs across the Jinan metropolitan area. (2) During the optimization process, 10 new ESs were extracted based on priority areas, which weakened the obstacle effect of problem areas in ECs, and 7 new ESs were extracted based on EPRL, which solved the problem of uneven distribution of ESs to a certain extent. (3) The optimized EN consists of 57 ESs and 124 ECs. Robustness analysis reveals that this multi-perspective optimization method enhances the connectivity and stability of the EN. An ESP of “One Belt, Two Axes, Two Zones, and Five Cores” has been established for the Jinan metropolitan area. This study provides a valuable reference for sustainable development in the Jinan metropolitan area and offers a scientific basis for similar metropolitan areas.

1. Introduction

In recent years, rapid urbanization has been the main feature of urban development, with numerous regions beginning to establish metropolitan areas on the basis of high urbanization [1]. However, highly urbanized regions often experience substantial reductions in ecological landscape areas and notable deterioration in environmental quality due to intensive construction activities [2]. The conversion of ecological land into construction land gives rise to a range of environmental challenges [3]. Ecological land loss, landscape fragmentation, poor connectivity among habitat patches, and biodiversity decline are prevalent issues in highly urbanized regions [3,4]. As urban development intensifies, the conflict between urban expansion and ecological conservation becomes increasingly pronounced [5]. Therefore, a scientific method is urgently needed to balance the contradiction between them [6]. Currently, the construction and optimization of urban ecological networks (ENs) and the establishment of ecological security patterns (ESPs) are widely recognized as essential strategies for promoting sustainable urban development [7].
The concept of ESPs was initially introduced in 1995 [8], emphasizing the balance between human activities and natural ecosystems. In 1996, Yu [9] further developed the concept of ESP based on EN construction. As a key component of ESP, the EN construction method of “identifying ecological sources (ESs), constructing ecological resistance surfaces, extracting ecological corridors (ECs), and obtaining ecological nodes” has been improved and is gradually being widely applied. ENs can integrate fragmented ecological patches into a unified and functional system [10]. Moreover, ENs are essential for enhancing ecosystem quality and resilience, safeguarding ecological security, and maintaining biodiversity [11,12].
ESs are the starting point of species dispersal and occupy an important position in ENs [13]. For the extraction of ESs, commonly employed methods include direct extraction and index inspection [14]. The direct extraction method involves utilizing ecological lands, such as scenic spots and nature reserves, directly as ESs [15]. However, this method ignores the characteristics of regional landscape patterns. In contrast, the index inspection method evaluates the ecological level by selecting specific indicators to identify high-quality ESs. This method is widely used due to its higher accuracy and objectivity [16]. Morphological spatial pattern analysis (MSPA) [17], ecosystem service evaluation [18,19], ecological sensitivity, and landscape connectivity [20] are commonly used assessment indicators. Highly urbanized areas generally exhibit degraded ecological conditions, and evaluation criteria based on a single aspect of ES is inadequate for addressing the complex environmental challenges present in urban settings. However, many existing studies rely on single-parameter evaluation approaches, which lack comprehensiveness. To address this limitation, this study integrates MSPA with habitat quality (HQ) assessments as evaluation indicators, thereby enhancing the scientific rigor and reliability of the methodology. The minimum cumulative resistance model (MCR) [21] is among the widely adopted methods to extract ECs. This method can identify ECs with the least resistance and highest survival rates, but it cannot effectively simulate the randomness of biological migration [22]. Conversely, circuit theory is based on the random walk of electrons on the surface of resistors [23], which can better simulate the actual migration of organisms in reality.
Building ENs is an important tool for regional ecological planning, while optimizing ENs is an effective method for enhancing the value of ecosystem services [24]. The EC contains many ecological nodes, and different types of ecological nodes can reflect different conditions within the EC. For example, ecological pinch points reflect the most vulnerable parts of ECs, ecological obstacle points hinder information exchange between species, and ecological breakpoints reflect the impact of roads on ECs [25]. Based on this, ecological nodes are often used to optimize ENs [26]. Some studies extract a large number of ecological nodes [27]. Although this achieves accurate identification, the large number of ecological nodes also leads to a lack of optimization focus. Currently, there is limited research that has conducted in-depth analysis of ecological nodes. Tools such as kernel density analysis can be employed to assess the spatial distribution density of ecological nodes and pinpoint regions with concentrated ecological challenges. This approach facilitates more targeted and effective optimization of ENs. In addition, urban ecosystems are complex [28], and it is difficult to achieve the desired results by optimizing the EN from a single perspective. Methods for optimizing ENs in highly urbanized areas still need to be further explored. The essence of an EN is a complex network composed of points and lines [5]. In recent years, some studies use topological parameters to quantify the characteristics of ENs, and robustness analysis is also commonly used as an evaluation index for the optimization effect of ENs [29].
The research scales of ENs exhibit diversity. Numerous scholars have conducted relevant research at various levels, including the regional scale [30], the basin scale [31,32], the urban agglomeration scale [33], the urban scale [14], and the community scale [34]. Currently, the economic development and ecological construction of urban agglomerations and metropolitan areas have gained increasing attention. Although scholars have conducted targeted EN construction in metropolitan areas such as the Nanjing metropolitan area [35], Wuhan metropolitan area [36], Zhengzhou metropolitan area [37], and Xuzhou metropolitan area [1], research on this topic in the Jinan metropolitan area remains limited. Furthermore, many studies focusing on the construction of urban agglomeration ENs have not incorporated EN optimization. Therefore, it is essential to carry out comprehensive research on the construction and optimization of ENs, as well as the identification of ESP, in the Jinan metropolitan area.
The Jinan metropolitan area is situated in the northwestern region of Shandong Province, downstream of the Yellow River in China. Given the establishment and rapid advancement of the Jinan metropolitan area, the local ecological environment’s quality has been altered [38,39]. These changes have also influenced the local climate, leading the city to confront a range of ecological and environmental challenges. In addition, the study area is endowed with abundant ecological resources, including the Yellow River that flows through the region and Mount Tai situated within it. As a result, the need to construct an EN aimed at enhancing ecological sustainability has become increasingly urgent. Although some scholars have investigated the EN of Jinan City [40], there remains a significant gap in research regarding the construction of ENs within the Jinan metropolitan area.
In this study, the Jinan metropolitan area was selected as the case study area. The primary aims of this research were to (1) identify ESs based on the results of MSPA and HQ assessment; (2) develop a comprehensive resistance surface by integrating natural and anthropogenic factors, extract ECs, and establish the initial EN for the Jinan metropolitan area; (3) identify priority areas using circuit theory combined with intersection recognition tools, optimize the EN by incorporating these priority areas and the ecological protection red line (EPRL), and evaluate the robustness of the EN before and after optimization; and (4) ultimately, construct the ESP for the Jinan metropolitan area and propose corresponding optimization strategies. This study provides a reference for the sustainable development and ecological restoration of the Jinan metropolitan area and contributes to the advancement of ecological conservation efforts in the Lower Yellow River region.

2. Materials and Methods

2.1. Study Area

Jinan metropolitan area is located in the Lower Yellow River (115°16′~118°37′ E, 35°38′~38°16′ N). It is an important economic circle in the Yellow River Basin (Figure 1). It undertakes the strategic task of radiating and leading the development of central and western Shandong. It is an important area connecting Beijing-Tianjin-Hebei region and the Yangtze River Delta. It is also the intersection of many strategies in China [41]. The metropolitan area is composed of six cities, Jinan, Tai’an, Liaocheng, Dezhou, Binzhou and Zibo, covering an area of 52,000 km2. It sits in a temperate monsoon climate zone. The terrain is higher in the southeast region and lower in the northwest region. The southern region is mountainous and hilly landscapes, dominated by the Taiyi mountain system (including Mount Tai, Mount Yimeng, Culai Mountain, and Lushan Mountain), which support rich forest resources. The northern area features a predominantly plain topography, primarily represented by the Northwest Shandong plain, with relatively richer water resources. The Yellow River traverses the middle plain of the research area and flows into the Bohai Sea from west to east. In recent years, as urbanization has progressed, the ecological space has shrunk, leading to environmental degradation and a decline in ecological functions within the study area.

2.2. Data Sources

The data source is shown in Table 1. The land use and land cover (LULC) data are divided into cultivated land, forestland, grassland, water, construction land, and unused land. Road data includes highways, national highways, and railways. All the data are projected to the geographic coordinate of GCS_China_Geodetic_Coordinate_System_2000 and the projection coordinate of CGCS2000_GK_CM_117E. The raster data in this study were resampled to 30 m × 30 m resolution.

2.3. Methods

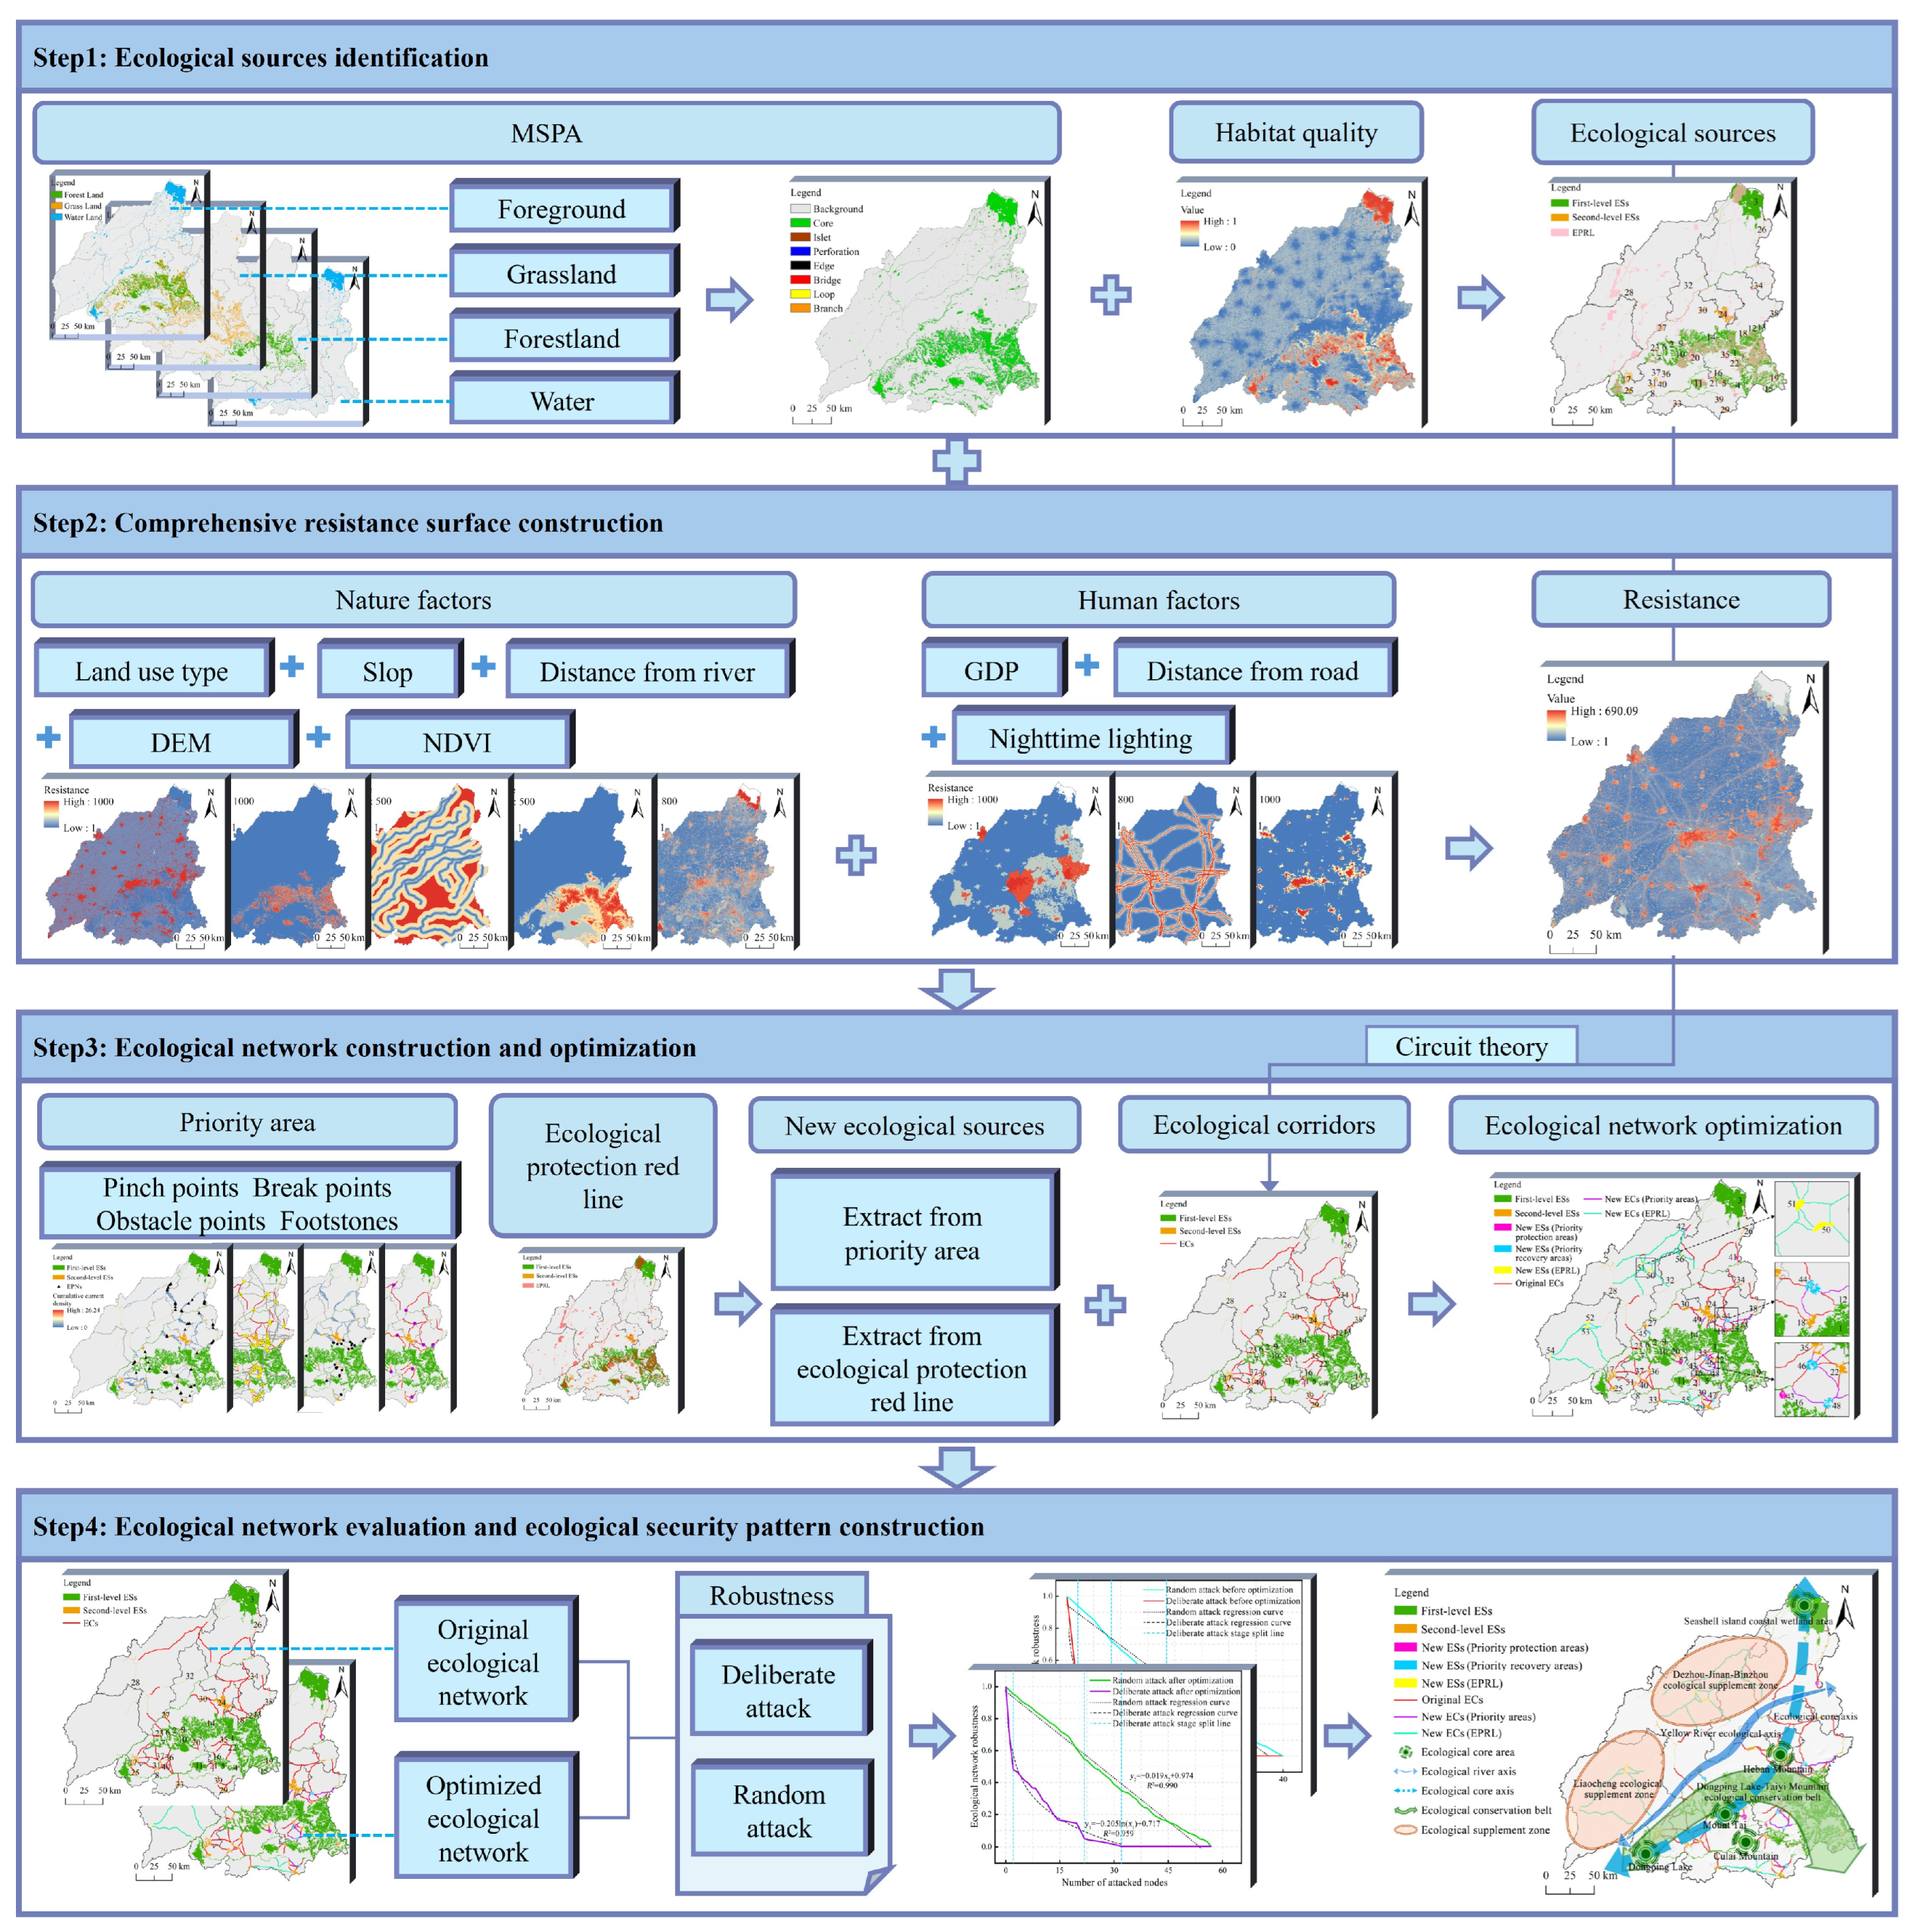
The technical framework of this research is presented in Figure 2.

2.3.1. ES Identification

(1)
Landscape Element Identification
ESs serve as the origin of species and ecological processes spreading outwards [13], which can promote ecological processes and is a key factor in providing diverse ecosystem services [22]. The MSPA method can accurately classify raster images into distinct functional categories and identify patterns that significantly influence regional landscape connectivity [42]. Therefore, it offers a robust and reliable approach for extracting both ESs and ECs. In this study, MSPA was used to extract ESs based on LULC. Forestland, grassland, and water were set as the foreground, and other LULCs were set as the background, and binary processing was carried out in ArcGIS 10.8. GuidosToolbox3.2 was used to analyze the binary data. Seven landscape types were identified as core, bridge, islet, branch, edge, loop, and perforation in the study area [17].
(2)
HQ Assessment
An effective ES must possess both high-quality habitat characteristics and an internal habitat structure capable of sustaining stable biomass levels. To identify high-quality ESs, the Habitat Quality module within InVEST 3.14.0 software was employed to calculate the HQ of the study area. According to the practical condition of the Jinan metropolitan area, cultivated land, urban land, rural residential land, industrial land, and unused land were selected as the threat sources. Threat source and habitat sensitivity parameters were assigned according to relevant references and the InVEST model guidelines [43], as shown in Table 2 and Table 3. The formula is presented as follows:
Q x y = H y 1 D x y z D x y z + k z
where Qxy is the HQ of LULC y at grid unit x; Hy is the habitat suitability of LULC y; Dxy is the habitat degradation degree of LULC y in grid unit x; k is the semi saturated constant coefficient, set as 0.5; and z is the normalized constant, set as 2.5 [43].
(3)
ES Extraction
In accordance with relevant literature [43], MSPA data were assigned values based on landscape type. HQ data were subsequently reclassified into four categories, high-, medium-high-, medium-low-, and low-HQ areas, utilizing the natural breakpoint method for value assignment. Based on the weighting presented in Table 4, the reclassified MSPA and HQ data were overlaid and subsequently reclassified into five distinct levels. The first three levels were identified as candidate patches for ESs, as the size of these areas significantly influences the dispersal and migratory capabilities of organisms. Consequently, patches exceeding 10 km2 were designated as ESs [44]. The ES extracted by this method exhibits superior quality, thereby establishing a robust foundation for the subsequent extraction of ECs and optimization of ENs. The EPRL demarcates critical ecological areas, playing a vital role in ensuring national ecological security [45]. Therefore, we utilize the EPRL as a reference to verify the rationality of the extracted ES results.
Landscape connectivity can reflect the role of different landscape types in impeding and facilitating biological migration. The delta of probability of connectivity (dPC) value can better reflect the connectivity level of the patch. A higher dPC value corresponds to a greater degree of landscape connectivity [46]. This study employed Conefor26 software for connectivity analysis. A total of eight distance thresholds of 100 m, 200 m, 500 m, 1000 m, 1500 m, 2000 m, 2500 m, and 3000 m were set [37]. The probability of connectivity (PC) and the integral index of connectivity (IIC) are recommended by the Conefor26 manual as the best index for the type of connectivity analysis. Utilizing PC and IIC values as benchmarks [47] (Table 5), it was observed that the PC and IIC remained relatively stable beyond the connectivity threshold of 1000 m. Ultimately, a connectivity distance threshold of 1000 m was selected. The connectivity probability was set to 0.5. Patches with a dPC value exceeding 0.5 were classified as primary ESs, while the remaining patches were classified as secondary ESs. The formulas are as follows:
P C = i = 1 n j = 1 n P i j * × a i × a j A L 2
d P C = 100 % × P C P C r e m o P C
I I C = i = 1 n j = 1 n a i a j 1 + n l i j A l 2
where PC is the possible connectivity index; n is the total number of patches; ai and aj represent the areas of patches i and j; AL is the area of the entire landscape; Pij* is the maximum probability of connection between patches i and j; dPC stands for the possible connectivity index, with higher values indicating higher element importance; PCremo is the overall index of the remaining patches after taking out a certain patch; nlij is the number of connections between patch i and patch j; and Al is the total landscape area.

2.3.2. Comprehensive Resistance Surface Construction

The comprehensive resistance surface provides a numerical assessment of the resistance level experienced by species as they migrate among different landscape components within a habitat patch, while revealing the effects of landscape heterogeneity [21]. This study selected eight factors from both natural and human aspects to construct the comprehensive resistance surface [43,48]. Natural factors include DEM, slope, NDVI, distance from river, and LULC. Human factors include GDP, nighttime lighting data, and distance from road. The integration of multiple resistance factors provides a more realistic representation of the conditions affecting biological migration in the study area, thereby enhancing the practical relevance and applicability of this research. This study used analytic hierarchy process to assign weights to each resistance factor, as shown in Table 6 [17], and the comprehensive resistance surface is finally obtained.

2.3.3. EC Extraction

ECs can indicate the probability and directionality of species movement between ESs [23]. As the framework of EN, EC connects various ESs to form an organic whole, which can promote communication between species. It provides a channel for energy, matter, and information transfer, strengthens the connection among ecological components, and ensures ecological processes stay stable and continuous [49]. Circuit theory links circuits to motion ecology. According to the characteristics of electrons randomly walking in low-resistance circuits under the influence of resistance in the electric network, the theory simulates the process of migration and dispersal movement of species or gene flow on the surface to overcome landscape or human resistance and identifies the species diffusion path and migration rule [50]. In this study, Circuitscape 4.0.7 was employed as the foundation for extracting ECs utilizing the Linkage Mapper 3.1 toolbox. ESs were treated as nodes, and the comprehensive resistance surface in the study area served as the resistance surface. Based on the aforementioned methodological advantages of ES extraction and ecological resistance surface construction, along with the appropriateness of applying circuit theory in identifying ECs, the EN extracted from the study area is expected to hold significant scientific value.

2.3.4. EN Optimization and Evaluation

(1)
Identification of priority protection areas
The priority protection areas in the EN include ecological pinch points and ecological footstones. Ecological pinch points refer to critical points in ECs that play an important role but have a high risk of degradation. They have an irreplaceable position in ECs [25]. In circuit theory, ecological pinch points have high current density, which is an important area for biological communication between ESs and should be prioritized for protection. This research employed the Pinchpoint Mapper tool in all-to-one mode with ECs to extract ecological pinch points. The results were reclassified into 5 grades based on the natural breakpoint method. Subsequently, the highest-level data were extracted, and the patches larger than 1 hm2 were further screened as ecological pinch points [14]. This study sets 5 cost-weighted distance cutoff distances from 10,000 m to 50,000 m. With the number and area of the extracted ecological pinch points as the reference, 30,000 m was finally selected as the experimental parameter. Ecological footstones can provide a resting place for biological migration and are temporary stopovers for biological migration. They can enhance the ability of long-distance migration of organisms, expand the migration range of organisms, relieve the pressure of ECs, and enhance the wholeness and efficiency of EN. This research extracted the intersection of ECs as ecological footstones [51].
(2)
Determination of Priority Recovery Areas
Ecological obstacle points and ecological breakpoints have a great negative effect on biological migration in the ECs [18]. Ecological obstacle points represent the obstructed areas where species move between ESs. These obstacles pose substantial resistance to biological migration and damage the ecosystem service function [25]. Contrary to the effect of ecological pinch points, measures should be taken to eliminate ecological obstacle points. This study utilized the Barrier Mapper tool and the maximum mode, setting a minimum search radius of 50 m, a maximum search radius of 300 m, and a step length of 50 m to identify the obstacle points [16]. Subsequently, the natural breakpoint method was employed to categorize the data into 5 levels. Among these, the highest-level data and patches exceeding an area of 1 hm2 were selected as ecological obstacle points [27]. Compared with the results of ecological obstacle points identified under various search radii, the result obtained under a 200 m search radius is the most comprehensive. Road networks often cause the fragmentation of regional ENs, and there are inevitably fracture points that hinder the migration of organisms. In this study, by overlaying ECs and major traffic arteries, the intersection points of the two were designated as ecological breakpoints.
(3)
EN Optimization
Priority areas refer to regions that play a critical role in maintaining the integrity and functionality of the overall ecosystem. Enhancing these areas can significantly improve the structure and function of the EN. In this study, the priority areas are divided into priority protection areas and priority recovery areas [27], and the EN is optimized with reference to the priority areas. Specifically, kernel density analyses were conducted for both priority protection areas and priority recovery areas. This study used the natural breakpoint method to classify the results of kernel density analysis into five levels. Subsequently, the highest-level data were extracted, and any construction land within this range was excluded to generate potential ESs. Patches with an area exceeding 5 km2 among the potential ESs were selected as new ESs. Following the integration of these new ESs with existing ESs, the optimized EN was reconstructed using circuit theory.
The main function of using ecological priority areas to optimize ENs is to improve the connectivity of ENs and remove the barriers of connectivity between ESs. In order to optimize the EN from the spatial distribution of ESs, the radiation range of ESs was analyzed by the multiple ring buffer method. Based on the characteristics of the research area and relevant literature [52], 10 km was adopted as the radiation radius of ESs. Referring to the EPRL, potential new ESs are selected based on areas exceeding 5 km2 within vacant regions, while also considering their biodiversity conservation function. The main objective of this study in identifying different types of new ESs is to refine the optimization measures for EN. Different restoration measures were planned based on the characteristics of each newly identified ES.
(4)
EN Robustness Evaluation
Robustness of EN means the capacity that the EN retains its initial functional characteristics after being attacked or destroyed, serving as a critical metric for evaluating network stability [32]. Robustness tests are conducted on the initial EN and the optimized EN to analyze the effectiveness of the optimization. In this study, four topological parameters of network clustering coefficient, node average degree, network efficiency, and diversity were selected to evaluate the EN. The four topological parameters were normalized to 0–1 according to the maximum and minimum value method, and then were superimposed with the same weight as the robustness evaluation index of the EN [20,53].
This study employs random and deliberate attacks to remove nodes to test the robustness of the EN [12]. Given the inherent uncertainty in random attacks, this study adopts the average result of 100 repeated random attacks to ensure representativeness of the results [54]. For deliberate attack, the degree of a node is used as an evaluation metric for node importance, with nodes being attacked in descending order based on their degree values. The formulas are shown below:
A = 1 n i = 1 n 2 E D i k i ( k i 1 )
K = i k i / n
E = i j G 1 d i j / n ( n 1 )
V = i j G n i j / n ( n 1 )
R i = ( N A i + N K i + N E i + N V i ) / 4
where ki is the degree of node i; EDi is the actual number of edges between adjacent nodes of node i; n is the nodes’ total number in the network; dij is the shortest distance between node i and node j; and NAi, NKi, NEi and NVi are the normalized network clustering coefficient, node mean degree, network efficiency, and network diversity, respectively. A is the clustering coefficient; K is the average degree of nodes in the network; E is network efficiency; V is the average number of independent paths; and Ri is the EN robustness.

3. Results

3.1. ES Extraction

3.1.1. MSPA Data Analysis

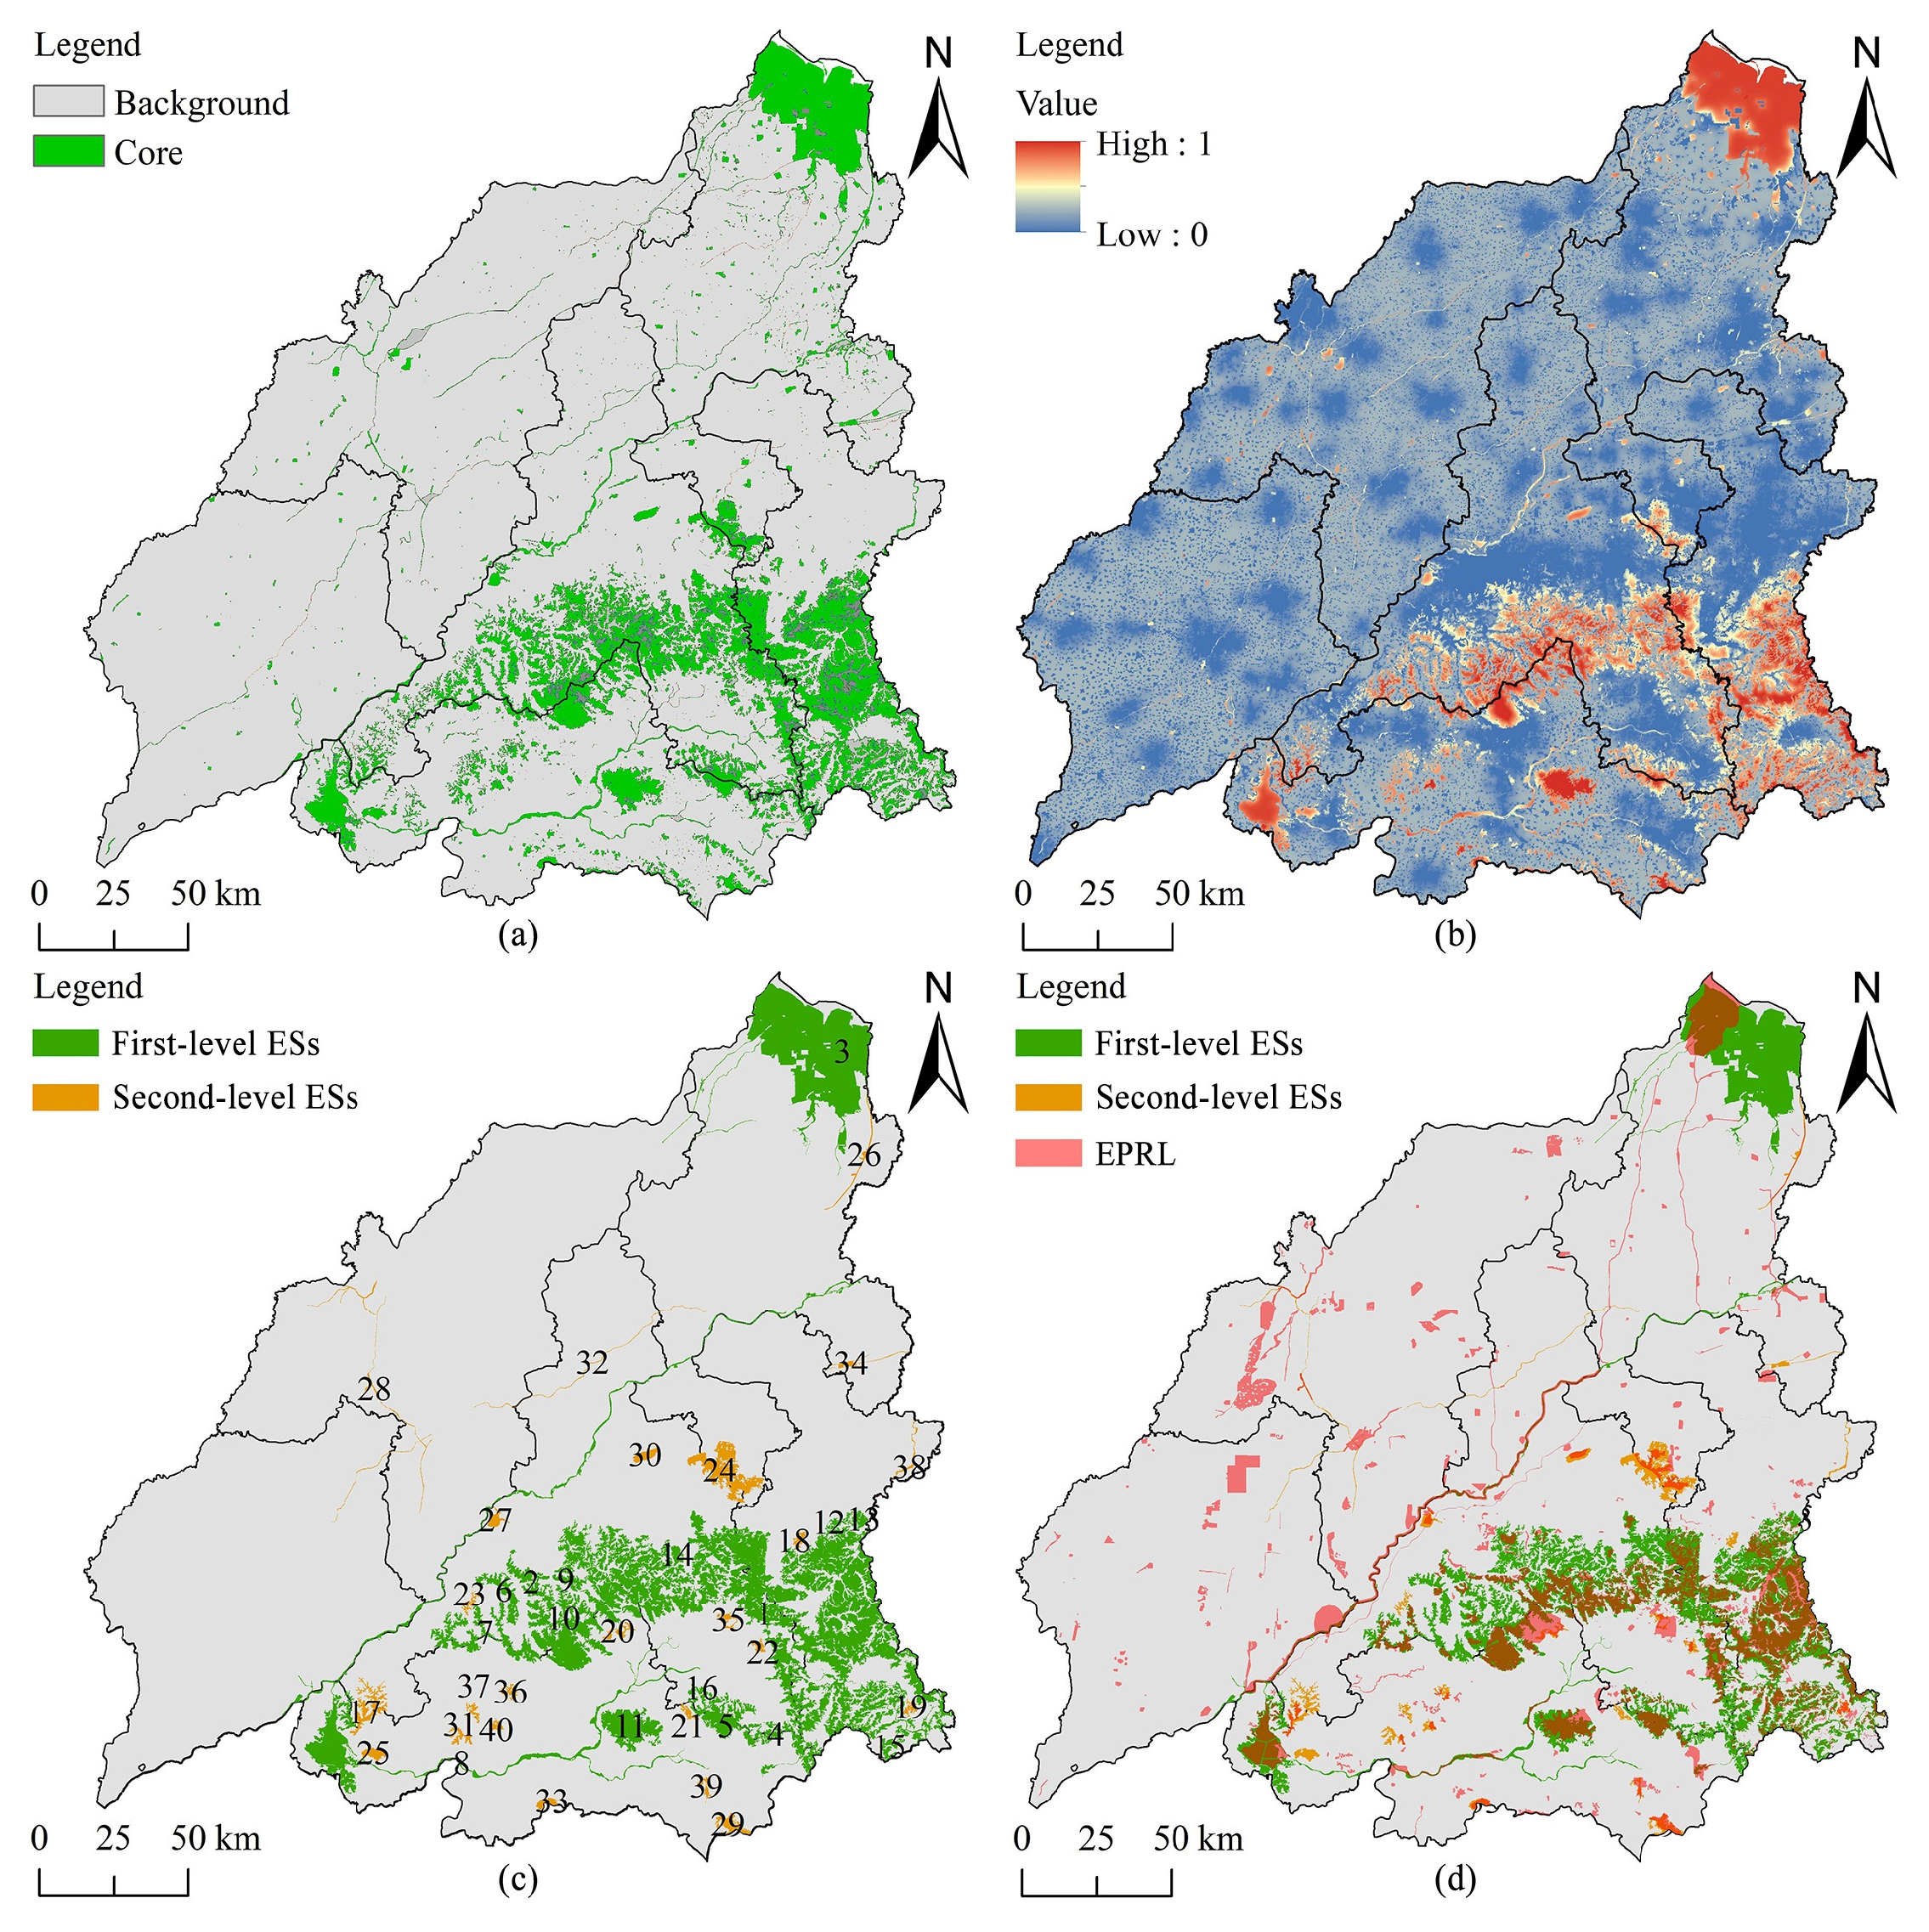
Figure 3a shows the landscape pattern distribution of Jinan metropolitan area based on MSPA. The foreground data is 7542.53 km2, which accounts for 14.49% of the total study area. In the foreground data, the core landscape area constitutes the largest portion, measuring 6617.82 km2 and accounting for 87.74% of the total foreground area. The core area is primarily situated in the southern mountainous and the northeast coastal area of the study area. In contrast, the central and western regions are sparser, and most of them are scattered small patches. The edge area is 768.15 km2 and exhibits certain edge effects. The perforation area is 76.64 km2, which only accounts for 1.02% of the total foreground area, indicating that the internal edge effect of the core area is relatively weak. The branch area and bridge area are 57.75 km2 and 17.63 km2, accounting for 0.77% and 0.23% of the total foreground area, respectively. Branch and bridge have a function in maintaining landscape connectivity, but the small proportion of their area indicates a lack of connectivity between core patches. The island patches are small, with an area of only 1.99 km2, indicating a strong holistic nature of the core area [55]. The loop area is 1.85 km2. In summary, the core area of the MSPA landscape type in the study area has the highest proportion, and the core patches are distributed regionally and unevenly. The anti-interference and stability levels of patches are good, but the connectivity between the patches needs to be further developed.

3.1.2. HQ Analysis

The spatial distribution of HQ in the study area is shown in Figure 3b. Based on the natural break method, the HQ is categorized into four grades: high-HQ areas (0.75–1), medium-high-HQ areas (0.50–0.75), medium-low-HQ areas (0.17–0.50), and low-HQ areas (0–0.17). High-HQ areas are predominantly found in the Mount Tai, Mount Yimeng, and Lushan Mountain in the southeast and the coastal regions in the northeast of the study area, covering a total area of 3177.06 km2. Medium-high-HQ areas are primarily situated around the high-HQ areas and along river systems, with a total area of 3683.22 km2. The predominant land use types in the top two HQ grades are forestland, grassland, and water. The medium-low-HQ areas constitute the largest portion of the research area, and the total area is 35,242.49 km2. Cultivated land is the primary LULC in this category, accounting for 82.09% of the total area. Low-HQ areas are mainly distributed within the urban zones, where construction land comprises 98.83% of the area. It is evident that there is a significant correlation between HQ levels and LULC.

3.1.3. ES Analysis

Following the integration, classification, extraction, and screening of HQ data and MSPA data, a total of 40 ESs (patch area ≥ 10 km2) were identified within the Jinan metropolitan area (Figure 3c). Among these, those with dPC values ≥ 0.5 were categorized as first level ESs. Upon verification, it was found that the overlapping area between the ESs and the EPRL accounted for 56.32% of the EPRL (Figure 3d), thereby demonstrating the high level of rationality in the distribution of the identified ESs. These ESs are predominantly distributed across two distinct zones, the southern region, encompassing Mount Tai, Mount Yimeng, Lushan Mountain, Culai Mountain, the Yellow River, the Dawen River, and Dongping Lake; and the northeastern region, primarily comprising the Majia River-Dehui River-Seashell Island coastal wetland area. The total area covered by these ESs is 6037.14 km2, representing 11.59% of the study area. Table 7 provides detailed data on 16 first-level ESs in the study area, which span an area of 5463.20 km2 and constitute 90.49% of the entire area covered by ESs. In contrast, the 24 secondary ESs account for only 9.51% of the total ESs’ area due to their smaller patch sizes. The land composition of ESs is predominantly forestland (42.86%), followed by grassland and water. Among the cities, Jinan has the largest ES (32.28%), followed by Zibo (27.59%), while Liaocheng has the smallest ES. Jinan exhibits superior ecological quality compared to other cities, with Zibo, Binzhou, and Tai’an forming the second tier of ecological conditions. However, Dezhou and Liaocheng have fewer ESs.
From a spatial distribution perspective, ESs are predominantly situated in mountainous regions and near rivers, lakes, and coastal zones. The primary ESs are concentrated in the Taiyi Mountains range and coastal wetland areas, including key locations such as the Mount Tai area, Lushan Mountain area, Lianhua Mountain area, Culai Mountain area, Jianyun Mountain area, Yuncui Mountain area, the Dawen River, the Yellow River, Dongping Lake, the coastal wetlands of Binzhou, and the Shell Bay and Wetland national nature reserve. Notably, there is a significant concentration of ESs within the Taiyi Mountain range and coastal regions. Secondary ESs are primarily found in areas like the Baifoshan Scenic Area, Wubulinghuo Gate Scenic Area, Yunmeng Mountain, the Phoenix Mountain range, southern Zhaishan of Xintai, the Heban Mountain range, Baiyun Lake Park, Jixi National Wetland Park, the Xiao Qing River, the Tu Hai River, the Yellow River diversion canal, and the Majia River. This distribution pattern indicates that ESs are predominantly located in mountainous regions, coastal wetlands, riparian and lacustrine environments, as well as protected areas and scenic spots characterized by favorable ecological conditions.

3.2. EC Identification

3.2.1. Comprehensive Resistance Surface

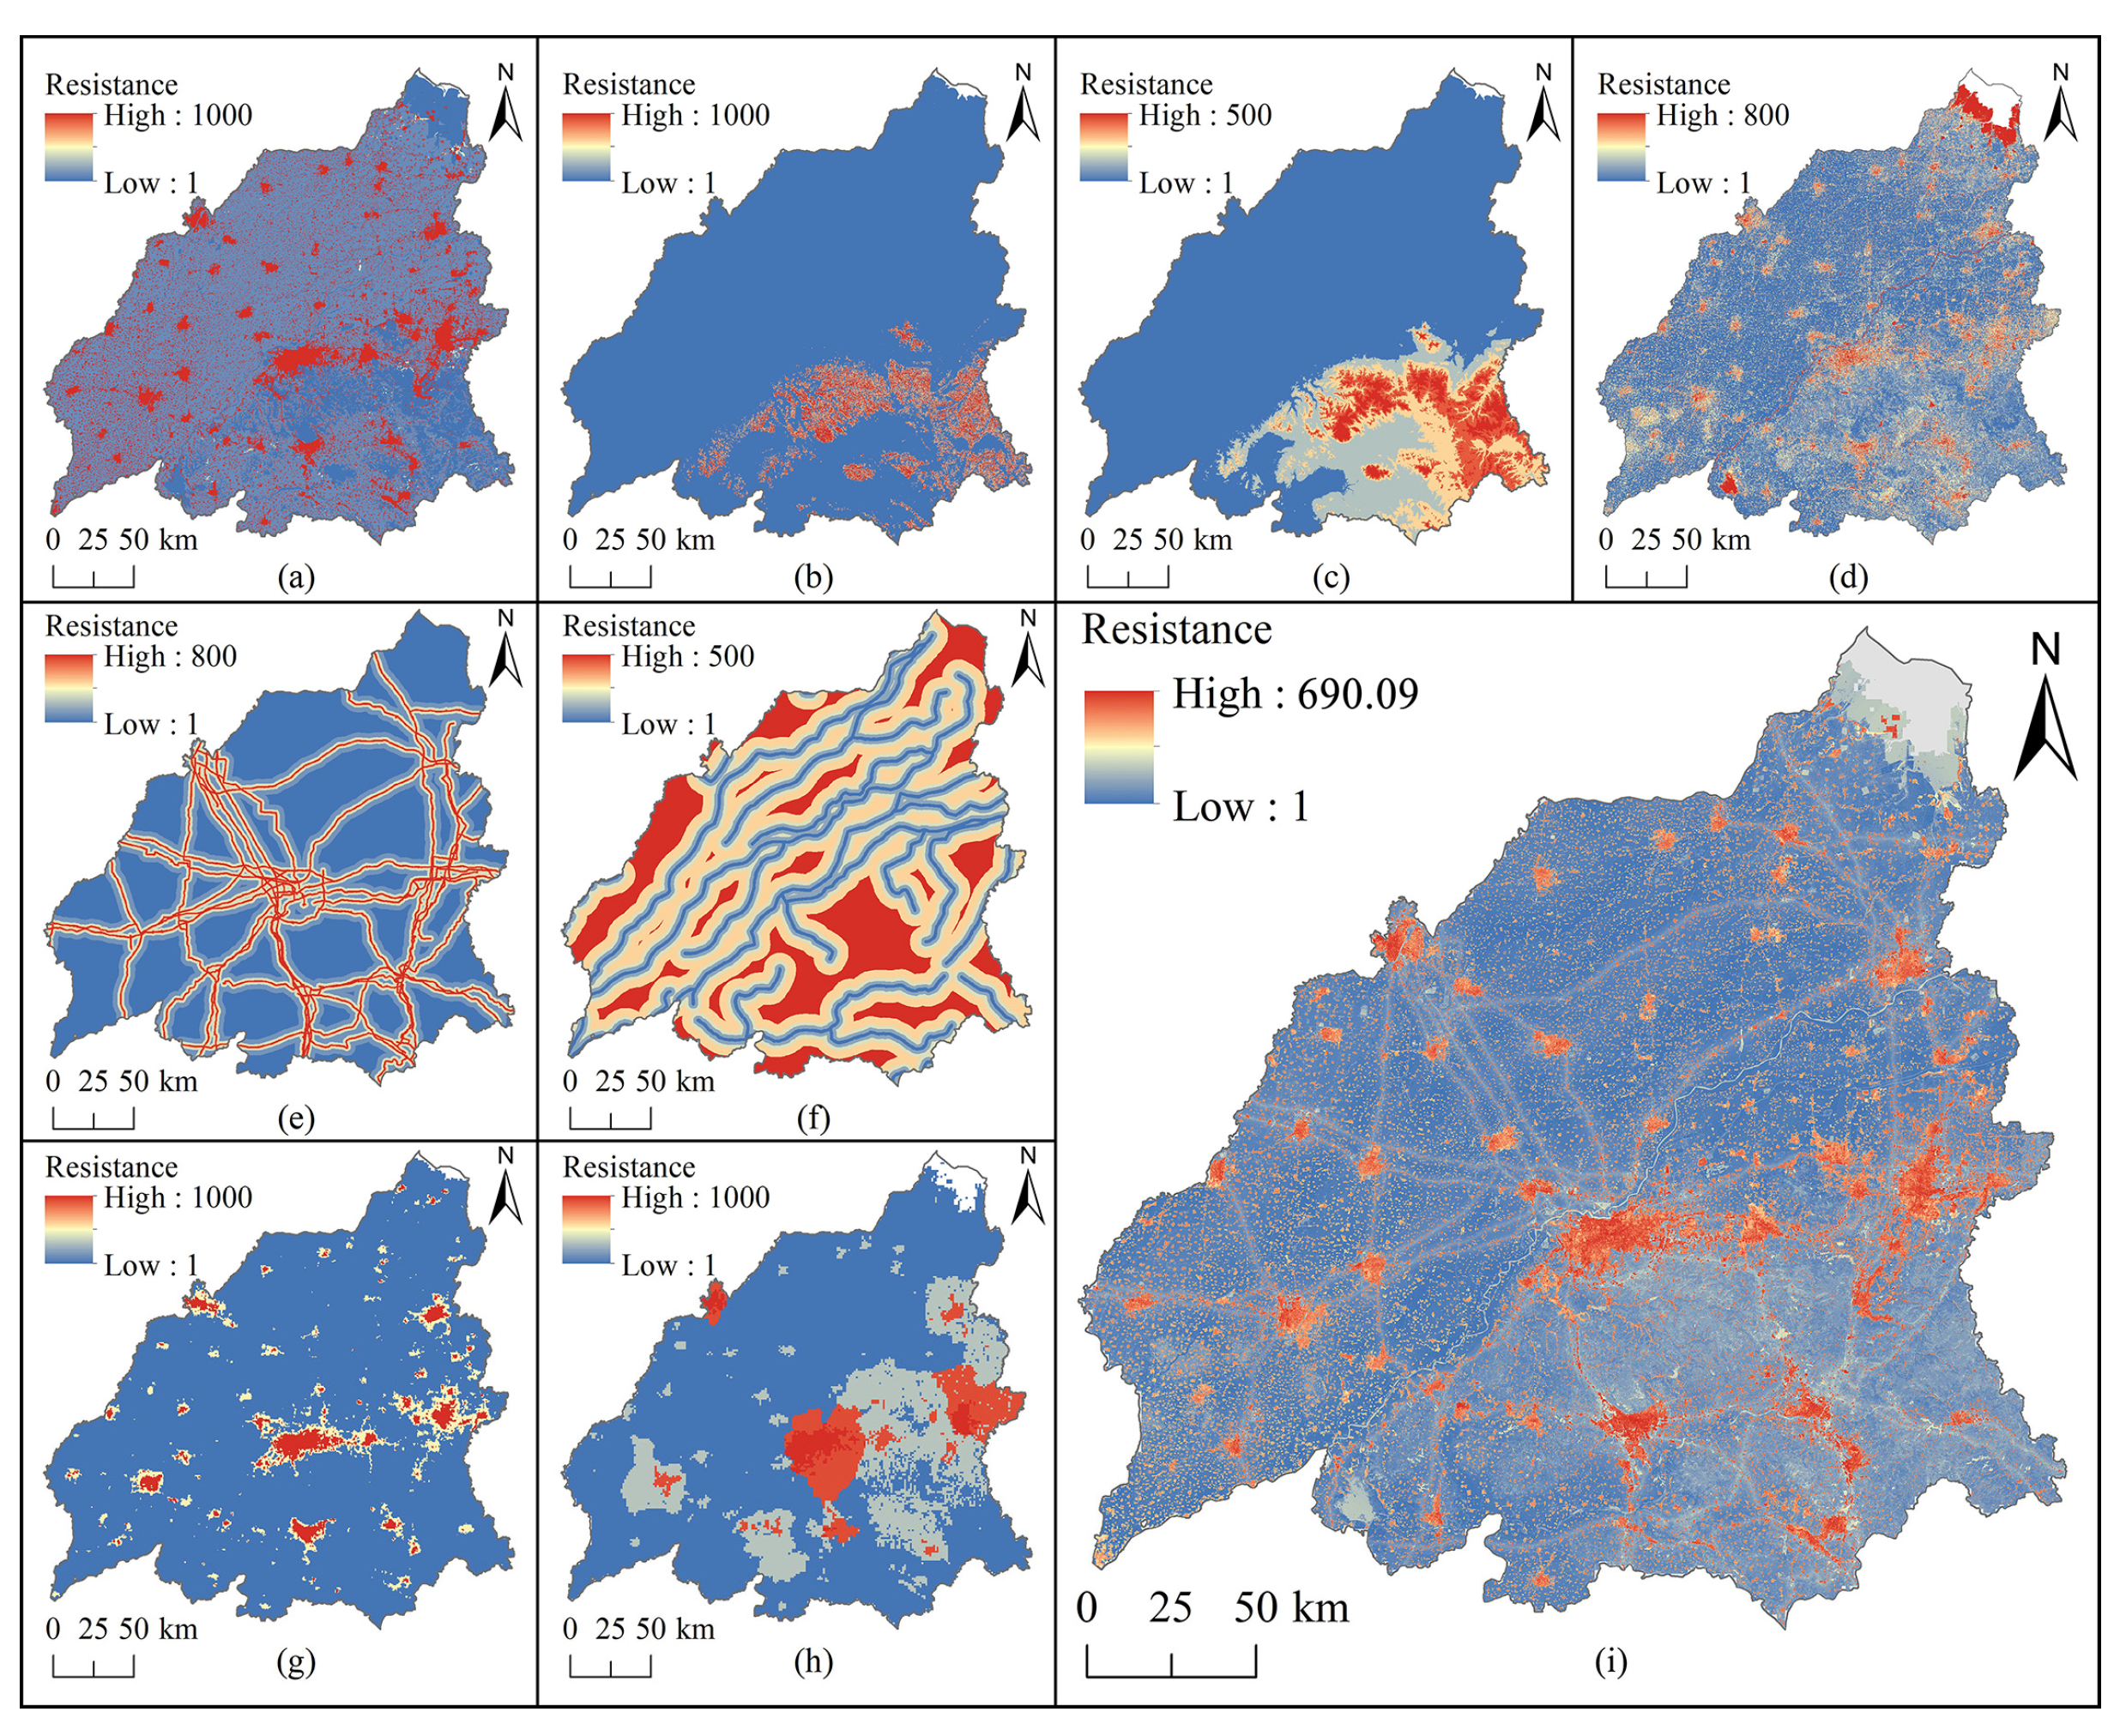
Following the reclassification and assignment of each resistance factor (Figure 4), by overlaying these factors the comprehensive resistance surface was obtained (Figure 4i). Regions that have higher ecological resistance values are predominantly situated in urban areas, as evidenced by land use type data, GDP, and nighttime lighting data. This indicates that human activities exert a significant negative impact on the ecological environment. The distribution of urban and town areas within the study area is relatively uniform, with extensive urban patches surrounding the Taiyi Mountains. The northwest region of the research area is mainly covered by plains (Figure 4b,c), where the predominant land use type is cultivated land, reflecting a high rate of agricultural development and utilization (Figure 4a). Topographically, the northwest plain area provides more favorable conditions for biological migration compared to the Taiyi Mountains range. Rivers (Figure 4f) and roads (Figure 4e), acting as linear network structures, have contrasting effects on organisms: rivers facilitate biological migration, whereas roads pose substantial barriers. The synthesized comprehensive resistance surface results derived from the aforementioned resistance factor data are both comprehensive and reasonable.

3.2.2. EC Extraction

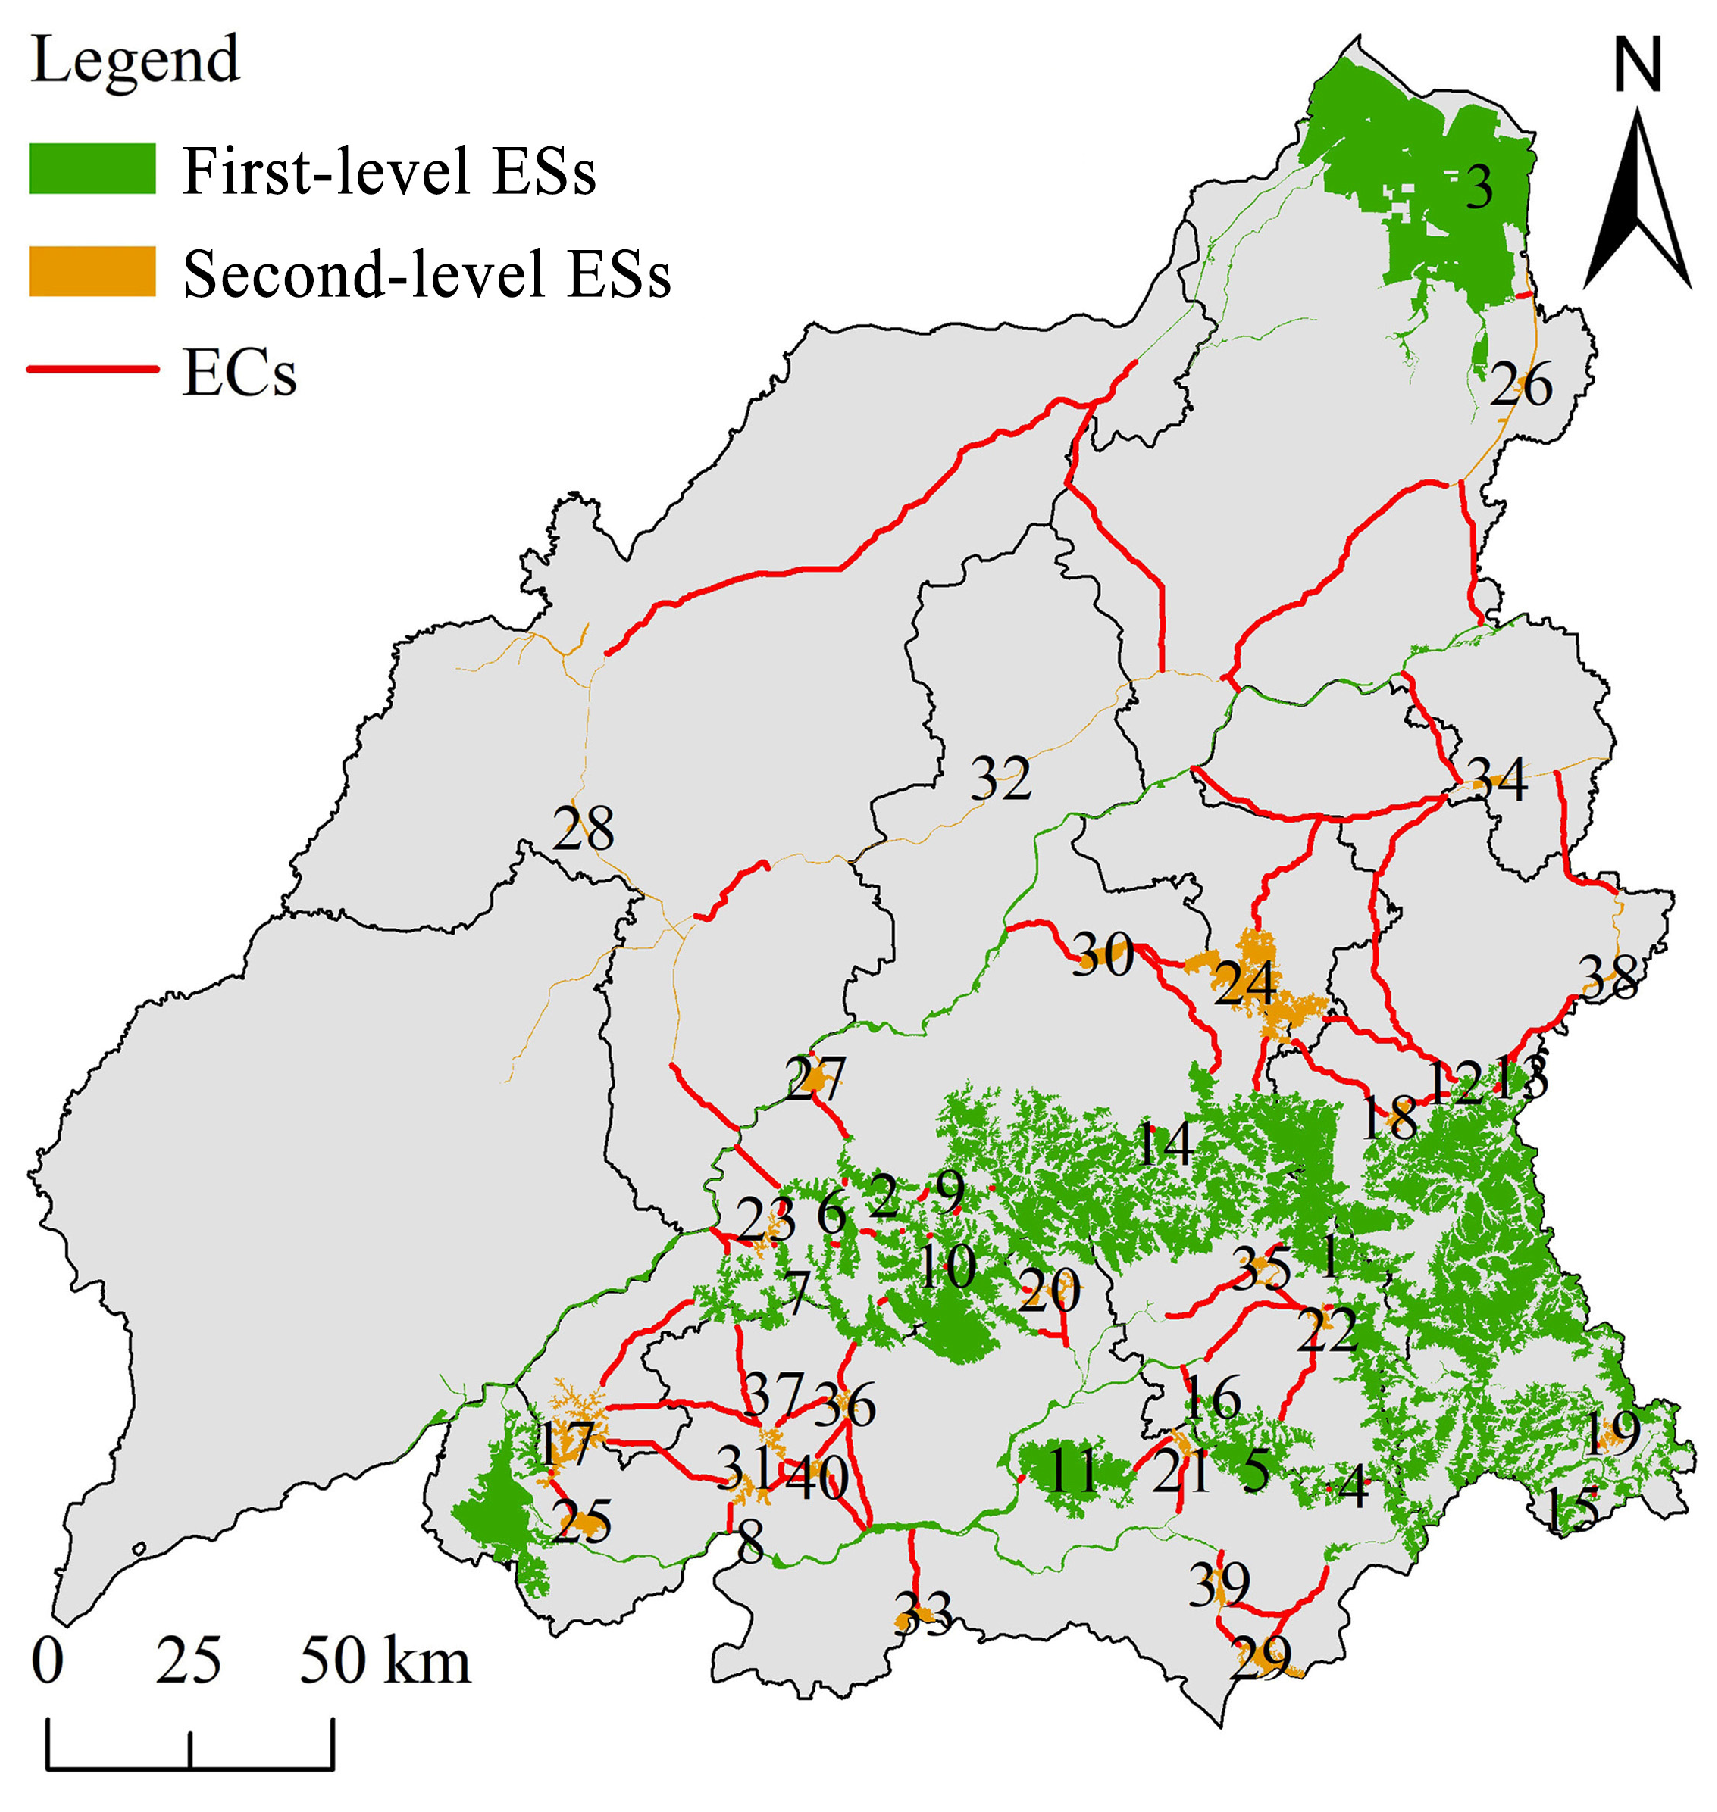
A total of 84 ECs were extracted within the research area (Figure 5), with a cumulative length of 1137.57 km. In terms of spatial distribution, these ECs are mainly located in the east-central region, where Binzhou contains the longest cumulative EC length, measuring 259.43 km. The northern region exhibits relatively continuous and intact ECs, while those in the southern region are more fragmented. In the Taiyi Mountains and the southern portion of the study area, where ESs are densely distributed and numerous, ECs tend to be shorter and more widely dispersed. Conversely, in the northern region of the study area, ESs primarily consist of water bodies arranged in linear patterns, leading to a scattered distribution of ECs. Although fewer in number, the ECs in the northern region are characterized by their greater length. Specifically, there are 25 ECs in the northern region of the Taiyi Mountains, and their total length is 754.24 km, whereas in the southern region, there are 59 ECs with a total length of only 383.33 km.

3.3. EN Optimization and Optimization Effect

3.3.1. Priority Protection Areas

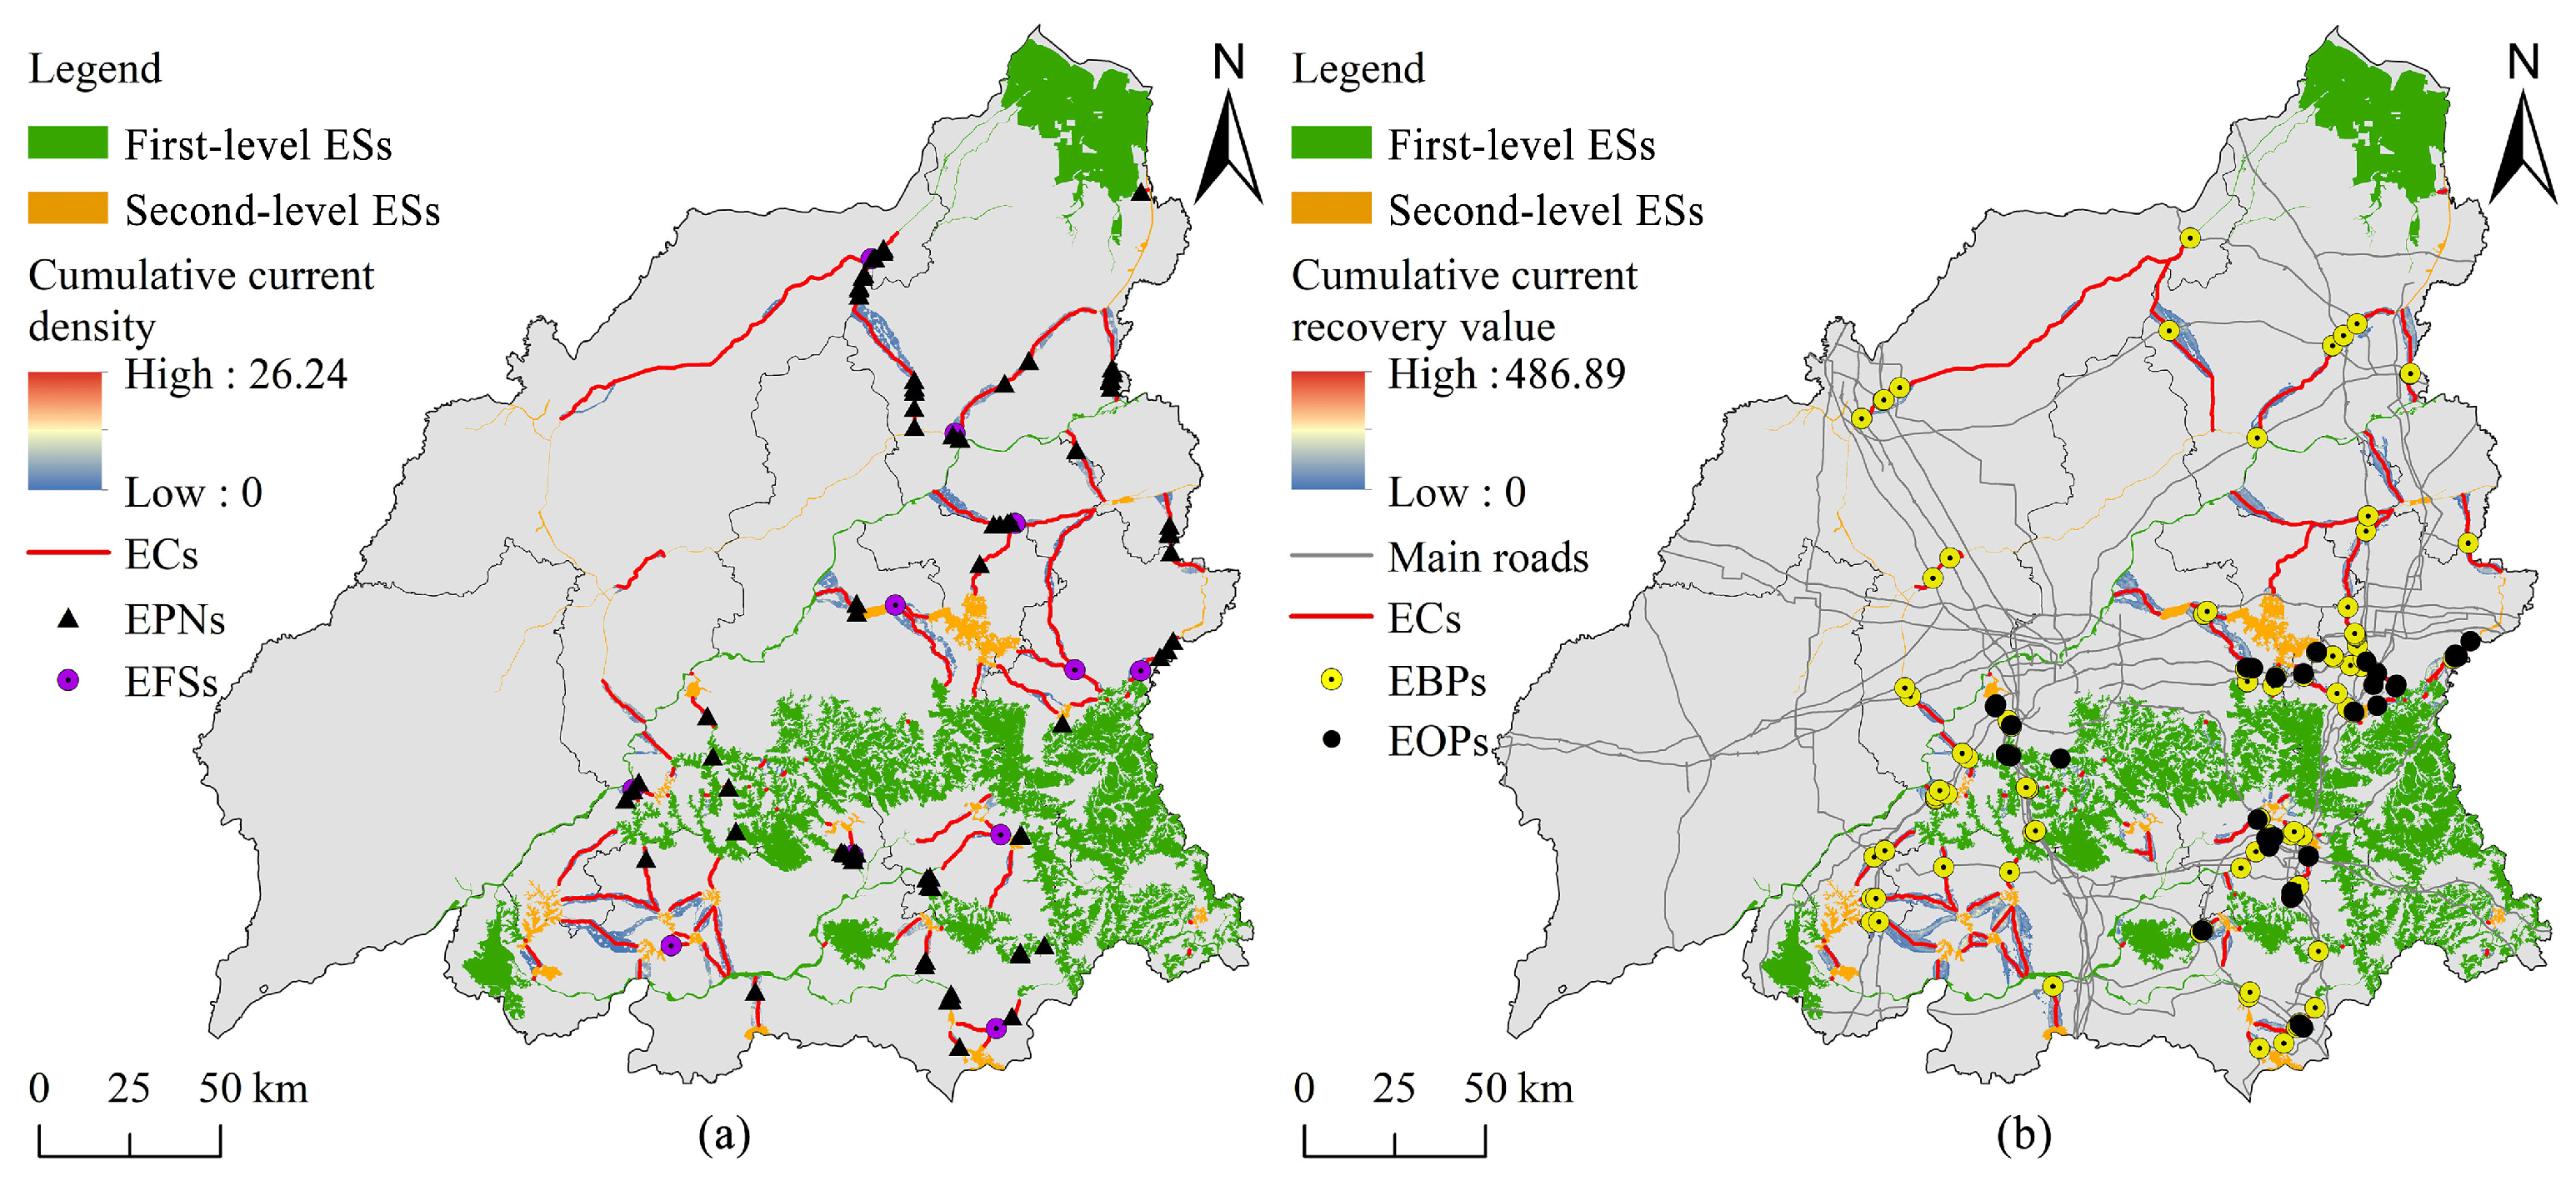
Ecological pinch points represent regions with high biological utilization rates within the ECs. However, the resistance surrounding these corridors is significant, making them susceptible to fragmentation. Based on the EC data, a total of 75 ecological pinch points were identified in the research area (Figure 6a), covering an aggregate area of 5.28 km2. Cultivated land and water are the key LULCs within these ecological pinch points, accounting for 72.75% and 22% of the total ecological pinch point area, respectively. The remaining 5.25% comprises forestland, grassland, and minimal construction land. Given their pivotal function in maintaining the connectivity of ECs, ecological pinch points should be the primary conservation zones within the EN.
From an urban perspective, Jinan has the largest area of ecological pinch points, with 17 ecological pinch points covering a total area of 1.87 km2, accounting for 35.49% of the total area. This is followed by Tai’an and Binzhou, which have 19 ecological pinch points totaling 1.58 km2 and 28 ecological pinch points totaling 1.27 km2, respectively. Zibo has six ecological pinch points with an area of 0.38 km2, while Dezhou has seven ecological pinch points covering 0.18 km2. After identifying and screening EC intersections within the study area, 11 intersections were ultimately selected as ecological footstones (Figure 6a). These ecological footstones are located in the overlapping areas of two corridors, where biological usage frequency is higher compared to other corridors. The establishment of ecological footstones can alleviate the pressure of ECs and extend the distance of biological migration, thereby playing an important ecological role.

3.3.2. Priority Recovery Areas

Ecological obstacle points are regions characterized by high resistance values within the ECs, which significantly impede the migration of organisms. A total of 39 ecological obstacle points were observed in the study area (Figure 6b). The total area of these ecological obstacle points is 7.52 km2, with the predominant LULC being construction land, accounting for 85.75% of the total obstacle area. The spatial distribution of ecological obstacle points exhibits a distinct regional concentration, with a large distribution in the center region of the study area. Jinan has the largest ecological obstacle point coverage, comprising 20 locations totaling 3.67 km2, representing 48.80% of the total obstacle area. Zibo contains 13 internal barriers covering 3.29 km2. In contrast, Binzhou and Tai’an exhibit relatively smaller ecological obstacle point distributions. Additionally, 109 ecological breakpoints were extracted in the research area (Figure 6b). As the core city of the Jinan metropolitan area, Jinan has a significant number of converging traffic routes, resulting in the highest ecological breakpoint count of 49. Zibo follows with 24 ecological breakpoints, while Tai’an, Binzhou, and Dezhou have fewer, with 16, 11, and 10, respectively. These findings suggest that ecological restoration efforts should prioritize the central region of the study area.

3.3.3. EN Optimization

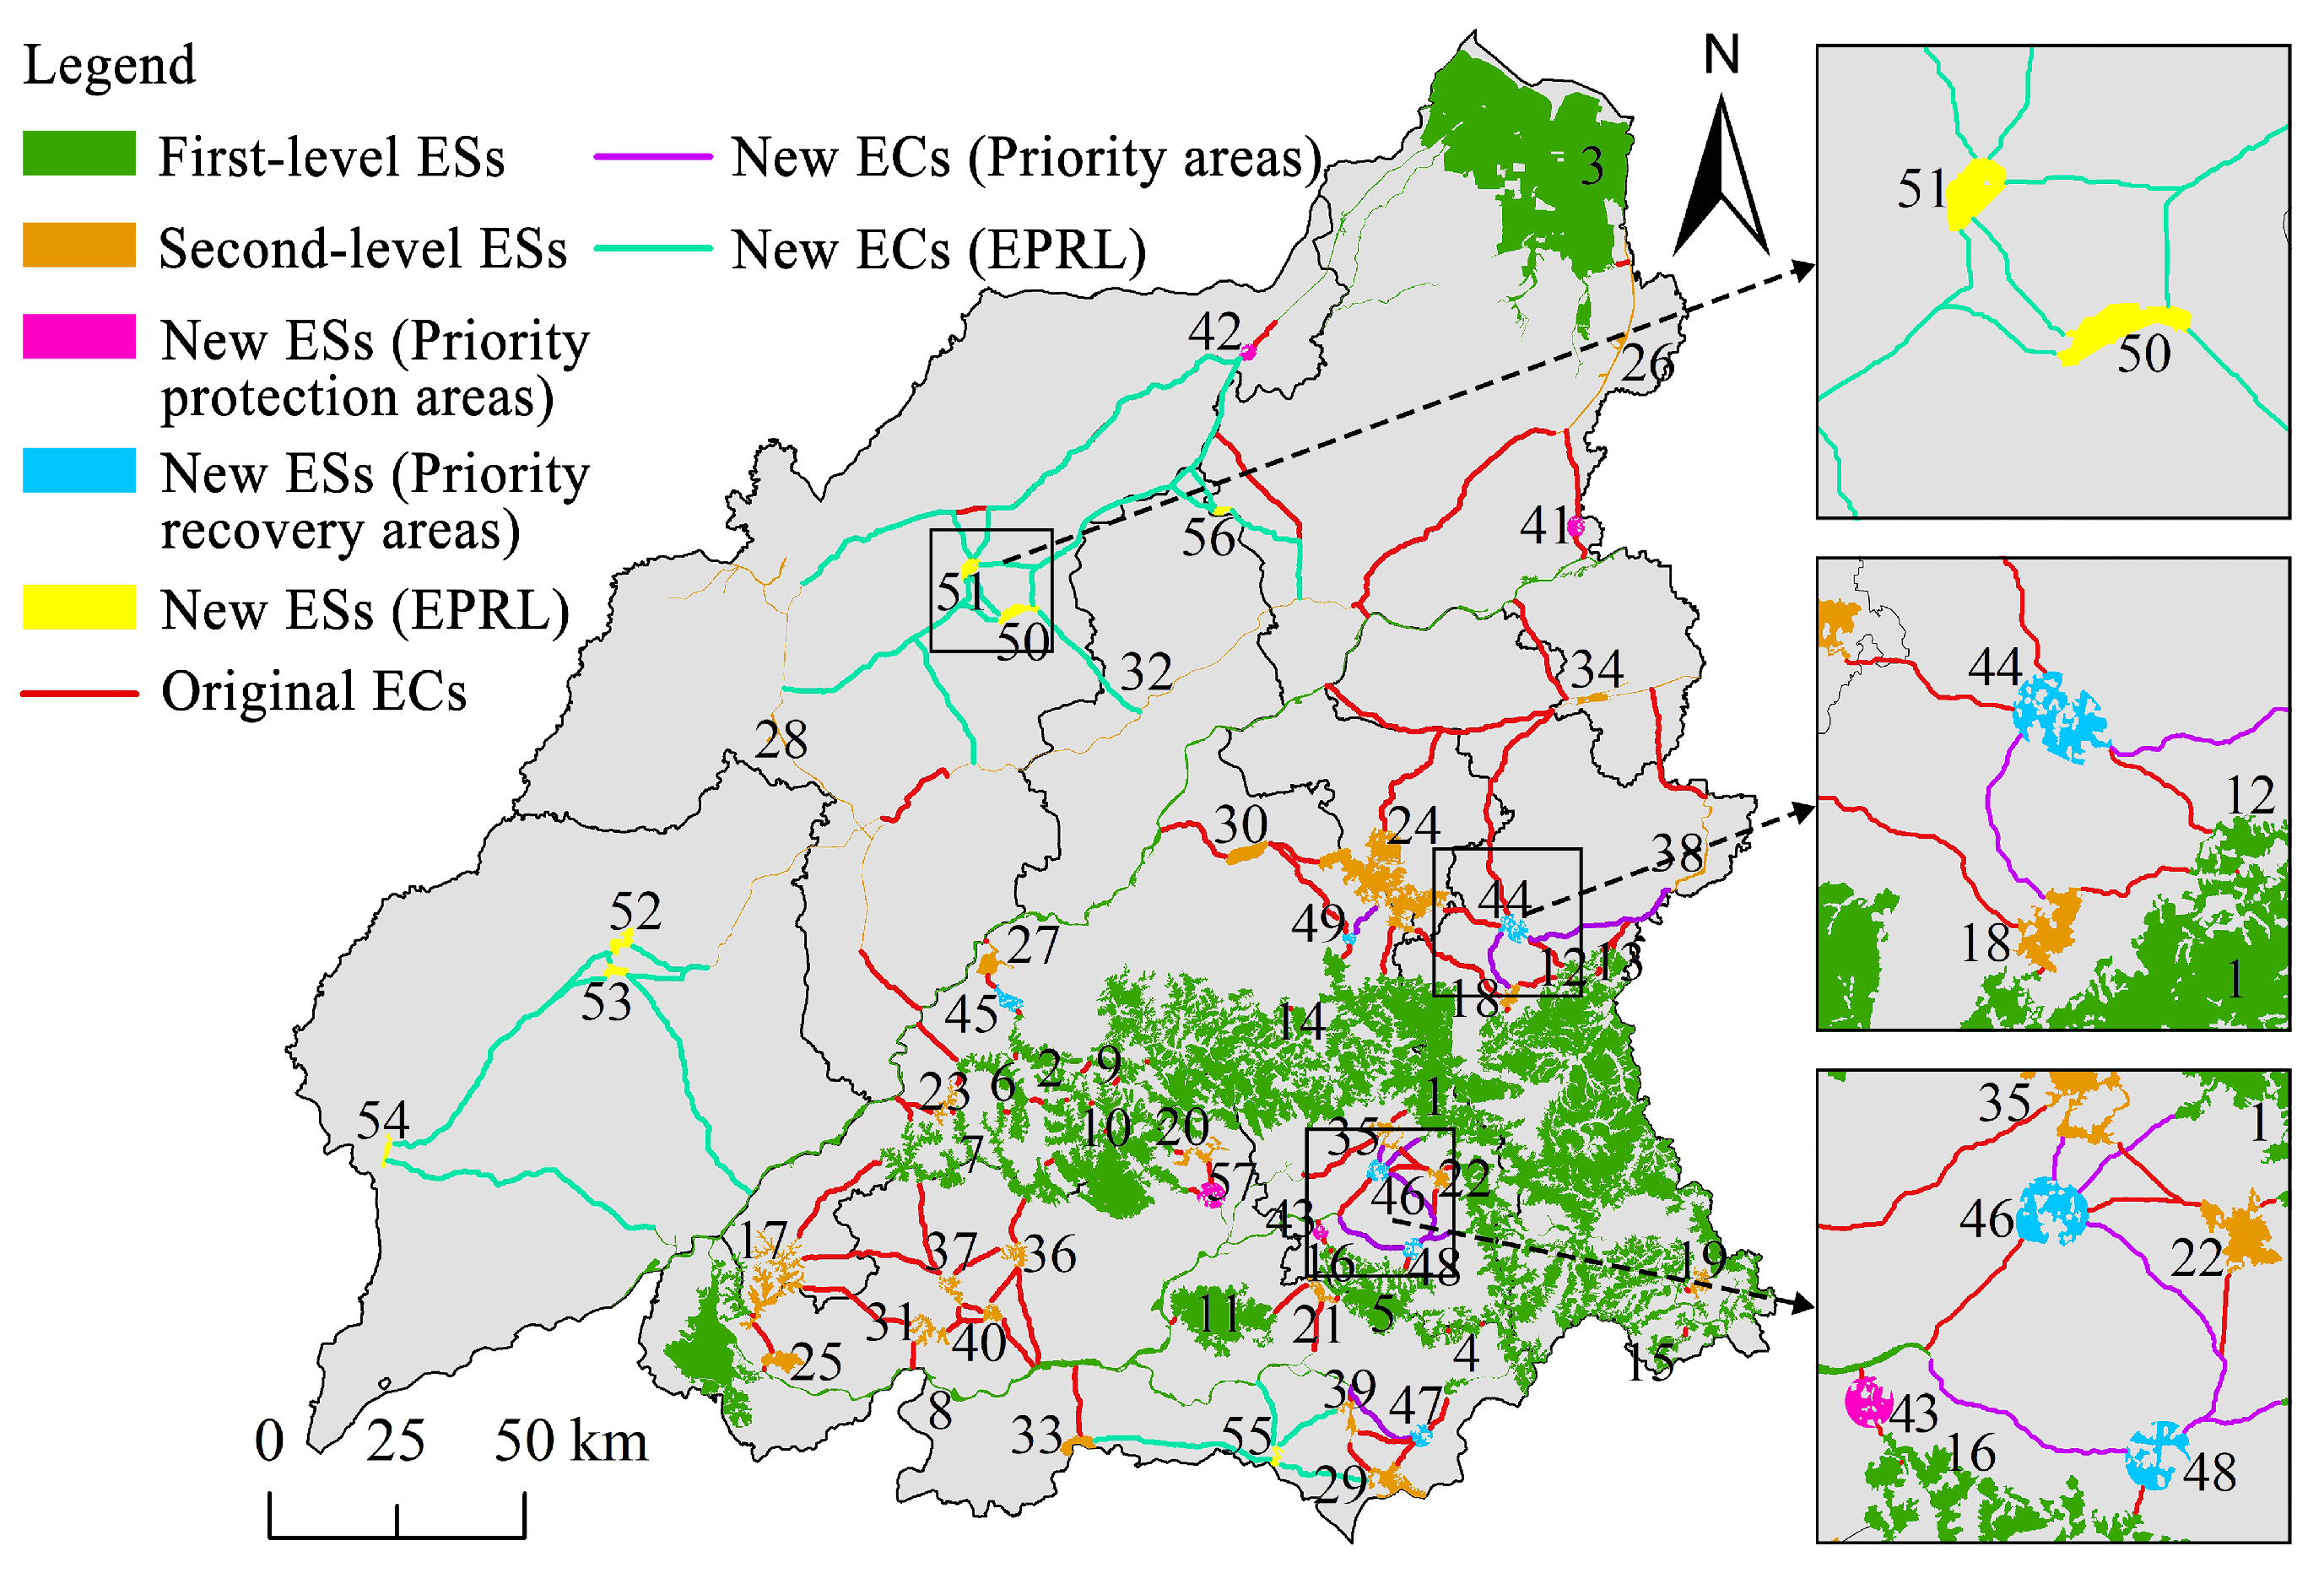
With the ecological pinch points, ecological footstones, ecological obstacle points and ecological breakpoints extracted above serving as potential optimization areas, kernel density analysis was used to precisely identify the specific optimization areas. To determine an appropriate search radius for the kernel density analysis, five search radii ranging from 3000 m to 6000 m were systematically evaluated. The optimal search radius was determined based on the number and the total area of newly identified ESs under varying kernel density search radius. The complexity of formulating targeted ecological restoration measures increases with the size of the restoration area [25]. Based on the analysis presented in Table 8, a search radius of 5000 m was identified as the most appropriate (Figure 7). Ultimately, 10 new ESs were identified (Figure 8), covering a total area of 104.81 km2.
According to the EPRL, seven new ESs were identified (Table 9), with a combined area of 54.38 km2. Among these, three ESs are distributed in Liaocheng, with an area of 28.22 km2. Two ESs are distributed in Dezhou, while one ES each is present in Binzhou and Tai’an (Figure 8).
The newly extracted ESs were then integrated with the original ESs (Figure 8). Ultimately, the optimized EN comprised a total of 57 ESs, covering an area of 6196.09 km2. Jinan exhibited the highest number of newly added ESs, totaling five locations with a combined area of 42.02 km2. Tai’an added three ESs, covering a total area of 36.02 km2. Liaocheng and Dezhou each added three ESs. Binzhou added two ESs, and Zibo added one ES. The optimized EN included 124 ECs (Figure 8), and the total length is 2038.56 km, representing an increase of 900.99 km compared to before optimization.

3.3.4. Evaluation of the Optimization Effect of EN

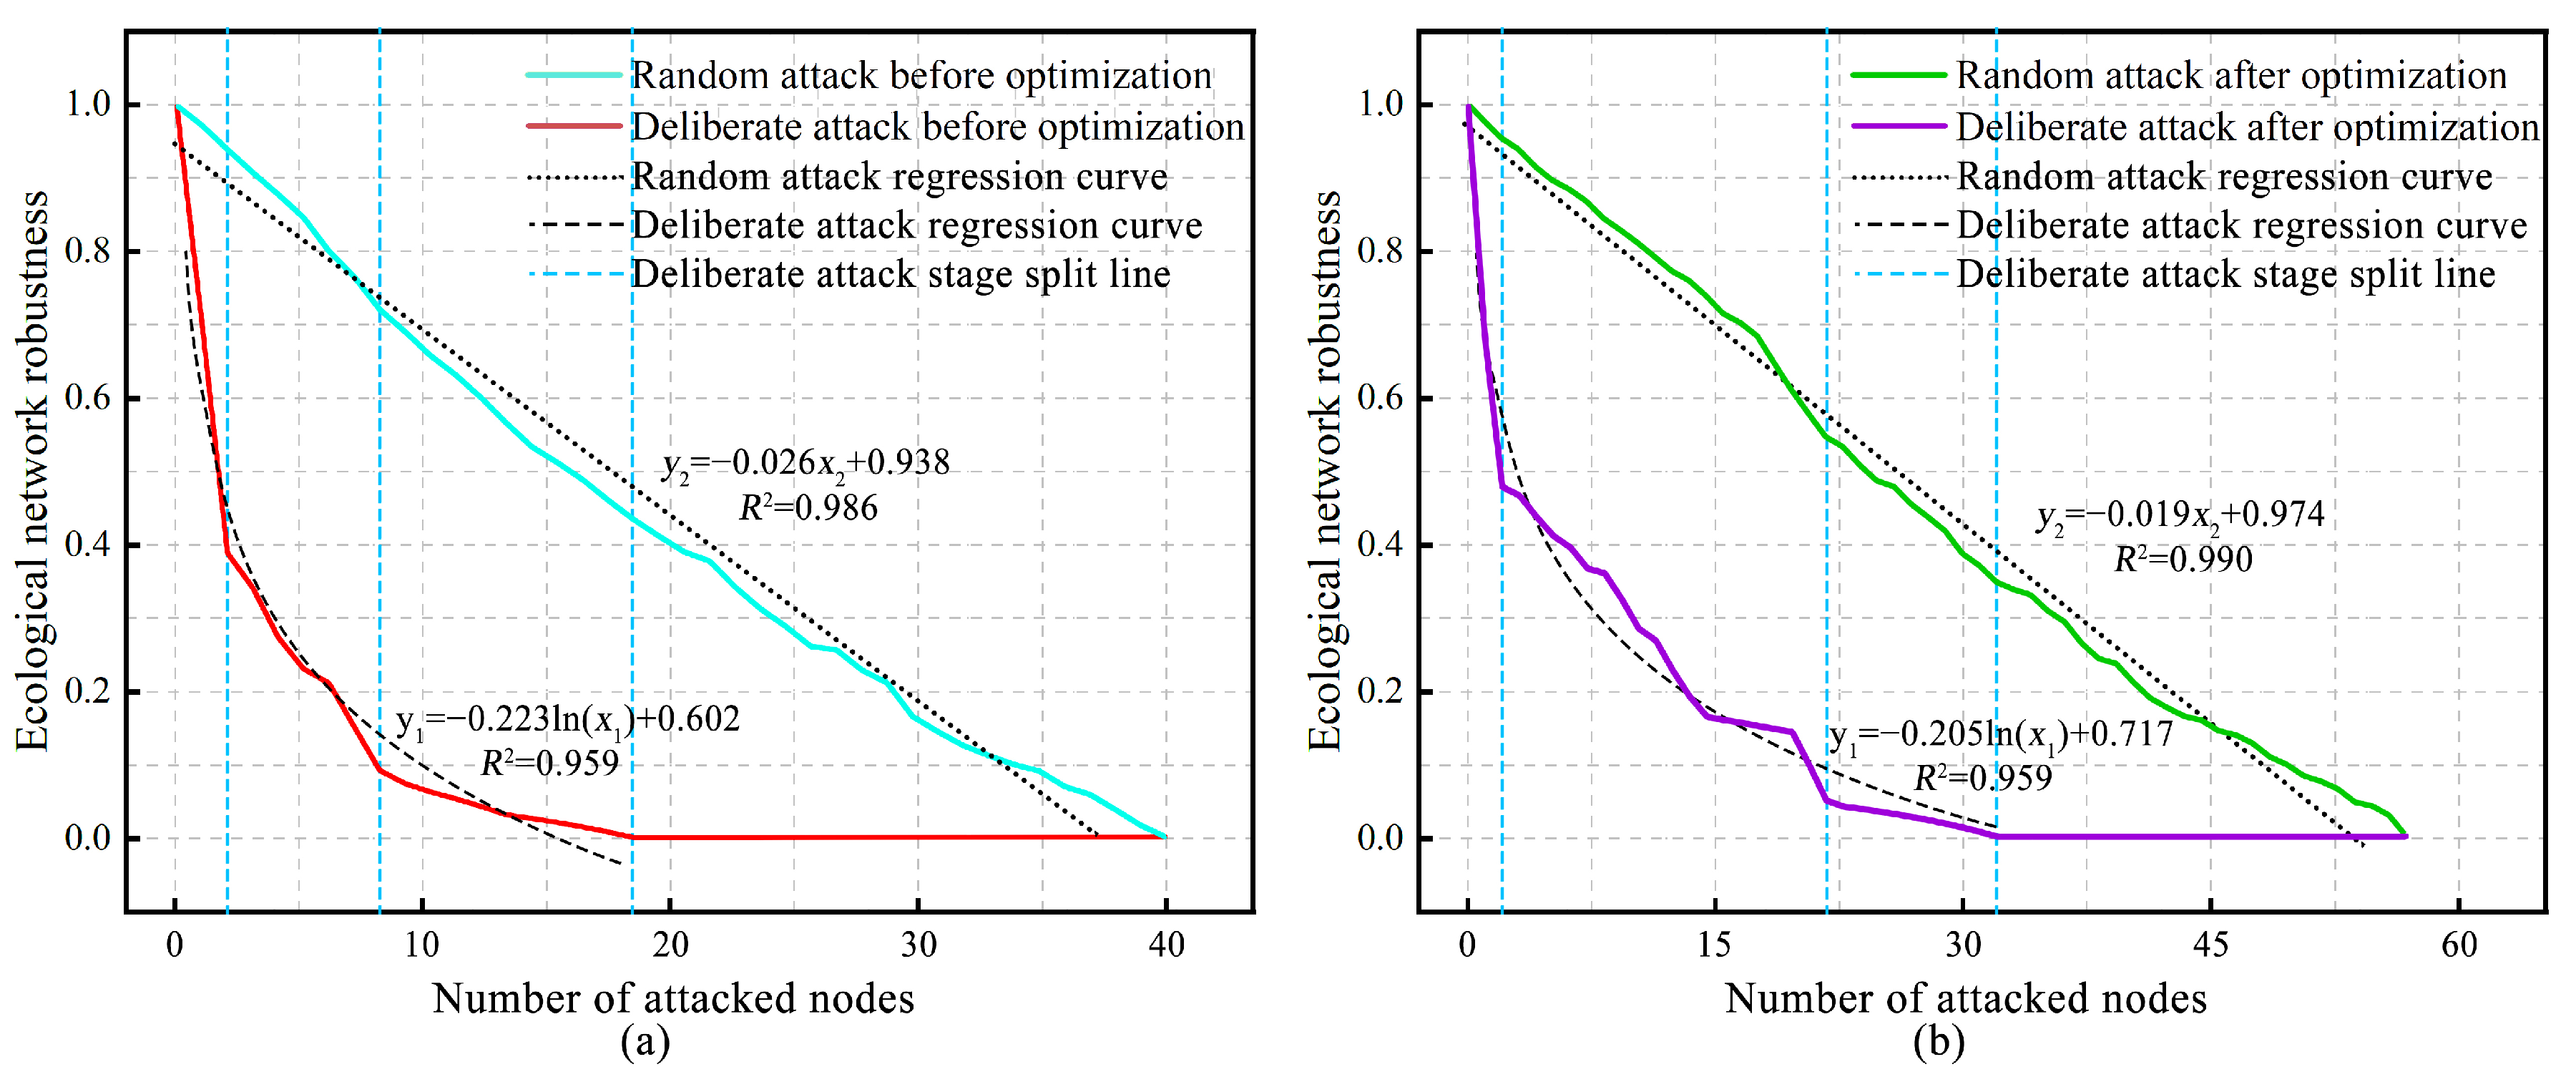
The source nodes of the EN of the Jinan metropolitan area were subjected to random and deliberate attacks, and the robustness of the EN is illustrated in Figure 9. The average robustness of the optimized EN increased from 0.435 prior to optimization to 0.459 in the random attack scenario. In the deliberate attack scenario, the process was split into four stages according to the decline rate. During the initial sharp decline stage, when ES 1 and ES 8 were removed from the EN both before and after optimization, the robustness of the EN decreased to 0.390 before optimization and to 0.479 after optimization. In the middle stage of rapid decline, six ESs were removed from the initial EN, while nineteen ESs were removed after optimization. The average influence of each ES on EN robustness decreased from 0.049 before optimization to 0.023 after optimization. In the middle and late stages of gentle decline, the robustness decreased from 0.092 when ten ESs were removed before optimization to 0.049 when ten ESs were removed after optimization. In the final stage where the EN reaches complete failure, the proportion of the EN in the complete failure state decreased from 55% before optimization to 44.64% after optimization.
Additionally, the slope of the downtrend line was −0.026, with a coefficient of determination of 0.986 when the EN is attacked randomly before optimization. When subjected to a deliberate attack, the slope of the robustness downtrend line decreased to −0.223, with a coefficient of determination of 0.959. For the optimized EN under random attacks, the slope of the downtrend line was −0.019, and the coefficient of determination was 0.990. Under deliberate attacks, the slope of the downtrend line for the optimized EN was −0.205, with a coefficient of determination of 0.959. Based on the aforementioned analysis, the decline in EN robustness after optimization is more gradual, indicating that the robustness of the EN after optimization is significantly improved, and the EN structure is more stable.

4. Discussion

4.1. Advantages of Optimization Methods

The distribution of priority areas can effectively reflect the ecological status of the region. Regions with a high density of priority areas are generally those facing the most severe ecological challenges within the EN [56]. On one hand, newly identified ESs can alleviate the adverse effects on the EN caused by existing issues and provide buffer zones for ecological restoration [57]. On the other hand, they enhance the efficiency of EN optimization. Based on the different types of priority areas used to extract new ESs, this study categorizes new ESs into different types. Specifically, the ESs identified within priority recovery areas, including Jinan, Zibo, Laiwu, and Xintai, are intended to address the issue of excessive resistance encountered in ECs. Meanwhile, ESs identified in priority protection areas focus on combating the degradation of ECs [58]. The spatial distribution of priority areas not incorporated into new ESs is relatively fragmented; therefore, ecological restoration can be conducted at the administrative district level as a long-term optimization strategy for the EN. ESs identified based on the EPRL exhibit favorable ecological conditions. These ESs can function as cores for establishing ecological buffer zones, improving surrounding ecological environments, and expanding the coverage of ESs [59]. For instance, Liaocheng could further increase the number of ESs using this approach.
EPRL can be classified into ecologically functionally significant areas and ecologically sensitive or fragile areas. However, not all EPRLs possess favorable ecological conditions comparable to those of established ESs [60]. In this study, EPRLs with an area exceeding 5 km2 and a focus on biodiversity protection are designated as new ESs to fill the gaps in the existing network. This approach not only reduces the costs associated with ecological restoration but also ensures that the newly designated ESs maintain high ecological quality. The Dezhou Red Altar Temple Provincial Forest Park, the Liaocheng Chiping National Forest Park, the Caitun Forest Farm, and the Shen County Masi City-level Forest Park are included. These EPRLs exhibit significant advantages as ESs and hold significant practical implications for implementing precise ecological restoration and ecosystem protection. Additionally, the robustness of the optimized EN was calculated to evaluate the optimization effect. The results demonstrate that the stability of the optimized EN has substantially improved, thereby confirming the feasibility of the optimization method based on ecological priority areas and EPRL.

4.2. ESP and Recommendations

The EN emphasizes the interconnectivity of functional components and the spatial integrity of corridor systems, highlighting the control of ecological processes such as species diffusion and migration [61]. It constitutes a resilient ecological conservation framework [62]. This study optimized the EN from multiple perspectives of network connectivity and the spatial distribution of ESs and constructed an ESP of “One Belt, Two Axes, Two Zones, and Five Cores” for the Jinan metropolitan area, as shown in Figure 10. Corresponding repair strategies and recommendations were proposed from the following aspects:
(1)
One Belt. The “One Belt” refers to the Dongping Lake-Taiyi Mountain ecological conservation belt, which encompasses the region where the ESs of the Jinan metropolitan area are predominantly concentrated. Dongping Lake is the largest lake within the Jinan metropolitan area and exhibits high HQ. Dongping Lake also serves as a critical area for flood storage. However, the development of safety infrastructure in the region has been relatively slow, which poses a potential threat to ecological development and construction. As a national ecological wetland park, it is essential to enhance ecological infrastructure and proactively prevent ecological degradation. The Taiyi Mountain Range, characterized by its complex topography and relatively low level of development, maintains high ecological quality and dense vegetation coverage, making it ecologically significant for species migration and habitat activities. Nevertheless, the presence of numerous historical open-pit mines and steep terrain in the central and southern parts of Shandong Province have led to significant challenges related to soil erosion, particularly in the southern mountainous areas, such as Jinan [63]. Currently, the Taiyi Mountain Ecological Protection and Restoration Project has been incorporated into the Shandong Province Land Use Plan. Therefore, while safeguarding existing high-quality habitats, ecological restoration efforts should prioritize reducing bare land development. Reforestation initiatives should be implemented on farmland located on steep slopes, and management practices concerning bare land and mountain ecological restoration should be strengthened.
(2)
Two Axes. The “Two Axes” are the ecological core axis and the ecological river axis. The ecological core axis refers to the spatial linkage formed by Dongping Lake, Mount Tai, Heban Mountain, and the Seashell Island coastal wetland area. This ecological core axis exerts a significant controlling and radiating influence on the ecological structure of the study area. However, the spatial distance between the Seashell Island coastal wetland area and Heban Mountain is relatively large, which may hinder the functional continuity of the axis. By prioritizing ecological development at the intersection of the ecological core axis and the Yellow River, a new ecological core zone can be established, thereby improving the overall coherence and effectiveness of the ecological core axis. The ecological river axis follows the course of the Yellow River, traversing the Jinan metropolitan area and functioning as a crucial EC within the study region. Jinan represents a key node along this ecological river axis. Despite its status as the central city of the metropolitan area, Jinan faces the challenge of being a “weak provincial capital.” Therefore, it will be prioritized in future development plans. Notably, the Yellow River flows as a suspended river through Jinan, presenting potential flood risks to the urban area. During urban development and construction, flood control projects should be carried out simultaneously. Furthermore, strict regulations should be established to safeguard the ecological integrity of the Yellow River and its surrounding environment. Both the ecological core axis and the ecological river axis provide essential support for the ecological environment and socio-economic development of the urban agglomeration due to their extensive spatial influence. Therefore, it is imperative to enhance the connectivity and implement coordinated protection measures for both the ecological core axis and the Yellow River ecological axis.
(3)
Two Zones. The “Two Zones” refers to the Liaocheng ecological supplement zone and Dezhou-Jinan-Binzhou ecological supplement zone located in the northwestern part of Shandong Province. The terrain of this area is mainly plain, and the main land use types are farmland and construction land. There is a notable risk of soil desertification in the area. The northwestern part of Shandong Province constitutes a key area within the province’s “three zones and nine fields” agricultural spatial framework, where farmland protection represents a critical objective. The frequent agricultural activities and development and construction have led to a relatively low HQ and a lack of ESs in this area. Therefore, integrating farmland protection with ecological function enhancement through measures such as the establishment of farmland protection forests can facilitate the coordinated development of agricultural sustainability and ecological conservation. In addition, this study mitigated the issue of uneven distribution of ESs to some extent through the application of EPRL; however, the overall number of ESs within the region remains relatively limited. In the future, the establishment of buffer zones could facilitate the development of smaller areas with favorable ecological conditions into ESs, thereby further addressing ecological gaps.
(4)
Five Cores. The ecological core area includes the Dongping Lake region, the Taishan region, the Culai Mountain region, the Heban Mountain region, and the Seashell Island coastal wetland area. These regions exhibit high levels of HQ and constitute key components of the EPRL. Among them, Dongping Lake, Mount Tai, and Culai Mountain form the ecological framework of Tai’an’s ESP, creating a spatial configuration known as “two mountains and one lake”. Due to the “mountain–urban integration” development model adopted in Tai’an, the southern region of Mount Tai has relatively high ecological resistance values and is under significant pressure from anthropogenic activities. Therefore, stringent ecological protection measures should be implemented to prevent uncontrolled development activities from encroaching upon the northern part of Mount Tai. Culai Mountain is primarily covered by forest and saves as an important ES and ecological security barrier. Therefore, the primary emphasis should be placed on ecological conservation. Heban Mountain is located at the confluence of the regions of Jinan, Binzhou, and Zibo, which is a crucial node for ecological connectivity among the three surrounding cities. However, it is surrounded by areas such as Zouping City, Zhoucun District, and Zhangqiu District, which exhibit high resistance values. This has led to a large number of ecological breakpoints and ecological obstacle points around Heban Mountain, impeding its connectivity with other ESs. Therefore, maintaining the ECs surrounding Heban Mountain is essential to prevent its isolation from the broader EN [64]. The Seashell Island coastal wetland area is a national natural reserve that serves as a critical stopover site for migratory birds, providing essential habitats for their overwintering, feeding, and breeding. As an important ES, it plays an important role in maintaining ecological health and stability of the coastline. Furthermore, being the estuary of both the Majia River and the Tuhai River, it significantly influences the ecological development and sustainability of these river systems. Therefore, enhancing the conservation and restoration of coastal wetlands is crucial to achieving the sustainable development of wetland ecosystems. Currently, the Seashell Island coastal wetland area has been incorporated into the Bohai Sea Yellow River Delta Nature Reserve Restoration and Upgrading Project.

4.3. Limitations

This study has certain limitations and warrants further investigation. First, while the study constructs an EN based on the large-scale Jinan metropolitan area, it does not adequately identify internal corridors within the Mount Tai region and Culai Mountain region. Additionally, the construction of ECs does not account for corridor width. In future research, it will be necessary to incorporate corridor width according to the biological activity characteristics of the study area and precisely delineate ECs at a smaller scale using high-resolution remote sensing images. Second, this study primarily constructs the ESP of the Jinan metropolitan area based on the current status of territorial space utilization. It focuses specifically on optimizing the EN of the Jinan metropolitan area in 2020 but does not include an analysis of long-term dynamics of the EN. Future studies should emphasize multi-year dynamic changes in the EN and predict its evolution under various development scenarios. Furthermore, this study does not sufficiently consider potential ecological risks, such as soil erosion and landslides in the southern mountainous area of Jinan. Future research should comprehensively evaluate these risks from multiple perspectives, considering both the threat to EN connectivity and the trade-offs between ecological benefits and economic costs associated with constructing new ECs.

5. Conclusions

This study integrated the MSPA, InVEST model, and circuit theory to construct an EN for the Jinan metropolitan area. Based on identified priority areas and EPRL, the EN was further optimized with respect to connectivity and spatial configuration, and the optimization outcomes were systematically evaluated. Finally, an ESP for the Jinan metropolitan area was established. The main findings are summarized as follows:
(1)
The initial EN of the study area comprises 40 ESs and 84 ECs. Four types of priority areas were identified, including 75 ecological pinch points, 11 ecological footstones, 39 ecological obstacle points, and 109 ecological breakpoints. There is a noticeable imbalance in the spatial distribution of ESs and ECs across the Jinan metropolitan area. The central-eastern part of the study area benefits from the presence of the Taiyi Mountain Range and the Yellow River, resulting in a more favorable ecological environment. This region is characterized by a high concentration of ESs and a denser EC network. In contrast, the northwestern plains are primarily dominated by cropland, which leads to relatively fewer and lower-quality ESs and ECs.
(2)
From the perspective of enhancing EN connectivity, this study employed priority areas to optimize the EN. The initially optimized EN comprised 50 ESs and 102 ECs. Considering the spatial distribution pattern of ESs, this study further optimized the EN by incorporating the EPRL into the analysis. Consequently, seven additional ESs and 22 additional ECs were identified. The newly added ESs and ECs were mainly located in the southeast region, as well as in the Liaocheng and Dezhou region in the northwestern part of the study area, alleviating the problem of uneven ES distribution. Ultimately, the final optimized EN comprises 57 ESs and 124 ECs.
(3)
The robustness of optimization of the EN has more obvious improvement. Under random and deliberate attacks, the average robustness values of the optimized EN increased from 0.435 to 0.459 and from 0.093 to 0.128, respectively. This indicates an improvement in the stability of the optimized EN. Finally, this study established an ESP of “One Belt, Two Axes, Two Zones, and Five Cores” for the Jinan metropolitan area and proposed corresponding recommendations.

Author Contributions

Conceptualization, X.L. and Y.J.; Methodology, X.L.; Software, Q.G., T.L., and R.Z.; Resources, Y.J.; Writing—Original Draft, X.L.; Writing—Review and Editing, F.Z. and Y.J.; Visualization, X.L., F.Z., Q.G., T.L., and R.Z.; Project Administration, Y.J.; Funding Acquisition, Y.J. All authors have read and agreed to the published version of the manuscript.

Funding

This research was financially supported by the National Natural Science Foundation of China (No. 32301658) and the Natural Science Foundation of Shandong Province, China (No. ZR2021QD124).

Institutional Review Board Statement

Not applicable.

Informed Consent Statement

Not applicable.

Data Availability Statement

The data supporting the findings of this study were obtained from publicly available datasets, and the websites providing access to these datasets are included in the article.

Conflicts of Interest

The authors declare no conflicts of interest.

References

  1. Zhao, Y.; Zhang, P.; Xu, H.; Liu, W. Assessment and Optimization of Ecological Networks in Trans-Provincial Metropolitan Areas—A Case Study of the Xuzhou Metropolitan Area. Land 2025, 14, 45. [Google Scholar] [CrossRef]
  2. Wang, Y.; Bin Mohamed Afla, M.R. Evaluation of Urban Ecological Benefits Utilizing Vegetated Areas Metrics in Nanjing, China. Geocarto Int. 2024, 39, 2395321. [Google Scholar] [CrossRef]
  3. Fletcher, R.J.; Didham, R.K.; Banks-Leite, C.; Barlow, J.; Ewers, R.M.; Rosindell, J.; Holt, R.D.; Gonzalez, A.; Pardini, R.; Damschen, E.I.; et al. Is Habitat Fragmentation Good for Biodiversity? Biol. Conserv. 2018, 226, 9–15. [Google Scholar] [CrossRef]
  4. Chase, J.M.; Blowes, S.A.; Knight, T.M.; Gerstner, K.; May, F. Ecosystem Decay Exacerbates Biodiversity Loss with Habitat Loss. Nature 2020, 584, 238–243. [Google Scholar] [CrossRef] [PubMed]
  5. Beita, C.M.; Murillo, L.F.S.; Alvarado, L.D.A. Ecological Corridors in Costa Rica: An Evaluation Applying Landscape Structure, Fragmentation-Connectivity Process, and Climate Adaptation. Conserv. Sci. Pract. 2021, 3, e475. [Google Scholar] [CrossRef]
  6. Shuai, N.; Hu, Y.; Chen, J.; Liu, X.; Bai, Y. Does Ecological Network Affect the Construction Land Spatial Development Intensity? —An Empirical Study Based on the Main Urban Area of Jinan, China. Ecol. Inform. 2024, 81, 102609. [Google Scholar] [CrossRef]
  7. Baggio, J.A.; Hillis, V. Managing Ecological Disturbances: Learning and the Structure of Social-Ecological Networks. Environ. Modell. Softw. 2018, 109, 32–40. [Google Scholar] [CrossRef]
  8. Forman, R.T.T. Some General Principles of Landscape and Regional Ecology. Landsc. Ecol. 1995, 10, 133–142. [Google Scholar] [CrossRef]
  9. Yu, K. Security Patterns and Surface Model in Landscape Ecological Planning. Landsc. Urban Plan. 1996, 36, 1–17. [Google Scholar] [CrossRef]
  10. Opdam, P.; Steingröver, E.; van Rooij, S. Ecological Networks: A Spatial Concept for Multi-Actor Planning of Sustainable Landscapes. Landsc. Urban Plan. 2006, 75, 322–332. [Google Scholar] [CrossRef]
  11. De Montis, A.; Ganciu, A.; Cabras, M.; Bardi, A.; Mulas, M. Comparative Ecological Network Analysis: An Application to Italy. Land Use Policy 2019, 81, 714–724. [Google Scholar] [CrossRef]
  12. Men, D.; Pan, J. Ecological Network Identification and Connectivity Robustness Evaluation in the Yellow River Basin under a Multi-Scenario Simulation. Ecol. Modell. 2023, 482, 110384. [Google Scholar] [CrossRef]
  13. Dai, L.; Liu, Y.; Luo, X. Integrating the MCR and DOI Models to Construct an Ecological Security Network for the Urban Agglomeration around Poyang Lake, China. Sci. Total Environ. 2021, 754, 141868. [Google Scholar] [CrossRef]
  14. Huang, Q.; Ma, Y. Ecological Network Construction in High-Density Water Network Areas Based on a Three-Dimensional Perspective: The Case of Foshan City. Sustainability 2024, 16, 7636. [Google Scholar] [CrossRef]
  15. Skokanová, H.; Netopil, P.; Havlíček, M.; Šarapatka, B. The Role of Traditional Agricultural Landscape Structures in Changes to Green Infrastructure Connectivity. Agric. Ecosyst. Environ. 2020, 302, 107071. [Google Scholar] [CrossRef]
  16. Zeng, W.; He, Z.; Bai, W.; He, L.; Chen, X.; Chen, J. Identification of Ecological Security Patterns of Alpine Wetland Grasslands Based on Landscape Ecological Risks: A Study in Zoigê County. Sci. Total Environ. 2024, 928, 172302. [Google Scholar] [CrossRef]
  17. Ma, J.; Yu, Q.; Wang, H.; Yang, L.; Wang, R.; Fang, M. Construction and Optimization of Wetland Landscape Ecological Network in Dongying City, China. Land 2022, 11, 1226. [Google Scholar] [CrossRef]
  18. Li, Y.; Wei, M.; Zhou, R.; Jin, H.; Chen, Y.; Hong, C.; Duan, W.; Li, Q. Identifying Priority Restoration Areas Based on Ecological Security Pattern: Implications for Ecological Restoration Planning. Ecol. Indic. 2025, 174, 113486. [Google Scholar] [CrossRef]
  19. Newton, A.C.; Hodder, K.H.; Cantarello, E.; Perrella, L.; Birch, J.C.; Robins, J.; Douglas, S.; Moody, C.; Cordingley, J.E. Cost–Benefit Analysis of Ecological Networks Assessed through Spatial Analysis of Ecosystem Services. J. Appl. Ecol. 2012, 49, 571–580. [Google Scholar] [CrossRef]
  20. Sun, W.; Yu, Q.; Xu, C.; Zhao, J.; Wang, Y.; Miao, Y. Construction and Optimization of Ecological Spatial Network in Typical Mining Cities of the Yellow River Basin: The Case Study of Shenmu City, Shaanxi. Ecol. Process 2024, 13, 60. [Google Scholar] [CrossRef]
  21. Adriaensen, F.; Chardon, J.P.; De Blust, G.; Swinnen, E.; Villalba, S.; Gulinck, H.; Matthysen, E. The Application of ‘Least-Cost’ Modelling as a Functional Landscape Model. Landsc. Urban Plan. 2003, 64, 233–247. [Google Scholar] [CrossRef]
  22. Peng, J.; Yang, Y.; Liu, Y.; Hu, Y.; Du, Y.; Meersmans, J.; Qiu, S. Linking Ecosystem Services and Circuit Theory to Identify Ecological Security Patterns. Sci. Total Environ. 2018, 644, 781–790. [Google Scholar] [CrossRef]
  23. McRae, B.H.; Dickson, B.G.; Keitt, T.H.; Shah, V.B. Using Circuit Theory to Model Connectivity in Ecology, Evolution, and Conservation. Ecology 2008, 89, 2712–2724. [Google Scholar] [CrossRef]
  24. Zhuge, M.; Hu, Y. Construction and Optimization of Ecological Network in Guanzhong Region of Shaanxi Province Based on PLUS-InVEST-Linkage Mapper. Land 2024, 13, 2037. [Google Scholar] [CrossRef]
  25. Chen, X.; Kang, B.; Li, M.; Du, Z.; Zhang, L.; Li, H. Identification of Priority Areas for Territorial Ecological Conservation and Restoration Based on Ecological Networks: A Case Study of Tianjin City, China. Ecol. Indic. 2023, 146, 109809. [Google Scholar] [CrossRef]
  26. Bombrun, M.; Dash, J.P.; Pont, D.; Watt, M.S.; Pearse, G.D.; Dungey, H.S. Forest-Scale Phenotyping: Productivity Characterisation Through Machine Learning. Front. Plant Sci. 2020, 11, 99. [Google Scholar] [CrossRef] [PubMed]
  27. Li, C.; Su, K.; Liang, X.; Jiang, X.; Wang, J.; You, Y.; Wang, L.; Chang, S.; Wei, C.; Zhang, Y.; et al. Identification of Priority Areas to Provide Insights for Ecological Protection Planning: A Case Study in Hechi, China. Ecol. Indic. 2023, 154, 110738. [Google Scholar] [CrossRef]
  28. Song, S.; Gong, Y.; Yu, Y. Integrating Pattern, Process, and Function in Urban Landscape Ecological Network Planning: A Case Study of Harbin Central City. Ecol. Indic. 2024, 159, 111671. [Google Scholar] [CrossRef]
  29. Wang, Z.; Zhao, X.; Cui, L.; Lei, Y.; Guo, Z.; Wang, J.; Li, J.; Zhai, X.; Rumiao, W.; Wei, L. Identification and Optimization of Urban Wetland Ecological Networks in Highly Urbanized Areas: A Case Study of Haidian District, Beijing. Ecol. Indic. 2025, 170, 113028. [Google Scholar] [CrossRef]
  30. Heintzman, L.J.; McIntyre, N.E. Assessment of Playa Wetland Network Connectivity for Amphibians of the South-Central Great Plains (USA) Using Graph-Theoretical, Least-Cost Path, and Landscape Resistance Modelling. Landsc. Ecol. 2021, 36, 1117–1135. [Google Scholar] [CrossRef]
  31. Kharrazi, A.; Akiyama, T.; Yu, Y.; Li, J. Evaluating the Evolution of the Heihe River Basin Using the Ecological Network Analysis: Efficiency, Resilience, and Implications for Water Resource Management Policy. Sci. Total Environ. 2016, 572, 688–696. [Google Scholar] [CrossRef]
  32. Men, D.; Pan, J. Incorporating Network Topology and Ecosystem Services into the Optimization of Ecological Network: A Case Study of the Yellow River Basin. Sci. Total Environ. 2024, 912, 169004. [Google Scholar] [CrossRef]
  33. Rosales, F.O.; Fath, B.; Llerena, G. Quantifying a Virtual Water Metabolic Network of the Metropolitan District of Quito, Ecuador Using Ecological Network Methods. J. Ind. Ecol. 2023, 27, 1304–1318. [Google Scholar] [CrossRef]
  34. Fan, J.; Wang, Q.; Ji, M.; Sun, Y.; Feng, Y.; Yang, F.; Zhang, Z. Ecological Network Construction and Gradient Zoning Optimization Strategy in Urban-Rural Fringe: A Case Study of Licheng District, Jinan City, China. Ecol. Indic. 2023, 150, 110251. [Google Scholar] [CrossRef]
  35. Liu, W.; Xu, H.; Zhang, X.; Jiang, W. Green Infrastructure Network Identification at a Regional Scale: The Case of Nanjing Metropolitan Area, China. Forests 2022, 13, 735. [Google Scholar] [CrossRef]
  36. Xu, L.; Zhang, Z.; Tan, G.; Zhou, J.; Wang, Y. Analysis on the Evolution and Resilience of Ecological Network Structure in Wuhan Metropolitan Area. Sustainability 2022, 14, 8580. [Google Scholar] [CrossRef]
  37. Huo, J.; Shi, Z.; Zhu, W.; Li, T.; Xue, H.; Chen, X.; Yan, Y.; Ma, R. Construction and Optimization of an Ecological Network in Zhengzhou Metropolitan Area, China. Int. J. Environ. Res. Public Health 2022, 19, 8066. [Google Scholar] [CrossRef]
  38. Zhao, Y.; Xia, J.; Xu, Z.; Zou, L.; Qiao, Y.; Li, P. Impact of Urban Expansion on Rain Island Effect in Jinan City, North China. Remote Sens. 2021, 13, 2989. [Google Scholar] [CrossRef]
  39. Meng, X.; Meng, F.; Zhao, Z.; Yin, C. Prediction of Urban Heat Island Effect over Jinan City Using the Markov-Cellular Au-tomata Model Combined with Urban Biophysical Descriptors. J. Indian. Soc. Remote Sens. 2021, 49, 997–1009. [Google Scholar] [CrossRef]
  40. Kong, F.; Yin, H.; Nakagoshi, N.; Zong, Y. Urban Green Space Network Development for Biodiversity Conservation: Identification Based on Graph Theory and Gravity Modeling. Landsc. Urban Plan. 2010, 95, 16–27. [Google Scholar] [CrossRef]
  41. Wang, C.; Wang, Q.; Liu, N.; Sun, Y.; Guo, H.; Song, X. The Impact of LUCC on the Spatial Pattern of Ecological Network during Urbanization: A Case Study of Jinan City. Ecol. Indic. 2023, 155, 111004. [Google Scholar] [CrossRef]
  42. Ostapowicz, K.; Vogt, P.; Riitters, K.H.; Kozak, J.; Estreguil, C. Impact of Scale on Morphological Spatial Pattern of Forest. Landsc. Ecol. 2008, 23, 1107–1117. [Google Scholar] [CrossRef]
  43. Kang, J.; Li, C.; Li, M.; Zhang, T.; Zhang, B. Identifying Priority Areas for Conservation in the Lower Yellow River Basin from an Ecological Network Perspective. Ecosyst. Health Sustain. 2022, 8, 2105751. [Google Scholar] [CrossRef]
  44. Shuai, N.; Hu, Y.; Gao, M.; Guo, Z.; Bai, Y. Construction and Optimization of Ecological Networks in Karst Regions Based on Multi-Scale Nesting: A Case Study in Guangxi Hechi, China. Ecol. Inform. 2023, 74, 101963. [Google Scholar] [CrossRef]
  45. Gao, J.; Jiang, Y.; Wang, H.; Zuo, L. Identification of Dominant Factors Affecting Soil Erosion and Water Yield within Ecological Red Line Areas. Remote Sens. 2020, 12, 399. [Google Scholar] [CrossRef]
  46. Ye, Y.; Chen, C.; Yu, C.; Sun, C.; Geng, S. Identifying Stepping-Stones within Small Wetlands in Highly Urbanized Areas and under Network Construction: A Case Study of the Guangdong–Hong Kong–Macao Greater Bay Area, China. Ecol. Indic. 2025, 176, 113622. [Google Scholar] [CrossRef]
  47. Modica, G.; Praticò, S.; Laudari, L.; Ledda, A.; Di Fazio, S.; De Montis, A. Implementation of Multispecies Ecological Networks at the Regional Scale: Analysis and Multi-Temporal Assessment. J. Environ. Manag. 2021, 289, 112494. [Google Scholar] [CrossRef] [PubMed]
  48. Vlková, K.; Zýka, V.; Papp, C.-R.; Romportl, D. An Ecological Network for Large Carnivores as a Key Tool for Protecting Landscape Connectivity in the Carpathians. J. Maps 2023, 20, 2290858. [Google Scholar] [CrossRef]
  49. Richard, T.T. Forman; Michel Godron Landscape Ecology. Environ. Conserv. 1989, 16, 90. [Google Scholar] [CrossRef]
  50. McRae, B.H. Isolation by Resistance. Evolution 2006, 60, 1551–1561. [Google Scholar] [CrossRef]
  51. Wang, F.; Gao, H.; Liu, J.; Fu, T.; Qi, F.; Gao, Y.; Zhao, L. Study on the Characteristics of Ecological Network and Critical Areas of Ecological Restoration in Hebei-Tianjin Coastal Wetlands. Wetlands 2024, 44, 24. [Google Scholar] [CrossRef]
  52. Zhang, F.; Jia, Y.; Liu, X.; Li, T.; Gao, Q. Application of MSPA-MCR Models to Construct Ecological Security Pattern in the Basin: A Case Study of Dawen River Basin. Ecol. Indic. 2024, 160, 111887. [Google Scholar] [CrossRef]
  53. Li, J.; Nie, W.; Zhang, M.; Wang, L.; Dong, H.; Xu, B. Assessment and Optimization of Urban Ecological Network Resilience Based on Disturbance Scenario Simulations: A Case Study of Nanjing City. J. Clean. Prod. 2024, 438, 140812. [Google Scholar] [CrossRef]
  54. Jiang, H.; Peng, J.; Liu, M.; Dong, J.; Ma, C. Integrating Patch Stability and Network Connectivity to Optimize Ecological Security Pattern. Landsc. Ecol. 2024, 39, 54. [Google Scholar] [CrossRef]
  55. Luo, J.; Fu, H. Constructing an Urban Cooling Network Based on PLUS Model: Implications for Future Urban Planning. Ecol. Indic. 2023, 154, 110887. [Google Scholar] [CrossRef]
  56. Bhatt, T.R.; Castley, J.G.; Sims-Castley, R.; Baral, H.S.; Chauvenet, A.L.M. Connecting Tiger (Panthera Tigris) Populations in Nepal: Identification of Corridors among Tiger-Bearing Protected Areas. Ecol. Evol. 2023, 13, e10140. [Google Scholar] [CrossRef]
  57. Fan, F.; Wen, X.; Feng, Z.; Gao, Y.; Li, W. Optimizing Urban Ecological Space Based on the Scenario of Ecological Security Patterns: The Case of Central Wuhan, China. Appl. Geogr. 2022, 138, 102619. [Google Scholar] [CrossRef]
  58. Huang, L.; Wang, J.; Fang, Y.; Zhai, T.; Cheng, H. An Integrated Approach towards Spatial Identification of Restored and Conserved Priority Areas of Ecological Network for Implementation Planning in Metropolitan Region. Sustain. Cities Soc. 2021, 69, 102865. [Google Scholar] [CrossRef]
  59. Ferrari, B.; Quatrini, V.; Barbati, A.; Corona, P.; Masini, E.; Russo, D. Conservation and Enhancement of the Green Infrastructure as a Nature-Based Solution for Rome’s Sustainable Development. Urban Ecosyst. 2019, 22, 865–878. [Google Scholar] [CrossRef]
  60. Bai, Y.; Jiang, B.; Wang, M.; Li, H.; Alatalo, J.M.; Huang, S. New Ecological Redline Policy (ERP) to Secure Ecosystem Services in China. Land Use Policy 2016, 55, 348–351. [Google Scholar] [CrossRef]
  61. Pashanejad, E.; Kharrazi, A.; Araujo-Gutierrez, Z.M.F.; Robinson, B.E.; Fath, B.D.; Parrott, L. A Functional Connectivity Approach for Exploring Interactions of Multiple Ecosystem Services in the Context of Agricultural Landscapes in the Canadian Prairies. Ecosyst. Serv. 2024, 68, 101639. [Google Scholar] [CrossRef]
  62. Wu, Z.; Cheng, S.; Xu, K.; Qian, Y. Ecological Network Resilience Evaluation and Ecological Strategic Space Identification Based on Complex Network Theory: A Case Study of Nanjing City. Ecol. Indic. 2024, 158, 111604. [Google Scholar] [CrossRef]
  63. Qi, S.-Z.; Zhang, X.-X. Urbanization Induced Environmental Hazards from Breakage Hills in the Karst Geological Region of Jinan City, China. Nat. Hazards 2011, 56, 571–574. [Google Scholar] [CrossRef]
  64. De León, L.F.; Sharpe, D.M.T.; Gotanda, K.M.; Raeymaekers, J.A.M.; Chaves, J.A.; Hendry, A.P.; Podos, J. Urbanization Erodes Niche Segregation in Darwin’s Finches. Evol. Appl. 2019, 12, 1329–1343. [Google Scholar] [CrossRef]
Figure 1. Location of the study area.
Sustainability 17 07342 g001
Figure 2. Technology framework.
Sustainability 17 07342 g002
Figure 3. ES extraction and analysis: (a) spatial distribution of MSPA; (b) spatial distribution of HQ; (c) spatial distribution of ESs; (d) spatial distribution of EPRL.
Sustainability 17 07342 g003
Figure 4. Comprehensive resistance surface construction: (a) LULC; (b) slope; (c) elevation; (d) NDVI; (e) Distance from road; (f) distance from river; (g) nighttime lighting; (h) GDP; (i) comprehensive resistance surface.
Sustainability 17 07342 g004
Figure 5. Spatial distribution of the initial EN.
Sustainability 17 07342 g005
Figure 6. Spatial distribution of priority areas: (a) priority protection areas (EPN: ecological pinch point, EFS: ecological footstone); (b) priority recovery areas (EBP: ecological breakpoint, EOP: ecological obstacle point).
Sustainability 17 07342 g006
Figure 7. Kernel density analysis: (a) screened priority protection areas (EPN: ecological pinch point, EFS: ecological footstone); (b) screened priority recovery areas (EOP: ecological obstacle point, EBP: ecological breakpoint).
Sustainability 17 07342 g007
Figure 8. Spatial distribution of EN after optimization.
Sustainability 17 07342 g008
Figure 9. EN optimization effect evaluation: (a) robustness results before optimization; (b) robustness results after optimization.
Sustainability 17 07342 g009
Figure 10. The ESP of “One Belt, Two Axes, Two Zones, and Five Cores” in the Jinan metropolitan area.
Sustainability 17 07342 g010
Table 1. Data sources and information.
Data TypeYearResolutionData Sources
LULC202030 m × 30 mResource and Environment Science Data Center of Chinese Academy of Sciences (RESDC) (http://www.resdc.cn (accessed on 12 February 2024))
Digital elevation model data (DEM)202030 m × 30 mRESDC (http://www.resdc.cn (accessed on 12 February 2024))
Slop202030 m × 30 mGenerated by DEM calculation
Gross domestic product (GDP)20201 km × 1 kmRESDC (http://www.resdc.cn (accessed on 8 April 2024))
Nighttime lighting20201 km × 1 kmNOAA National Centers for Environmental Information (http://www.ngdc.noaa.gov/ (accessed on 8 April 2024))
Road and River2020vector dataOpenStreetMap (https://www.openstreetmap.org (accessed on 14 April 2024))
Normalized difference vegetation index (NDVI)202030 m × 30 mNational Ecosystem Science Data Center (https://nesdc.org.cn (accessed on 15 April 2024))
EPRL2020vector dataShandong Provincial Department of Ecological Environment
(http://gcc.sdein.gov.cn/dtxx/201610/t20161020_711402.html (accessed on 15 June 2024))
Table 2. Threat factor parameters.
ThreatMaximum Threat Distance (km)WeightDecay Type
Cultivated land30.5Linear
Urban land 101Index
Rural residential50.7Index
Industrial land70.9Index
Unused land10.3Linear
Table 3. Habitat suitability and sensitivity to stress factors.
LULCHabitat SuitabilityThreat Factor
Cultivated LandUrban LandRural ResidentialIndustrial LandUnused Land
Cultivated land0.4010.50.60.2
Forestland10.810.70.80.4
Grassland0.80.60.80.60.70.6
Water0.90.70.90.70.80.3
Construction land000000
Unused land00.50.60.60.60
Table 4. Weight overlay for MSPA and HQ.
TypeWeight (%)ClassificationReclassification Weight
MSPA40Core4
Bridge3
Perforation1
Edge1
Islet2
Loop2
Branch1
HQ60High-HQ area (0.75–1)4
Medium-high-HQ area (0.50–0.75)3
Medium-low-HQ area (0.17–0.50)2
Low-HQ area (0–0.17)1
Table 5. Connectivity index at various distance thresholds.
Connectivity IndexConnection Distance Threshold (m)
10020050010001500200025003000
PC0.5590.5640.5790.5970.6030.6030.6050.606
IIC0.5620.5710.6000.6330.6430.6480.6510.655
Table 6. Ecological resistance factor index evaluation system.
FactorsWeightGradeResistance ValueFactorWeightGradeResistance Value
LULC0.33Forestland, Grassland1Distance from road (m)0.07>50001
Water102000–5000100
Cultivated land1001000–2000300
Unused land500500–1000500
Construction land10000–500800
NDVI0.23>0.871Distance from river (m)0.050–10001
0.79–0.871001000–3000100
0.68–0.793003000–5000200
0.54–0.685005000–10,000300
0–0.54800>10,000500
DEM (m)0.16≤861GDP (ten thousand yuan/km2)0.03341–35771
86–2121003577–9353100
212–3542009353–25,837300
354–53430025,837–109,221500
>534500>109,2211000
Slope (°)0.110–2.451Nighttime lighting (nW/cm2/sr)0.020–3.931
2.45–6.981000.393–13.14100
6.98–12.8320013.14–29.45300
12.83–20.1450029.45–101.25500
>20.141000>101.251000
Table 7. First-level ES data.
ES CodeArea (km2)dPCES CodeArea (km2)dPC
13088.1587.36926.951.21
277.049.041026.081.17
31074.348.0711163.580.98
421.987.721215.530.96
5158.667.061318.090.82
664.305.701416.610.67
7166.583.911523.090.57
8509.843.201612.420.50
Table 8. Number of patches identified under different kernel density search radius.
Search Radius (m)3000400050006000
Number of new ESs (Priority protection areas)1244
Number of new ESs (Priority recovery areas)0166
Total area (km2)8.4325.67104.81144.35
Table 9. Extracted EPRL information.
NumberNameEcological FunctionArea (km2)
50, 51Dezhou Hongtan Temple Forest Park windproof sand fixation, biodiversity maintenance EPRLWindbreak and sand fixation, biodiversity conservation13.83
52, 53Chiping Yellow River heritage soil conservation EPRLSoil conservation, water conservation, biodiversity conservation21.55
54West of Majia River in Shen County soil conservation EPRLSoil conservation, biodiversity conservation, water conservation,6.67
55Xintai southern hilly biodiversity conservation EPRLBiodiversity conservation, water conservation, soil conservation7.10
56North of Shahe River biodiversity conservation EPRLBiodiversity conservation, water conservation, soil conservation,5.23
Disclaimer/Publisher’s Note: The statements, opinions and data contained in all publications are solely those of the individual author(s) and contributor(s) and not of MDPI and/or the editor(s). MDPI and/or the editor(s) disclaim responsibility for any injury to people or property resulting from any ideas, methods, instructions or products referred to in the content.