1. Introduction
1.1. Sustainable Urban Development
Rising urbanization, with over half of the global population in cities, shifts the scientific and policy focus to urban life’s quality and its societal and environmental impact [
1]. Urban areas account for the majority of the global demand for ecosystem services by utilizing up to 60% of water resources for residential use and 76% of wood for industrial production as well as generating over 50% of waste and 60–80% of global greenhouse gas emissions [
2]. Conceptually, sustainable urban development is seen as a response to the negative effects of urban development, including economic, social, and environmental impacts.
In 2015, the UN adopted the 2030 Agenda for Sustainable Development. The Agenda defines 17 main goals, including Goal 11—Make cities and human settlements inclusive, safe, resilient, and sustainable. The specific tasks described in Goal 11 include the sustainable development of public transport and improving its accessibility, ensuring access to safe and affordable housing and basic services, ensuring access to green and public spaces, reducing the negative impact of cities on the environment, protecting the cultural and natural heritage of cities, building resilient cities, and increasing citizen participation [
3]. Consequently, tools are needed to monitor progress toward each of the goals at the local level of individual cities and districts.
According to Keith [
4], the importance of cities and urban areas was undervalued in discussions on sustainable development and climate change undertaken during global macroeconomic and political meetings in the last decade. The development of a dedicated urban SDG was a significant step toward a more urban view of sustainability issues, but since then, the focus on cities as sites of sustainable development action has eroded. A new narrative for sustainable urban development should focus on resilient, equitable social systems, integrating climate change, health, well-being, biodiversity protection, and disaster-resilient infrastructure rather than just economic development [
4]. The broad concept of urban resilience is reviewed by Meerow, Newell, and Stults [
5].
Changes in the urban environment over the last decades and the problems of modern cities, such as social segregation, deteriorating air and water quality, transportation issues, urban sprawl, waste management, and excessive energy use, prompted the emergence of new models and concepts of urban development. Most of these models (e.g., 15-min city, Eco-city, Compact City, Green City, MILU—Multi-Functional and Intensive Land Use, Smart growth, New Urbanism, Self-reliant City, Community Garden, Just City, and XXQ City) include principles of urban sustainability [
6]. Sustainable urban development has been the leading model of urban development [
7] as an application of sustainable development concepts that complement economic growth paradigms by adding environmental, social, and economic principles [
8,
9]. This idea was originally developed out of environmental concerns in cities but evolved into a more holistic approach, including the interplay of social, economic, political, and ecological forms bound in a spatial context with the aim of sustainable development [
10]. Urban sustainability can be defined as a balance between urban area development, environmental protection, and social considerations [
11]. In sustainable cities, people and businesses work to enhance their environments at the local and regional levels, supporting global sustainable development [
12].
Wheeler defines SUD by saying that “sustainable urban development seeks to create cities and towns that improve the long-term health of human and ecological systems of the planet” [
13]. The definition is system- and process-oriented—it is important to make global systems as strong and robust as possible in order to minimize the risks of unforeseen disasters. Cities and urban regions must develop closer and less destructive relations with the natural systems around them. Wheeler lists the basic indicators for monitoring the implementation of SUD as follows: non-renewable resource use, air and water pollution, GHG emissions, the percentage of developed land, automobile miles travelled, and equity gaps between rich and poor. Obviously, on a local level, more detailed and specifically related indicators are needed.
Some scholars use the term sustainable community development (SCD) as a “holistic approach that integrates social, environmental, and economic considerations into the dynamic processes of complex systems toward the achievement of community sustainability for the benefit of current and future generations” [
14]. Ostrom developed the Social-Ecological Systems (SESs) framework to allow for integrative and multidisciplinary analyses of the relationships between multiple levels of these complex systems at different spatial and temporal scales [
15]. Every SES is composed of multiple levels of nested systems with four core subsystems: resource systems, resource units, governance systems, and users. From this perspective, an urban socio-ecological system can be conceptualized as four spatially and temporally interconnected components: governance networks, material and energy flows, urban infrastructure and form, and socio-economic dynamics [
14]. The sustainable development of urban areas is the result of interdependencies and mutual interactions between these elements.
Despite the different urban issues in American and European cities, the concepts of urban development both in the USA and in Europe have similar key assumptions, i.e., cities and neighborhoods should be walkable, with good public transport accessibility, multifunctional, compact, and spatially accessible. The spatial aspects of urban sustainability are often embedded in environmental (built environment, transportation networks, public spaces, land use, and city structure) or socio-economic issues of sustainable urban policies (urban sprawl, location of functions) [
16,
17]. There are many good examples of implementing theoretical assumptions for spatial policy adopted by city authorities, for example, the Stockholm City Plan–Walkable City, the Sustainable City pLAn–Los Angeles city plan, the Greenest City Action Plan of Vancouver, or the Model City Münster in Germany.
1.2. The Concept of Sustainable Urban Location
The achievement of urban sustainability should result in more healthy, aesthetic, safe, economically viable, equal and inclusive, resilient, and unharmful to the natural environment cities. Although contemporary urban policies are based on the concept of sustainable development, their successful implementation to a large extent relies on the engagement of private developers, mainly pursuing their own business goals. Urban policies can only influence and regulate the decisions of the private sector to a limited degree, although these decisions have a huge impact on urban sustainability. There seems to be a particularly intensive relationship between urban sustainability and the sector of commercial buildings, as the latter influences not only the physical realm of the urban area but also the economic and social ones. The commercial built environment is strikingly present in modern cities, in the developed and developing world, as it often shapes them physically, with the agglomeration of business activities in ever-growing business districts; landmark office buildings became the feature of modern cities. But it is not just architectural visibility that makes commercial buildings so much in the focus of research and policy but also their impact on local communities, the local natural environment (carbon footprint, use of natural resources, building materials, waste, etc.), urban mobility, and the urban economy.
Although the form and type of buildings affect the development of cities in many ways, extensive research on the benefits of sustainable office buildings has not yet sufficiently covered their impact on urban sustainability, including transportation issues, access to amenities and functions, land use, natural environment, quality of life, and local economy. The office sector responded to its responsibilities toward the environment and communities by building sustainable or “green” buildings, of which negative impacts are minimized. However, these types of buildings, which have become the dominant style of offices in developed nations, continue to contribute to urban challenges. These include increased traffic, disorganized urban functions, and the formation of homogenous urban areas, all of which adversely affect urban sustainability, as well as cause environmental disturbances, such as obstructed air corridors and strain on natural habitats. Therefore, the examination of the real estate sector’s effects on urban sustainability needs to be broadened to an urban-wide perspective rather than being limited to individual buildings. The location of the buildings, with all the consequences regarding the natural environment, transportation capacity, and land use, greatly determines the impact of the building on the sustainable development of cities.
The term “sustainable urban location”, as used in the paper, has not yet been defined with reference to the location of commercial buildings and location choices in the office real estate market. In fact, there are a few studies on sustainable location, but it is a rather limited contribution to extensive research on the topic of “facility location”, focused on large-scale industrial facilities (plants, warehouses) or specialized public and private facilities [
18,
19].
Previous efforts to define sustainable residential locations emphasize mobility patterns and transportation costs as key impacts on the environment, economy, and quality of life [
20]. The sustainable urban location (of a warehouse, plant, or residential unit) is subject to planning based on several impacts of buildings on urban development [
21]. Research on the sustainable location of industrial facilities or housing exists, but studies on the social, economic, and environmental impacts of office locations on urban sustainability are limited or narrowly focused [
22].
To summarize, we can define sustainable urban location (SUL) as the one that meets the needs of all parties involved, (1) investors/developers, (2) users/employees, and (3) policymakers—sustainability goals, while contributing to the sustainable development of the city by reducing the consumption of resources and limiting the negative impacts on the natural environment. Based on this definition, in the further part of the work, we construct the sustainable location index (SLI) reflecting the accessibility of public transport, amenities, green areas, cycle infrastructure, and parking slots for a given site location.
1.3. A Common Perspective of Investors, Users, and Sustainable Development Goals
Real estate investors and developers significantly influence the formation of urban environments. Operating within the parameters of urban spatial policy, their endeavors do not inherently advance sustainability. The successful implementation of sustainable urban development objectives necessitates identifying mutual interests that align sustainable development with the pragmatic considerations of investors, developers, and the prospective occupants of office spaces.
From the perspective of sustainable urban development, the following are important [
23]:
Maintaining the multifunctionality of housing estates—diversity of functions.
Accessible public transport and promotion of sustainable mobility (for pedestrians and cyclists).
Maintaining a balance between green areas and buildings.
Social justice (social inclusion), which is spatially expressed in ensuring equal access to resources and services in the city.
Efficient use of space by promoting the redevelopment of degraded areas (brownfields).
There are many shared interests between the goals of sustainable urban development, investors looking for the most suitable locations, and office space users. Based on in-depth interviews [
24], the features preferred by investors were identified as follows:
Accessibility to public transport.
Local zoning plans.
Parking availability.
Access to urban amenities.
Access to a cycling network.
Quality of area and prestige.
The literature review [
25,
26] indicates characteristics such as (1) accessibility—transportation, infrastructure, services, and network; (2) proximity—central business district and concentration of business activities (employees, suppliers, and customers); (3) availability of amenities, facilities, and urban services; and (4) quality of area and prestige.
Office building users/employees indicate that the proximity of amenities [
27,
28], such as a grocery store, restaurants, parcel lockers, cafes, pharmacies, ATMs, a fitness gym, and cycling facilities, is important; see reports by Justjoin.it & JLL, Skanska & Colliers, and Walter Herz [
29,
30,
31]. In addition to the amenities listed above, the management staff also indicate access to parking spaces and public transport as important. In addition to access to amenities, IT employees emphasize the importance of access to bicycle infrastructure, time to get to work, and parking options, but also access to greenery and parks.
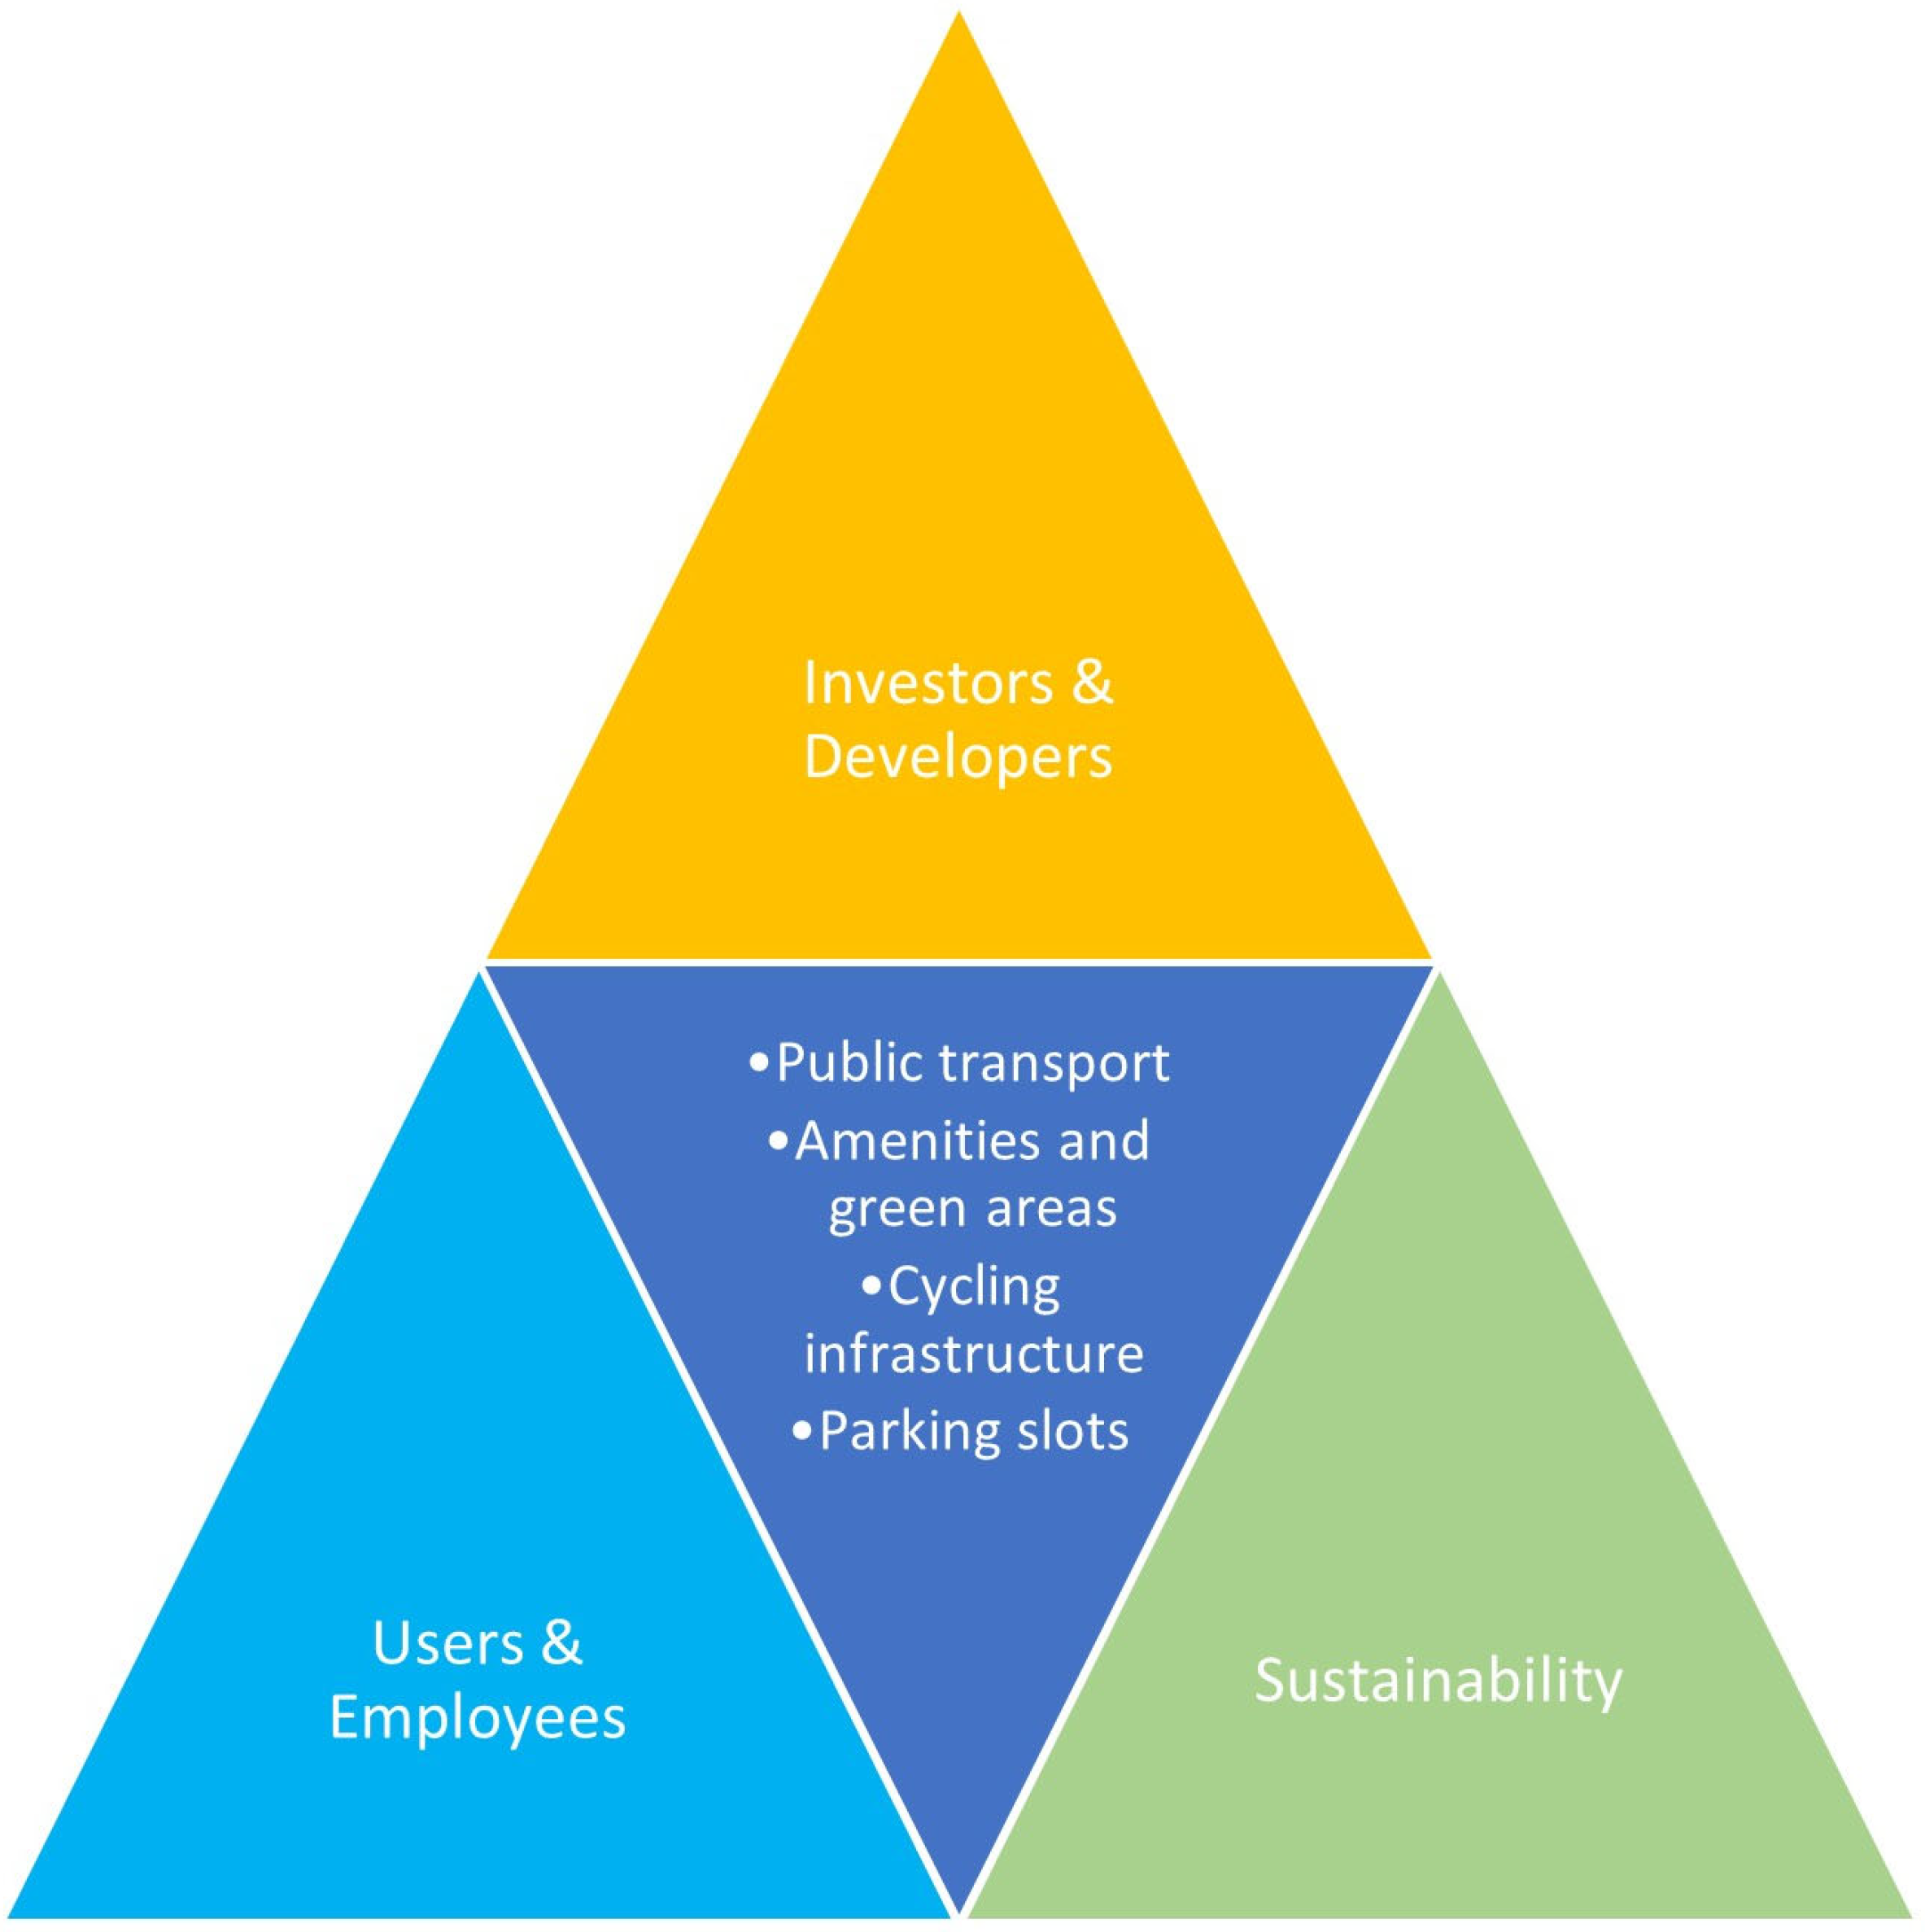
By analyzing office building location issues from three different perspectives, we can identify features of importance to investors/developers, tenants/users of office space, and urban planners. Key features of a sustainable office building location include the following: accessibility to public transport, accessibility to amenities and green areas, cycling infrastructure, and availability of parking spaces—see
Figure 1.
The impact of planning policy on the location of office buildings has not been investigated enough even though land-use policy and planning policy determine the availability of land for commercial–office, services, and retail use and regulate the supply of land that can be built up or redeveloped for office functions. In Poland, spatial planning is implemented through local spatial development plans (LDPs), which precisely define the permitted ways of land use for each site. However, LDPs are not mandatory for the whole administrative area of a city. At the beginning of 2026, all municipalities will be required to have a local spatial development plan covering the entire municipality within its administrative boundaries.
Krakow is the second largest city in Poland, with an area of 327 sq km, located in the southern part of Poland. It is inhabited by more than 800,000 people [
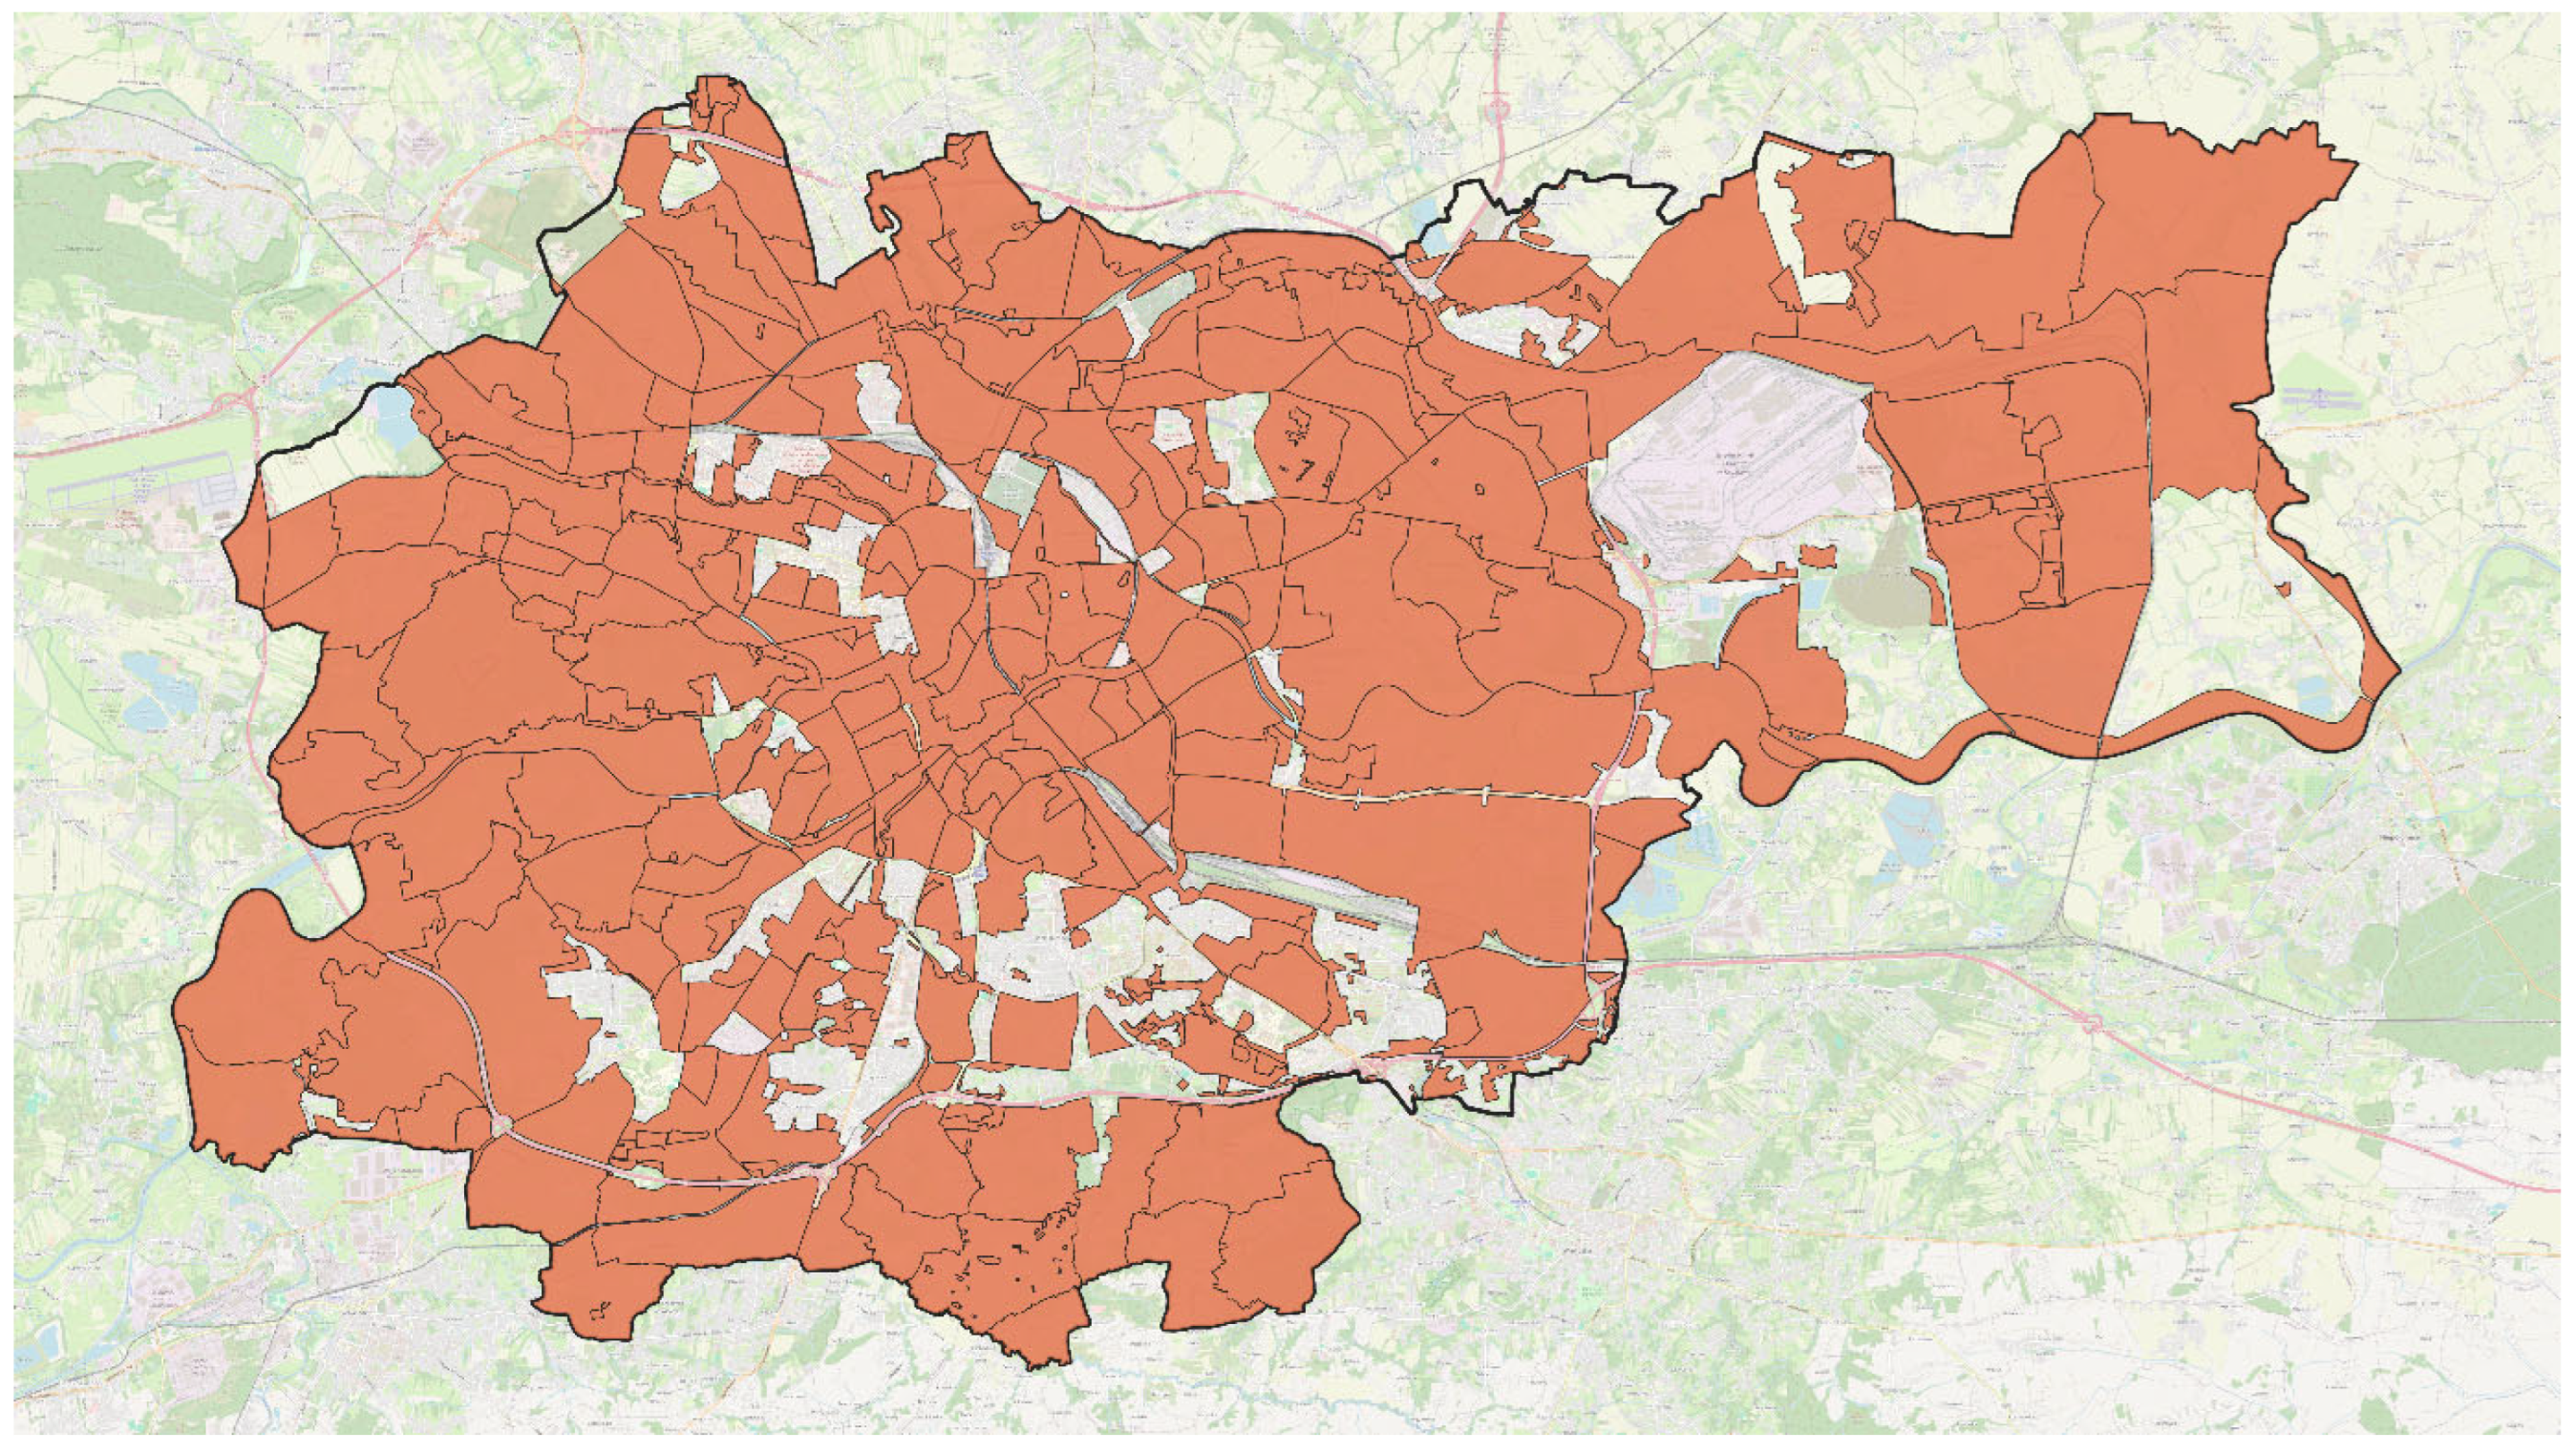
32]. Krakow is a special case when we consider the significance of planning policy for the real estate market. A total of 79.8% of the area of Krakow was covered by LSDPs by the end of 2024, as compared to 48.7% in 2016 and 10.7% in 2006 (
Figure 2). From an urban development perspective, the increased number of LSDPs is a radical improvement. Nevertheless, the planning policy in Krakow is too fragmented and lacks consistency (allowing construction within borders of land sites without parallel planning of the development of public transportation networks is a major hindrance for sustainable urban development). It is a dynamically growing city, affected by immense pressure from residential buildings’ developers, office construction, and other commercial projects. It is also a city of extreme historic value with its old center and surrounding historic districts, densely built up and strictly covered by the protection of monuments’ rules and strict limits on high-rise construction around the center (protection of monumental landscape) and a non-built zone for large-scale commercial projects. Thus, new construction, especially large-scale and commercial, is limited to the outskirts of downtown and more distant areas, with land for new commercial and residential projects stretching up to the suburbs. Accordingly, there is no typical Central Business District but rather multiple “office hubs” scattered around the city. It is a good example of a city with polycentric business locations, which are dispersed around the actual and historic center of a city but remain close to its transportation hubs.
2. Materials and Methods
The criteria of sustainable office location have been elaborated based on the BREEAM and LEED rating systems and adjusted to local urban conditions and availability of data for spatial research, as well as research focus. We analyzed the two multi-criteria certification systems applied for new office construction in Poland: the “LEED v4 for BUILDING DESIGN AND CONSTRUCTION” rating system (updated version from 27 January 2017) and “BREEAM International New Construction 2016. Technical Manual SD233 1.0” [
33,
34]. We focused only on certification criteria relevant for location assessment; that is, the categories were location and transportation (LT) and sustainable sites (SS) in the LEED rating system and 8.0 transport, 12.0 land use, and ecology in the BREAM assessment system. The categories and subcategories of the assessment served as a direction to elaborate the sustainable location indicators adjusted for local conditions (availability of data, urban form of Krakow, and specific features of urban transportation systems). Such an approach is also justified with the relative insignificance of location criteria in LEED and BREEAM systems in the overall assessment of green buildings; in both systems, the locational aspects of office projects are not among the required minimum for green scores.
For the purpose of spatial analysis, we choose four criteria of sustainable office locations:
Transportation accessibility.
Active and clean modes of transportation represented by biking network access.
Walkability index.
Planning criterion: office function permitted in zoning plans.
Transportation accessibility in certification systems is measured by the distance to tramway and bus stops (usually the maximum distance from the project boundaries to any stop is 500 m) and the number of tram lines at the stop; the required minimum of tram lines connecting the project with different directions is 3 (the number of lines also signifies the tram trip frequencies). The needs of office building users expressed in surveys indicate, in addition to the accessibility of public transport, the need for convenient use of parking spaces near the office building. The criterion of transport accessibility consists of the density of public transport stops (buses and trams) within 400 m (5 min walk) and the density of parking lots.
Active and clean modes of transportation are represented by biking network access. Most of the methods evaluating accessibility to biking infrastructure are based on the direct access from project boundaries to the public bicycle network, which should not be more than 200 m from the project boundaries (BREAM, LEED). The criterion of accessibility of ecological means of transport is based on the density of bicycle paths and bicycle parking. It was assumed that the location of a bicycle path and bicycle parking within a radius of 400 m is sufficient to count it as accessible.
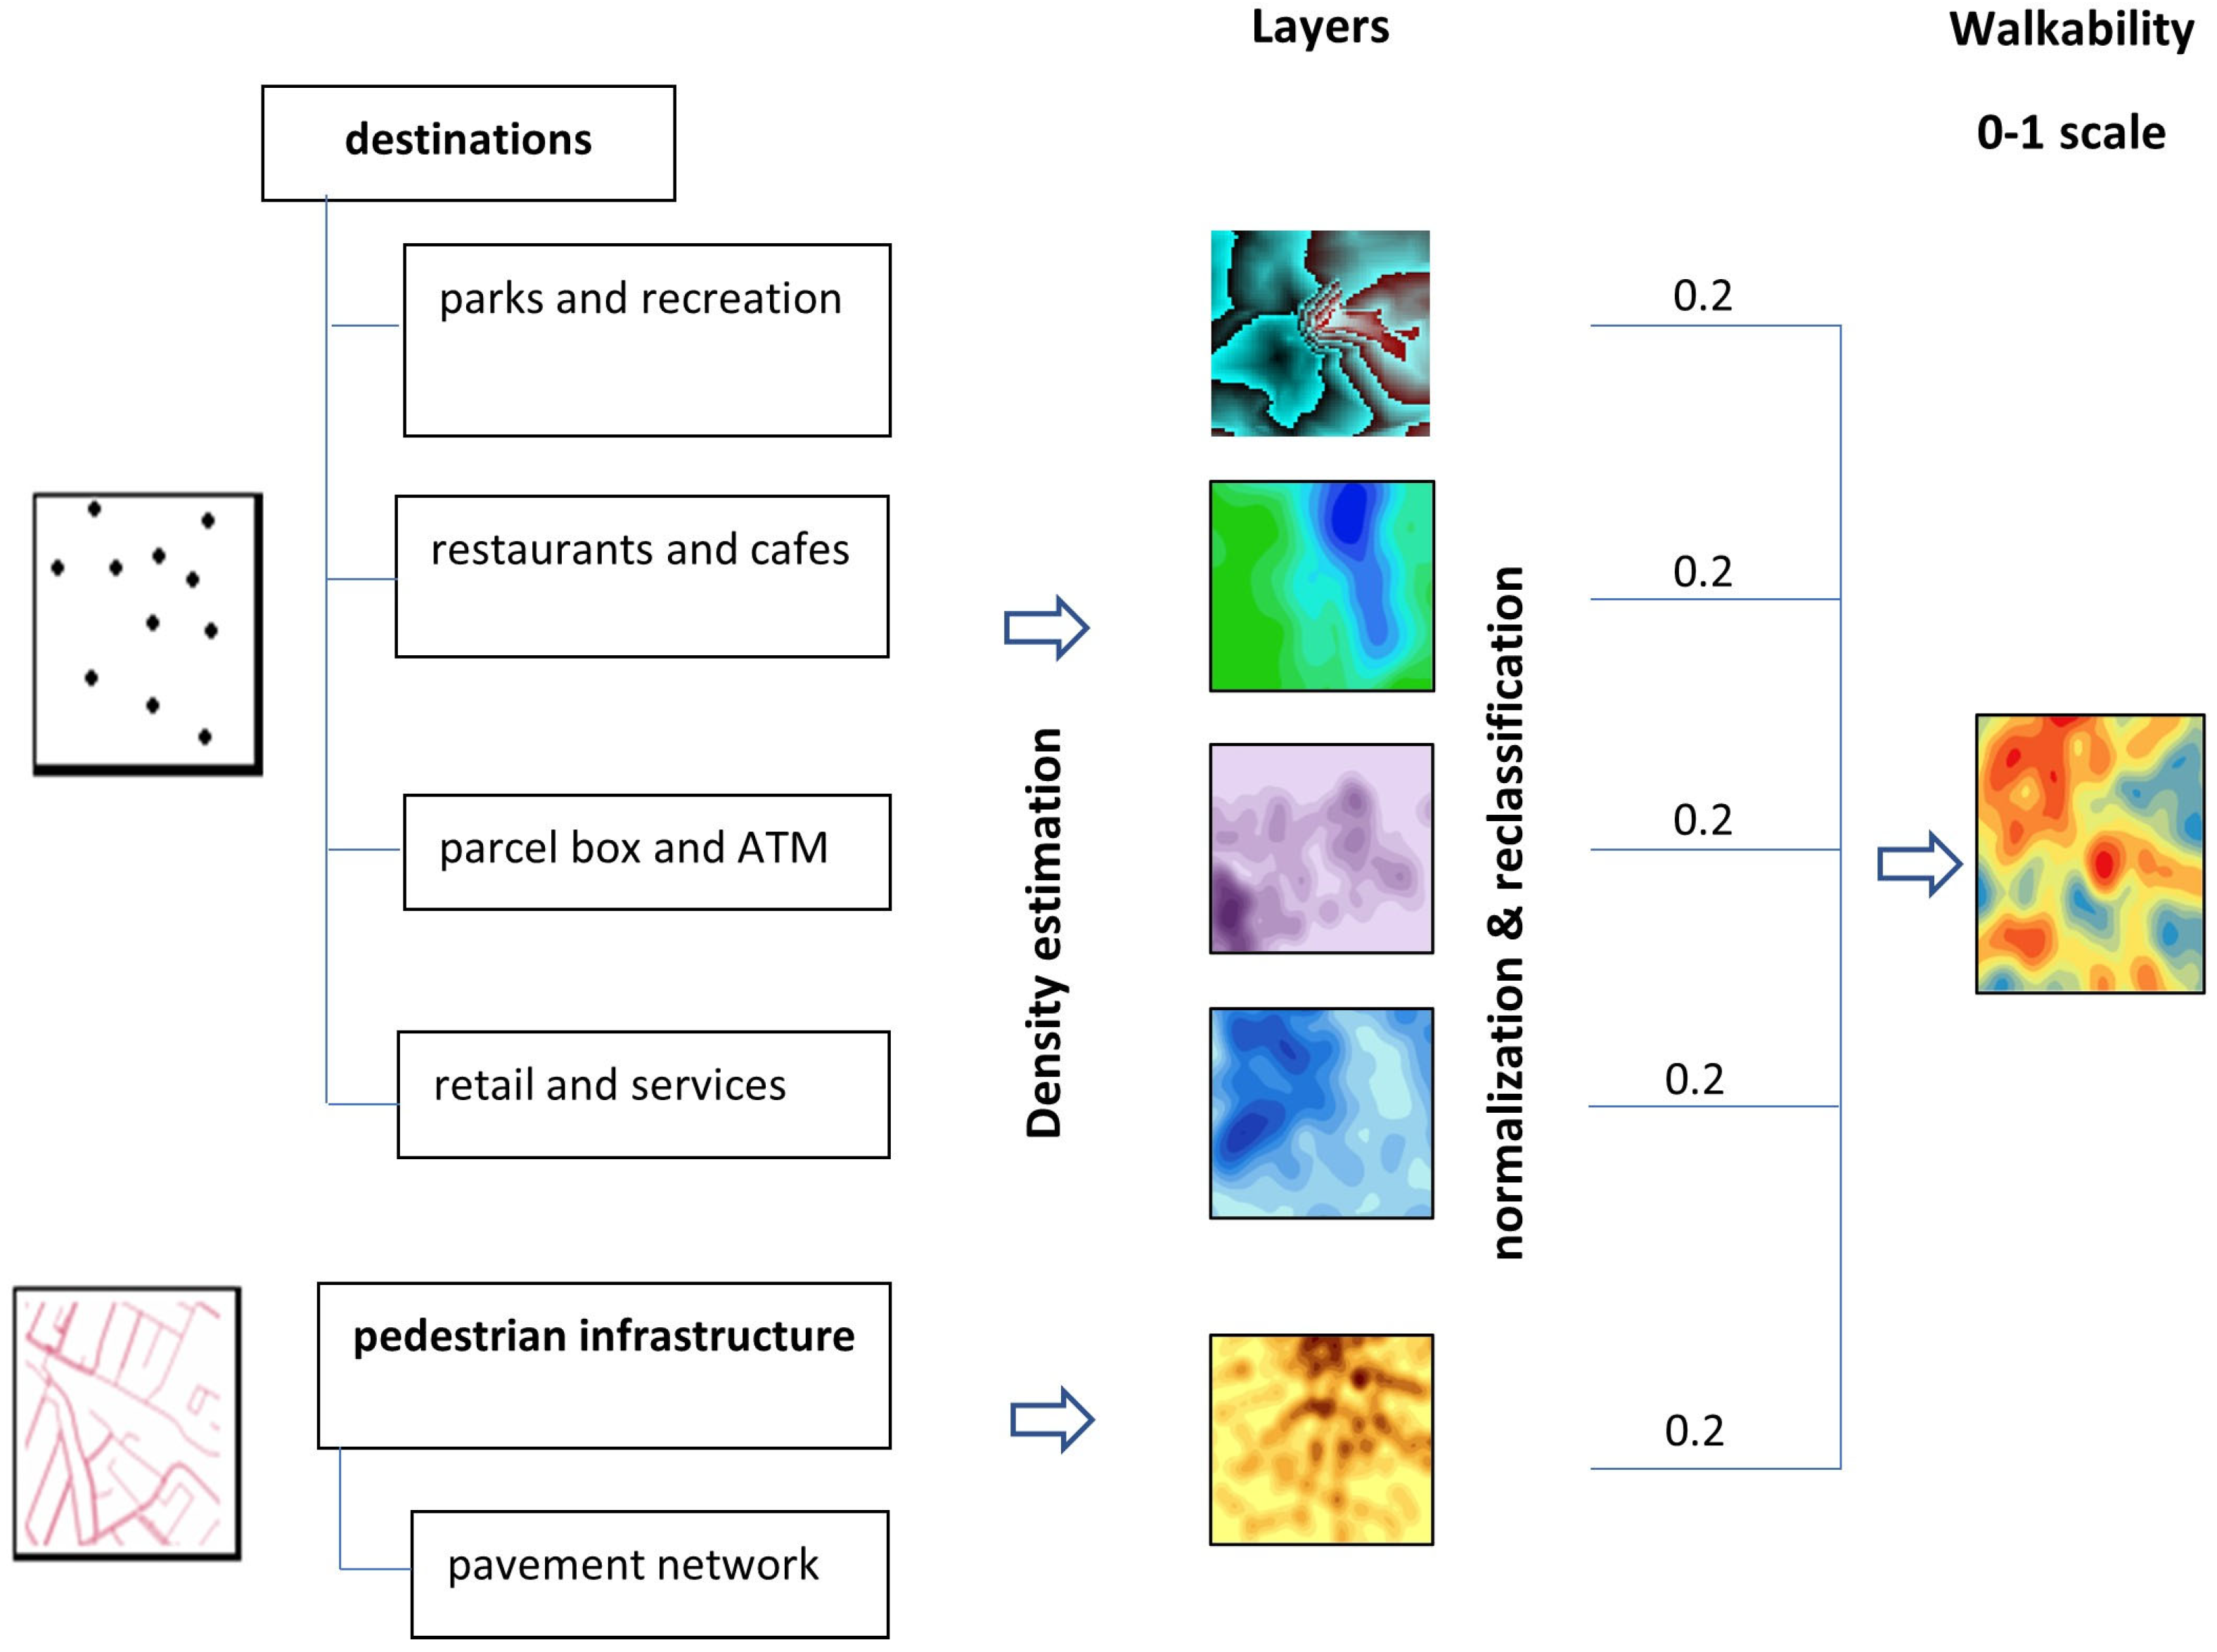
The walkability index, adopted for the analysis, is a modified version of the method proposed by Telega A., Telega I., and Bieda A., without taking public transport into account, as the parameter of accessibility to public transport was previously derived [
35]. This index is mainly driven by the needs of users and investors, who point to the location of an office building in an environment rich in a variety of amenities, such as green areas, cafés, restaurants, ATMs, and pharmacies, but also parcel boxes or fitness facilities. Access to pedestrian infrastructure is also no less important, which is why the walkability index includes a linear density for the pavement network (
Figure 3).
The selection of the optimal sustainable location for an office building is accomplished by determining the location density of the various elements: public transport, cycle paths, parking, and amenities. The density was estimated using the kernel density function for each of the elements studied.
Planning criterion—office function permitted. The last factor is the compliance of a given location with the provisions of the local spatial development plan (LSDP). LSDPs are the main tool of the city’s spatial policy, which determines how land is developed. The specificity of Krakow is that office buildings are scattered in terms of location, and there is no single central business district (CBD). At the same time, some of the plans that have been created in recent years have a protective function, not a pro-investment one. In accordance with the principles of spatial planning, office buildings should be built in areas for which (according to the plan) the basic or supplementary function is services.
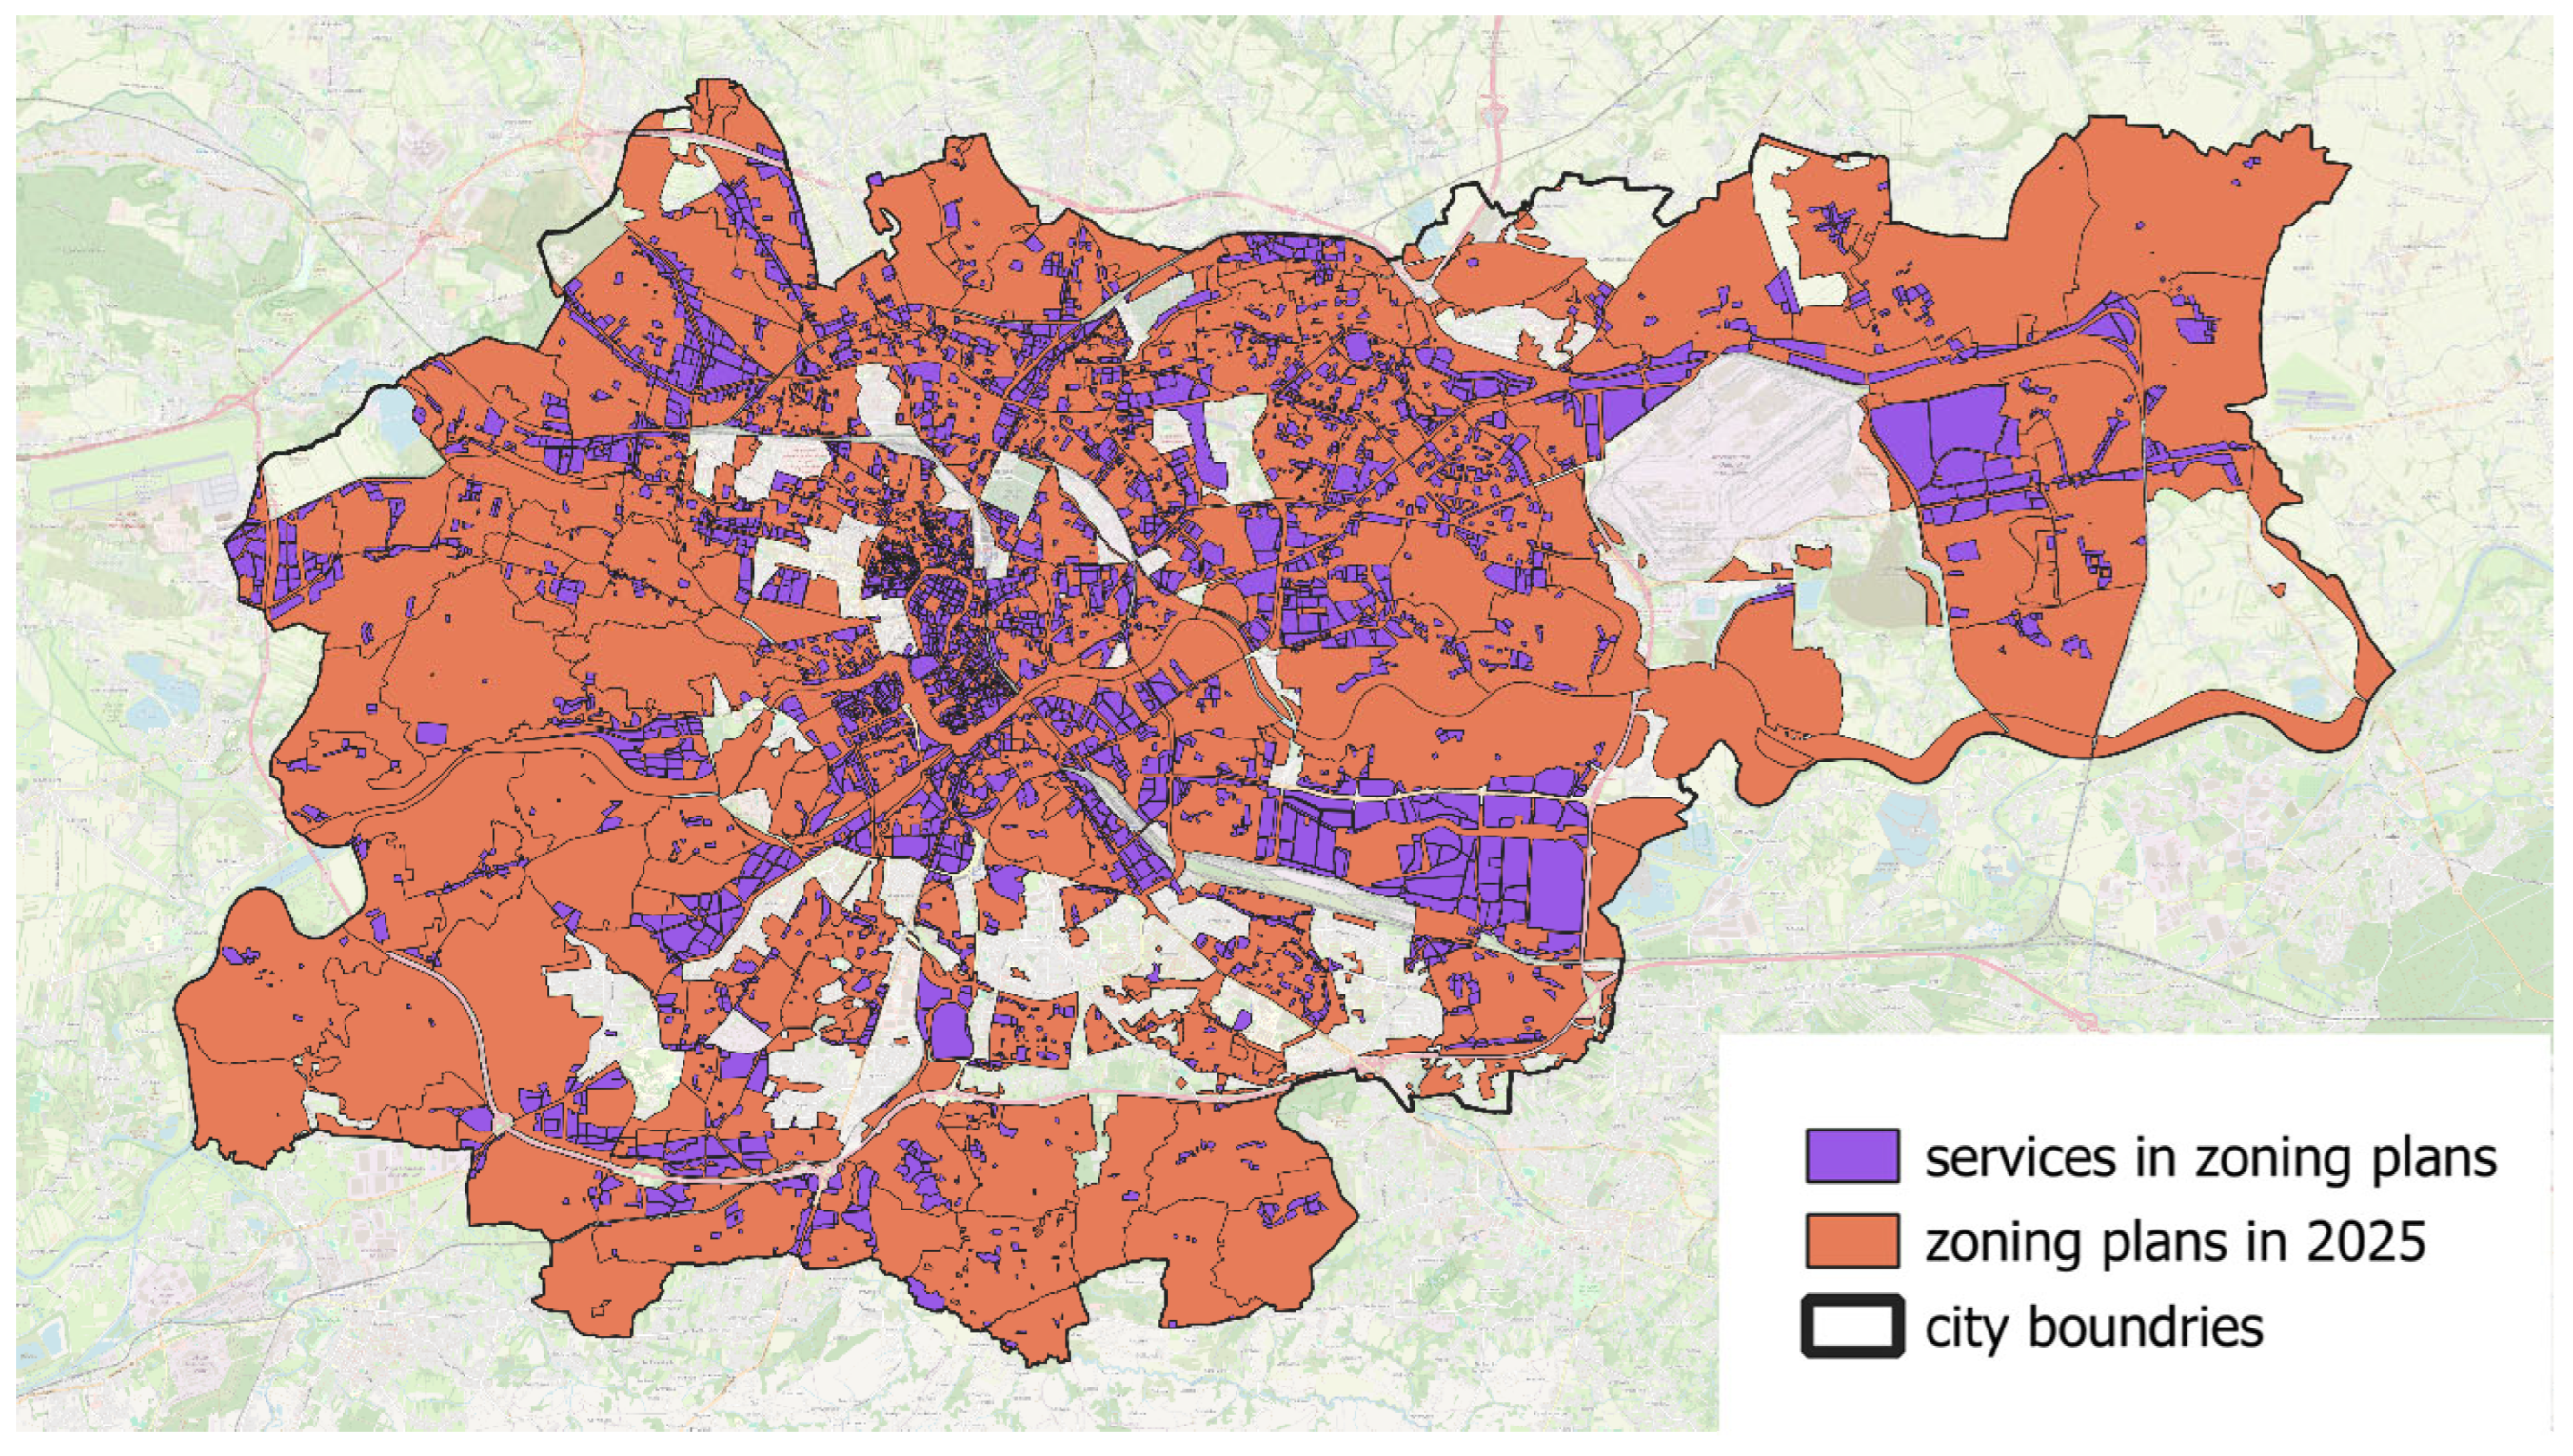
A total of 274 zoning plans were analyzed (
Figure 4), of which 64.4% permit the development of services, including office-related functions. From this set, we selected only those areas where the service function is designated as either a primary or complementary land use (4504 units). Due to the nature of this factor (1 or0), it was not taken into account when calculating the aggregated index. Additionally, some office buildings were built in areas not covered by the plan (based on an individually issued decision) or before the plan was adopted. Instead, we calculated the average value of the aggregated sustainable location index for the 4504 selected units in order to check to what extent the planning provisions are consistent with the actual conditions (in terms of the adopted assumptions).
The planning criterion is crucial from the developers’ perspective. SLI could easily be extended to include a planning factor by simply multiplying index values by 1 or 0 accordingly.
In recent years, GIS has been increasingly used in real estate research such as appraisals [
36,
37], determinants of real estate prices [
38], or analysis of the real estate market [
39]. GIS allows for the collection and elaboration of data and the performance of advanced spatial analysis. There are many studies dealing with site selection taking into account both spatial and non-spatial criteria [
40,
41], but the use of GIS in office real estate research is still new.
To meet the criteria and reveal potential sustainable locations, a spatial database has been developed containing information about the location and attributes of tram stops, bicycle networks, land use, zoning plans, and urban units. Data were obtained from OpenStreetMap and the Bureau of Spatial Planning and spatially integrated within a GIS.
Each type of object has been described in a separate data layer (see
Table 1). Discrete data (points and lines representing the selected locations of amenities and bike paths or sidewalks, respectively) were stored in vector layers. The densities were then calculated for each criterion, and the layers with calculated densities of individual factors were normalized. Then, the raster values were summed, assuming equal weights for all layers. Finally, the rasters were reclassified to a scale from 0 to 1 (continuous values), in which each pixel had a specific sustainable location index value (SLI). The pixel resolution was 10 × 10 m. All analyses were performed in QGIS.
The average SLI values were calculated for individual districts and for units of local plans in which service functions are permitted. The value was also estimated for all office buildings in the city, both those with an ecological certificate and those without.
3. Results and Discussion
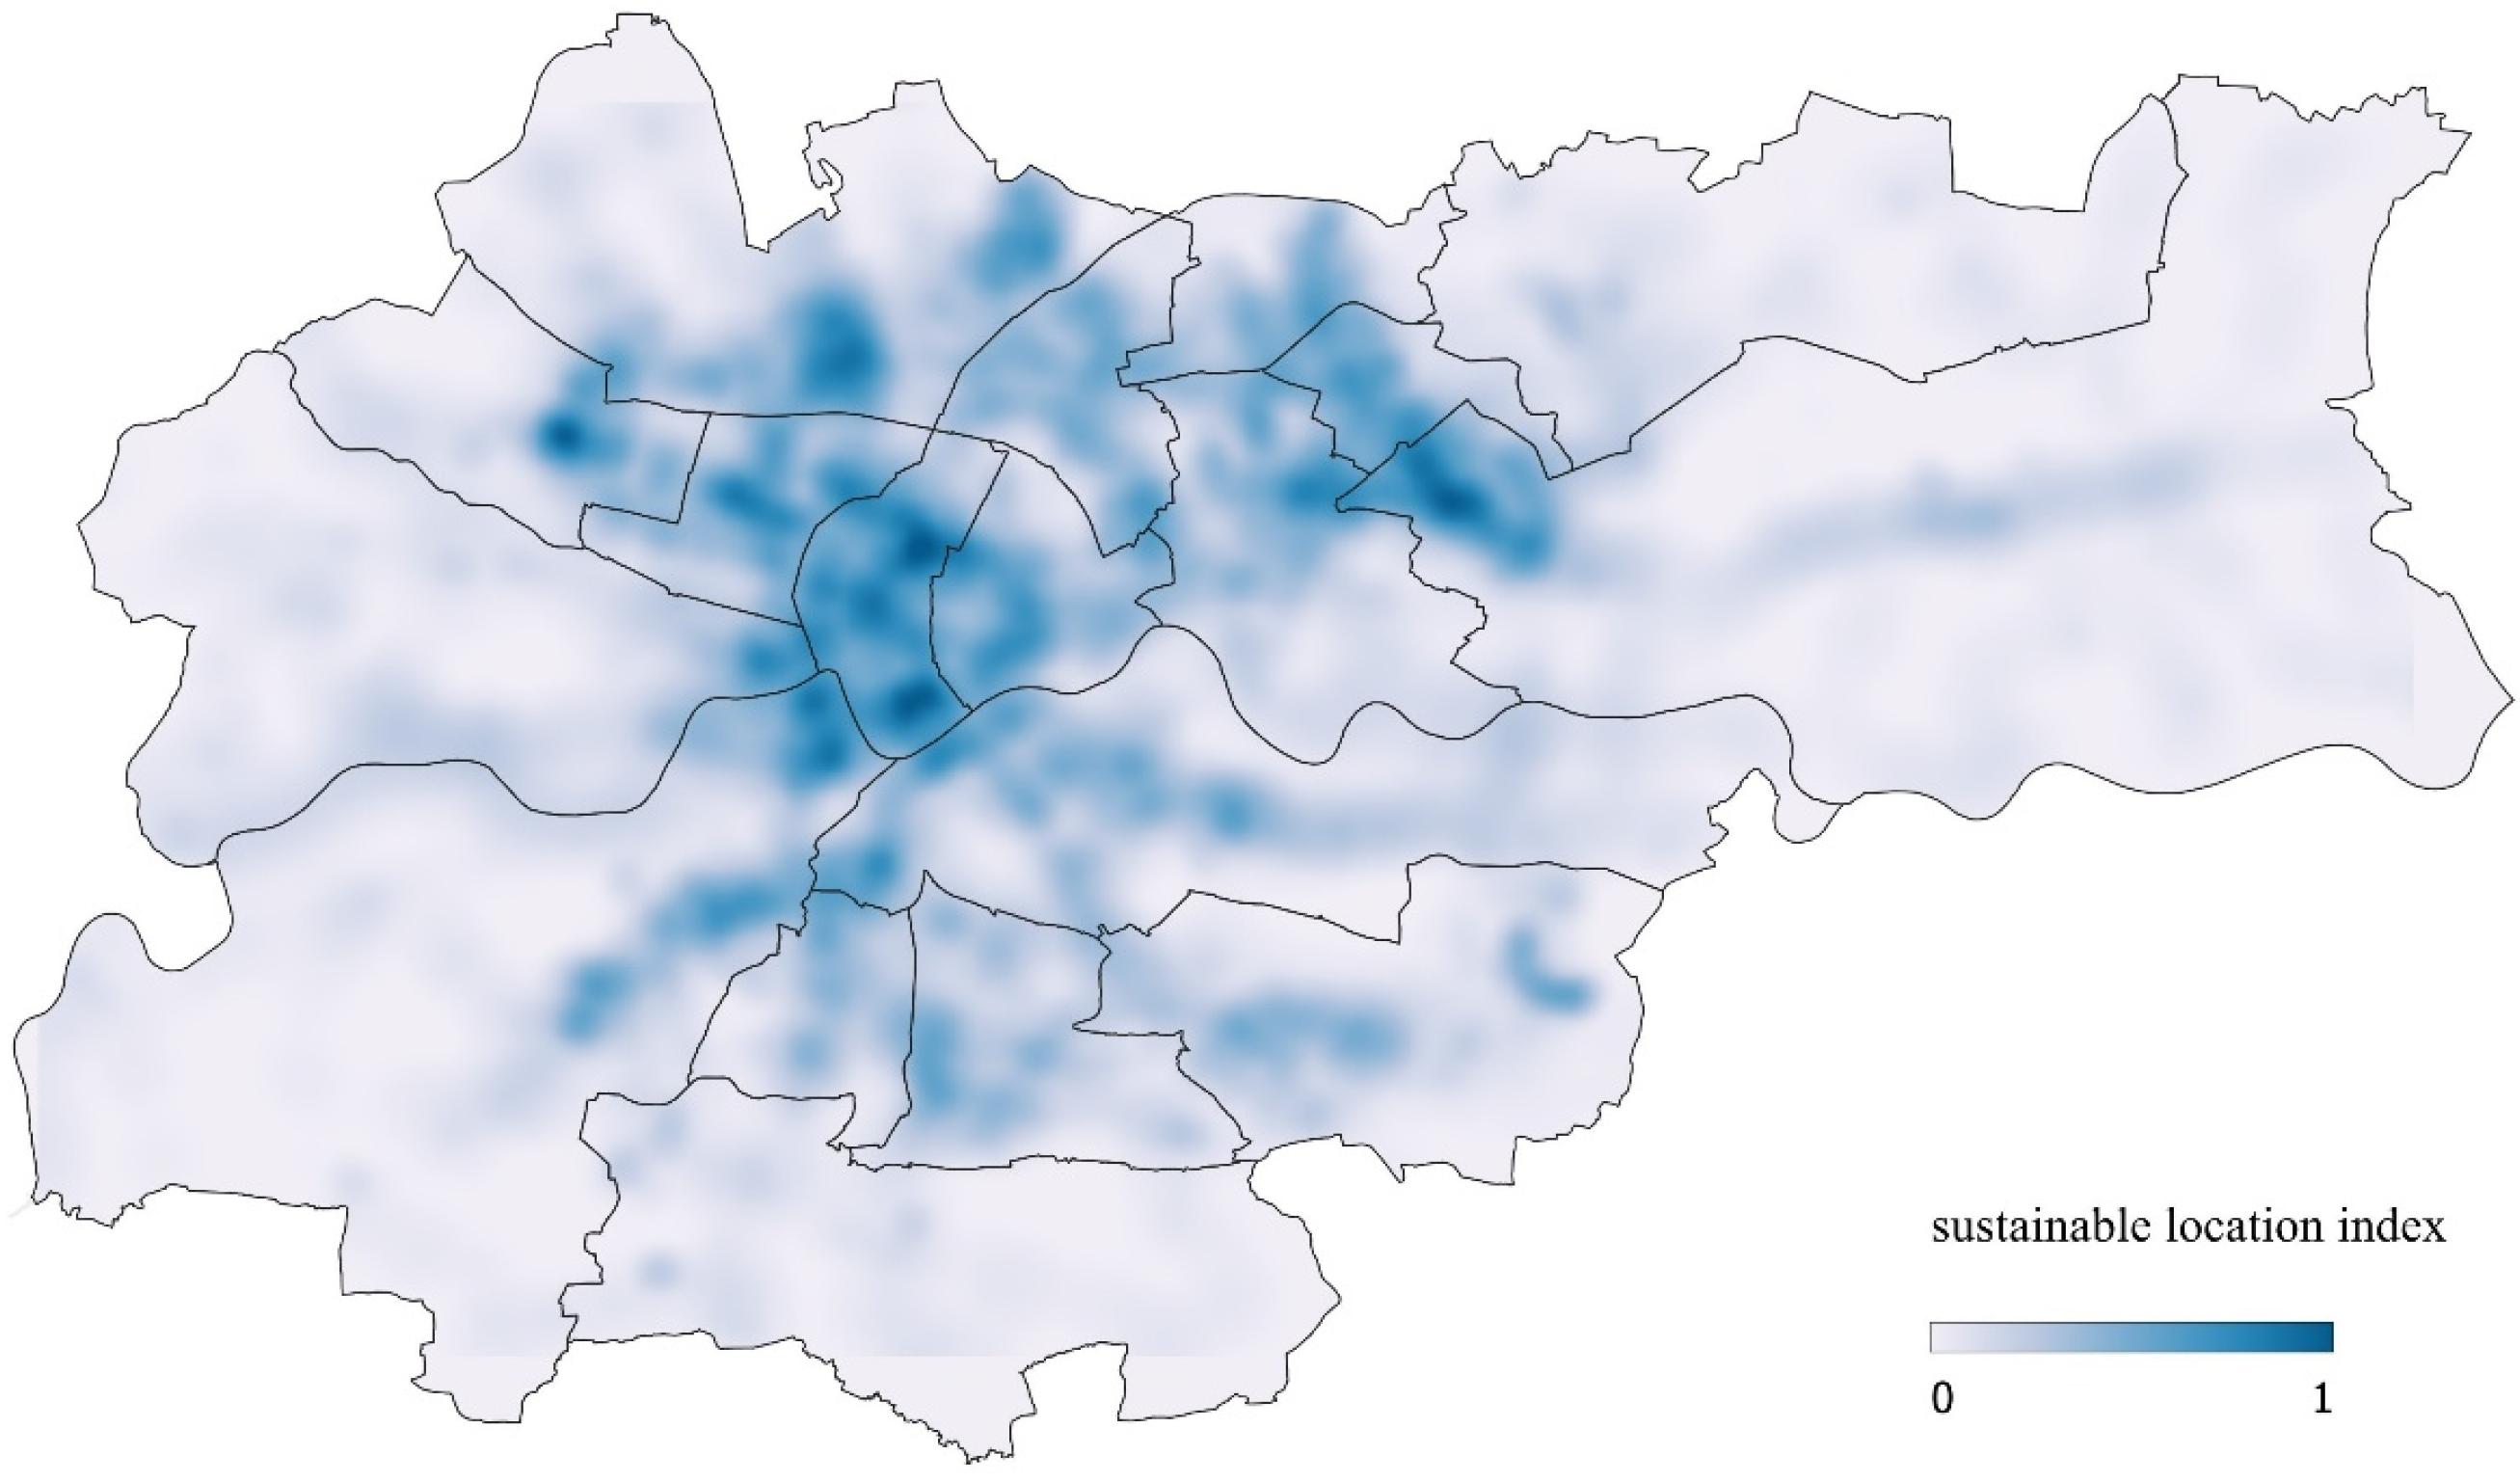
The spatial distribution of sustainable location index (SLI) values for the Krakow area is shown in
Figure 5.
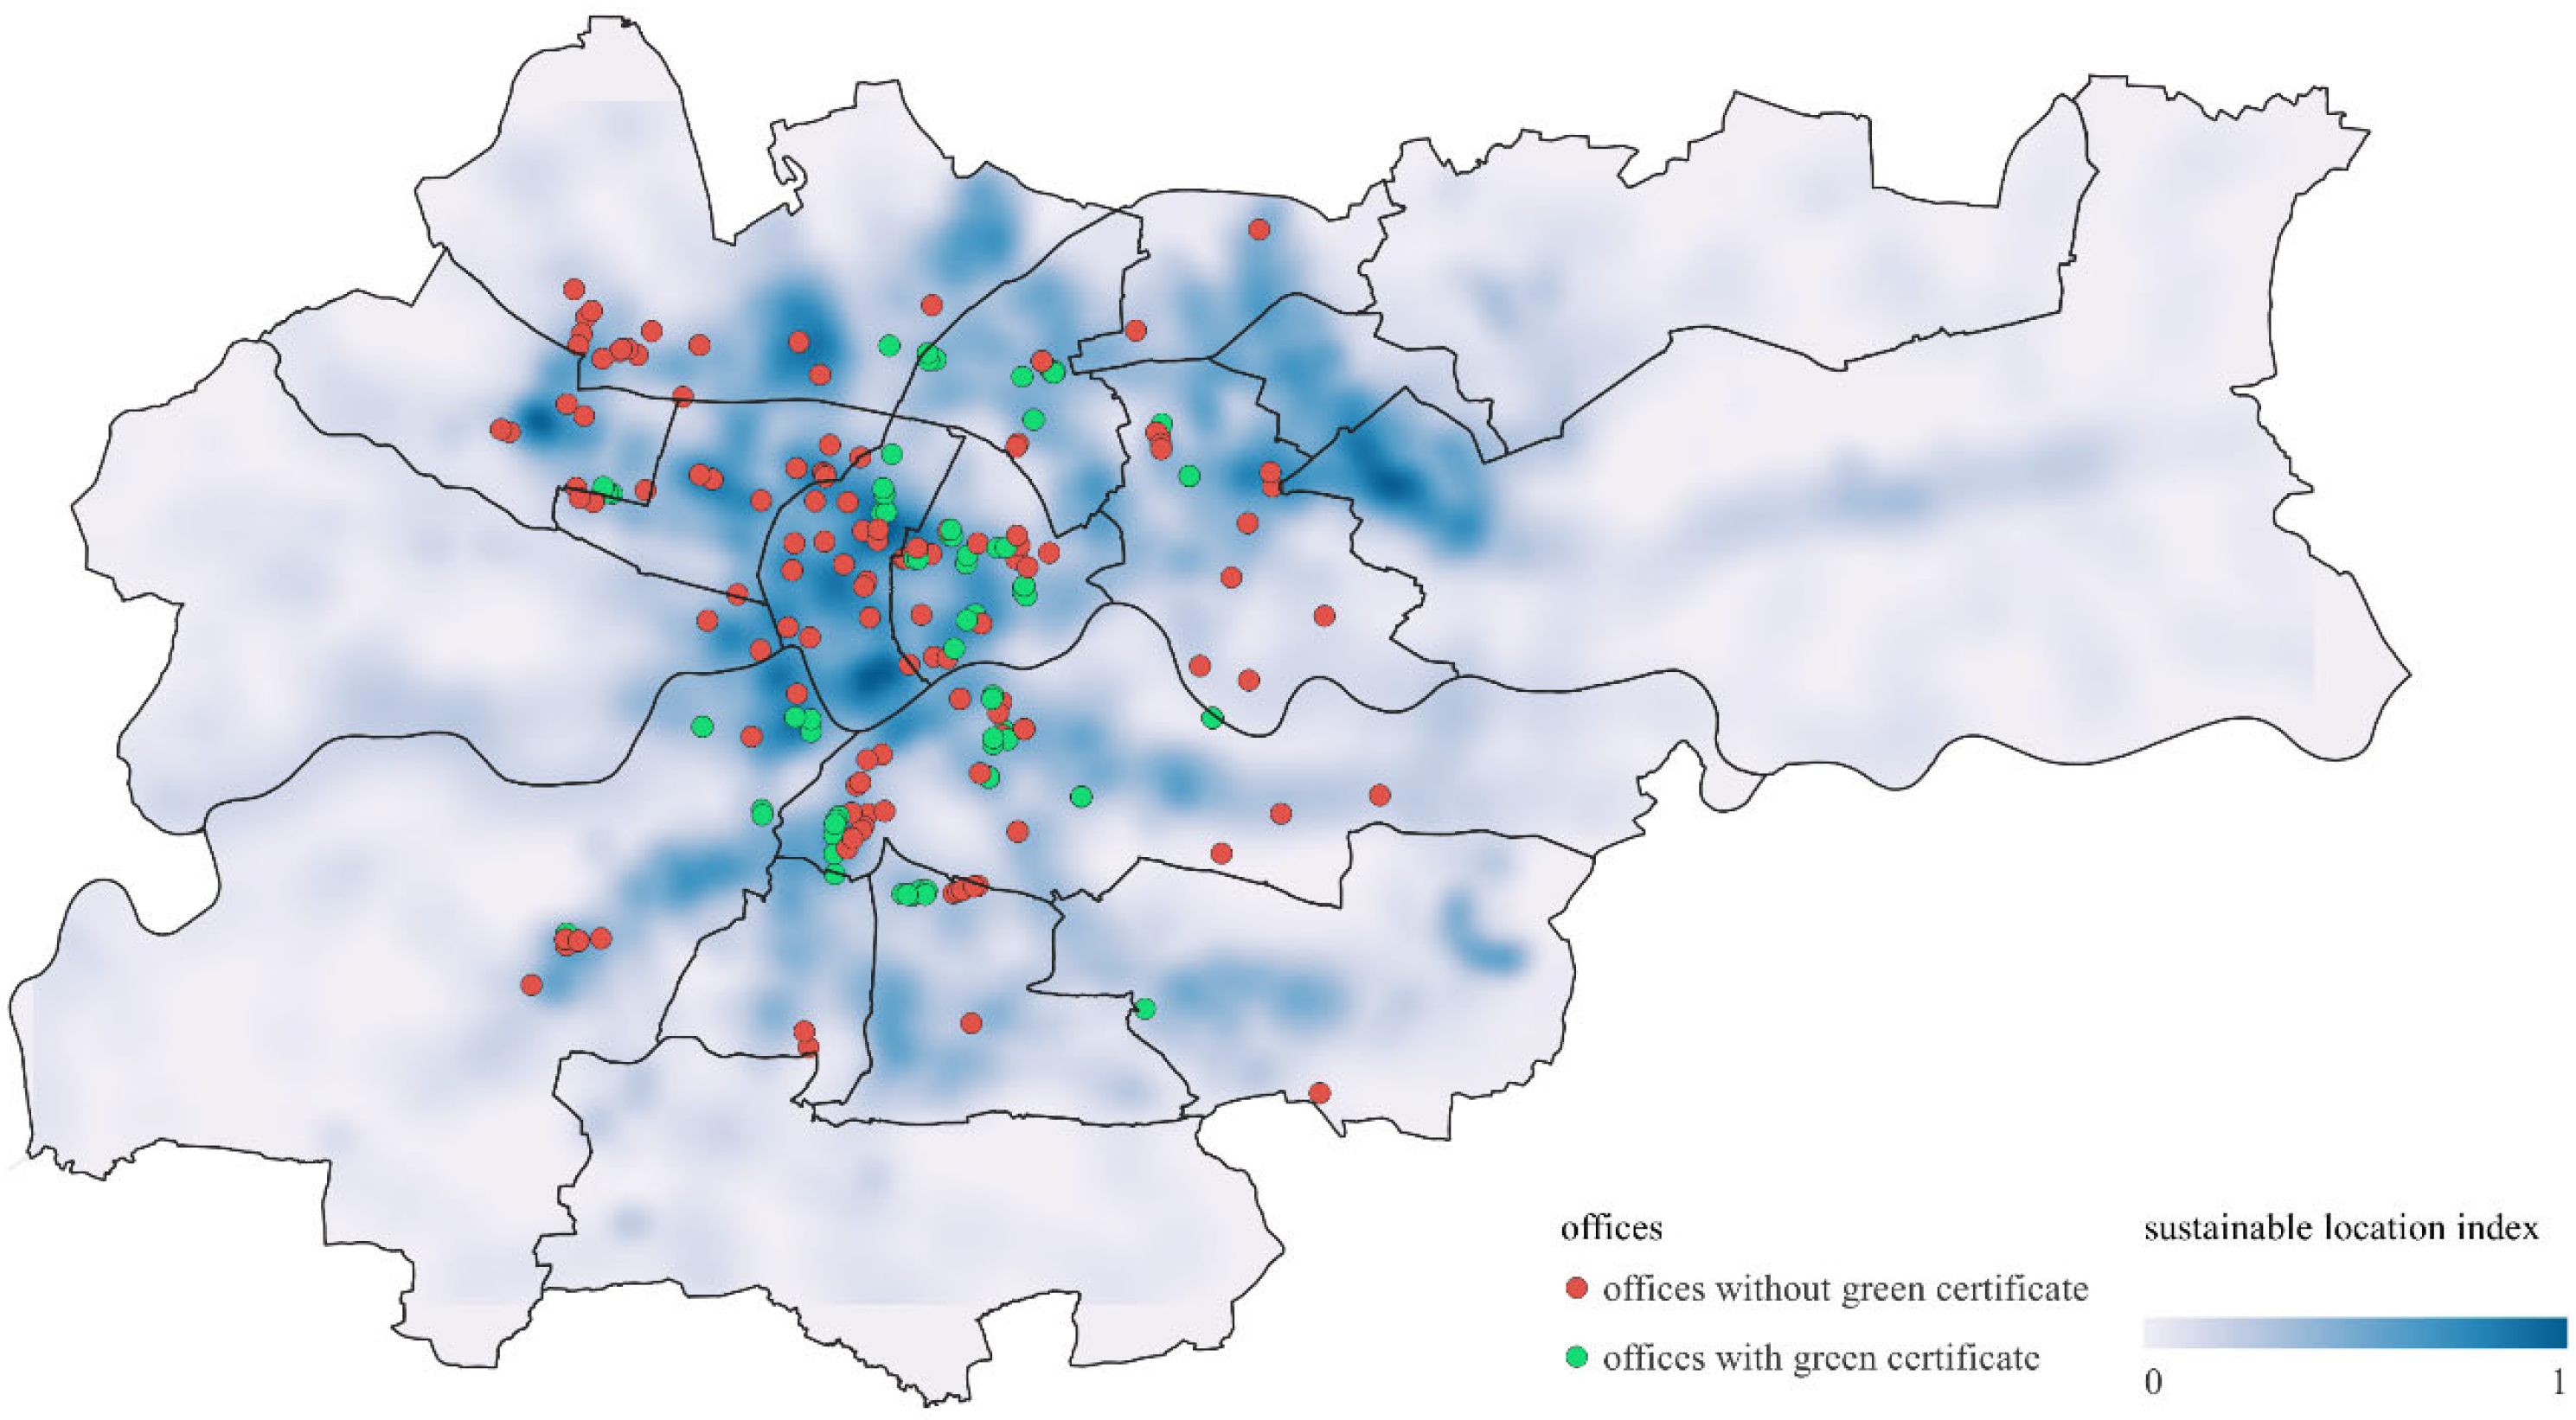
The study includes 235 office buildings that have been built in Krakow in recent years—see
Figure 6. The division of office buildings according to SLI is presented in
Table 2. Note that only about one quarter of all office buildings are located in a good (21.3%) or very good (5.1%) location in terms of SLI. Most office buildings (94 or 40%) are characterized by an SLI value in the range [0, 0.4), which can be considered a low or very low result. The mean SLI value for all office buildings is 0.476, while the median is 0.467.
Among 89 buildings with BREAM or LEED certificates (marked in green in
Figure 6), only 19 (21.4%) had locations with high (15, 16.9%) or very high (4, 4.5%) values of SLI. The locations of the majority of BREAM or LEED office buildings (40%) are characterized by an SLI value in the range of [0, 0.4). The mean SLI value for that group of office buildings is 0.478, while the median is 0.46, so it is quite comparable in terms of location characteristics to all office buildings. Obviously, the location characteristics are not the only criteria taken into account in the certification process. Nevertheless, this raises a question if the certification could be improved in terms of the location assessment.
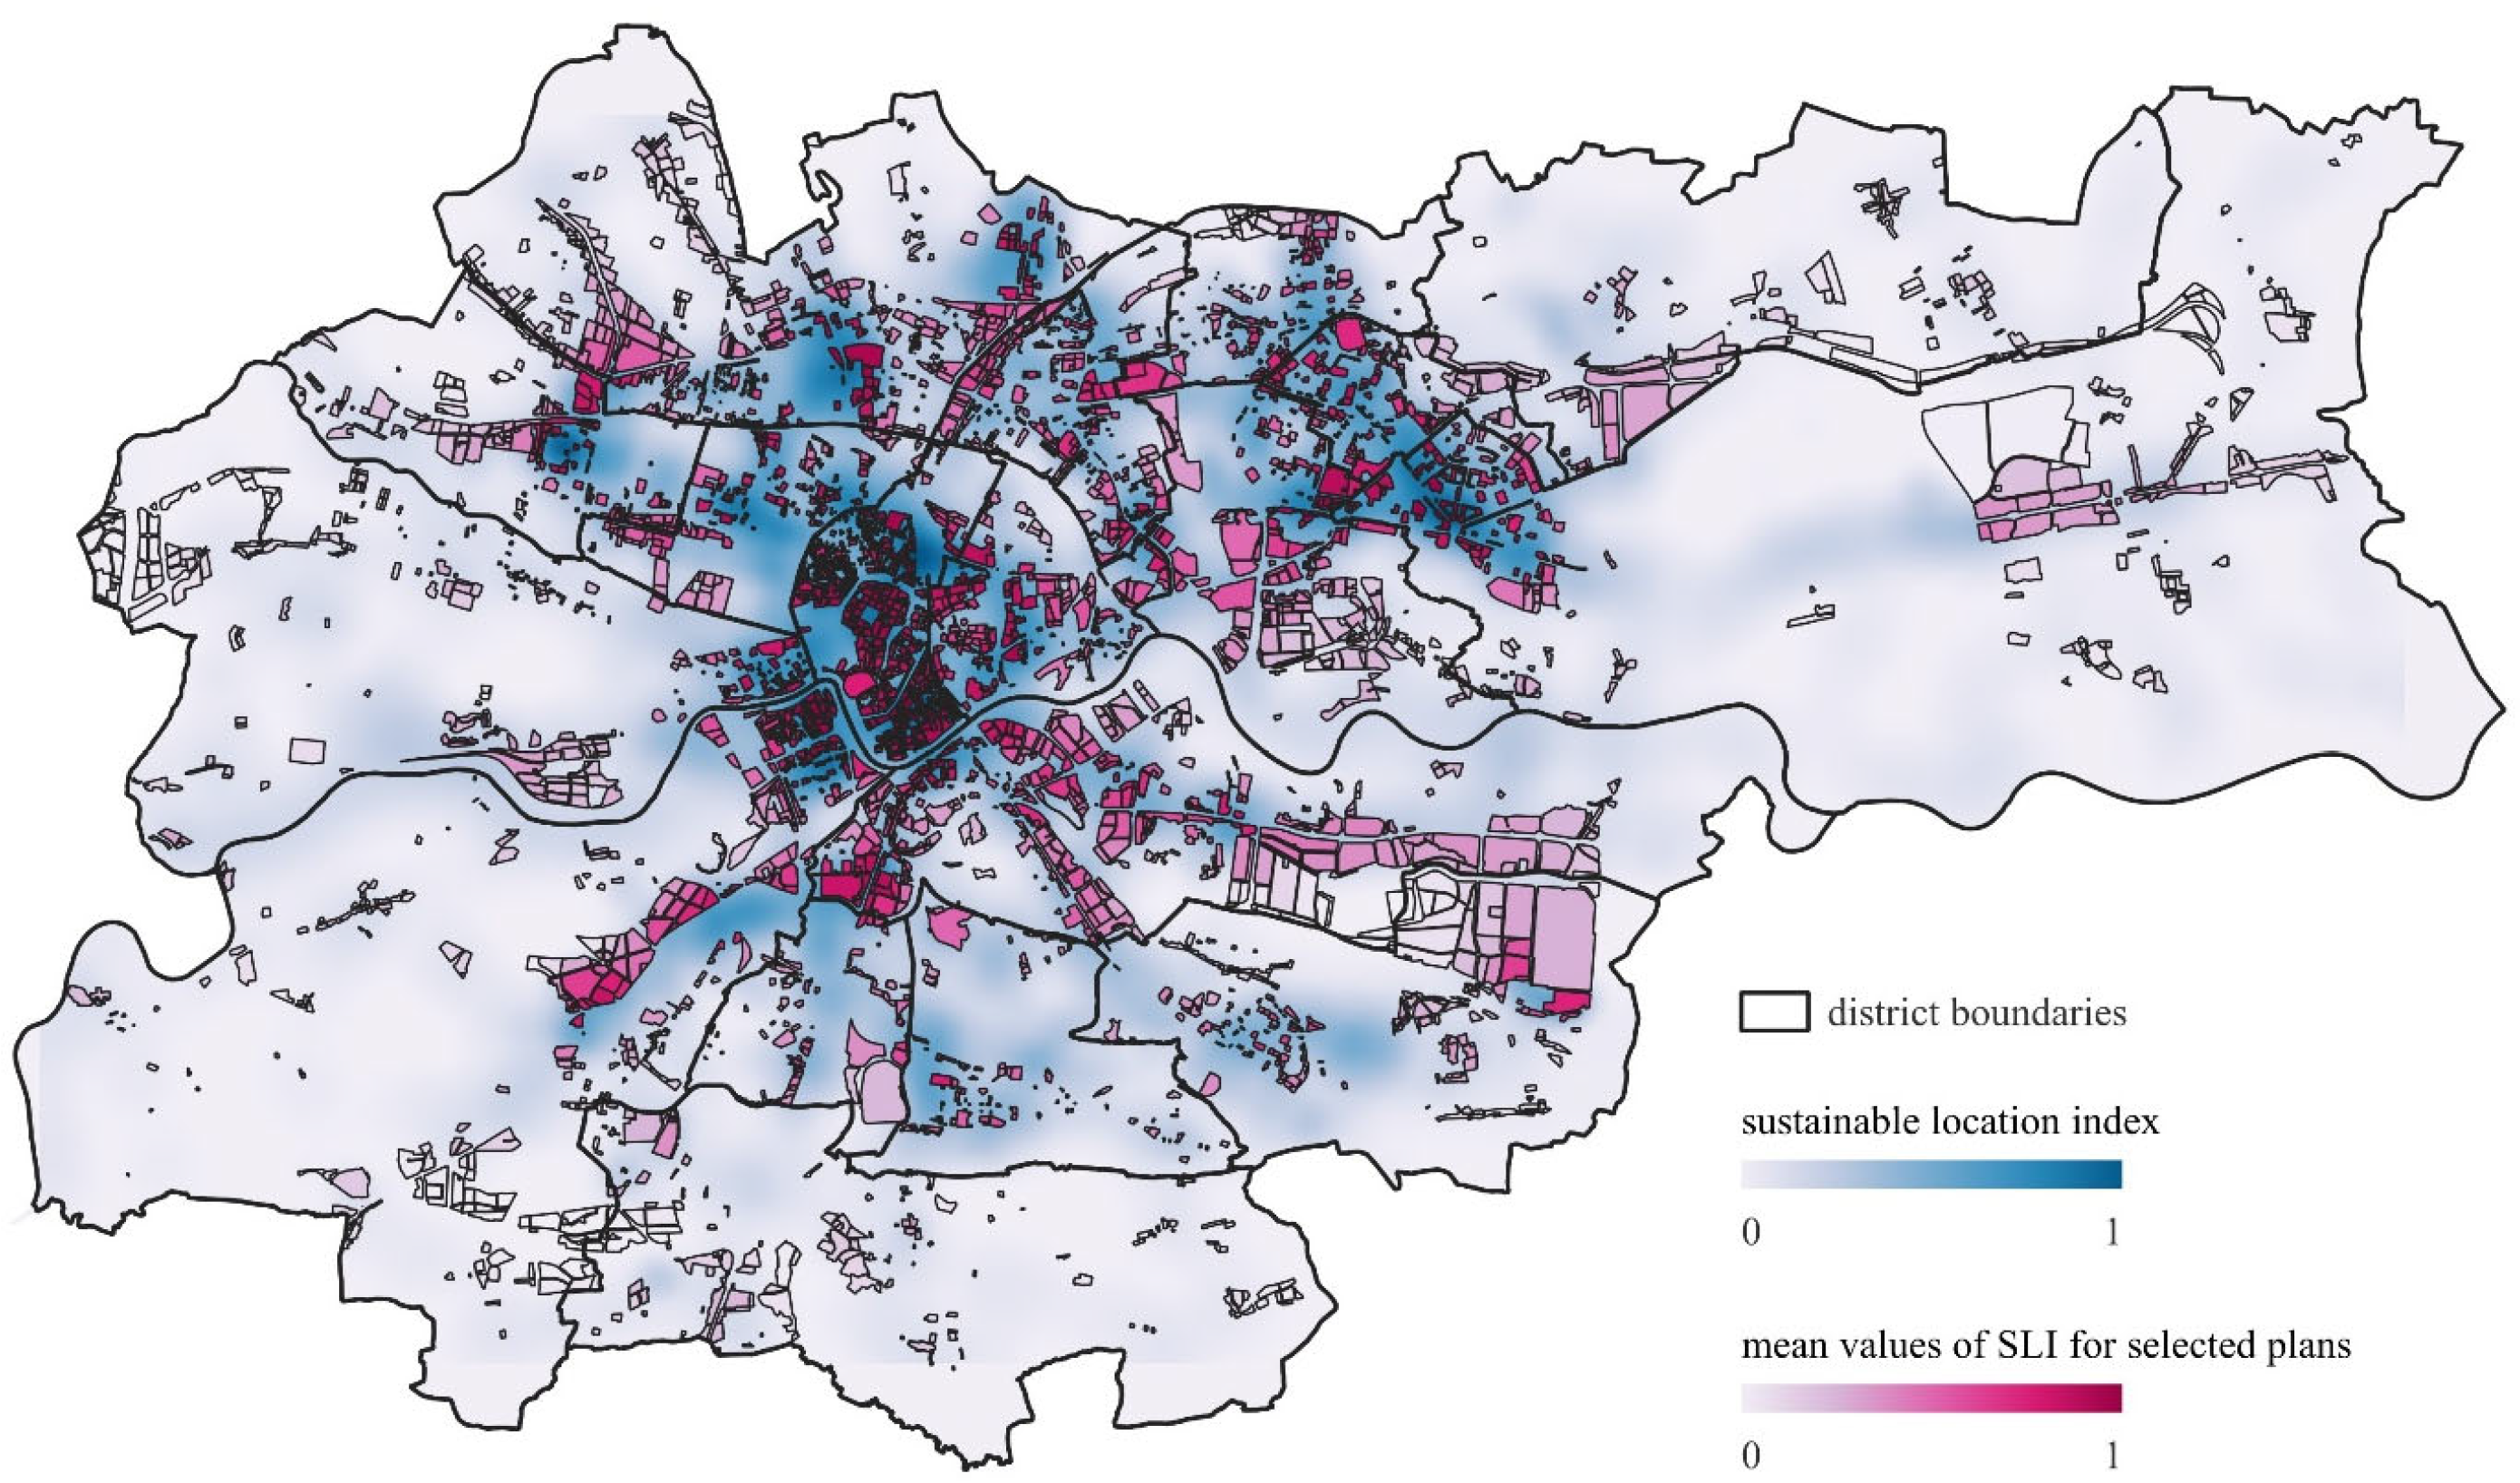
As noted earlier, the area of Krakow is not entirely covered by spatial development plans. An important factor is whether (or not) a service function is allowed in the area covered by a given plan. Among the areas covered by planning, there are 4,504 areas with a service function as the main or supplementary purpose. We calculated the mean SLI value for each such area—see
Figure 7. The division by range is shown in
Table 3. Note that more than half of the areas are characterized by a very low (1516 or 33.7%) or low (1164 or 25.8%) SLI value. This suggests a mismatch between the plan allowing for a service function and the actual conditions (transport infrastructure, green areas, etc.) of the given area.
It is difficult to formulate specific recommendations without a thorough analysis of the local specifics of each area, but a low SLI value indicates the need for either a correction of the plan or investments to improve the conditions of a given location in terms of transport infrastructure, walkability, and availability of greenery. As can be seen in
Figure 7, this is especially the case for the areas designated in the eastern and southeastern parts of Krakow. It may be interesting to conduct field studies to identify the specific reasons for the low SLI value for the selected areas and to formulate recommendations for local authorities in terms of development policy priorities. In this sense, the tool we propose can be used by NGOs and various associations of urban activists in their dialogue with the city authorities.
4. Conclusions
The main objective of the work is to develop a method for assessing the location of office buildings in accordance with the principles of sustainable development. We believe that the sustainable location index (SLI), proposed by us, can be a useful tool used by both economic entities planning to build an office building and local authorities in the process of developing strategies and spatial development plans. The advantage of SLI is that it is based on publicly available data and is relatively easy to calculate using GIS.
The proposed method is quite universal and, with some adjustments, can be used to assess the location of various types of buildings. We believe that this is an advantage of the proposed approach. However, the SLI index in its current form is most suitable for assessing the location of office buildings. Constructing a similar index for, for example, industrial facilities would require entirely different assumptions and data sets.
The main conclusion is that a large number of office buildings (approx. 40%) built in Krakow in recent years are located in places with low SLI values. This means that these locations are not optimal from the perspective of sustainable development. The same is the case with office buildings awarded with BREAM or LEED certificates. Approximately 60% of the plan units assigned a service function are distinguished by low or very low SLI values. This indicates a discrepancy between the intended service function in the planning and the existing conditions, such as transport infrastructure and green spaces within the specified area. A low SLI value signifies the necessity for either an adjustment of the planning strategy or investments aimed at enhancing the conditions of a given location regarding transport infrastructure, walkability, and the availability of green spaces.
The paper provides implications for office developers in a way that location selection for new office projects could be better informed of impacts on urban sustainability without compromising their market effectiveness. As part of future research, it is worth considering examining the impact of the location of an office building (measured in terms of SLI) on office space rental prices and other economic indicators, as well as the correlation between the value of the indicator and the satisfaction with the workplace declared by employees. This, of course, requires conducting appropriate survey research.
Our work could also be useful for local policymakers as a complementary tool that helps determine land use and allocate urban functions, especially commercial ones. Another interesting direction could be a systematic assessment of individual areas with an assigned service function and a low average SLI value. The conclusions can be an important guide in the development and updating of local spatial development plans.
The main limitation of the study is the availability of appropriate spatial data in a GIS-compatible format. The sustainable location index can be easily expanded to include additional components, such as environmental quality (dust and noise pollution) or factors resulting from local planning assumptions. A certain simplification involves estimating the availability of green areas (large parks) by using the centroid of the park area when calculating density values. Modifying the approach to encompass the area of parks and other green spaces should be considered. Economic aspects (e.g., travel costs to a given location) and aesthetics—how an office building fits into the cityscape or the built form of a given district—may also be important. However, this requires a series of additional qualitative studies.
