Article

Non-Monotone Carbon Tax Preferences and Rebate-Earmarking Synergies

by
Felix Fred Mölk
1,*,†,
Florian Bottner
2,†,
Gottfried Tappeiner
1 and
Janette Walde
3
1
Department of Economics, University of Innsbruck, 6020 Innsbruck, Austria
2
Department of Public Finance, University of Innsbruck, 6020 Innsbruck, Austria
3
Department of Statistics, University of Innsbruck, 6020 Innsbruck, Austria
*
Author to whom correspondence should be addressed.
These authors contributed equally to this work.
Sustainability 2025, 17(16), 7282; https://doi.org/10.3390/su17167282
Submission received: 2 July 2025 / Revised: 6 August 2025 / Accepted: 8 August 2025 / Published: 12 August 2025

Abstract

As carbon taxes gain traction in climate policy, public support remains limited. The purpose of this study was to investigate how different mineral oil tax designs, particularly those combining rebates and earmarking, affect public acceptance, and whether the effects are monotone. The data were based on an online survey that was conducted in 2022 in Austria (n = 1216). It was found that a tax increase of EUR 25-cents per liter is politically feasible if revenues are earmarked for public transport or climate protection and paired with moderate rebates. Other uses of revenue, especially the general budget, fail to achieve majority support, regardless of tax level or compensation. To capture non-monotonic and heterogeneous preferences, an adaptive-choice-based-conjoint experiment with hierarchical Bayesian estimation was employed. Rebates were modeled as a stand-alone attribute, allowing for the identification of non-monotonicities for this attribute. The findings show deviations from widespread monotonicity assumptions: a moderate tax increase (EUR 10-cent/liter) was preferred over no increase, even in the absence of earmarking. Similarly, larger annual rebates (EUR 200–300) reduced support compared to a EUR 100 rebate, which was most popular.

1. Introduction

Climate change, with its potentially devastating effects, is causing great concern in many parts of the world. As a result, the need for effective and long-term climate protection measures increases noticeably. Among the strategies proposed to reduce greenhouse gas emissions and promote greener practices, carbon taxation has emerged as a prominent policy tool. A carbon tax is a market-based mechanism that aims to internalize the external costs of carbon emissions by adding a price on carbon-emitting activities [1]. By placing this additional financial burden on carbon-intensive practices, a carbon tax can incentivize a switch to low-carbon alternatives. Thereby, CO2 emissions can be reduced and the mitigation goals of the Paris Agreement can be achieved in the most effective and cost-efficient way [2,3,4,5].
Carbon taxation is not only a tool that benefits environmental sustainability by reducing emissions, but can also align with the social and the economic sustainability dimensions assuming proper use of the generated tax revenue. Socially, the revenue can be redistributed through mechanisms such as annual per capita rebates, which can offset regressive effects and enhance public equity [6]. Economically, targeted use of carbon tax revenues, such as reducing distortionary taxes on labor or capital, can generate efficiency gains, supporting what is known as the double dividend hypothesis [7].
Despite the theoretical attractiveness of carbon taxation as an economic and environmental tool, its practical implementation has encountered formidable challenges. This can be seen from the fact that, in 2022, only around 23% of all global carbon emissions were subject to carbon pricing, which includes taxes and emissions trading systems [8]. One of the key factors that significantly influences the political implementation of such initiatives is how policymakers perceive the degree of public acceptance [9]. The implementation of environmental policy is thereby influenced both directly through public opinion and indirectly mediated through protests, as Weaver [10] illustrates. Since the higher costs that citizens associate with carbon taxes are seen as a key obstacle to their social acceptance [11], many governments are reluctant to implement carbon taxes comprehensively; this reluctance is further compounded by a lack of political will [12,13]. Thus, the degree to which the public is willing to support and collaborate with carbon tax policies could be a crucial factor in their long-term viability.
In recent years, political acceptance has become a central topic in the literature on carbon taxation. Scholars have used various methods to measure public support, including binary yes/no questions [14,15], Likert scales [16,17], willingness-to-pay (WTP) designs [18,19], and discrete choice experiments (DCEs) [20,21].
Although each approach offers important insights, many studies either rely on designs that preclude the detection of non-monotonic preferences or assume, explicitly or implicitly, that public acceptance declines with higher taxes [22,23] or rises with larger rebates [21].
However, there are strong theoretical reasons to expect more complex patterns. Increases in carbon taxation may be perceived not merely as a cost, but also as an effective action to reduce emissions [24], boosting acceptance up to a certain threshold, beyond which the disutility of rising costs dominates. Similarly, a carbon tax with lump-sum transfers may be viewed as more fair [25], while very large rebates could raise concerns about fiscal inefficiency, meaning that spending in other areas will suffer too much. If such non-monotonicities exist, they cannot be reliably detected with conventional designs, as this requires measuring preferences for sufficiently many values of rebates or tax increases. As such, DCEs are capable of detecting them, but the attribute-levels need to be set up accordingly, which, especially for revenue recycling, is rarely the case in the literature. Furthermore, because public acceptance is ultimately determined by the distribution of individual preferences [26], not simply by mean effects, accurate modeling requires methods that capture the heterogeneity across respondents. Without accounting for both potential non-monotonicity and heterogeneous preferences, acceptance shares for policy proposals may be systematically mis-estimated. For instance, non-monotonic preferences, where support increases only up to a certain point before declining, can be obscured in models that assume linear or monotonic responses, leading to the false impression that more is better. Similarly, ignoring heterogeneity can allow individuals with strong directional preferences to outweigh those who are closer to indifference, leading to aggregate estimates that fail to reflect the true distribution of public opinion.
Our study addresses existing gaps by employing an adaptive choice-based conjoint experiment, combined with hierarchical Bayesian estimation. While other discrete choice methods, such as standard choice-based conjoint designs, can in principle detect non-monotonic preferences at both the group and individual levels, adaptive choice-based conjoint introduces an additional check early in the response process. This check prompts respondents to evaluate policy components independently, without having to trade them off against others. This helps to identify potential non-monotonicities at the individual level, in a way that complements what can be inferred from traditional choice tasks. In this study, three key policy dimensions are analyzed—tax rates, lump-sum transfers, and earmarking strategies—to better understand how carbon tax designs can gain public support, while maintaining environmental effectiveness.

2. Literature Review

Research on public acceptance of carbon taxation has expanded significantly over the past decades, applying a variety of empirical methods and using different approaches to measure acceptance.
Some studies rely on binary questions regarding policy approval [27,28], which allow the aggregation of acceptance rates, while fully accounting for preference heterogeneity. Alternatively, acceptance shares may be estimated using logistic regression models, which further enable the analysis of determinants of acceptance. Other studies use Likert scale ratings [16,17], which share many of the same advantages and disadvantages as binary formats. However, they offer the additional benefit of capturing preference intensity, albeit at the cost of some added complexity in analysis and interpretation.
A more flexible approach is provided by Contingent Valuation designs, which are used to estimate willingness-to-pay (WTP) for carbon taxation [18,29]. By varying the tax rate, preferences for multiple policy options can be evaluated within a single survey, and support is expressed through average WTP. In this framework, the share of the population accepting a given tax can be inferred from aggregate demand [22,23], although this requires assuming a monotonically decreasing utility in tax levels.
With increasing interest in recycling carbon tax revenues as a means of improving public acceptance [30,31,32], discrete choice experiments (DCEs) have become widely used to analyze carbon tax preferences [20,21,33]. DCEs offer a structured way to study how individuals evaluate different features of a carbon tax. The respondents are presented with policy alternatives that vary in key attributes, such as the size of the tax increase [21,33], the way revenues are used [20,26], or the geopolitical context [31]. By observing choices across varying scenarios, researchers can infer how people make trade-offs and which attribute combinations are most preferred.
A major advantage of DCEs is that they do not require a specific functional form for utility within each attribute, as long as attribute levels are coded accordingly. When paired with well-designed attributes and attribute levels, and appropriate modeling techniques, this flexibility allows for the identification of complex and potentially non-monotonic preference structures. However, while DCEs provide this potential, most applications make limited use of it. For instance, relatively few studies employ models that fully account for preference heterogeneity [21,26,34] such as mixed logit models or hierarchical Bayesian approaches, and most focus primarily on average effects [20,31].
Furthermore, as Barrez [35] notes, many DCEs on carbon tax acceptance include only a single attribute for revenue use [20,31,33,34,36]. While this simplifies the experimental design, it comes at a cost: it prevents the analysis of how combinations of revenue uses might be valued relative to single-purpose allocations and obscures potential non-monotonic preferences within individual recycling options. For instance, if respondents favor moderate over high lump-sum rebates, collapsing the attribute into a single level may underestimate its appeal and lead to inefficient policy conclusions. Such non-monotonicities are not only plausible but theoretically likely, given that carbon tax revenues are finite and allocating more to one purpose necessarily reduces what can be spent on others.
Some recent studies addressed this limitation by modeling revenue recycling through multiple distinct attributes. Maestre-Andrés et al. [32] found that combining climate protection projects with support for low-income households is generally well received, though not as popular as allocating all funds to climate initiatives. Similarly, Hammerle et al. [21] included a standalone attribute for financial transfers to low-income households, which strongly influences choices, though they assumed preferences for this attribute are monotonically increasing.
Our study builds on this literature and addresses two critical gaps. First, lump-sum rebates are separated from other earmarking strategies to independently assess their effects and allow for the possibility of non-monotonic preferences for this attribute. Second, an adaptive choice-based conjoint (ACBC) design with hierarchical Bayesian estimation is implemented, enabling flexible modeling of individual-level preferences. This approach allows the simulation of acceptance shares more accurately than designs based solely on average effects and to identify policy combinations that balance political feasibility and environmental effectiveness.

3. Method

At the beginning of the online survey, the participants were informed on the consent page about the procedure of the study and a hypothetical tax reform, which included an additional tax rate on already levied fuel taxes in Austria. In a second step, the respondents answered questions regarding their climate perceptions and mobility behavior. The third step was the main part, the ACBC, which included three different types of experiments in itself. The ACBC procedure is explained in more detail in Section 3.2.2. Finally, the survey concluded in a fourth step with socio-demographic questions.

3.1. The Survey

To examine public acceptance of a carbon tax, an online survey was distributed with the help of students at the University of Innsbruck between March and May 2022 (Students received a survey link that they forwarded to roughly 15 people each). The online survey was conducted using Lighthouse Studio and consisted of two main parts, the general questions (see Section 3.1.2) and the ACBC (see Section 3.2) (PDF versions of a complete exemplary survey, both in the original German and in English translation, are available in the Supplementary Materials).
Table 1 presents an overview of our sample of 1216 respondents and compares its composition to population benchmarks based on sex, age, education, and income. The sample aligns closely with the electorate in terms of sex and income, but shows notable discrepancies in age and education. To assess whether these differences affected our findings, sample weights were used as a robustness check (Section 5.1). The results remained mostly consistent, suggesting that our main findings are robust to these deviations.
The survey was carried out from March to May 2022, a period marked by heightened uncertainty due to the Russia–Ukraine conflict that commenced in February 2022. Immediately prior to the survey, war-related fuel prices in Austria rose rapidly and ranged between €1.70 and €2.10 at the time of the survey. The prices surpassed the multi-year average and diverged considerably from the €1.40 referred to in our experiment. Considering the potential impact of a carbon tax-induced price increase during this period, it is likely that participants exhibited a pronounced degree of price sensitivity.

3.1.1. Type of Tax

In October 2021, the Austrian federal government passed the eco-social tax reform. Given that a primary objective of this reform is to reduce greenhouse gas emissions, a CO2 tax was introduced in July 2022 that is levied on fossil fuels. CO2 taxes, in their textbook form, impose a uniform price per ton of greenhouse gases emitted in all sectors of the economy. However, since the European Union’s Emission Trading System already covers many sectors such as industry, the Austrian eco-social tax reform mainly focuses on the transport sector instead [40].
Because an Austrian mineral oil tax is already levied, the implementation of this CO2 tax has produced similar economic effects to an increase in the mineral oil tax. Furthermore, given that individuals are assumed to be relatively aware of levels and fluctuations in fuel prices, an increase in mineral oil tax might be easier to grasp compared to the cross-sectoral effects of a carbon tax. Hence, by framing our experiment with a hypothetical mineral oil tax, respondents should be able to comprehend the consequences of each choice option, which is desirable in choice experiments, to increase the quality of answers [41].

3.1.2. General Questions and Participant Information

To ensure that participants were as well informed as possible when processing the survey, they were provided comprehensive background information on the status quo of the Austrian mineral oil tax structure and the newly adopted eco-social tax reform of 2021/22. In the survey, a fuel price of €1.40 was referenced and it was stated that this included the mineral oil tax of €0.40 already levied. In addition, the participants were informed by how much fuel consumption is expected to decrease for each tax increase. On the last information page and also in the ACBC choice situations (see Figure 1), scenarios were displayed that show the potential CO2-reduction effects in the transport sector caused through each hypothetical tax increase, as well as potential lump-sum payments that could be paid from the tax revenue. For this, it was assumed that a 1% fuel price increase would lead to a long-term reduction in fuel consumption by approximately 0.5%. While estimates of the price elasticities of demand for fuels vary substantially across studies, in a meta-analysis, Labandeira et al. [42] found that the mean estimate of price elasticities for gasoline was −0.526, and −0.391 for diesel. In order to convert the effect of a fuel tax increase into revenue, the decline in fuel demand and the resulting reduction in fuel tax revenues were also taken into account in the calculation. With this information strategy, the participants were made aware of the consequences that a tax increase would have on both their individual financial situation and societal CO2 emissions from fuel use.

3.2. Adaptive Choice Based Conjoint

The ACBC embedded in the survey was completed by participants after the general questions and the information pages. In contrast to a standard CBC, the ACBC included two additional sections before the choice tasks, the Build-Your-Own (BYO) and Screener sections (see Section 3.2.2). When analyzing potential non-monotonicities, the additional BYO section in the ACBC provides a clear benefit over standard CBC, as it captures preferences within individual attributes, without the confounding effects of trade-offs. A further advantage of the ACBC is that it adapts subsequent choice scenarios for each respondent based on the previous choices by that respondent, making the process more efficient and respondent-friendly [43,44]. For some recent applications, see Fuchs and Hovemann [45], Kouki-Block and Wellbrock [46], Nickkar and Lee [47]. In the following two subsections, the attributes and levels used in this study are explained, as well as the procedure of the ACBC.

3.2.1. Attributes

In the context of investigating the public acceptance of a carbon tax, hypothetical tax reforms were constructed based on an extensive literature review in the growing field of public support for carbon taxes. Besides the tax rate, much of the literature revolves around the use of carbon tax revenues, since they open up many degrees of freedom when designing a tax reform [48]. On the one hand, tax revenues can be spent on direct refunding to citizens via lump-sum payments, or on the other hand, revenues could be earmarked for other (mainly subsidizing) purposes. While lump-sum payments have a direct impact on an individual’s budget, other earmarking strategies include an implicit contribution to various measures and (public) goods. For the ACBC, hypothetical tax reform options were constructed that consisted of the three attributes tax level, lump-sum payments, and earmarking, i.e., the components of the reform that can be influenced by the policymaker. The attributes and their respective levels are summarized in Table 2.
The first attribute tax levels represented an additional charge on the market price of fuel, including already levied taxes. In this dimension, other studies found that an increase in the tax level has a monotonically negative effect on the acceptance of the carbon tax [21] and that majority support is only possible if the tax increase is fairly moderate [20]. To explore potential non-monotonic preferences and a broad spectrum of possible tax increases, seven distinct levels were considered, ranging in increments of EUR 10 or 25-cent per liter of fuel for our ACBC experiment. The lowest tax level corresponded to an increase of EUR 0-cent and the highest to an increase of EUR 125-cent. This tax increase was added to a predefined baseline fuel market price of EUR 1.40, about which the participants were informed.
When investigating the revenue side of carbon taxes, the literature is consistent in concluding that a predetermined revenue recycling is very effective in increasing public support for carbon taxation [18,30,31]. One essential aspect revolves around regressive distributional concerns [49], which are often resolved through regular lump-sum payments [6]. However, most applications include lump-sum payments as one of the attribute-levels within the earmarking attribute [31,50]. This approach has two major drawbacks: (1) it only analyzes the case where all tax revenue is re-distributed through lump-sum payments, and (2) from a single attribute-level, it is impossible to determine the preferred amount of re-distribution. This becomes problematic if the utility does not generally increase in lump-sum payments, and if the optimal amount of re-distribution is lower than the total tax revenue. In such cases, re-distributing all revenues would be inefficient in terms of both public spending and public acceptance. To address these concerns, yearly lump-sum payments per adult were included as a standalone attribute in the ACBC. This attribute was represented by six different levels, in EUR 50 increments between EUR 0 and EUR 300. Please note that the revenue from the carbon tax increase might exceed the yearly lump-sum transfers, allowing for the allocation of the surplus funds toward other earmarking purposes. This creates an interdependence between the tax revenue that is available for the two attributes, as more spending on lump-sum payments means that less is available for other earmarking purposes.
Other revenue recycling purposes were represented by our third attribute, earmarking. The literature has developed a variety of strategies, such as financially supporting low-income households [51] or climate mitigation purposes [21]. Consistently, these studies have found strong evidence that earmarking strategies tend to increase public support for carbon taxation [26,31,34]. Conversely, lack of pre-specified revenue recycling can lead to resistance [20]. Following the literature, the following seven levels were included in the ACBC. Similarly to lump-sum payments, the levels Low-income households and Full repayment to adults (see Table 2) work against the regressivity of the carbon tax. Climate protection and Alternative engines can increase the environmental benefits of the tax, while Public transport might combine distributive and environmental considerations. Finally, the attribute-level General budget referred to no earmarking, and No tax increase allowed respondents to express their disapproval to any increase in carbon taxation.

3.2.2. Procedure

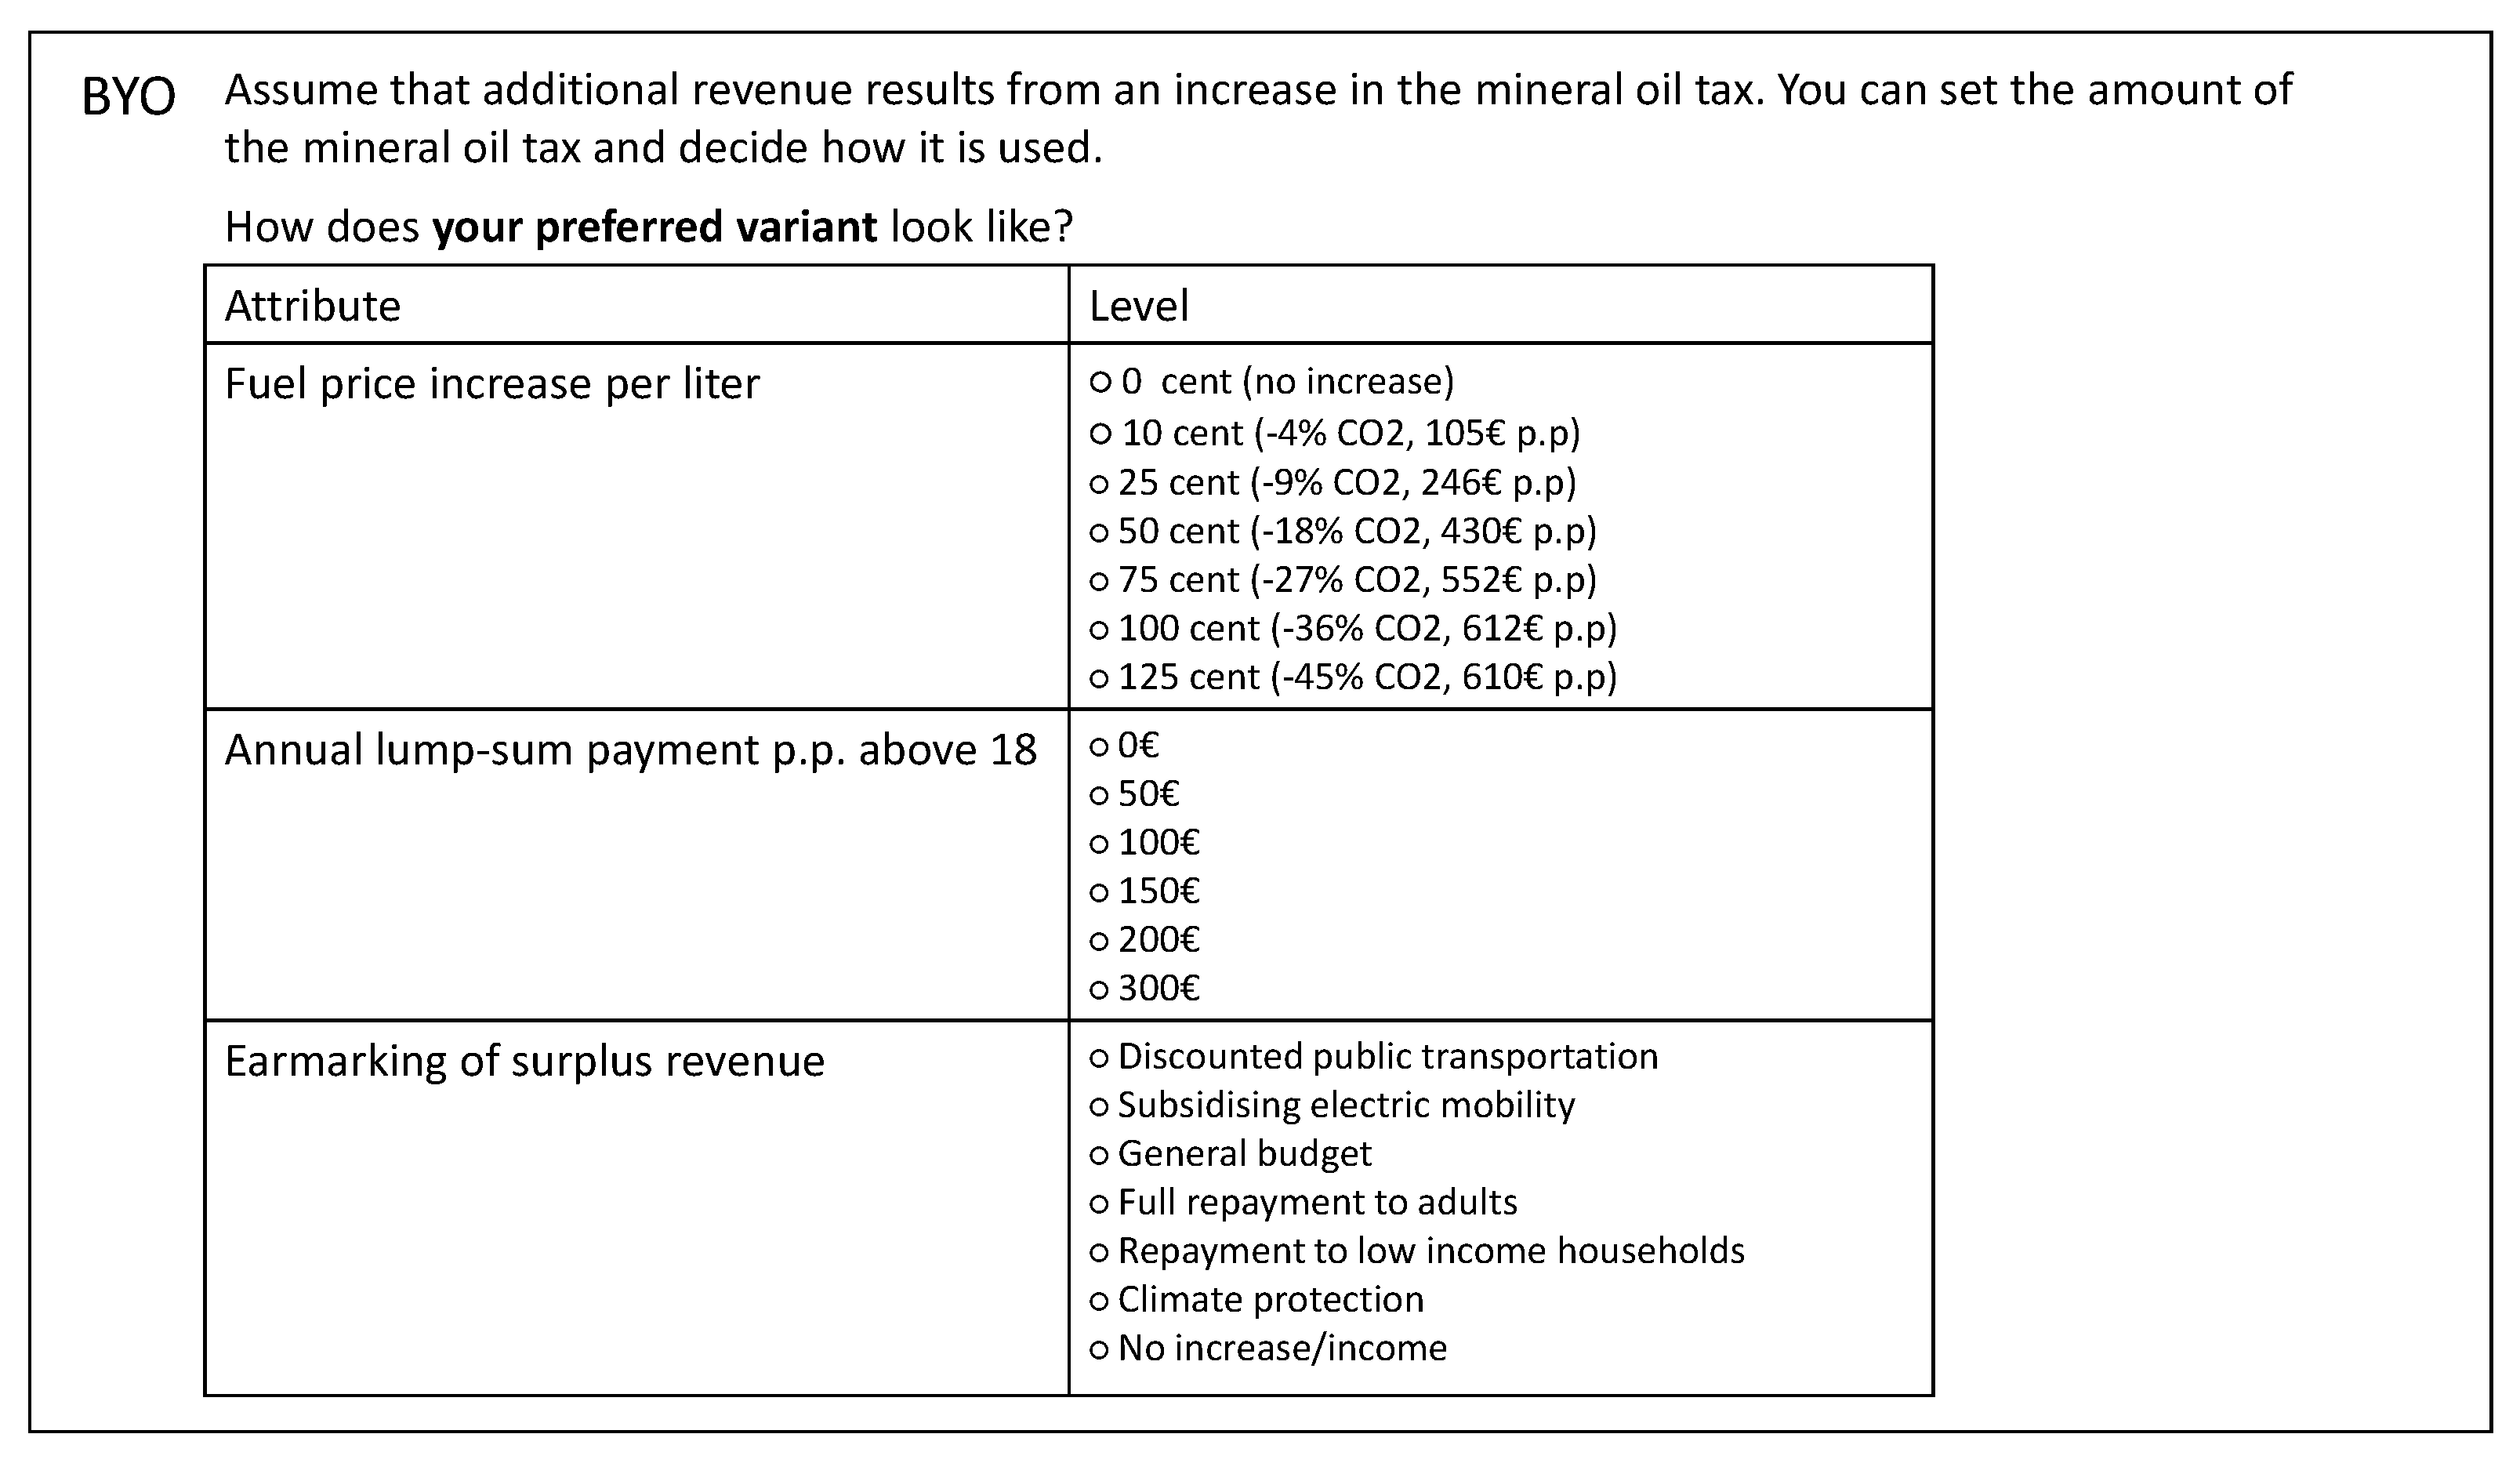
The ACBC is a dynamic and respondent-friendly method that collects data by presenting three sequential choice phases based on the attributes and levels introduced in Section 3.2.1 (For reasons of space, only an overview of the three steps of the ACBC is provided. A detailed description can be found in the Lighthouse Studio manual at https://sawtoothsoftware.com/help/lighthouse-studio/manual/index.html accessed on 11 August 2025). The process began with a Build-Your-Own (BYO) section, allowing participants to construct an ideal policy measure by selecting their most preferred level for each of the three attributes. For now, attributes were treated independently of one another. An exemplary BYO decision-making page is shown in Figure A1. The information gathered in the BYO formed the foundation for designing the next phase, ensuring that subsequent scenarios were both relevant and tailored to the individual participant.
In the second phase, the screener section, participants were presented with six screening pages, each of which included three different policies (see Figure A2). For every policy presented, respondents chose whether to accept or decline. This phase identifies attribute-levels that are either essential or entirely unacceptable to the participants. It further introduces an implicit None-Option, whose utility is estimated by estimating the utility of the decline option in the screeners, and which is treated like a standalone policy profile.
Finally, the ACBC culminated in six choice tasks, similar to those found in standard CBC designs. An example of a choice task is depicted in Figure 1. Participants selected the one of three policies that best aligned with their preferences. However, unlike standard CBC designs, the policies presented in this phase were individually tailored based on the responses provided in the BYO and screener phases. In other words, only if all levels of a profile were identified as potentially acceptable after the screening section, and only if a profile shared at least one level with the BYO specification, were the respective policies presented in a choice task at this stage.
Combining the data from these three sections, the ACBC method enables robust simulations of acceptance rates for various policy combinations, offering insights into their majority capability, and allows for nuanced analyses of individual preferences while maintaining a consistent structure that supports advanced econometric modeling.

4. Results

4.1. Econometrics

4.1.1. Estimating Part-Worth Utilities

Individual decisions were modeled based on the Random Utility Theory [52,53]. Each tax proposal p consisted of one level l a { 1 , . . . , L a } per attribute a { 1 , . . . , A } , where A equals the number of attributes in the choice experiment plus one (for the None-Option) and L a the number of levels in attribute a plus one (for the level absent).
In a CBC, the None-Option is explicitly included as an additional profile in each choice set. In contrast, in an ACBC, the None-Option is treated differently: it corresponds to the decline option in the screener section. For model estimation in the ACBC, the None-Option is represented as an additional attribute, which appears only when all other attributes are absent. This setup adds one extra attribute and one extra level per attribute. Consequently, the utility estimates for the None-Option are interpreted as full tax profiles, unlike the other attribute-levels, which represent only components of a tax profile.
The valuations of each attribute-level are expressed by the so-called part-worth utilities β . More specifically, β i , a , l a is the part-worth utility of level l a in attribute a for individual i. Additionally, a dummy variable x p , a , l a is introduced that equals 1 if and only if proposal p includes level l a for attribute a, and 0 otherwise. ϵ i p is the stochastic error component. Consequently, the utility U i p that individual i assigns to proposal p is specified as follows:
U i p = a = 1 A l a = 1 L a ( β i , a , l a · x p , a , l a ) + ϵ i p
In Equation (1), the total utility of a tax proposal p for individual i is modeled by the sum of the part-worth utilities ( β ) of the levels of each attribute of that proposal. Therefore, trade-offs between levels of different attributes can be assessed by directly comparing the levels’ part-worth utilities.
For estimation, a Multinomial Logit (MNL) model was used that specifies the probability of choosing a tax proposal p out of P tax proposals. In this model, the probability that individual i chooses tax proposal p depends on the utility that individual assigns to p and the utility they assign to all other proposals that can be chosen.
P i ( c h o i c e = p | p ( p 1 , p 2 , . . . , p P ) ) = e x p ( U i p ) k = 1 P e x p ( U i p k )
The application of HB estimation allows deriving individual-level effects using this MNL model. Therewith, a vector of estimates b is derived for the parameters β for each individual i, which will be referred to as part-worth utilities. This also involves the utility of the None-Option, which is simply one element in b per respondent. Thus, heterogeneous preferences can be captured appropriately. The HB approach involves iterative recalibration of probability estimates, leveraging information from the entire dataset, as well as the individual [54]. The estimation process was facilitated through the use of Sawtooth Software, employing the iterative Gibbs Sampling algorithm. In that, 20,000 iterations were burned through to ensure convergence of the algorithm, before another 20,000 iterations were performed to calculate the final part-worth utility estimates. To facilitate comparisons, these estimates were zero-centered for each attribute at an individual level.

4.1.2. Calculating Attribute Importances

Based on the estimated part-worth utilities b, individual-level importance scores were calculated (see Equation (3)). They indicate how much influence each attribute has on a respondent’s choice. For an individual i, the importance of attribute a is calculated as follows:
I i , a = max { b i , a , 1 , . . . , b i , a , L a } min { b i , a , 1 , . . . , b i , a , L a } j = 1 A ( max { b i , j , 1 , . . . , b i , j , L j } min { b i , j , 1 , . . . , b i , j , L j } ) .
At the individual-level, importance scores sum up to one. The importance of attribute a for individual i can be interpreted as the potential influence of that attribute on individual i’s choices in percentages. Therewith, a concise overview on the impact of each of the attributes on the decision-making of respondents can be provided.

4.1.3. Simulating Acceptance Rates

Building on the model described by Equations (1) and (2), carbon tax acceptance rates and the relation to a potential majority capability were simulated. It is feasible to compare a broad set of policy proposals through the application of an ACBC. More specifically, acceptance rates can be simulated for every proposal according to the characteristics shown in Table 2. To simulate individual-level acceptance, HB part-worth utilities were used. An individual i was considered to accept a tax proposal p if the utility of the proposal exceeded the utility of the None-Option:
A c c e p t a n c e i p = 1 if U ^ i p > b N o n e i 0 else
The share of ones for a proposal across all individuals was calculated and contrasted with the majority threshold of 50% to evaluate its political feasibility. The results are shown in Section 4.5.

4.1.4. Weightings

To account for the lack of representativity of the sample concerning the Austrian electorate, each individual’s acceptance was weighted according to three different demographics: age, education, and income. Given that each of the demographics might have some effect on our estimates, it is possible that a joint weighting could influence our estimates more severely if the effects add up. To investigate these considerations, raking was performed. Raking produces weights such that the weighted sample mimics the target distribution according to multiple features simultaneously; in our case, according to age, education, and income. To be precise, the anesrake() function from the anesrake R-package was used [55]; R version 4.2.3, anesrake version 0.80 (The following parameters were chosen: cap = 5, type = “nolim”, enforcing that age, education, and income are included in the weighting procedure. Additionally, it is assured that weights do not exceed a certain threshold as is recommended by the R-package). This applies an iterative procedure, where at each step, the sample is weighted to best mimic one demographic, while in the next step, weights are adjusted to mimic the next demographic. After sufficiently many steps, the weights converged, such that the weighted sample closely represented the target population according to our three features.

4.2. Build-Your-Own (BYO)

The ACBC is superior to the other mentioned experiment types since the dynamic procedure designs choice tasks individually for each respondent. To design these concepts, the ACBC is preceded by a BYO section that delivers initial individual preferences. These findings are portrayed in Table 3. Accordingly, tax rates of 75€-cent or higher were favored by only a small percentage of our sample. Similarly, high annual lump-sum payments were rarely preferred. The most popular repayment amounts were between EUR 0 and EUR 100, accounting for a combined 76% of the sample. More than two third of respondents preferred to use the remaining tax revenue for either Public transport or Climate protection. The lowest share of respondents (2.7%) favored the General budget, which would correspond to no earmarking. The redistributive measures being Low-income households and Full repayments to adults were preferred by less than a combined 9% of the sample.
Under the assumption of monotonic preferences, respondents would be expected to consistently favor one of the extreme values for tax levels and rebates. However, the BYO results indicate that this was not the case: only 25% and 36% of respondents, respectively, selected an extreme value. When applying commonly held directional expectations—namely, that individuals prefer lower taxes and higher rebates—the evidence for non-monotonicity becomes even stronger. Just 22.3% chose the lowest tax level, and only 6.1% opted for the highest available rebate.
In the BYO, respondents only highlighted their most preferred level of each attribute. For the attribute Tax level, for instance, this could potentially differ significantly from the maximum tax increase that would be acceptable. Further, the preferred BYO level was chosen for each attribute separately rather than conjointly, not exploiting the advantages of conjoint analysis. Therefore, part-worth utility estimates are presented in Section 4.3, also incorporating the information from the screener and choice task sections, and are hence able to assess preferences for all levels, rather than only the most preferred ones, presenting a much more nuanced picture of the respondents’ preferences.

4.3. Part-Worth Utilities

4.3.1. Non-Monotonicity and Mean Preferences

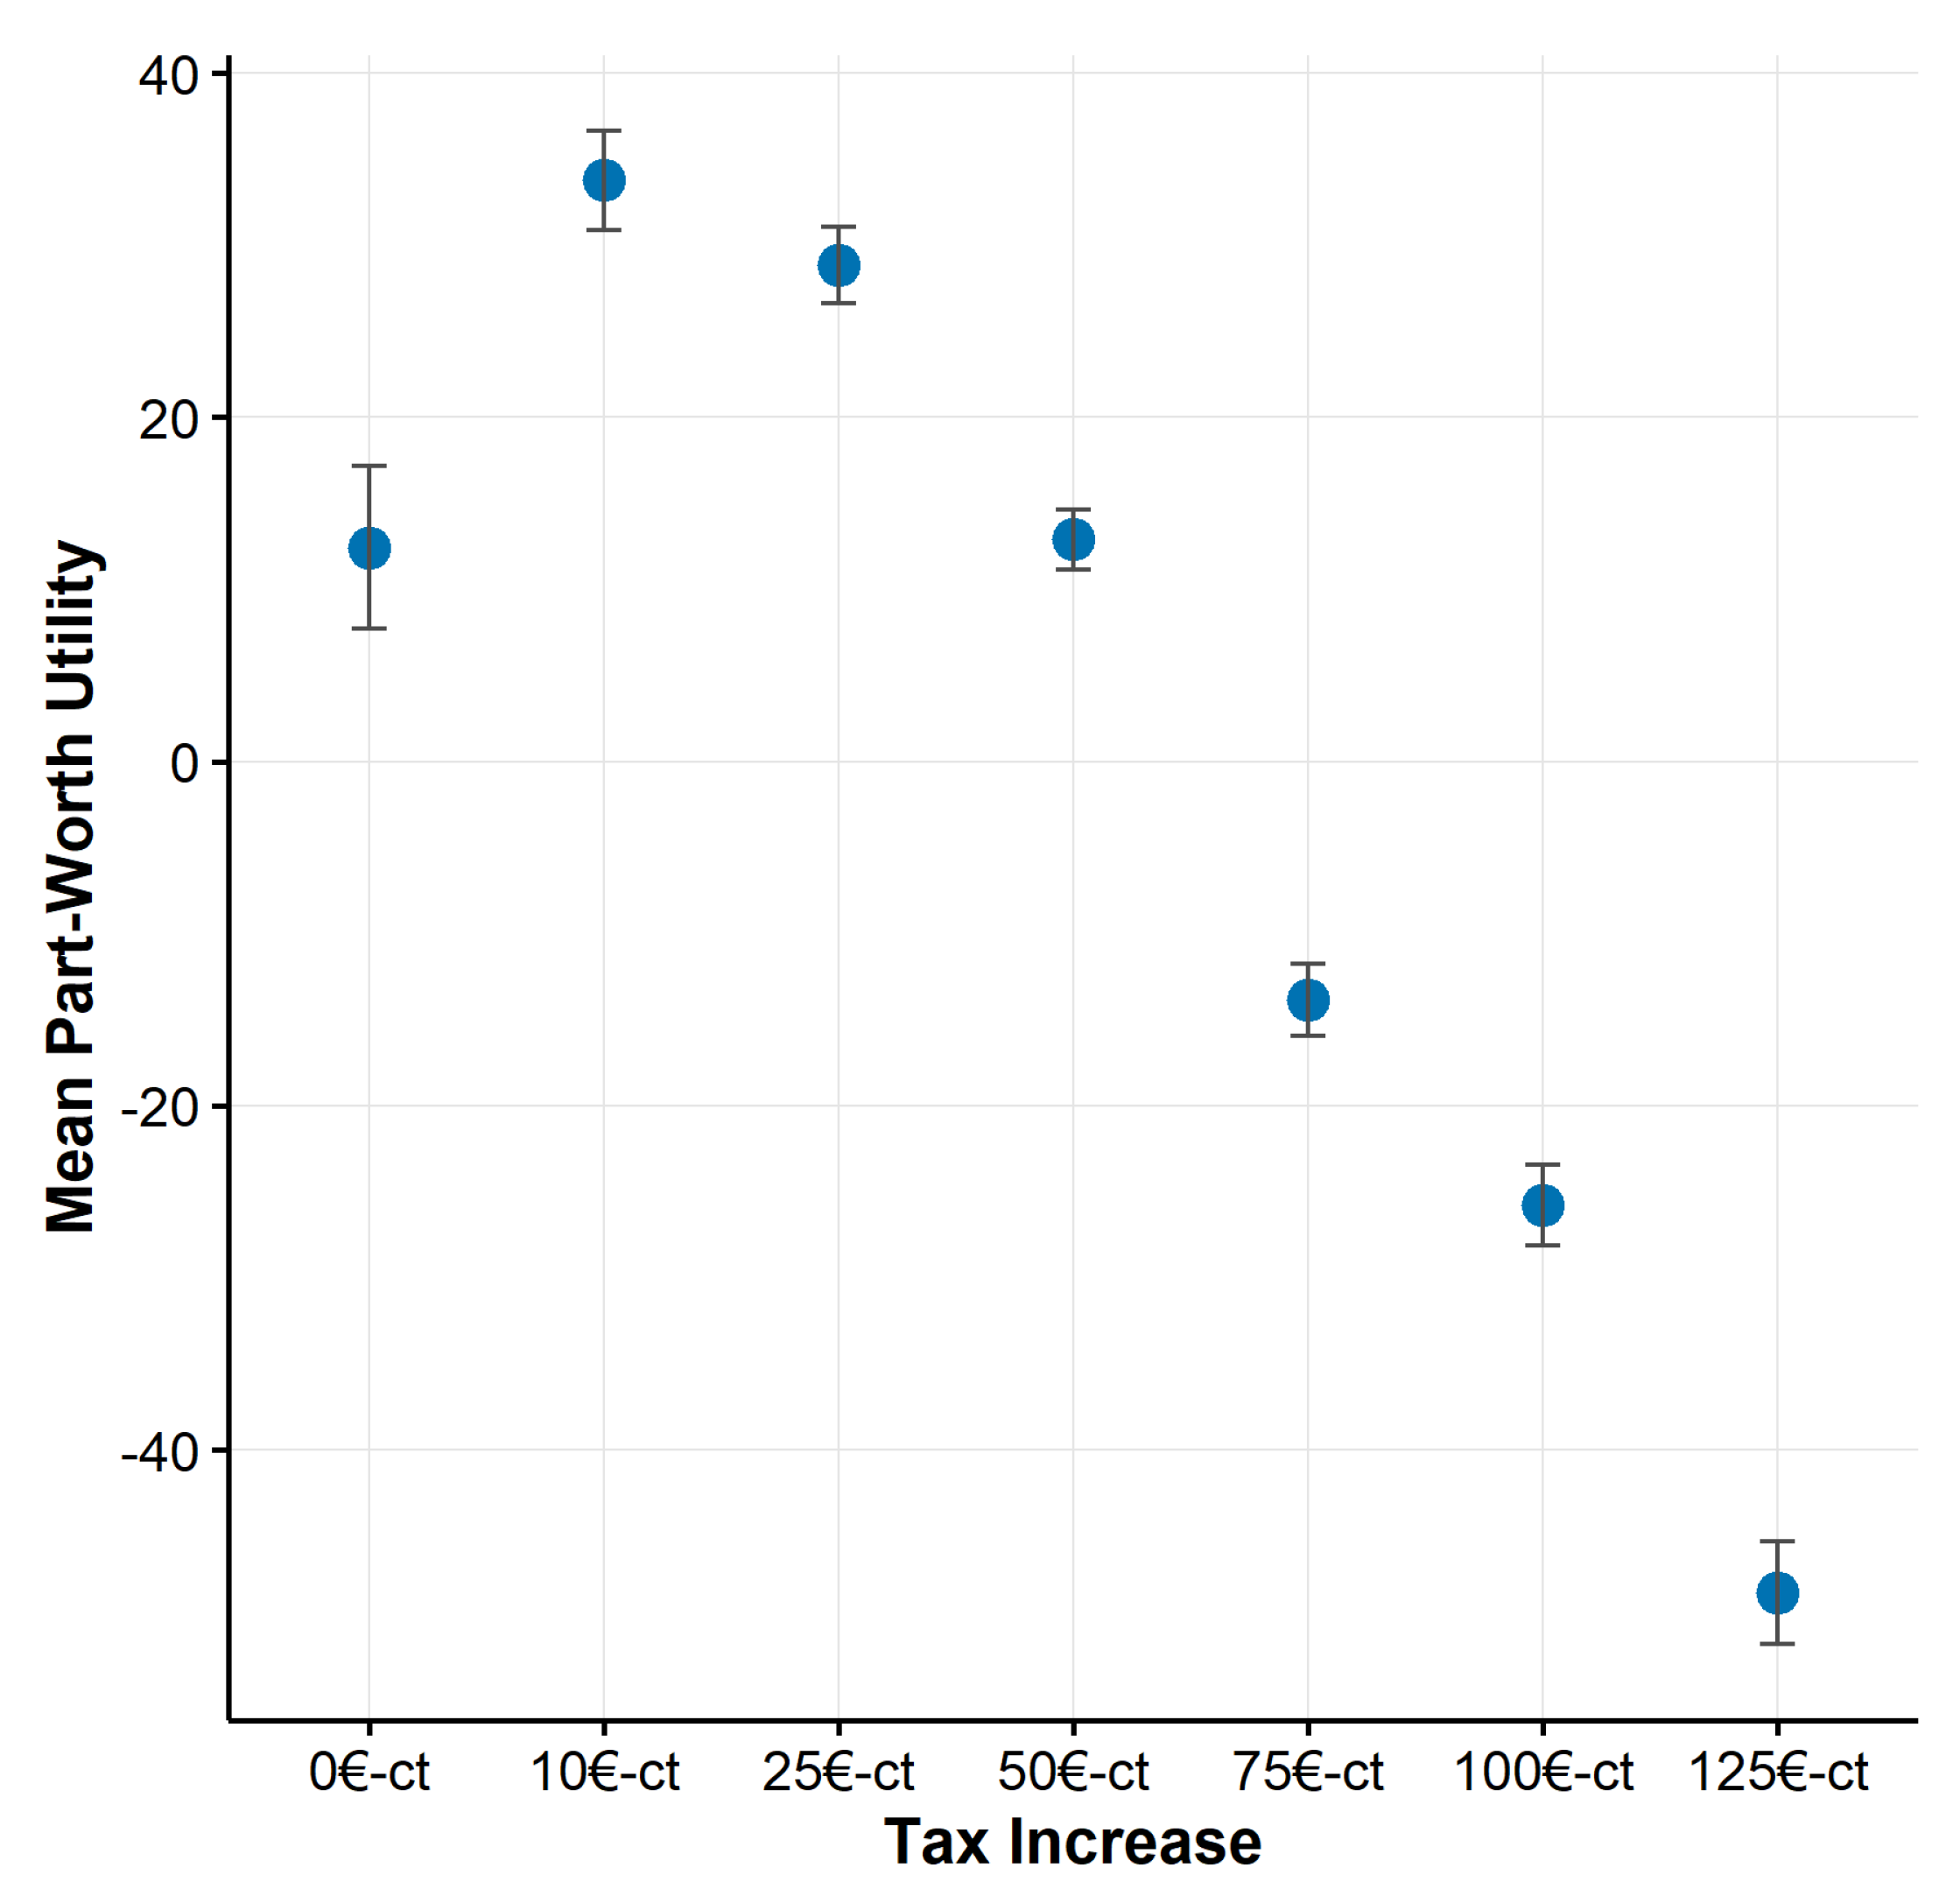
Figure 2 presents the results of the HB estimation for the corresponding levels of the attribute tax levels. Each dot represents a mean estimate of the part-worth utility (y-axis) within a specific attribute-level (x-axis), and the error bars represent the 95% confidence intervals.
The results indicate that the mean part-worth utility was significantly lower for a tax increase of EUR 0-cent than for a tax increase of EUR 10-cent (T-test, p-value < 0.001). Carbon price increases exceeding EUR 10-cents per liter of fuel were gradually associated with decreasing mean part-worth utilities. While tax rates of up to EUR 50-cents were generally well received according to the mean part-worth utilities, tax rates of EUR 75-cents and more were clearly less popular for the respondents in our sample.
This inverse U-shaped preference pattern of the part-worth utilities contradicts monotonically decreasing preferences with increasing tax levels, a widespread assumption [19,22,56] and finding [31,34,57] in applications on carbon tax acceptance.
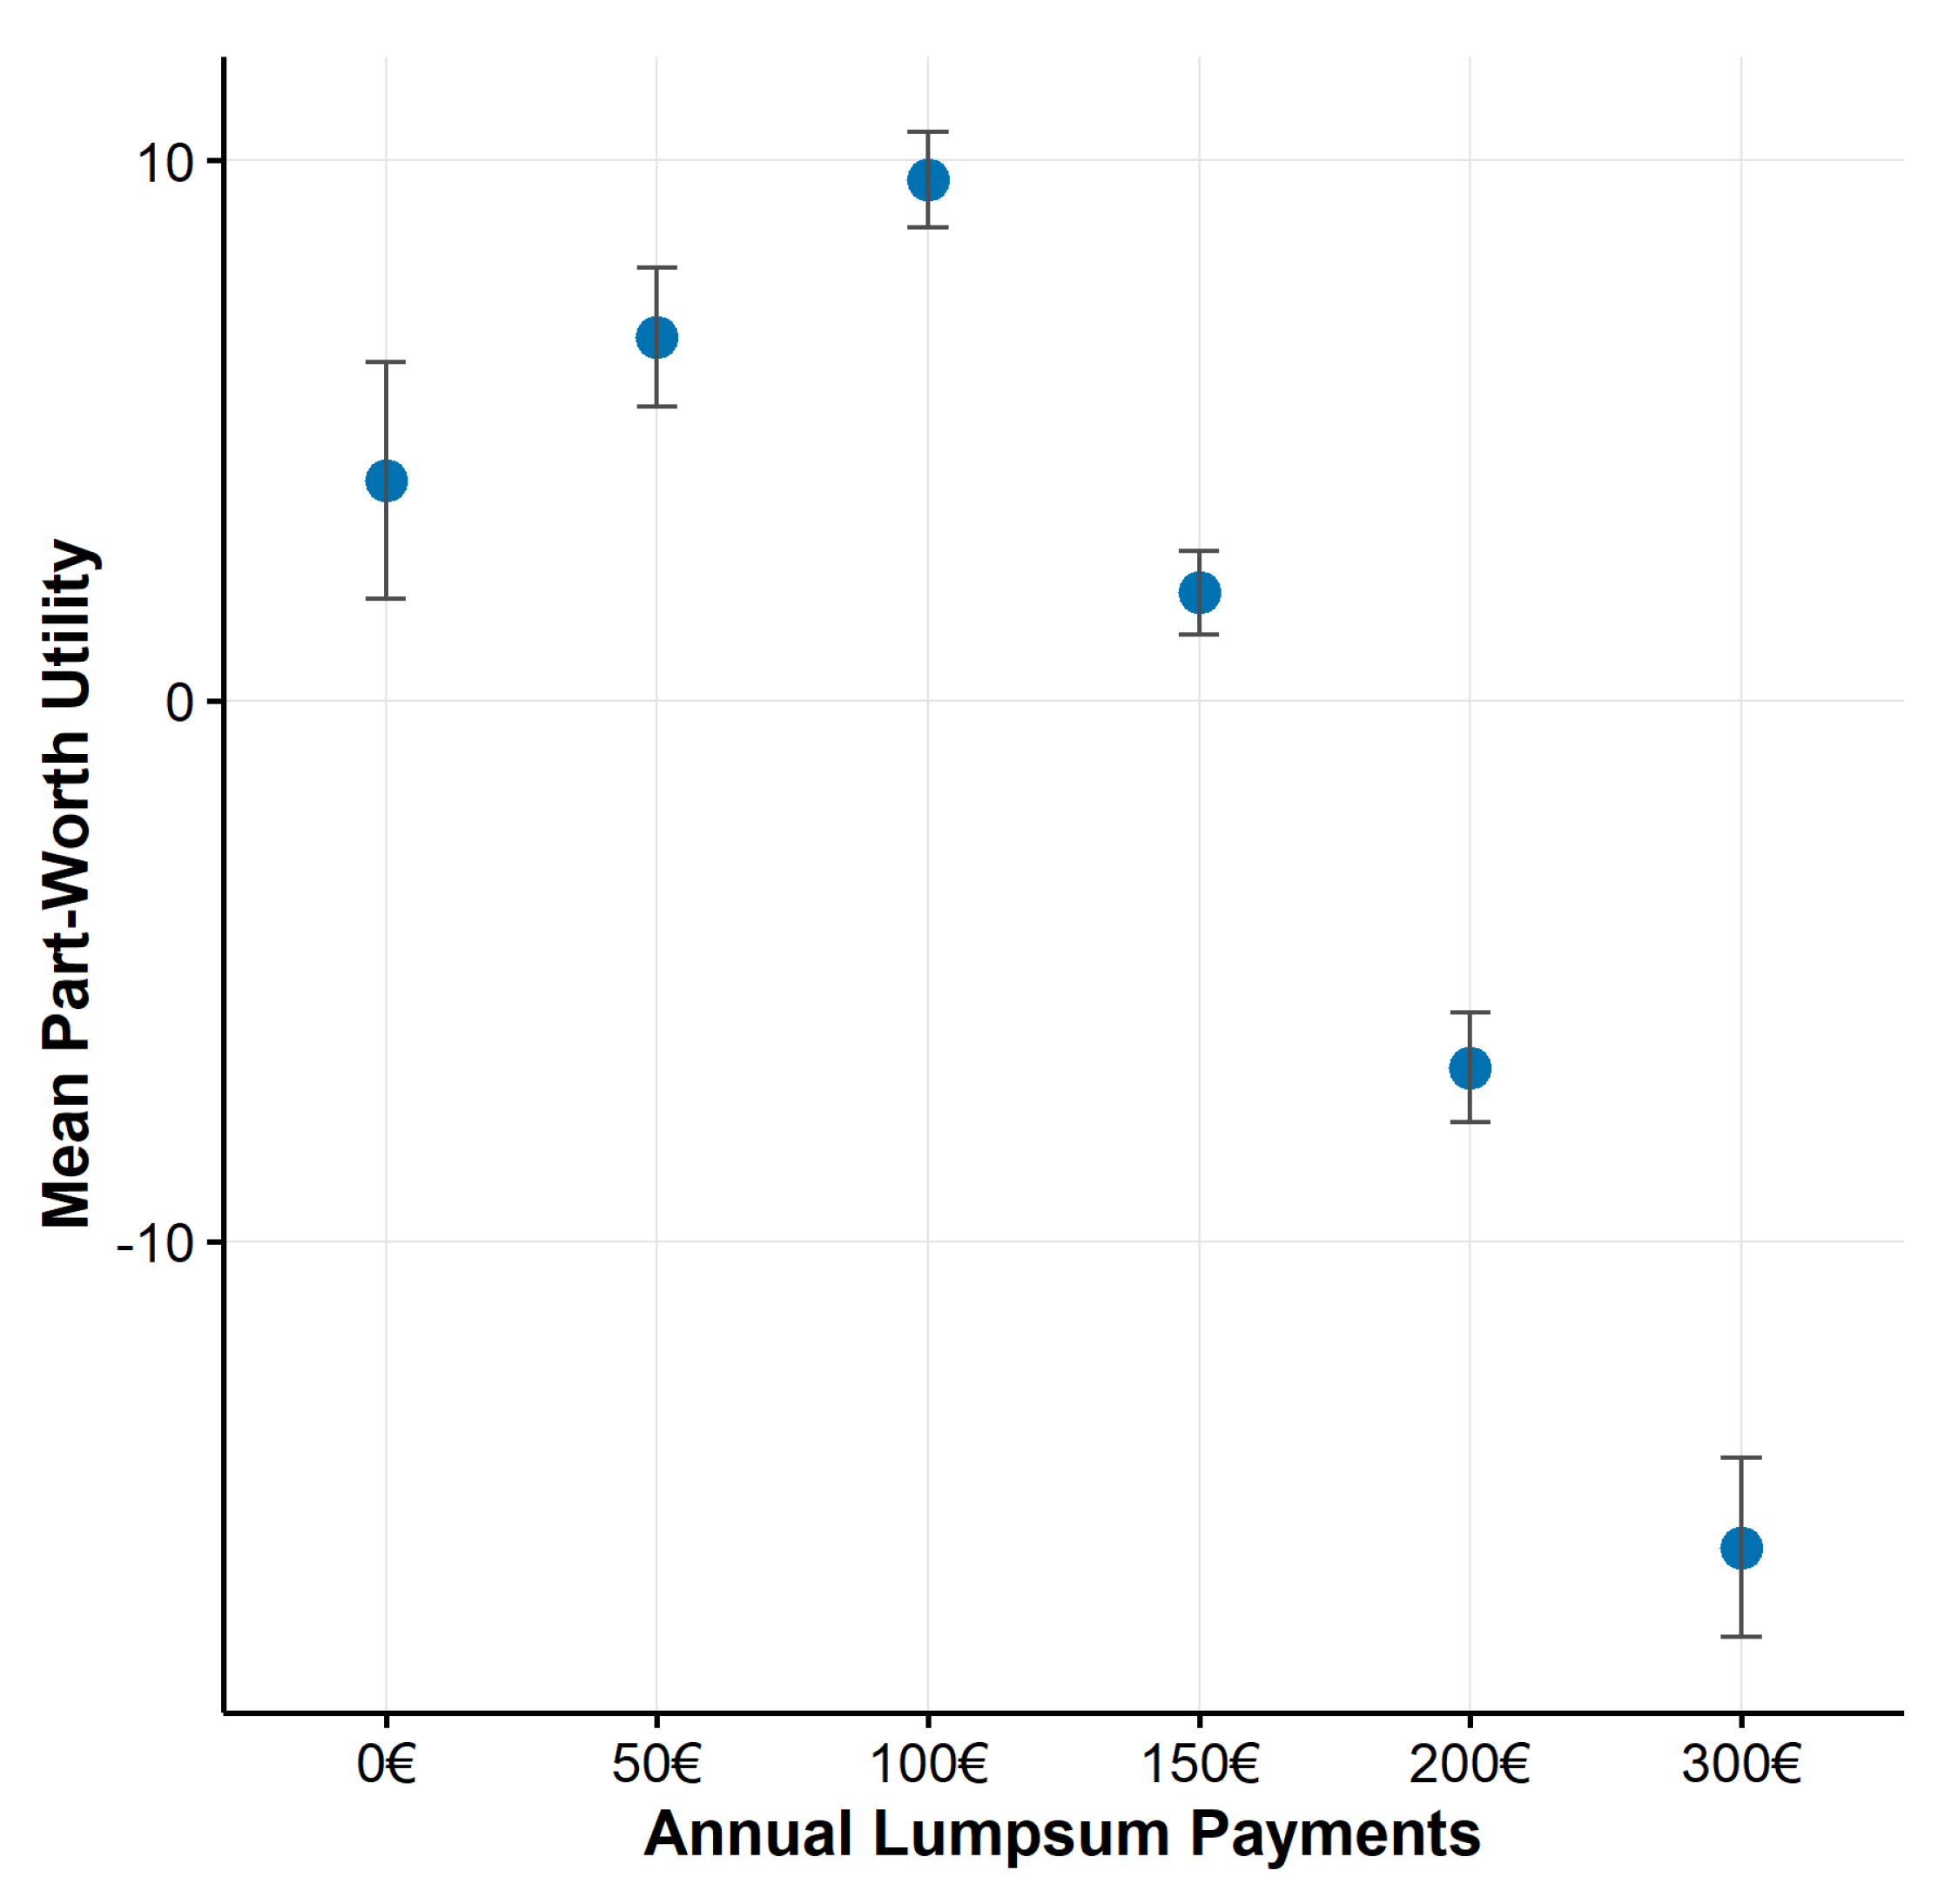
The mean part-worth utilities of the different levels of the attribute yearly lump-sum payments in Figure 3 reveal another inverse U-shaped pattern. This means that the popularity of re-distributive transfers slightly increased from EUR 0 onward and peaked at EUR 100. Levels that exceeded this value were instead associated with lower mean part-worth utilities, especially for EUR 200 and EUR 300. Thus, the respondents preferences were not monotonically increasing with lump-sum repayments.
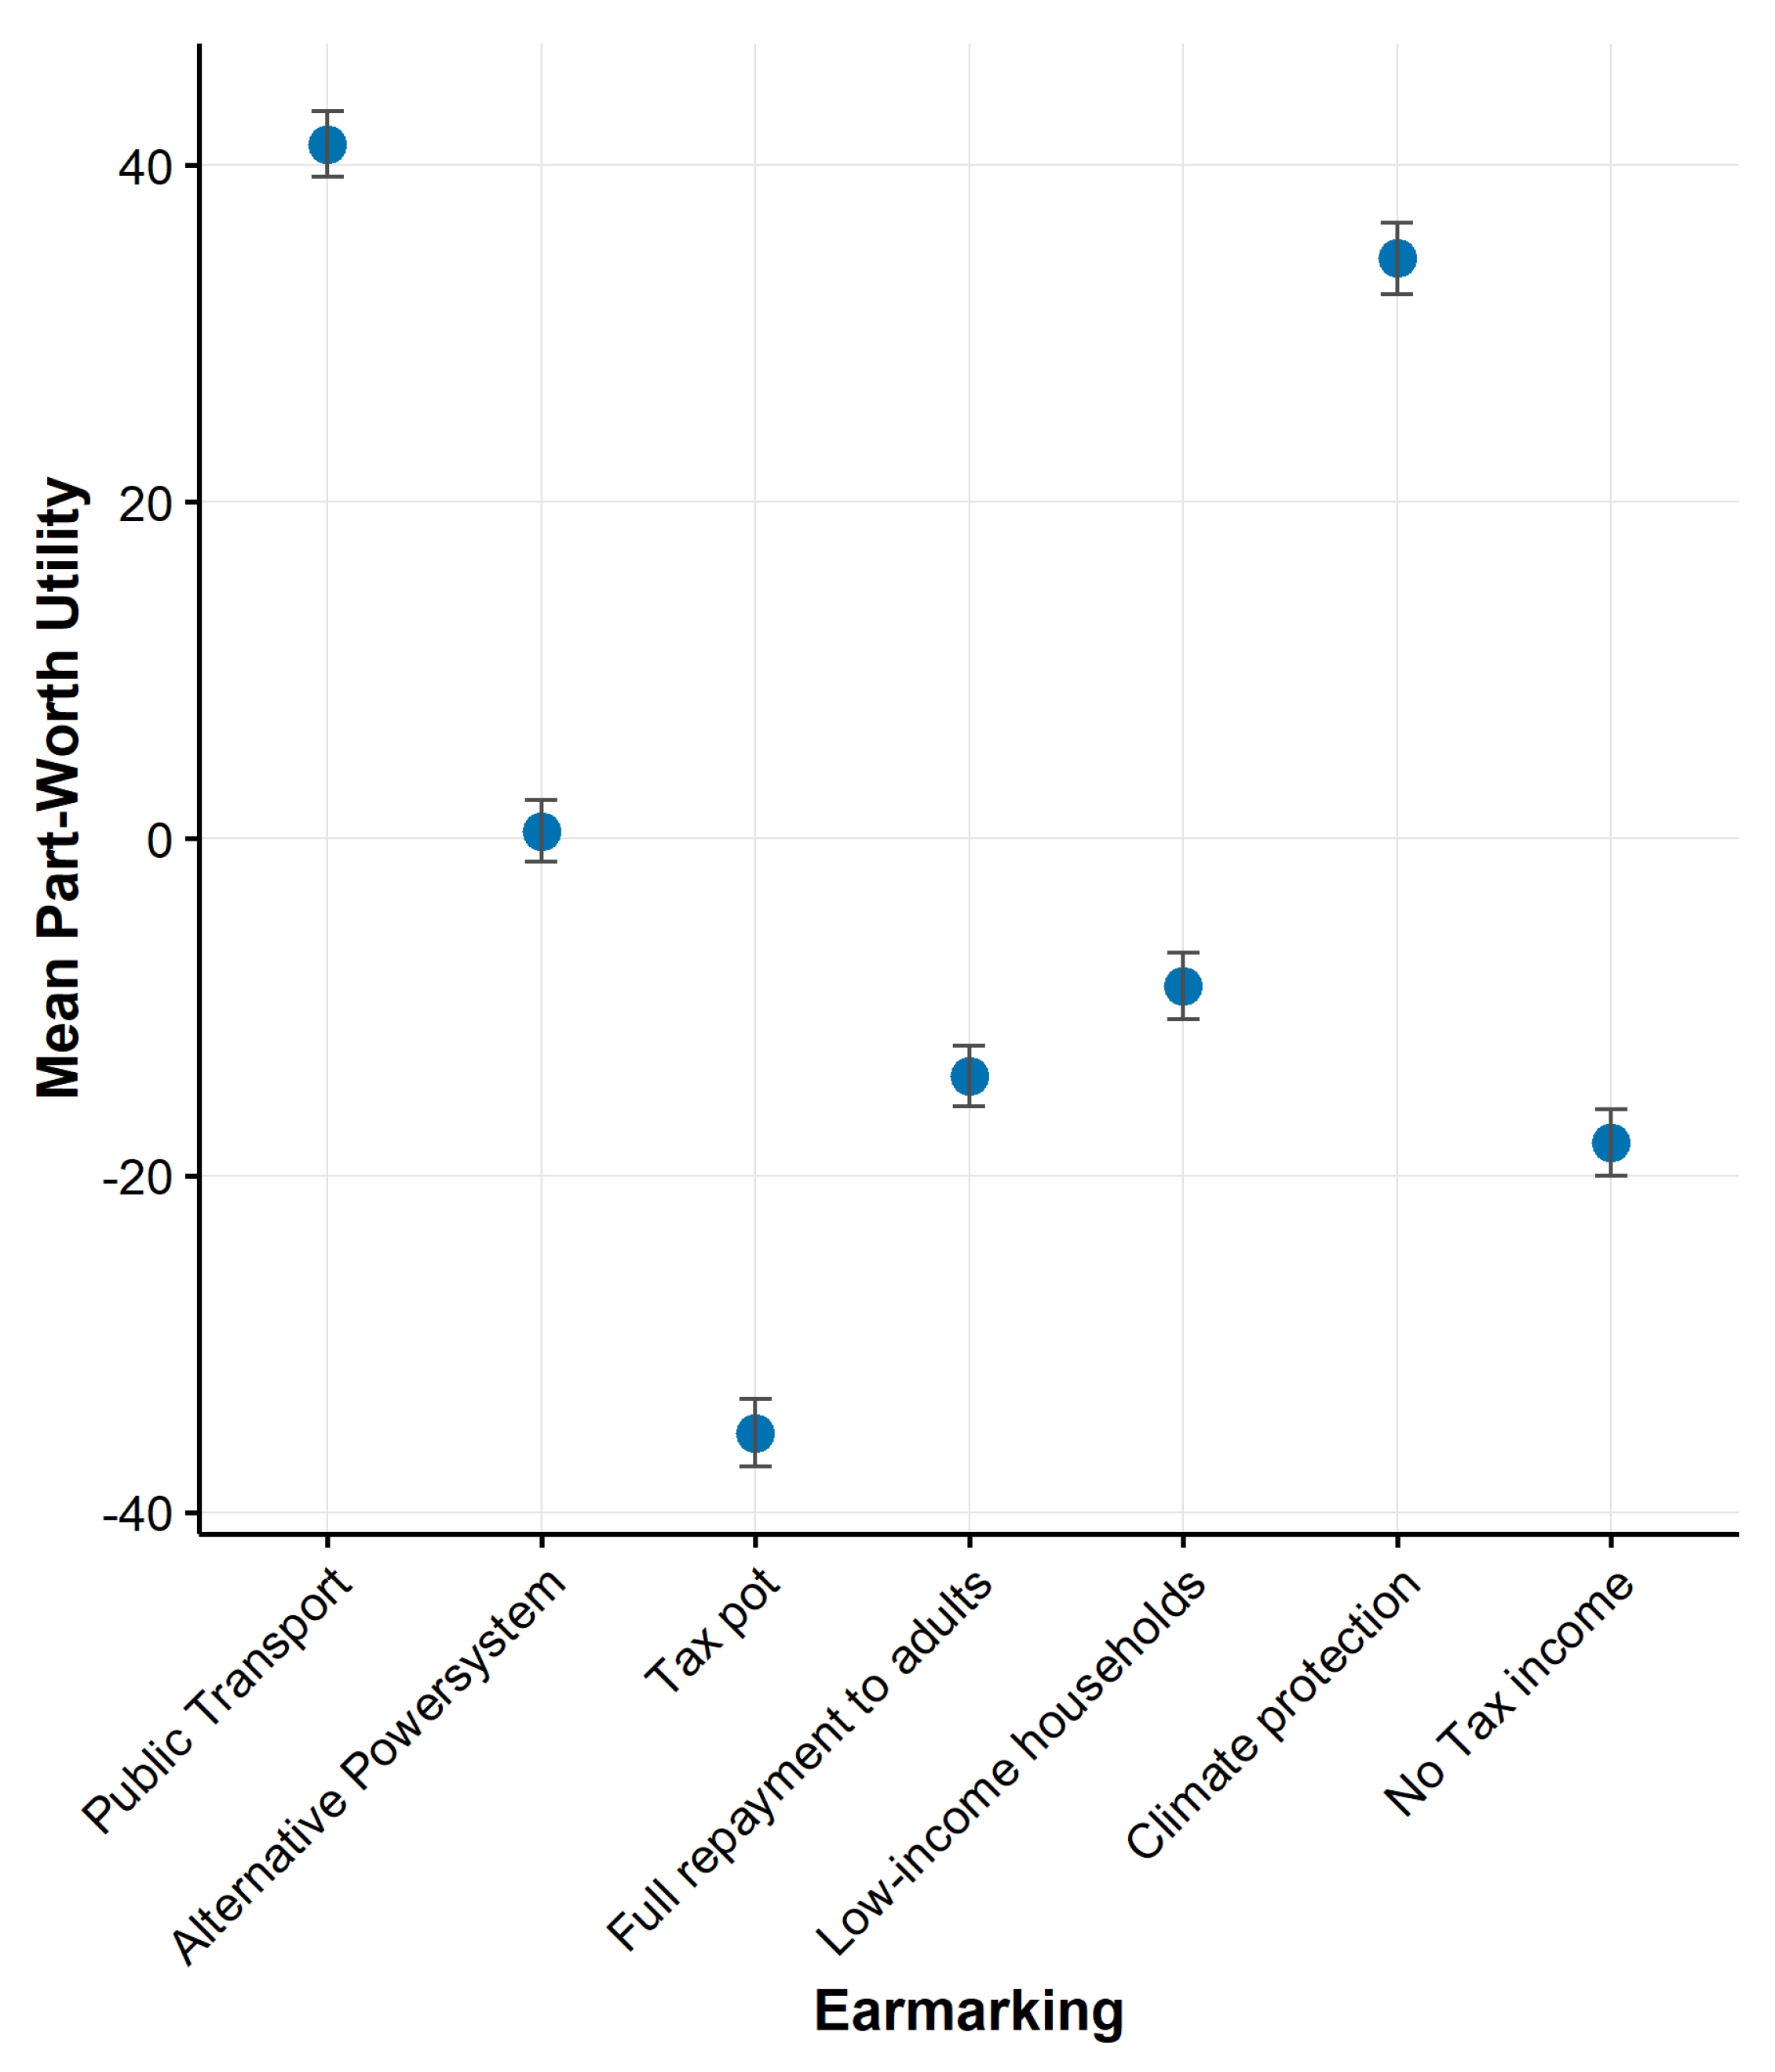
The estimates in Figure 4 represent the part-worth utilities of the levels of the earmarking attribute. Please note that this attribute allocates the remaining tax revenues not dedicated to lump-sum transfers. According to the mean estimates, the most-preferred uses for these funds included investments in public transportation and climate protection measures. All other options were clearly less popular. Accordingly, re-distributive measures such as transfers to low-income households or full repayments to adults were not favored. The earmarking alternative general budget, which corresponds to no pre-specification of how the tax revenue surplus will be used, was the least favored option. This clearly highlights the desirability of earmarking for increasing public support for carbon taxation.
Across all attributes, the popularity of the levels according to the mean part-worth utilities closely matched the popularity according to the BYO. Given that part-worth utilities were estimated based on choices and the BYO followed a direct, and hence different approach, this consistency further strengthens our findings.

4.3.2. Heterogeneity

Table 4 presents the 10th, 50th (median), and 90th percentiles of the distribution of individual-level part-worth utility estimates for each attribute-level. These quantiles provide detailed information on the extent and structure of preference heterogeneity within the sample. The results reveal substantial variation in preferences across all attributes, with particularly pronounced heterogeneity observed for the tax level attribute. This indicates that while a subset of respondents strongly opposed higher tax levels, others were more tolerant or even supportive, pointing to diverse underlying valuations of the policy. Notably, preferences were especially heterogeneous with respect to the EUR 0-cent level, which effectively captured respondents’ views on whether any tax increase is acceptable at all. This is particularly insightful, as this level can be interpreted as addressing a distinct evaluative dimension, namely, the general acceptability of increasing taxes, separate from the question of how large such an increase should be.
Considerable heterogeneity was also observed for the None-Option, which represents a respondent’s baseline utility for accepting a given policy. The wide distribution of utility estimates for this option underscores the importance of modeling opt-out behavior as an individual-specific threshold, rather than assuming a homogeneous valuation across the population. Endogenously estimating this threshold allowed the model to more accurately reflect variation in the respondents’ willingness to accept a policy.
In summary, the results presented in Table 4 demonstrate a notable variation in preferences across respondents. These patterns confirm the presence of systematic heterogeneity in how individuals evaluate carbon taxes and in their preferred forms of revenue recycling.

4.4. Attribute Importances

In order to examine which of the three attributes used in the experiment was most important for the participants’ decisions, the mean attribute importances are shown. For this sample, it was found that the attribute tax levels was most important, with a mean importance of 46.3% (standard error of 0.397 percentage points), while earmarking followed in second place with 35.1% (standard error of 0.243 percentage points). Lump-sum transfers, which are very prominent in social discussions, played a comparatively minor role, with a mean importance of 18.6% (standard error of 0.346 percentage points). This insight was subsequently condensed in the findings on acceptance rates in Section 4.5.

4.5. Tax Reform Acceptance Rates

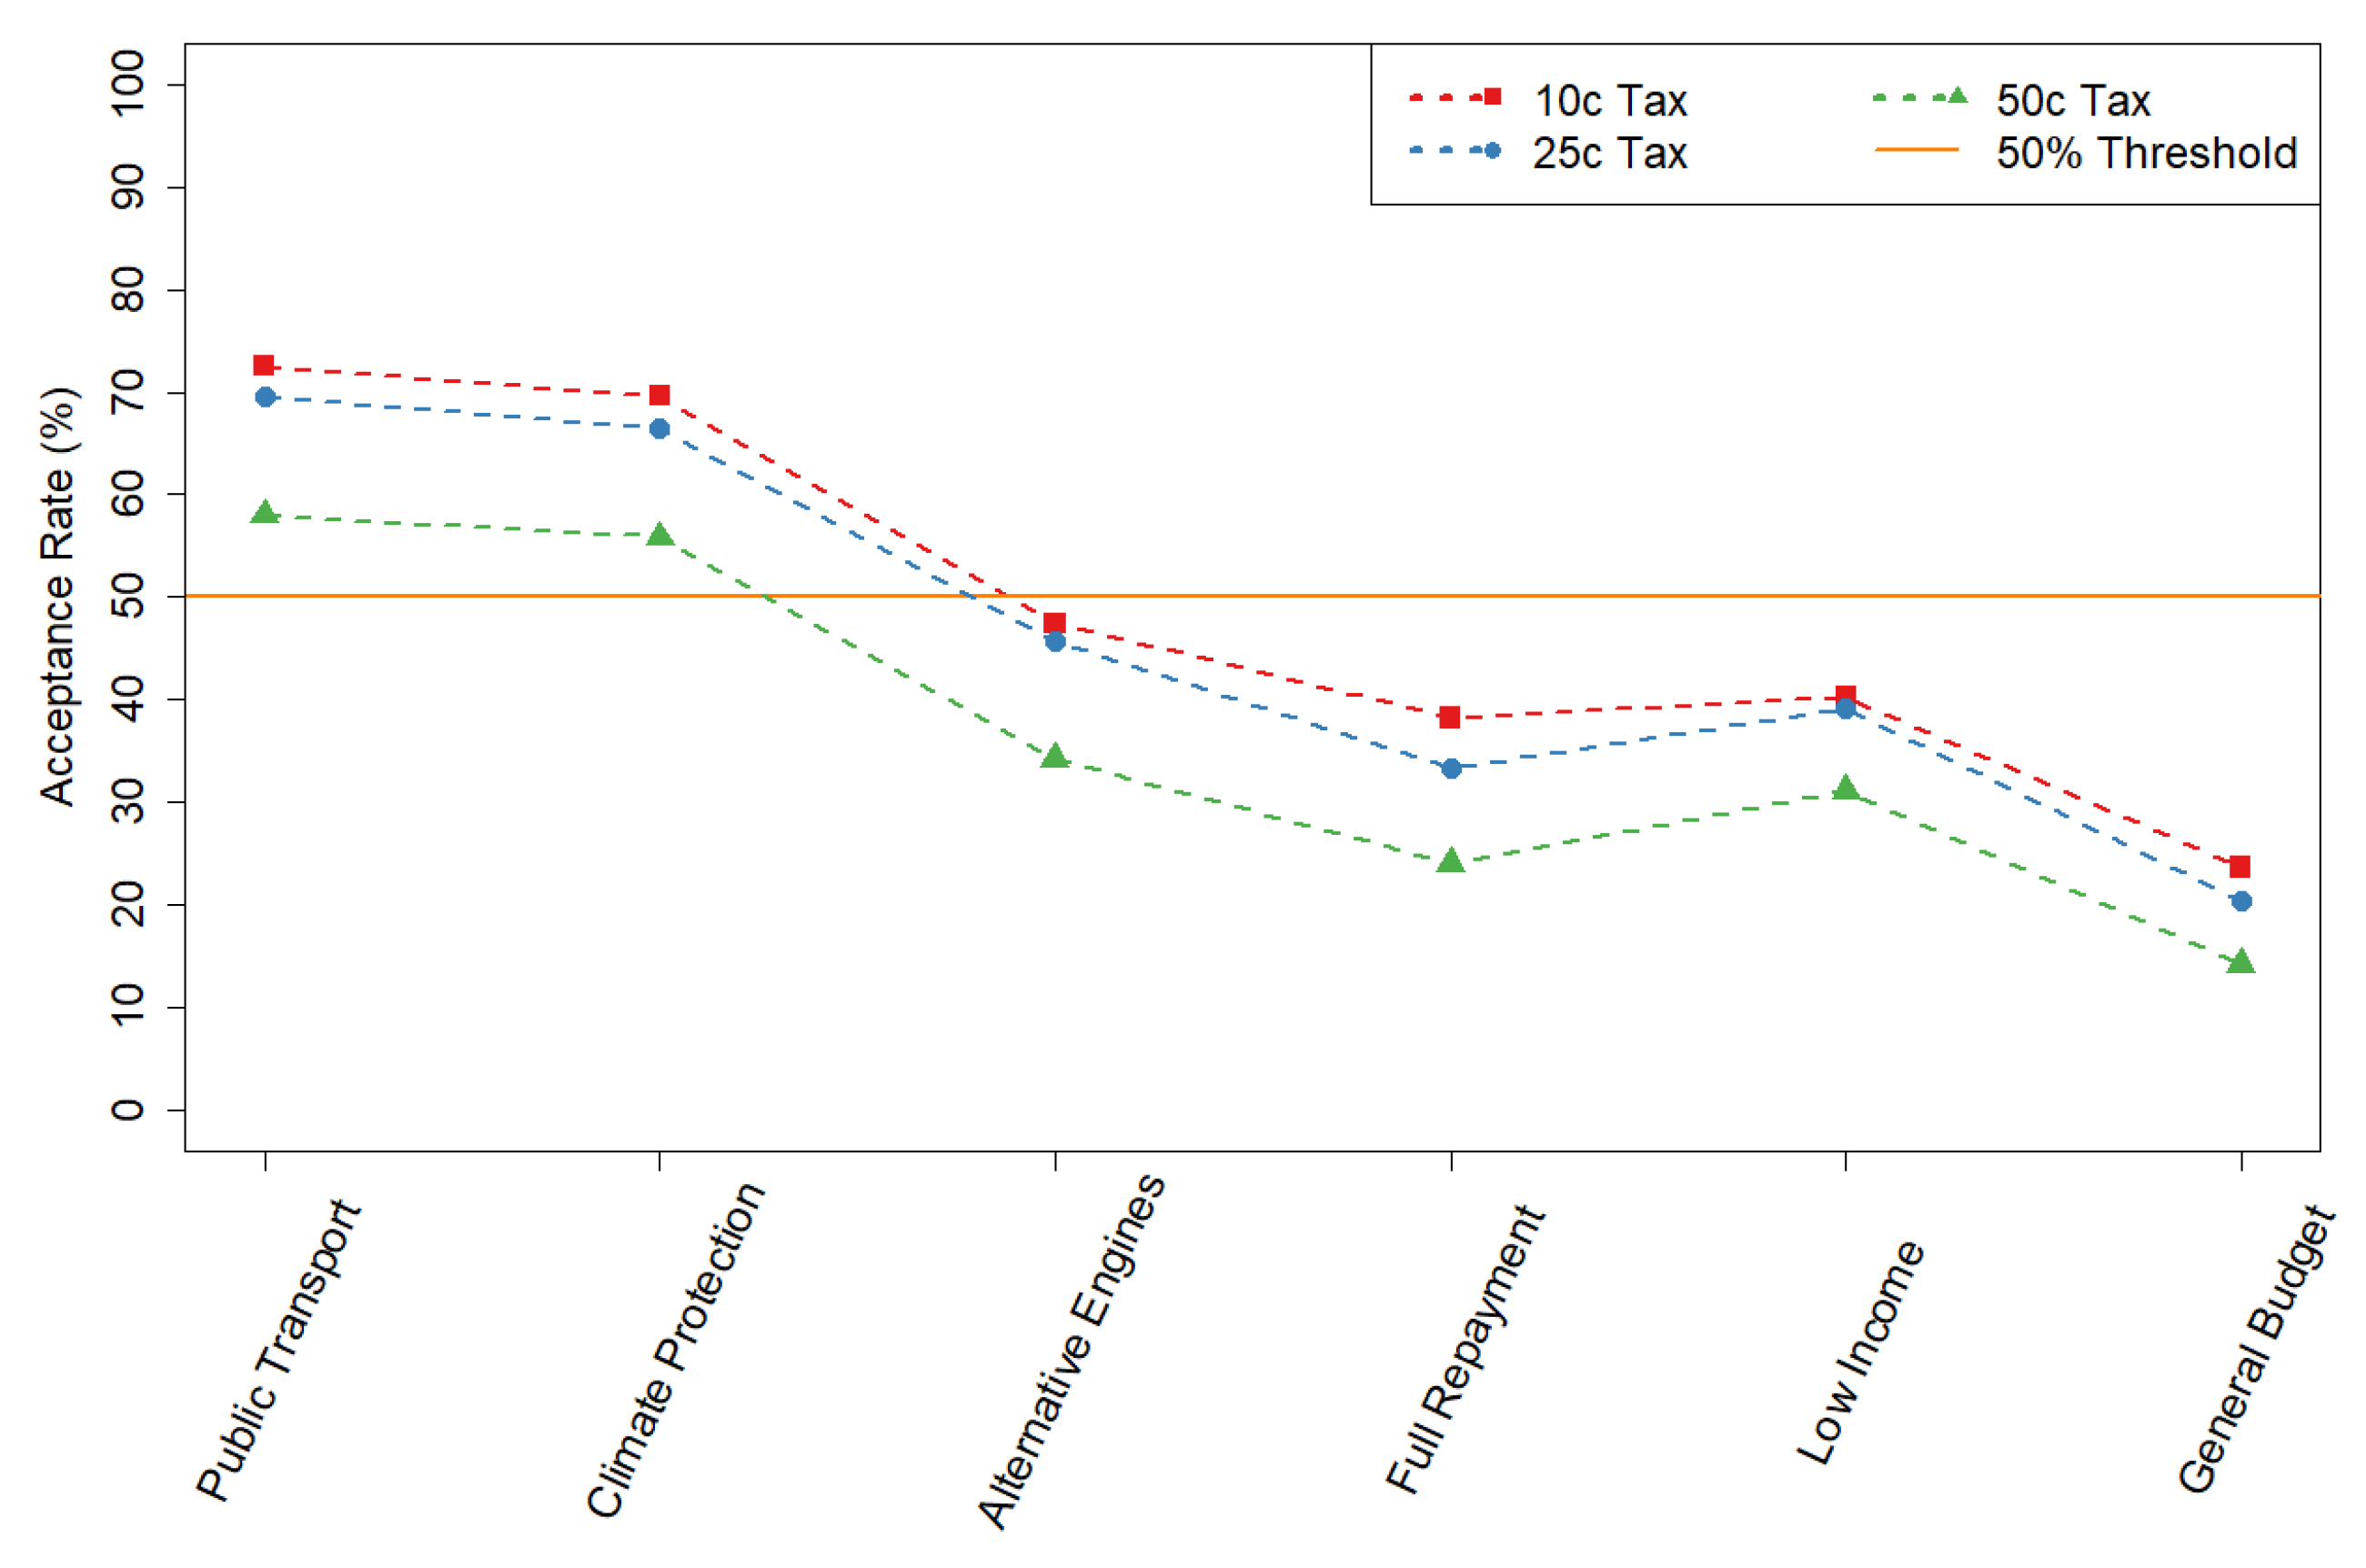
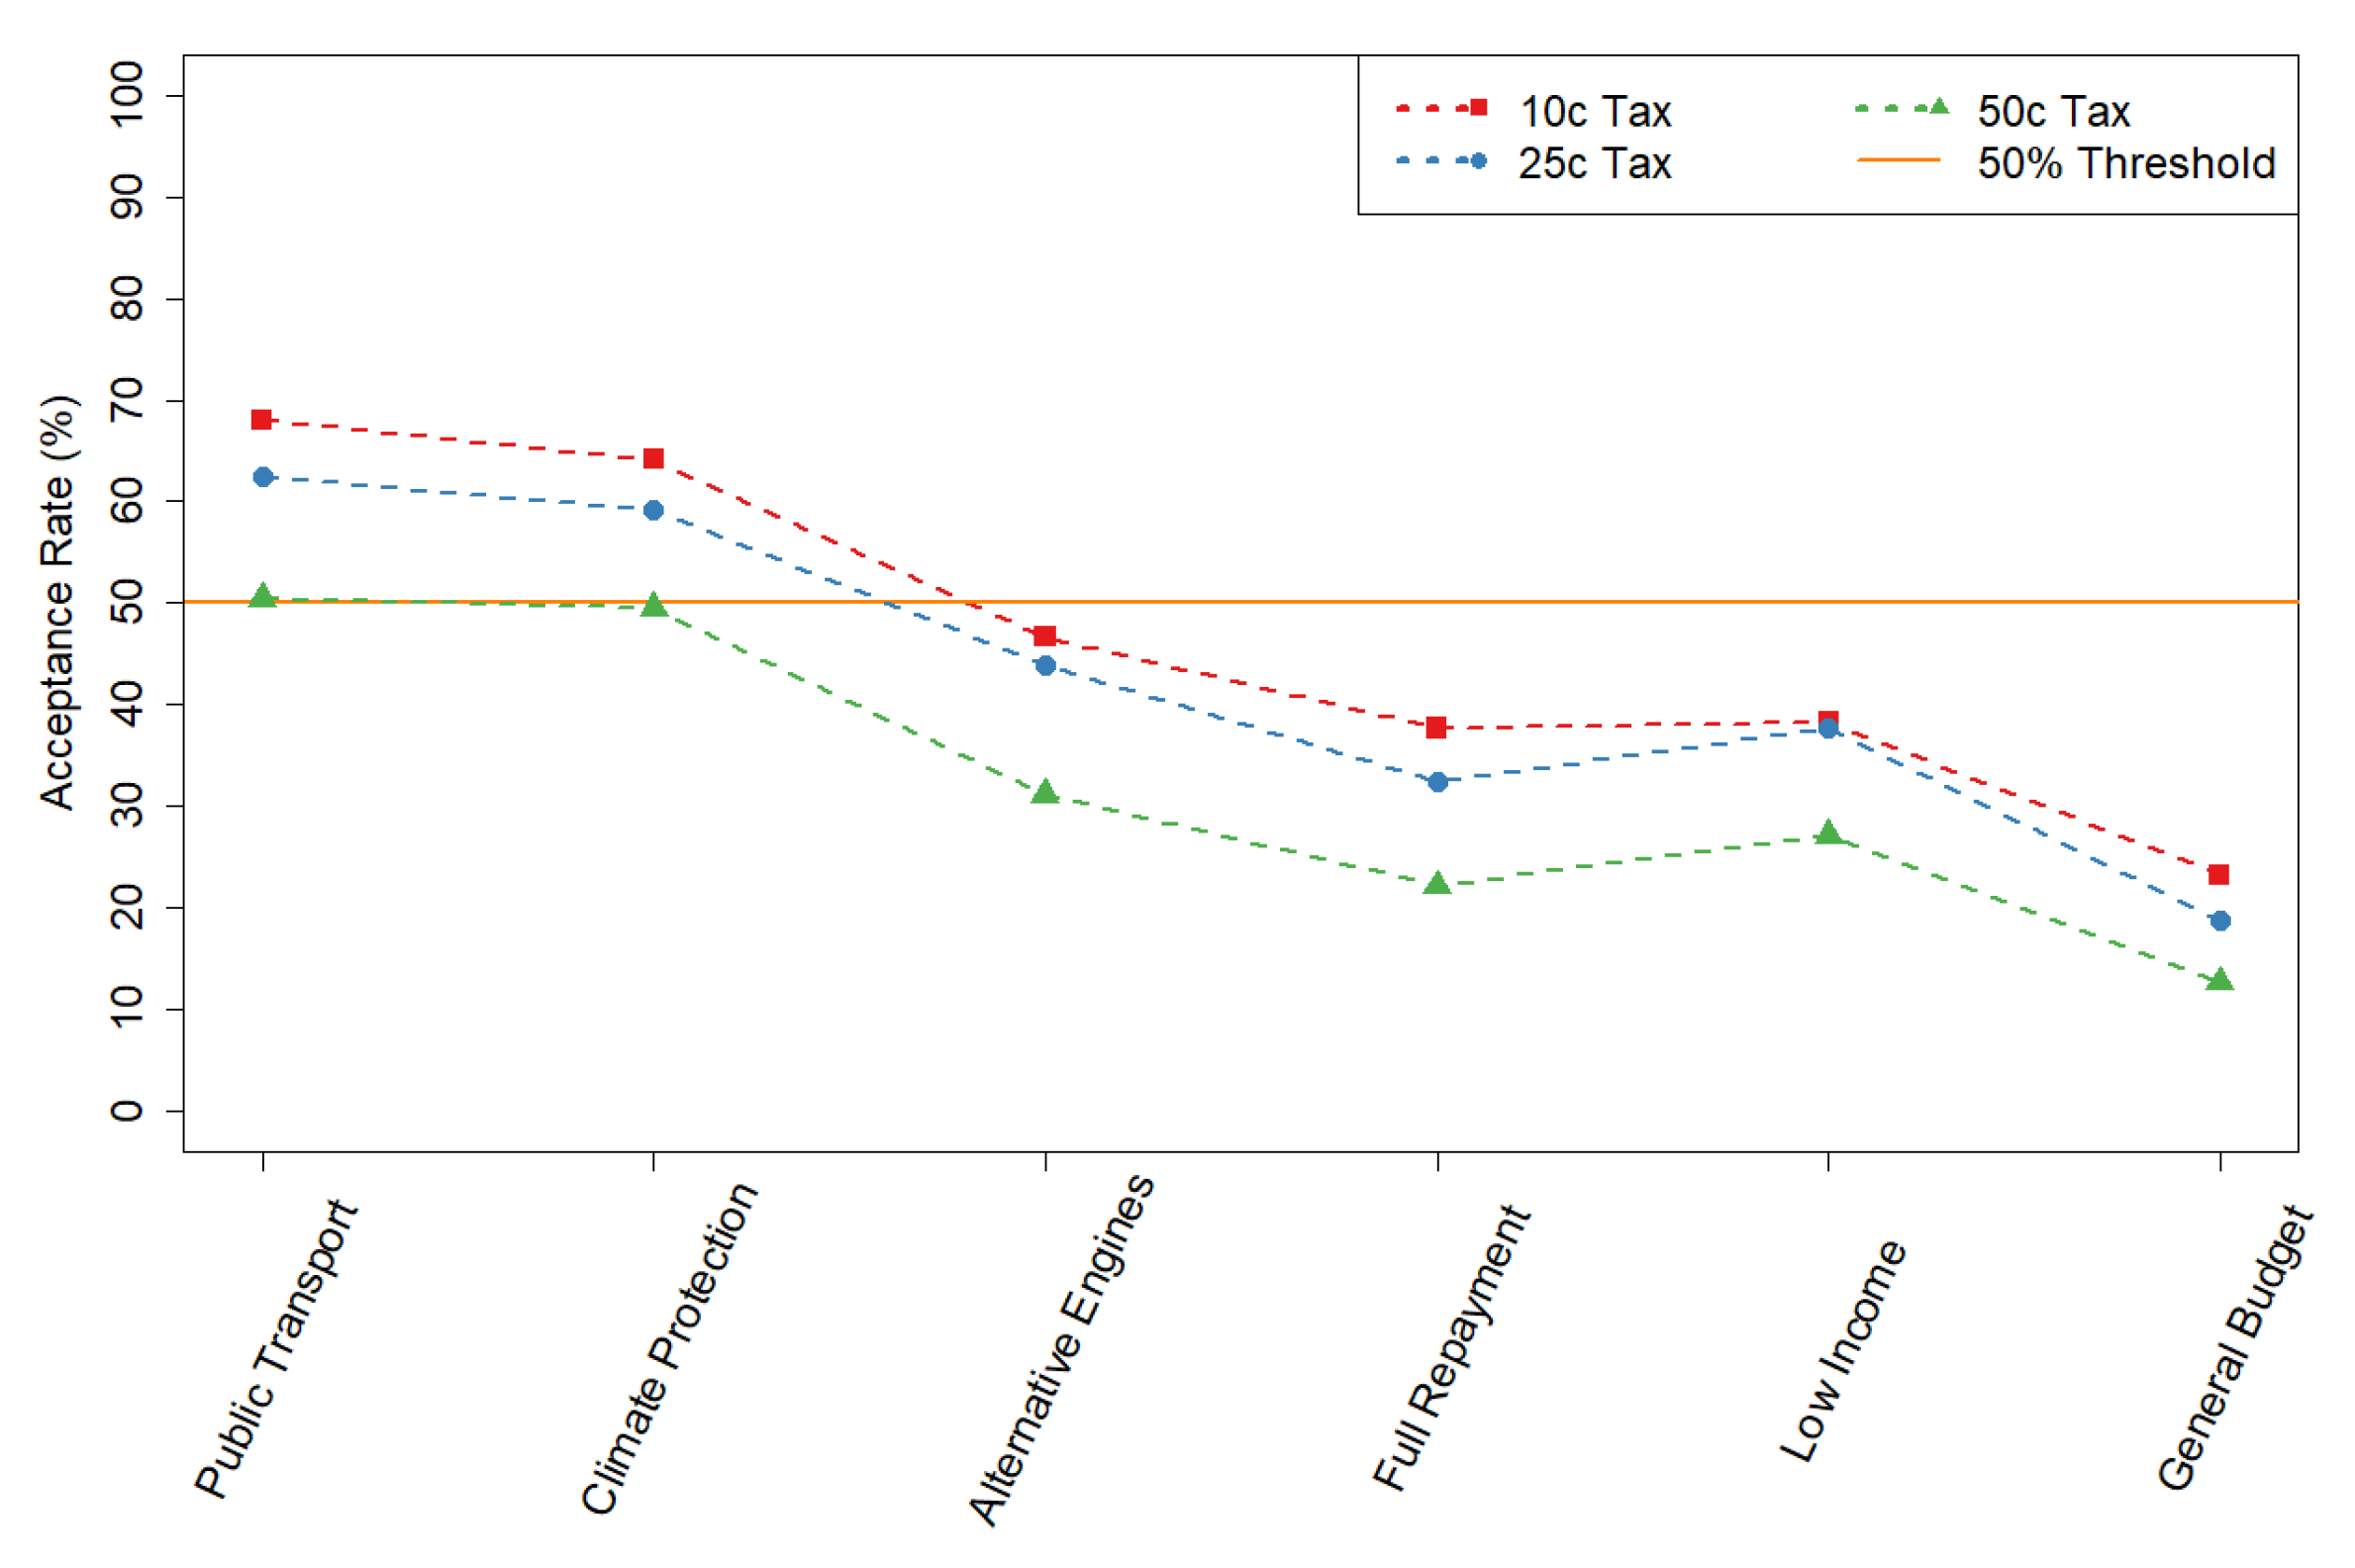
Figure 5 displays the acceptance rates (Y-axis) for various combinations of earmarking strategies (X-axis) and tax rates for the exemplary lump-sum payment of EUR 100. (For the sake of clarity, only the most popular case with EUR 100 lump-sum payments is shown in the main text. Figure A3 in the Appendix A displays the acceptance rates of all lump-sum payment levels). This allowed us to assess which combinations were able to secure a majority. When estimates lay above the 50% threshold line, the reform combination was accepted by the majority of our sample; otherwise, it was rejected. To facilitate comparability, the point estimates associated with each tax rate are connected with a dashed line, offering a clear view of the policy measures’ performance. Note, this does not imply any interdependence between the different earmarking types.
Our estimates reveal a general pattern, where acceptance rates varied greatly between the respective tax reform combinations. For example, an acceptance rate can drop from over 70% to about 25%, if ceteris paribus, earmarking is changed from public transport to general budget. Further, earmarking strategies for public transport and climate protection consistently achieved the highest acceptance rates and were the only surveyed strategies that could achieve majorities. This lack of majority capability also applied to the fully re-distributive approach (i.e., full repayment and transfers to low-income households). For all combinations, acceptance rates decreased monotonically with increasing tax rates, in part because tax increases of 0€-cent were not considered here, since they do not allow financing of lump-sum payments or other earmarking options.
The tax reforms that were able to gain the highest possible acceptance rates involved tax increases of 10 to 25 EUR-cent, with the funds allocated to public transport or climate protection and lump-sum payments capped at a maximum of EUR 150. Another way of approaching the findings is to look for the highest carbon tax increase that can be made politically feasible by recycling tax revenues accordingly. A carbon tax up to 50 EUR-cent per liter of fuel might be feasible when repaying EUR 0 to EUR 150 annually and earmarking surplus revenues to subsidizing public transport or climate protecting measures. Increases of up to 25 EUR-cents were even supported by 70% of our sample given appropriate revenue use.
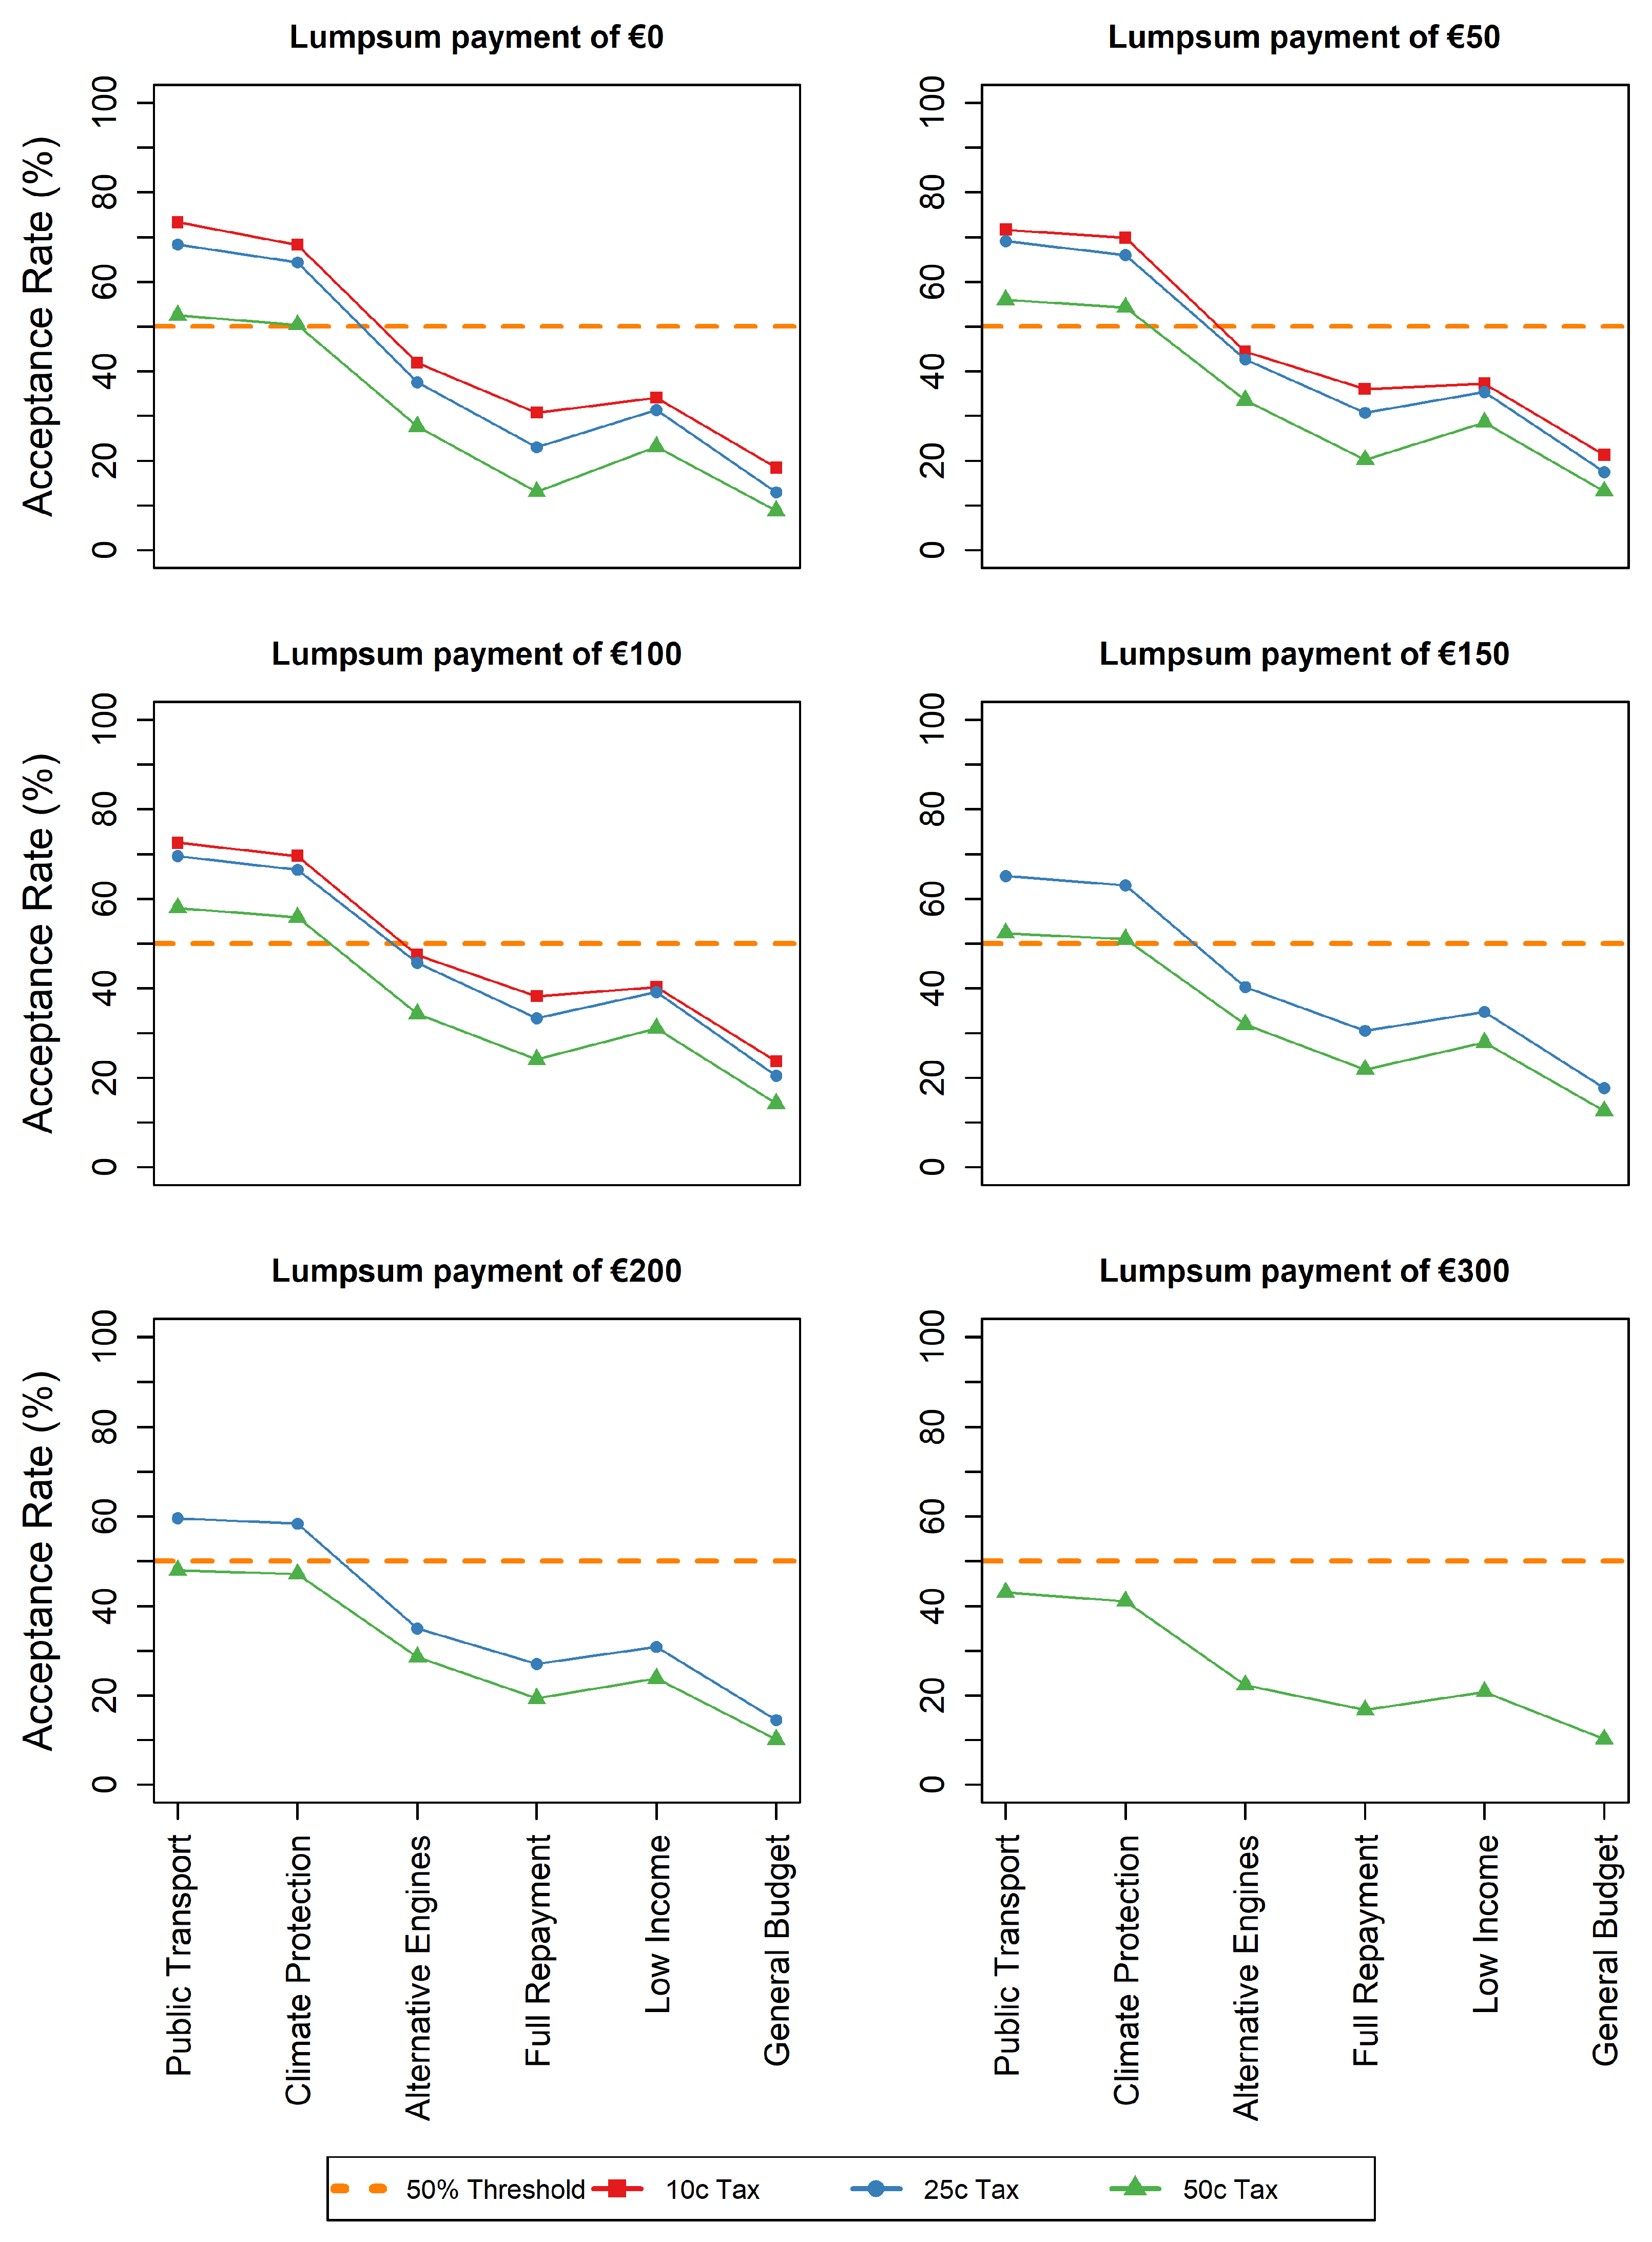
The comparison of acceptance rates of all lump-sum payments (see Figure A3 in Appendix A) reveals that the support increased if transfers rose from EUR 0 to EUR 100 and decreased afterwards. After reaching EUR 300, even earmarking for public transport and climate protection failed to attain substantial approval. Furthermore, tax rates of 75 EUR-cent or more did not achieve a majority for any of the possible combinations.

5. Discussion

5.1. Robustness

The literature suggests that support for environmental measures might be higher among younger [18,29] and more educated [58,59] individuals. As in our sample these groups were over-represented, sample weighting was performed to assess the robustness of our findings.
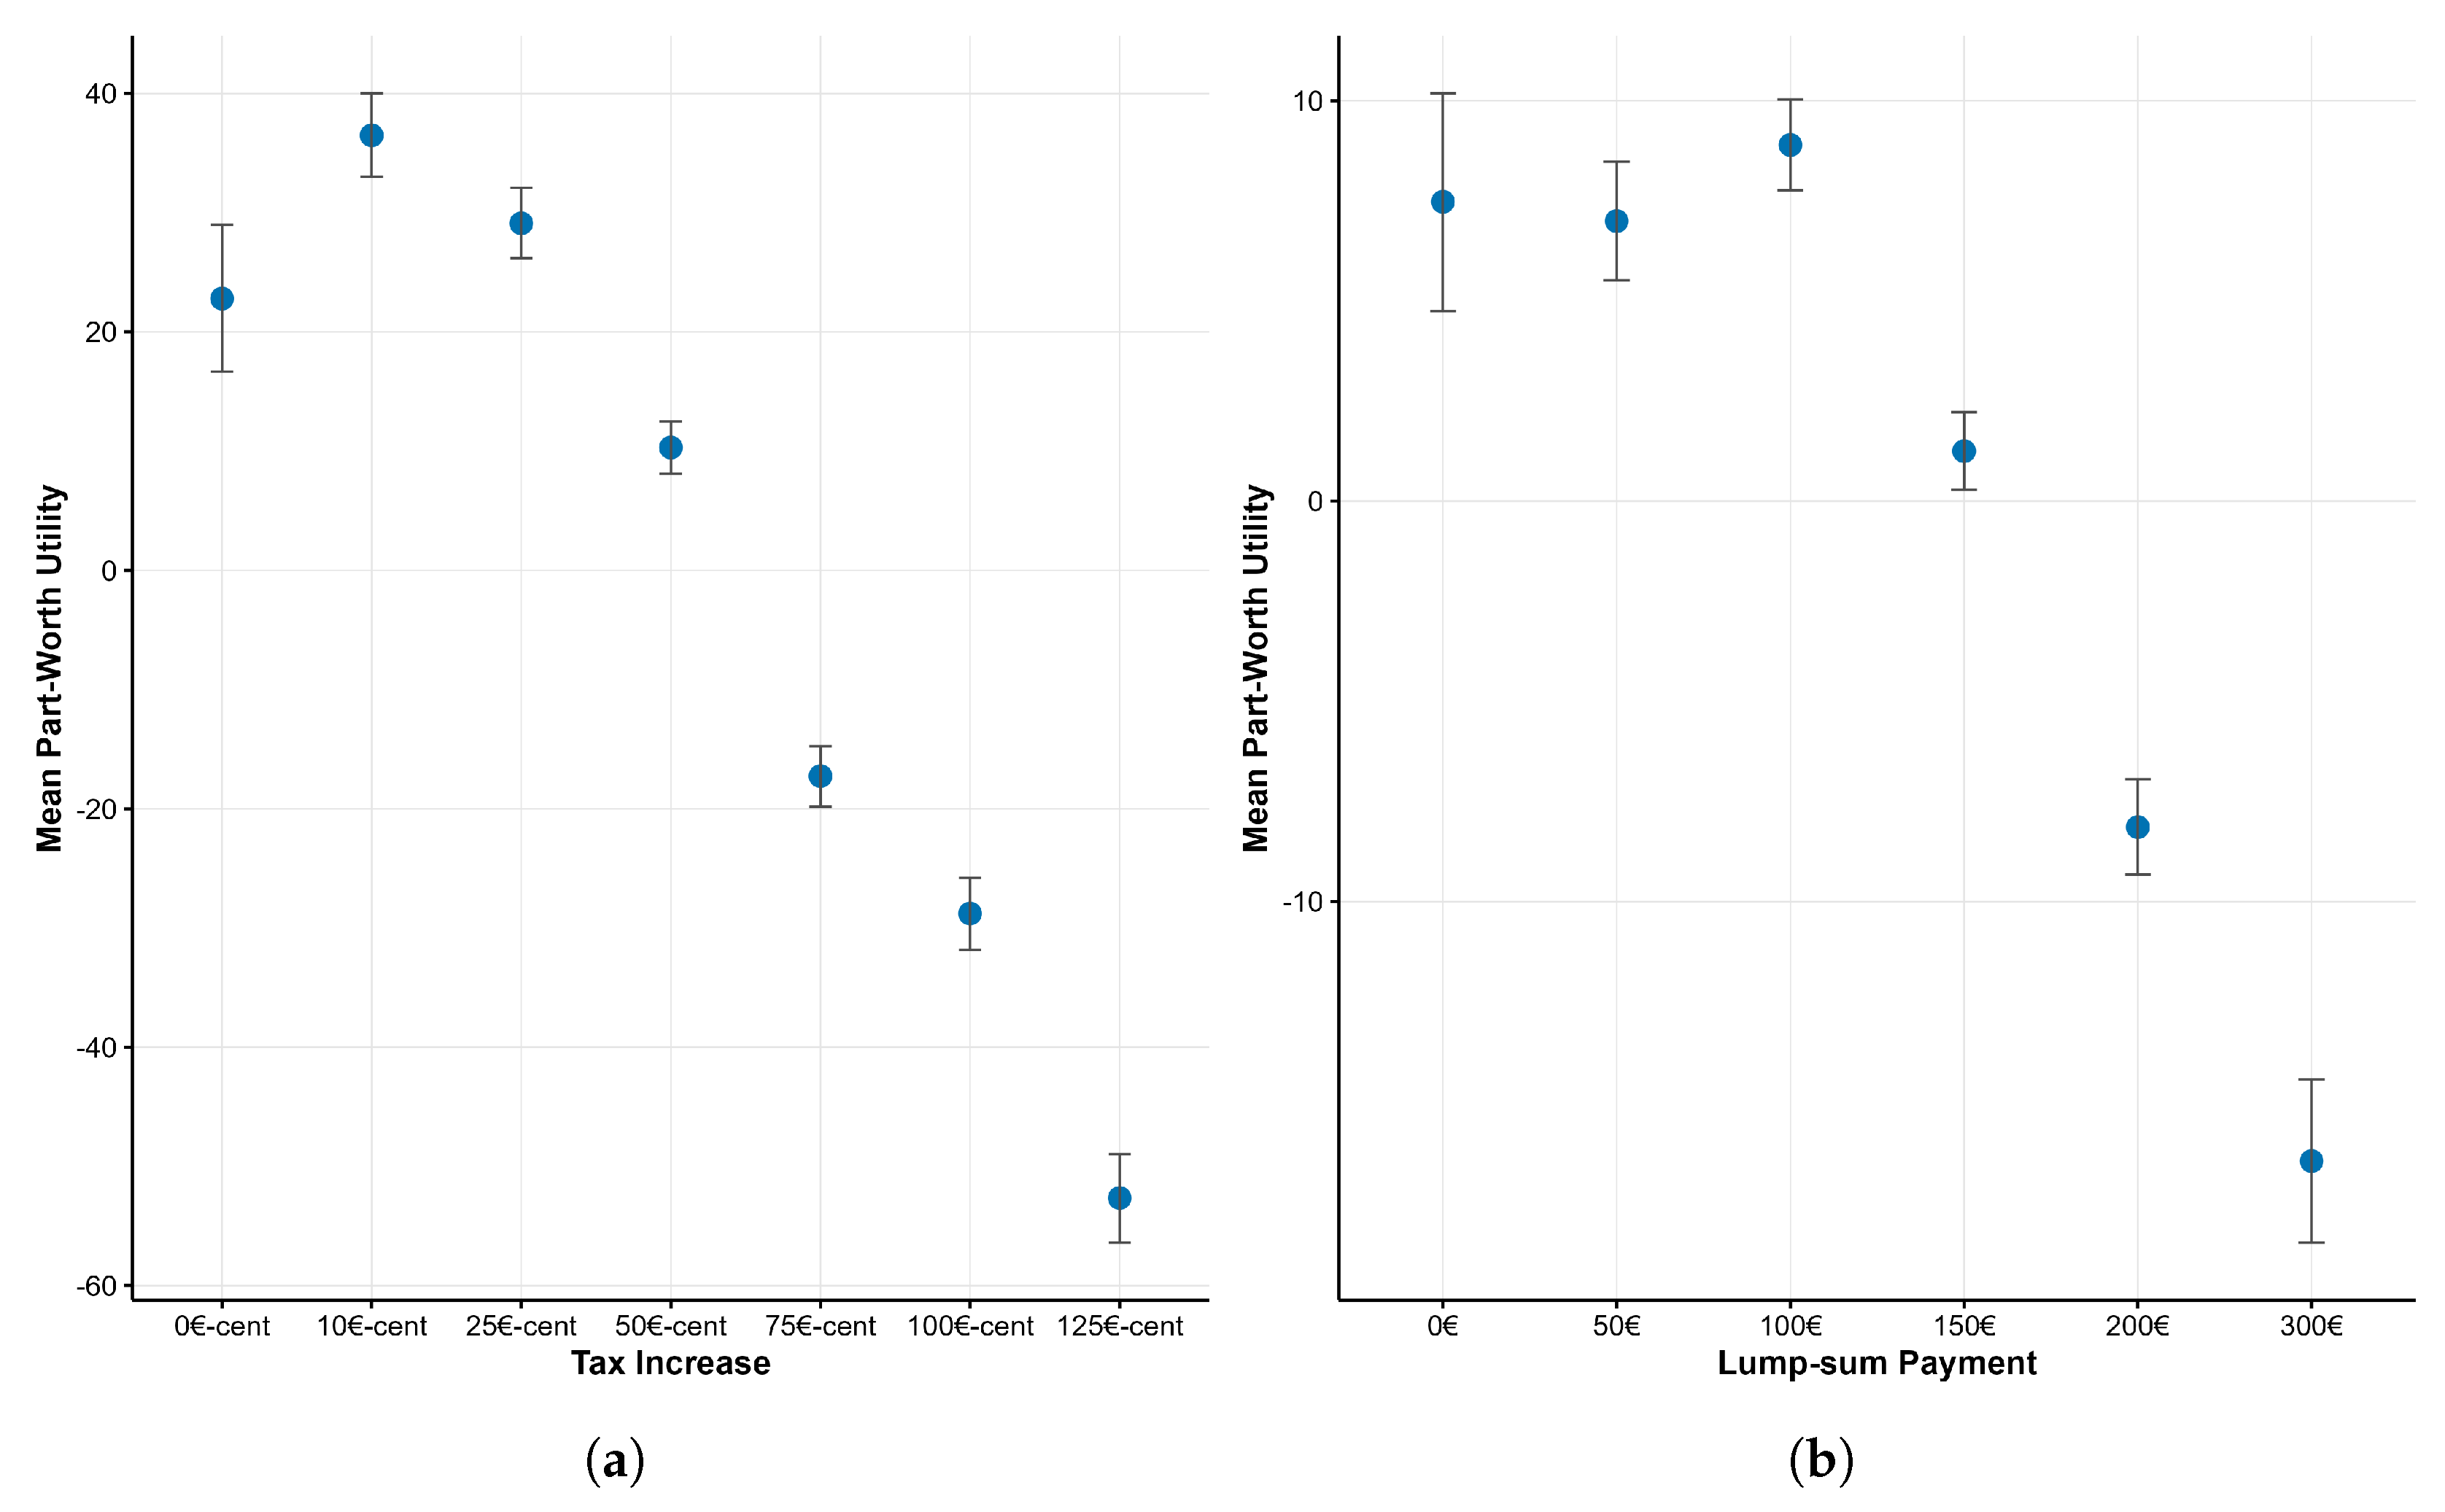
First, how the sample weightings influenced the conclusions about non-monotonic preferences was tested. Figure 6 shows the weighted means of the part-worth utilities for all levels of the attributes Tax level and Lump-sum payment, with bootstrapped 95% confidence intervals.
The preferences for tax levels were still non-monotonic, with the highest weighted mean part-worth utilities for a tax increase of 10 EUR-cents. Part-worth utilities declined when the tax was increased by more than that, especially for increases of 75 EUR-cent or more. This matches the trend that was observed for the unweighted data.
For the most part, the weighted mean part-worth utilities for lump-sum payments exhibited trends similar to those observed in the unweighted estimates. In particular, higher lump-sum payment amounts were valued significantly less than lower amounts, even after applying sample weights. It is worth noting that the weighted mean part-worth utilities for EUR 0 and EUR 100 rebates were not statistically different, whereas this distinction was present in the unweighted estimates. Given that many applications assume monotonically increasing preferences for rebate amounts, both the weighted and unweighted results provide evidence that challenges this assumption.
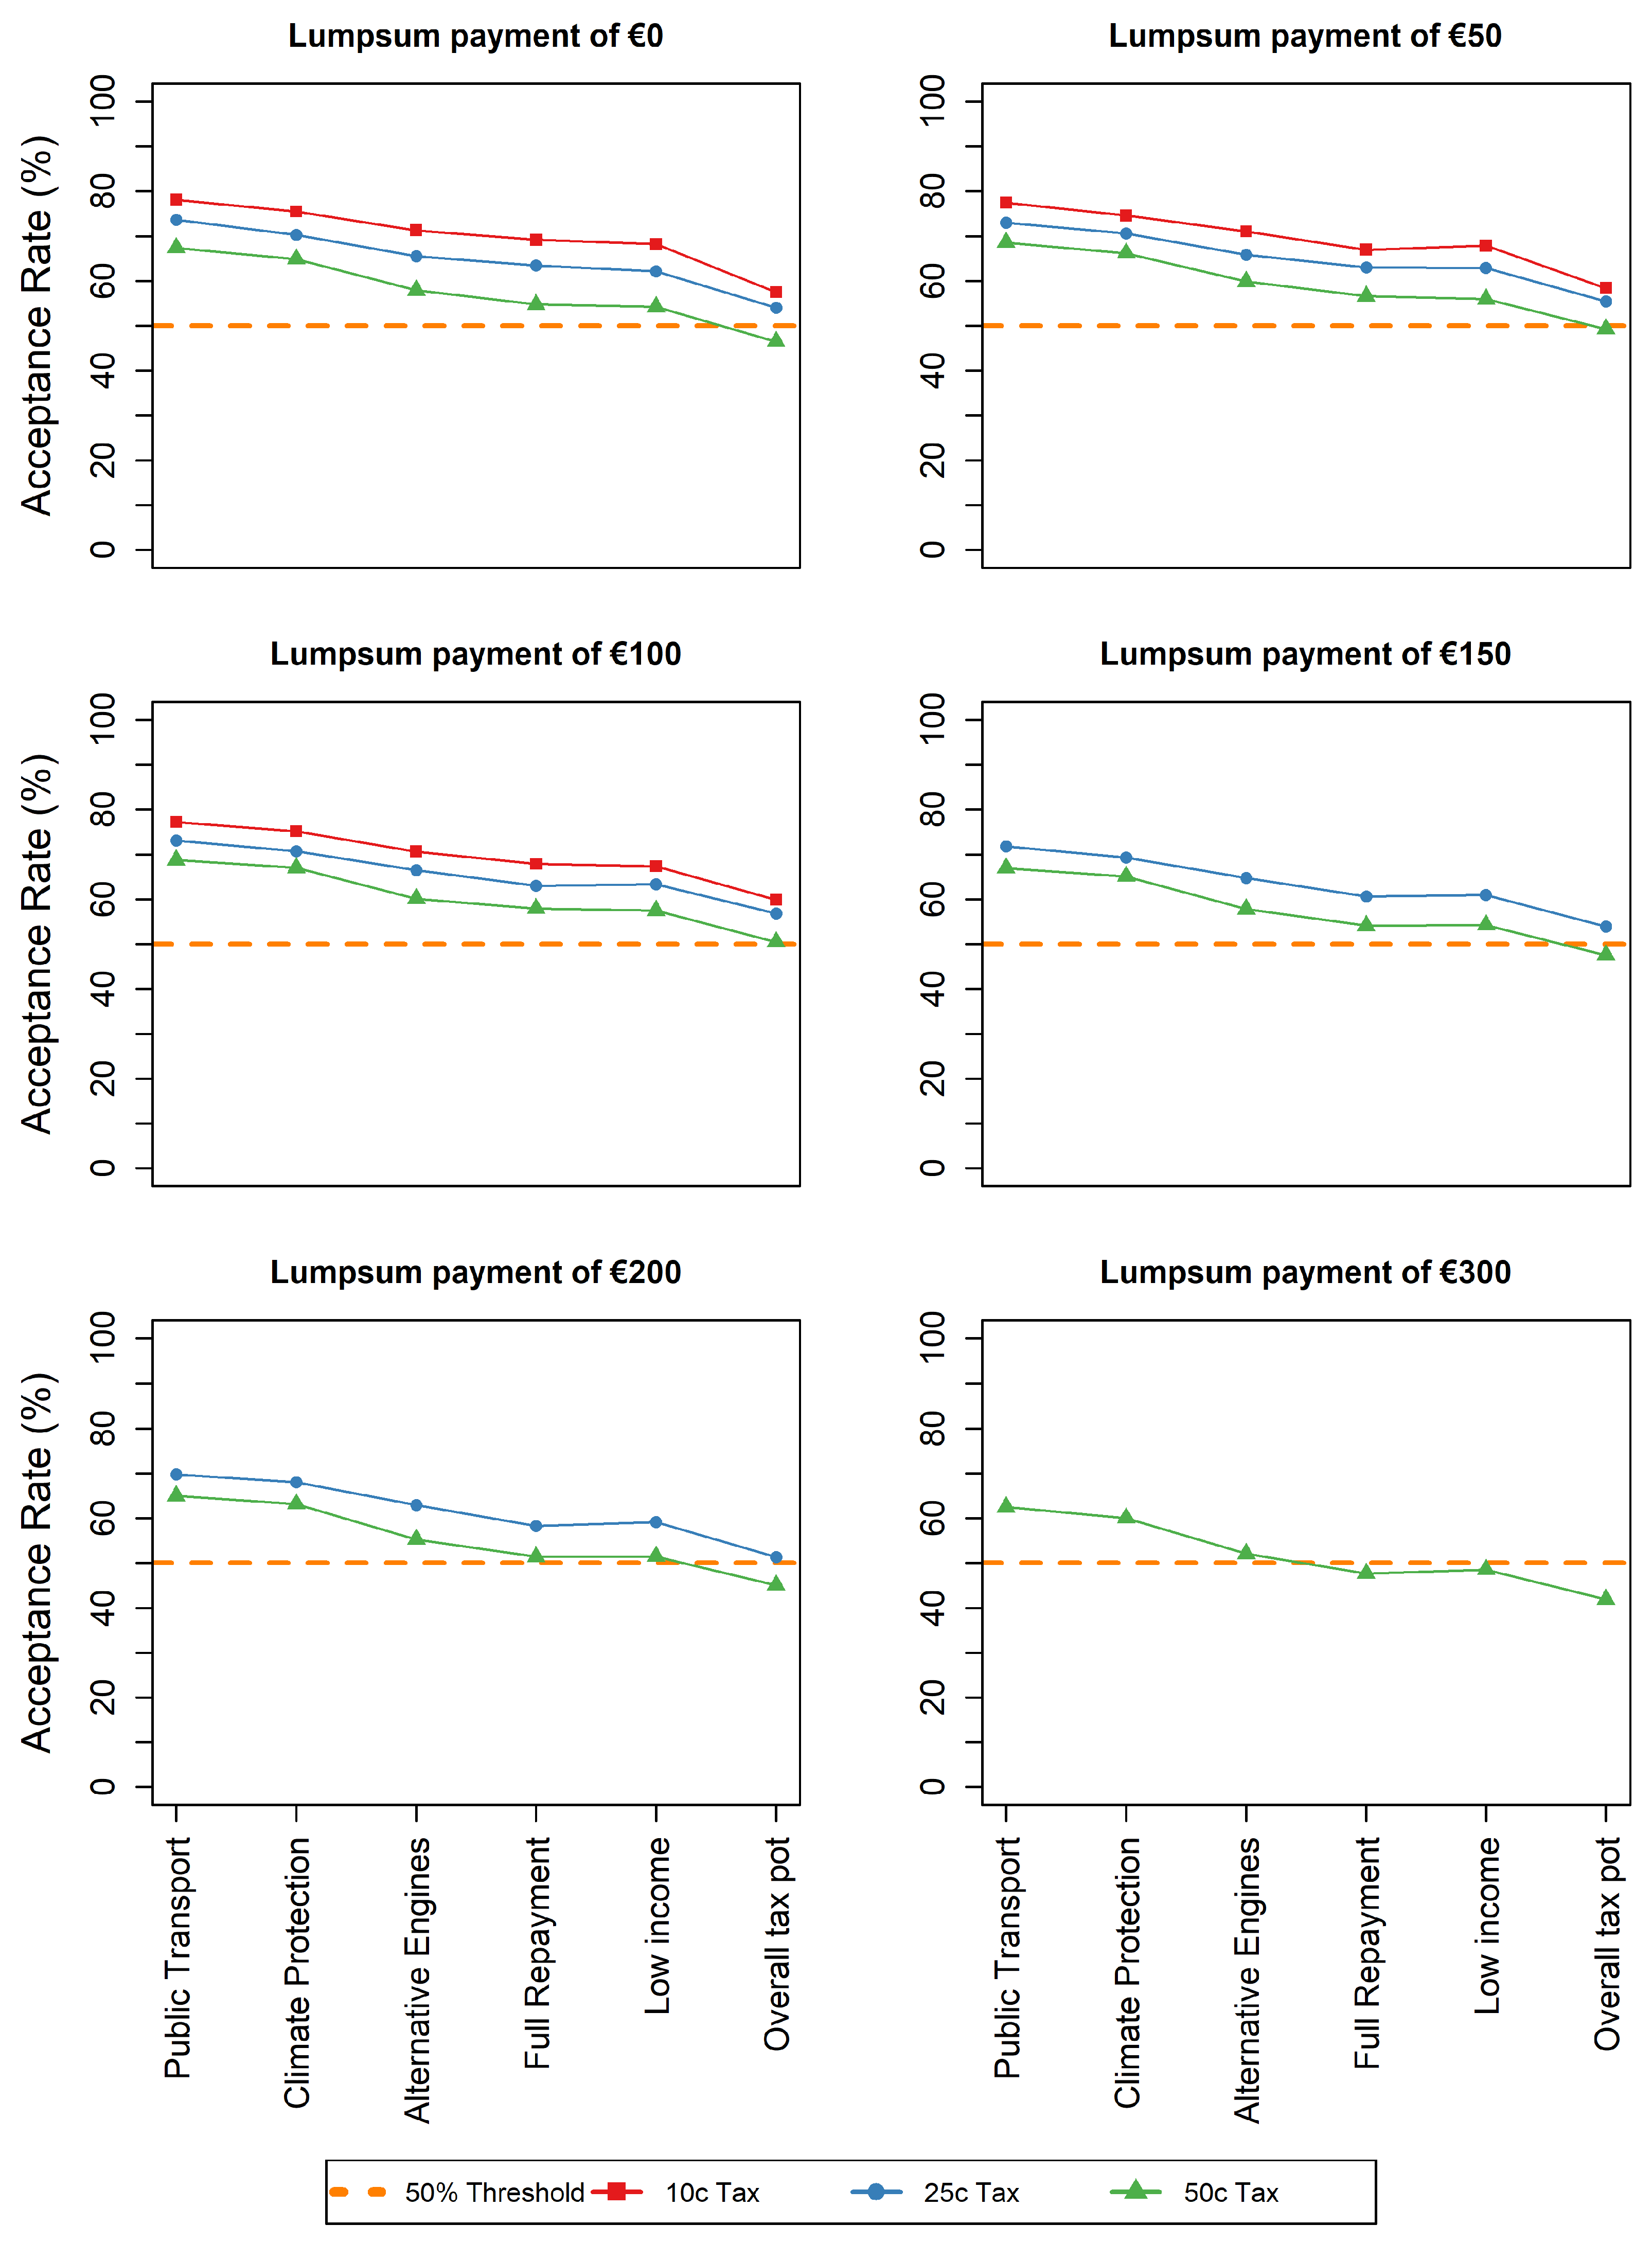
Next, the stability of the estimated acceptance rates with respect to the sample weighting was tested, as shown in Figure 7 for lump-sum payments of EUR 100 (To assure completeness, the graphs for all other lump-sum payment levels are added in the Appendix A in Figure A4). Acceptance for tax increases of 50 EUR-cents dropped to approximately 50% under optimal revenue recycling, raising concerns that, in a real voting environment, majority support might no longer be sustained. More moderate increases of 10 EUR-cents or 25 EUR-cents, however, still received more than 60% support. Although weighting did influence acceptance rates, possibly leading to the endorsement of a policy measure below the threshold of majority support, it was observed that policy bundles that enjoyed decisive majority support prior to weighting maintained approval, even after the application of weights. This specifically applied to increases up to 25 EUR-cents per liter of fuel if no more than EUR 150 were refunded via lump-sum payments and the remaining tax revenue was used to subsidize public transportation or for climate protection measures. Additionally, those proposals that were not acceptable to a majority of respondents pre-weighting, remained below the 50% threshold.

5.2. Empirical Implications

In this study, carbon tax acceptance was examined by applying HB modeling to data of an ACBC. Methodologically, the focus lay on two core concepts: First, the assumption of monotonicity and second, the heterogeneity of preferences.
First, given the extensive literature on environmental preferences [61], it is reasonable to assume that an individual’s utility is influenced by the emission abatement that is associated with a carbon tax [24]. Since abatement increases with the tax rate [62,63], and abatement contributes positively to utility, this component of utility is likely to increase with the tax rate. However, higher taxes also impose greater costs on individuals, which negatively affect utility. The interplay of these opposing effects implies that individuals may prefer higher tax rates up to a certain point, beyond which the disutility from cost outweighs the utility from abatement. Consequently, utility may not be monotonically decreasing for tax rates, a common assumption in many applications [22,23]. The results of this study provide empirical support for this argument, as not increasing the tax was found to be significantly less popular than a moderate increase of 10 EUR-cents per liter.
To investigate non-monotonic preferences for lump-sum repayments, a dedicated attribute was introduced. This allowed showing that acceptance increased with moderate repayments, but declined when too much was refunded, directly contradicting the assumption of monotonically increasing utility in repayments, as used, for instance, by Hammerle et al. [21]. The literature often includes lump-sum payments as a single level within the earmarking attribute [31,34,36], effectively assuming that all tax revenue is redistributed in this way. Our findings demonstrate that this approach is suboptimal for maximizing public acceptance. By re-distributing only part of the revenue as lump-sum payments and allocating the rest to other purposes, both public acceptance and governmental spending efficiency can be improved.
A possible explanation for the decline in acceptance at high repayment levels is the trade-off between lump-sum payments and other earmarking strategies. Every euro returned through repayments cannot be allocated to secondary uses such as improving public transport or investing in climate protection, both of which may have broader societal appeal as our results show. Correspondingly, respondents may perceive excessive repayments as a missed opportunity for collective benefit, especially if they value systemic improvements over individual compensation.
These patterns were robust across multiple analytical approaches: First, in the BYO setting, where preferences were expressed separately for each attribute. Second, in the estimation of mean part-worth utilities, which accounted for the trade-offs between attributes. And third, in the estimation of acceptance rates, which dropped significantly at high repayment levels. These consistent results, which remained even after the application of weights, provide strong empirical evidence for non-monotonic utility in repayments.
Second, estimating individual-level part-worth utilities revealed strong preference heterogeneity across all three attributes. While this may not significantly affect estimates of mean part-worth utilities, it can bias population-level acceptance predictions. This is because, in a voting-like decision context, outcomes depend on the distribution of preferences, not just their average, since each individual’s choice carries equal weight. Previous literature tackled this by running mixed logit models, for instance. However, with some exceptions [26], most applications using mixed logit models focused on the determinants of acceptance rather than estimating acceptance shares [21,34]. We believe that both tasks are equally important, and that reliable estimates of acceptance shares can deliver a useful input for policy makers.

5.3. Policy Implications

Our study shows that a carbon tax increase of up to 25 EUR-cents per liter was broadly accepted in Austria, while support for a 50 EUR-cent increase was more uncertain and may hover around the threshold of majority approval. This required that tax revenues were earmarked for public transport or climate protection measures and that lump-sum payments did not exceed EUR 150.
In general, earmarking strategies aiming to mitigate climate change were more effective in gaining public acceptance than those aiming to reduce regressive effects. These findings are consistent with previous literature [18,26,28,35], and are illustrated by the comparatively low attribute importance of lump-sum payments and the lower acceptance rates when including the earmarking option full repayment or transfers to low-income households. It should be noted that the policy designs included in our experiment in which funds flowed directly into the general budget were, in accordance with past literature, particularly unpopular [57,64,65]. According to our findings, transfers to low-income households, a recycling scheme with mixed success in the literature [35], also did not contribute relevantly to public acceptance of a carbon tax. This might have been a consequence of our ACBC design, because a standalone attribute was given to lump-sum payments, which could already have alleviated some of the distributional concerns with respect to the tax.
For a tax increase of 25 EUR-cents, which according to the findings should be broadly accepted, a 9% CO2-reduction in the transport sector is expected (see Figure 1). If policymakers choose the most popular lump-sum payment of EUR 100 annually, EUR 146 per adult per year remain for other earmarking purposes like public transport or climate protection measures. Using these revenues to subsidize mitigation policies, CO2 could be further reduced.
Carbon prices are often presented on the scale of Euro per tonne of CO2 equivalent (€/tCO2e), as this enables comparisons across different pollutants. Translating a 25 EUR-cents increase into that scale, and using estimates by the United States Environmental Protection Agency [66] of an average pollution of 2.69 kg CO2 per liter of diesel and 2.35 kg per liter of gasoline, results in 95.70€/tCO2e or 109.62€/tCO2e. To put this into perspective, as of August 2025, only five countries worldwide (Uruguay, Sweden, Liechtenstein, Switzerland, and Norway) have implemented CO2 tax levels higher than that, in part with coverage below 20% [67].
These findings carry important implications for sustainability, across its environmental and social dimensions. First, the environmental dimension is clearly supported: our results show that carbon tax increases capable of significantly reducing emissions, up to an estimated 9% in the transport sector, can still achieve broad public support when properly designed. This underlines the potential of carbon taxation as an effective environmental tool. Second, the combination of modest rebates and earmarked spending on public transport highlights a policy design that also promotes social sustainability by addressing equity concerns, while enhancing mobility and access.
Recent studies have emphasized that increasing public awareness of the effectiveness of carbon taxes and of the details of revenue recycling can significantly increase acceptance [57,68,69,70]. Carattini et al. [68], for instance, showed that a well-designed communication strategy is important in order to reduce information asymmetries in relation to high personal costs, tax regressivity, or adverse effects on the economy. This is particularly important in settings where revenue recycling is not specified [71], and remains relevant even after the implementation of taxing schemes, as Mildenberger et al. [12] observed in the cases of Canada and Switzerland, two countries that have already implemented carbon dividends. There, public awareness about revenue recycling remains low with respect to both the existence of rebates and the amounts returned. It is, hence, crucial that information on the tax reform design is made easily accessible to society, so that the benefits and costs are clearly understood, and that people are made aware if acceptance-increasing instruments such as revenue recycling are implemented.
In designing the survey, these insights were incorporated from the literature by emphasizing transparency in the presentation of policy instruments. Specifically, a mineral oil tax was chosen over a carbon tax, as the former is more tangible and easier for respondents to grasp. Information was also provided on the expected abatement effects and the projected revenues associated with each tax proposal. While informing survey participants is inherently less complex than communicating with the broader public, effective communication strategies remain crucial instruments for increasing acceptance.
While our analysis offers valuable insights, there are some limitations that should be considered when interpreting the results.
The most obvious limitation is the lack of representativity in our sample. Through the application of weights, some idea was gained about how severely this might have influenced the results. While this procedure was undoubtedly helpful, it could not correct for sampling inconsistencies that were not directly reflected in the characteristics used for weighting. This could include unobserved differences in political attitudes, environmental concerns, or tax-related beliefs that vary systematically between the sample and the broader population, but were not captured by the weighting variables. Given that the sample was distributed by students, it is likely that their networks exhibit, to some extend, similar norms and beliefs, meaning that results might be biased and reflect a specific segment of the Austrian society. This calls for caution when interpreting our acceptance rate estimates. As such, the apparent majority support for a 50 EUR-cent increase should be regarded as suggestive evidence rather than a definitive conclusion, and instead the more robust finding of support for a 25 EUR-cent increase should be emphasized. At the same time, it is unlikely that the main methodological claims, particularly those concerning preference heterogeneity and non-monotonicity, were severely affected.
It is important to note that the data for this study were collected in 2022, during a period shaped by multiple global disruptions, including the COVID-19 pandemic and the onset of the Russia–Ukraine conflict. These events contributed to increased economic uncertainty and rising energy prices, which may have had temporary, as well as lasting, impacts on respondents’ preferences. While the core insights regarding preference structures and revenue recycling strategies remain relevant, the specific levels of public support observed should be interpreted in light of these contextual factors.
Although respondents were carefully provided with detailed information to help them make informed decisions and minimize potential biases, the stated preference design inevitably carries limitations related to hypothetical bias [72] and social desirability bias [73].

6. Conclusions

This study highlights the critical importance of accounting for non-monotonic public preferences when evaluating support for carbon pricing policies. Using hierarchical Bayesian estimation applied to adaptive choice-based conjoint data, a methodological framework is demonstrated that is capable of simultaneously comparing multiple policy scenarios, while capturing complex, non-linear preference structures at the individual level. This approach enables a more nuanced understanding of what drives public acceptance and how design features influence the political viability of carbon taxation, providing relevant takeaways for both policy makers and researchers.
Given that rebates may be capped at a certain threshold while maximizing acceptance, policy makers can improve governmental spending efficiency by using the remaining tax income to support public transportation, for instance. Further, the results may be useful for policy makers aiming to implement mineral oil taxes at higher levels. Substantial fuel tax increases of 25 EUR-cent per liter can gain majority support, provided specific conditions are met. In particular, acceptance hinges on revenue recycling strategies: the most favored option combined an annual lump-sum payment of EUR 100 to all adults with earmarking of surplus revenues for public transportation or climate protection.
Contrary to the common (often implicit) assumption that lower taxes and higher rebates increase public support, our results provide robust evidence for non-monotonic preferences with respect to both tax levels and rebate amounts. Support increased initially, peaked, and then declined as both parameters continued to rise. Especially for rebates, the literature has not yet focused on potential non-monotonicities, nor has it extensively discussed their relationship to other earmarking strategies. These dynamics underline the necessity of carefully designed empirical studies that can account for such patterns, to accurately assess the political feasibility of ambitious climate policies. In the case of lump-sum payments, this can be achieved by devoting a standalone attribute to them in a choice modeling framework.
Since the main shortcoming of this study is its lack of sample representativity, future research should extend it to a representative stratified population sample that is less connected to universities or large cities, ideally including multiple countries. Given that acceptance was maximized through a combination of rebates and earmarking, further interesting research questions arise that warrant testing more formally: Should revenues be used for a single revenue recycling approach, or is a (weighted) combination of approaches more accepted? And if so, which combinations would be most promising?

Supplementary Materials

The following supporting information can be downloaded at https://www.mdpi.com/article/10.3390/su17167282/s1, Pdf versions of the survey and its English translation.

Author Contributions

Conceptualization, F.F.M., F.B. and G.T.; methodology, F.F.M. and J.W.; software, F.F.M.; formal analysis, F.F.M. and J.W.; data curation, F.F.M.; writing—original draft preparation, F.B. and F.F.M.; writing—review and editing, F.B., F.F.M., G.T. and J.W.; visualization, F.F.M.; supervision, G.T. and J.W.; project administration, G.T. All authors have read and agreed to the published version of the manuscript.

Funding

This research received no external funding.

Institutional Review Board Statement

The study was conducted in accordance with the Declaration of Helsinki, and approved by the Board for Ethical Questions in Science of the University of Innsbruck (75/2021, 22 November 2021).

Informed Consent Statement

Informed consent was obtained from all subjects involved in the study.

Data Availability Statement

The original data presented in the study are openly available in FigShare at 11 August 2025, https://doi.org/10.6084/m9.figshare.29517737.

Conflicts of Interest

The authors declare no conflicts of interest.

Abbreviations

The following abbreviations are used in this manuscript:
ACBCAdaptive Choice-Based Conjoint
WTPWillingness-to-pay
DCEDiscrete Choice Experiment
BYOBuilt-Your-Own
MNLMultinomial Logit

Appendix A

Figure A1. Build−Your−Own (BYO). A display of the BYO as it was displayed in the survey. Respondents selected their preferred level of each of the three attributes. Information was provided about the anticipated abatement effect of the tax and the maximum available lump−sum payment, which was based on the tax revenue.
Sustainability 17 07282 g0a1
Figure A2. Screener Example. An example of a Screener as it was displayed in the survey. For each of the six Screeners, respondents decided for each of three proposals whether it was acceptable. Information was provided about the anticipated abatement effect of the tax and the maximum available lump−sum payment, which was based on the tax revenue.
Sustainability 17 07282 g0a2
Figure A3. Mineral oil tax policy acceptance rates. Sample wide acceptance rates for all estimated proposals with tax rates up to EUR 50−cent per liter of fuel. For higher tax rates, not a single proposal surpassed the 50% majority threshold, leading us to exclude them for reasons of feasibility. The maximum available repayment value was showcased to each individual (see Figure 1) and corresponds to EUR 105, EUR 246, and EUR430 for EUR 10−Cent, EUR 25−Cent, and EUR 50−Cent, respectively. Acceptance rates were only simulated for proposals that included realistic combinations of tax rates and lump−sum payments—hence the decreasing number of lines in the subsequent plots.
Sustainability 17 07282 g0a3
Figure A4. Weighted mineral oil tax policy acceptance rates. Sample wide acceptance rates for all estimated proposals with tax rates up to EUR 50−cent per liter of fuel. For higher tax rates, not a single proposal surpassed the 50% majority threshold, leading us to exclude them for reasons of feasibility. The maximum available repayment value was showcased to each individual (see Figure 1) and corresponds to EUR 105, EUR 246, and EUR 430 for EUR 10−Cent, EUR 25−Cent, and EUR 50−Cent, respectively. Acceptance rates were only simulated for proposals that included realistic combinations of tax rates and lump−sum payments—hence the decreasing number of lines in the subsequent plots. Acceptance was weighted to fit the electorate quota from Table 1 according to age, education, and income.
Sustainability 17 07282 g0a4

References

  1. Baumol, W.J.; Oates, W.E. The Theory of Environmental Policy; Cambridge University Press: Cambridge, UK, 1988. [Google Scholar]
  2. Boyce, J.K. Carbon Pricing: Effectiveness and Equity. Ecol. Econ. 2018, 150, 52–61. [Google Scholar] [CrossRef]
  3. Schmalensee, R.; Stavins, R.N. Lessons Learned from Three Decades of Experience with Cap and Trade. Rev. Environ. Econ. Policy 2017, 11, 59–79. [Google Scholar] [CrossRef]
  4. Andersson, J.J. Carbon Taxes and CO2 Emissions: Sweden as a Case Study. Am. Econ. J. Econ. Policy 2019, 11, 1–30. [Google Scholar] [CrossRef]
  5. Dechezleprêtre, A.; Nachtigall, D.; Venmans, F. The joint impact of the European Union emissions trading system on carbon emissions and economic performance. J. Environ. Econ. Manag. 2023, 118, 102758. [Google Scholar] [CrossRef]
  6. Klenert, D.; Mattauch, L. How to make a carbon tax reform progressive: The role of subsistence consumption. Econ. Lett. 2016, 138, 100–103. [Google Scholar] [CrossRef]
  7. Kirchner, M.; Sommer, M.; Kratena, K.; Kletzan-Slamanig, D.; Kettner-Marx, C. CO2 taxes, equity and the double dividend—Macroeconomic model simulations for Austria. Energy Policy 2019, 126, 295–314. [Google Scholar] [CrossRef]
  8. World Bank. State and Trends of Carbon Pricing 2022. Available online: https://openknowledge.worldbank.org/handle/10986/37455 (accessed on 11 August 2025).
  9. Fairbrother, M. Public opinion about climate policies: A review and call for more studies of what people want. PLoS Clim. 2022, 1, e0000030. [Google Scholar] [CrossRef]
  10. Weaver, A.A. Does Protest Behavior Mediate the Effects of Public Opinion on National Environmental Policies? A Simple Question and a Complex Answer. Int. J. Sociol. 2008, 38, 108–125. [Google Scholar] [CrossRef]
  11. Stadelmann-Steffen, I.; Dermont, C. The unpopularity of incentive-based instruments: What improves the cost–benefit ratio? Public Choice 2018, 175, 37–62. [Google Scholar] [CrossRef]
  12. Mildenberger, M.; Lachapelle, E.; Harrison, K.; Stadelmann-Steffen, I. Limited evidence that carbon tax rebates have increased public support for carbon pricing. Nat. Clim. Change 2022, 12, 121–122. [Google Scholar] [CrossRef]
  13. Mildenberger, M.; Lachapelle, E.; Harrison, K.; Stadelmann-Steffen, I. Limited impacts of carbon tax rebate programmes on public support for carbon pricing. Nat. Clim. Change 2022, 12, 141–147. [Google Scholar] [CrossRef]
  14. Fremstad, A.; Mildenberger, M.; Paul, M.; Stadelmann-Steffen, I. The role of rebates in public support for carbon taxes. Environ. Res. Lett. 2022, 17, 084040. [Google Scholar] [CrossRef]
  15. Carattini, S.; Kallbekken, S.; Orlov, A. How to win public support for a global carbon tax. Nature 2019, 565, 289–291. [Google Scholar] [CrossRef] [PubMed]
  16. Dreyer, S.J.; Walker, I. Acceptance and support of the Australian carbon policy. Soc. Justice Res. 2013, 26, 343–362. [Google Scholar] [CrossRef]
  17. Umit, R.; Schaffer, L.M. Attitudes towards carbon taxes across Europe: The role of perceived uncertainty and self-interest. Energy Policy 2020, 140, 111385. [Google Scholar] [CrossRef]
  18. Rotaris, L.; Danielis, R. The willingness to pay for a carbon tax in Italy. Transp. Res. Part D Transp. Environ. 2019, 67, 659–673. [Google Scholar] [CrossRef]
  19. Cao, L.; Toyohara, A.; Li, Y.; Zhou, W. Willingness to pay for carbon tax in Japan. Sustain. Prod. Consum. 2024, 52, 427–444. [Google Scholar] [CrossRef]
  20. Carattini, S.; Baranzini, A.; Thalmann, P.; Varone, F.; Vöhringer, F. Green Taxes in a Post-Paris World: Are Millions of Nays Inevitable? Environ. Resour. Econ. 2017, 68, 97–128. [Google Scholar] [CrossRef]
  21. Hammerle, M.; Best, R.; Crosby, P. Public acceptance of carbon taxes in Australia. Energy Econ. 2021, 101, 105420. [Google Scholar] [CrossRef]
  22. Gupta, M. Willingness to pay for carbon tax: A study of Indian road passenger transport. Transp. Policy 2016, 45, 46–54. [Google Scholar] [CrossRef]
  23. Nastis, S.A.; Mattas, K. Income elasticity of willingness-to-pay for a carbon tax in Greece. Int. J. Glob. Warm. 2018, 14, 510–524. [Google Scholar] [CrossRef]
  24. Savin, I.; Drews, S.; van den Bergh, J. Carbon pricing—Perceived strengths, weaknesses and knowledge gaps according to a global expert survey. Environ. Res. Lett. 2024, 19, 024014. [Google Scholar] [CrossRef]
  25. Sommer, S.; Mattauch, L.; Pahle, M. Supporting carbon taxes: The role of fairness. Ecol. Econ. 2022, 195, 107359. [Google Scholar] [CrossRef]
  26. Sælen, H.; Kallbekken, S. A choice experiment on fuel taxation and earmarking in Norway. Ecol. Econ. 2011, 70, 2181–2190. [Google Scholar] [CrossRef]
  27. Hammar, H.; Jagers, S.C. Can trust in politicians explain individuals’ support for climate policy? The case of CO2 tax. Clim. Policy 2006, 5, 613–625. [Google Scholar] [CrossRef]
  28. Baranzini, A.; Carattini, S. Effectiveness, earmarking and labeling: Testing the acceptability of carbon taxes with survey data. Environ. Econ. Policy Stud. 2017, 19, 197–227. [Google Scholar] [CrossRef]
  29. Benjamin, E.O.; Hall, D.; Sauer, J.; Buchenrieder, G. Are carbon pricing policies on a path to failure in resource-dependent economies? A willingness-to-pay case study of Canada. Energy Policy 2022, 162, 112805. [Google Scholar] [CrossRef]
  30. Kallbekken, S.; Kroll, S.; Cherry, T.L. Do you not like Pigou, or do you not understand him? Tax aversion and revenue recycling in the lab. J. Environ. Econ. Manag. 2011, 62, 53–64. [Google Scholar] [CrossRef]
  31. Beiser-McGrath, L.F.; Bernauer, T. Could revenue recycling make effective carbon taxation politically feasible? Sci. Adv. 2019, 5, eaax3323. [Google Scholar] [CrossRef] [PubMed]
  32. Maestre-Andrés, S.; Drews, S.; Savin, I.; van den Bergh, J. Carbon tax acceptability with information provision and mixed revenue uses. Nat. Commun. 2021, 12, 7017. [Google Scholar] [CrossRef]
  33. Malerba, D.; Never, B.; Fesenfeld, L.; Fuhrmann-Riebel, H.; Kuhn, S. On the acceptance of high carbon taxes in low- and middle-income countries: A conjoint survey experiment. Environ. Res. Lett. 2024, 19, 094014. [Google Scholar] [CrossRef]
  34. Gevrek, Z.; Uyduranoglu, A. Public preferences for carbon tax attributes. Ecol. Econ. 2015, 118, 186–197. [Google Scholar] [CrossRef]
  35. Barrez, J. Public acceptability of carbon pricing: Unravelling the impact of revenue recycling. Clim. Policy 2024, 24, 1323–1345. [Google Scholar] [CrossRef]
  36. Wilkowska, W.; Frank, M.; Kluge, J.; Ziefle, M. How Do We Move towards a Greener and Socially Equitable Future? Identifying the Trade-Offs of Accepted CO2 Pricing Revenues in Germany. Sustainability 2024, 16, 3378. [Google Scholar] [CrossRef]
  37. Statistik Austria 2023. Bevölkerung Nach Alter und Geschlecht Seit 1869. Volkszählungen 1869 bis 2001, Registerzählung 2011 und 2021; Gebietsstand 2021. Available online: https://www.statistik.at/statistiken/bevoelkerung-und-soziales/bevoelkerung/bevoelkerungsstand/bevoelkerung-nach-alter/geschlecht (accessed on 11 August 2025).
  38. Statistik Austria. Zensus Volkszählung 2021: Ergebnisse zur Bevölkerung aus der Registerzählung. Available online: https://www.statistik.at/fileadmin/user_upload/Zensus-VZ-2021.pdf (accessed on 11 August 2025).
  39. Eurostat. European Union—Statistics on Income and Living Conditions. Available online: https://ec.europa.eu/eurostat/documents/203647/203704/EU+SILC+DOI+2020v1.pdf (accessed on 11 August 2025).
  40. Kettner, C.; Loretz, S.; Schratzenstaller, M. Steuerreform 2022/2024–Maßnahmenüberblick und erste Einschätzung. WIFO Monatsberichte Mon. Rep. 2021, 94, 815–827. Available online: https://www.wifo.ac.at/publication/pid/13773180 (accessed on 11 August 2025).
  41. Pearce, A.; Harrison, M.; Watson, V.; Street, D.J.; Howard, K.; Bansback, N.; Bryan, S. Respondent understanding in discrete choice experiments: A scoping review. Patient 2021, 14, 17–53. [Google Scholar] [CrossRef]
  42. Labandeira, X.; Labeaga, J.M.; López-Otero, X. A meta-analysis on the price elasticity of energy demand. Energy Policy 2017, 102, 549–568. [Google Scholar] [CrossRef]
  43. Orme, B.K. Getting Started with Conjoint Analysis: Strategies for Product Design and Pricing Research, 4th ed.; Research Publishers LLC: Manhattan Beach, CA, USA, 2020. [Google Scholar]
  44. Brand, B.M.; Baier, D. Adaptive CBC: Are the benefits justifying its additional efforts compared to CBC? Arch. Data Sci. Ser. A 2020, 6. [Google Scholar] [CrossRef]
  45. Fuchs, M.; Hovemann, G. Consumer preferences for circular outdoor sporting goods: An Adaptive Choice-Based Conjoint analysis among residents of European outdoor markets. Clean. Eng. Technol. 2022, 11, 100556. [Google Scholar] [CrossRef]
  46. Kouki-Block, M.; Wellbrock, C.M. Influenced by Media Brands? A Conjoint Experiment on the Effect of Media Brands on Online Media Planners’ Decision-Making. J. Media Bus. Stud. 2022, 19, 29–52. [Google Scholar] [CrossRef]
  47. Nickkar, A.; Lee, Y.J. Willingness to Pay for Advanced Safety Features in Vehicles: An Adaptive Choice-Based Conjoint Analysis Approach. Transp. Res. Rec. 2022, 2676, 173–185. [Google Scholar] [CrossRef]
  48. Wagner, K. Environmental preferences and consumer behavior. Econ. Lett. 2016, 149, 1–4. [Google Scholar] [CrossRef]
  49. Andor, M.A.; Lange, A.; Sommer, S. Fairness and the support of redistributive environmental policies. J. Environ. Econ. Manag. 2022, 114, 102682. [Google Scholar] [CrossRef]
  50. Bristow, A.L.; Wardman, M.; Zanni, A.M.; Chintakayala, P.K. Public acceptability of personal carbon trading and carbon tax. Ecol. Econ. 2010, 69, 1824–1837. [Google Scholar] [CrossRef]
  51. Jiang, Z.; Shao, S. Distributional effects of a carbon tax on Chinese households: A case of Shanghai. Energy Policy 2014, 73, 269–277. [Google Scholar] [CrossRef]
  52. McFadden, D. The measurement of urban travel demand. J. Public Econ. 1974, 3, 303–328. [Google Scholar] [CrossRef]
  53. Manski, C.F. The structure of random utility models. Theory Decis. 1977, 8, 229. [Google Scholar] [CrossRef]
  54. Andrews, R.L.; Ansari, A.; Currim, I.S. Hierarchical Bayes versus finite mixture conjoint analysis models: A comparison of fit, prediction, and partworth recovery. J. Mark. Res. 2002, 39, 87–98. [Google Scholar] [CrossRef]
  55. Pasek, J. Anesrake: ANES Raking Implementation. 2018. Available online: https://CRAN.R-project.org/package=anesrake (accessed on 11 August 2025).
  56. Viscusi, W.K.; Zeckhauser, R.J. The Perception and Valuation of the Risks of Climate Change: A Rational and Behavioral Blend. Clim. Change 2006, 77, 151–177. [Google Scholar] [CrossRef]
  57. Bürgisser, R.; Stadelmann-Steffen, I.; and Armingeon, K. Can information, compensation and party cues increase mass support for green taxes? J. Eur. Public Policy 2024, 1–28. [Google Scholar] [CrossRef]
  58. Kallbekken, S.; Garcia, J.H.; Korneliussen, K. Determinants of public support for transport taxes. Transp. Res. Part A Policy Pract. 2013, 58, 67–78. [Google Scholar] [CrossRef]
  59. Kotchen, M.J.; Boyle, K.J.; Leiserowitz, A.A. Willingness-to-pay and policy-instrument choice for climate-change policy in the United States. Energy Policy 2013, 55, 617–625. [Google Scholar] [CrossRef]
  60. Canty, A.; Ripley, B.D. Boot: Bootstrap R (S-Plus) Functions. 2024. Available online: https://CRAN.R-project.org/package=boot (accessed on 11 August 2025).
  61. Fleiß, J.; Ackermann, K.A.; Fleiß, E.; Murphy, R.O.; Posch, A. Social and environmental preferences: Measuring how people make tradeoffs among themselves, others, and collective goods. Cent. Eur. J. Oper. Res. 2020, 28, 1049–1067. [Google Scholar] [CrossRef]
  62. Yang, L. Research on the Collaborative Pollution Reduction Effect of Carbon Tax Policies. Sustainability 2024, 16, 935. [Google Scholar] [CrossRef]
  63. Aydin, C.; and Esen, Ö. Reducing CO2 emissions in the EU member states: Do environmental taxes work? J. Environ. Plan. Manag. 2018, 61, 2396–2420. [Google Scholar] [CrossRef]
  64. Woerner, A.; Imai, T.; Pace, D.D.; Schmidt, K.M. How to increase public support for carbon pricing with revenue recycling. Nat. Sustain. 2024, 7, 1633–1641. [Google Scholar] [CrossRef]
  65. Muth, D.; Weiner, C.; Lakócai, C. Public support and willingness to pay for a carbon tax in Hungary: Can revenue recycling make a difference? Energy Sustain. Soc. 2024, 14, 30. [Google Scholar] [CrossRef]
  66. United States Environmental Protection Agency. Greenhouse Gas Emissions from a Typical Passenger Vehicle. 2024. Available online: https://www.epa.gov/greenvehicles/greenhouse-gas-emissions-typical-passenger-vehicle (accessed on 11 August 2025).
  67. World Bank. Carbon Pricing Dashboard. 2023. Available online: https://carbonpricingdashboard.worldbank.org/compliance/price (accessed on 11 August 2025).
  68. Carattini, S.; Carvalho, M.; Fankhauser, S. Overcoming public resistance to carbon taxes. WIREs Clim. Change 2018, 9, e531. [Google Scholar] [CrossRef] [PubMed]
  69. Dabla-Norris, E.; Khalid, S.; Magistretti, G.; and Sollaci, A. Does information change public support for climate mitigation policies? Clim. Policy 2024, 24, 1474–1487. [Google Scholar] [CrossRef]
  70. Beiser-McGrath, L.F.; Bernauer, T. How Do Pocketbook and Distributional Concerns Affect Citizens’ Preferences for Carbon Taxation? J. Politics 2023, 86, 551–564. [Google Scholar] [CrossRef]
  71. Maestre-Andrés, S.; Drews, S.; van den Bergh, J. Perceived fairness and public acceptability of carbon pricing: A review of the literature. Clim. Policy 2019, 19, 1186–1204. [Google Scholar] [CrossRef]
  72. Murphy, J.J.; Allen, P.G.; Stevens, T.H.; Weatherhead, D. A Meta-analysis of Hypothetical Bias in Stated Preference Valuation. Environ. Resour. Econ. 2005, 30, 313–325. [Google Scholar] [CrossRef]
  73. Entem, A.; Lloyd-Smith, P.; Adamowicz, W.L.; Boxall, P.C. Using inferred valuation to quantify survey and social desirability bias in stated preference research. Am. J. Agric. Econ. 2022, 104, 1224–1242. [Google Scholar] [CrossRef]
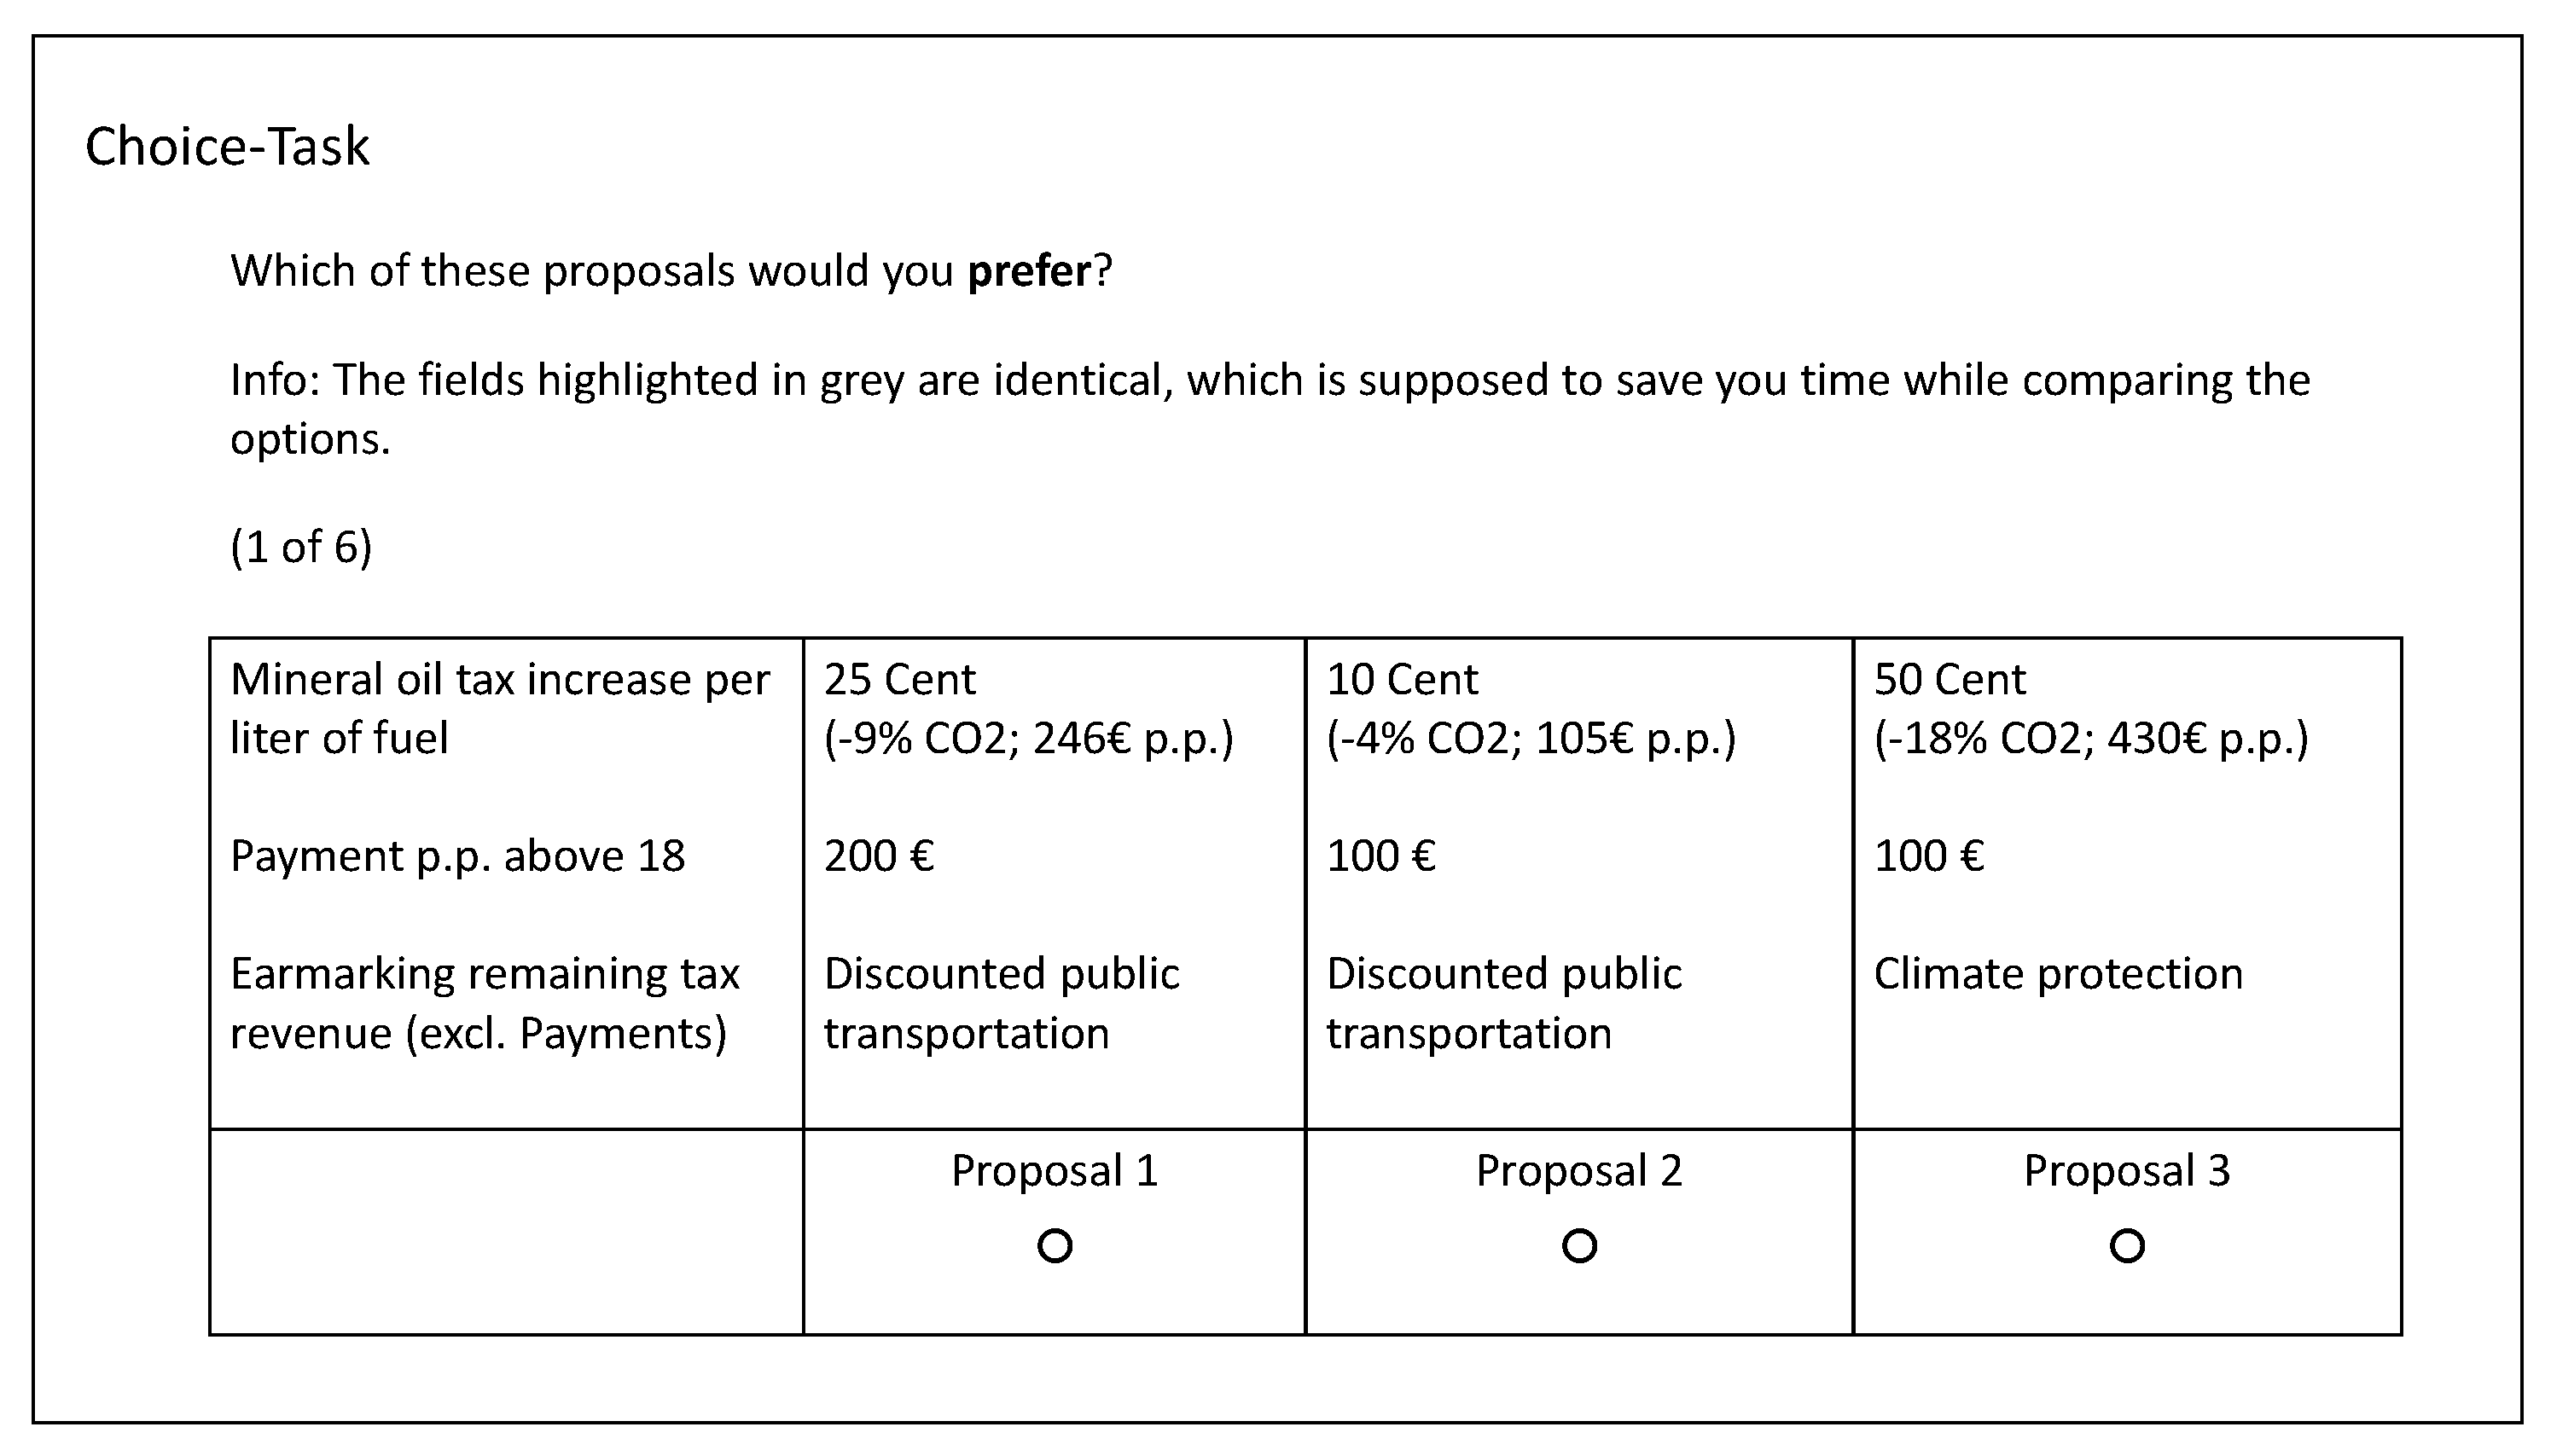
Figure 1. Choice−Task Example. An example of a Choice−Task as it was displayed in the survey. Respondents decided between three proposals that each consisted of three attributes. Information was provided about the anticipated abatement effect of the tax and the maximum available lump−sum payment, which was based on the tax revenue.
Sustainability 17 07282 g001
Figure 2. Part−worth utilities for the attribute tax levels. The dot denotes the mean estimate, and the error bars represent the 95% confidence intervals.
Sustainability 17 07282 g002
Figure 3. Part−worth utilities for the attribute yearly lump−sum payments. The dot denotes the mean estimate, and the error bars represent the 95% confidence intervals.
Sustainability 17 07282 g003
Figure 4. Part−worth utilities for the attribute earmarking. The dot denotes the mean estimate, and the error bars represent the 95% confidence intervals.
Sustainability 17 07282 g004
Figure 5. Acceptance rates for EUR 100 annual lump−sum payments. The acceptance rates are shown for annual lump−sum payments of EUR 100. The dashed line is an aid to interpretation and does not represent a connection between the respective levels.
Sustainability 17 07282 g005
Figure 6. Weighted mean part−worth utilities with 95% bootstrapped confidence intervals. Weighting was performed through raking using the characteristics age, education, and income. Weighted means were calculated using the function boot() in the R−package boot [60]. Confidence bounds were calculated using the function boot.ci() in the same package. (a) Weighted mean part−worth utilities for tax increases. (b) Weighted mean part−worth utilities for annual lump−sum payments.
Sustainability 17 07282 g006
Figure 7. Weighted acceptance rates for lump−sum payments of €100. The acceptance rates are shown for annual lump−sum payments of €100. Weighting was applied to simultaneously mimic the target population concerning age, education, and income. Weights were calculated to fit the electorate quotas from Table 1.
Sustainability 17 07282 g007
Table 1. Summary of the sample.
CharacteristicObservationsQuota SampleQuota Electorate
Gender a:
Female60049.34%51.11%
Male61050.16%48.89%
Diverse60.49%NA b
Age a:
<20524.27%4.55%
20–2951242.04%17.58%
30–3914912.23%13.65%
40–491008.21%16.15%
50–5922718.64%15.38%
60–69574.68%17.51%
>701219.93%15.18%
Highest completed education c:
Mandatory school867.07%24.41%
Apprenticeship18715.38%30.88%
High School48539.88%15.59%
University41734.29%15.35%
Others413.37%13.77%
Monthly household income d:
<150023519.41%14.37%
1500–249926922.21%24.87%
2500–349925020.64%19.94%
3500–449918915.61%15.07%
4500–549912210.07%10.58%
>550014612.06%15.16%
Total1216
a The electorate quotas for gender were calculated based on Austrian census data that dates to late 2021 [37]. b The number of people registered officially as diverse, inter, open, or no entry, was 11 in all of Austria, which is why this group is not mentioned explicitly for reasons of data protection. c The electorate quotas for highest completed education are taken from the Zensus Volkszählung and refer to late 2021 [38]. d Total disposable household income data from EU-SILC’s 2018 wave were used to obtain the electorate quotas for the monthly household income [39].
Table 2. Attributes and levels. Some attribute-level combinations are budgetarily mutually exclusive and were therefore not included for simulating acceptance rates. For example, lump-sum payments of EUR 300 per adult cannot be financed from the non-existent revenue of no tax increase (0 EUR -cent).
AttributesLevelsDescription
0 €-Cent
10 €-Cent
25 €-Cent
Tax level50 €-CentAdditional mineral oil tax.
75 €-Cent
100 €-Cent
125 €-Cent
0 €
50 €
Rebate100 €Yearly financial repayment
150 €to persons over 18 years.
200 €
300 €
No tax increaseBaseline level in absence of a tax.
Public transportSubsidizing of public transport measures.
Alternative enginesSubsidizing of other engines (e.g. e-mobility).
EarmarkingLow-income householdsRe-distribution to cushion social hardship.
General budgetNo specific use of the revenues.
Climate protectionSubsidizing of climate protection initiatives.
Full repayment to adultsAll tax revenues are equally reimbursed.
Table 3. Build-Your-Own (BYO).
Tax LevelLump-Sum PaymentEarmarking
Level%Level%Level%
0 €-cent22.3€030.5No tax increase12.6
10 €-cent25.9€5020.6Public transport39.1
25 €-cent24.1€10025.0Alternative engines8.6
50 €-cent15.2€15011.3Low-income households5.1
75 €-cent5.7€2006.4General budget2.7
100 €-cent3.1€3006.1Climate protection28.3
125 €-cent3.7 Full repayment to adults3.7
Table 4. Heterogeneity of part-worth utility estimates. Distribution of part-worth utility estimates for all levels of each attribute and the None-Option. The 10th, 50th, and 90th percentiles are shown to capture most of the distribution, while avoiding outliers.
Level10-QuantileMedian90-Quantile
0 €-Cent−78.8749.378104.928
10 €-Cent−22.78737.85482.464
25 €-Cent−9.05428.64169.346
Tax level50 €-Cent−20.29113.85144.901
75 €-Cent−46.553−19.77227.980
100 €-Cent−63.559−34.92224.833
125 €-Cent−93.726−62.31617.043
€0−33.2271.79744.600
€50−14.8386.65027.832
Rebate€100−4.2599.24223.829
€150−11.3611.77115.218
€200−24.167−7.24810.902
€300−42.767−17.71315.052
No tax increase−51.500−21.29923.750
Public transport8.70138.64678.880
Alternative engines−30.116−2.09830.916
EarmarkingLow-income households−42.104−11.52124.712
General budget−66.947−38.201−2.114
Climate protection−4.67234.83673.284
Full repayment to adults−47.405−12.79016.684
None0.50553.580102.416
Disclaimer/Publisher’s Note: The statements, opinions and data contained in all publications are solely those of the individual author(s) and contributor(s) and not of MDPI and/or the editor(s). MDPI and/or the editor(s) disclaim responsibility for any injury to people or property resulting from any ideas, methods, instructions or products referred to in the content.