Article

Simulation of Microclimate and PM2.5 Dispersion in Typical Urban Parks in Beijing Based on the ENVI-Met Model

1
Beijing City University, Beijing 100083, China
2
Beijing Municipal Institute of City Management, Jia 48# Shangjialou, Chaoyang District, Beijing 100028, China
3
Research Base for Capital City Environment Construction, Beijing 100083, China
4
The College of Forestry, Beijing Forestry University, Beijing 100083, China
*
Author to whom correspondence should be addressed.
Sustainability 2025, 17(16), 7247; https://doi.org/10.3390/su17167247
Submission received: 14 June 2025 / Revised: 3 August 2025 / Accepted: 4 August 2025 / Published: 11 August 2025
(This article belongs to the Special Issue Air Quality Characterisation and Modelling—2nd Edition)

Abstract

With rapid advancements in industrialization and urbanization, Beijing is increasingly facing severe urban heat island effects and air pollution, particularly from haze. Urban parks play a vital role in improving the local microclimate and facilitating the dispersion of fine particulate matter (PM2.5). However, most existing studies have focused primarily on the cooling and humidifying functions of urban parks, with limited attention given to the combined assessment of their regulatory effects on both the microclimate and air pollutants. Moreover, the influence of seasonal variation on these ecological services has rarely been systematically examined. To address these research gaps, this study selected three representative urban parks in Beijing and conducted a quantitative analysis of four key environmental parameters—air temperature, relative humidity, wind speed, and PM2.5 concentration—during spring, summer, and winter. Using Landsat remote sensing imagery and the ENVI-met v3.1 computational fluid dynamics (CFD) model, this study simulated dynamic changes in the microclimate and pollutant dispersion within parks. Model feasibility was evaluated through validation metrics and comparisons with field observations. The results show the following: (1) Urban parks significantly improve the local microclimate and reduce PM2.5 concentrations, with the most notable effects observed in summer when the ecological functions of vegetation are at their peak. (2) The ENVI-met model can be used to simulate the microclimate and PM2.5 dispersion in the three parks, with the highest simulation accuracy occurring during the summer season. This study provides valuable insights for urban park planning in Beijing, particularly for developing strategies to enhance microclimatic conditions and mitigate air pollution.

1. Introduction

Currently, China is in the process of rapid urbanization, and the heat island effect and increased concentration of particulate matter (PM) in the atmospheric environment affect urban ecology [1]. The heat island effect refers to a phenomenon in which the temperature in one area is higher than that in the surrounding areas [2]. Even though the heat island effect may inhibit radiation fog formation in certain urban settings by reducing nighttime surface cooling, it more commonly promotes cloud and fog buildup, which traps pollutants near the surface, severely degrading air quality and threatening public health. People are paying increasing attention to the harm caused by the heat island effect on cities. People living in the central areas of heat islands for a long period of time exhibit emotional irritability, loss of appetite, and many other problems [3]. Under the influence of the heat island effect, clouds and fog increase throughout a city, which can lead to severe air pollution caused by the accumulation of harmful gases and smoke over the city area, subsequently affecting the environmental quality of the city [4]. Particulate matter can be divided according to particle size; for example, PM2.5 refers to particles with a diameter of 2.5 μm or less in the atmosphere. The sources of atmospheric particulate matter can be divided into natural sources and man-made sources. Man-made sources are mainly particles formed during fuel combustion and lead-containing compounds emitted by automobiles [5]. PM2.5 can penetrate deep into the human respiratory system due to its small aerodynamic diameter (≤2.5 μm), reaching the bronchi and even the alveolar regions, where it interferes with gas exchange. This exposure is associated with a range of adverse health outcomes, including asthma, bronchitis, and cardiovascular diseases [3].
As important components of the urban ecological environment, urban parks can weaken the urban heat island effect and reduce particulate matter. They are an important link for maintaining the balance of the urban ecosystem [6]. Many studies have shown that parks can alleviate the urban heat island effect [7,8]. Through field investigations, Chen [9] concluded that the temperature within a park is quantitatively affected by the area of the park. Here, the park area refers to the total land occupied by the park, including green spaces, roads, buildings, water bodies, and all other land uses within the park boundaries. Dimoudi [10] used the fluid dynamics method to simulate a selected city park; explored the influence of park size, vegetation type, and wind speed on air temperature; and reported that the extent of the microclimate effect was dependent upon the area of the park. Zhang [11] observed the concentration of atmospheric particles in the greenfield at the Beijing Olympic Forest Park and reported that broad-leaved forest and shrub forest had the greatest particulate retention effects in spring and summer, whereas evergreen vegetation and coniferous and broad-leaved mixed vegetation showed significant particulate retention in autumn and winter. The blocking effect of different species of plants, enabling particulate retention, is related to the community type, greenbelt structure, and, most significantly, environmental factors [12].
Remote sensing technology offers an effective means of obtaining high-resolution spatial data on urban land cover, vegetation structure, and building morphology, which serve as a critical foundation for simulating urban environmental processes. Integrating remote sensing imagery into computational fluid dynamics (CFD) models such as ENVI-met enables high spatial and temporal resolution of analyses, facilitating scenario-based assessments and predictions of microclimates in urban parks [13]. In contrast to commonly used CFD models such as FLUENT, ENVI-met incorporates additional modules for atmosphere, radiation, buildings, vegetation, and soil, allowing for realistic and dynamic 3D microclimate simulations. Several studies have employed ENVI-met to model microenvironments such as urban parks. For example, Qin [14] used ENVI-met to simulate two numerical models with and without rooftop greening for typical residential areas in Beijing and concluded that the greening of roofs has a beneficial effect on cooling and humidifying. Lao [15] investigated typical urban city blocks in Zhongshan City, Guangdong Province, China, and simulated the actual microclimate and a scenario without vegetation. Their simulation results demonstrated that within-city green spaces could reduce temperatures and thereby improve the level of human comfort during hot summers. Building on these studies, Ma [16] proposed an optimization design strategy to improve the study of the microclimate of urban parks by combining measurements with numerical simulations to comprehensively analyze influencing factors such as the air temperature, relative humidity, and wind speed inside the park on the microclimate of Altai Park in Hohhot, Mongolia.
In recent years, some studies have also utilized ENVI-met to simulate the retention of particulate matter by roadways and green belts. For example, Vos et al. [17] used numerical simulation to study the effects of different plant structures on the blocking of particulates in street canyons, which are formed in narrow streets lined by continuous skyscrapers, and Nikolova et al. [18] concluded that the wind direction and speed were the main factors affecting particulate diffusion in simulated street canyons. Additionally, Wang et al. [19] studied the influencing variables for plant barriers blocking the effect of particulates and suggested an optimal distance between the plant barrier and pollution source under set parameters.
However, studies that quantitatively integrate microclimate regulation and particulate matter retention in urban parks remain limited. Current research still focuses primarily on the cooling and humidifying effects of vegetation, with few comprehensive assessments of the regulatory effects of urban parks on temperature, humidity, wind speed, and PM2.5 dispersion. Furthermore, the impact of seasonal variation on these ecosystem services has not been systematically explored. This study addresses these gaps by combining remote sensing and field observation data with ENVI-met simulations to establish a more robust evaluation framework. By distinguishing seasonal differences, we assess the regulatory effects of three typical types of urban parks in Beijing on the microclimate and PM2.5 dispersion. The findings provide valuable insights for urban park planning in Beijing and other major cities seeking to mitigate microclimate issues and air pollution.

2. Materials and Methods

2.1. Site Description

Three parks were selected within the city of Beijing, China: Qingnianhu Park, Ditan Park, and Dongsheng Bajia Park. The locations of the three parks are shown in Figure 1. The parks differed in total area, green plant coverage, and location (Table 1). Qingnianhu Park and Ditan Park are located in the center of the city, whereas Dongsheng Bajia Park is located near the suburbs. The specific attributes of the area and greening rates of the three parks are shown in Table 1.

2.2. Data Acquisition

(1) Remote Sensing Data
For numerical simulation modeling, remote sensing images from the three parks were analyzed for the heights of trees and surrounding buildings. The remote sensing image in TIFF format was acquired from Landsat 8 OLI_TIRS on 6 August 2021, with a center longitude of 116.7367° E and center latitude of 40.3251° N, and was downloaded from the geospatial data cloud (http://www.gscloud.cn/). The spatial resolution is 30 m. The image strip number is 123, and the line number is 32, covering all the study areas in Beijing.
(2) Field Measurement Data
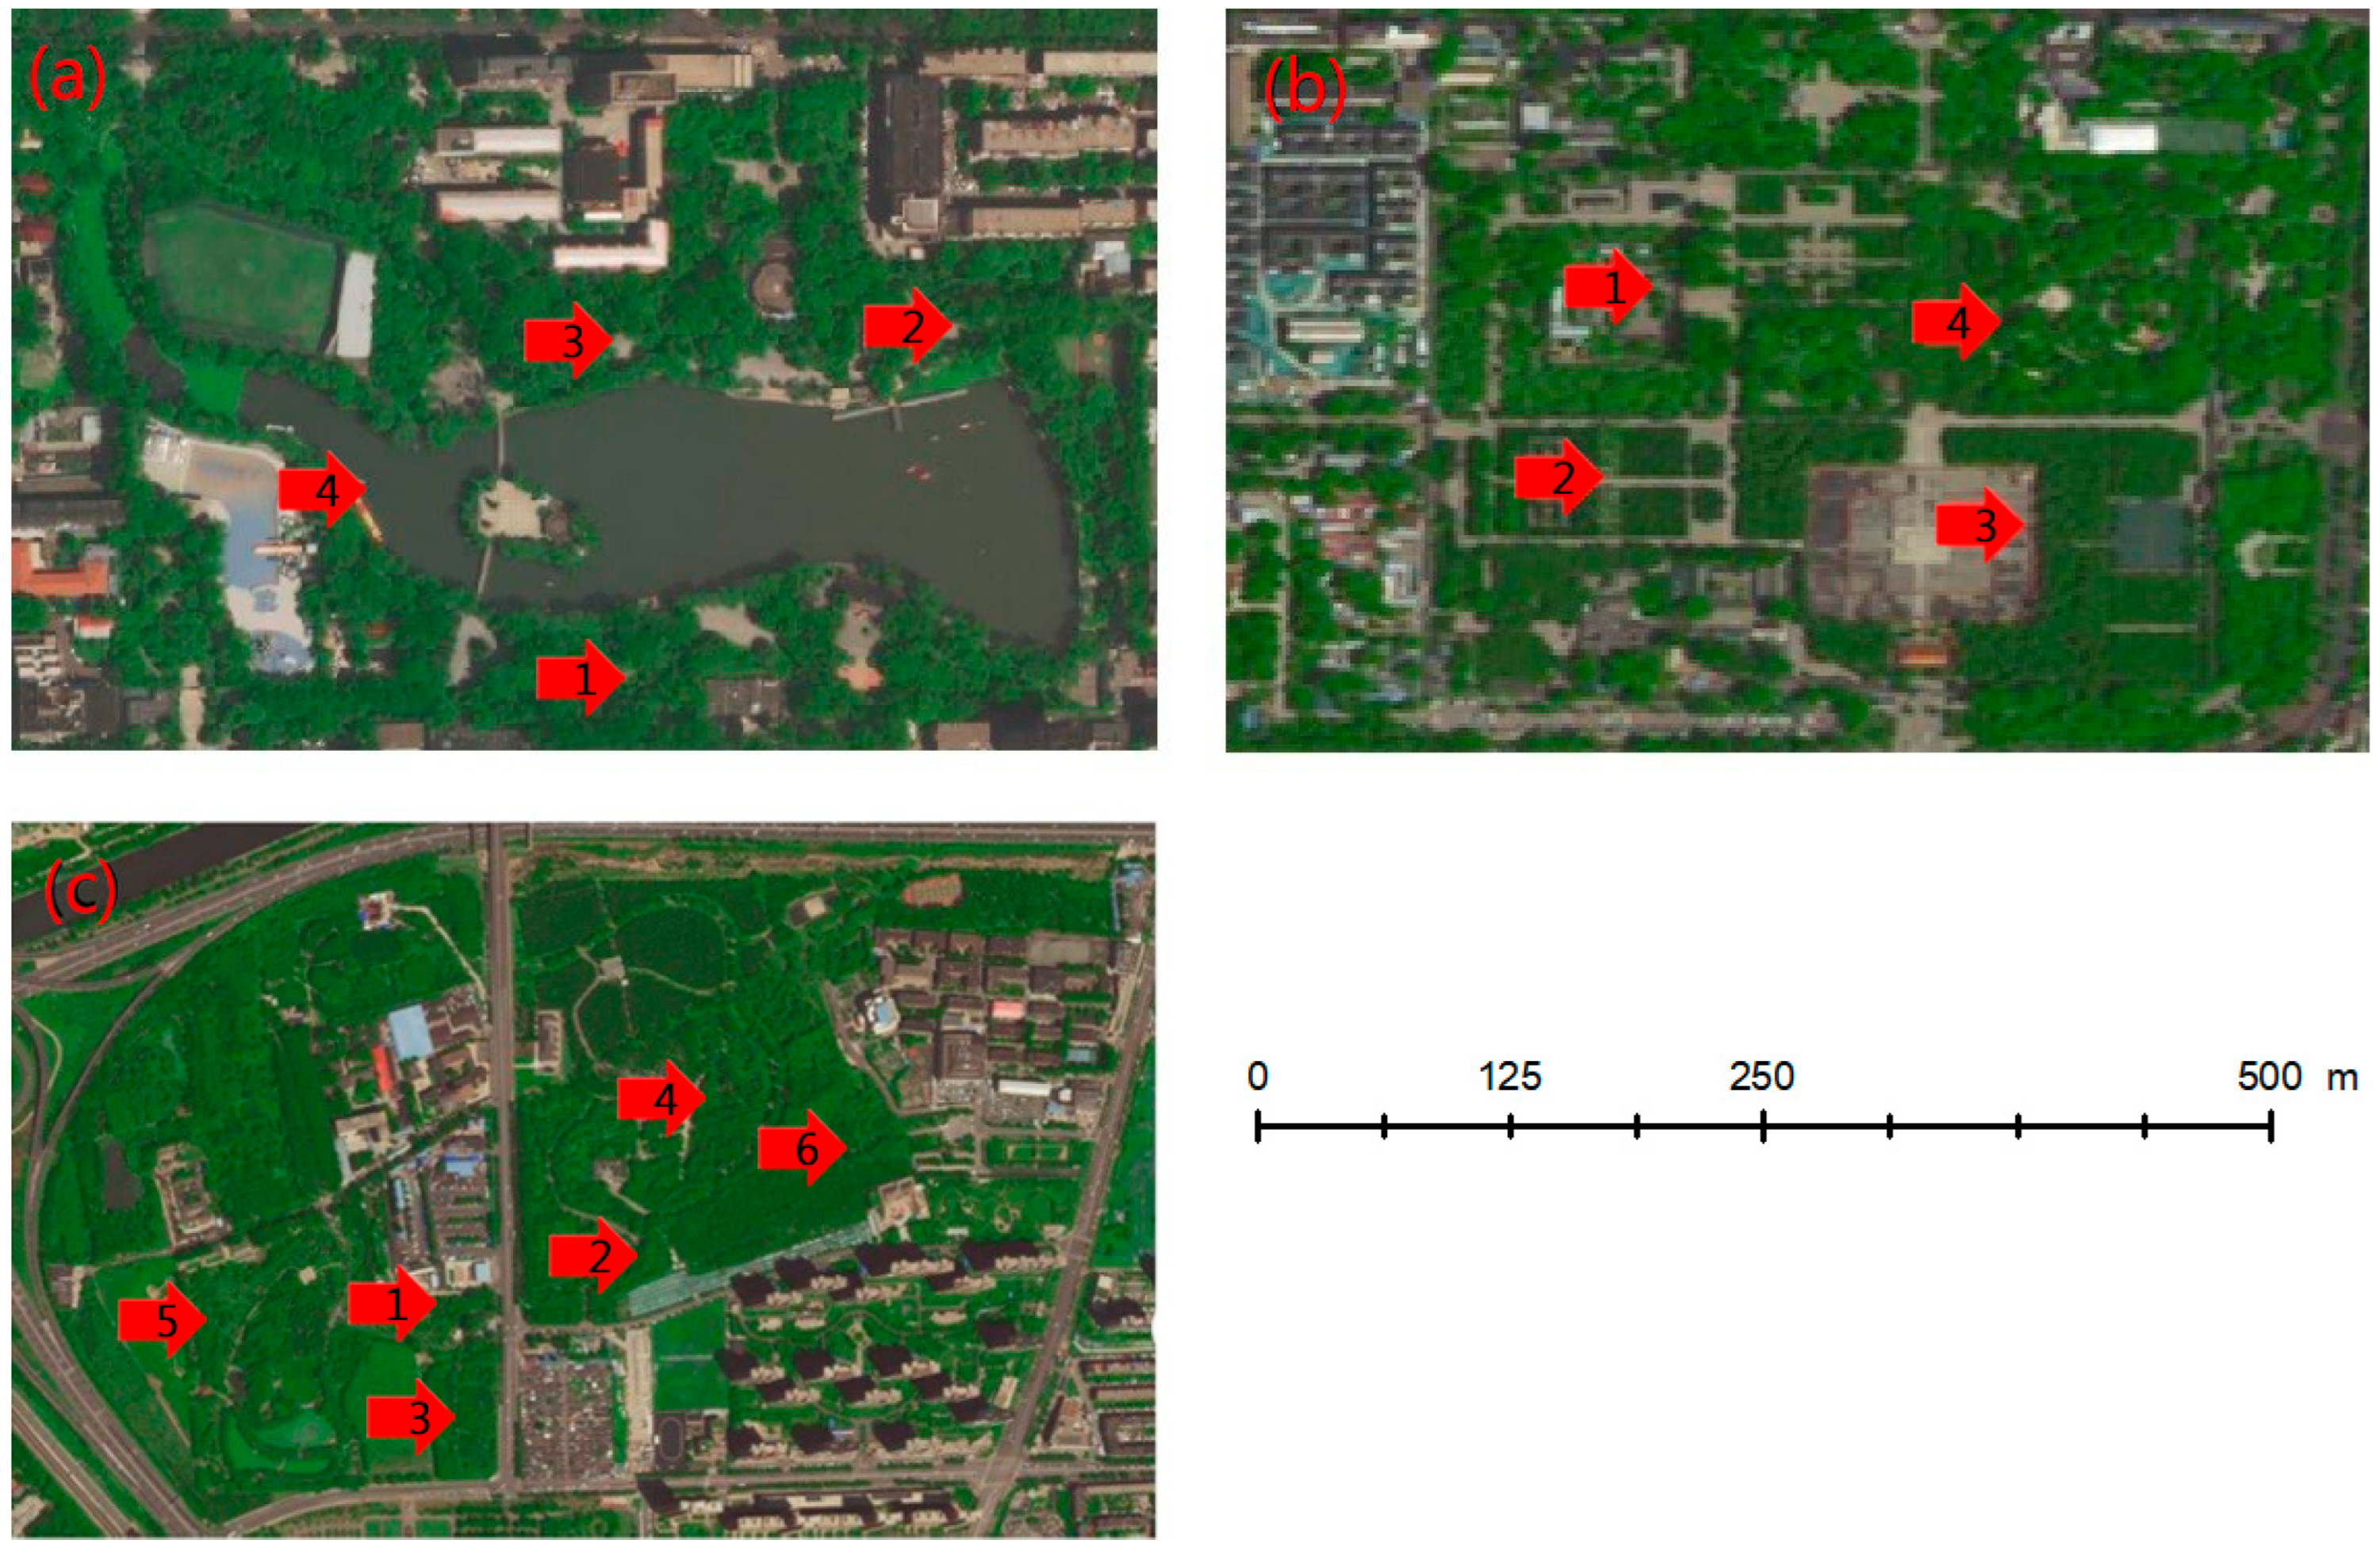
The locations of specific monitoring points in the three parks are shown in Figure 2. A minimum of four monitoring points were sampled at each park. In Qingnianhu Park, four monitoring sites were selected: the lake (1), the woodland side (2 and 3), and the asphalt road (4). Four monitoring points were also selected in Ditan Park, all located on the woodland side, with two sampling sites located on the pathway (1 and 2). Six sampling locations were selected in Dongsheng Bajia Park. Dongsheng Bajia Park is divided into the East District and West District, which are separated by roads. Three sampling points were selected in the West District (1, 3, and 5), and three were selected in the East District (2, 4, and 6); all the points were located in woodlands.
At the sampling locations, we collected measurements of temperature, relative humidity, wind speed, and the concentration of PM2.5. The specific field data collected are shown in Table 2.
Field data collection was conducted over 9 days in the spring of 2019 (with samples collected on 15 March, 17 March, 19 March, 21 March, 27 March, 2 April, 5 April, 8 April, and 10 April), over 9 days in the summer of 2019 (on 8 July, 11 July, 12 July, 15 July, 18 July, 19 July, 21 July, 22 July, and 25 July), and over 8 days in the winter of 2019 (on 3 December, 4 December, 6 December, 8 December, 9 December, 13 December, 14 December, and 15 December). Autumn data were excluded due to equipment failure and insufficient field observation days during this season. The samples were collected during the day, and instantaneous measurements were taken every 2 h from 10:00 to 18:00. The Kestrel 4500 (Nielsen-Kellerman Co., Boothwyn, PA, USA) handheld device was used to measure air temperature (accuracy ±0.5 °C), relative humidity (±3%), and wind speed (±3% of reading). The PM2.5 concentration was monitored using a Dustmate optical particle counter (Turnkey Instruments Ltd., Cheshire, UK; accuracy within ±10% under an ambient temperature of 5–35 °C, relative humidity of 20–95%). Tree and building heights were obtained using a Bolulai laser altimeter (Bo Lu Lai Instrument Co., Shenzhen, China), with a typical accuracy of ±0.3–0.5 m depending on target distance and surface characteristics.

2.3. ENVI-Met Simulation Method Based on Remote Sensing Data

The computational fluid dynamics model ENVI-met was developed by Bruse and Fleer [20] to simulate the urban microclimate. It can simulate the interaction between a solid surface, vegetation, and air in an urban environment with a spatial resolution of 0.5–10 m and a temporal resolution of 10 s and carry out microclimate simulation analysis of fluid dynamics. The ENVI-met model accounts for plant transpiration and heat exchange, surface temperature, soil and biological processes, and building-related meteorological parameters, as well as the emission and dispersion of atmospheric particulate matter. It is capable of simulating the spatiotemporal variations of microclimatic variables such as air temperature and humidity, surface temperature, radiation flux, turbulence, and particulate diffusion and deposition within green spaces, thereby providing valuable insights for optimizing urban outdoor spatial planning and design strategies [21]. The version used in this paper is v3.1, which mainly includes modeling, programming, calculation, and display modules. Establishing the simulation model in the modeling module is the key to completing the simulation. The ENVI-met model consists of three submodels and nested grids. It should be noted that ENVI-met v3.1 does not support simulations under sub-zero (below 0 °C) air temperatures.
The submodels include a three-dimensional main model, a soil model, and a one-dimensional boundary model. The three-dimensional main model includes horizontal coordinates (X and Y) and vertical coordinates (Z), and parameters such as buildings and vegetation are set in the main model. The soil model is a one-dimensional model and has a depth of 1.75 m, which consists of 14 layers from the surface to 1.75 m. The soil model can calculate the heat transfer process from the surface to the soil, plant transpiration, and the temperature and humidity changes in the underlying surface caused by heat and moisture transfer in the soil. To simulate the process of boundary layer treatment accurately, the one-dimensional boundary model extends the boundary of the three-dimensional main model proportionally to the atmospheric boundary layer of 2500 m and simultaneously transfers the initial conditions of the atmospheric boundary layer to the boundary of the main model. ENVI-met provides three kinds of linked boundary conditions (LBCs), namely, open LBC, closed LBC, and cyclic LBC. The open LBC addresses the values of the meshes adjacent to the inflow boundary mesh. For most cases, this boundary condition is recommended. In this paper, open LBC is selected for each parameter.

2.3.1. Image Import and Model Configuration

Owing to the complexity of the layout of parks, the configuration of vegetation, meteorological conditions, and street distribution affect the simulation accuracy [22]. In this work, the first step in building the model is to import the preprocessed TIFF remote sensing image containing the study area into ArcGIS 10.5 to create the underlying surface classification vector map. The vector map is converted into a raster map in bmp format, which is used as the base map in the 2D model of ENVI-met. At this stage, the BMP base map includes information on park boundaries and underlying surface types. Subsequently, the heights of vegetation and buildings were measured using a handheld laser altimeter (accuracy ±0.3 m) and supplemented by visual interpretation of Landsat imagery, enabling the construction of a 3D model.

2.3.2. Parameter Settings

In this work, due to the computational intensity of ENVI-met and high-resolution requirements, representative days from each season were selected. 2 April, 19 July, and 13 December were taken as the days of simulation in spring, summer, and winter, respectively. The number of nested grids was 10, and the simulation was run for 10 h. The spatial resolutions and model dimensions for the three selected parks are summarized in Table 3. The model was initialized and configured using general baseline parameters, such as the base location, simulation duration, and site-specific field data, including meteorological conditions, pollutant emission data, and vegetation characteristics. For the meteorological parameters, the spring data from the Ditan Park weather station were used as a representative example. Initial inputs, including measured wind direction, wind speed, hourly temperature, and relative humidity, were used to establish the foundational conditions for the simulation. The model was initialized at 8:00, and the simulation ran for a total of 10 h, with data from the second hour onward used for further analysis. Additionally, simulation parameters for vegetation and pollutant sources were set according to the specific conditions of the parks. A comprehensive overview of these configuration parameters can be found in Table 4.
The emission factor of PM2.5 on urban main roads exhibits a diurnal variation, with an average value of 0.09 ± 0.05 g/(km·veh), due to fluctuations in traffic flow and driving behavior throughout the day [23]. However, for the purpose of simplifying model inputs and enabling consistent comparison across time periods, we adopted a fixed emission factor of 0.15 g/(km·veh), referring to previous studies [24]. The average road width around parks was 24 m, and there were 38 vehicles traveling in the same direction within 1 km on average. The vehicle speed was assumed to be 40 km·h−1 [24], and the calculated emission rate was as follows:
q = 0.15 ( g / car ) ( 1   km / 40   km / h ) × 1   h 3600   s × 38 ( car ) 1000   m × 10 6   μ g 1   g 63.5   μ g / s / m

2.3.3. Evaluating the Accuracy of Simulations on the Basis of the RMSE and MAPE

The accuracy of the model simulation was evaluated via the root mean square error (RMSE), i.e., the square root value of the error, and the mean absolute percentage error (MAPE), i.e., the average relative percentage error, which calculates the deviation degree of the calculation error from the observed value and is not affected by the numerical range. These two indices are commonly used to evaluate model accuracy and are calculated according to the following formula:
R M S E = i = 1 n ( X t r u e , i X m o d e l , i ) 2 n
M A P E = 100 % n i = 1 n X t r u e , i X m o d e l , i X t r u e , i
where X m o d e l , i is the simulation value, X t r u e , i is the measured value, and n is the number of measurements. Multiplying by 100% is performed to convert the relative error from a decimal to a percentage value.

3. Results

3.1. Image-Based Model Construction

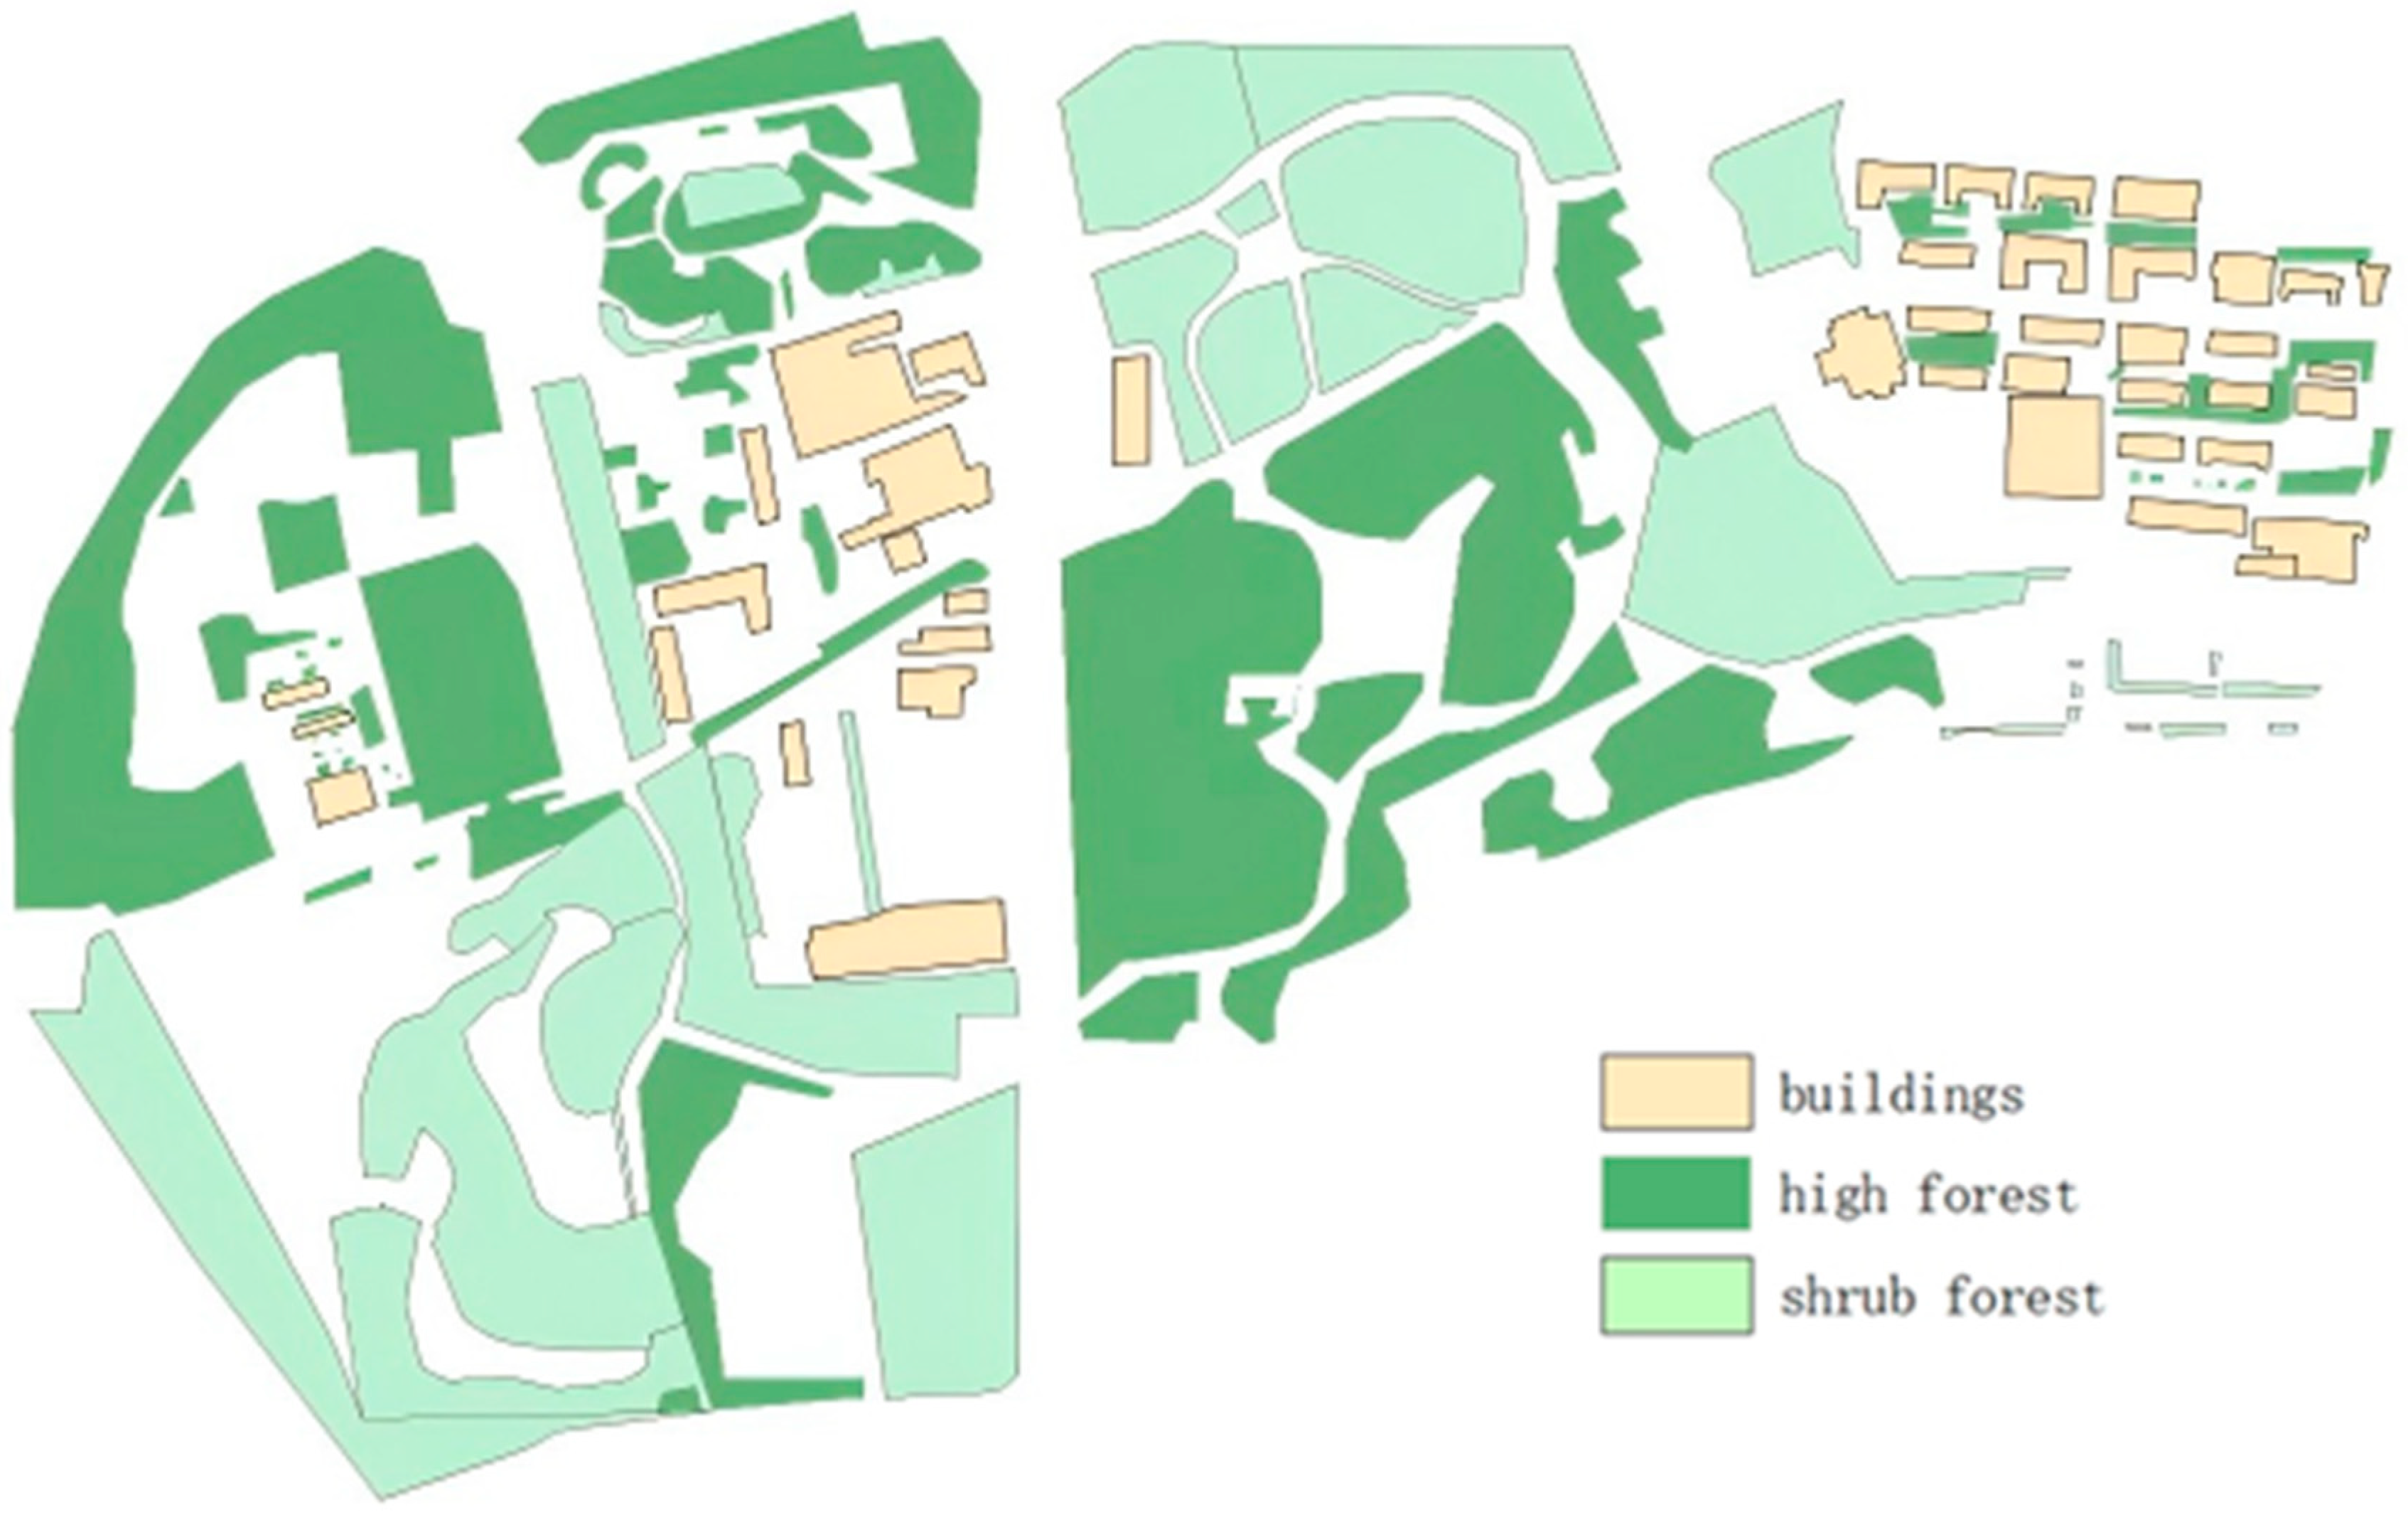
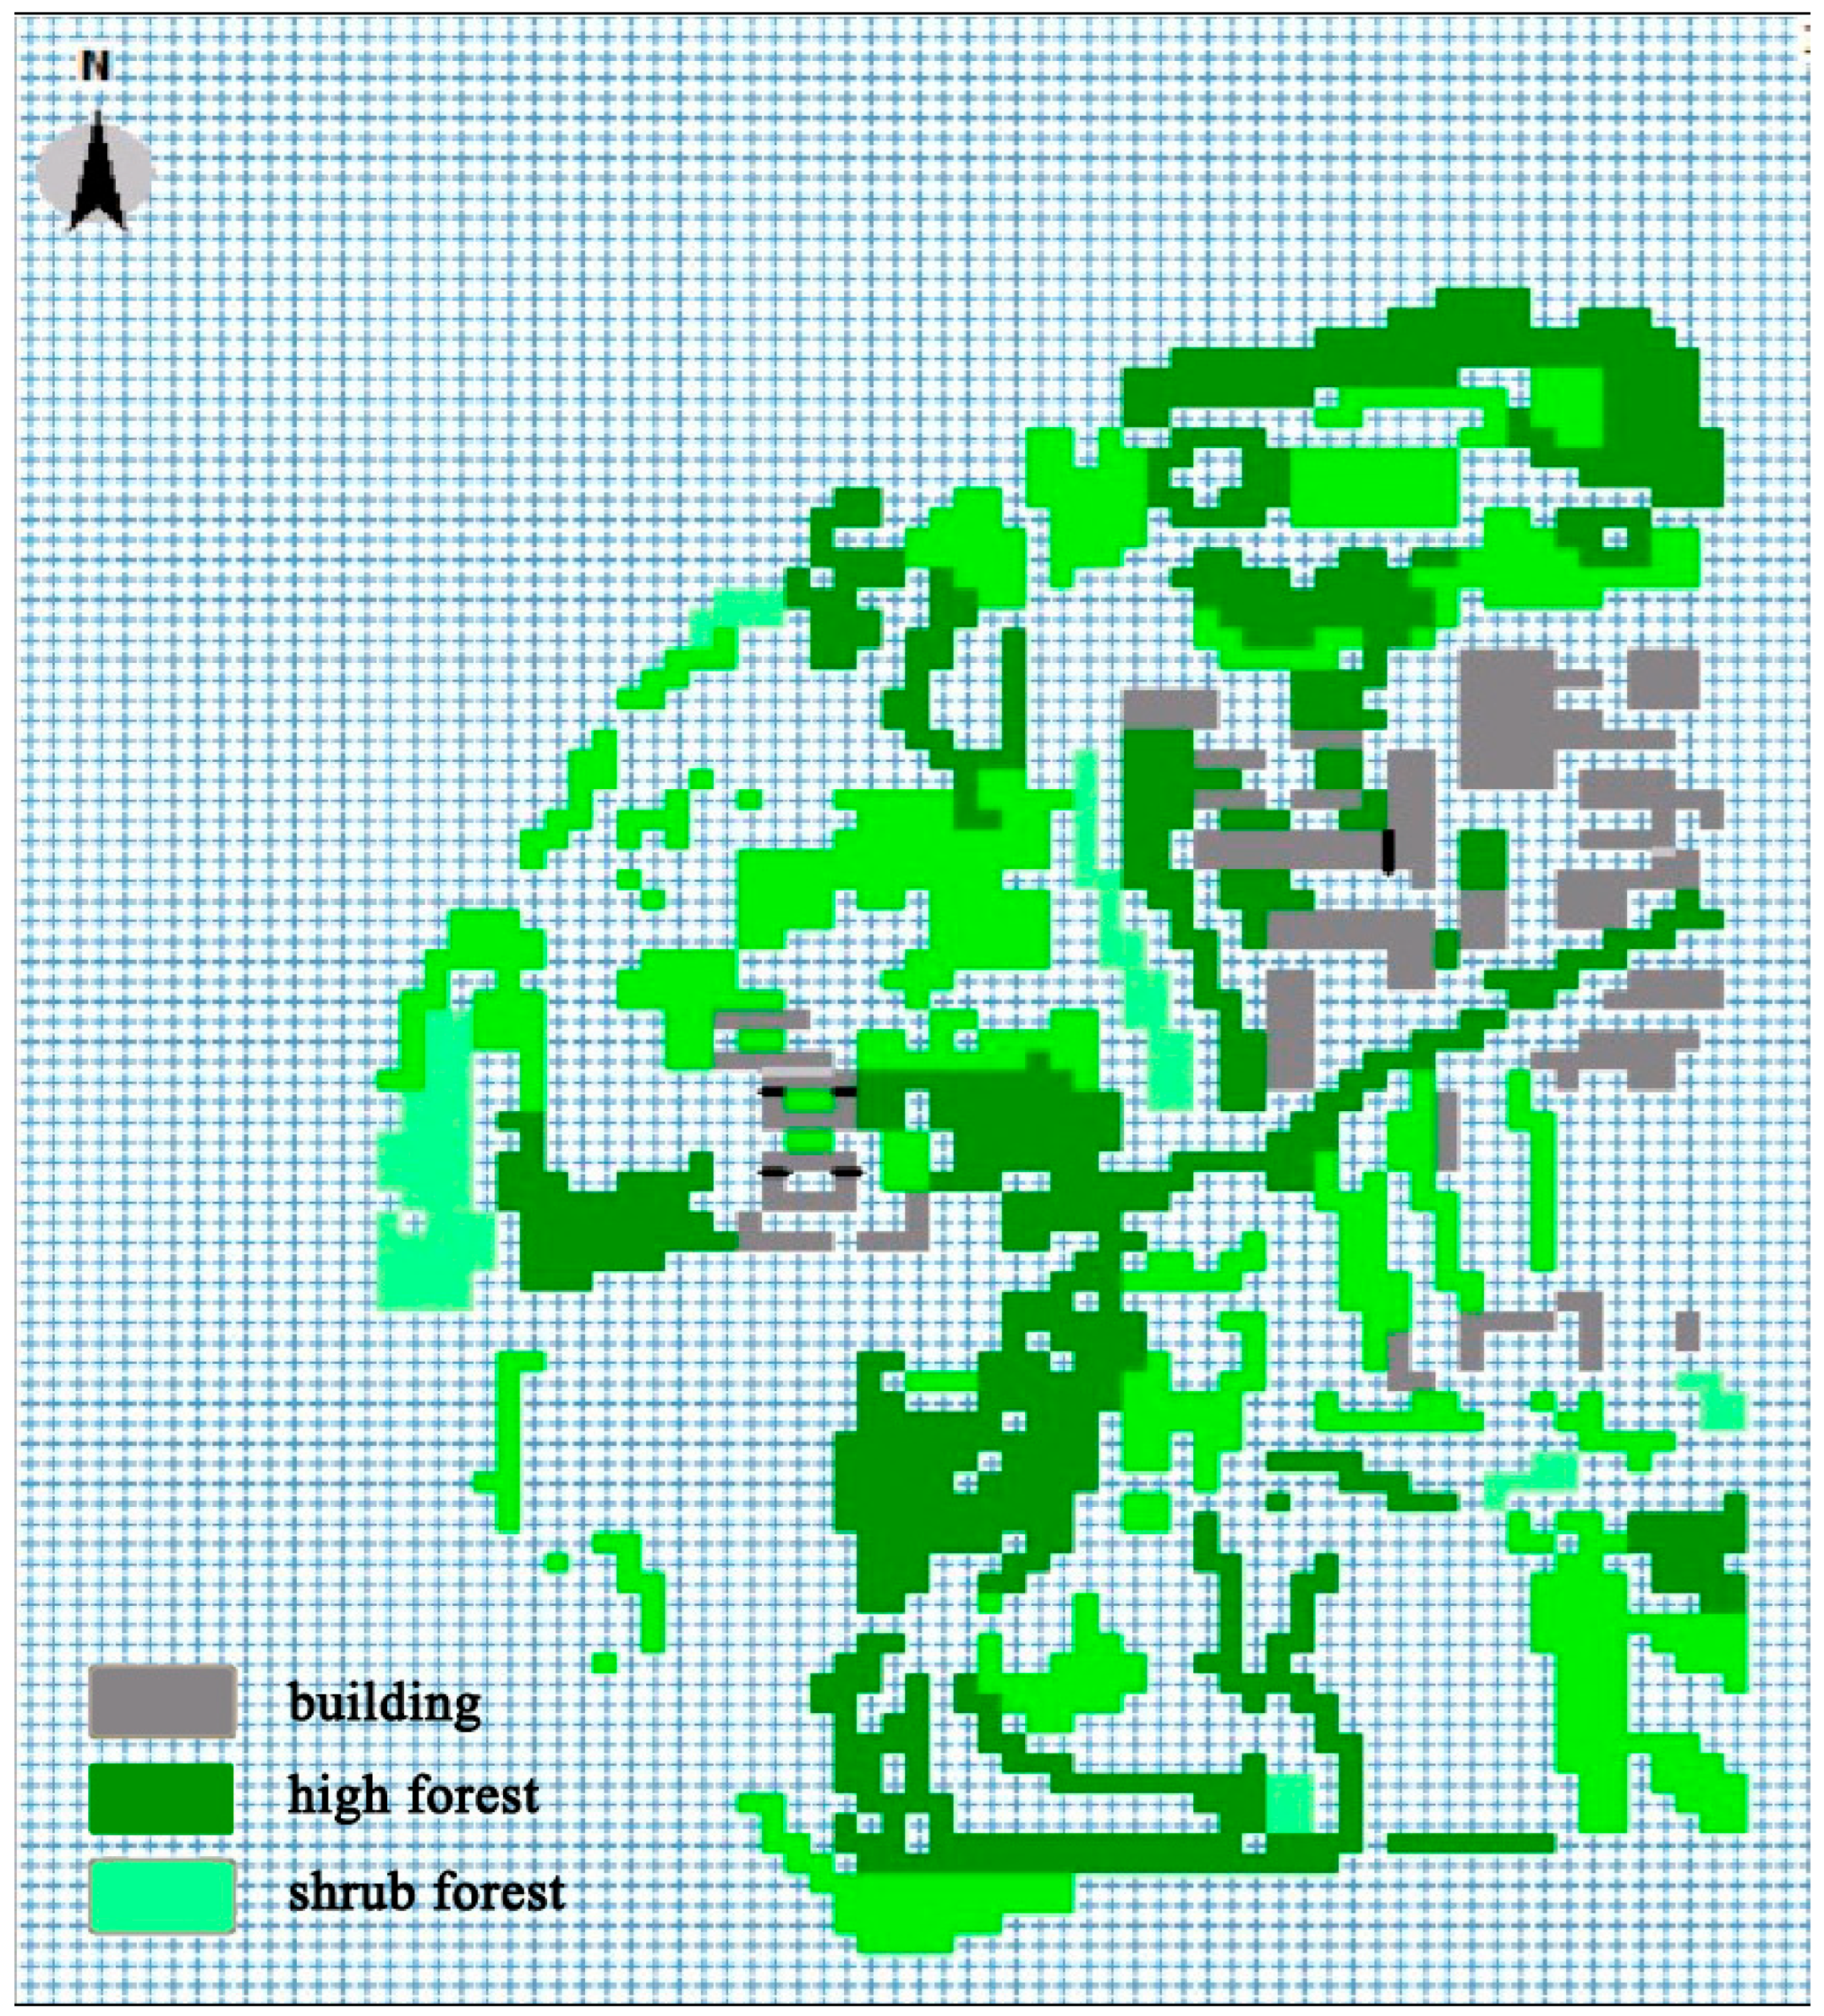
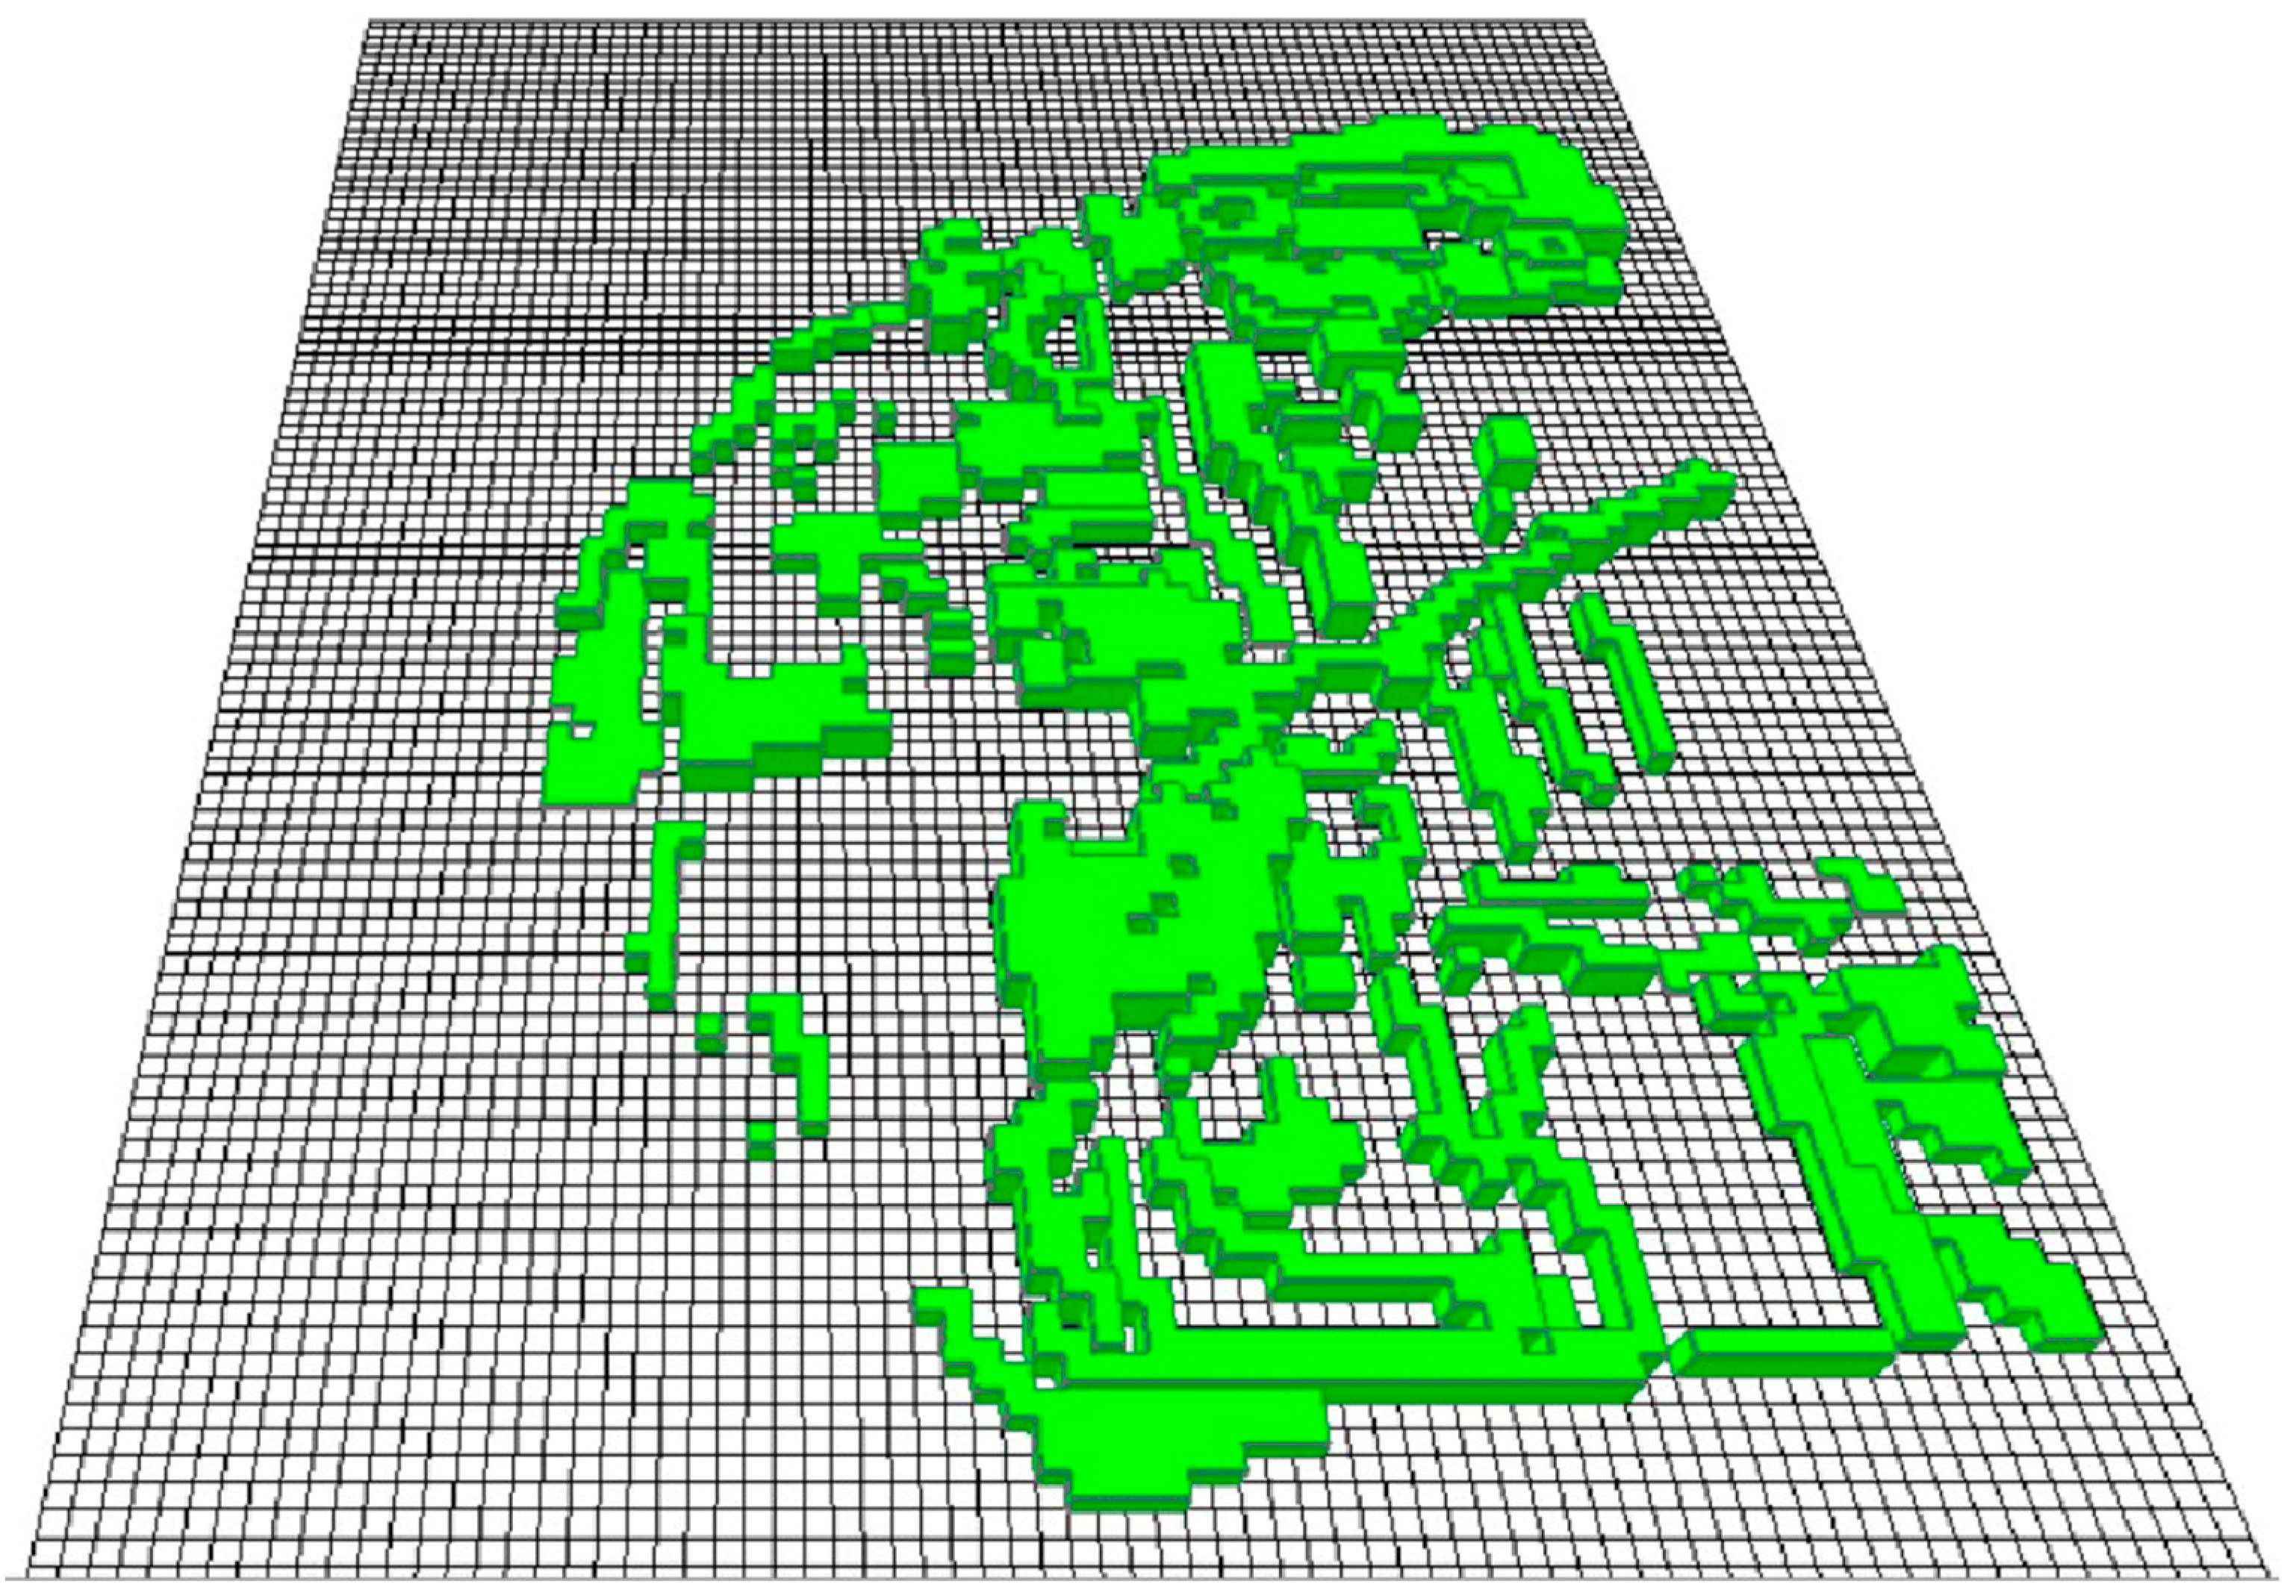
The base map (Figure 3) required to build the model is a raster map converted from the surface classification vector map by combining supervised classification with manual visual interpretation in ArcGIS via remote sensing images. Figure 4 and Figure 5 are 2D and 3D models based on the building heights, plant species, and surface classification map.

3.2. Analysis of the Microclimate and PM2.5 Diffusion Simulation in the Parks

3.2.1. Analysis of the Microclimate and PM2.5 Diffusion Simulation in Parks During the Summer

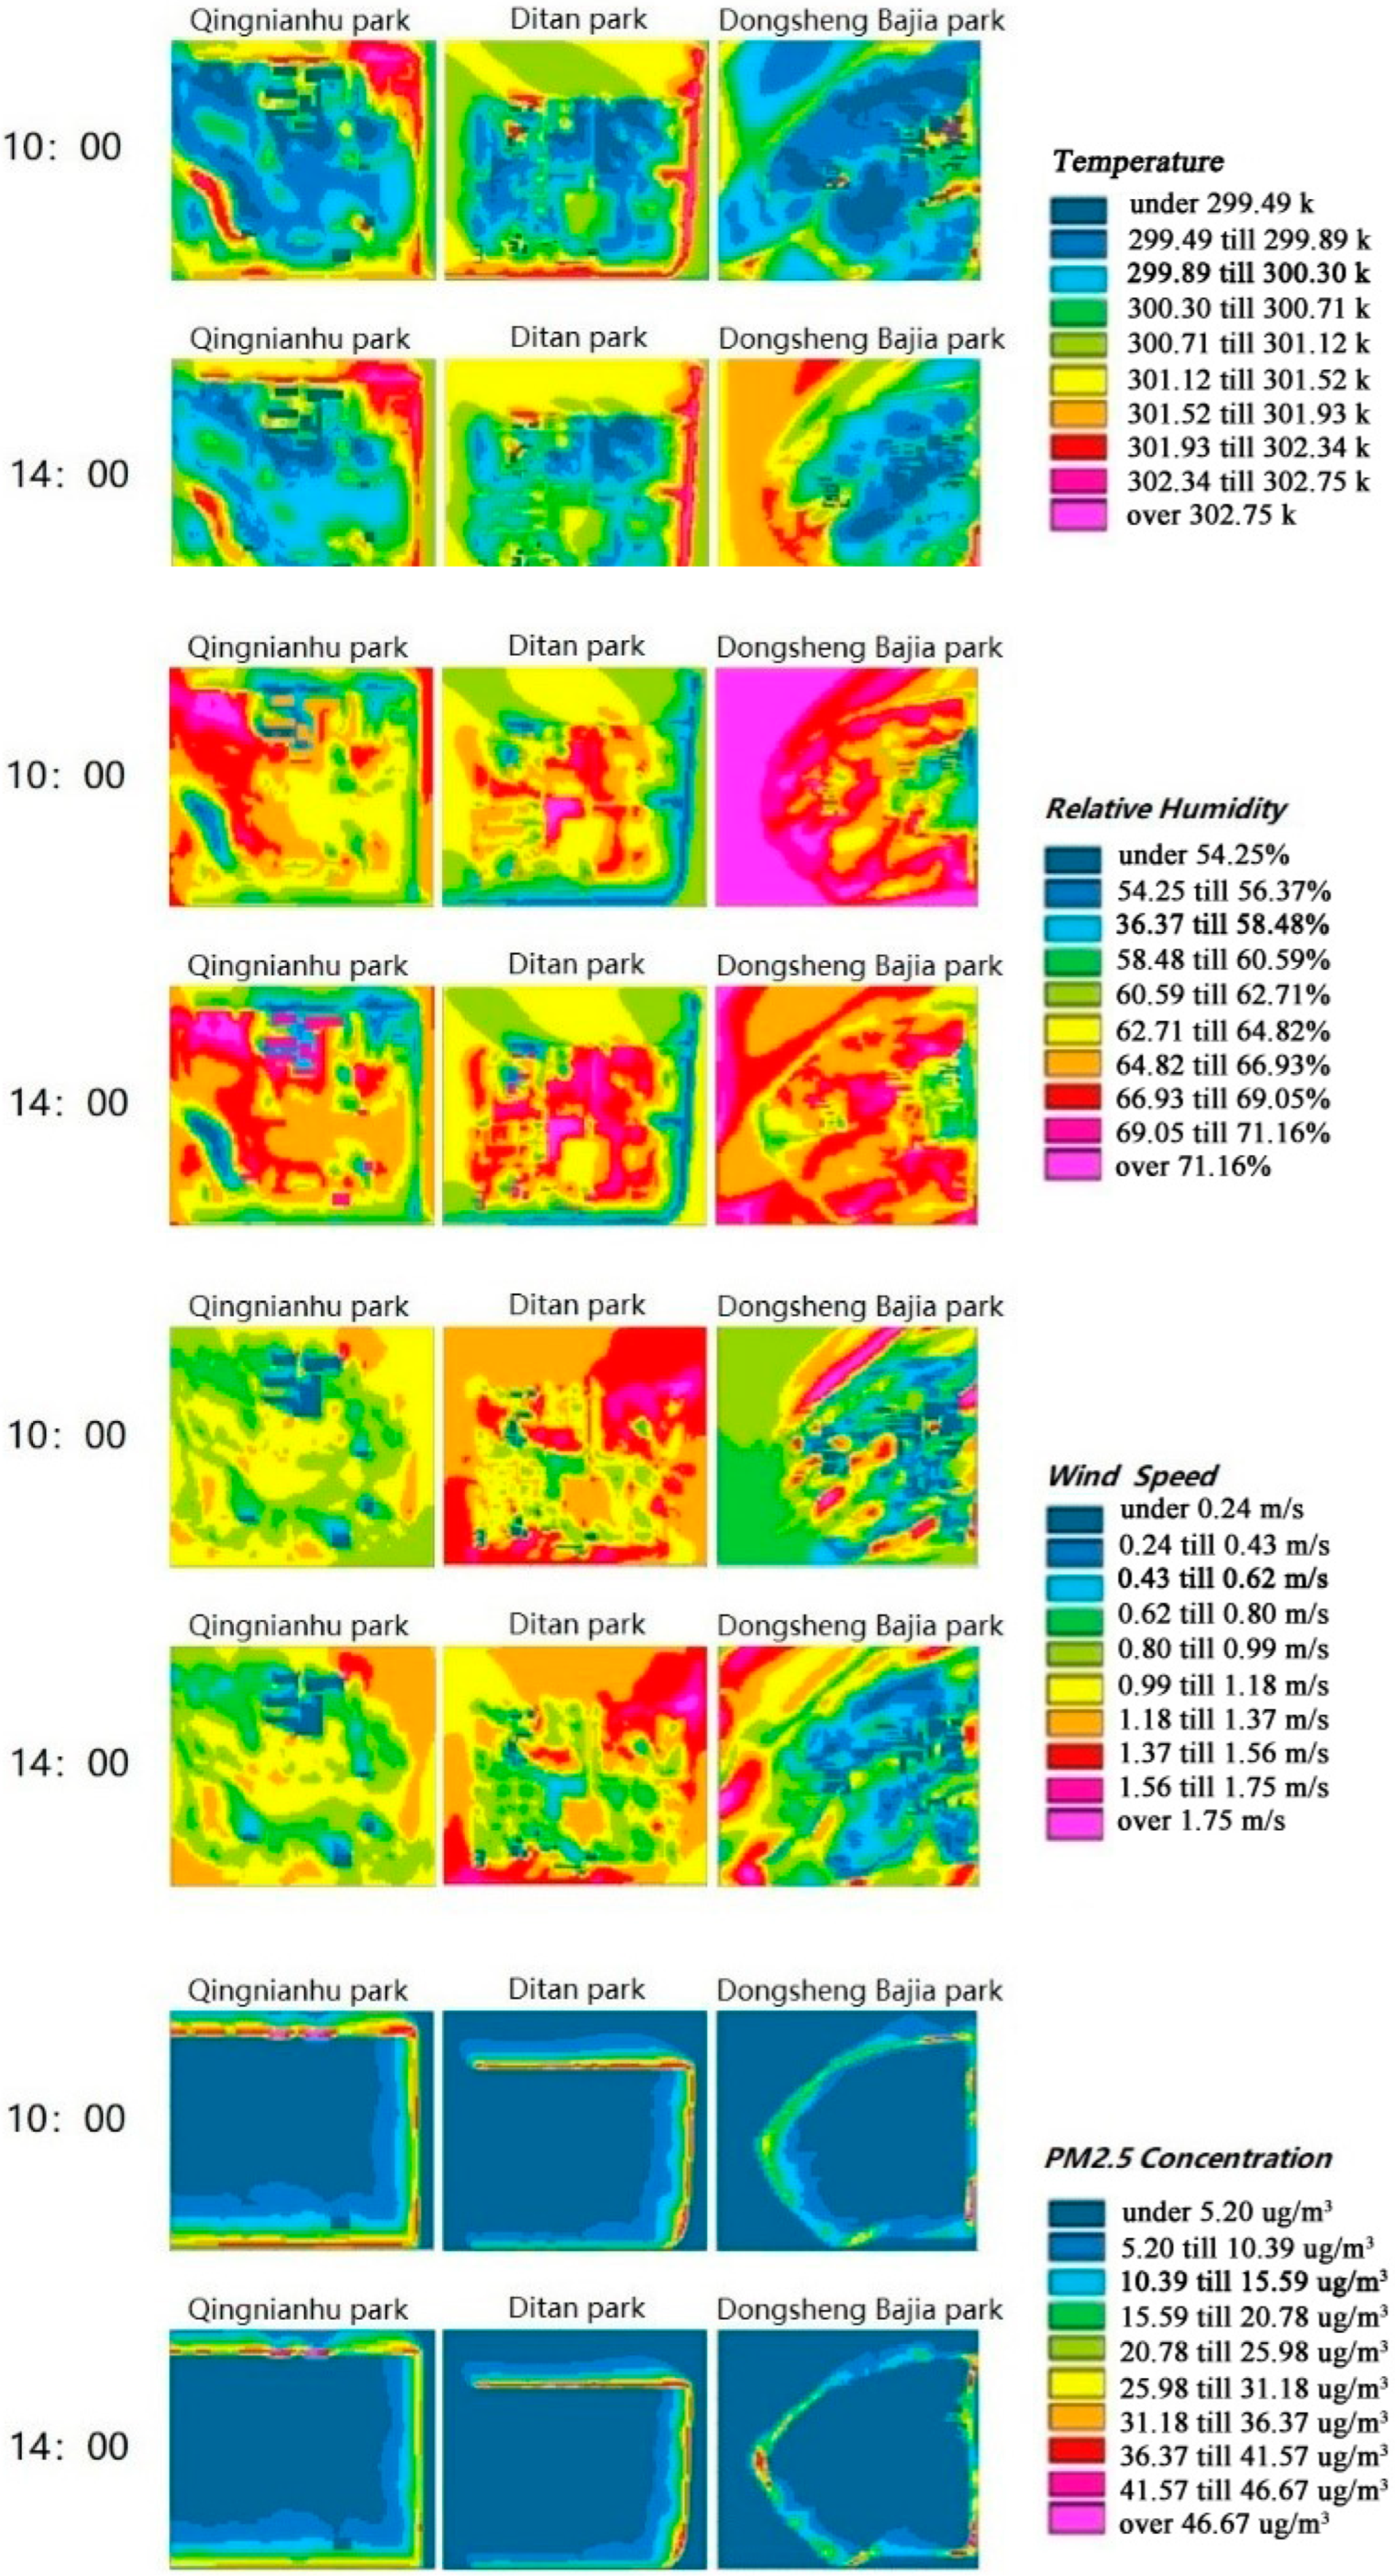
To facilitate comparison and analysis across parks and seasons, this study focused on the quantitative assessment of microclimate conditions and PM2.5 dispersion in urban parks at two specific time points—10:00 and 14:00. All microclimate and PM2.5 concentration outputs were extracted at a height of 1.5 m.
Temperature factor: Most Dongsheng Bajia Park temperatures at 10:00 were less than 26.34 °C (dark blue area), and the average temperature was lower than those of the other parks (Figure 6). The temperature of each park rose significantly at 14:00. Especially in Dongsheng Bajia Park, the temperature rose by approximately 3 °C in most areas from 10:00 to 14:00. The temperature distribution revealed that the temperature inside the park was lower than that outside the park. The temperature was lower in areas near buildings or where vegetation was concentrated.
Humidity factor: In Qingnianhu Park, the influence of water on humidity was greater than that of vegetation because the large Qingnian Lake dominated, and the humidity around Qingnian Lake increased during the day. The distribution of relative humidity in the three parks revealed that the relative humidity inside the park was greater than that outside the park, and the humidity outside Dongsheng Bajia Park decreased from 10:00 to 14:00.
Wind speed: Generally, across the three parks, the wind speed outside the park was greater than that inside the park, and the wind speed decreased around the vegetation (Figure 6); for example, the wind speed in the square area in the center of Ditan Park was approximately 1.18 m·s−1 to 1.37 m·s−1, which was approximately 0.3 m·s−1 higher than that in the surrounding areas covered with vegetation.
PM2.5 concentration: Over the course of the day, the PM2.5 concentration in each park decreased slightly at 14:00 compared with that at 10:00 (Figure 6), and the dark blue areas with concentrations under 5.20 μg·m−3 increased.

3.2.2. Analysis of the Microclimate and PM2.5 Diffusion Simulation in Parks During the Spring

As shown in Figure 7, the temperature of each park rose significantly at 14:00, and the temperature distribution of the three parks revealed that the temperature inside the park was lower than that outside the park and that the temperature change in the park was not as pronounced as that in summer. For example, at 14:00, the temperature outside Dongsheng Bajia Park was approximately 3 °C higher than that inside. During the spring season, parks with high water contents had more pronounced effects on temperature than they did in the summer. Qingnianhu Park is characterized by a large body of water with an area of approximately 27,105 m2 and a maximum temperature difference between the inside and outside of the park.
Humidity factor: The relative humidity inside and outside the parks decreased at 14:00. However, the decline inside the park was less than that outside the park (Figure 7). For example, in Ditan Park, the external humidity decreased by approximately 1%, whereas the decrease in internal humidity was not obvious. Among the three parks, the humidity in Dongsheng Bajia Park decreased the most, whereas that in Qingnianhu Park decreased the least. This indicated that the humidity inside the park was greater than that in the surrounding city, and the moisture retention and humidification of the water were greater than those of the vegetation in spring, as Qingnianhu Park features a large lake.
Compared with that at 10:00, the wind speed of each park at 14:00 slightly changed (Figure 7). The wind speed outside the park was greater than that inside the park, but this difference was not as obvious as that in summer.
At 14:00, PM2.5 concentrations in each park decreased by 4.5% to 7.1% compared to those at 10:00. The area covered by PM2.5 levels above 8.0 μg·m−3 was reduced by an average of 12.4%, particularly in vegetated zones and lakeside areas.

3.2.3. Analysis of the Microclimate and PM2.5 Diffusion Simulation in Parks During the Winter

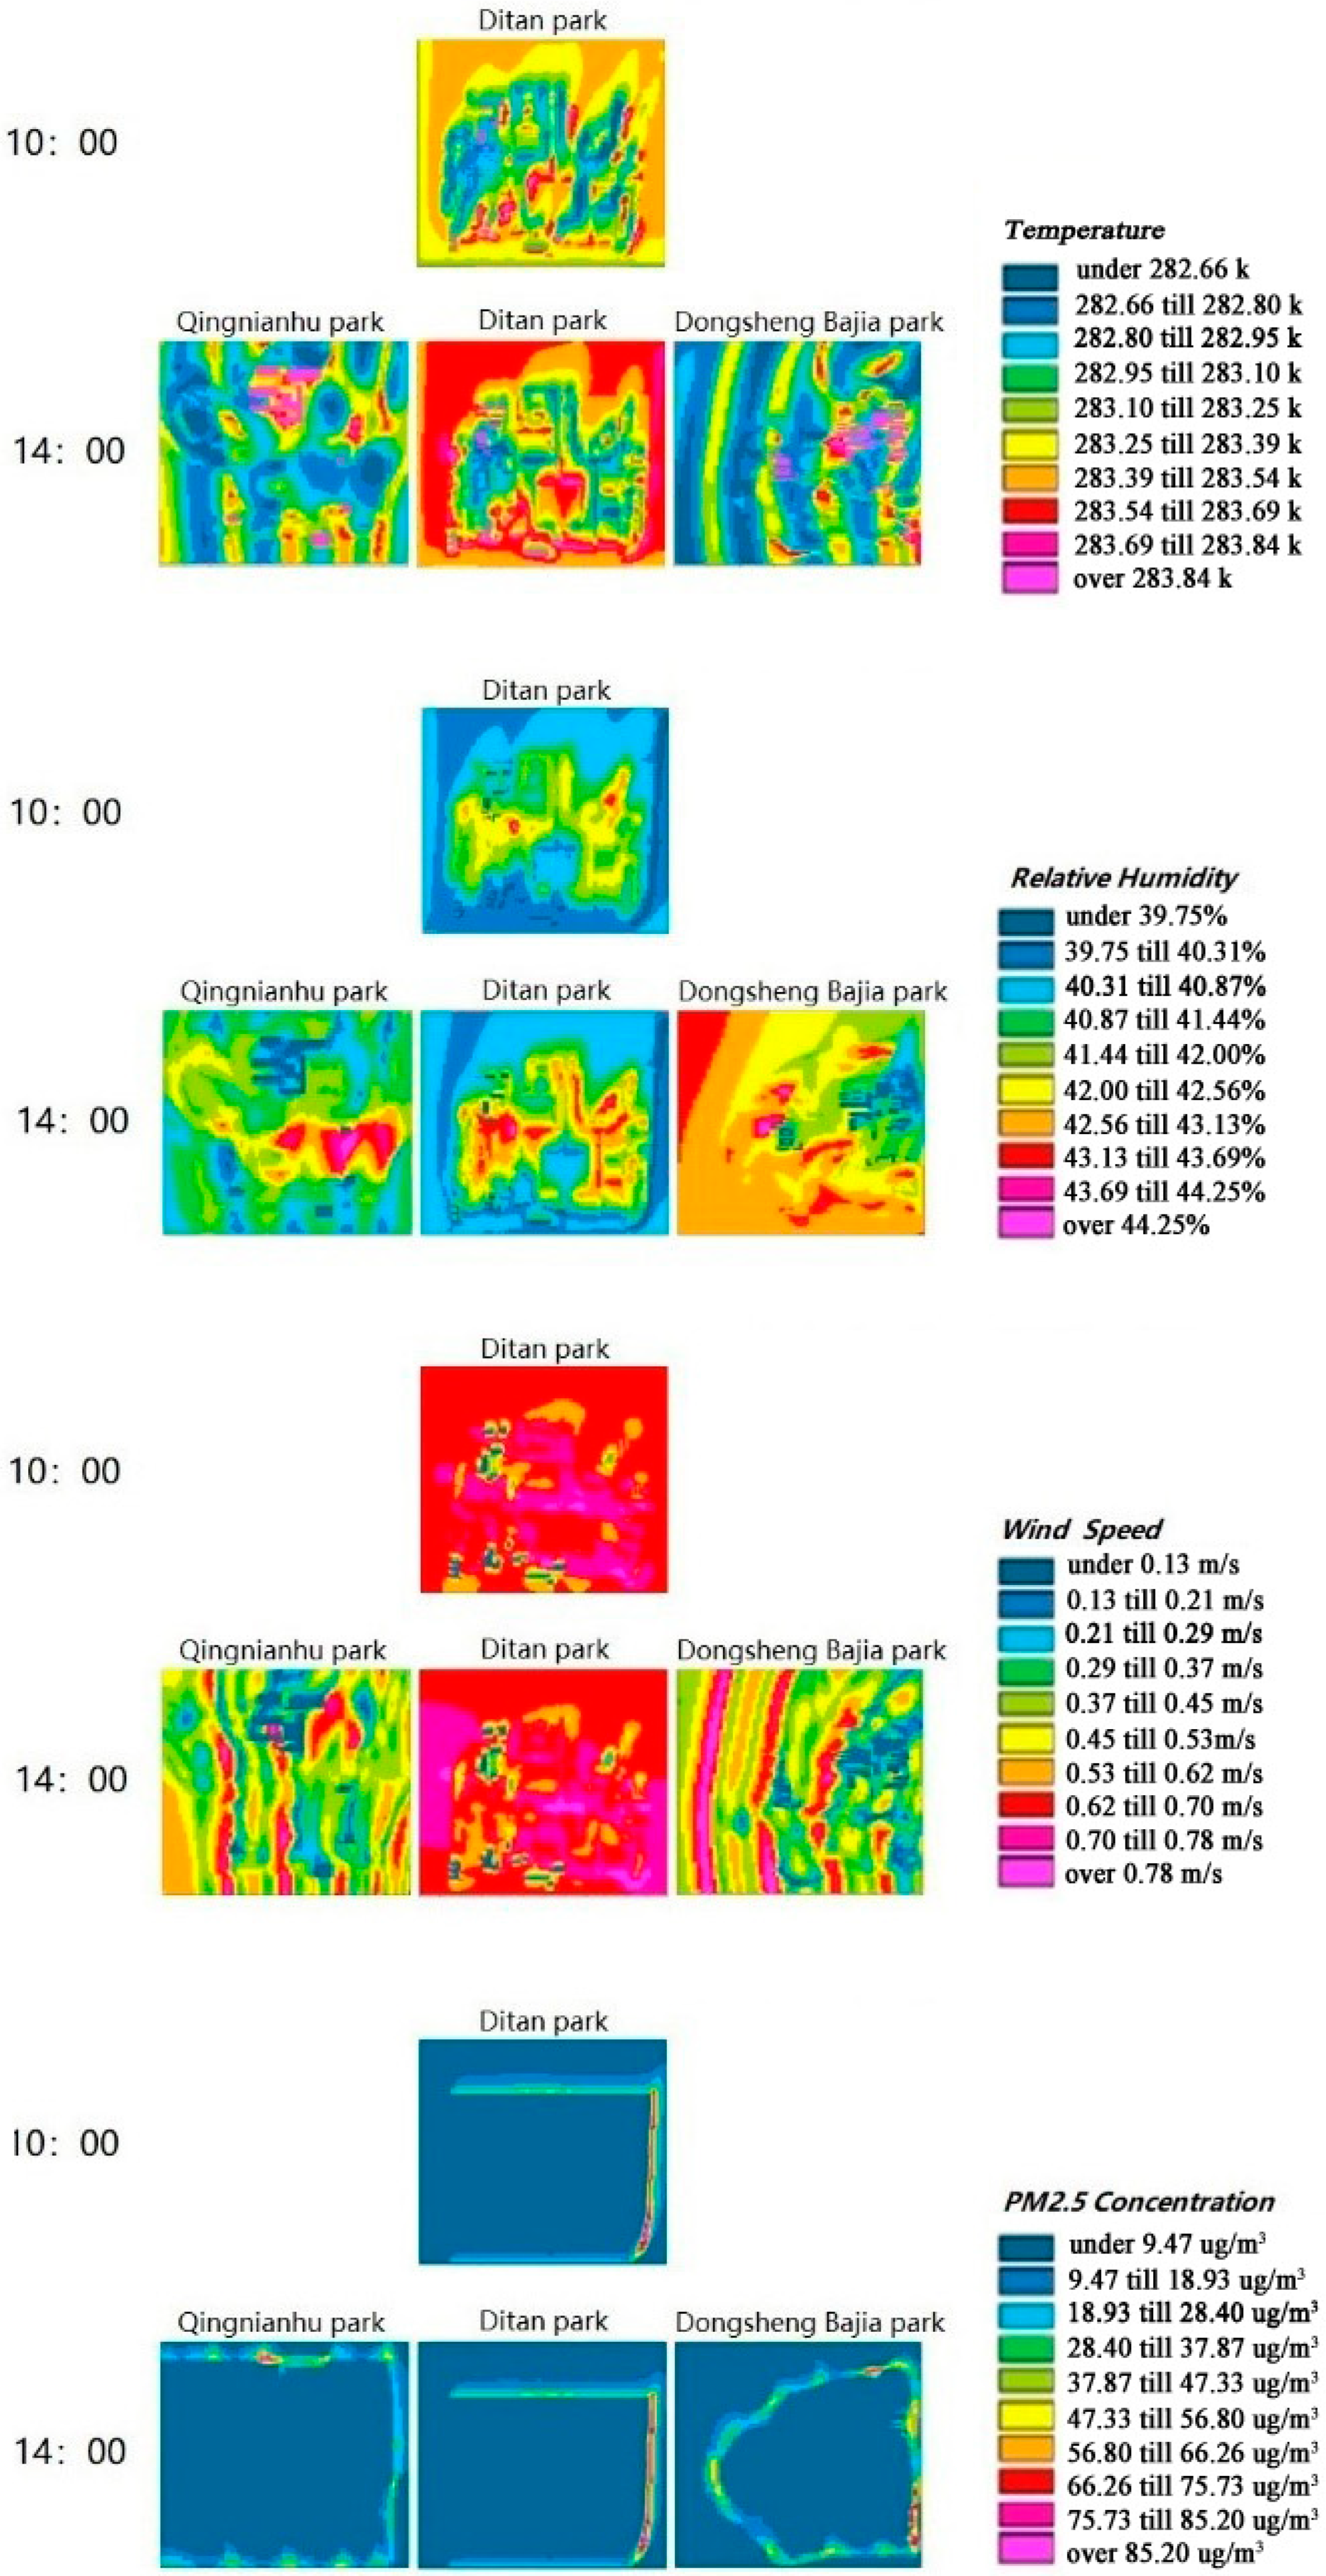
As ENVI-met is unable to model temperatures falling below 0 °C, analysis at Qingnianhu Park and Dongsheng Bajia Park was only performed using the 14:00 measurement once the daytime temperatures exceeded 0 °C on the measured day. The temperature in Ditan Park was above 0 °C at 10:00 on the measured day; therefore, only the changes in temperature, humidity, wind speed and PM2.5 concentration in Ditan Park were explored at 10:00.
Temperature factor: As shown in Figure 8, the temperature in Ditan Park increased by approximately 0.4 °C at 14:00, and the temperature inside the three parks was lower than that outside the parks.
Humidity factor: The humidity in Ditan Park increased at 14:00, but the change outside the park was not obvious (Figure 8). The humidity inside the three parks was greater than that outside the parks, and the humidification effect near the green plants was more pronounced.
Wind speed factor: As shown in Figure 8, the wind speed in Ditan park at 14:00 was slightly higher than that at 10:00.
The PM2.5 concentration in Ditan Park decreased by approximately 9.2% at 14:00, and areas with concentrations below 6.0 μg·m−3 increased by 15.1%, suggesting improved dispersion under slightly warmer afternoon conditions.

3.3. Comparison Between Simulated and Observed Values

3.3.1. Temperature

Over the three seasons, the difference between the simulated and measured values of the park temperature was within 1.5 °C based on the mean of all sampling points within each park. This result indicates a good fit between the model outputs and the observed data. The difference between the simulated and measured values was greatest in summer, within 0.9 °C (Figure 9). In the temperature simulation, the simulated values and measured values of the three parks followed a consistent trend: the simulated values were initially greater than the measured values but were lower than the measured values in the afternoon.
In Qingnianhu Park, snowfall occurred, causing the measured temperature to continue to rise, unlike in the other parks, where the temperature first increased but then decreased. The reason for the temperature deviation is that the heat generated by human activities is not considered in the simulation, and the carbon dioxide generated by human activities increases the temperature.

3.3.2. Relative Humidity

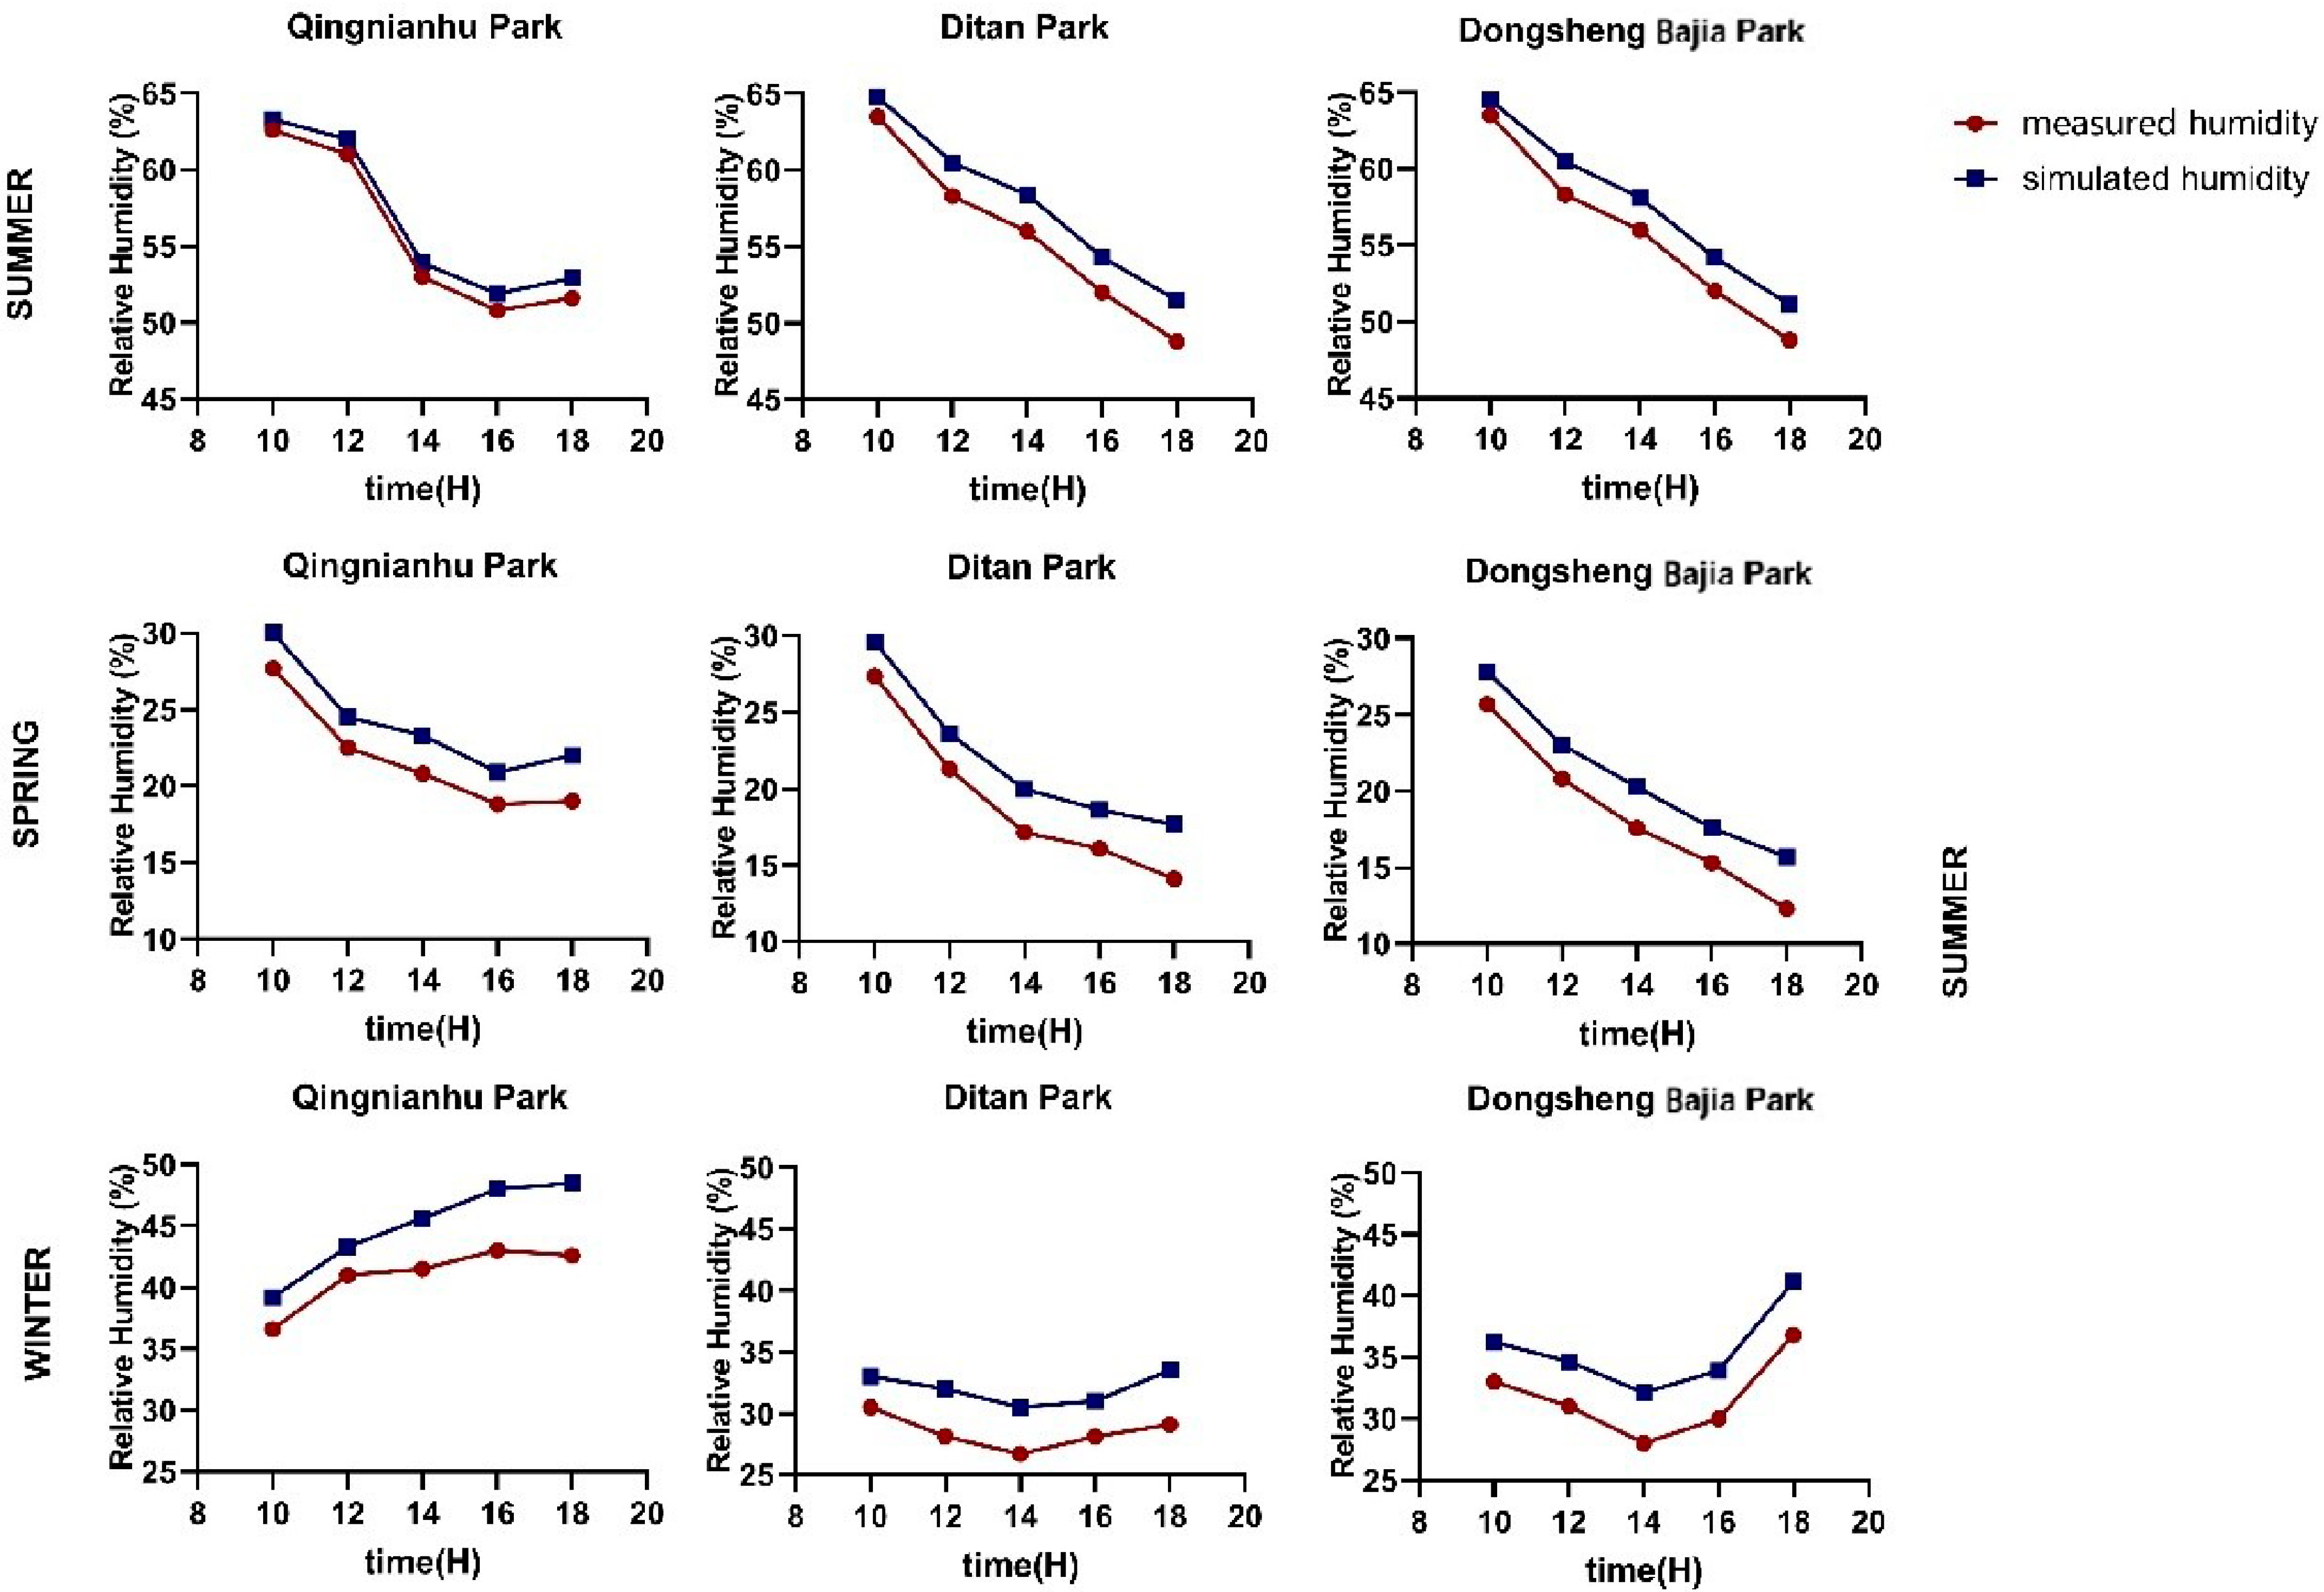
The simulated value of relative humidity was always greater than the measured value. Among the three seasons, the simulation effect in summer was the best. The difference between the simulated and measured values in spring and summer was within 4%, and it was within 6% in winter. The difference between the simulated and measured values of the three parks reached a maximum at 18:00 in the three seasons (Figure 10). In spring and summer, the general trend of the simulated and measured humidities continued to decrease. In winter, due to snowfall at 17:00, the relative humidity in Qingnianhu Park continued to rise before 17:00 and decreased from 17:00 to 18:00. The RH can best represent the water vapor conditions in a region, and snowfall can occur when the water vapor conditions are sufficient, so the measured trend of the RH is consistent with the snowfall process.

3.3.3. Wind Speed

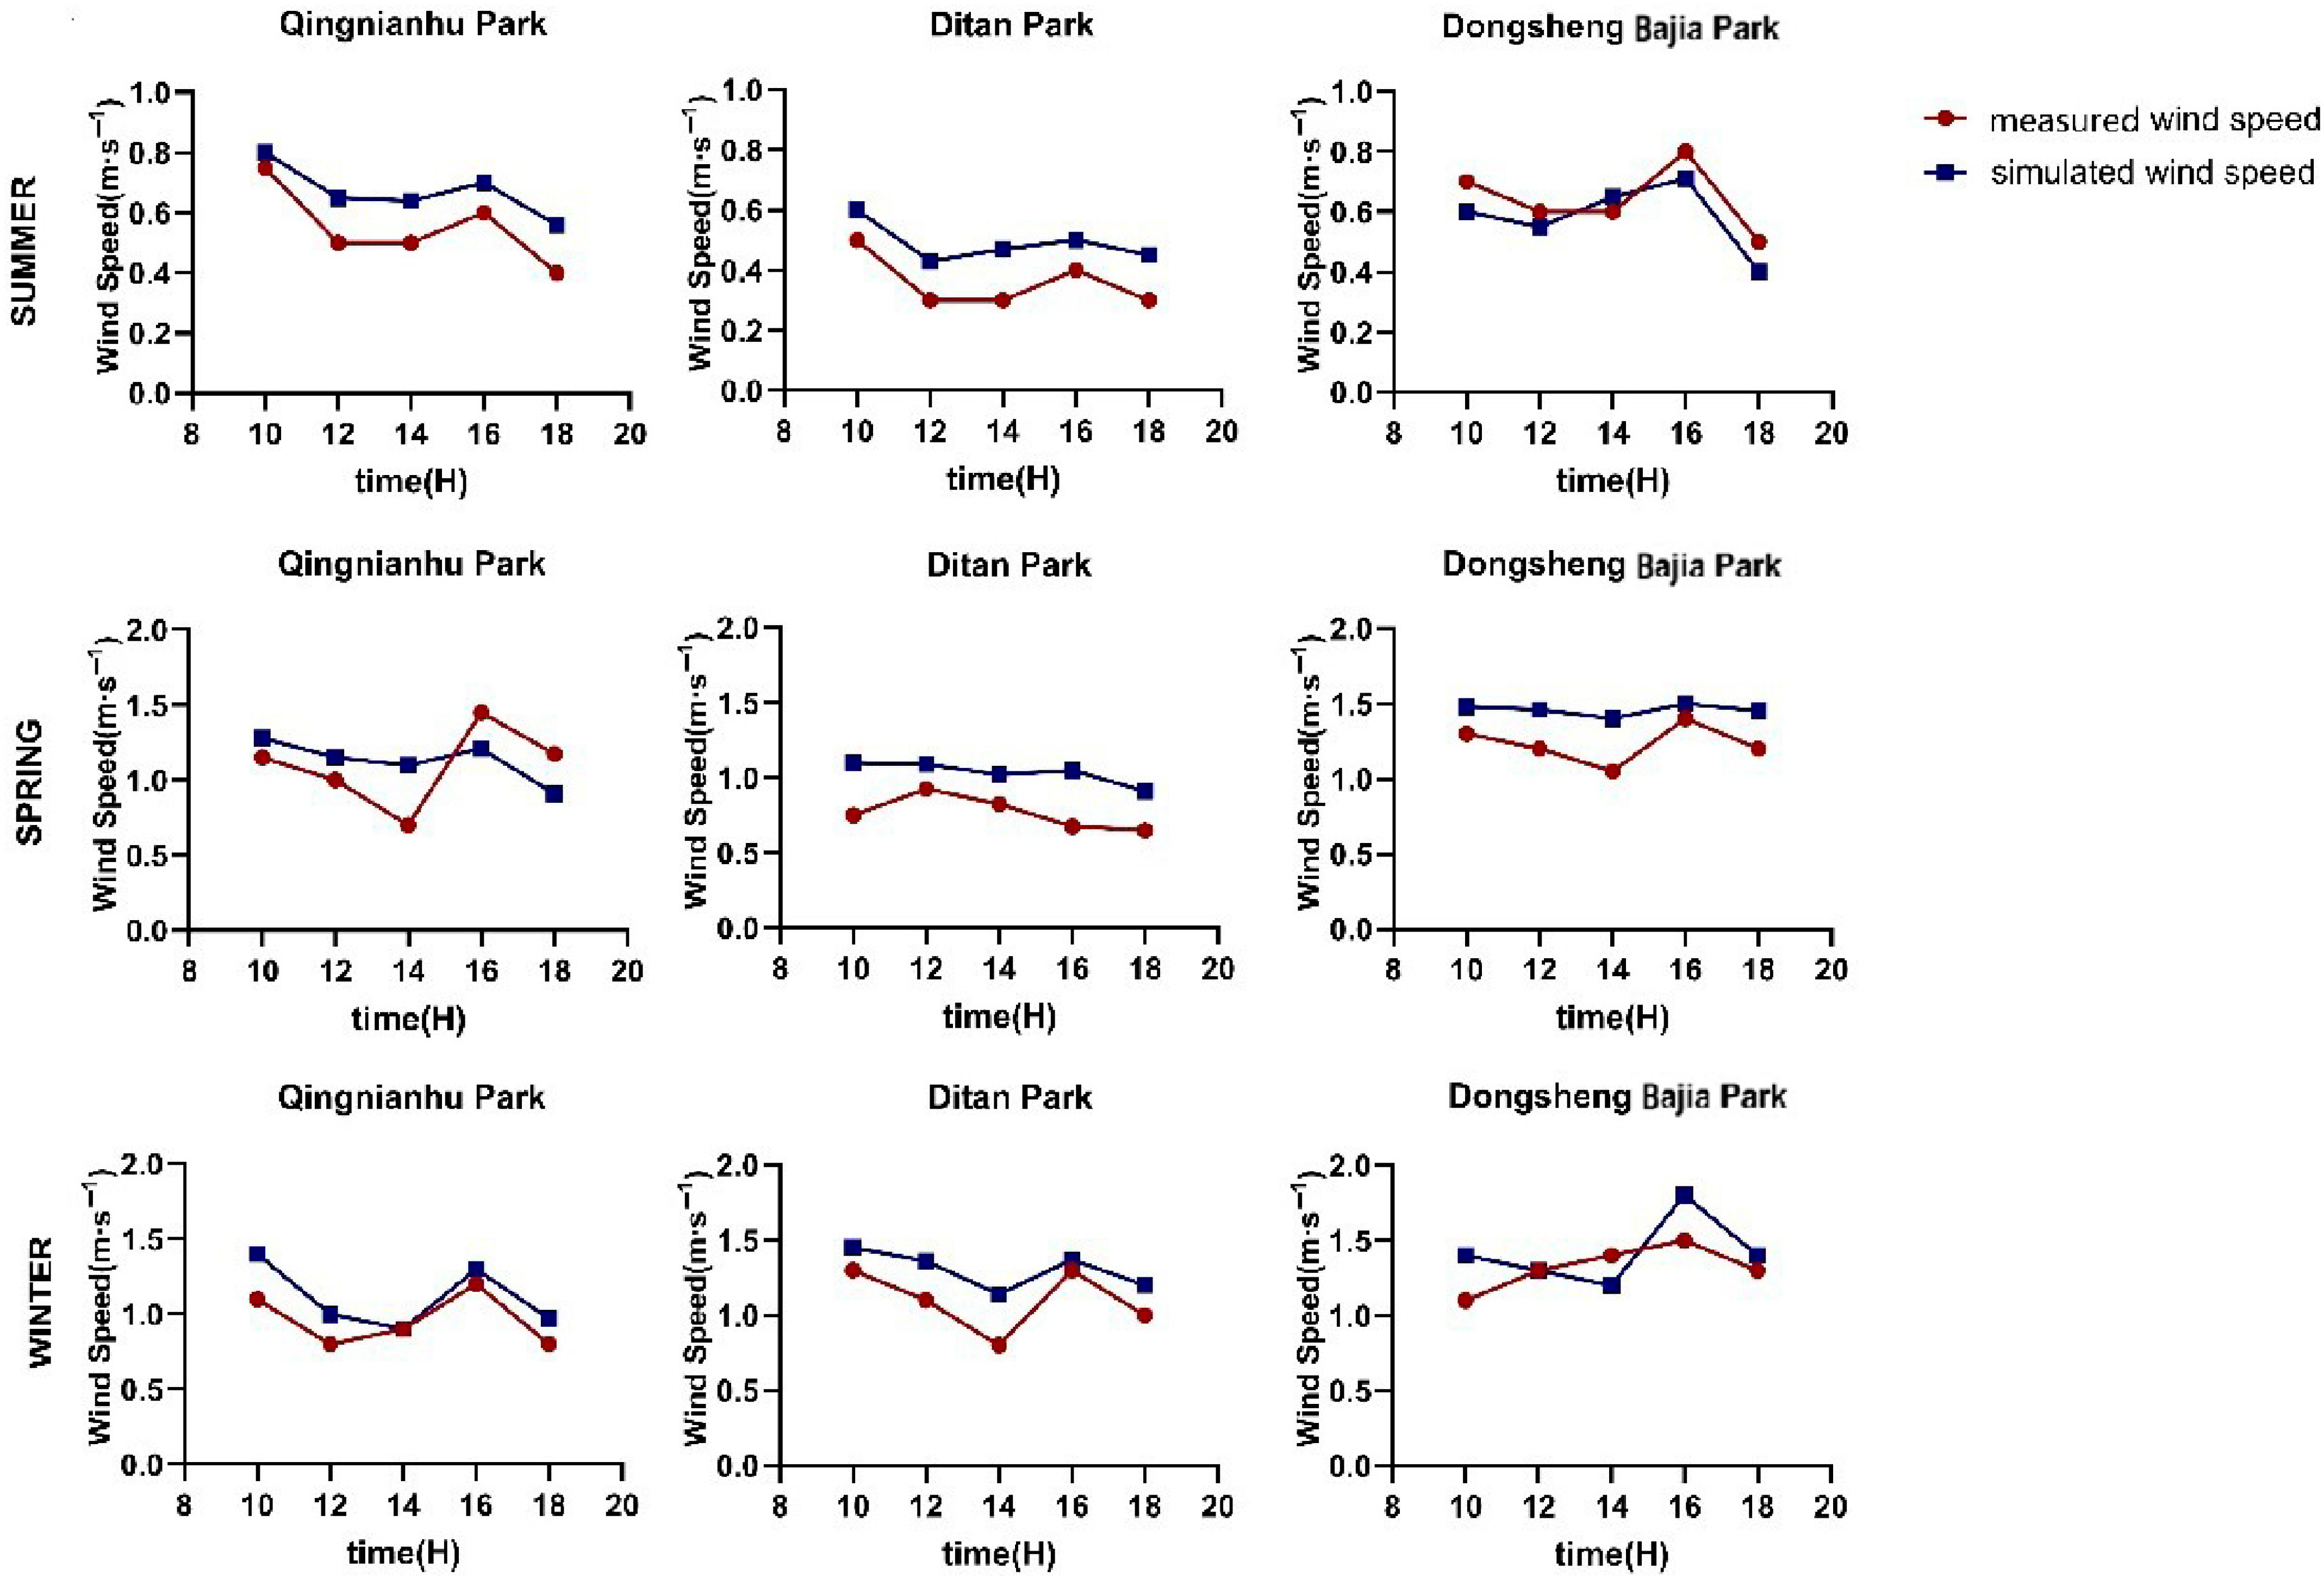
Among the three seasons, the best fit for the wind speed between the observed and measured data was in the summer, where the difference was less than 0.2 m·s−1, and the difference in the wind speed between the spring and winter was within 0.4 m·s−1 (Figure 11). Generally, the wind speed in the three parks reached a maximum in the afternoon, and the wind speed variation law of Qingnianhu Park in the winter was roughly the same as that in the summer and spring, which indicated that the snowfall process had little influence on the wind speed. There was little difference in the wind speed between the eastern and western areas of Dongsheng Bajia Park. The simulated values of Qingnianhu park and Ditan park were generally greater than the measured values because a simplified vegetation model was utilized and the influences of human activities were not included in the model. This is consistent with Zhao [25], who pointed out that the wind speed error originates from two main sources: the simplification of the simulation model or inaccuracies in defining boundary conditions and measurement error due to the variability in wind speed and the model’s reliance on parameterized set values.

3.3.4. PM2.5 Concentration

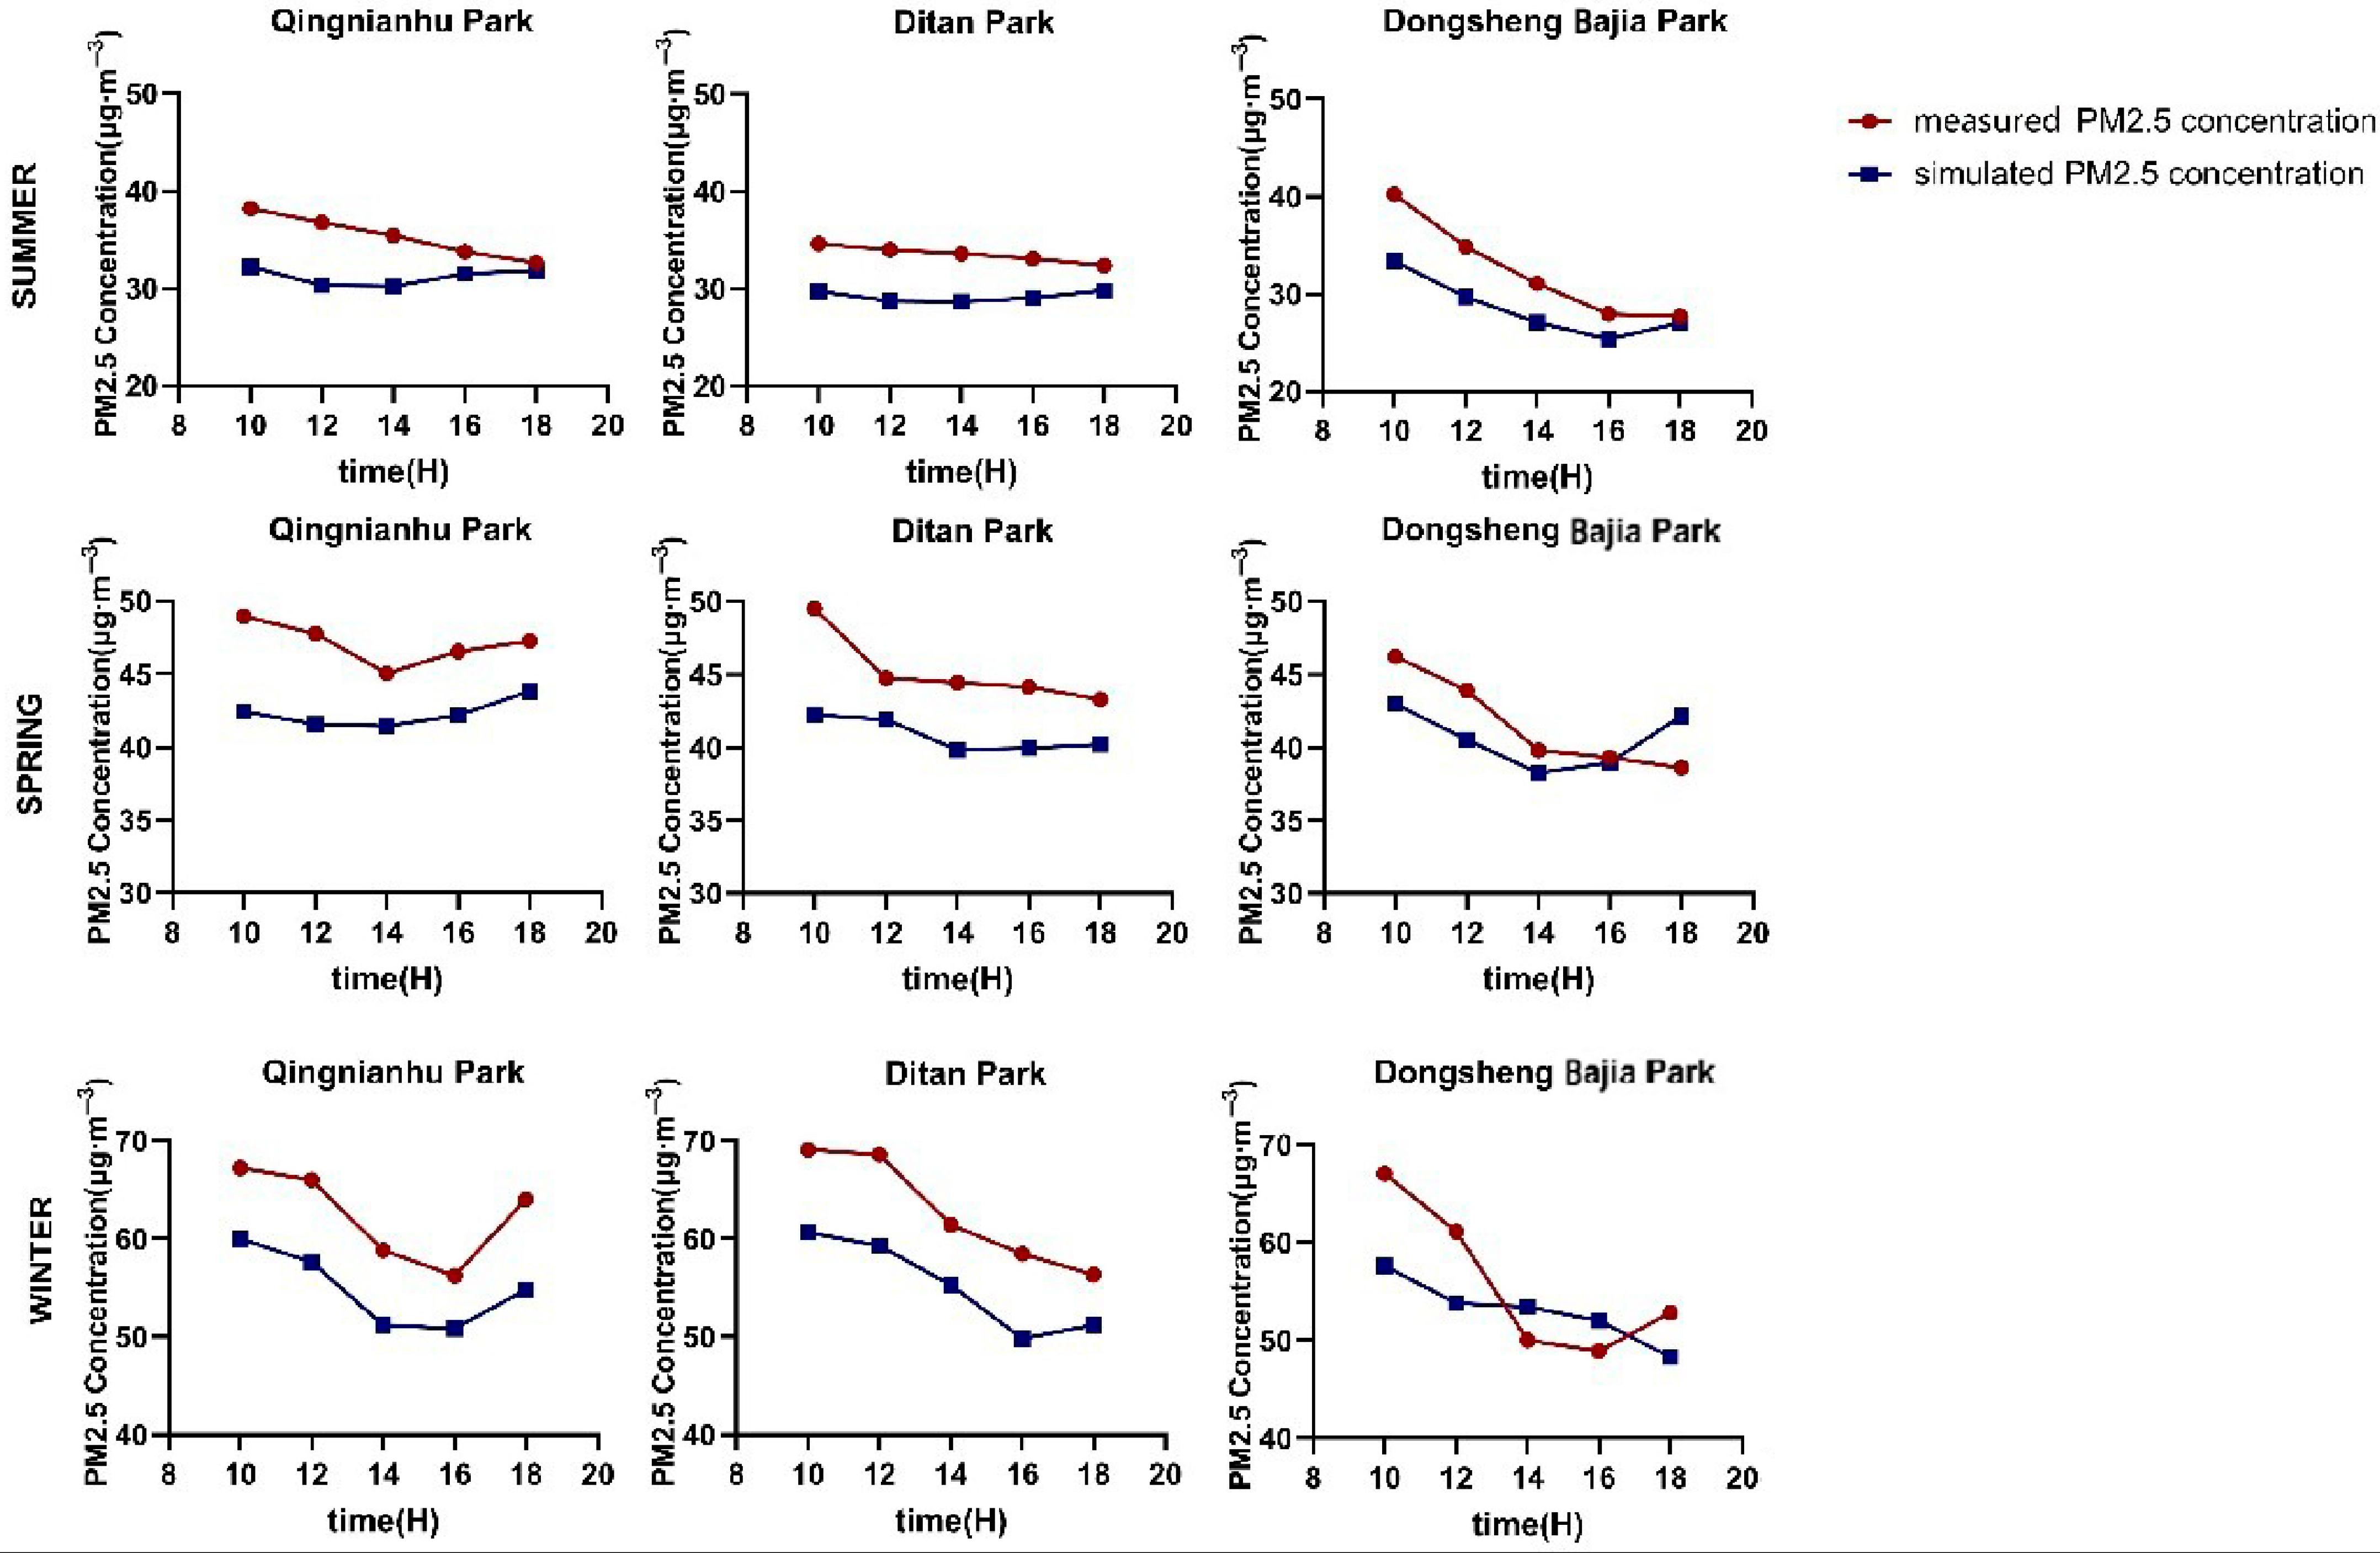
Among the three seasons, the simulation effect in summer was the best, with a maximum difference of 6.89 μg·m−3 (Figure 12). The simulation effect was the worst in winter, but the difference between the measured and simulated values remained below 10 μg·m−3. The change trends of the measured values of the PM2.5 concentration are complicated because the PM2.5 concentration is affected by various factors, such as the wind environment and the dust retention of plants, among which the wind environment is the main influencing factor for the PM2.5 concentration. The measured values were generally higher than the simulated values because the simulation environment was relatively simplified. In particular, the model did not fully account for non-road emission sources such as industrial activities or secondary pollutant formation processes, which can significantly contribute to the ambient concentrations of PM2.5. The concentration of PM2.5 was generally high in winter, which was caused by smog in northern cities in winter.

3.4. Evaluating the Accuracy of Simulation on the Basis of the RMSE and MAPE

The accuracy of the model simulation was evaluated using RMSE and MAPE, as described in Section 3.4. The quantitative evaluations of the simulation results are shown in Table 5. The MAPE values of temperature, relative humidity, and PM2.5 concentrations in the three parks in summer were all less than 10%, and the MAPE values of wind speed were all less than 17%, indicating that this model can effectively simulate summer park conditions. The RMSE and MAPE of most quantitative analysis parameters in spring were greater than those in summer, indicating that the simulation effect in summer was better than that in spring. In winter, the model was generally more accurate at Ditan Park than at Qingnianhu and Dongsheng Bajia Park.
The RMSE and MAPE of the four quantitative analysis parameters of Qingnianhu Park in the three seasons indicate that the simulation effect of Qingnianhu Park in summer was the best, followed by that in spring and winter, probably because the simulation results were not as good in winter. In terms of the RMSE and MAPE of the wind speed and PM2.5 concentration in Dongsheng Bajia and Ditan Parks, the simulation error in the wind speed decreased from summer to spring and increased from spring to winter, and the error in the PM2.5 concentration decreased from summer to spring and increased from spring to winter; however, the change in the temperature and relative humidity error exhibited no obvious trend.

4. Discussion

The simulation results indicated that the microclimatic conditions inside the parks were generally better than those in the surrounding urban environments. This finding is consistent with that of Zhang et al. [11], who used ENVI-met to simulate the microclimate of the Olympic Sports Center Park. This study further analyzed the seasonal variations in four quantitative parameters. Across all three parks studied, the internal park temperatures were generally lower than those in the surrounding urban areas. Among them, Dongsheng Bajia Park, with its high vegetation coverage, exhibited the most pronounced cooling effect. The cooling impact of parks was especially evident in summer, with temperature differences between park interiors and surrounding areas reaching approximately 3 °C. The temperature was lower in areas near buildings or where vegetation was concentrated, which was consistent with the results of simulations of the thermal environment of urban parks in Baoding, Hebei Province, by ENVI-met [26].
The relative humidity within parks was consistently greater than that in adjacent urban zones, particularly in areas with dense vegetation or close proximity to water bodies. Qingnianhu Park, characterized by its large lake, had the strongest humidifying effect during spring and summer. Both the simulated and observed humidity levels generally decreased throughout spring and summer, which aligns with the findings of Qin et al. [14] for summer and Zhang et al. [27] for spring. In winter, the relative humidity in Qingnianhu Park initially increased but then decreased following snowfall, mirroring the pattern observed by Zhang et al. [28] at a height of 2 m at the meteorological observatory in Gande County, Qinghai Province.
The wind speed was generally lower within parks than in surrounding urban areas, highlighting the moderating effects of vegetation and landscape features on the urban microclimate and air quality. Wind speed was significantly reduced in parks, primarily due to the shading and wind-breaking effects of vegetation and built structures [29]. This effect was most evident in densely wooded areas, whereas open spaces such as plazas experienced relatively high wind speeds. The seasonal variations in wind speed during winter followed a similar pattern to those observed in spring and summer.
Through index evaluation and comparison with field measurements, this study confirms the feasibility of using ENVI-met to model microclimates and PM2.5 dispersion in these three parks. Nonetheless, seasonal differences in simulation accuracy were observed. The wind speed simulation errors decreased from summer to spring but increased again in winter. Similarly, the PM2.5 concentration errors followed a decreasing trend from summer to spring, followed by an increase in winter. In contrast, no clear seasonal pattern was observed for the temperature and relative humidity simulation errors. According to Zhang’s research [30], the shadow of buildings and the shade of trees can obviously reduce the ambient temperature, and the simulation error of relative humidity may be caused by the deviation between the plant model in the sample plot and the actual plants [31,32]. Therefore, the difference in the error change laws of temperature and relative humidity between the two parks may be caused by the difference in the setting laws of the buildings and plant models.
While ENVI-met offers advantages in simulating realistic and dynamic three-dimensional microclimates, it also has certain limitations. A limitation of ENVI-met is that the model is unable to simulate a microclimate below 0 °C [33]. Therefore, the initial winter temperature at 8:00 in the simulation of Dongsheng Bajia Park was set to 0 °C. Because of this limitation, in the winter temperature simulation, the difference between the simulated values and measured values in Dongsheng Bajia Park was the greatest. In addition, ENVI-met has some limitations in the concentration simulation of PM2.5 in some areas, and the actual measured value is larger than the simulation value. There are two reasons for this difference. First, the model is only applicable in small areas, such as street canyons, residential quarters, and office areas. However, with increasing distance inside the parks, the accuracy at these larger scales decreased. Second, the concentration of PM2.5 in parks originates not only from road dust but also from chemical plants, human activities, and other factors [12,34]. Future improvements to ENVI-met should include the integration of more diverse and dynamic pollution sources to better reflect real-world environmental complexity.

5. Conclusions

This study selected three representative urban parks in Beijing and integrated remote sensing data with field observations to simulate the spatial-temporal patterns of temperature, relative humidity, wind speed, and PM2.5 concentration using the ENVI-met model. By combining satellite imagery and ground-based data, the study aimed to provide a comprehensive understanding of how urban parks impact both the microclimate and air quality. The seasonal variability in microclimatic regulation and PM2.5 dispersion capacities of the parks was evaluated. The main conclusions are as follows:
(1) Urban parks significantly improve local microclimate conditions, with the most significant cooling effects observed during the summer months. Parks featuring high vegetation coverage and water bodies demonstrate enhanced ecological regulation functions, contributing to improved environmental quality.
(2) The ENVI-met model proved to be a feasible tool for simulating the microclimate and PM2.5 dispersion in urban parks. It demonstrated the highest accuracy during summer, particularly for temperature and humidity simulations, as verified by RMSE and MAPE evaluations compared with field data. However, discrepancies were noted in PM2.5 concentration simulations, especially at larger scales.
(3) Seasonal variations were observed in the microclimate and PM2.5 dispersion, with the model showing the best performance in summer and the largest errors in winter. These errors are likely due to the model’s inability to simulate temperatures below 0 °C and its simplified treatment of complex pollution sources.
(4) Future research should focus on enhancing the adaptability of ENVI-met to more complex urban environments by incorporating a wider range of pollution emission scenarios and improving model parameterization to better reflect real-world conditions. Additionally, it should explore ways to integrate real-time monitoring data to provide more dynamic and accurate simulations.

Author Contributions

Conceptualization, J.W.; methodology, N.X. and J.W.; formal analysis, H.S., F.Z., Y.Y., J.J., Q.L. and D.L.; investigation, H.S., F.Z., Y.Y., J.J., Q.L. and D.L.; writing—original draft preparation, N.X. and J.W.; writing—review and editing, N.X., J.W., H.S., F.Z., Y.Y., J.J., Q.L. and D.L.; visualization, N.X., J.W., H.S., F.Z., Y.Y., J.J., Q.L. and D.L.; supervision, J.W.; funding acquisition, N.X. All authors have read and agreed to the published version of the manuscript.

Funding

This research was funded by the Fundamental Research Funds for the Natural Science Foundation of China (grant number 42330507, 42071342), the Foundation of Beijing Key Laboratory of Precision Forestry, Beijing Forestry University (grant number BFUKF202503), and the Foundation of Beijing City University (grant number KYQH202468).

Institutional Review Board Statement

Not applicable.

Informed Consent Statement

Not applicable.

Data Availability Statement

Data are contained within the article.

Acknowledgments

We are grateful to the teachers of Beijing City University and Beijing Forestry University.

Conflicts of Interest

The authors declare no conflicts of interest.

References

  1. Wang, Y.; Shi, P.; Zhao, W.; Wang, Z.; Xie, X. Spatial-temporal characteristics and influencing factors of thermal environment in Lanzhou. Ecol. Sci. 2022, 41, 59–65. [Google Scholar] [CrossRef]
  2. Manley, G. On the frequency of snowfall in metropolitan England. Q. J. R. Meteorol. Soc. 1958, 84, 70–72. [Google Scholar] [CrossRef]
  3. Nie, J.; Zhang, J.; Huang, B. A review of the human health consequences of urban heat island effect. Ecol. Sci. 2021, 40, 200–208. [Google Scholar] [CrossRef]
  4. Peng, X.; Zou, H.; He, Z. Influence of urban heat island effect on urban ecological system and research of antidote. Jiangxi Sci. 2003, 3, 257–259. [Google Scholar] [CrossRef]
  5. Shen, S.; Liu, L.; Wen, W.; Xing, Y.; Su, W.; Sun, J.Q. Pollution characterization and source analysis of carbon components of PM2.5 in Beijing and surrounding areas in summer. Environ. Eng. 2022, 40, 71–80. [Google Scholar] [CrossRef]
  6. Oke, T.R.; Crowther, J.M.; McNaughton, K.G.; Gardiner, B. The micrometeorology of the urban forest and discussion. Philos. Trans. R. Soc. Lond. B 1989, 324, 335–349. [Google Scholar] [CrossRef]
  7. Huang, Y.J.; Akbari, H.; Taha, H.; Rosenfeld, A.H. The potential of vegetation in reducing summer cooling loads in residential buildings. J. Clim. Appl. Meteorol. 1987, 26, 1103–1116. [Google Scholar] [CrossRef]
  8. Taha, H. Urban climates and heat islands: Albedo, evapotranspiration, and anthropogenic heat. Energy Build. 1997, 25, 99–103. [Google Scholar] [CrossRef]
  9. Chen, Z.; Chen, F.M.; Zhu, F.G.; Cao, L.; Shen, X.H.; Li, J.X. Effects of park size and plant community structure on urban park air temperature. Chin. J. Ecol. 2011, 30, 2590–2596. [Google Scholar] [CrossRef]
  10. Dimoudi, A.; Nikolopoulou, M. Vegetation in the urban environment: Microclimatic analysis and benefits. Energy Build. 2003, 35, 69–76. [Google Scholar] [CrossRef]
  11. Zhang, F.; Li, L. Spatial microclimate simulation of plant community based on human comfort—Taking Olympic Forest Park as an example. J. Beijing Univ. Civ. Eng. Archit. 2020, 36, 30–39. [Google Scholar] [CrossRef]
  12. Zhu, L.; Gu, K.; Fang, Y. Study on the correlation between space form of urban residential areas and PM2.5 concentration based on ENVI-met. Ecol. Environ. Sci. 2019, 28, 1613–1621. [Google Scholar] [CrossRef]
  13. Sun, L. Research on shrubs of temperature and moisture and numerical computation. China Univ. Min. Technol. 2015. Available online: https://kns.cnki.net/KCMS/detail/detail.aspx?dbname=CMFD201601&filename=1015972290.nh (accessed on 10 January 2025).
  14. Qin, W.; Hu, D.; Li, Y.; Guo, Z. Numerical simulation of microclimate in Beijing typical residential area based on ENVI-met model. J. Meteorol. Environ. 2015, 31, 56–62. Available online: https://d.wanfangdata.com.cn/periodical/ChVQZXJpb2RpY2FsQ0hJMjAyNTA2MjISDWxucXgyMDE1MDMwMDkaCGRnemRwYzJs (accessed on 10 January 2025).
  15. Lao, Z.; Li, Y.; Deng, X.; Li, Y. Numerical simulation of thermal environment in Zhongshan urban streets based on ENVI-met. Chin. Environ. Sci. 2017, 37, 3523–3531. [Google Scholar]
  16. Ma, T. Study on microclimate measurement and simulation in Hohhot urban park—Take Aertai park for example. Inner Mongolia Univ. Technol. 2018. Available online: https://kns.cnki.net/kcms/detail/detail.aspx?filename=1018795391.nh (accessed on 10 January 2025).
  17. Vos, P.E.J.; Maiheu, B.; Vankerkom, J.; Janssen, S. Improving local air quality in cities: To tree or not to tree. Environ. Pollut. 2013, 183, 113–122. [Google Scholar] [CrossRef]
  18. Nikolova, I.; Janssen, S.; Vos, P.; Berghmans, P. Modelling the mixing of size resolved traffic induced and background ultrafine particles from an urban street canyon to adjacent backyards. Aerosol Air Qual. Res. 2014, 14, 145–155. [Google Scholar] [CrossRef]
  19. Wang, Y.; Qiao, Y.; Wang, N. Application of CFD simulation in urban microclimate in China. J. Chin. Urban For. 2021, 19, 53–60. [Google Scholar] [CrossRef]
  20. Bruse, M.; Fleer, H. Simulating surface-plant-air interactions inside urban environments with a three-dimensional numerical model. Environ. Softw. Model. 1998, 13, 373–384. [Google Scholar] [CrossRef]
  21. Detommaso, M.; Costanzo, V.; Nocera, F. Application of weather data morphing for calibration of urban ENVI-met microclimate models: Results and critical issues. Urban Clim. 2021, 38, 100895. [Google Scholar] [CrossRef]
  22. Liu, Z.; Cheng, W.; Jim, C.Y.; Morakinyo, T.E.; Shi, Y.; Ng, E. Heat mitigation benefits of urban green and blue infrastructures: A systematic review of modeling techniques, validation and scenario simulation in ENVI-met V4. Build. Environ. 2021, 200, 107939. [Google Scholar] [CrossRef]
  23. Fan, S.; Zhang, D.; Tian, L.; Li, X.; Guo, J.; Lin, Y. Emission inventory and spatial distribution of road fugitive dust PM2.5 in Beijing. Res. Environ. Sci. 2016, 29, 20–28. (In Chinese) [Google Scholar]
  24. Zhang, W. Numerical Study of the Impact of Green Space Layout on Microclimate in Residential District. Master’s Thesis, Nanjing University, Nanjing, China, 2015. Available online: https://kns.cnki.net/kcms/detail/detail.aspx?filename=1015321521.nh (accessed on 10 January 2025).
  25. Zhao, Z. Research on microclimate simulation and optimization strategy of university campus based on ENVI-met: Taking Shenyang Agricultural University as an example. Master’s Thesis, Yanbian University, Yanbian, China, 2024. (In Chinese). [Google Scholar]
  26. Zhang, X.; Nie, Q.; Liu, J. Research on urban geothermal comfort improvement strategy based on ENVI-met. Ecol. Sci. 2021, 40, 144–155. [Google Scholar] [CrossRef]
  27. Wang, X.; Zhang, Y.; Zhang, J.; Fu, C.; Zhang, X. Progress in urban metabolism research and hotspot analysis based on CiteSpace analysis. J. Clean. Prod. 2021, 281, 125224. [Google Scholar] [CrossRef]
  28. Zhang, H.; Xiao, J.; Chen, Q.; Jiang, M. Micro-meteorological characteristics analysis of two snowfall processes in Gandi of Qinghai Province. Meteorol. Mon. 2019, 45, 1093–1103. [Google Scholar]
  29. Wang, Y.; Zhou, D.; Wang, Y.; Fang, Y.; Yuan, Y.; Lv, L. Comparative study of urban residential design and microclimate characteristics based on ENVI-met simulation. Indoor Built Environ. 2019, 28, 1200–1216. [Google Scholar] [CrossRef]
  30. Zhang, M.; Gao, Z. Effect of urban form on microclimate and energy loads: Case study of generic residential district prototypes in Nanjing, China. Sustain. Cities Soc. 2021, 70, 102930. [Google Scholar] [CrossRef]
  31. Geng, H.; Wei, X.; Zhang, M.; Li, Q. Influence of vegetation and architecture on microclimate based on ENVI-met: A case study of Nanjing Agricultural University. J. Beijing For. Univ. 2020, 42, 115–124. [Google Scholar]
  32. Chen, Y.; Chen, N.; Zhai, Y.; Dai, Y. Predictability of a cold vortex snowfall process in Ningxia in the late autumn of 2015. J. Arid Meteorol. 2017, 35, 465–474. [Google Scholar]
  33. Cortes, A.; Rejuso, A.J.; Santos, J.A.; Blanco, A. Evaluating mitigation strategies for urban heat island in Mandaue City using ENVI-met. J. Urban Manag. 2022, 11, 97–106. [Google Scholar] [CrossRef]
  34. Jia, X.; Yan, P.; Meng, Z.; Tang, J.; Zhang, Y.; Yan, X. Characteristics of PM2.5 during heavy pollution in Beijing and its surrounding areas from November to December, 2016. J. Appl. Meteorol. Sci. 2019, 30, 302–315. [Google Scholar] [CrossRef]
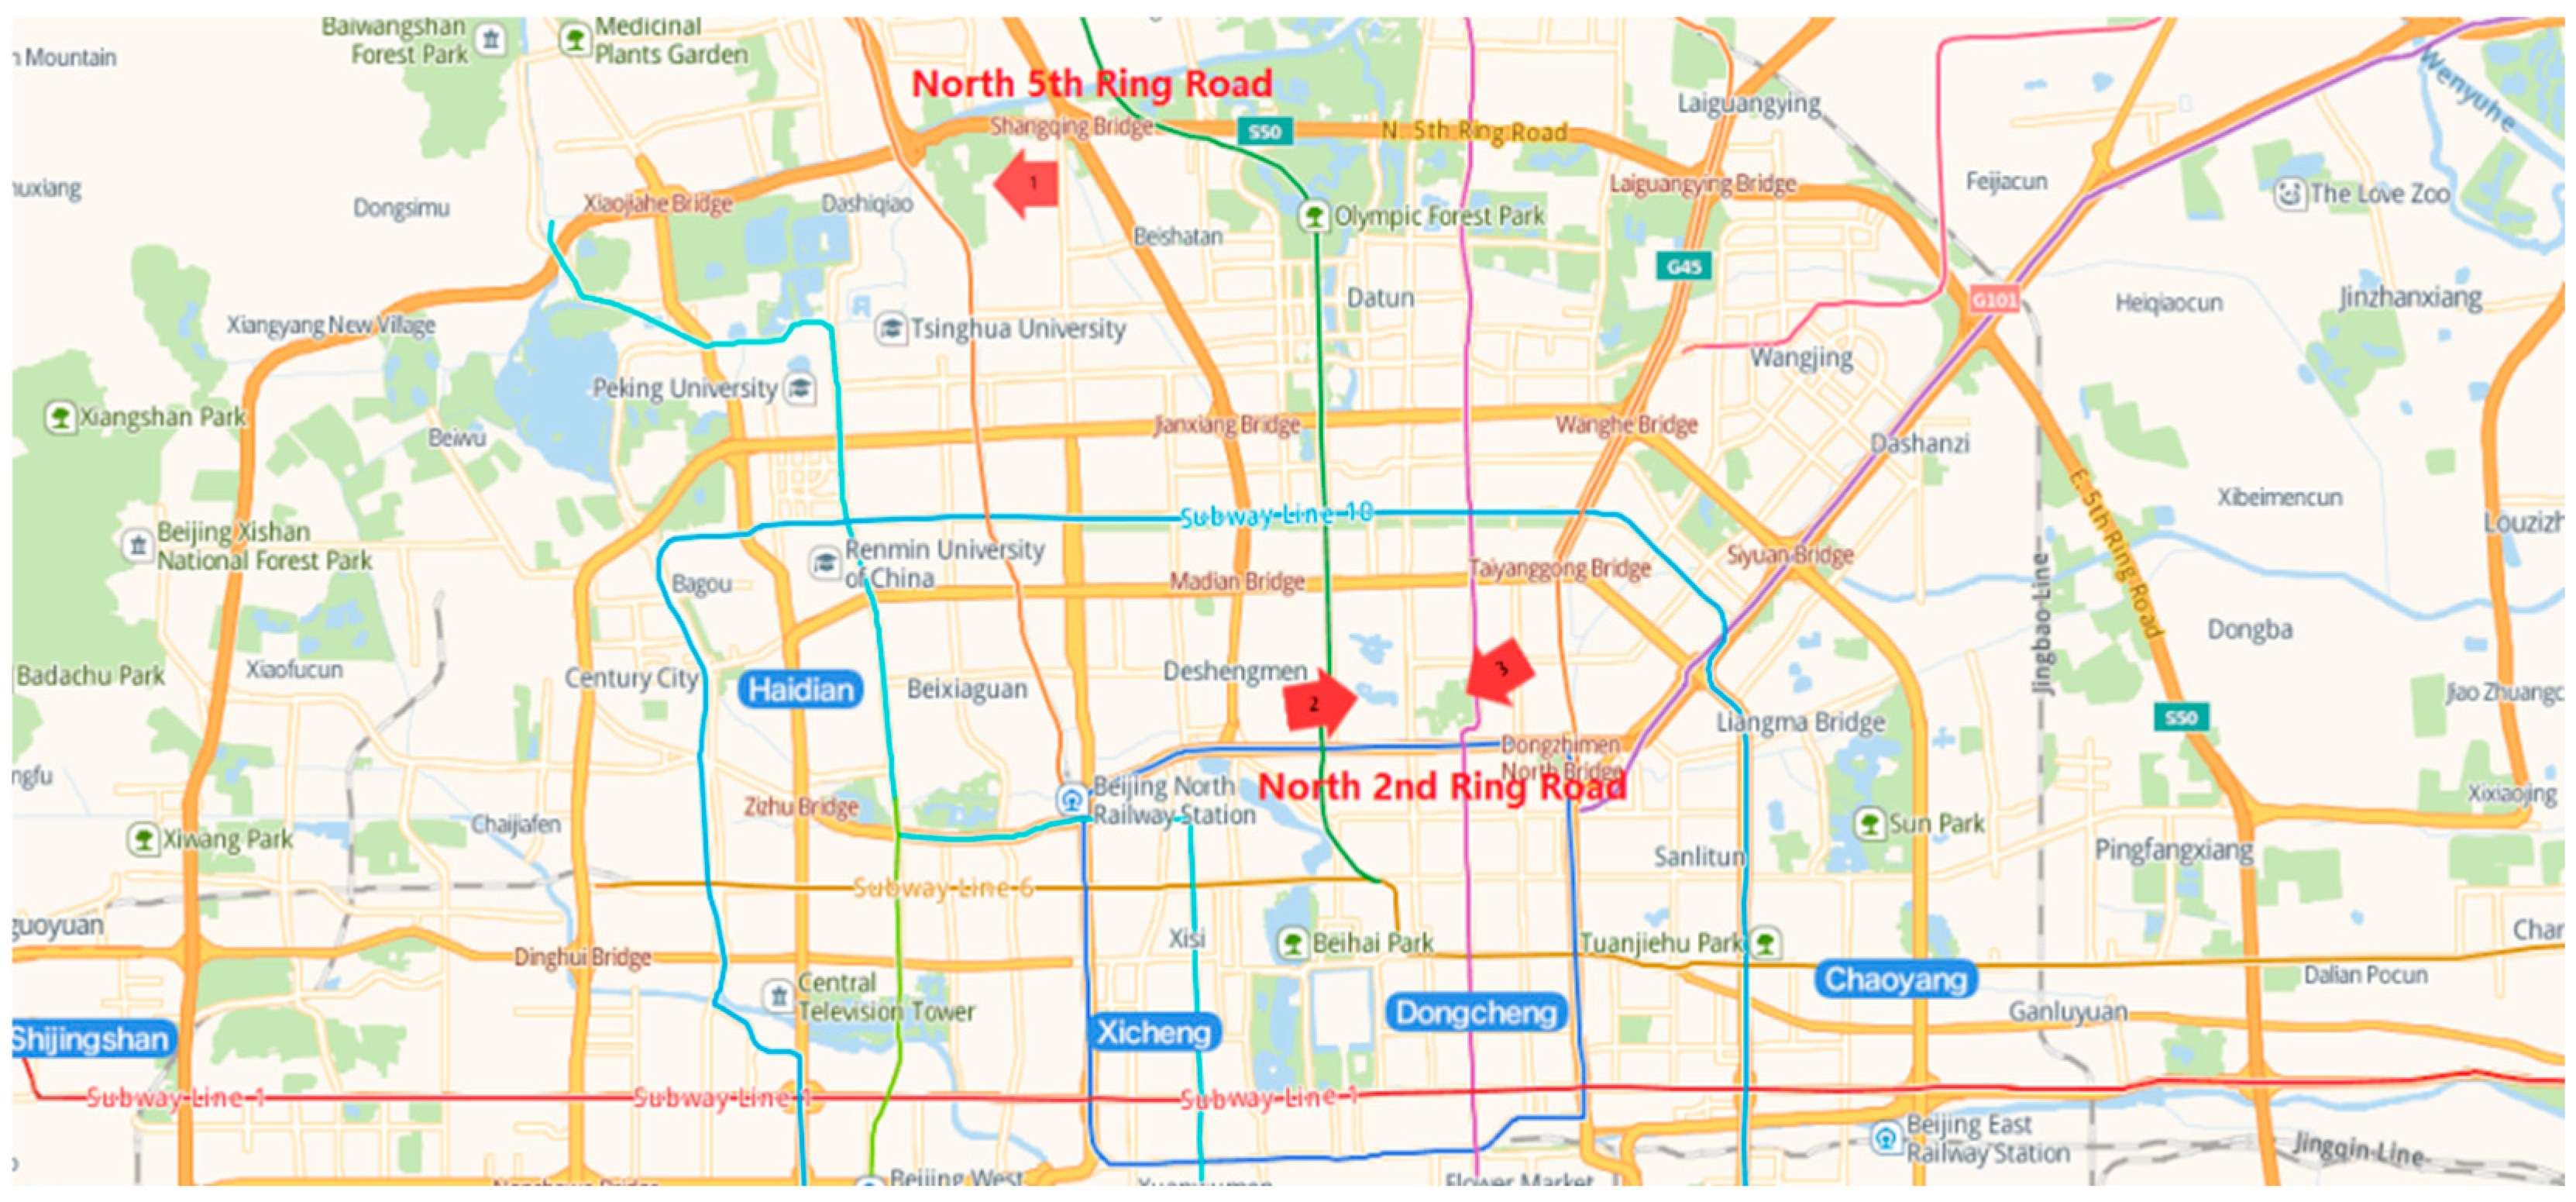
Figure 1. Park distribution map (from English webpage version of amap). The arrows indicate the park locations: 1. Dongsheng Bajia Park, 2. Qingnianhu Park, and 3. Ditan Park.
Sustainability 17 07247 g001
Figure 2. Park sampling locations (from English webpage version of amap): (a) Qingnianhu Park, (b) Ditan Park, (c) Dongsheng Bajia Park.
Sustainability 17 07247 g002
Figure 3. The classification map of the underlying surface (taking the Dongsheng Bajia Park base map as an example).
Sustainability 17 07247 g003
Figure 4. Two-dimensional model (taking Dongsheng Bajia Park as an example).
Sustainability 17 07247 g004
Figure 5. Three-dimensional model (taking Dongsheng Bajia Park as an example).
Sustainability 17 07247 g005
Figure 6. Simulated microclimate and PM2.5 diffusion in summer.
Sustainability 17 07247 g006
Figure 7. Simulated microclimate and PM2.5 diffusion in spring.
Sustainability 17 07247 g007
Figure 8. Simulated microclimate and PM2.5 diffusion in winter.
Sustainability 17 07247 g008
Figure 9. Comparison between the simulated and measured temperatures of the parks in the three seasons.
Sustainability 17 07247 g009
Figure 10. Comparison between the simulated and measured humidities of the parks in the three seasons.
Sustainability 17 07247 g010
Figure 11. Comparison between the simulated and measured wind speeds in the parks in the three seasons.
Sustainability 17 07247 g011
Figure 12. Comparison between the simulated and measured PM2.5 concentrations in the parks in the three seasons.
Sustainability 17 07247 g012
Table 1. Park attributes.
ParkArea [ha]Greening Rate [%]
Qingnianhu1739.8
Ditan37.462.43
Dongsheng Bajia101.581.79
Table 2. Data collection.
Meteorological FactorEquipmentParkNumber of Observatories
Temperature, relative humidityKestrel 4500 (Nielsen-Kellerman Co., Boothwyn, PA, USA)Qingnianhu, Ditan, Dongsheng Bajia4, 4, 6
Wind speed, wind directionKestrel 4500 (Nielsen-Kellerman Co., Boothwyn, PA, USA)Qingnianhu, Ditan, Dongsheng Bajia4, 4, 6
Concentration of PM2.5Dustmate (Turnkey Instruments Ltd., Cheshire, UK)Qingnianhu, Ditan, Dongsheng Bajia4, 4, 6
Tree height, building heightBolulai altimeter (Bo Lu Lai Instrument Co., Shenzhen, China)Qingnianhu, Ditan, Dongsheng Bajia-
Table 3. Basic parameters of the park models.
Park NameNumber of Grid Cells (x,y,z)Size of Grid Cells (Meters) (x,y,z)
Qingnianhu100,75,305,5,3
Ditan96,54,305,5,3
Dongsheng Bajia75,100,305,5,3
Table 4. Initial parameter settings.
ParameterParameter Setting
Base locationBeijing39.5° N, 116.2° E
Simulated timeStart time2 April 2019 8:00
Duration10 h
Meteorological conditionInflow direction135°
Wind speed1.4 m/s
Initial air temperature12°2
Relative humidity26%
PollutantSpeciesPM2.5
Source geometryLinear
Discharge height0.3 m
Emission rate63.5 µg·s−1·m−1
VegetationLAD1–2 m2/m3
Height2 m, 10 m, 15 m, 20 m
Table 5. Evaluation of the simulation outputs for the four model parameters.
SeasonParameterRMSE/MAPE
Qingnianhu ParkDitan ParkDongsheng Bajia Park
SummerTemperature (°C)/%0.59/2.560.40/1.520.39/1.48
Relative humidity (%)/%1.84/4.821.56/4.012.05/4.91
Wind speed (m·s−1)/%0.20/15.020.21/15.600.25/16.50
PM2.5 (μg·m−3)/%5.62/6.665.97/6.925.58/6.59
SpringTemperature (°C)/%0.67/2.980.89/3.590.68/3.05
Relative humidity (%)/%2.49/5.502.40/5.273.02/5.63
Wind speed (m·s−1)/%0.26/16.700.16/14.200.11/12.70
PM2.5 (μg·m−3)/%7.03/7.626.87/7.138.04/8.91
WinterTemperature (°C)/%0.58/2.380.53/2.030.99/3.80
Relative humidity (%)/%3.10/5.992.90/4.623.11/5.72
Wind speed (m·s−1)/%0.27/16.910.24/16.410.31/17.74
PM2.5 (μg·m−3)/%9.12/10.338.46/9.077.18/7.70
Disclaimer/Publisher’s Note: The statements, opinions and data contained in all publications are solely those of the individual author(s) and contributor(s) and not of MDPI and/or the editor(s). MDPI and/or the editor(s) disclaim responsibility for any injury to people or property resulting from any ideas, methods, instructions or products referred to in the content.