Article

Can Functional Industrial Policy Promote Digital–Green Synergy Development?

by
Xiekui Zhang
1,
Zhusheng Wu
1 and
Zefeng Zhang
2,*
1
China-ASEAN School of Economics & School of Economics & China-ASEAN Institute of Financial Cooperation, Guangxi University, Nanning 530004, China
2
School of Humanities and Public Administration, Baise University, Baise 533000, China
*
Author to whom correspondence should be addressed.
Sustainability 2025, 17(16), 7233; https://doi.org/10.3390/su17167233
Submission received: 6 July 2025 / Revised: 4 August 2025 / Accepted: 7 August 2025 / Published: 10 August 2025

Abstract

Against the backdrop of China’s high-quality development strategy, promoting the synergistic transformation of digitalization and greening in enterprises has become a critical pathway toward achieving sustainable economic and environmental development. This paper takes the MIC2025 as a quasi-natural experiment and constructs a multi-period difference-in-differences (DID) model to evaluate the policy’s impact on the digital–green synergy development (DGSD) of firms, using data from A-share listed companies in China from 2011 to 2022. The empirical results indicate that the implementation of MIC2025 significantly improves DGSD. This conclusion remains robust under a series of tests, including heterogeneous DID specifications, placebo tests, machine learning approaches, and instrumental variable estimation. Further heterogeneity analysis reveals substantial differences in policy effects across regions, city and firm characteristics. A mechanism analysis revealed that the MIC2025 policy effectively enhances corporate DGSD by alleviating financing constraints and incentivizing innovation in digital and green technologies. Additionally, companies in strategic industries exhibit a stronger DGSD growth momentum. This study provides both theoretical support and empirical analysis for understanding how functional industrial policy can promote digital–green synergy, offering valuable insights for policy implications and future research optimization.

1. Introduction

In recent years, green development has emerged as a central topic in the discourse on sustainable development, while digital transformation is increasingly recognized as a vital driver of economic growth [1,2]. On the one hand, with the widespread adoption of digital technologies and the continuous advancement of digital transformation across industries, enterprises are increasingly shifting toward digital modes of production and business operation. This transformation enables more precise control over input–output processes, real-time monitoring of energy consumption and pollutant emissions, and efficient information sharing—all of which significantly enhance firms’ capacity for green transformation. On the other hand, the intensifying threat of global warming and the growing frequency of climate-related disasters have drawn broad international attention to the urgency of sustainable development. In response, many countries have proposed ambitious targets, such as carbon peaking and carbon neutrality, alongside increasingly stringent environmental regulations. These shifts exert mounting pressure on enterprises to adopt more advanced and environmentally friendly production technologies. In this context, digital technologies—such as smart manufacturing, big data analytics, and industrial internet—are being widely deployed due to their strengths in dynamic precision management and energy efficiency. The inherent complementarities between digitalization and greening—in terms of development logic, technological pathways, and operational tools—are fostering a mutually reinforcing relationship [3,4,5]. This synergy has increasingly captured the attention of both academic researchers and policy makers, giving rise to the emerging paradigm of coordinated digital–green development. Over the past decades, China’s rapid economic rise was largely driven by an extensive growth model characterized by high input and resource consumption. While this model propelled China into the ranks of the world’s most influential economies, it is now proving unsustainable in the face of a new wave of technological and industrial transformation. As the country transitions toward high-quality development, a fundamental shift in its growth paradigm has become imperative. Against this backdrop, the Chinese government has repeatedly emphasized the importance of “promoting coordinated digital and green development, using digitalization to drive green transformation, and leveraging green goals to deepen digital innovation,” aiming to achieve a more sustainable and innovation-driven growth trajectory [2,4].
To meet the demands of high-quality development, China has increasingly emphasized the implementation of functional industrial policies characterized by a “market-oriented and government-guided” approach as a key component of institutional reform. Functional industrial policy refers to a policy framework whereby the government promotes innovation-driven development, industrial upgrading, and overall competitiveness by improving market institutions, optimizing the business environment, ensuring fair competition, supporting technological innovation and diffusion, providing efficient public services, and enhancing workforce skills to align with evolving industrial demands [6,7,8]. Unlike selective industrial policies—which intervene in the development trajectory of specific industries through preferential tools [9,10]—functional industrial policies focus on empowerment rather than intervention. Their core objective is to improve total factor productivity, innovation capabilities, and industrial adaptability. Accordingly, functional policies place greater emphasis on the foundational role of market mechanisms, while positioning government as a provider of favorable institutional environments. They prioritize long-term, systemic development goals, such as the advancement of future industries and the research and development of frontier technologies [7]. Against this backdrop, China launched the “Made in China 2025” initiative in May 2015, with the aim of upgrading its manufacturing sector and enhancing global competitiveness. The initiative seeks to build a comprehensive innovation ecosystem for manufacturing by strengthening public infrastructure, accelerating the development of producer services, improving fiscal and tax support, and refining market access standards. Subsequently, the Ministry of Industry and Information Technology (MIIT) initiated the construction of 30 MIC2025 pilot cities in 2016 and 2017, urging these cities to pioneer breakthroughs in building new manufacturing systems, promoting regional collaborative innovation, strengthening talent development, and enhancing policy support frameworks. Clearly, the MIC2025 pilot program focuses on institutional supply, infrastructure investment, and the construction of innovation ecosystems. While balancing equity and efficiency, it also avoids the typical pitfalls of selective industrial policies, such as resource misallocation, rent-seeking opportunities, and policy inertia [9,10,11]. Therefore, MIC2025 can be classified as a functional industrial policy. It is clear that MIC2025 contributes to enhancing firms’ innovation capabilities, improving performance, promoting digital transformation, and reducing energy consumption. However, several critical questions remain: Can MIC2025 effectively promote the coordinated advancement of firms’ digitalization and greening processes? Are its effects heterogeneous across different contexts? And what are the underlying mechanisms of its impact? Addressing these questions is crucial for deepening our understanding of the relationship between functional industrial policies and the dual transformation of enterprises. Moreover, it can provide valuable insights for accelerating the integration of digital and green development and fostering high-quality growth among Chinese enterprises.
The remainder of this paper is organized as follows: Section 2 reviews relevant literature. Section 3 presents the theoretical framework and research hypotheses. Section 4 outlines the research design, including data sources, variable construction, and model specification. Section 5 reports the main empirical results and a series of robustness checks. Section 6 extends the analysis by exploring heterogeneity across different contexts and examining the underlying mechanisms of policy impact. Section 7 concludes this study with a summary of key findings and policy implications.

2. Literature Review

This study is closely related to existing literature that focuses on the measurement and influencing factors of enterprise digitalization and greening, as well as the policy effects of MIC2025. The first strand of literature concentrates on the measurement of enterprise digitalization and its influencing factors. Broadly, the methods for measuring enterprise digitalization can be categorized into two types: text analysis and single-indicator methods. The text analysis method involves systematically collecting digital-related keywords, then rigorously searching, matching, extracting, and analyzing the annual reports of listed companies, with the frequency of keyword occurrences serving as a proxy for the level of digitalization [12,13,14,15,16,17,18,19]. For instance, Zhu et al. (2024) assess enterprise digitalization by mining the frequencies of keywords such as “blockchain”, “big data”, “cloud computing”, and “artificial intelligence” from annual reports [18]. Huang and Gao (2023) argue that enterprise digital development consists of two components: digital investment and digital application. The former is measured through the frequencies of terms such as “artificial intelligence technology”, “blockchain technology”, “cloud computing technology”, and “big data technology”, while the latter is gauged through keywords such as “e-commerce”, “mobile payment”, and “industrial internet” [19]. Yan et al. (2025) further refine the approach by classifying technologies into five major application dimensions—artificial intelligence, big data, cloud computing, blockchain, and digital technologies—and collecting and analyzing keyword frequencies accordingly [20]. Some studies adopt single indicators to measure digitalization levels, such as digital intangible assets [18,21], enterprise ICT investment [22], or the cumulative customer digital transformation index [23]. In terms of influencing factors, they are generally categorized into internal and external drivers. Prior research has shown that internal factors such as executive backgrounds [18,24,25], demand for product personalization [26], venture capital [24], and dialect diversity [20] significantly affect enterprise digitalization. External influences include both policy and environmental constraints. The former encompasses supportive or coercive policy effects such as the development of digital or network infrastructure [27,28], the layout of computing infrastructure [29], open government data [14], tax incentives and subsidies [30,31], and labor protection policies [19,32]. The latter includes environmental pressures such as carbon emissions [12,13,33], climate risks [16], and geographic factors [17], all of which impact the process of digital transformation.
The second body of literature centers on the measurement of corporate greening and its influencing factors. In terms of measurement, four primary approaches are commonly employed in existing studies. The first approach is the use of single indicators, which typically rely on variables such as the number of green patent applications or grants to assess the degree of corporate greening [34,35,36]. The second approach involves constructing composite evaluation systems based on multiple dimensions. For instance, Zhang and Li (2025) developed a framework encompassing economic performance, quality outcomes, management capabilities, and environmental performance, comprising 16 secondary indicators, and applied the entropy method to calculate the greening level [37]. Similarly, Li et al. (2025) used the entropy method to integrate three dimensions: green management, green production, and external recognition [38]. Peng et al. (2023) established an evaluation system for green transformation based on eight dimensions, including green culture, green strategy, and environmental information disclosure [39]. The third approach adopts a production input—output framework to estimate green total factor productivity (GTFP), using efficiency models such as Data Envelopment Analysis (DEA) or Stochastic Frontier Analysis (SFA) [40,41]. For example, Chen and Wang (2024) and Zhang et al. (2025) employed the slack-based measure (SBM) directional distance function and the Malmquist–Luenberger productivity index, which accounts for undesirable outputs, to calculate firm-level GTFP [42,43]. Piao et al. (2025) applied SFA methods for the same purpose [44]. The fourth approach is based on text analysis, wherein keywords related to green transformation are extracted from corporate annual reports, and the frequency of such terms is used to quantify the level of corporate greening [4,45]. Regarding the drivers of corporate greening, the literature primarily focuses on the role of digital transformation, intelligent upgrading, and environmental regulations. On one hand, a growing body of research suggests that macro-level investments in digital infrastructure [46], integration of digital technologies with the real economy [47], meso-level industrial upgrading through intelligent transformation [48], as well as micro-level adoption of digital strategies [36,38,49] and artificial intelligence technologies [45,50], all facilitate green innovation and enhance corporate greening. On the other hand, various studies have examined the role of environmental regulations—such as environmental taxes [51,52], green credit policies [41,45,53,54], and energy and carbon trading schemes [37,55,56]—in promoting substantial green innovation by exerting external pressure and providing internal incentives [57,58]. However, some scholars argue that such regulations may impose additional compliance costs or reduce expected returns, thereby undermining firms’ incentives for green innovation [59,60].
The third body of literature focuses on the impact of the MIC2025 industrial policy. Existing empirical studies on the policy’s effects remain limited and primarily examine its influence on enterprise innovation, technological transformation, export performance of related products, asset pricing, and firms’ risk-taking capabilities. For instance, Bai et al. (2025), using MIC2025 as a quasi-natural experiment, find that the government’s industrial prioritization policy significantly enhances the innovation capacity of prioritized firms through three main channels: human capital accumulation, tax incentives, and government subsidies [61]. Conroy (2024) shows that MIC2025 contributes to technological transformation and economic growth in certain regions [62]. Xu et al. (2024) demonstrate that the synergy between MIC2025 and trade liberalization helps improve both the quality and price premiums of exported products [63]. Regarding asset pricing, Liu et al. (2022) find that MIC2025 leads to a significant short-term increase in stock prices, as measured by cumulative abnormal returns (CARs), though this effect tends to reverse in the long run [64]. Jiang et al. (2025) reveal that MIC2025 substantially enhances firms’ capacity to bear risks, with more pronounced effects observed in firms facing tighter financing constraints, greater information asymmetries, and weaker human capital endowments [65]. Although relatively few in number, some studies have explored the green development implications of MIC2025. Xu (2022), also adopting a quasi-natural experimental approach, finds that MIC2025 significantly strengthens green innovation capacity among manufacturing firms [66]. Some scholars have also provided evidence that MIC2025 significantly improves the green economic efficiency of pilot cities, thereby advancing urban green development [67,68]. Shen and Lin (2020) find that MIC2025’s R&D preferential policies help increase firms’ R&D capital and reduce their energy intensity [69].
Existing literature has explored the interactive relationship between digitalization and greening in considerable depth [3,4,5]. On the one hand, firms leverage digital technologies to improve resource allocation efficiency and enhance environmental monitoring precision, thereby advancing green production and governance. On the other hand, digitalization helps alleviate financing constraints associated with green investment by increasing information transparency and strengthening internal controls, thus reducing uncertainties in the green transition process. Regarding the reverse effect, stricter energy efficiency and carbon emission standards drive enterprises to implement energy-saving upgrades in their production systems, which in turn accelerates the adoption of digital technologies. Furthermore, the growing demand for sophisticated information processing in green production, coupled with intensified environmental regulation and rising green consumption preferences, compels firms to adopt digital strategies that emphasize the synergy between economic and environmental performance. However, there remains a notable gap in the literature concerning the role of functional industrial policies—particularly the MIC2025 initiative—in shaping this digital–green interaction. To date, few studies have systematically examined how MIC2025 influences DGSD through specific policy mechanisms, making this a valuable avenue for further research.
Therefore, this study makes contributions from two main perspectives. First, from a research perspective, it is the first to evaluate the impact of MIC2025 on firms’ coordinated digital and green transformation from the standpoint of functional industrial policy. By examining the policy effects of MIC2025, this paper provides new empirical evidence on the relationship between functional industrial policies and firms’ synergistic advancement in digitalization and greening. Second, building on the endogenous growth framework with product variety developed by Romer (1990) and Alfaro et al. (2010) [70,71], this study introduces the concept of product diversity to construct a model that integrates MIC2025 with the digital–green transformation of enterprises into a unified theoretical framework. Leveraging panel data from A-share listed firms in China spanning 2011–2022 and applying a multi-period difference-in-differences (DID) approach, we systematically examine the characteristics and mechanisms through which the policy fosters coordinated digital and green transformation at the firm level. This provides valuable insights for policymakers aiming to implement functional industrial policies that promote both digital and green transitions and facilitate high-quality development.

3. Theoretical Models and Research Hypotheses

Our research attempts to develop a theoretical model that incorporates functional industrial policy and firms’ coordinated digital and green transformation, building upon the endogenous growth model with product diversification proposed by Romer (1990) and Alfaro et al. (2010) [70,71]. In line with the content of the MIC2025 policy and for the sake of analytical tractability, we assume that the implementation of functional industrial policy increases government support for firms’ digital–green transformation (such as increasing dedicated fiscal funding and implementing preferential corporate income tax policies), and also raises environmental requirements for enterprises (such as increasing the rate of environmental protection tax and enhancing local governments’ attention to corporate environmental issues). Before the implementation of the functional industrial policy, there was no government intervention.

3.1. End Products Sector

The final goods sector consists of a number of homogeneous firms that operate under conditions of perfect competition. The production of the final product requires the use of labor and a series of intermediate product inputs with an index of j [ 0 , N t ] . N t is a measure of product variety. At each moment t, the production function of the final product is
Y t = 0 N t Y j 1 θ d j 1 1 θ L θ
In this equation, Y t represents the final product output, Y j represents the quantity of intermediate product j input, and labor input is always a constant quantity L. The coefficient lies between 0 and 1.

3.2. Intermediate Products Sector

The intermediate product sector consists of several heterogeneous companies, each producing a differentiated product, forming a monopolistic competitive relationship. The production of each intermediate product requires the input of final products in a certain proportion. Let the total amount of final products invested in intermediate product production be X t , and let Y i represent the output of the i intermediate product. Then X t must equal the total quantity of all intermediate products:
  X t = 0 N t Y j d j  
Similarly, X i represents the quantity of final products invested in the production of the i intermediate product, X i = Y j . Assume that industrial waste and other pollutants are generated during the production of intermediate products due to the insufficient utilization of input factors, E j . E j depends on two factors: the number of intermediate products produced by the enterprise Y j and the degree of coordinated development of digitalization and greening G j .
E j = Y j G j  
This equation shows that when Y j remains constant, an increase in G j causes a decrease in E j ; when G j remains constant, an increase in Y j causes an increase in E j . Among these, G j is jointly influenced by the level of green technology application A j and the level of enterprise digital technology application D j . The function form is as follows:
G j ( A j , D j ) = γ A j δ D j η  
where γ , δ , η > 0 . This equation indicates the following: ① The higher the level of green technology application A j , the more efficient the use of inputs in the production process, resulting in less industrial waste generated due to incomplete utilization, thereby enhancing the company’s level of green development, G j A j > 0 . ② The higher the value of D j , the higher the level of digital technology application D j , and the more benefits enterprises will derive from intelligent production, real-time sharing of production information, and improved decision-making efficiency. This will effectively alleviate situations of improper resource utilization and inadequate regulation of pollution emissions, ultimately contributing to the green development of enterprises, Y j D j > 0 .
Meanwhile, the following can be obtained from Equation (4):
G ˙ j = γ δ A j δ 1 D j η A ˙ j + γ η A j δ D j η 1 D ˙ j  
Since the intermediate goods sector exclusively produces intermediate inputs, it must incur additional costs to use final goods, apply green technologies, and adopt digital technologies. Moreover, it is subject to an environmental protection tax on pollution emissions. Assume that the price of each unit of final goods is normalized to 1, the costs of applying green technologies and digital technologies per unit are P A and P D , respectively, and the environmental protection tax is a specific tax with rate τ . Therefore, before the implementation of the functional industrial policy, the profit of an intermediate goods firm is given by
Π j 0 = P j Y j Y j P A A j P D D j τ 0 E j  
After the implementation of functional industrial policies, the profits of intermediate product manufacturers are as follows:
Π j 1 = P j Y j Y j v 1 P A A j s 1 P D D j τ 1 E j  
where 0 < v , s < 1 , and τ 1 > τ 0 > 0 . It is important to note that, as digitalization and green development represent the current direction of progress for countries worldwide, the implementation of the MIC2025 functional industrial policy will significantly strengthen fiscal and tax policy support for innovation and application in green and digital technologies. Meanwhile, the enhancement of environmental protection requirements for enterprises is more focused on fostering environmental awareness and promoting sustainable development, rather than the amount of tax revenue generated. Therefore, the increase in environmental protection taxes will be smaller than the fiscal and tax policy support for technological innovation and application, meaning that, overall, v 1 , s 1 > τ 1 τ 0 .

3.3. R&D Sector

The R&D department is a fully competitive production environment responsible for three types of R&D activities: new intermediate product R&D, green technology R&D, and digital technology R&D. The development of a new intermediate product requires an input of C N units of final output, so the growth rate of the number of product types depends on the number of final products R N invested in this type of scientific research activity and the probability of innovation success μ N ( 0 < μ N < 1 ). Therefore, we have
N ˙ = μ N R N C N  
Similarly, the research and development of one unit of green technology and digital technology requires an investment of C A and C D units of final output, respectively. Therefore, the growth rate of green technology and digital technology depends on the number of final products R A and R D invested in this type of scientific research activity and the probability of innovation success μ A ,   μ D ( 0 < μ A , μ D < 1 ); that is,
A ˙ 1 = μ A R A C A  
D ˙ 1 = μ D R D C D  
After the implementation of functional industrial policies, the R&D costs of green and digital technologies decreased, and Equations (9) and (10) were rewritten as follows:
A ˙ 2 = μ A R A v 2 C A  
D ˙ 2 = μ D R D s 2 C D  
where 0 < v2, s2 < 1.

3.4. Research Hypothesis

Based on the above analysis, this paper proposes the first research hypothesis, H1: Functional industrial policies can promote the level of coordinated development between enterprise digitalization and greening.
To further identify the mechanisms through which functional industrial policies exert their effects, this paper draws on Equations (6) and (7) to conduct a channel analysis from the perspective of alleviating financing constraints. Specifically, MIC2025, as a functional industrial policy, not only provides direct financial support to enterprises through fiscal instruments, but also indirectly improves the financing environment via institutional arrangements and policy signals, thereby easing the financial pressures enterprises face during the dual transformation toward digitalization and greening [31,62,70]. On the one hand, central and local governments reduce enterprises’ upfront investment costs in technological upgrading and green innovation by setting up special guiding funds, implementing tax reductions, and offering fiscal subsidies, thus strengthening financial guarantees for coordinated transformation. On the other hand, the policy sends clear signals and positive expectations, enhancing capital market confidence in the future growth of digitally and environmentally oriented firms. This, in turn, guides financial institutions to allocate more credit resources to relevant enterprises, effectively reducing their financing costs and credit risks.
In addition, the MIC2025 policy also plays a positive role in addressing problems inherent in the traditional financial system, such as financing delays, risk aversion, and information asymmetry. As enterprises continue to accumulate digital assets, green patents, and technological achievements within digitalization scenarios, they gradually acquire the ability to effectively convey their market value to financial institutions. This enhances the certainty in valuing collateral during the financing process, reduces default risks, and further increases both the likelihood of obtaining credit and the efficiency of capital utilization [66]. Accordingly, this paper proposes the second research hypothesis, H2: Functional industrial policies indirectly promote the coordinated development of enterprise digitalization and greening by alleviating financing constraints.
Furthermore, combining Equations (11), (12), (4), and (5), we can see that A ˙ 2 > A ˙ 1 and D ˙ 2 > D ˙ 1 . From the perspective of technological innovation, this paper examines how the MIC2025 policy fosters synergistic effects by encouraging enterprises to engage in both digital and green technological innovation. MIC2025 not only guides the allocation of resources toward the digital and green sectors through institutional design but also systematically establishes incentive mechanisms that support coordinated technological innovation within enterprises, serving as a key driving force for their dual transformation. Specifically, the policy utilizes tools such as R&D subsidies, tax incentives, and government procurement [31,61,66,69] to encourage enterprises to digitally and ecologically upgrade their existing production processes, management models, and manufacturing equipment. This promotes a path of incremental innovation and helps enhance resource allocation efficiency along the existing technological trajectory [72,73]. Meanwhile, MIC2025 emphasizes a future-oriented strategic direction, encouraging enterprises to break through critical technological bottlenecks in key areas, such as artificial intelligence, industrial internet, advanced manufacturing equipment, and new materials [62]. Under policy guidance and forward-looking expectations, enterprises tend to increase their R&D investment, intensify R&D efforts, and adjust their return horizons. These efforts not only reduce the risk of funding chain disruptions but also improve the quality of technological innovation.
More importantly, the policy actively promotes the construction of a collaborative innovation network that integrates government, industry, academia, research, and application. It enhances the integrative capacity among local governments, universities and research institutes, as well as enterprises in terms of technological, capital, and human resources. Over time, this fosters the formation of a cross-regional, cross-industry, and cross-actor collaborative innovation ecosystem [62]. This process is highly conducive to the deep integration between digital and green technology systems and reinforces their systemic interaction in coordinated development. Accordingly, this paper further proposes hypothesis H3: Functional industrial policies indirectly promote the coordinated development of digitalization and greening within enterprises by driving technological innovation (including both digital and green technologies).
In summary, the MIC2025 initiative, as a functional industrial policy, not only supports the digital and green transformation of enterprises through dedicated funding, but also promotes a coordinated leap in digitalization and greening by alleviating financing constraints and fostering technological innovation. Based on the theoretical model established in this study and the systematic analysis of the underlying mechanisms, the three research hypotheses proposed above aim to provide a clear theoretical foundation for the subsequent empirical analysis.

4. Research Design

4.1. Model Setting

To investigate the impact of functional industrial policies on the coordinated development of enterprise digitalization and greening, this study takes the MIC2025 pilot cities as a quasi-natural experiment and conducts an empirical analysis using a DID model. The specific model is constructed as follows:
D G C D i t = α + β D I D i t + λ X i , t 1 + μ i + ψ j + ν t + ε i j t
D I D i t = T r e a t i × P o s t t  
In Equation (13), i and t represent the company and the year, respectively. D G C D i t denotes the level of digital greening and synergistic development of firms. D I D i t is used to characterize whether a listed company belongs to the treatment group and whether the year is after the policy implementation, as a dummy variable. X i , t 1 is a series of control variables; μ i is an individual firm fixed effect; ψ j is an industry fixed effect; ν t is a year fixed effect and ε i j t is a random perturbation term.

4.2. Variable Design

4.2.1. Dependent Variable

Considering data availability and drawing on established literature [4,74,75], this paper employs a coupling coordination degree (DGSD) model to evaluate the level of coordinated development between digitalization and greening within firms, thereby capturing the degree of synergistic advancement. To measure the level of digitalization, we adopt a text analysis approach based on existing studies [18,20]. Specifically, we construct a digitalization-related keyword dictionary by referencing representative publications on digital transformation and relevant Chinese digital policy documents. This dictionary encompasses five major categories of keywords: artificial intelligence, blockchain technology, cloud computing, big data, and digital application. We then collect annual reports of listed firms and use Python software 3.12 to conduct text mining, extracting the frequencies of the identified keywords. The frequency values are log-transformed after adding one, and the resulting measure is used to quantify each firm’s digitalization level (Dig).
To assess the degree of green transformation at the firm level, this study employs the green total factor productivity (Green), calculated by the Slack-Based Measure–Malmquist–Luenberger (SBM-ML) model, as a proxy variable [42,43]. As shown in Table 1, the input and output indicators are selected as follows: the number of employees is used to represent labor input; the net value of fixed assets serves as the capital input; energy input is measured by firm-level industrial electricity consumption, estimated by multiplying the city’s total industrial electricity usage by the firm’s employment share in the city. Operating revenue is used as the desirable output, while the emissions of the “three industrial wastes”—sulfur dioxide, industrial wastewater, and industrial dust—are considered undesirable outputs. These emissions are estimated at the firm level by scaling city-level emissions using the firm’s employment share in the local labor market.
The coupling coordination degree model is commonly used to examine the interactions and coordinated development between two or more systems. The calculation steps are as follows:
C = n = 1 k U n 1 k n = 1 k U n k 1 k
T = n = 1 k α n U n , n = 1 k α n = 1  
D = C T  
Here, k denotes the number of subsystems within the enterprise’s digital–green coordinated development system; U n represents the normalized evaluation indices of the two subsystems; and parameter α n is the weight coefficient, reflecting the relative importance of each subsystem within the overall system. C denotes the coupling degree, which reflects the interdependence and mutual constraints between subsystems. Higher C values indicate stronger interactions among subsystems. T represents the overall development level of the system. The coordinated development degree measures the extent of positive coupling in subsystem interactions. A higher D value indicates a better synergistic relationship between subsystems, thereby contributing more effectively to the high-quality development of the overall system. It should be noted that U 1 , U 2 , C , T , D [ 0,1 ] . The value range and meaning of D are shown in the Table 2 below:
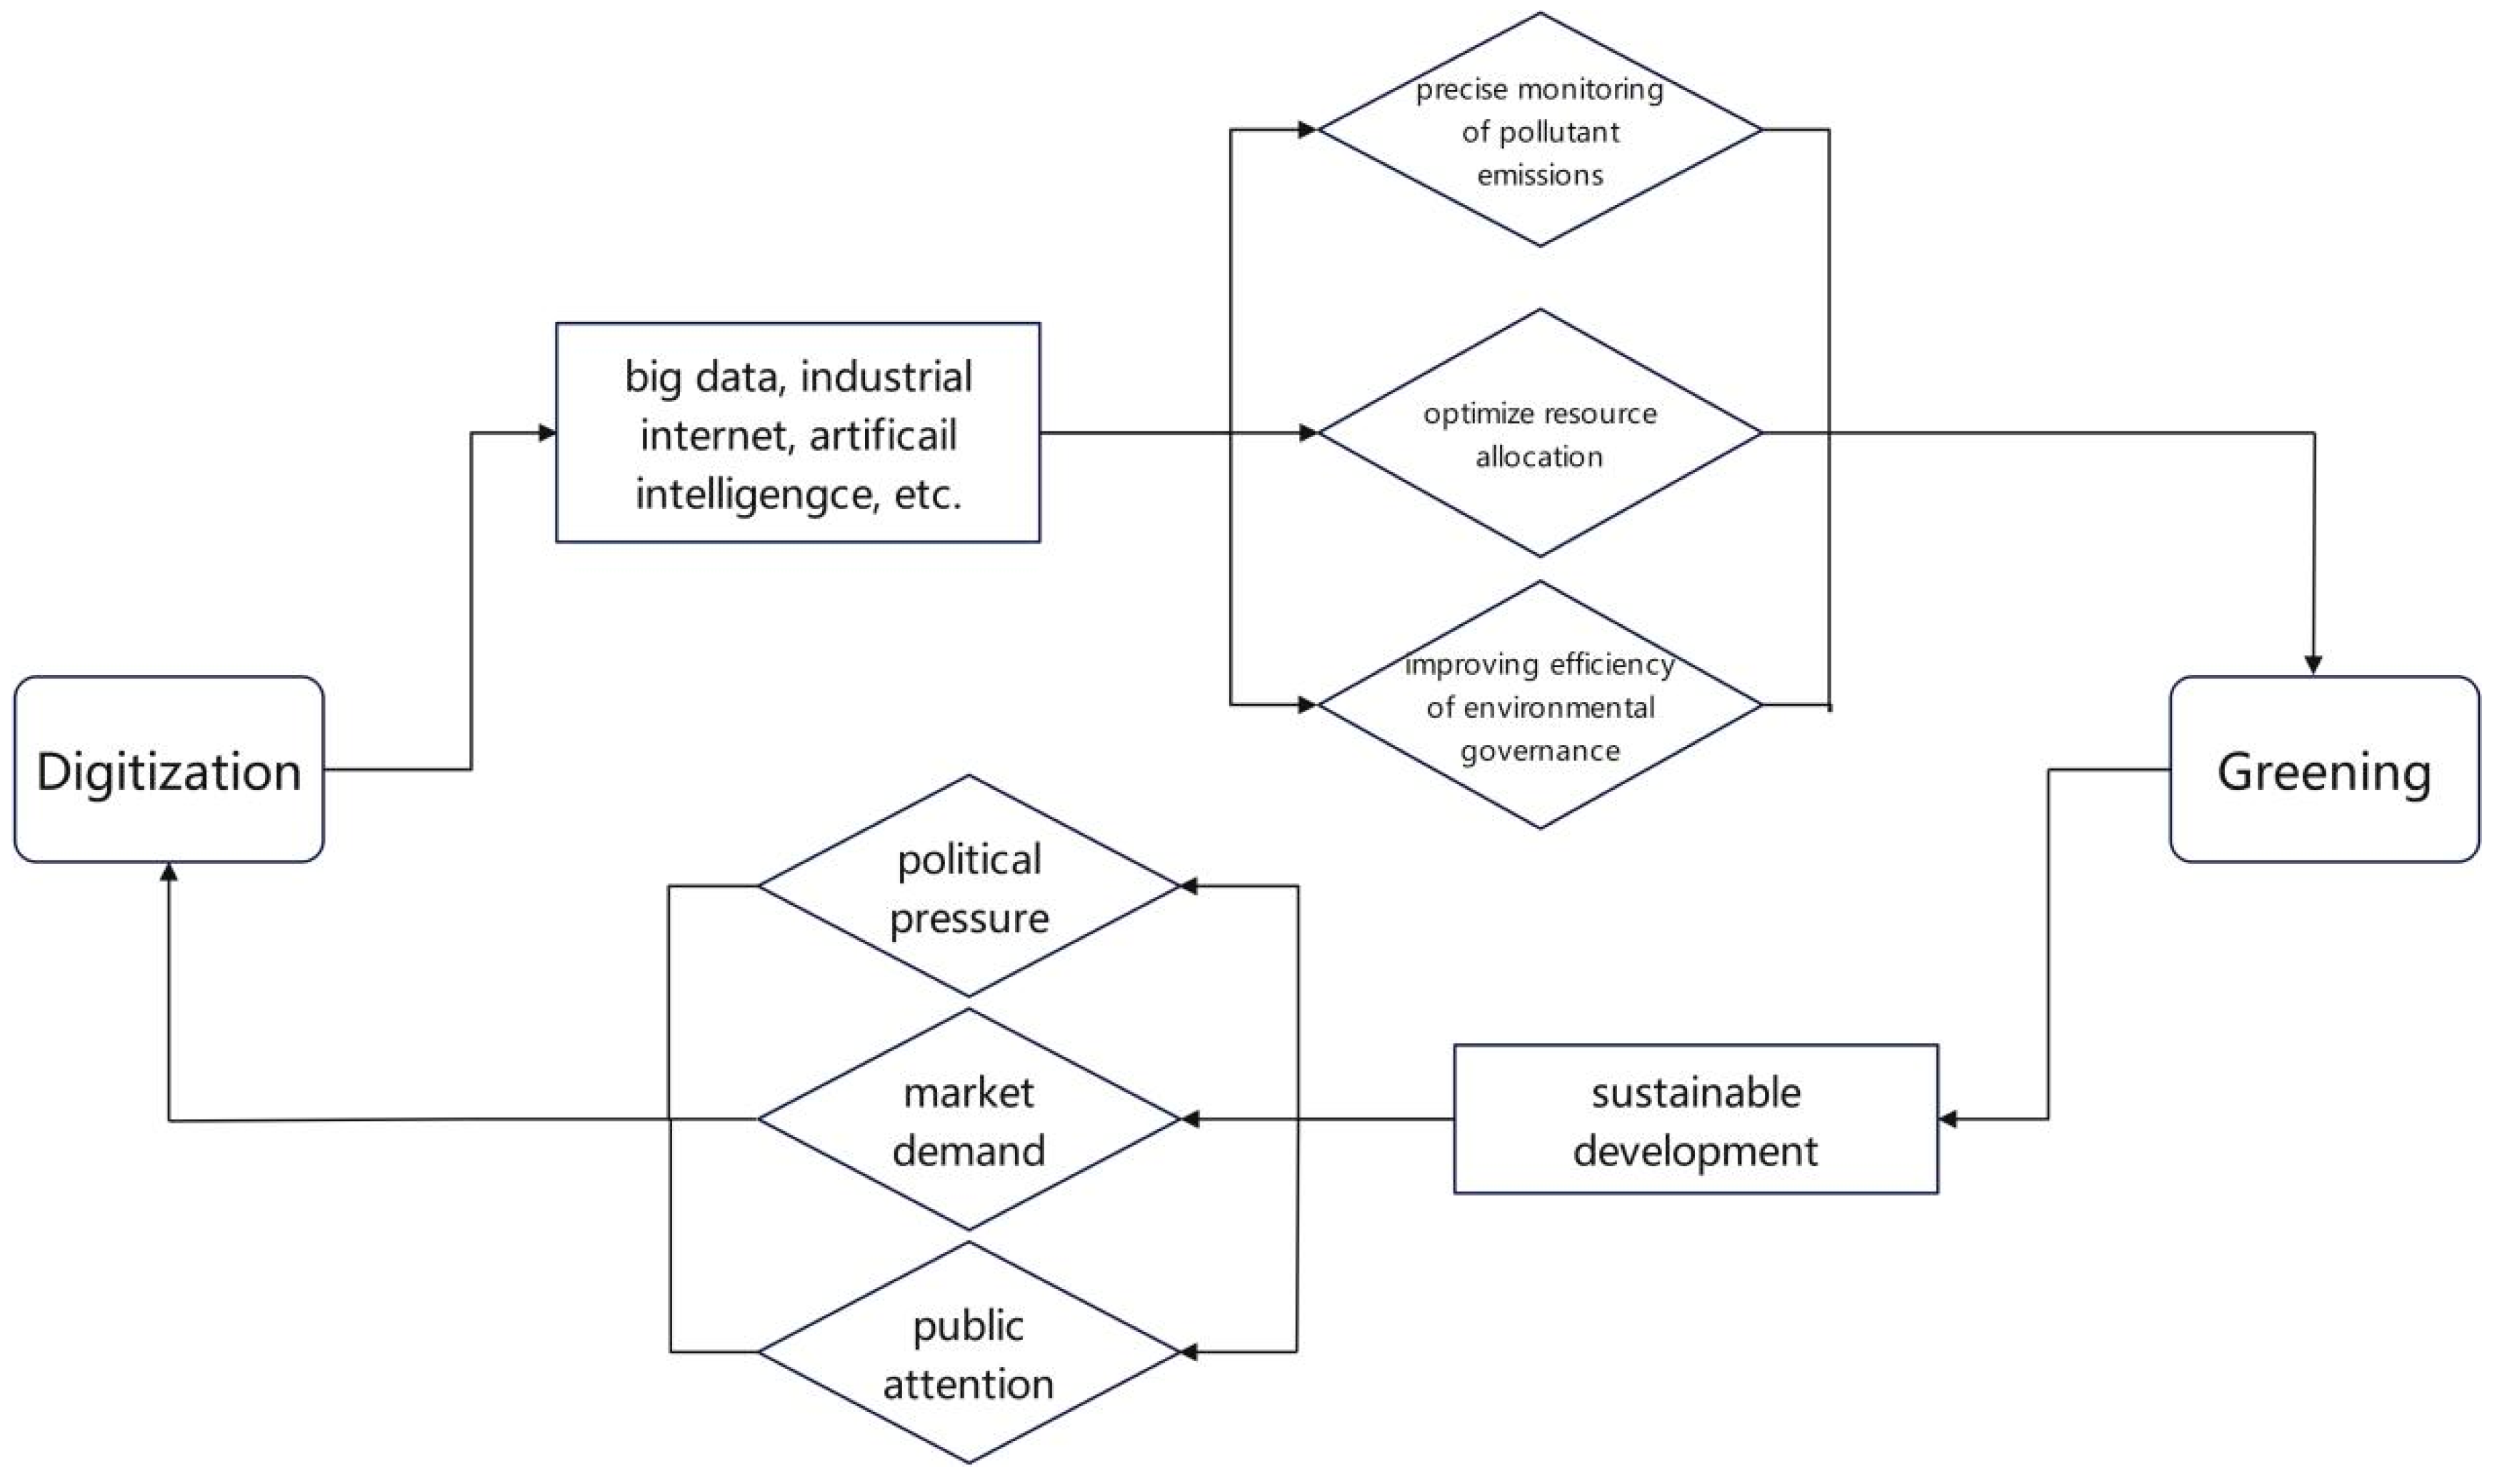
Since this study involves two subsystems—enterprise digital development and green development—we set k = 2 , where U 1 and U 2 represent the normalized values of the original indicators for enterprise digitalization and green transformation, respectively. Drawing on existing literature [4,74,75] and the context of this study, we argue that digital transformation is a critical driver of green development. It facilitates clean production, optimizes resource allocation, and enhances environmental governance through the application of advanced technologies. Conversely, policy pressures, market demands, and public oversight can compel enterprises to upgrade their production technologies, thereby accelerating their digital transformation (as shown in Figure 1). Therefore, digitalization and green development are equally important in the context of coordinated transformation, and we set α 1 = α 2 = 0.5 accordingly.
At the same time, the coordination development degree D is the level of coordinated development of enterprise digitalization and greening ( D G S D ) that this paper aims to calculate. Therefore, Equations (15)–(17) can be rewritten as
C = U 1 U 2 1 2 U 1 + U 2 2 1 2 = 2 U 1 U 2 U 1 + U 2  
T = α 1 U 1 + α 2 U 2 ,   α 1 = α 2 = 0.5
D G S D = C T  
Among them, because the levels of enterprise digitalization and green development are both positive indicators, the calculation processes for U 1 and U 2 are as follows:
  U 1 = D i g m i n ( D i g ) max D i g m i n ( D i g )  
  U 2 = G r e e n m i n ( G r e e n ) max G r e e n m i n ( G r e e n )  
where D i g represents the level of digital development of an enterprise, and G r e e n represents the level of green development of an enterprise.

4.2.2. Independent Variable

D I D i t is a dummy variable used to indicate whether a listed company belongs to the treatment group and whether the year is after the policy implementation. T r e a t i is a dummy variable indicating whether the registered location of a listed company is in a MIC2025 policy pilot city. If the registered location of the listed company is in a policy pilot city, then T r e a t i = 1; otherwise, T r e a t i = 0. P o s t t is a dummy variable indicating whether the year falls before or after the implementation of the policy. If the year falls after the implementation of the policy, P o s t t = 1; otherwise, P o s t t = 0.

4.2.3. Mechanism Variables

The mechanism variables in this study are categorized into two types: transmission variables and moderating variables. The transmission variables include firms’ financing constraints and their level of technological innovation. Financing constraints are measured using the SA index [30,65], while technological innovation is assessed by the number of relevant patent applications, reflecting a firm’s innovation capacity in specific domains. To better align with the research context, we further distinguish between digital technological innovation (Digital_Tech) [30,37] and green technological innovation (Green_Tech) [36,37]. As for the moderating variables, we use the classification of strategic industries as a proxy, based on the ten priority sectors supported under the “Made in China 2025” initiative. The moderating effects are empirically tested using a triple difference (DDD) model.

4.2.4. Control Variables

Following prior studies [4,25,74], we control for a set of firm-level and city-level variables that may influence the coordinated development of enterprise digitalization and greening. The detailed definitions of these variables are presented in Table 3. The study sample consists of A-share listed companies in China from 2011 to 2022. The data are primarily obtained from the CNRDS database, the CSMAR database, and the China City Statistical Yearbook. After excluding firms in the financial industry and those under special treatment (ST) due to abnormal operations, we arrive at an unbalanced panel dataset comprising 29,120 observations.

4.3. Descriptive Statistics

Table 4 presents the descriptive statistics of the key variables, including the number of observations, mean, standard deviation, minimum, and maximum values. To eliminate potential multicollinearity issues, we conducted a correlation analysis and variance inflation factor (VIF) test before the baseline regression analysis. First, as shown in Table 4, the level of DGSD among firms ranges from 0 to 0.999, with a mean of 0.508 and a standard deviation of 0.182. This indicates substantial variation across firms in terms of their digital–green coordination. Second, the dummy variable DID, which represents the implementation of the MIC2025 policy, has a mean value of 0.177, suggesting that approximately 18% of the sample observations are from MIC2025 pilot cities. This relatively low proportion is due to the fact that there are only 30 pilot cities nationwide, accounting for less than 10% of the cities included in the dataset. Hence, this study contributes to a deeper understanding of the policy effects of MIC2025 as a functional industrial policy.
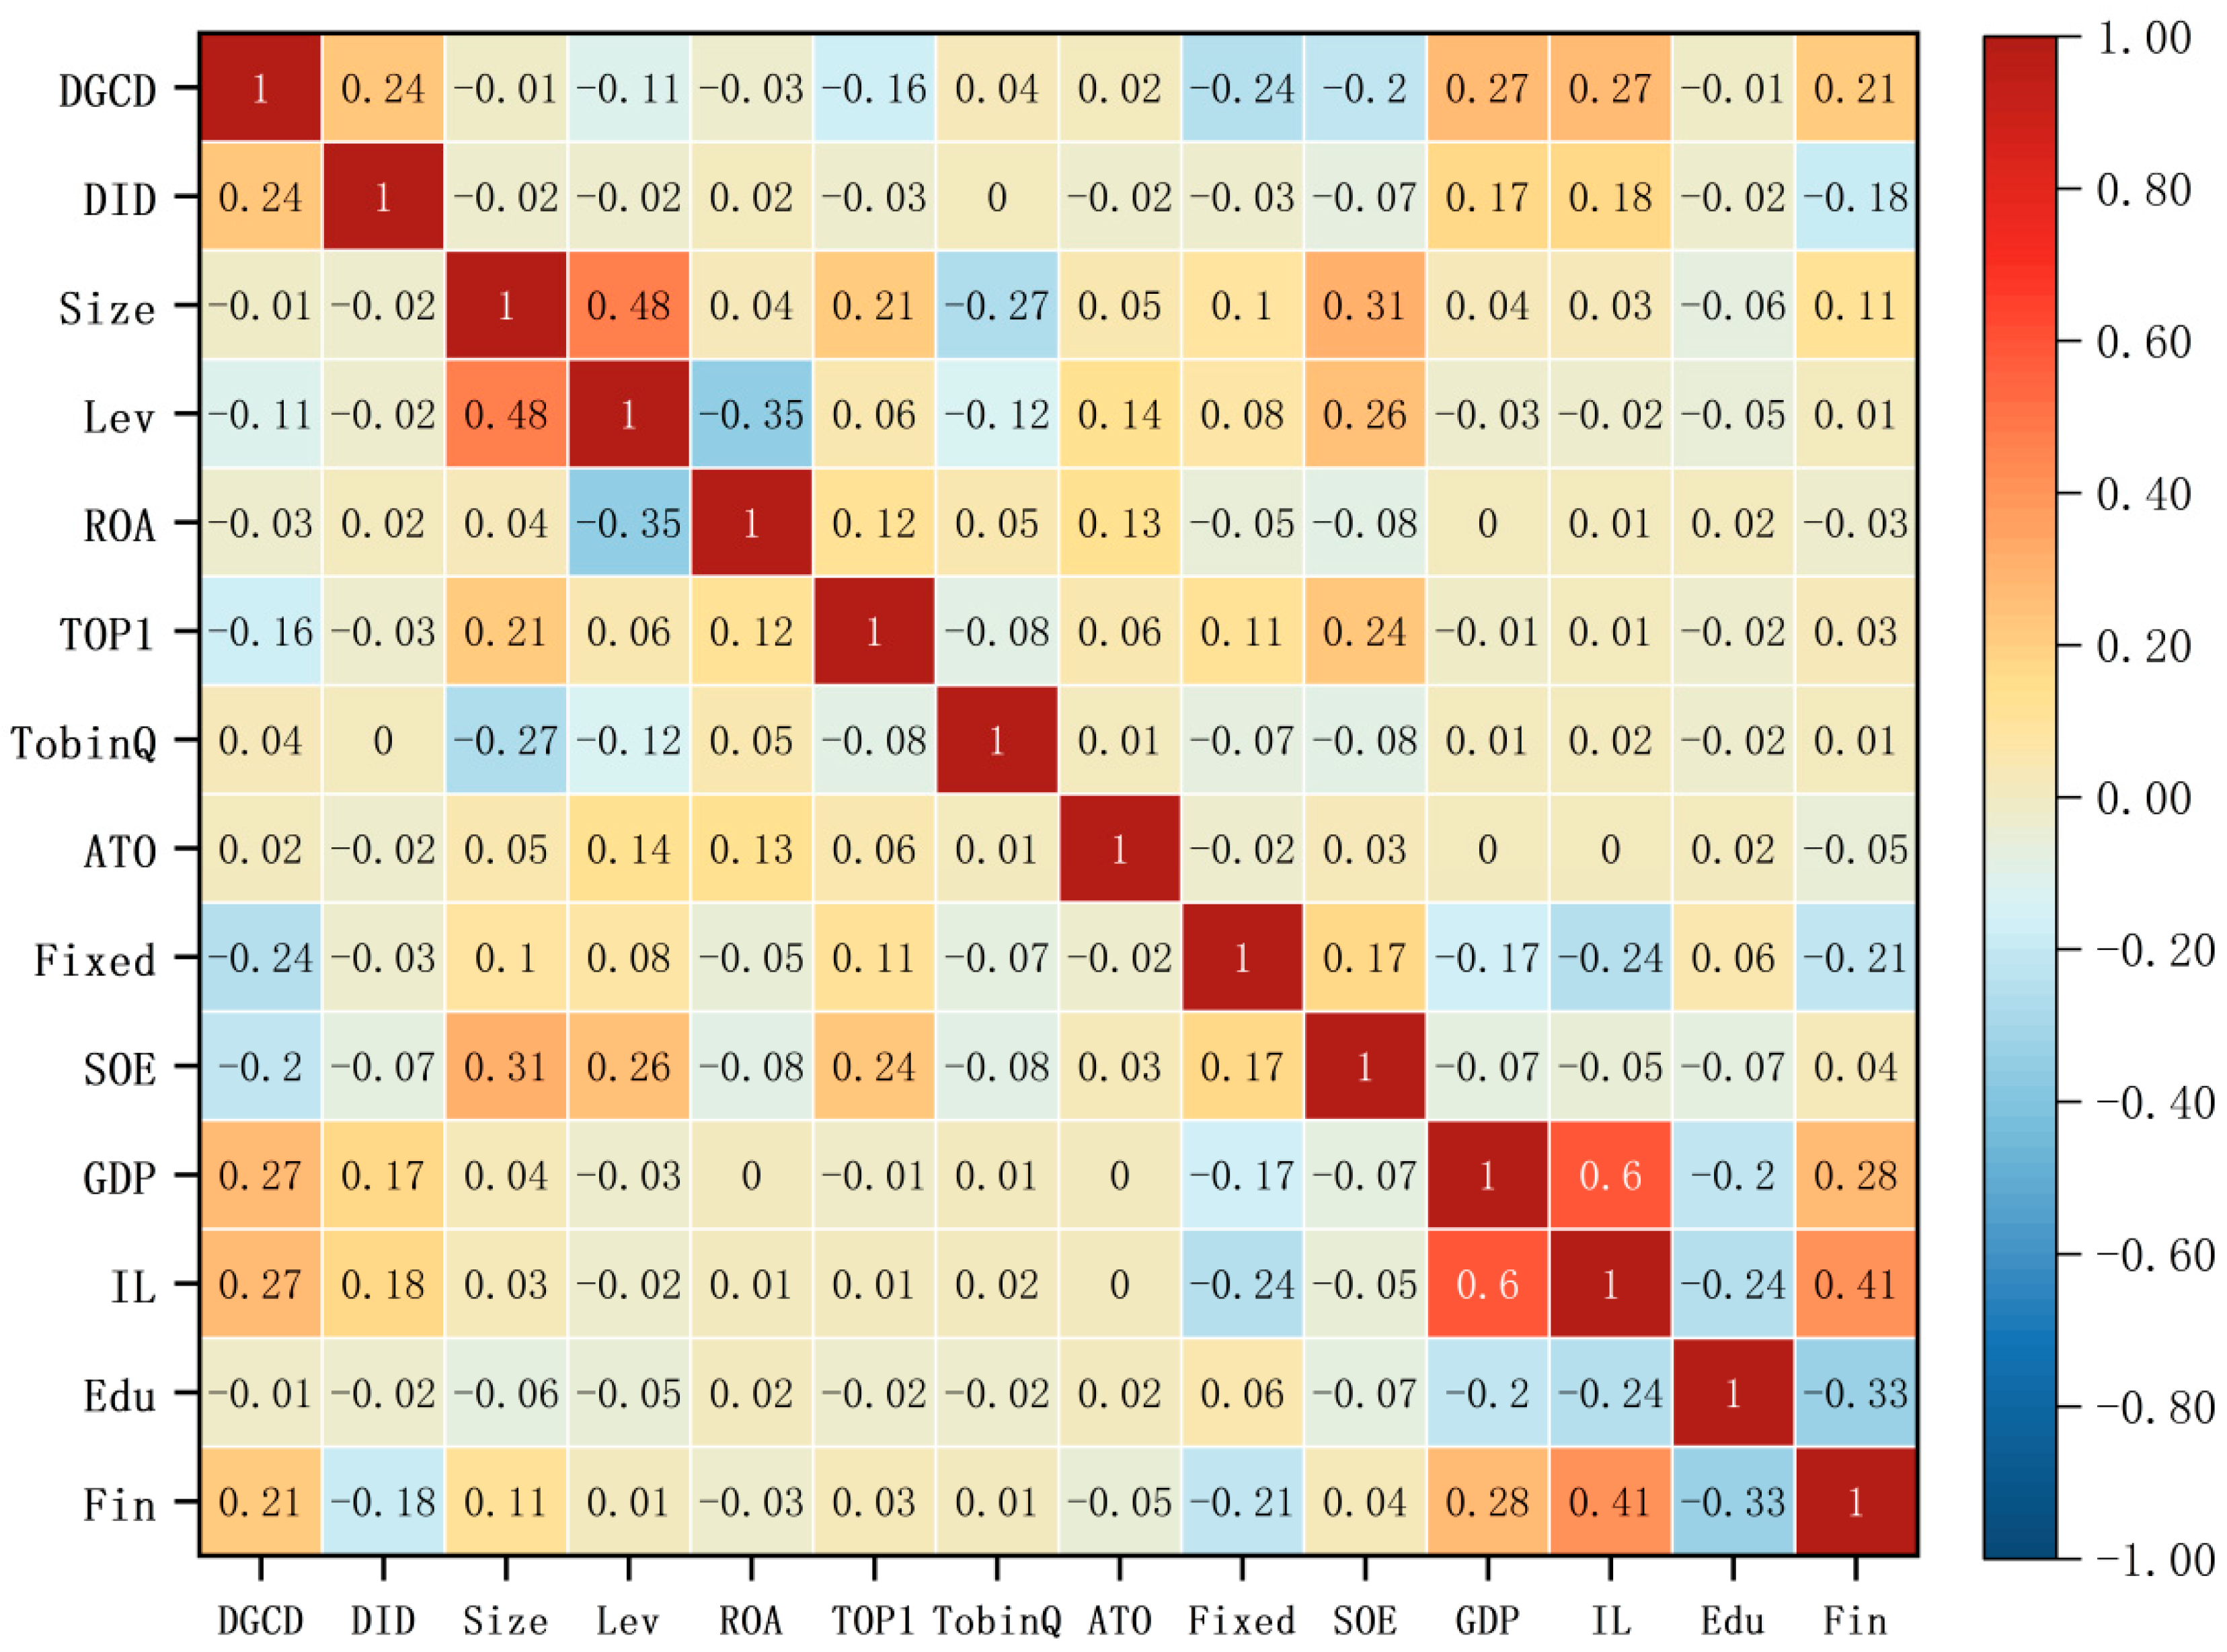
Moreover, we tested for multicollinearity among variables. The VIF test results show that all main variables have VIF values well below the threshold of 10, with an average VIF of 1.34, which indicates no serious multicollinearity concerns. The correlation analysis, as illustrated in Heatmap (Figure 2), reveals that the MIC2025 variable is positively and significantly correlated with the dependent variable DGSD, with a correlation coefficient of 0.24, significant at the 1% level. Furthermore, the absolute values of the correlation coefficients between main variables and control variables are all below 0.3, suggesting no strong linear relationships among them.

4.4. Development Trend

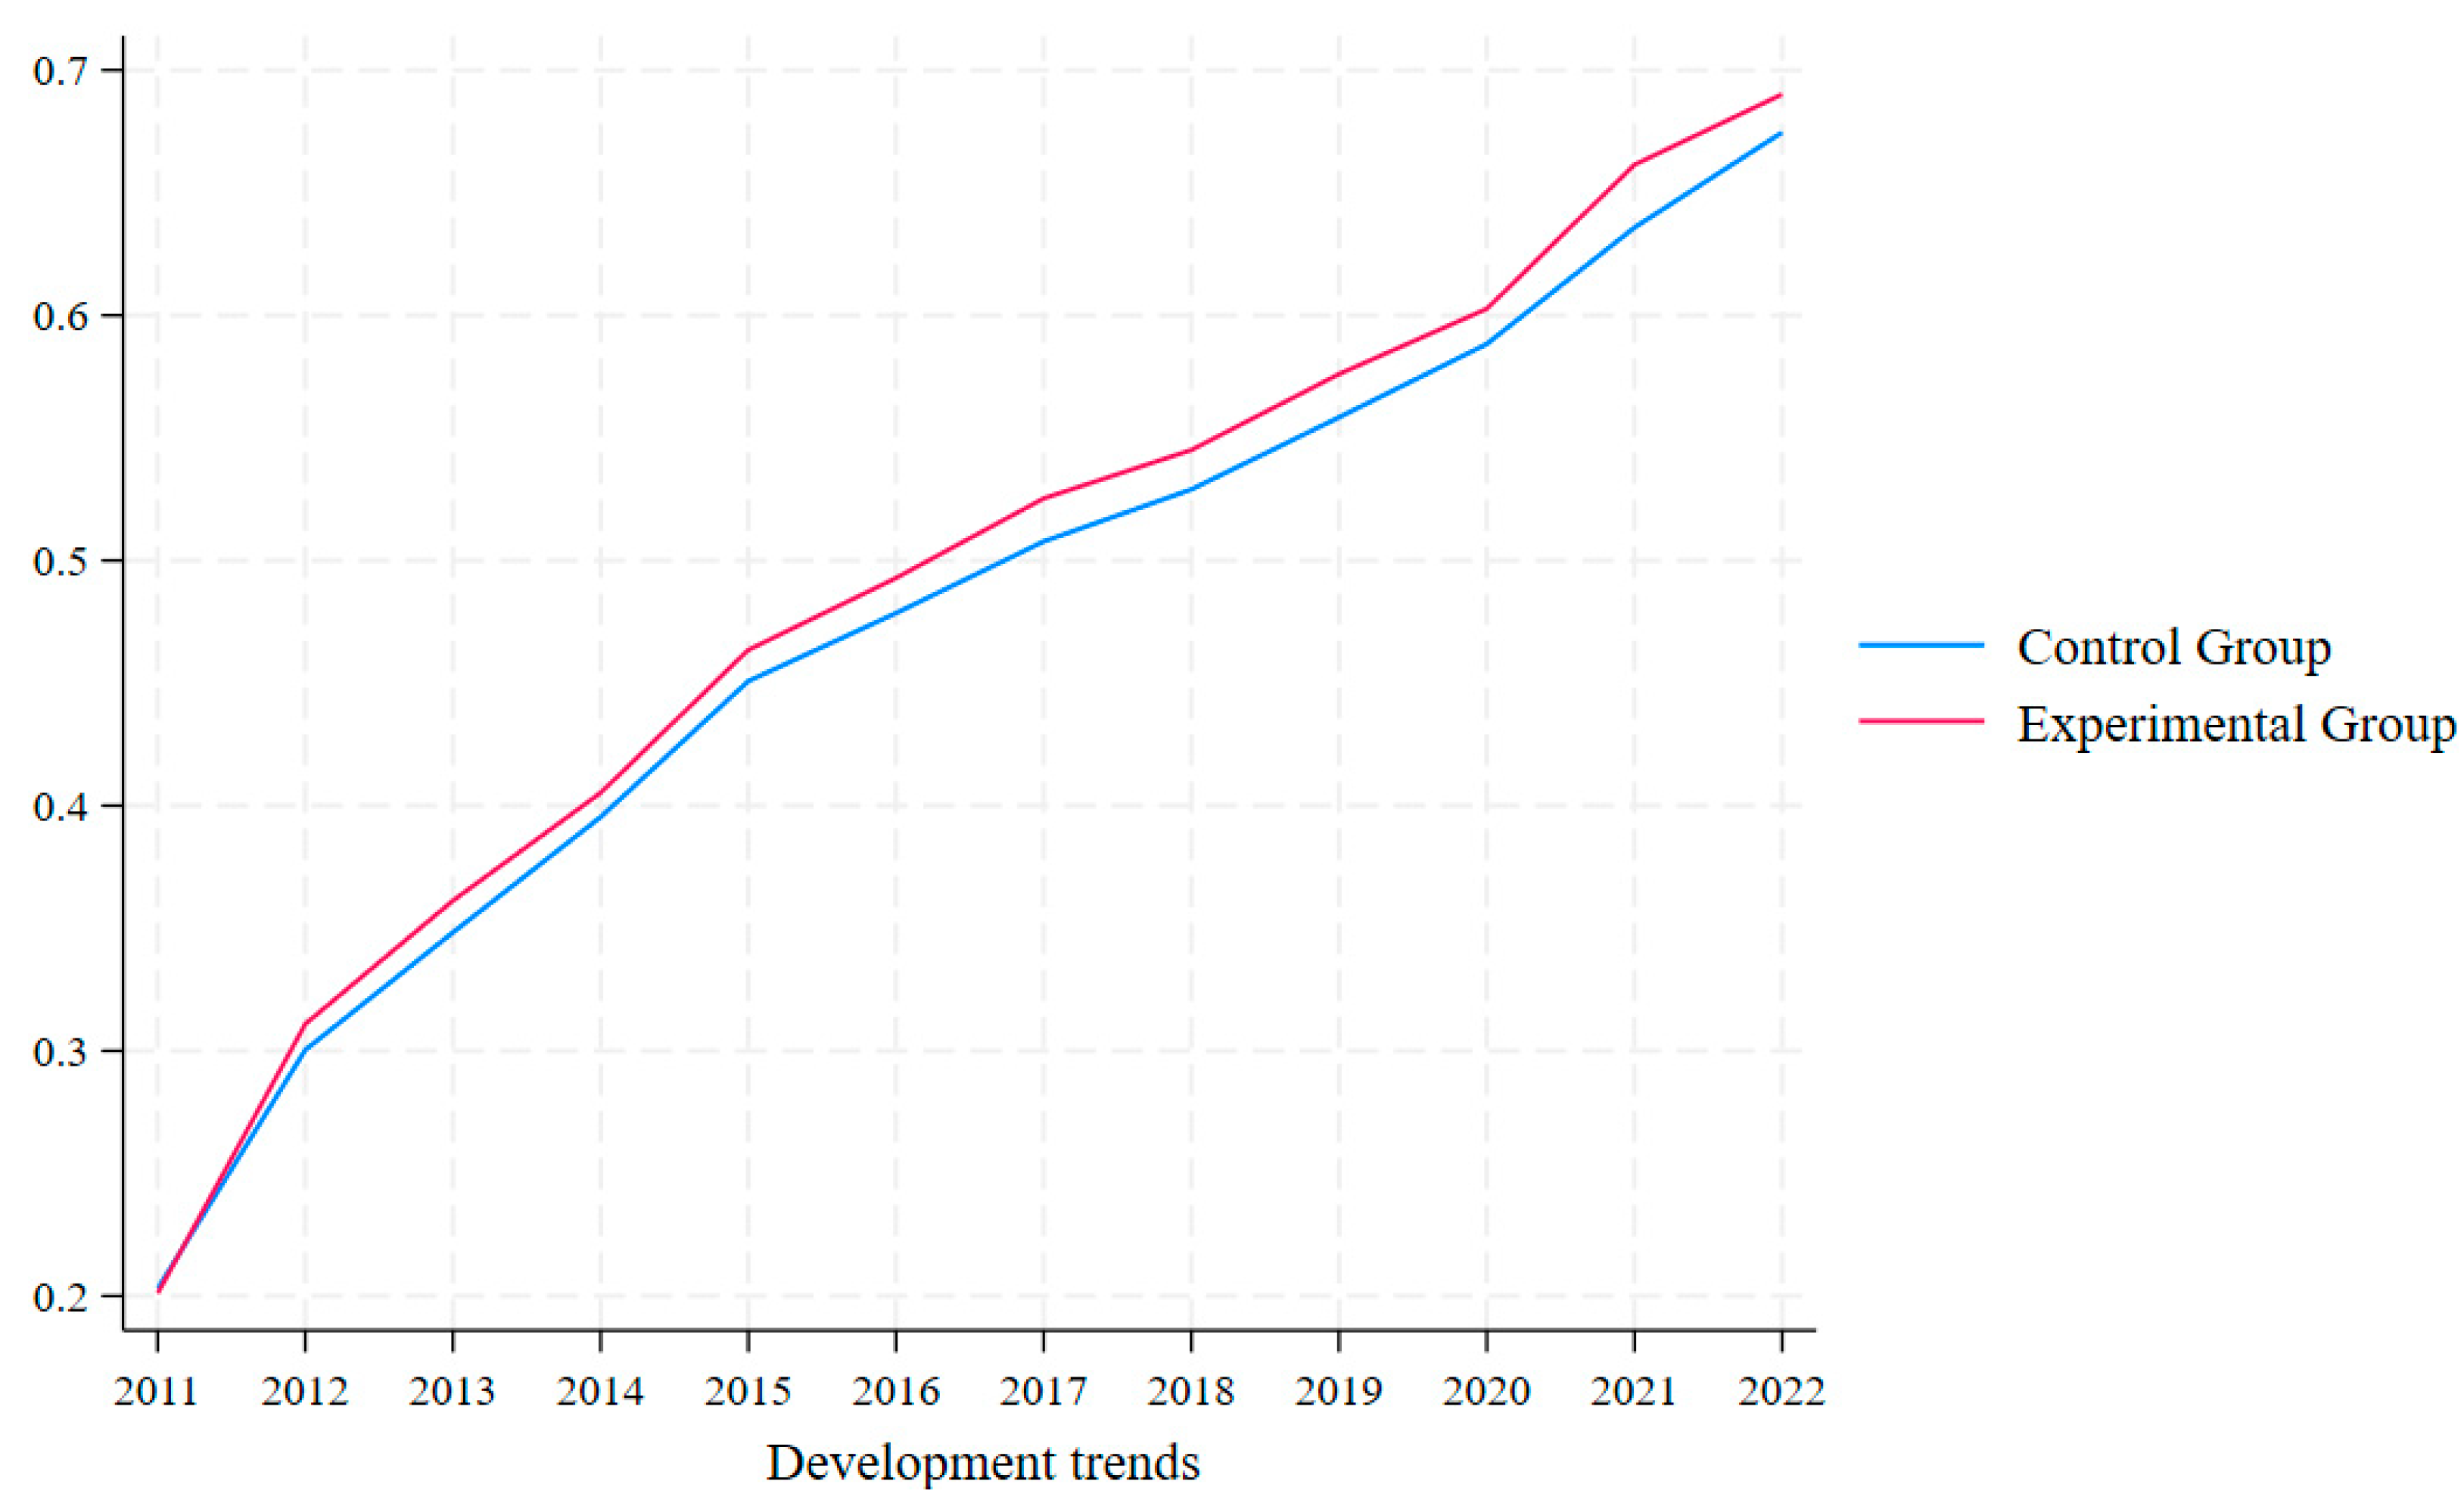
Table 5 presents the differences in the mean values of DGSD between the treatment and control groups, as well as before and after the policy implementation. The results show that the mean DGSD value in the treatment group is 0.022 higher than that in the control group, and the post-policy mean is 0.112 higher than the pre-policy mean. Both differences are statistically significant, suggesting that the MIC2025 policy may have a positive impact on the coordinated development of enterprise digitalization and green transformation. To further illustrate the dynamic trends of DGSD across groups, this study plots the time-series trend of the mean DGSD values (see Figure 3). The results indicate that in 2011, there was almost no difference in the DGSD mean values between the treatment and control groups. From 2012 to 2015, both groups experienced a similar upward trend. However, starting from 2016, the DGSD mean value of the treatment group consistently surpassed that of the control group, and the gap steadily widened over time. This provides additional evidence supporting the positive role of functional industrial policy in promoting the coordinated development of enterprise digitalization and green transformation.

5. Empirical Analysis and Results

5.1. Parallel Trends

Satisfying the parallel trend is a prerequisite for the validity of the double difference model, so this paper utilizes the event study method to construct the following model:
D G S D i t = α + k = 5 , k 1 5 β T r e a t i × P o s t t k + λ X i , t 1 + μ i + ψ j + ν t + ε i j t
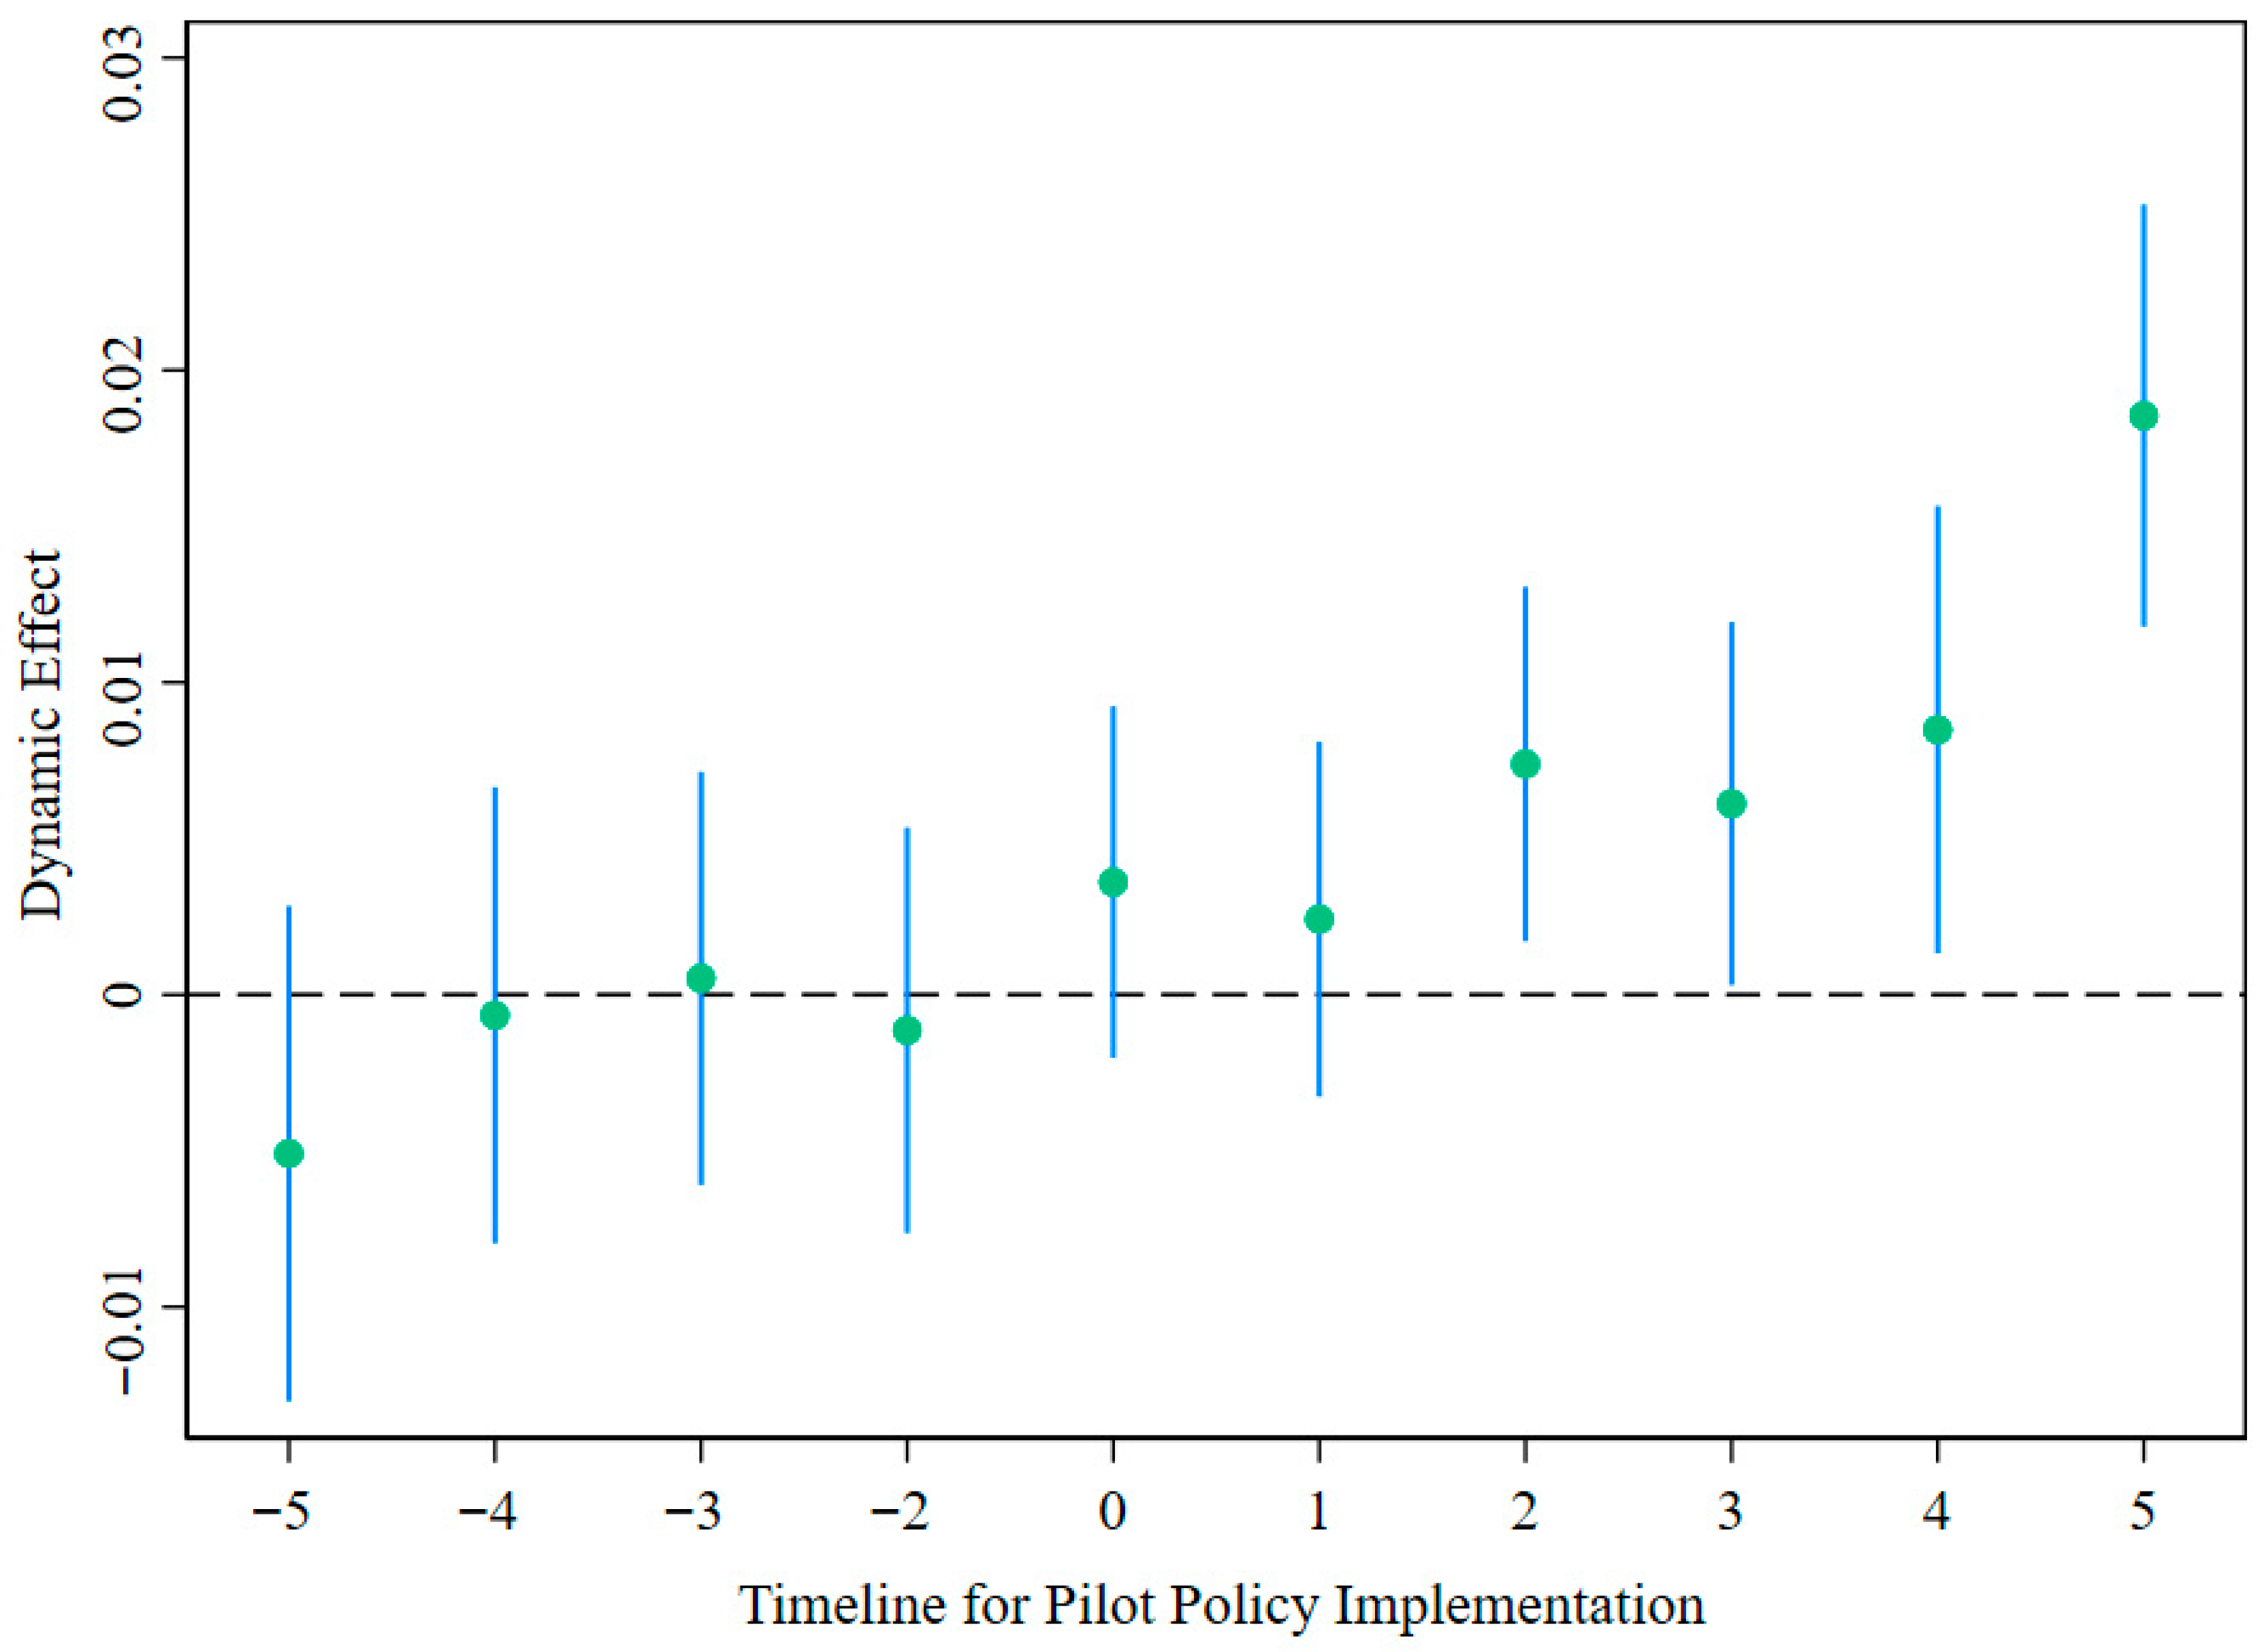
Here, k denotes the number of years since the implementation of the MIC2025 policy. To avoid multicollinearity, the year prior to policy implementation is set as the reference period. The parallel trend test is illustrated in Figure 4. Before the implementation of the MIC2025 policy, the estimated coefficients of the core explanatory variable are statistically insignificant, indicating that the DGSD levels of firms in the treatment and control groups followed a common trend prior to the policy intervention. This finding supports the validity of the parallel trend assumption. Furthermore, the estimated coefficients become significantly positive from the second phase of the policy onward, suggesting that the MIC2025 policy has led to a notable improvement in DGSD levels among firms in the treatment group compared to those in the control group.

5.2. Baseline Regression

To examine the policy effect of MIC2025 pilot cities on enterprise DGSD, this study employs robust standard errors in the baseline regression analysis. This adjustment is designed to address potential heteroskedasticity, thereby improving the reliability of parameter estimates. Table 6 reports the baseline regression results. Columns (1) and (2) present the results without and with control variables, respectively, while controlling for individual fixed effects, time fixed effects, and industry fixed effects. From a statistical perspective, the estimated coefficient of the core explanatory variable is significantly positive at the 1% level, indicating that the implementation of the MIC2025 policy can enhance firms’ DGSD levels. From an economic perspective, compared to firms in the control group, those in the treatment group experienced a 0.0351 increase in DGSD after the policy implementation, which accounts for approximately 6.91% of the sample mean of the dependent variable (0.0351/0.508). These findings suggest that the functional industrial policy MIC2025 contributes to improving firms’ DGSD levels and provide preliminary evidence for further exploration of the mechanisms through which MIC2025 affects DGSD. However, it should be noted that policies may have a lag effect.

5.3. Robustness Test

5.3.1. Heterogeneous Treatment of DID

Stacked Regression Estimator
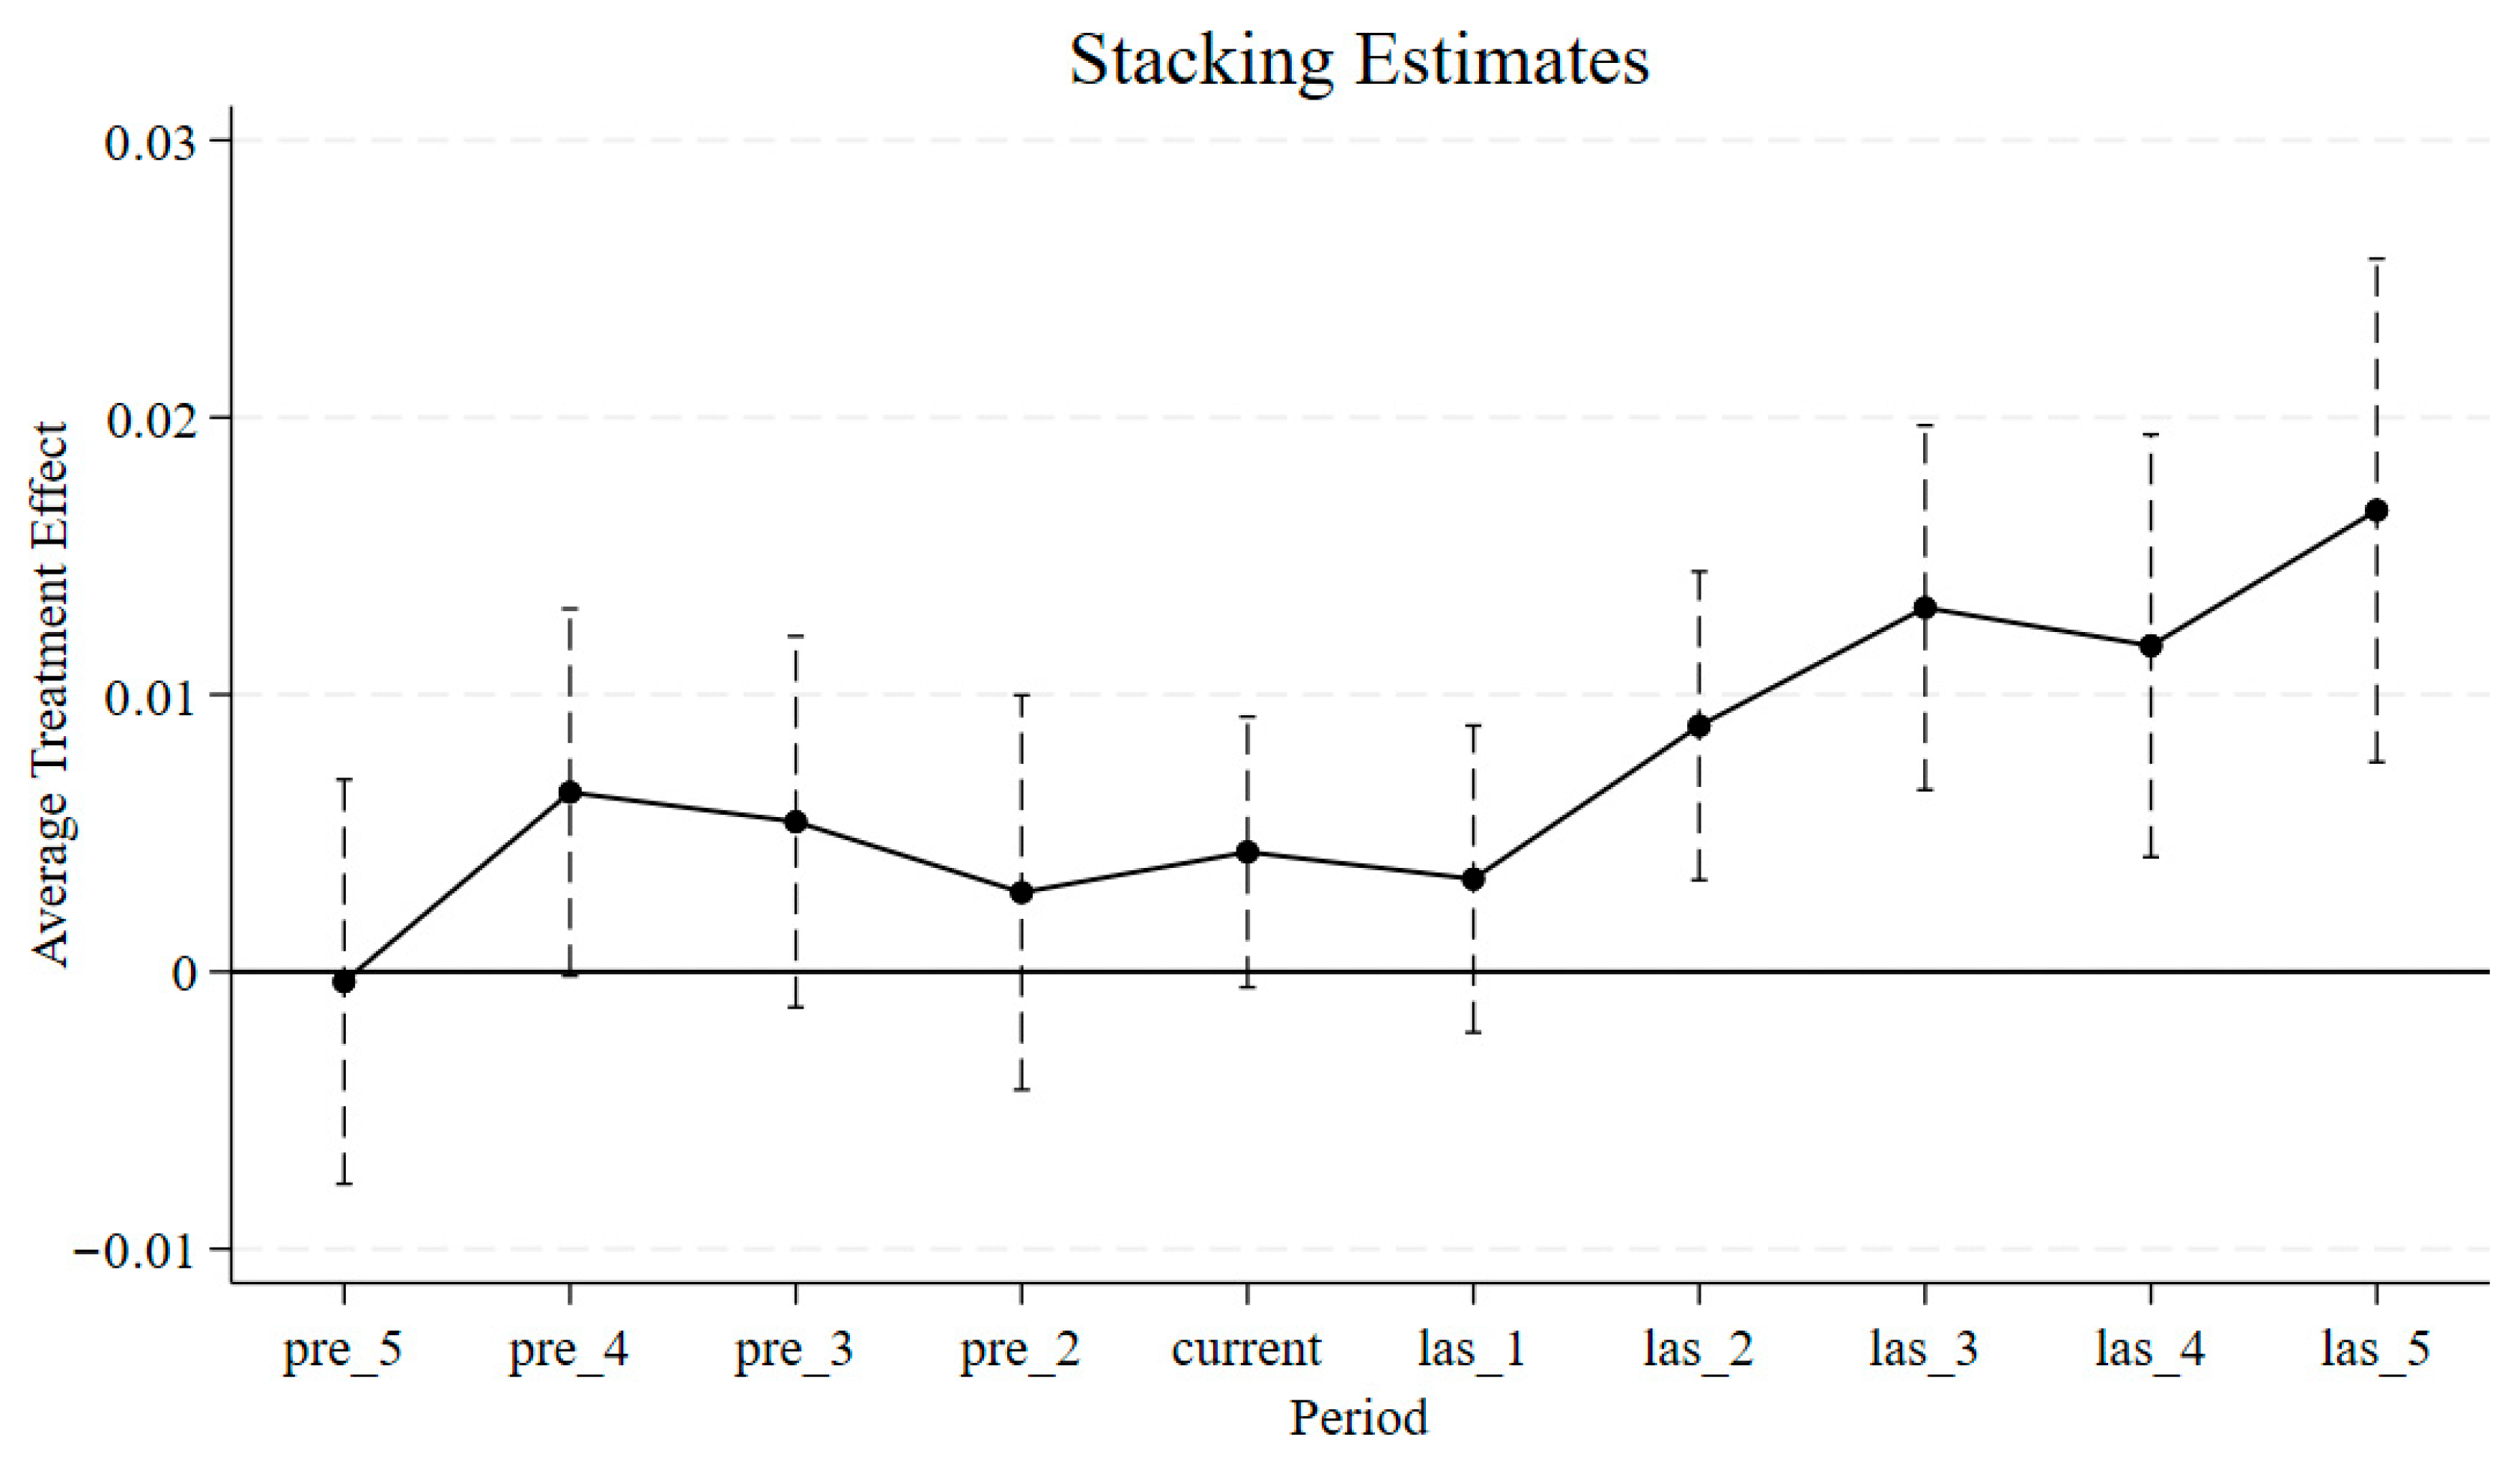
In multi-period DID models, heterogeneous treatment effects may bias the baseline estimation results and lead to incorrect inferences. To address this issue, this study adopts the Stacked Regression Estimator proposed by Cengiz et al. (2019) as a corrective method [76]. The results accounting for treatment heterogeneity are illustrated in Figure 5. Prior to the implementation of the MIC2025 policy, the parallel trends assumption continues to hold between the treatment and control groups. After the policy was introduced, the DGSD level of firms in the treatment group increased significantly, with an overall estimated coefficient of 0.0046 (significant at the 10% level). This indicates that, after accounting for the potential interference of heterogeneous treatment effects on the baseline regression results, the conclusion that the MIC2025 policy effectively promotes firms’ DGSD improvement remains robust and interpretable.
Goodman–Bacon Decomposition
When applying a multi-period DID model for regression estimation, the treatment effects derived from a two-way fixed effects (TWFE) regression may exhibit heterogeneity across groups or over time, thereby undermining the robustness of the estimated coefficients. To evaluate the extent of this potential bias, this study follows the approach proposed by Goodman-Bacon (2021), which decomposes the overall TWFE estimator into a series of 2 × 2 DID comparisons [77]. Each component estimates the treatment effect between a treated and control group defined by a specific timing of treatment and assigns corresponding weights to these comparisons. This decomposition enables a visual and analytical assessment of whether treatment effect heterogeneity poses a serious threat to identification. Table 7 presents the decomposition results of the baseline coefficient into four components. Among them, the potentially problematic comparisons—“late-treated units as treatment group vs. early-treated units as control group” and “treated units vs. always-treated units”—account for only 1.1% and 7.4% of the total weight, respectively. These combinations contribute minimally to the overall estimate. In contrast, the more appropriate comparisons—“early-treated units vs. late-treated units” and “treated units vs. never-treated units”—carry a combined weight of 91.5%, constituting the main source of identification in the model. Therefore, the baseline results based on the multi-period DID framework are considered reliable and robust.

5.3.2. Expectancy Effect Test

One potential concern in this study lies in the possibility that the MIC2025 pilot cities may have been influenced by anticipatory effects. Specifically, the State Council of China released the “Made in China 2025” initiative in 2015, prior to the implementation of the pilot program. This may have led enterprises to anticipate the policy and adjust their production layouts in advance, thereby introducing significant bias into the results. To address this issue, this study follows the approach of Lu and Yu (2015), by including lead dummy variables for the years prior to the policy shock in the baseline regression [78]. Specifically, the policy implementation is hypothetically advanced by one, two, and three years, and the model is re-estimated accordingly after controlling for these effects. Additionally, drawing on Cherniwchan (2017) [79], an alternative strategy is adopted by excluding the sample from the year 2015—immediately preceding the policy implementation—to eliminate its potential influence on the overall estimation results. The specific analysis results are shown in Table 8.

5.3.3. Placebo Test

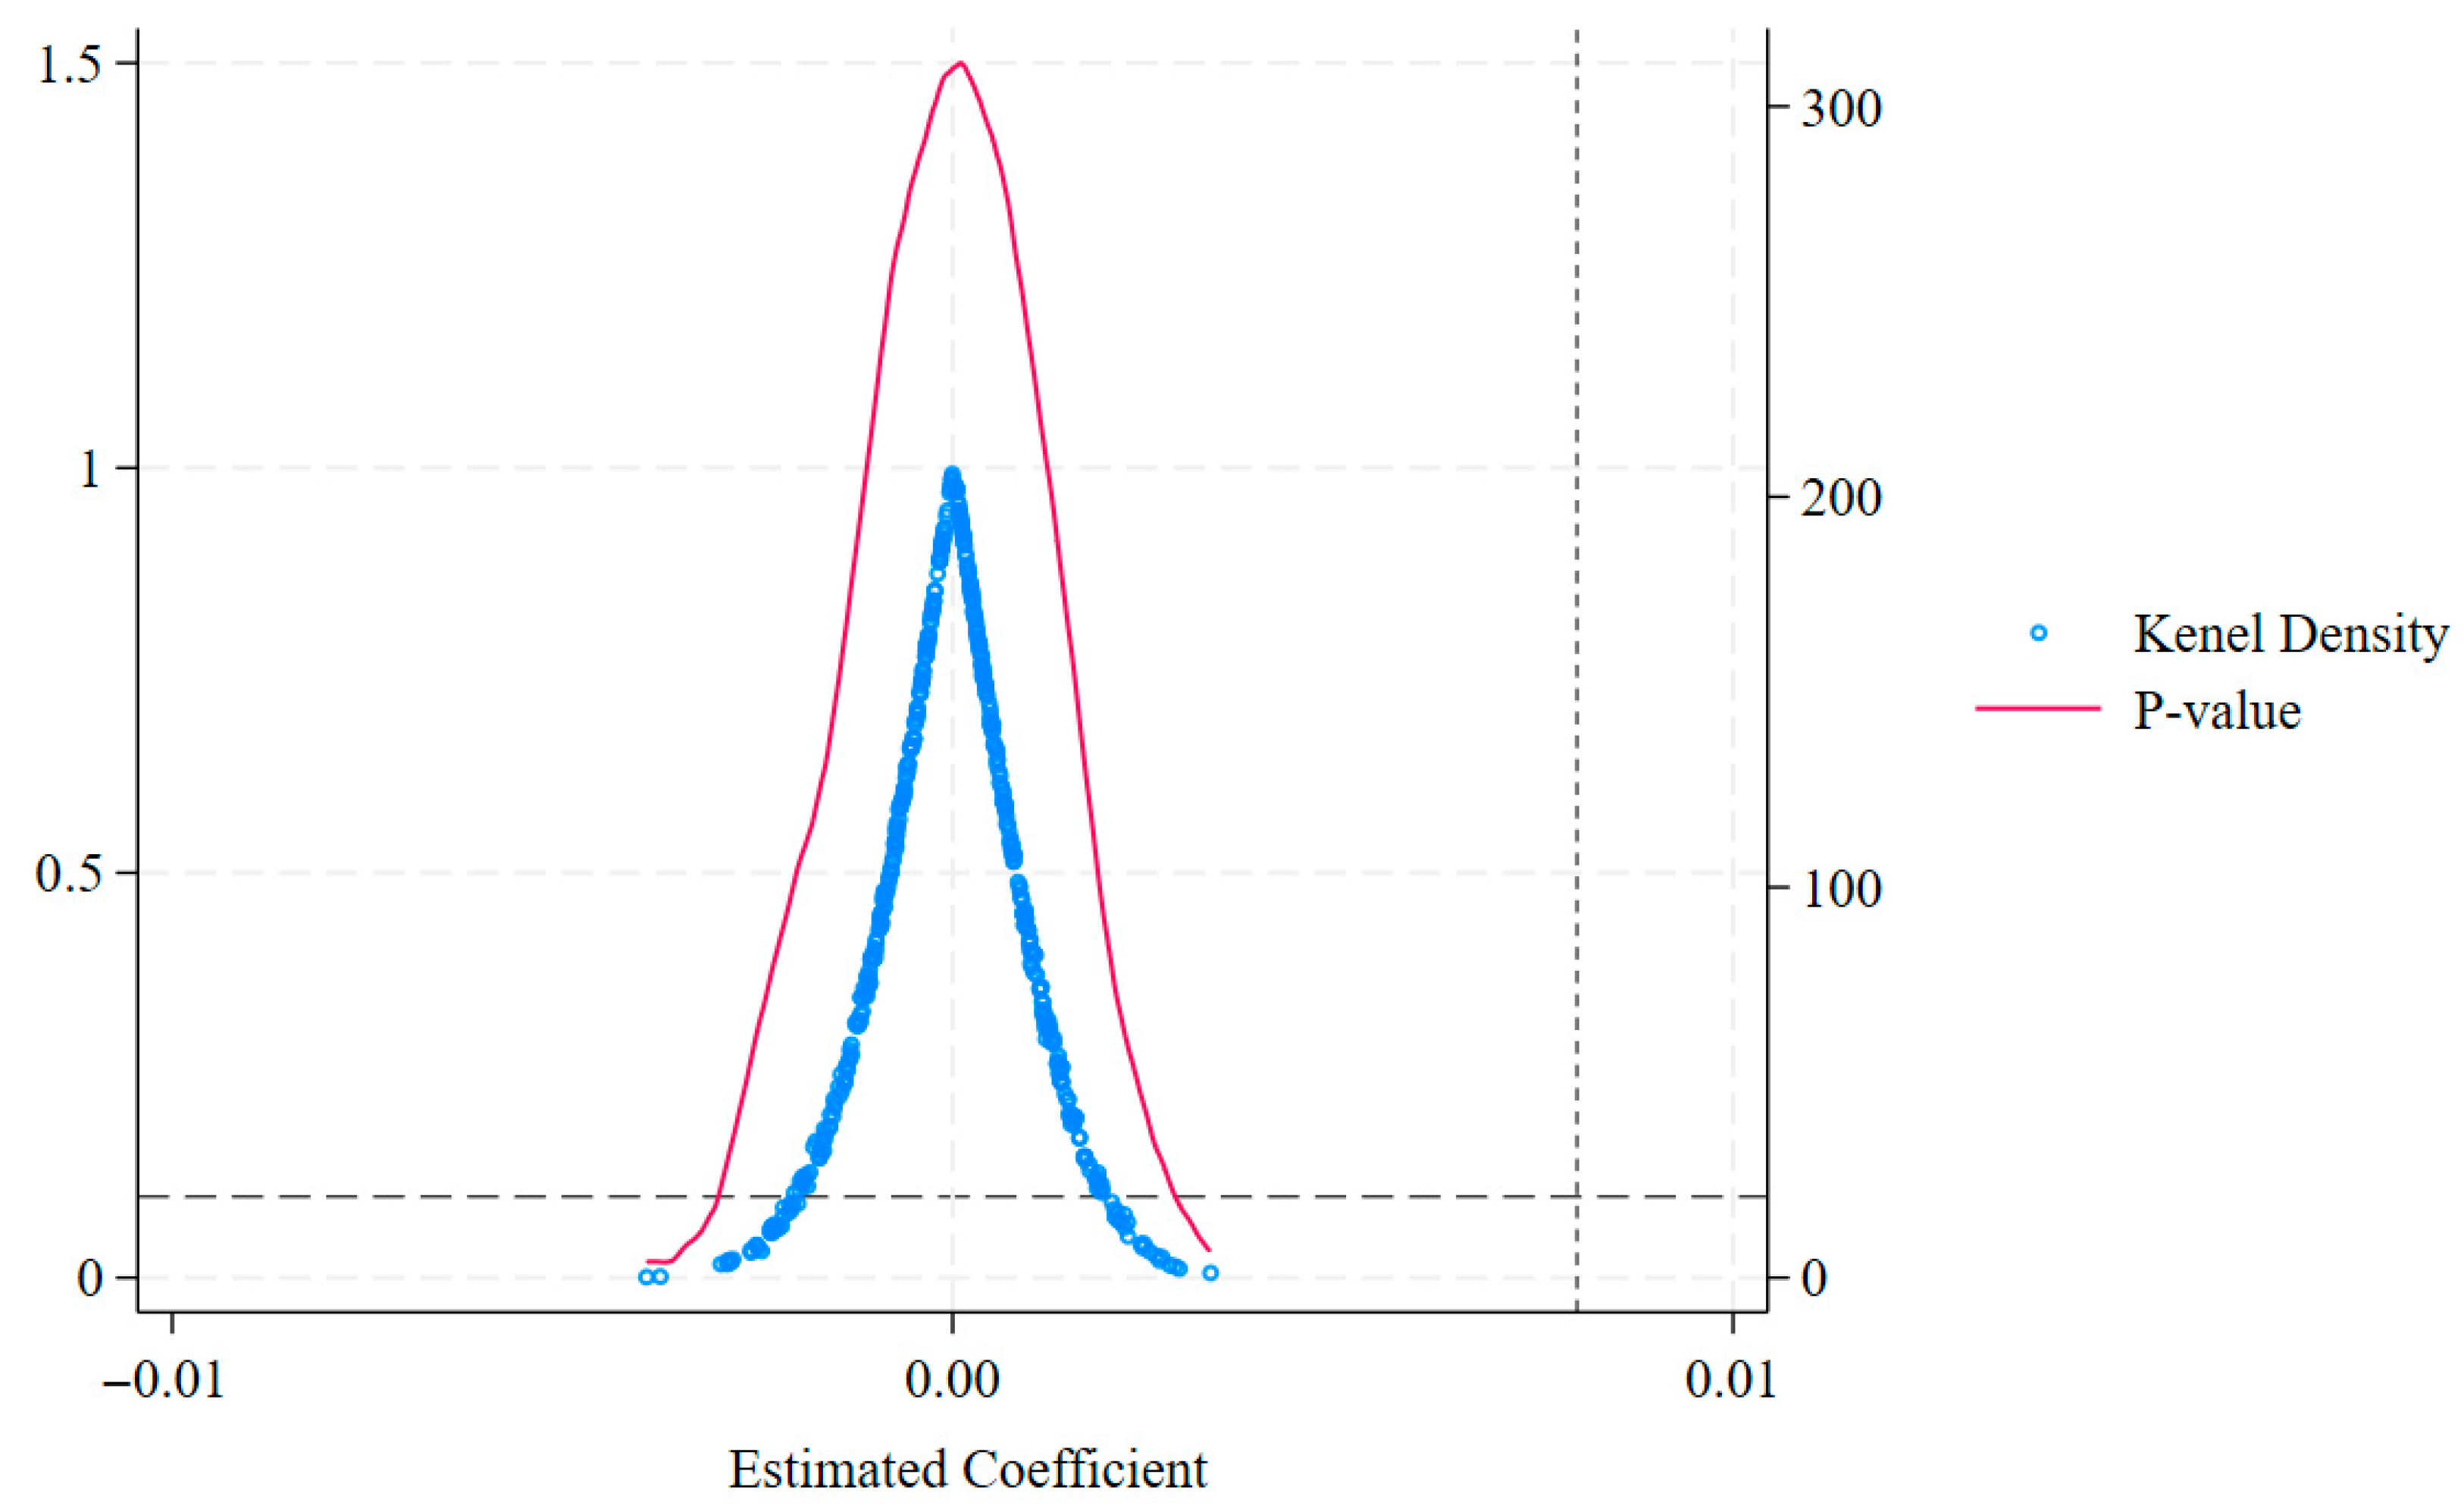
Our research conducts placebo tests from two perspectives to further validate the robustness of the baseline results. First, we construct pseudo-treatment groups to examine whether the observed effects on DGSD could be driven by random shocks. Specifically, we conduct 1000 iterations of random sampling across firms to generate placebo estimates and plot the distribution of the resulting coefficients. As shown in Figure 6, the blue icon represents the distribution of placebo coefficients, the vertical dashed line denotes the actual coefficient from the baseline regression, and the horizontal dashed line indicates the 10% significance level. The results reveal that the placebo estimates are concentrated around zero and are substantially distant from the actual estimated coefficient. Moreover, the majority of the placebo estimates have p-values greater than 0.1, indicating that the DGSD outcomes are unlikely to be driven by unobserved random shocks. These findings reinforce the credibility and robustness of the baseline DID estimation.
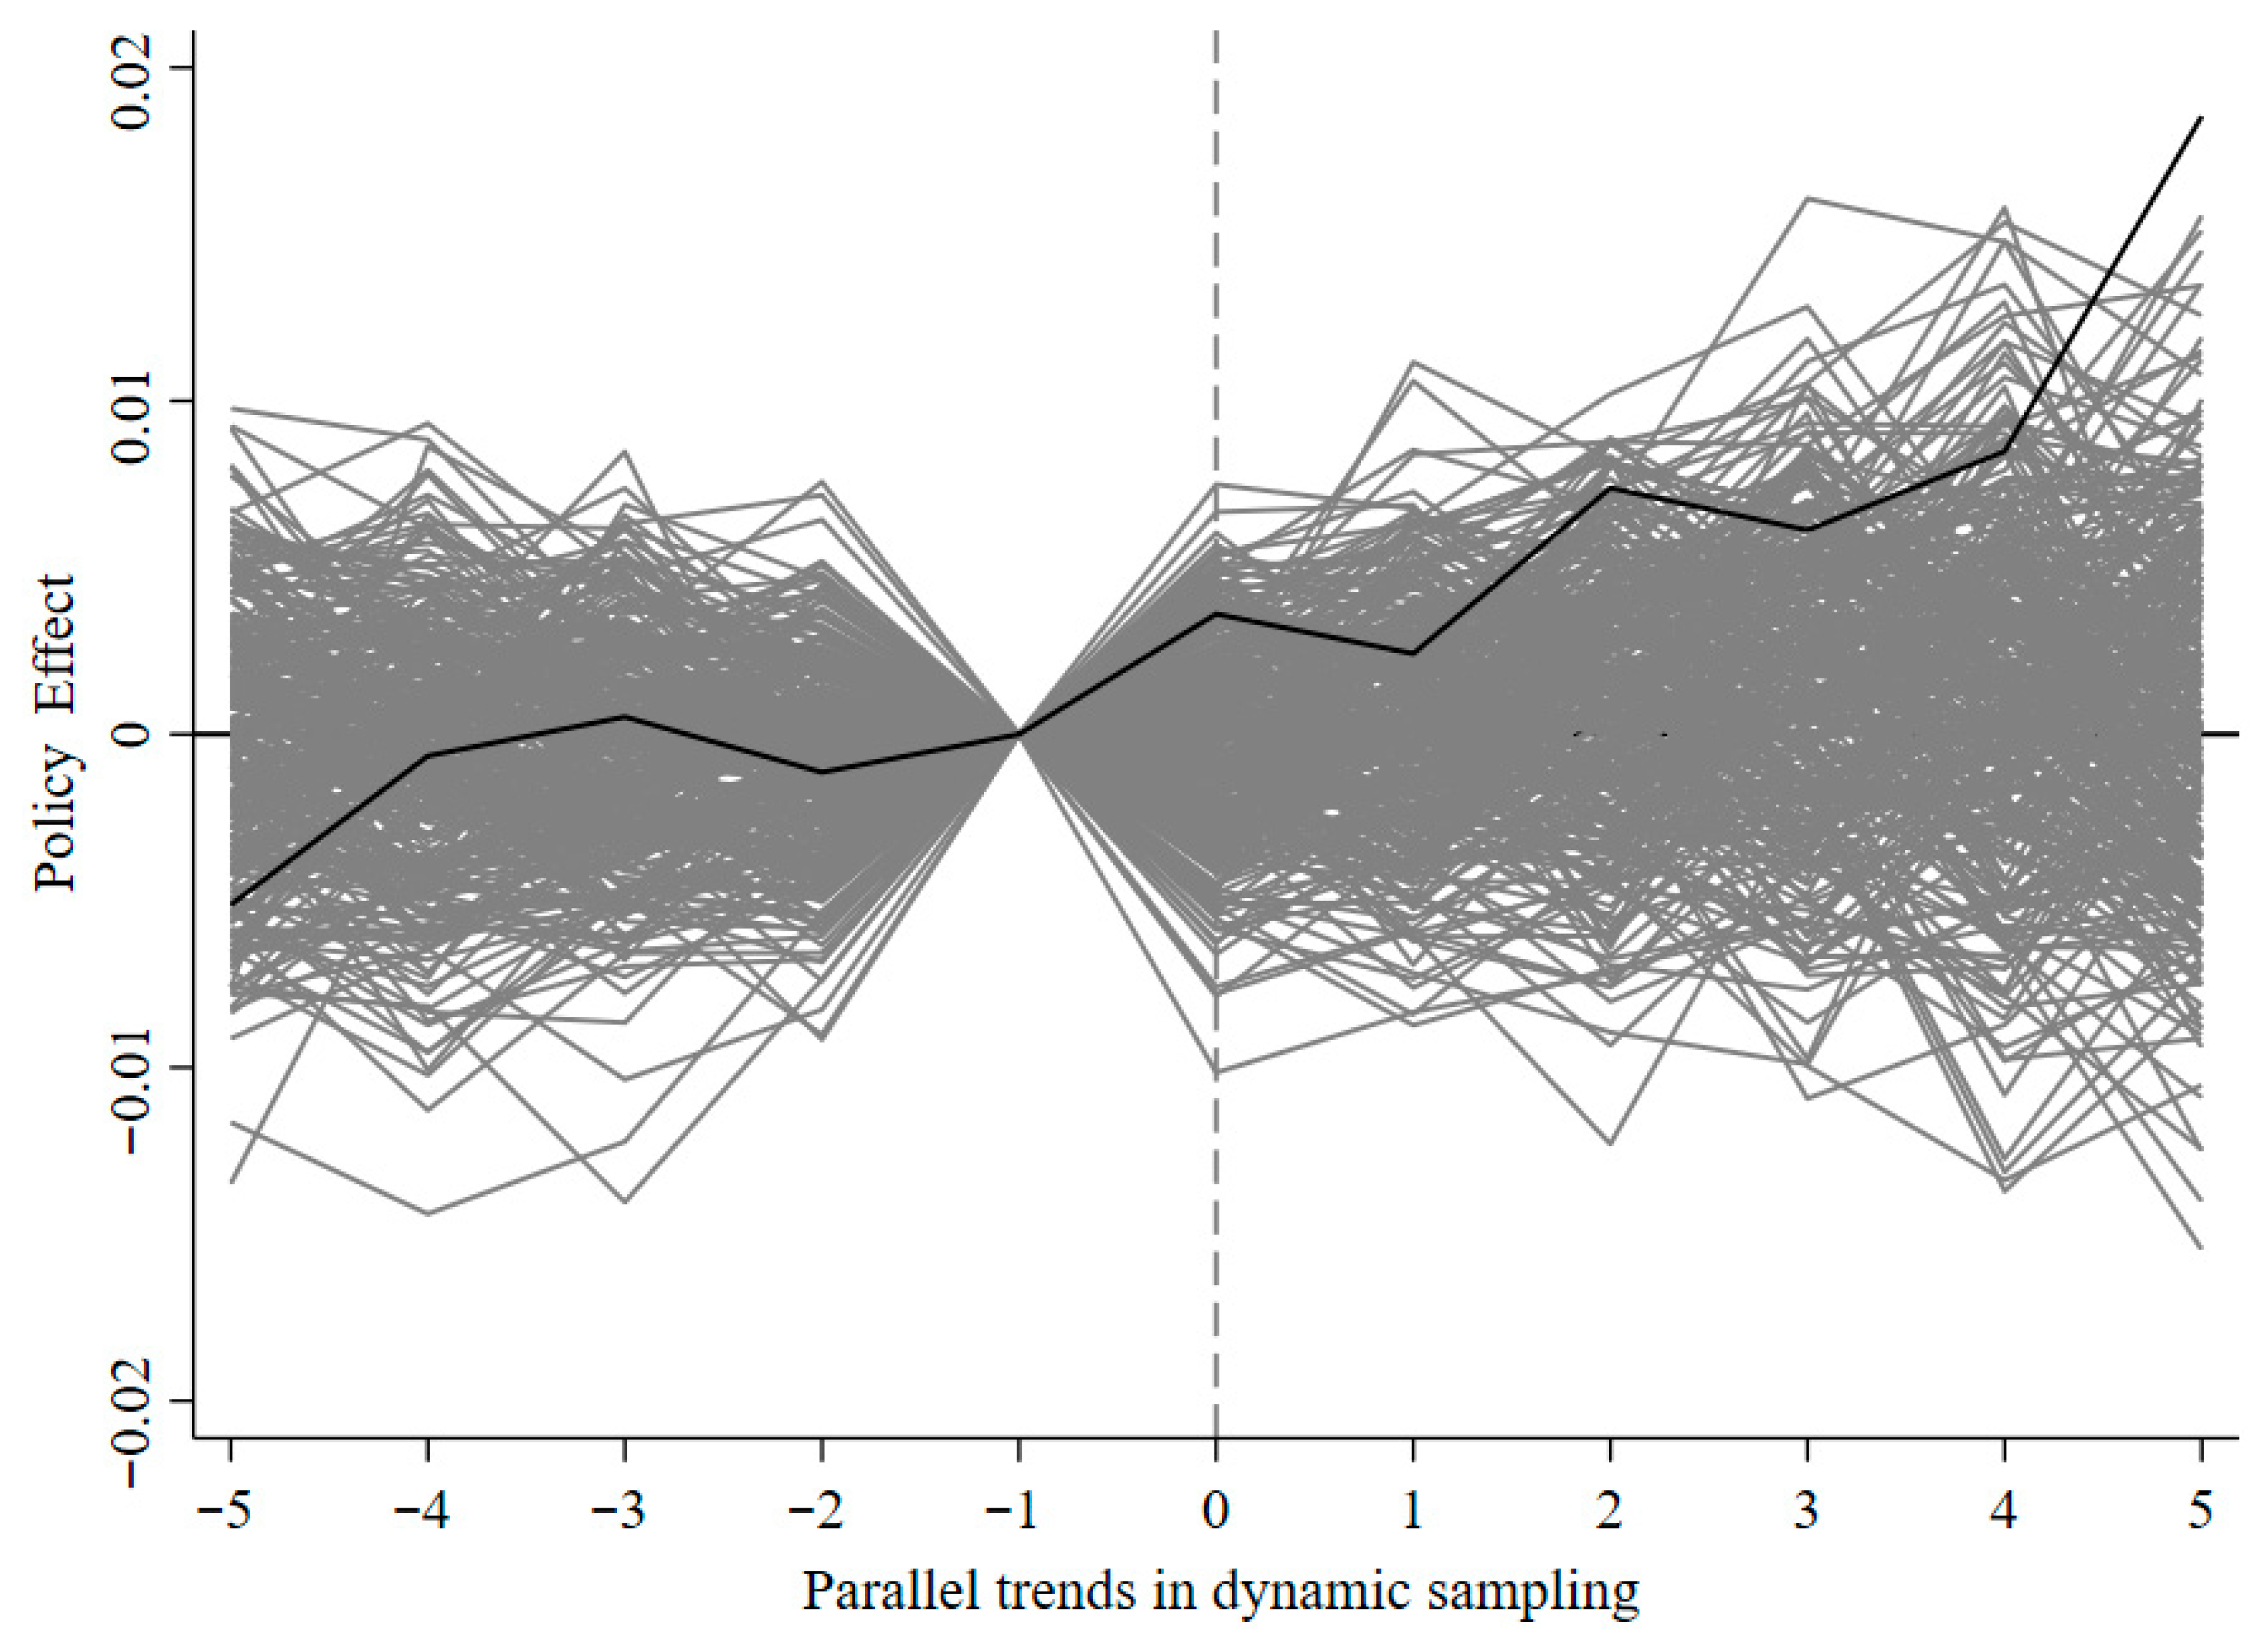
Second, following Abadie et al. (2010) [80], this study implements a placebo test based on an event study design. Specifically, we fix the policy implementation years as 2016 and 2017 and randomly draw a set of firms from the full sample to serve as placebo-treated groups, with the number of pseudo-treated firms matching that of the actual treated group. Using Equation (23), we estimate the treatment effect and repeat this process 300 times. Figure 7 displays the dynamic placebo test results. The gray lines represent the distribution of estimated coefficients from the placebo trials, which are symmetrically distributed around the y = 0 line, while the black line represents the actual coefficient path from the baseline regression. By comparing the dynamic trajectories of the placebo-based pseudo-treatment effects and the actual estimated effect, we find that the post-treatment estimates for the real treatment group lie significantly above most of the placebo curves. Furthermore, the placebo groups exhibit no clear upward trend, indicating that the observed improvement in firms’ DGSD is not driven by random fluctuations, but is instead causally linked to the implementation of the MIC2025 policy.

5.3.4. Dual Machine Learning

Compared with traditional causal inference models, machine learning techniques can effectively handle nonlinear data, thereby mitigating issues such as the “curse of dimensionality” and estimation bias caused by model misspecification [81]. This study employs machine learning models, including Random Forest, Interaction Trees, and Gradient Boosting, setting the sample split ratio at 1:3 to validate the impact of the MIC2025 policy on firms’ digital–green coordinated development (DGSD). Columns (1) and (2) in Table 9 present the regression results with the sequential inclusion of linear and quadratic control variables, respectively. The estimated coefficients indicate that the MIC2025 policy effect on enterprise DGSD remains positively significant.

5.3.5. Exclusion of Other Policies

To more accurately identify the causal effect of the MIC2025 policy on firms’ digital–green synergistic development (DGSD), this study controls for potential confounding policy shocks during the sample period. Specifically, several local governments began investing in computing infrastructure, including the construction and operation of supercomputing centers in cities such as Tianjin, Shenzhen, and Guangzhou. In parallel, efforts to develop the data factor market were initiated through the establishment of data trading platforms beginning in 2014. Furthermore, the new Environmental Protection Law, enacted in 2015, represents a major regulatory shock in environmental governance. To capture the impact of this law, heavily polluting industries are identified based on the second-level industry classifications defined by the 2012 revision of the CSRC’s Guidelines for Industry Classification of Listed Companies. Additionally, to reduce carbon emissions and achieve the carbon neutrality goal, China successively launched three rounds of low-carbon pilot city programs, which may also influence firms’ green transformation. Table 10, columns (1) through (5), reports the estimation results after controlling for these policy interferences. Whether we control for each policy shock individually or exclude all of them simultaneously, the positive effect of MIC2025 on firms’ DGSD remains significant at the 1% level.

5.3.6. Other Robustness Tests

In addition, other robustness checks conducted in this study are presented in Table 11. To avoid the potential influence of measurement error in the dependent variable on the estimation results, we perform new baseline regressions using alternative measures of the dependent variable. Specifically, two approaches are adopted: first, using a simple interaction term between firms’ digital transformation and green transformation [82]; and second, replacing the frequency-based measure previously used with the ratio of digital assets to total assets, consistent with the DGSD calculation method adopted in the coupling coordination model. Regardless of whether the simple interaction term or the revised DGSD measure is used, the estimated coefficients remain significantly positive. Furthermore, we re-estimate the baseline regression using robust clustered standard errors with an alternative clustering method, and the results remain significantly positive at the 5% level. By excluding the COVID-19 period and applying a winsorization treatment, the results continue to support the conclusion that the MIC2025 policy has a robust positive effect on firms’ DGSD. Finally, we also conducted benchmark regression by lagging the policies by three periods, respectively, to verify the policy lag reported in the parallel trends. It is specifically shown in Table 12.

5.4. Endogenous Alleviation

5.4.1. Instrumental Variable Approach

Endogeneity in empirical analysis may arise from issues such as reverse causality, sample selection bias, and omitted variable bias, all of which can undermine the consistency of parameter estimates. To address this concern, our study adopts an instrumental variable (IV) approach within a quasi-natural experiment framework. Drawing on the methodology of Duranton and Turner (2012), who employed historical and geographical instruments [83], we use a historical indicator—whether a city was connected to the railway network in 1933 during the Republic of China era—as our IV. A valid instrument must satisfy both relevance and exogeneity; that is, it should be strongly correlated with the core explanatory variable (MIC2025) but uncorrelated with the error term in the outcome equation. In our case, cities that had rail access in 1933 are more likely, due to historical path dependence, to have developed robust manufacturing systems and industrial economies, increasing their likelihood of being selected as MIC2025 pilot cities—thereby satisfying the relevance condition. At the same time, from a historical perspective, whether a city had a railway in 1933 is unlikely to directly affect firms’ contemporary DGSD outcomes, supporting the exogeneity assumption. Since this IV is cross-sectional, we interact it with a time-series variable—annual city-level per capita capital stock—to construct a panel IV [84]. The estimation is carried out using two-stage least squares (2SLS). As reported in Table 13, the Kleibergen–Paap LM statistic is 269.278 (significant at the 1% level), and the Kleibergen–Paap Wald F statistic is 344.169 (well above the conventional threshold of 16.38), indicating that the instrument is neither under-identified nor weak. Furthermore, the coefficients from both stages remain significantly positive at the 1% level, confirming the robustness of our main findings when accounting for endogeneity through the IV approach.
Compared to modern railways or high-speed rail systems, the railways constructed in 1933 primarily served the political and military needs of the Republic of China era, such as facilitating wartime logistics and the transmission of military and governmental directives. Economic considerations were secondary at that time. Although these historical railways were not intentionally designed to connect economically advanced cities, their long-term historical effects may have indirectly contributed to industrial development through alternative channels—such as fostering a more skilled labor force or cultivating a cultural environment conducive to technological innovation. To further validate the exclusion restriction of the instrumental variable (IV), we adopt two approaches. First, following the strategy proposed by Nunn and Wantchekon (2011) [85], we examine whether the IV affects the outcome variable DGSD in a subsample where the treatment effect is expected to be absent. Specifically, we exclude all observations with Post = 1 (after MIC2025 implementation) and conduct a baseline regression of DGSD on the IV. As shown in Column (1) of Table 14, the estimated coefficient of the IV is no longer statistically significant, suggesting that the instrument influences DGSD only through the MIC2025 policy channel. Second, to account for possible unobserved pathways through which the IV may affect DGSD, we include a comprehensive set of city-level control variables in the regression. These controls include expenditures on science and technology, education investment, human capital level, transportation accessibility, labor productivity, and innovation and entrepreneurship indicators [86]. Column (2) presents the baseline IV and DGSD relationship, while Column (3) shows the results after adding the aforementioned controls. The estimated coefficients remain largely unchanged, thereby providing further evidence against alternative transmission mechanisms and supporting the validity of the exclusion restriction.

5.4.2. Preference Score Matching

In estimating the policy effect of MIC2025 on firms’ DGSD, the identification strategy relies on the classification of treated and control groups based on whether firms are located in designated pilot cities. However, such a quasi-experimental design may be subject to sample selection bias. To address this concern, we adopt a Propensity Score Matching difference-in-differences (PSM-DID) approach. Specifically, we use all control variables previously employed in the baseline regressions as matching covariates and conduct a Logit regression with the binary Treat variable as the dependent variable. Firms are matched using the 1:2 nearest-neighbor matching method. The estimation results are reported in Table 14, column (4). The coefficient remains positive and statistically significant, which is consistent with the baseline estimates.

6. Further Analysis

6.1. Heterogeneity Analysis

6.1.1. Regional Level

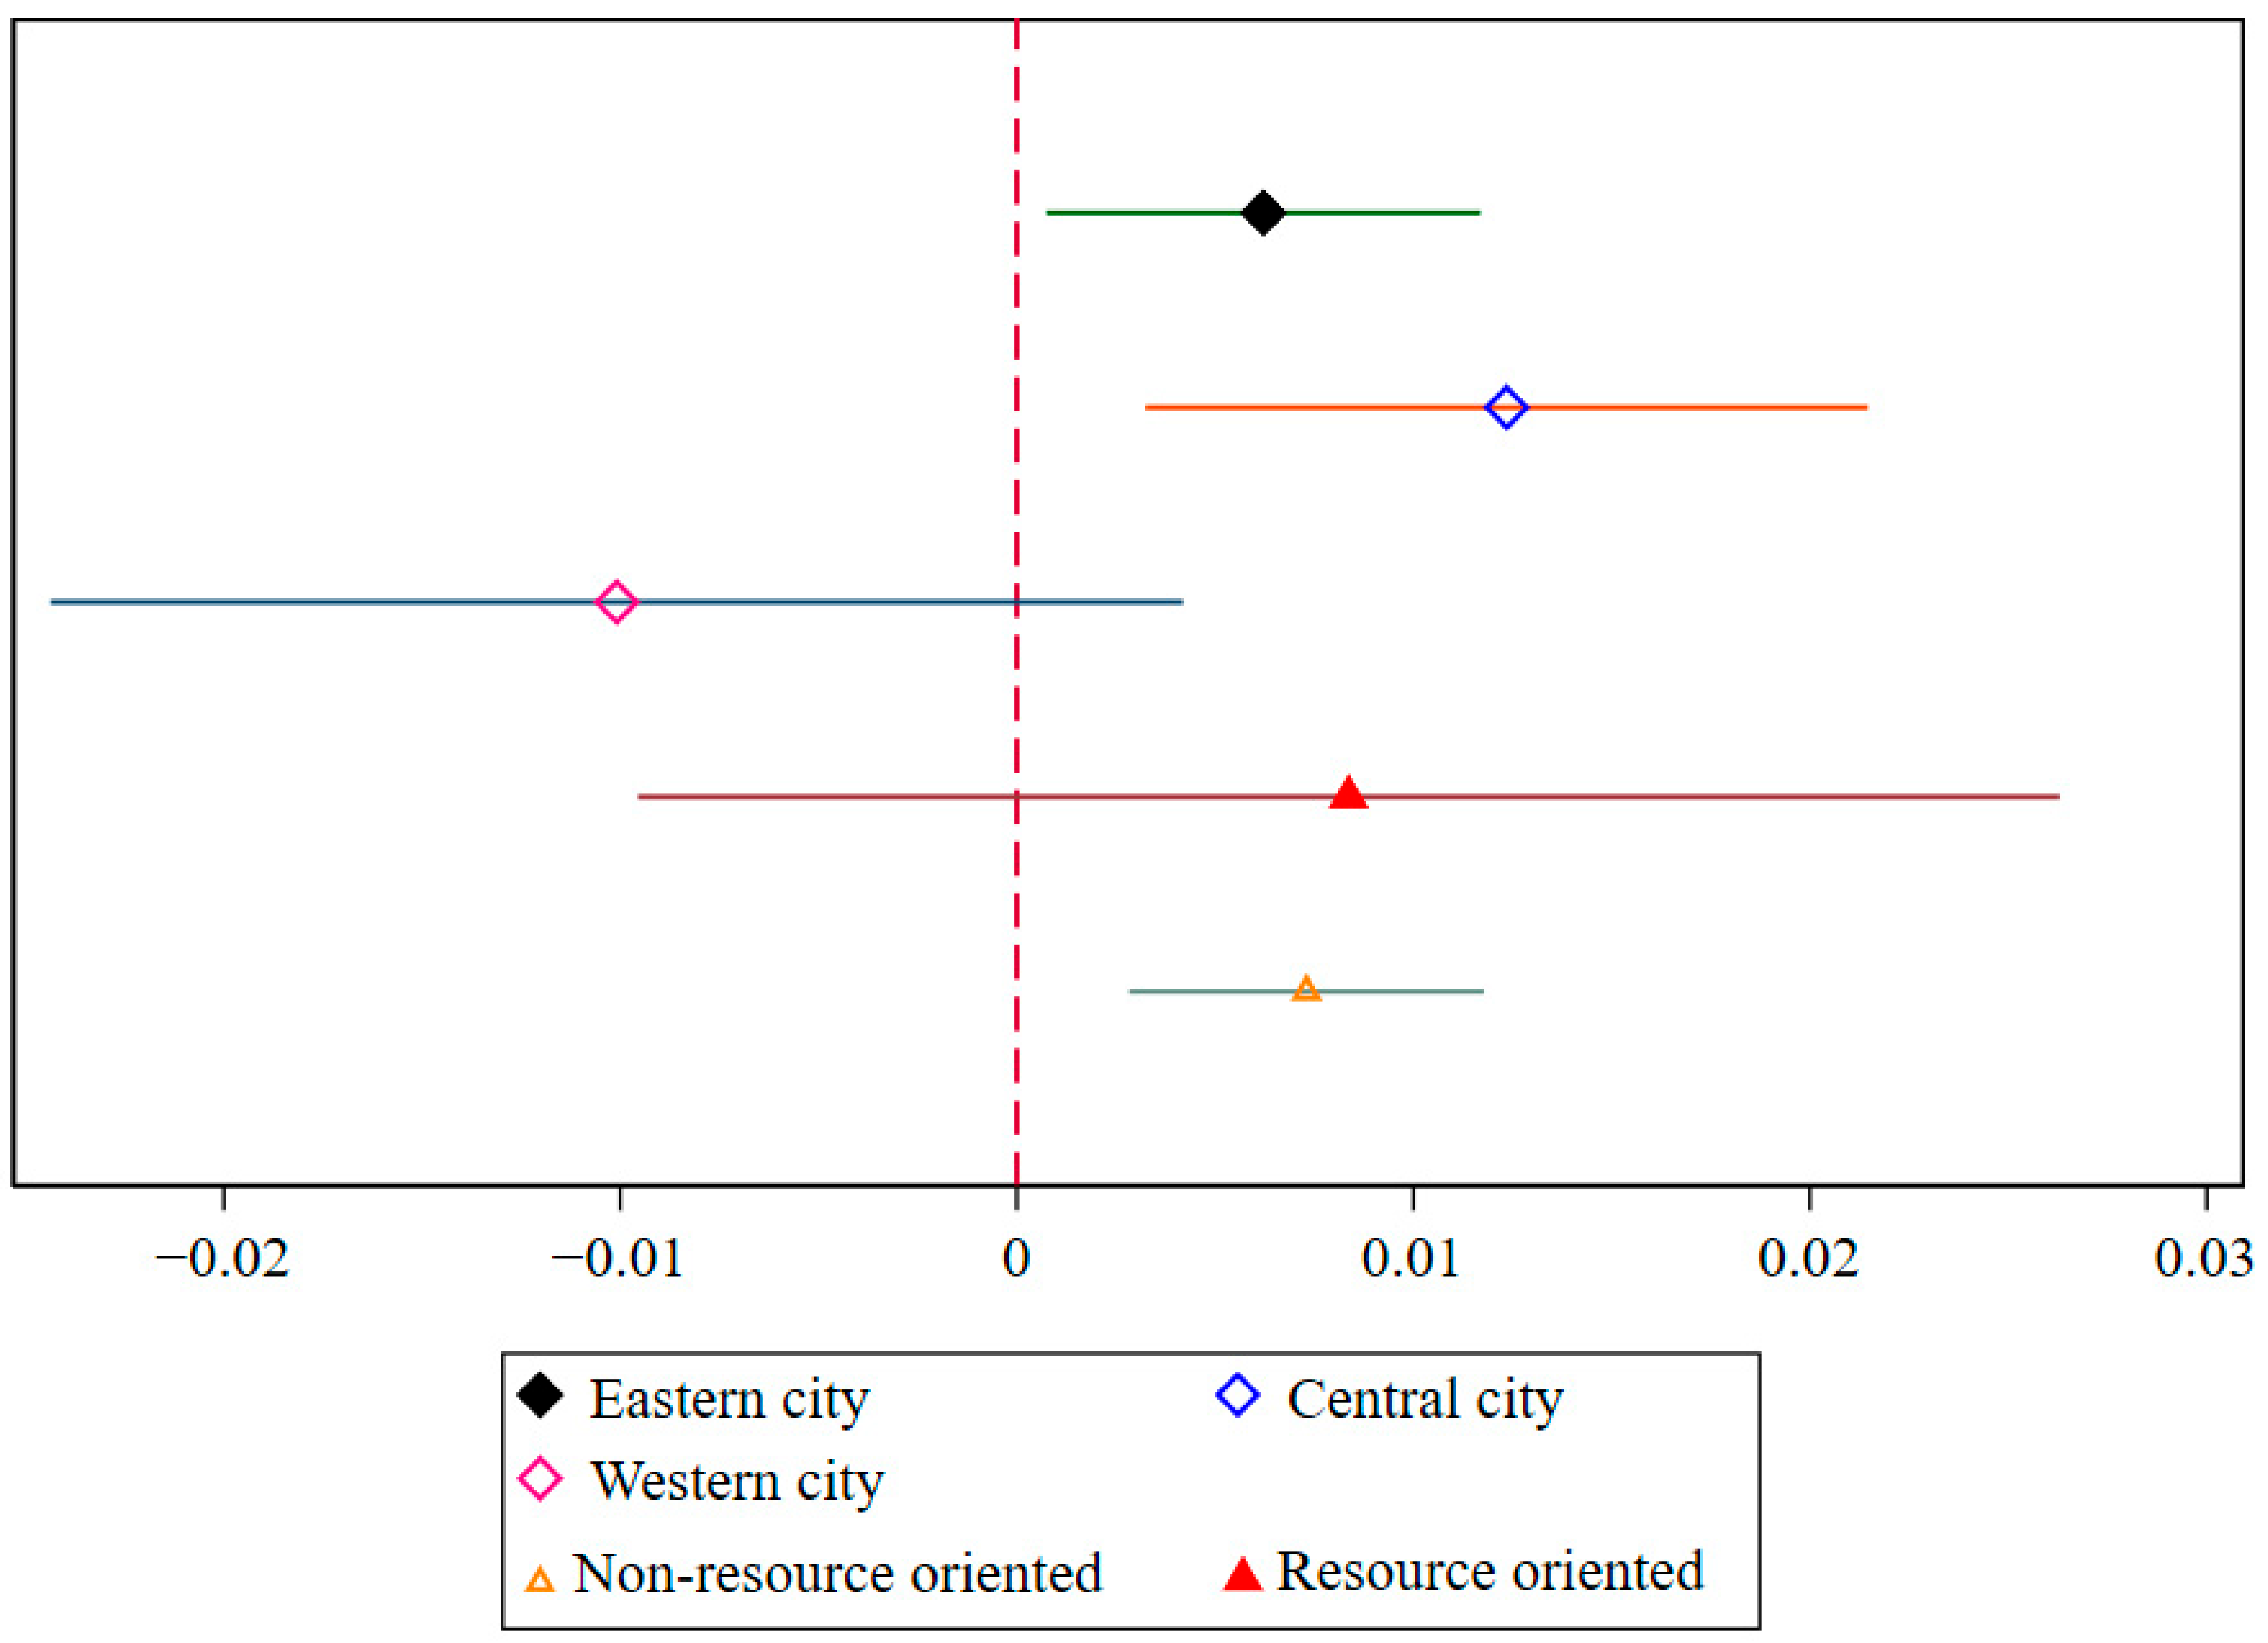
In theory, the effectiveness of the MIC2025 policy in promoting firms’ digital–green coordinated development (DGSD) may vary significantly across regions due to differences in local socioeconomic conditions. To examine this heterogeneity, we first conduct subgroup regressions based on the “Several Opinions of the Central Committee of the Communist Party of China and the State Council on Promoting the Rise of the Central Region” and “The State Council issued implementation guidelines on several policy measures for the development of western China”, categorizing the sample into eastern, central, and western cities. Additionally, we distinguish between resource-based and non-resource-based cities based on the classification outlined in the National Plan for the Sustainable Development of Resource-Based Cities (2013–2020). The eastern region, with its relatively advanced level of economic development, enjoys access to foreign technology, a high-quality talent pool, and a favorable business environment, alongside a well-established high-tech industrial foundation. It is home to China’s major economic engines—the Beijing–Tianjin–Hebei region, the Yangtze River Delta, and the Guangdong–Hong Kong–Macao Greater Bay Area—where factors such as capital, labor, knowledge, and technology are highly concentrated. While the central region lags behind in overall development, it has increasingly attracted innovative technology, skilled professionals, and high-quality capital as a result of industrial restructuring and national strategies to support small and medium-sized cities. These dynamics contribute to sustained momentum for DGSD in central cities. In contrast, resource-based cities tend to rely heavily on resource exploitation, often lacking investment in technological innovation and environmental awareness, making them more vulnerable to the “resource curse” and hindering their capacity for dual digital and green transformation [87].
The heterogeneity analysis is visually presented through graphical illustrations, and detailed estimation results are reported in Figure 8 and Table 15. Columns (1) and (2) show that the MIC2025 policy significantly enhances DGSD in eastern and central cities, with a stronger effect observed in the central region, suggesting a “latecomer advantage”. This also highlights the lack of complementary elements in policy responses in western regions. However, no significant policy effect is detected in western cities. Columns (3) and (4) further indicate that the policy does not significantly promote DGSD among firms located in resource-based cities, underscoring their limited capacity to leverage the policy for coordinated transformation.

6.1.2. City Development Level

Focusing on the city-level heterogeneity, this study selects two key variables as the basis for subgroup analysis: local government fiscal competitiveness and industrial structure upgrading. The level of fiscal competitiveness is measured by the ratio of general public revenue to general public expenditure at the local government level. For the measurement of industrial structure upgrading, we follow a vector-based approach: the economy is divided into three sectors (primary, secondary, and tertiary), and the share of each sector’s value added in GDP is treated as a three-dimensional X 0 = ( x 1,0 ; x 2,0 ; x 3,0 ) spatial vector, representing the city’s industrial structure. Then calculate the angles θ1, θ2, and θ3 between X 0 and the vectors X 1 = (1,0,0), X 2 = (0,1,0), and X 3 = (0,0,1), respectively, where the industries are arranged from low to high levels:
θ j = a r c c o s ( i = 1 3 ( x i . j x i , 0 ) ( i = 1 3 ( x i , j 2 ) 1 / 2 i = 1 3 ( x i , 0 2 ) 1 / 2 ) ) , j = 1,2 , 3
Therefore, the formula for defining the value of industrial structure advancedization W is
W = k = 1 3 j = 1 3 θ j
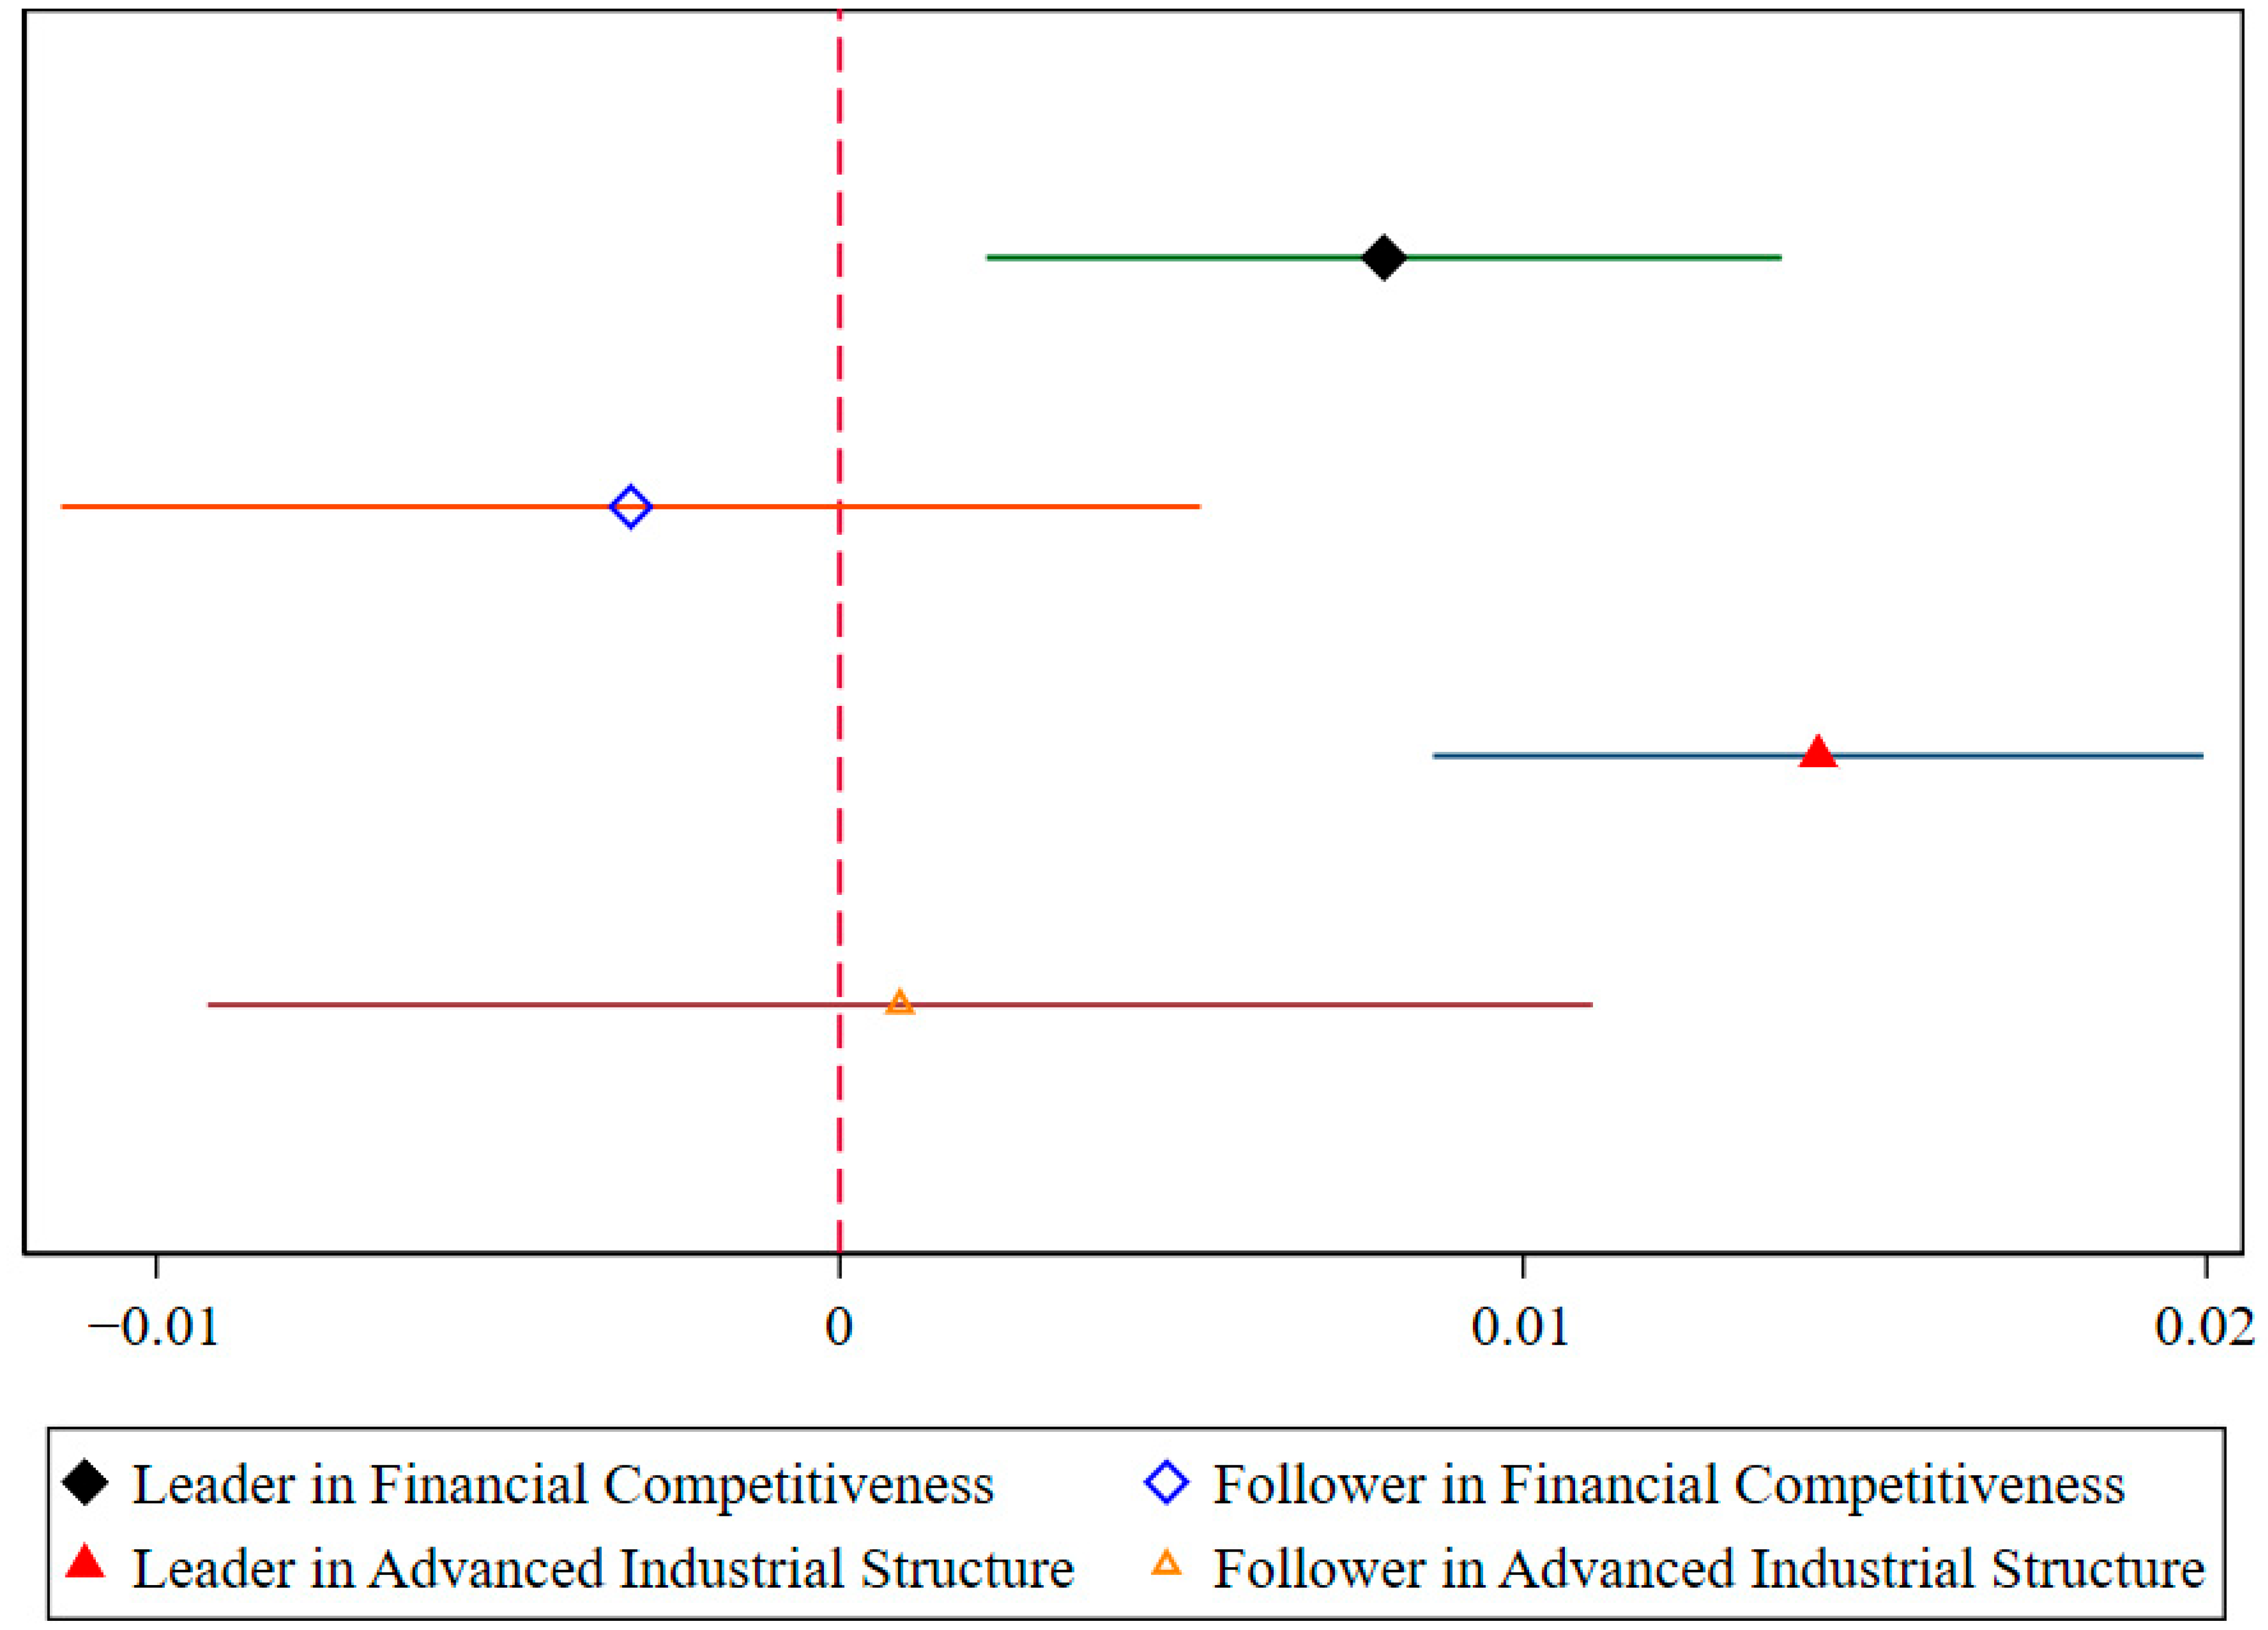
Local fiscal competitiveness plays a dual role in shaping both the capacity for policy implementation and the efficiency and precision of policy execution. On one hand, local governments with stronger fiscal capacity are typically better equipped to allocate funds and provide enterprises with substantial support through targeted instruments such as special-purpose funds, policy subsidies, and tax incentives. These tools enhance the credibility and intensity of policy signals, thereby incentivizing firms to pursue coordinated digital and green transformation. This shows that local fiscal policies play an important role in fostering digital economic growth [88,89]. On the other hand, regions with weaker fiscal capacity often suffer from policy fragmentation, absence of performance evaluation mechanisms, misallocation of fiscal resources, and local rent-seeking behavior, all of which undermine the effectiveness of macro-level industrial policy and hinder the formation of a virtuous cycle for high-quality development. Similarly, a higher level of industrial upgrading reflects a region’s capacity to move beyond traditional development models and low-end industrial dependence, facilitating a more efficient shift toward both digitalization and greening. This is consistent with the findings of Tan et al. (2023) [90], who concluded that industrial structure plays an important role as a channel between digital development and low-carbon sustainability. In this study, both fiscal competitiveness and industrial upgrading are split into high-level and low-level groups based on their sample mean values. As shown in Figure 9 and Table 16, the regression results indicate that the MIC2025 policy effects are significantly stronger in the high-level groups for both fiscal capacity and industrial upgrading. The differences in estimated effects between high and low groups are also statistically significant, underscoring the importance of local economic foundations in determining policy effectiveness.

6.1.3. Enterprise Development Level

Digital transformation often entails high costs and significant technological barriers, making it difficult for firms to realize short-term benefits. As a result, enterprises with differing initial levels of digitalization are prone to a digital divide. In particular, firms with consistently high R&D investment tend to possess stronger intrinsic motivation for transformation. These enterprises are more likely to view innovation as a long-term strategic goal and are therefore more proactive in embracing both digitalization and greening initiatives. For such firms, functional industrial policy can more effectively stimulate their transformation ambitions and long-term vision. The measurement of continuous innovation investment is defined by the following formula:
I I P i , t = I I N i , t I I N i , t 1 × I I N i , t
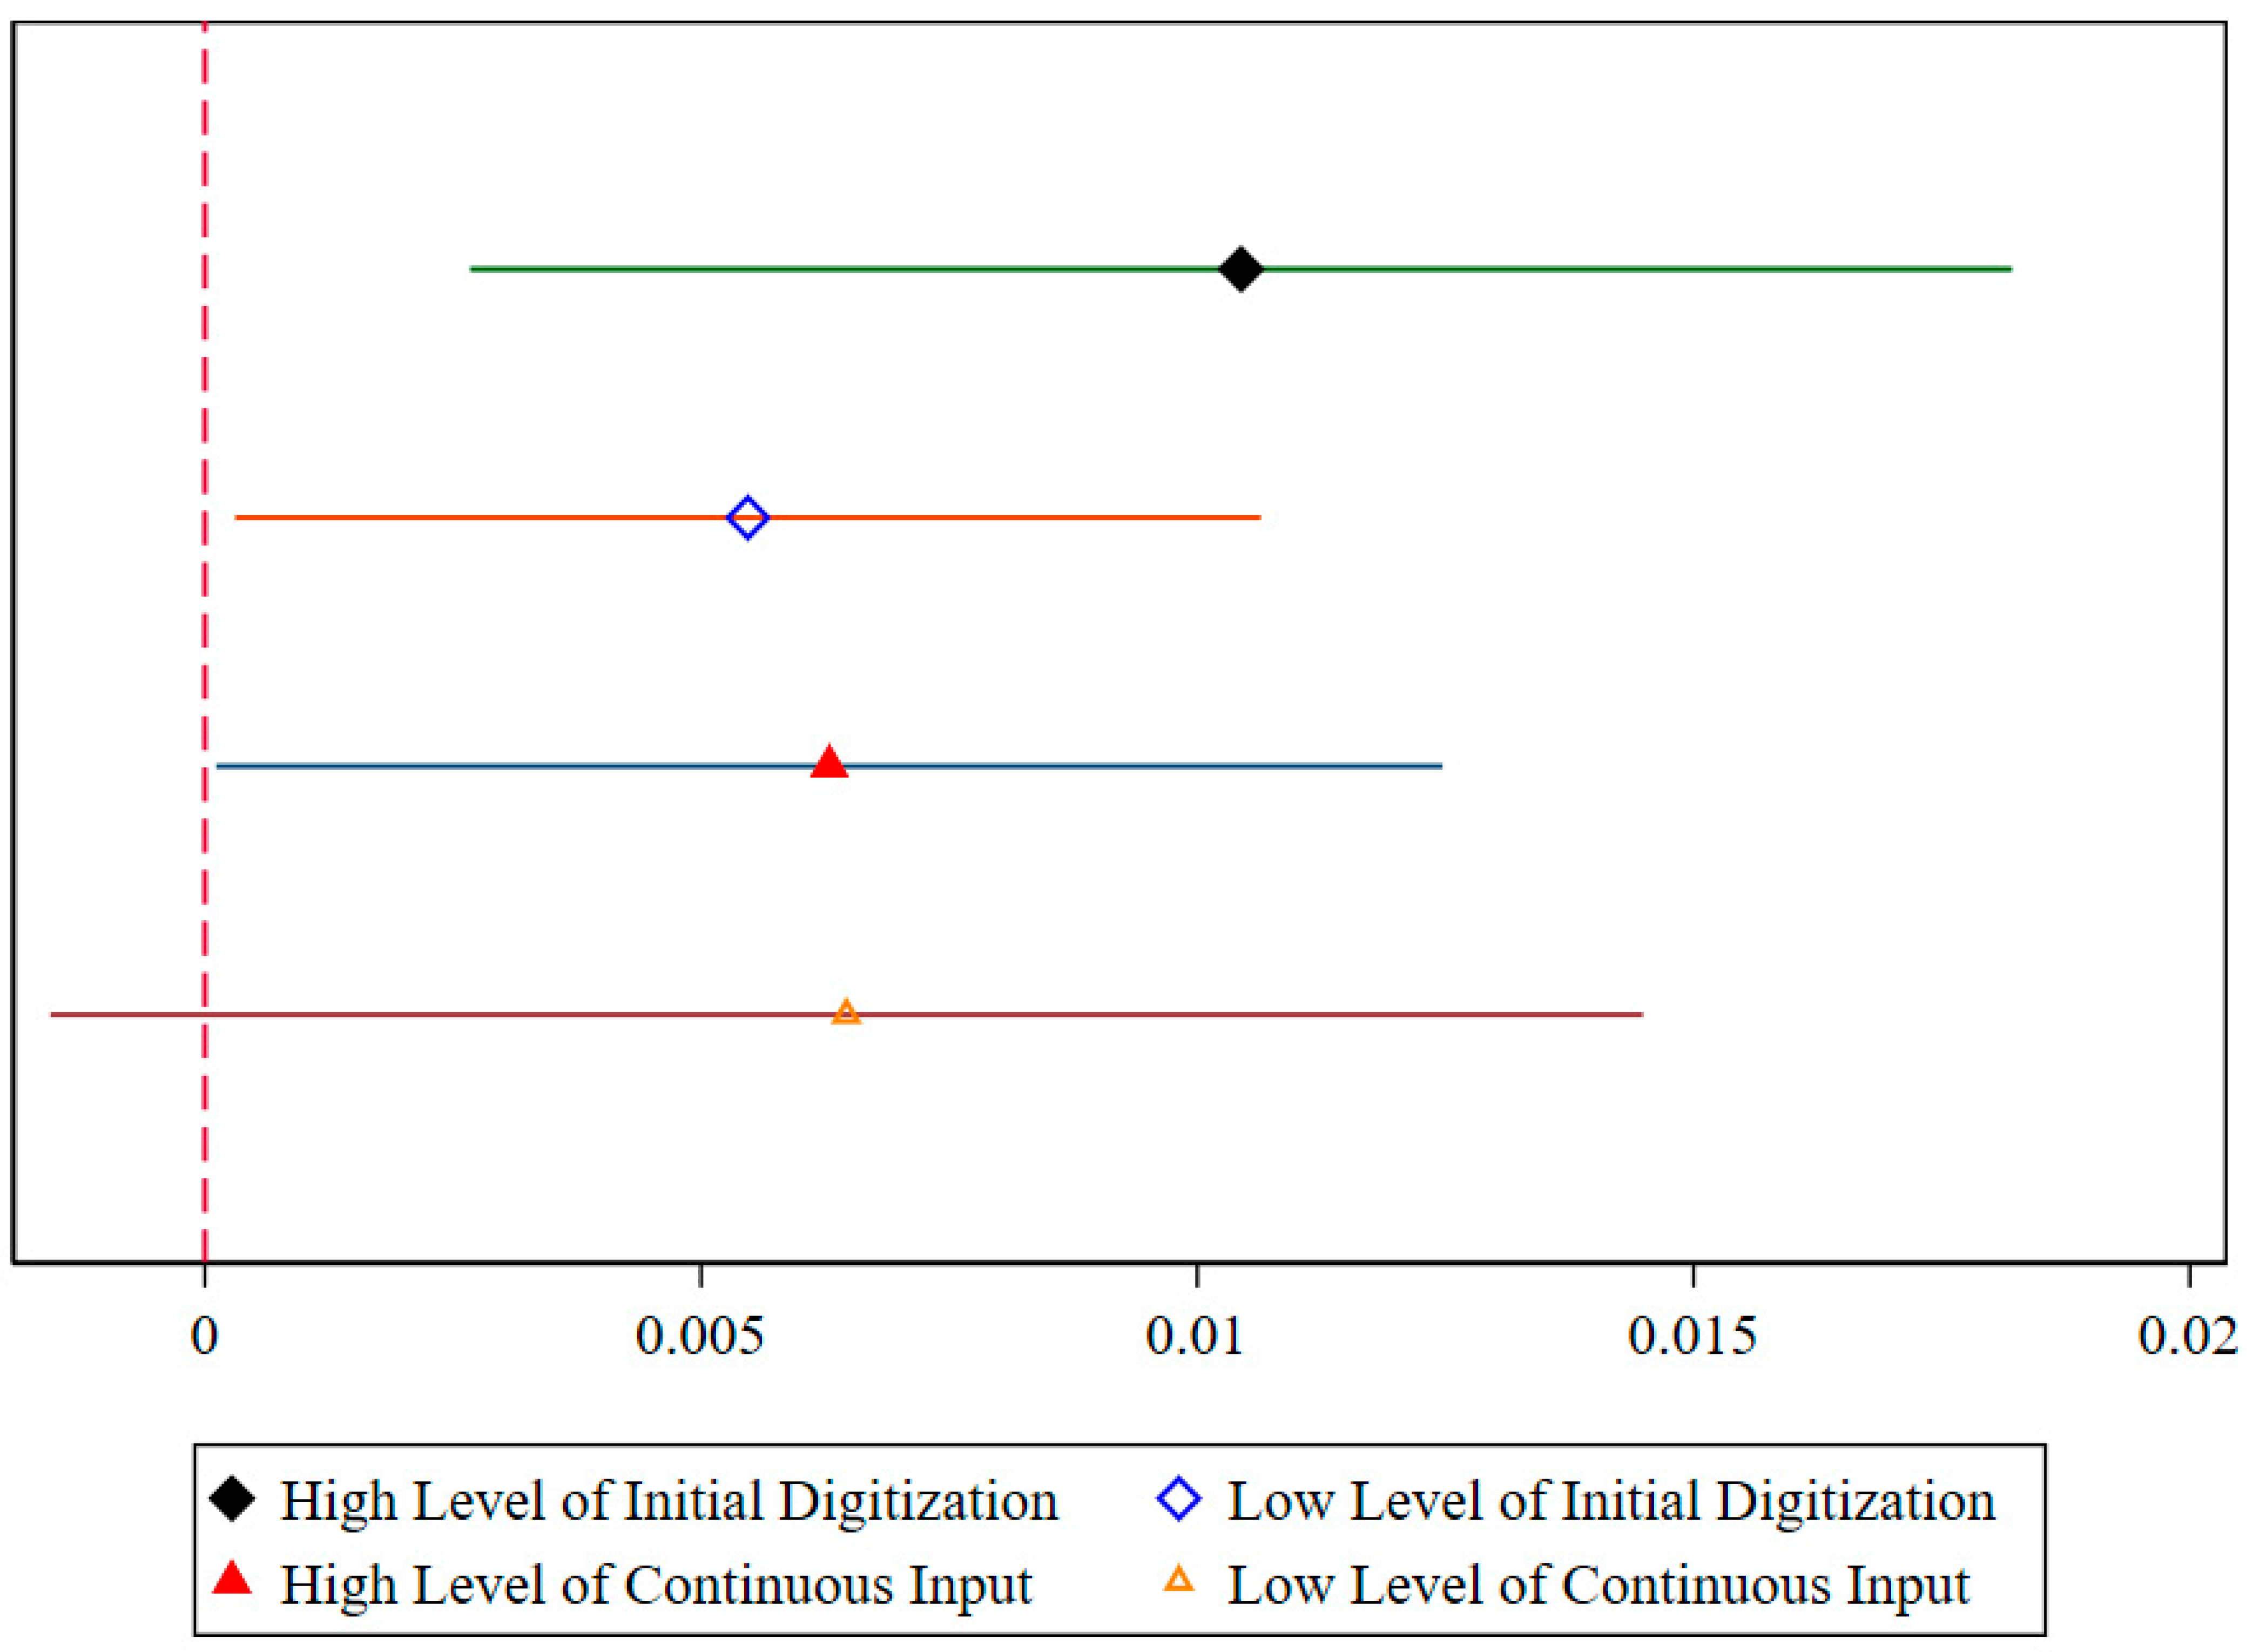
I I P i , t denotes the persistence of i innovation input in year t. I I N i , t and I I N i , t 1 denote the sum of i innovation inputs in year t and year t−1, respectively. The regression results in Figure 10 and Table 17 show that firms with better initial digitization levels have stronger DGSD promotion effects, while higher levels of sustained innovation investment by firms have more positive DGSD promotion effects of the MIC2025 policy on firms. This suggests that the initial digitization level and enterprises’ continuous innovation investment have a “complementary” effect on the policy impact.

6.2. The Role of Mechanisms

6.2.1. Financing Constraints of Enterprises

The MIC2025 policy may alleviate corporate financing constraints by direct fiscal subsidies and indirect market signaling, guiding credit resources toward firms engaged in digital and green R&D. In doing so, the policy facilitates capital access for enterprises, particularly those involved in emerging technology and sustainability innovation. This study employs the SA index to measure the degree of financial constraint faced by firms. As reported in Table 18 column (1) and (2), the MIC2025 policy significantly eases firms’ financing constraints, thereby enabling them to obtain greater financial resources for digital–green innovation and R&D investment. These findings suggest that alleviating financing constraints serves as a key mechanism through which the MIC2025 policy enhances the enterprise-level DGSD.

6.2.2. Green and Digital Technology Innovation

From the external environmental perspective, the MIC2025 policy not only directly supports firms’ R&D and innovation in digital and green technologies, but also promotes the development of digital finance and green finance. These specialized credit support systems help overcome spatial and informational frictions in the traditional financial system, enabling financial institutions to more accurately assess firms’ technological potential and patent value. As a result, they significantly reduce the external financing pressure associated with high-tech investments and long return cycles, helping firms avoid potential capital chain ruptures. From the internal firm-level perspective, the policy’s incentive effects go beyond technology development. They also drive internal transformation, including resource reallocation and management process optimization. To fully realize the value of technological R&D, firms cannot rely on a “single-leg approach”; instead, organizational synergy is essential. Innovation in digital and green technologies requires skilled technical personnel, mature management systems, and efficient input–output mechanisms to be effective. In this study, we measure technological innovation using the number of digital and green patent applications, respectively. As shown in Table 18, the MIC2025 policy significantly promotes enterprises’ DGSD by incentivizing both digital and green innovation, with the effect of digital technology innovation being stronger than that of green innovation.

6.2.3. Strategic Priority Industries

The MIC2025 policy explicitly identifies ten key strategic sectors for prioritized development. These sectors not only represent the forefront of technological innovation but also hold substantial potential for future economic growth. As such, they are recognized as central pillars for advancing China’s drive toward indigenous innovation and high-quality development. The development trajectory of China’s strategic industries is characterized by a dual-track approach. On one hand, the country actively assimilates advanced technologies and managerial experience from developed nations by promoting technology transfer, talent inflows, and international collaboration, thereby enhancing its absorptive capacity for frontier innovations. On the other hand, China leverages its accumulated foreign capital, high-end human resources, and robust knowledge base to foster a domestically driven innovation ecosystem, emphasizing both incremental improvements and breakthrough developments in core technologies. Although the ten strategic sectors are clearly defined at the policy level, mapping them precisely onto standardized industrial classifications remains a complex task. To address this issue, this study aligns the ten focal areas with corresponding two-digit industry codes under China’s National Industrial Classification System, specifically: C34, C35, C36, C37, C38, C39, I64, and I65. Firms operating within these industries are assigned a value of 1, while others are coded as 0. Given the heterogeneity in development missions, innovation climates, risk environments, and factor endowments across different industries, it is important to examine whether firms in these strategic sectors benefit more significantly from the MIC2025 policy in terms of improvements in their DGSD levels. To rigorously assess the moderating role of industry affiliation in the relationship between the MIC2025 policy and firm-level DGSD outcomes, this study employs a difference-in-difference-in-differences (DDD) estimation strategy(the results are shown in Table 19). The model specification is as follows:
D G C D i t = α + β ( T r e a t i × P o s t t × S t r a t e g y k ) + β 1 ( T r e a t i × P o s t t ) + β 2 ( T r e a t i × S t r a t e g y k ) + λ X i , t 1 + μ i + ψ j + ν t + ε i j t

7. Conclusions

This study incorporates functional industrial policy and enterprise-level DGSD into a unified theoretical framework, analyzing the impact and underlying mechanisms of the MIC2025 policy on DGSD. Based on a multi-period DID model, the empirical findings reveal that the policy exerts a significant positive effect on promoting DGSD. To address potential model specification bias, this study conducts a series of robustness checks, including heterogeneous treatment corrections in the DID model, machine learning methods, and IV estimations. The results remain robust across all specifications. Further, the heterogeneity analysis at the regional level indicates that the policy has had a strong positive effect in eastern and central cities, whereas its impact in western cities remains limited due to economic and structural constraints. From the urban perspective, cities with stronger fiscal capacity and more advanced industrial structures exhibit more pronounced policy effects. At the firm level, enterprises with higher initial levels of digitalization and continuous R&D investment benefit more from the policy intervention. Moreover, the mechanism analysis reveals that alleviating firms’ financing constraints and enhancing innovation in digital and green technologies are critical channels through which the policy affects DGSD. Notably, the improvement in firms’ DGSD levels exhibits a more pronounced policy effect within strategic industries.
As an effective functional industrial policy, MIC2025 not only supports China’s economic transformation and pursuit of high-quality development through technological and environmental advancement, but also offers valuable insights for developing countries that face technological limitations and ecological stress. (1) Policy design aligned with regional conditions: For countries still in the phase of technological catch-up, it is crucial to avoid directly replicating models of advanced economies. Instead, the institutional logic of MIC2025—featuring differentiated policy design, pilot-based implementation, and regional coordination—can serve as a useful reference. By leveraging national endowments such as resource advantages, industrial base, and sectoral characteristics, developing countries can first build foundational innovation systems and university–industry research mechanisms through early-stage R&D and technology acquisition. Subsequently, by integrating ecological goals with interregional technological diffusion, the synergy between green development and technological upgrading can be progressively achieved, avoiding inefficient uniform approaches. (2) Strengthening international technological cooperation and intellectual property systems: For developing countries, utilizing international partnerships to introduce digital and green technologies is a pragmatic starting point. This should be followed by strengthening domestic systems for intellectual property protection and innovation incentives. Given the common challenges of limited technical reserves and weak R&D capacity, building domestic capabilities with external support becomes essential. China’s experience—anchored in the approach of “learning, adapting, and creating” and “bringing in, going out”—illustrates how international cooperation, local adaptation, and institutional development can drive a transition from technology absorption to independent innovation.
However, our research still has such limitations. It is important to recognize that while the experience of MIC2025 offers valuable reference points for developing countries, its applicability is constrained by significant cross-country differences. Variations in political institutions, economic structures, industrial foundations, and governance capacities may limit the direct transferability of China’s policy model. Moreover, the successful implementation of such a complex and coordinated policy framework requires substantial administrative capacity and long-term policy continuity, which may not be readily available in all developing contexts. These factors highlight the contextual limitations of this study and suggest that any policy adaptation must be carefully tailored to local conditions. Due to data availability constraints, this paper focuses solely on listed companies in China. However, the digitalization and greening processes of non-listed enterprises are also of considerable significance and warrant further exploration. Future research could broaden the scope by incorporating firms from different countries and regions, enabling cross-national or contextual policy comparisons.
Author Contributions

Conceptualization, X.Z. and Z.Z.; methodology, X.Z.; software, Z.Z.; validation, Z.W.; formal analysis, Z.W.; investigation, X.Z.; data curation, Z.W.; writing—original draft preparation, Z.W.; writing—review and editing, X.Z.; visualization, Z.W.; supervision, X.Z. and Z.Z.; project administration, X.Z.; funding acquisition, Z.Z. All authors have read and agreed to the published version of the manuscript.

Funding

This research was funded by Guangxi Baise Zhihan Education Consulting Co., Ltd (Grant NO. 25BSZHKY001).

Institutional Review Board Statement

Not applicable.

Informed Consent Statement

Not applicable.

Data Availability Statement

The data presented in this study are available upon request from the corresponding author.

Conflicts of Interest

The authors declare no conflict of interest.

References

  1. Saunila, M.; Ukko, J.; Ranrala, T. Sustainability as a driver of green innovation investment and exploitation. J. Clean. Prod. 2018, 179, 631–641. [Google Scholar] [CrossRef]
  2. Yang, X.; Ran, R.; Chen, Y.; Zhang, J. Does digital government transformation drive regional green innovation? Evidence from cities in China. Energy Policy 2024, 187, 114017. [Google Scholar] [CrossRef]
  3. Diodato, D.; Huergo, E.; Moncada, P.; Rentocchini, F.; Timmermans, B. Introduction to the special issue on “the twin(digital and green) transition: Handing the economic and social challenges”. Ind. Innov. 2023, 30, 755–765. [Google Scholar] [CrossRef]
  4. Tang, L.; Zhang, T.; Wang, J.; Liu, B.; Huang, Y. “Dual synergistic” transformation and corporate total factor productivity: Empirical evidence from China. Econ. Anal. Policy 2025, 85, 717–732. [Google Scholar] [CrossRef]
  5. Chen, D.; Wang, J.; Li, B.; Luo, H.; Hou, G. The Impact of Digital-Green Synergy on Total Factor Productivity: Evidence from Chinese Listed Companies. Sustainability 2025, 17, 2200. [Google Scholar] [CrossRef]
  6. Lall, S. Reinventing Industrial Strategy: The Role of Government Policy in Building Industrial Competitiveness. Ann. Econ. Financ. 2013, 14, 767–811. [Google Scholar]
  7. Tian, G. From industrial policy to competition policy: A discussion based on two debates. China Econ. Rev. 2020, 62, 101505. [Google Scholar] [CrossRef]
  8. Nem Singh, J. The advance of the state and the renewal of industrial policy in the age of strategic competition. Third World Q. 2023, 44, 1919–1937. [Google Scholar] [CrossRef]
  9. Shi, J.; Sadowsji, B.M.; Zeng, X.; Dou, S.; Xiong, J.; Song, Q. Picking winners in strategic emerging industries using government subsidies in China: The role of market power. Humanit. Soc. Sci. Commun. 2023, 10, 394. [Google Scholar] [CrossRef]
  10. Branstetter, L.; Li, G.; Ren, M. Picking winners? Government subsidies and firm productivity in China. J. Comp. Econ. 2023, 51, 1186–1199. [Google Scholar] [CrossRef]
  11. Huang, X.; Wang, X.; Ge, P. Selective industrial policy and innovation resource misallocation. Econ. Anal. Policy 2024, 82, 124–146. [Google Scholar] [CrossRef]
  12. Chen, W. Can low-carbon development force enterprises to make digital transformation? Bus. Strategy Environ. 2023, 32, 1292–1307. [Google Scholar] [CrossRef]
  13. Zhao, S.; Zhang, L.; An, H.; Peng, L.; Zhou, H.; Hu, F. Has China’s low-carbon strategy pushed forward the digital transformation of manufacturing enterprises? Evidence from the low-carbon city pilot policy. Environ. Impact Assess. Rev. 2023, 102, 107184. [Google Scholar] [CrossRef]
  14. Chen, K.; Zhang, S. How does open public data impact enterprise digital transformation? Econ. Anal. Policy 2024, 83, 178–190. [Google Scholar] [CrossRef]
  15. Xie, Y.; Wu, D. How does competition policy affect enterprise digitization? Dual perspectives of digital commitment and digital innovation. J. Bus. Res. 2024, 178, 114651. [Google Scholar] [CrossRef]
  16. Chen, W.; Zhang, Q. Can corporate climate risk drive digital transformation? Evidence from Chinese heavy-polluting enterprises. Technol. Forecast. Soc. Change 2025, 212, 123990. [Google Scholar] [CrossRef]
  17. Wang, T.; Zhao, X.; Li, X. Geographical influences, media attention and enterprise digital transformation. Technol. Forecast. Soc. Change 2025, 210, 123853. [Google Scholar] [CrossRef]
  18. Zhu, C.; Li, N.; Ma, J. Impact of CEO overconfidence on enterprise digital transformation: Moderating effect based on digital finance. Financ. Res. Lett. 2024, 59, 104688. [Google Scholar] [CrossRef]
  19. Huang, Y.; Gao, Y. Labor protection and the digital transformation of enterprises: Empirical evidence from China’s social insurance law. Financ. Res. Lett. 2023, 57, 104169. [Google Scholar] [CrossRef]
  20. Yan, J.; Li, Z.; Li, Y. Dialect diversity and enterprise digital transformation. Financ. Res. Lett. 2025, 82, 107653. [Google Scholar] [CrossRef]
  21. Wang, C.; Yan, G.; Ou, J. Does Digitization Promote Green Innovation? Evidence from China. Int. J. Environ. Res. Public Health 2023, 20, 3893. [Google Scholar] [CrossRef]
  22. Fang, M.; Nie, H.; Shen, X. Can enterprise digitization improve ESG performance? Econ. Model. 2023, 118, 106101. [Google Scholar] [CrossRef]
  23. Ding, Y.; Sun, Y.; Zhang, X. Customer digital transformation and enterprise risk-taking: Evidence from Chinese supply chains. China Econ. Rev. 2025, 91, 102418. [Google Scholar] [CrossRef]
  24. Peng, H.; Bumailikaimu, S.; Feng, T. The power of market: Venture capital and enterprise digital transformation. North Am. J. Econ. Financ. 2024, 74, 102218. [Google Scholar] [CrossRef]
  25. Rong, Y.; Hu, J. How does FinTech influence enterprises’ digital transformation?—A perspective based on executive backgrounds. Appl. Econ. 2025, 1–14. [Google Scholar] [CrossRef]
  26. He, S.; Tang, Y. Effects of Personalized Demands on the Digital Diffusion of Enterprises: A Complex Network Evolution Game Model-Based Study. J. Knowl. Econ. 2023, 15, 12854–12880. [Google Scholar] [CrossRef]
  27. Jia, X.; Xie, B.; Wang, X. The impace of network infrastructure on enterprise digital transformation -- A quasi-natural experiment from the “broadband China” Strategy. Appl. Econ. 2023, 56, 1363–1380. [Google Scholar] [CrossRef]
  28. Li, M.; Wang, Z.; Shu, L.; Gao, H. Broadband infrastructure and enterprise digital transformation: Evidence from China. Res. Int. Bus. Financ. 2025, 73, 102645. [Google Scholar] [CrossRef]
  29. Cheng, H.; Ruan, P.; Wang, P. The impact of surging computing power on enterprise digital transformation–Based on quasi-natural experiments set up by the National Supercomputing Center. Financ. Res. Lett. 2024, 65, 105496. [Google Scholar] [CrossRef]
  30. Feng, Q.; Ge, Y.; Zhao, L. Tax incentives and corporate digital transformation: Evidence from China’s accelerated depreciation policy. J. Asian Econ. 2024, 95, 101832. [Google Scholar] [CrossRef]
  31. Zhao, X.; Zhao, L.; Sun, X.; Xing, Y. The incentive effect of government subsidies on the digital transformation of manufacturing enterprises. Int. J. Emerg. Mark. 2024, 19, 3892–3912. [Google Scholar] [CrossRef]
  32. Bi, W.; Li, Y.; Zhang, X.; Zhong, T. Labor protection and enterprise digital transformation: A quasi-natural experiment based on the enforcement of Social Insurance Law in China. Econ. Politics 2024, 36, 708–733. [Google Scholar] [CrossRef]
  33. Li, X.; Yang, Y. Emission reduction pressure and enterprise digital transformation: Do enterprise innovation and digital economy matter? Bus. Process Manag. J. 2024, 30, 1399–1434. [Google Scholar] [CrossRef]
  34. Gu, J. Peer influence, market power, and enterprises’ green innovation: Evidence from Chinese listed firms. Corp. Soc. Responsib. Env. Manage. 2024, 31, 108–121. [Google Scholar] [CrossRef]
  35. Hou, X.; Kong, S.; Xiang, R. Extreme high temperatures and corporate low-carbon actions. Sci. Total Environ. 2024, 925, 171704. [Google Scholar] [CrossRef]
  36. Zhang, H.; Wu, J.; Mei, Y.; Hong, X. Exploring the relationship between digital transformation and green innovation: The mediating role of financing modes. J. Environ. Manag. 2024, 356, 120558. [Google Scholar] [CrossRef]
  37. Zhang, W.; Li, B. Energy-use rights trading, technological innovation, and green transformation of energy-intensive manufacturing enterprises. Econ. Anal. Policy 2025, 86, 528–544. [Google Scholar] [CrossRef]
  38. Li, C.; Yang, G.; Cai, W.; Shi, H. Enterprise digital transformation and green competitiveness: Opportunity or crisis? Financ. Res. Lett. 2025, 77, 107051. [Google Scholar] [CrossRef]
  39. Peng, C.; Jia, X.; Zou, Y. Can “splitting” be beneficial? The impact of top management team information-knowledge faultline on enterprise green transformation. J. Clean. Prod. 2023, 406, 136935. [Google Scholar] [CrossRef]
  40. Zhang, B.; Yu, L.; Sun, C. How does urban environmental legislation guide the green transition of enterprises? Based on the perspective of enterprises’ green total factor productivity. Energy Econ. 2022, 110, 106032. [Google Scholar] [CrossRef]
  41. Yin, X.; Wang, D.; Lu, J.; Liu, L. Does green credit policy promote corporate green innovation? Evidence from China. Econ. Change Restruct. 2023, 56, 3187–3215. [Google Scholar] [CrossRef]
  42. Chen, M.; Wang, H. Can export trade drive green transformation development of Chinese enterprises? based on the dual perspectives of export density and export domestic value-added rate. J. Asian Econ. 2024, 92, 101737. [Google Scholar] [CrossRef]
  43. Zhang, Z.; Luo, X.; Du, J.; Xu, B. Does green credit accelerate green transformation of heavily polluting enterprises? Int. Rev. Financ. Anal. 2025, 98, 103895. [Google Scholar] [CrossRef]
  44. Piao, Z.; Chen, X.; Li, Y.; Yang, K. How does green finance overcome the bottleneck of green productivity? Moderating effects of green transformation. Econ. Change Restruct. 2025, 58, 10. [Google Scholar] [CrossRef]
  45. Zhang, Z.; Li, P.; Huang, L.; Kang, Y. The impact of artificial intelligence on green transformation of manufacturing enterprises: Evidence from China. Econ. Change Restruct. 2024, 57, 146. [Google Scholar] [CrossRef]
  46. Guo, B.; Hu, P.; Lin, J. The effect of digital infrastructure development on enterprise green transformation. Int. Rev. Financ. Anal. 2024, 92, 103085. [Google Scholar] [CrossRef]
  47. Sun, G.; Fang, J.; Li, J.; Wang, X. Research on the impact of the integration of digital economy and real economy on enterprise green innovation. Technol. Forecast. Soc. Change 2024, 200, 123097. [Google Scholar] [CrossRef]
  48. Xu, Y.; Yang, C.; Ge, W.; Liu, G.; Yang, X.; Ran, Q. Can industrial intelligence promote green transformation? New insights from heavily polluting listed enterprises in China. J. Clean. Prod. 2023, 421, 128550. [Google Scholar] [CrossRef]
  49. Du, G.; Zhou, C.; Zhang, M. Does digital transformation promote local-neighborhood green technology innovation?—based on the panel data of Chinese a-share listed companies from 2011 to 2021. J. Clean. Prod. 2024, 466, 142809. [Google Scholar] [CrossRef]
  50. Yang, H.; Li, L.; Liu, Y. The effect of manufacturing intelligence on green innovation performance in China. Technol. Forecast. Soc. Change 2022, 178, 121569. [Google Scholar] [CrossRef]
  51. Tchorzewska, K.B.; Garcia-Quevedo, J.; Martinez-Ros, E. The heterogeneous effects of environmental taxation on green technologies. Res. Policy 2022, 51, 104541. [Google Scholar] [CrossRef]
  52. Ranocchia, C.; Lambertini, L. Poter Hypothesis vs Pollution Haven Hypothesis: Can Threr Be Environment Policies Grtting Two Eggs in One Basket? Environ. Resour. Econ. 2021, 78, 177–199. [Google Scholar] [CrossRef]
  53. Lin, B.; Pan, T. The impact of green credit on green transformation of heavily polluting enterprises: Reverse forcing or forward pushing? Energy Policy 2024, 184, 113901. [Google Scholar] [CrossRef]
  54. Rahman, S. The importance of green patents for CDS pricing: The role of environmental disclosures. Energy Econ. 2024, 139, 107905. [Google Scholar] [CrossRef]
  55. Chen, Z.; Zhang, X.; Chen, F. Do carbon emission trading schemes stimulate green innovation in enterprises? Evidence from China. Technol. Forecast. Soc. Change 2021, 168, 120744. [Google Scholar] [CrossRef]
  56. Gan, T.; Zhou, Z.; Li, S.; Tu, Z. Carbon emission trading, technological progress, synergetic control of environmental pollution and carbon emissions in China. J. Clean. Prod. 2024, 442, 141059. [Google Scholar] [CrossRef]
  57. Li, Z.; Huang, Z.; Su, Y. New media environment, environmental regulation and corporate green technology innovation:Evidence from China. Energy Econ. 2023, 119, 106545. [Google Scholar] [CrossRef]
  58. Luo, G.; Guo, J.; Yang, F.; Wang, C. Environmental regulation, green innovation and high-quality development of enterprise: Evidence from China. J. Clean. Prod. 2023, 418, 138112. [Google Scholar] [CrossRef]
  59. Chen, F.; Chen, Z.; Zhang, X. Belated stock returns for green innovation under carbon emissions trading market. J. Corp. Financ. 2024, 85, 102558. [Google Scholar] [CrossRef]
  60. Garcia-Quevedo, J.; Martinez-Ros, E.; Tchorzewska, K.B. End-of-pipe and cleaner production technologies. Do policy instruments and organizational capabilities matter? Evidence from Spanish firms. J. Clean. Prod. 2022, 340, 130307. [Google Scholar] [CrossRef]
  61. Bai, J.; Cai, Q.; Yao, N.; Guo, Q. Government industrial priorities, public corporate governance and corporate innovation: A political push perspective. Econ. Anal. Policy 2025, 85, 1885–1900. [Google Scholar] [CrossRef]
  62. Conroy, G. How ‘Made in China 2025’ helped supercharge scientific development in China’s cities. Nature 2024. ahead of print. [Google Scholar] [CrossRef]
  63. Xu, X.; Wang, Q.; Zhang, M. The complementary effects of ‘Made in China 2025’ industrial policy and trade liberalisation on China’s export of relevant products. Asian J. Technol. Innov. 2024, 33, 283–312. [Google Scholar] [CrossRef]
  64. Liu, X.; Megginson, W.L.; Xia, J. Industrial policy and asset prices: Evidence from the Made in China 2025 policy. J. Bank. Financ. 2022, 142, 106554. [Google Scholar] [CrossRef]
  65. Jiang, L.; Li, Y.; Li, Z.; Yang, Z.; Wang, L. The effect of Made in China 2025 pilot city policy on corporate risk-taking. Appl. Econ. Lett. 2025, 1–5. [Google Scholar] [CrossRef]
  66. Xu, L. Towards Green Innovation by China’s Industrial Policy: Evidence From Made in China 2025. Front. Environ. Sci. 2022, 10, 924250. [Google Scholar] [CrossRef]
  67. Yuan, J.; Liu, S. A double machine learning model for measuring the impact of the Made in China 2025 strategy on green economic growth. Sci. Rep. 2024, 14, 12026. [Google Scholar] [CrossRef]
  68. Song, M.; Yu, M.; Chen, X.; Lobonț, O.R.; Du, J. Made in China 2025: Artificial intelligence intervention and urban green economy development. J. Environ. Manag. 2025, 391, 126411. [Google Scholar] [CrossRef]
  69. Shen, X.; Lin, B. Policy incentives, R&D investment, and the energy intensity of China’s manufacturing sector. J. Clean. Prod. 2020, 255, 120208. [Google Scholar] [CrossRef]
  70. Romer, P. Endogenous Technological Change. J. Political Econ. 1990, 98, 2. [Google Scholar] [CrossRef]
  71. Alfaro, L.; Chanda, A.; Kalemli-Ozcan, S.; Sayek, S. Does foreign direct investment promote growth? Exploring the role of financial markets on linkages. J. Dev. Econ. 2010, 91, 242–256. [Google Scholar] [CrossRef]
  72. Chen, K.; Meng, Q.; Sun, Y.; Wan, Q. How does industrial policy experimentation influence innovation performance? A case of Made in China 2025. Humanit. Soc. Sci. Commun. 2024, 11, 40. [Google Scholar] [CrossRef]
  73. Li, Y.; Ma, H.; Xiong, J.; Zhang, J.; Divakaran, P.K.P. Manufacturing structure, transformation path, and performance evolution: An industrial network perspective. Socio-Econ. Plan. Sci. 2022, 82, 101230. [Google Scholar] [CrossRef]
  74. Cao, T.; Xie, N.; Hanim, W.; Qin, Y. Digital-green synergistic transition, fiscal decentralization and regional green total factor productivity in agriculture. J. Environ. Manag. 2025, 385, 125382. [Google Scholar] [CrossRef]
  75. Yang, Y.; Luo, F. Unlocking Corporate Sustainability: The Transformative Role of Digital-Green Fusion in Driving Sustainable Development Performance. Systems 2025, 13, 13. [Google Scholar] [CrossRef]
  76. Cengiz, D.; Dube, A.; Lindner, A.; Zipperer, B. The Effect of Minimum Wages on Low-Wage Jobs. Q. J. Econ. 2019, 134, 1405–1454. [Google Scholar] [CrossRef]
  77. Goodman-Bacon, A. Difference-in-differences with variation in treatment timing. J. Econom. 2021, 225, 254–277. [Google Scholar] [CrossRef]
  78. Lu, Y.; Yu, L. Trade Liberalization and Markup Dispersion: Evidence from China’s WTO Accession. Am. Econ. J. Appl. Econ. 2015, 7, 221–253. [Google Scholar] [CrossRef]
  79. Cherniwchan, J. Trade liberalization and the environment: Evidence from NAFTA and U.S. manufacturing. J. Int. Econ. 2017, 105, 130–149. [Google Scholar] [CrossRef]
  80. Abadie, A.; Diamond, A.; Hainmueller, J. Synthetic Control Methods for Comparative Case Studies: Estimating the Effect of California’s Tobacco Control Program. J. Am. Stat. Assoc. 2010, 105, 493–505. [Google Scholar] [CrossRef]
  81. Chernozhukov, V.; Chetverikov, D.; Demirer, M.; Duflo, E.; Hansen, C.; Newey, W.; Robins, J. Double/debiased machine learning for treatment and structural parameters. Econom. J. 2018, 21, c1–c68. [Google Scholar] [CrossRef]
  82. Liu, X.; Zuo, Z.; Han, J.; Zhang, W. Is digital-green synergy the future of carbon emission performance? J. Environ. Manag. 2025, 375, 124156. [Google Scholar] [CrossRef] [PubMed]
  83. Duranton, G.; Turner, M.A. Urban Growth and Transportation. Rev. Econ. Stud. 2012, 79, 1407–1440. [Google Scholar] [CrossRef]
  84. Nunn, N.; Nancy, Q. US Food Aid and Civil Conflict. Am. Econ. Rev. 2014, 104, 1630–1666. [Google Scholar] [CrossRef]
  85. Nunn, N.; Wantchekon, L. The Slave Trade and the Origins of Mistrust in Africa. Am. Econ. Rev. 2011, 10, 3221–3252. [Google Scholar] [CrossRef]
  86. Acemoglu, D.; Johnson, S.; Robinson, J.A. The Colonial Origins of Comparative Development: An Empirical Investigation. Am. Econ. Rev. 2001, 91, 1369–1401. [Google Scholar] [CrossRef]
  87. Luo, H.; Yang, B.; Liu, Z.; Ding, C.; Liu, B. The bright and dark sides: Unpacking the effect of digital economy on resource curse. J. Clean. Prod. 2024, 485, 144351. [Google Scholar] [CrossRef]
  88. Chen, X.; Zhang, L.; Cheng, X. Fiscal decentralization and the development of the digital economy: Evidence from China. J. Econ. Policy Reform 2024, 27, 276–292. [Google Scholar] [CrossRef]
  89. He, Y.; Li, Z.; Wang, X.; Chen, X. Government investment, human capital flow, and urban innovation: Evidence from smart city construction in China. Int. Rev. Financ. Anal. 2025, 99, 103916. [Google Scholar] [CrossRef]
  90. Tan, L.; Yang, Z.; Irfan, M.; Ding, C.; Hu, M.; Hu, J. Toward low-carbon sustainable development: Exploring the impact of digital economy development and industrial restructuring. Bus. Strategy Environ. 2023, 33, 2159–2172. [Google Scholar] [CrossRef]
Figure 1. Interaction between digitization and greening.
Sustainability 17 07233 g001
Figure 2. Correlation coefficient heat map.
Sustainability 17 07233 g002
Figure 3. Comparison of development trends.
Sustainability 17 07233 g003
Figure 4. Parallel trend scenario assessment.
Sustainability 17 07233 g004
Figure 5. Stacking difference-in-differences test.
Sustainability 17 07233 g005
Figure 6. Placebo test (sampling of individuals).
Sustainability 17 07233 g006
Figure 7. Parallel trends in dynamic sampling.
Sustainability 17 07233 g007
Figure 8. Heterogeneity analysis: regional level.
Sustainability 17 07233 g008
Figure 9. Heterogeneity analysis: city level.
Sustainability 17 07233 g009
Figure 10. Heterogeneity analysis: enterprise level.
Sustainability 17 07233 g010
Table 1. Green input–output indicator system.
Indicator TypeIndicator Name
Input indicatorsNumber of employees (persons)
Net value of fixed assets (ten thousand yuan)
Industrial electricity consumption (kWh)
Expected output indicatorsEnterprise operating income (ten thousand yuan)
Non-expected output indicatorsIndustrial waste emissions (10,000 tons)
Table 2. Range of values for coordination degree D and corresponding subsystem coordination status.
The   Range   of   Values   for   D Subsystem Coordination Status The   Range   of   Values   for   D Subsystem Coordination Status
[0, 0.1)Extreme imbalance and decline[0.5, 0.6)Barely coordinated development category
[0.1, 0.2)Severe imbalance and decline[0.6, 0.7)Basic coordinated development category
[0.2, 0.3)Moderate imbalance and decline[0.7, 0.8)Intermediate coordinated development category
[0.3, 0.4)Mild imbalance and decline[0.8, 0.9)Well-coordinated development category
[0.4, 0.5)Near imbalance and decline[0.9, 1)High-quality coordinated development category
Table 3. Definitions of the main variables.
VariablesDefinitions
DGSDThe value of the coupling coordination based on the two subsystems of digitization and greening.
DIDIf the company is located in a MIC2025 pilot city and the year is after the policy implementation, it is equal to 1. Otherwise, it is equal to 0.
SizeThe natural log of total assets.
LevThe ratio of total liabilities to total assets.
ROAThe ratio of net profit to total assets.
TOP1The proportion of the number of shares held by the largest shareholder to the total number of shares in the company.
Tobin QThe market value of the company’s debt plus equity, divided by the total assets of the company.
ATOOperating revenue divided by average total assets.
FixedThe ratio of net fixed assets to total assets.
SOEIf the enterprise is a state-owned enterprise, it is equal to 1. Otherwise, it is equal to 0.
GDPThe natural log of the city’s gross domestic product.
ILThe natural log of the added value of the secondary sector.
EduThe proportion of urban education expenditure in government budget expenditure.
FinThe natural log of the total loan amount of financial institutions at the end of the year.
SAUse the SA index to measure the degree of corporate financing constraints.
Digital_TechNumber of digital patent applications filed by companies in the current year.
Green_TechNumber of green patent applications filed by companies in the current year.
StrategyIf the enterprise belongs to a strategic industry, then it equals 1. Otherwise, it equals 0.
Table 4. Descriptive statistics for variables.
VariableObsMeanSDMinMaxVIF
DGSD29,1200.5080.18200.999
DID29,1200.1770.382011.14
Size29,12022.2971.33615.57728.6361.63
Lev29,1200.4310.2100.0071.9571.67
ROA29,1200.0370.077−1.3241.2851.29
TOP129,1200.3400.1510.0180.9001.12
TobinQ29,1202.1432.7660.625259.1461.09
ATO29,1200.6480.5500.00312.3731.07
Fixed29,1200.2050.1610.0000.9711.13
SOE29,1200.3930.488011.20
GDP29,12011.4520.7558.93612.4561.60
IL29,12017.2700.97213.31018.6361.83
Edu29,1200.1660.0330.0440.3561.16
Fin29,1202.4161.1490.4568.8711.46
SA29,120−3.8470.277−5.931−1.805
Green_Tech29,1202.16115.4520941
Digital_Tech27,08612.349112.10604973
Strategy29,1200.4370.49601
Table 5. Comparison of differences between groups.
Control GroupExperimental GroupPre-PolicyPost-Policy
(N = 21,454)(N = 7666)(N = 23,966)(N = 5145)
Mean_DGSD0.5020.5250.4880.601
MeanDiff0.022 ***0.112 ***
Note: *** indicates that the difference is significant at the 1% level.
Table 6. Baseline regression results.
(1)(2)
VariableDGSDDGSD
DID0.0070 ***0.0077 ***
(0.0022)(0.0022)
Size 0.0096 ***
(0.0015)
Lev −0.0156 ***
(0.0055)
ROA −0.0127
(0.0087)
TOP1 −0.0303 ***
(0.0087)
TobinQ 0.0001
(0.0002)
ATO 0.0122 ***
(0.0021)
Fixed −0.0290 ***
(0.0073)
SOE −0.0174
(0.0110)
GDP −0.0012
(0.0008)
IL 0.0094 **
(0.0040)
Edu 0.0496
(0.0316)
Fin 0.0069 ***
(0.0019)
Constant0.5069 ***0.1419 *
(0.0006)(0.0755)
Stkcd effectYesYes
Year effectYesYes
Industry effectYesYes
Observations29,12029,120
Adj R20.8390.840
Note: ***, ** and * indicate significant at the 1%, 5%, and 10% levels, respectively; robust standard errors in parentheses.
Table 7. Goodman–Bacon decomposition.
Control Group TypeWeightAvg DD Est
Earlier T vs. Later C0.0090.002
Later T vs. Earlier C0.011−0.010
T vs. Never treated0.9060.008
T vs. Already treated0.074−0.003
Notes: T = treatment, C = comparison.
Table 8. Expectancy effect test.
(1)(2)(3)(4)
VariablesDCGDCGDCGExclude 2015
samples
DID0.0050 *0.0074 ***0.0065 ***0.0092 ***
(0.0029)(0.0025)(0.0023)(0.0024)
One year ahead0.0036
(0.0031)
Two year ahead 0.0006
(0.0030)
Three year ahead 0.0033
(0.0033)
Constant0.1412 *0.14190.14270.1482 *
(0.0754)(0.0755)(0.0754)(0.0779)
Stkcd effectsYesYesYesYes
Year effectYesYesYesYes
Obs29,12029,12029,12027,117
Adj R20.8400.8400.8400.841
Note: *** and * indicate significant at the 1% and 10% levels, respectively; robust standard errors are in parentheses.
Table 9. Dual machine learning.
(1)(2)(3)(3)
VariablesRfRfGradboostGradboost
DID0.0249 ***0.0251 ***0.0763 ***0.0763 ***
(0.0079)(0.0079)(0.0013)(0.0013)
Constant−0.0009−0.0009
(0.0006)(0.0006)
Primitive Control VariablesYesYesYesYes
Quadratic Control VariablesNoYesNoYes
ControlYesYesYesYes
TWFEYesYesYesYes
Observation29,12029,12029,12029,120
Note: *** indicate significant at the 1% levels, respectively; robust standard errors in parentheses.
Table 10. Eliminating interference from other policies.
(1)(2)(3)(4)(5)
VariablesArithmetic Infrastructure DevelopmentMarkets for Data ElementsNew Environmental Protection ActLow-Carbon Pilot CitiesAll Policies
did0.0375 ***0.0342 ***0.0351 ***0.0346 ***0.0357 ***
(0.012)(0.011)(0.011)(0.012)(0.012)
did1Control Control
did2 Control Control
did3 Control Control
did4 ControlControl
Constant0.0360−0.02060.03130.0250−0.0105
(0.383)(0.385)(0.387)(0.384)(0.389)
TWFEYesYesYesYesYes
ControlYesYesYesYesYes
Observation29,12029,12029,12029,12029,120
Adj R20.6340.6340.6340.6340.634
Note: *** indicate significant at the 1% levels, respectively; robust standard errors are in parentheses.
Table 11. Other robustness tests.
(1)(2)(3)(4)(5)
VariablesD × CReplacing the explanatory variableReplacing the clustering methodChanging the sampleWinsorization treatment
DID0.0117 ***0.0095 **0.0077 **0.0380 ***0.0336 ***
(0.0025)(0.0048)(0.0034)(0.012)(0.011)
Constant−0.9740 ***−0.20580.14190.12670.0589
(0.0847)(0.1613)(0.1097)(0.449)(0.410)
TWFEYesYesYesYesYes
ControlYesYesYesYesYes
Observation29,12028,11829,12022,98229,120
Adj R20.7400.5890.8400.6290.634
Note: *** and ** indicate significant at the 1% and 5% levels, respectively robust standard errors in parentheses.
Table 12. Examining the lagged effect of the policy.
(1)(2)(3)
VariablesDGSDDGSDDGSD
L.DID0.0064 *
(0.0035)
L2.DID 0.0070 **
(0.0034)
L3.DID 0.0051
(0.0036)
Constant0.2495 **0.2592 **0.3685
(0.1187)(0.1304)(0.1470)
TWFEYesYesYes
ControlYesYesYes
Observation2,42442,08511,8061
Adj R20.8270.8090.795
Note: ** and * indicate significant at the 5% and 10% levels, respectively; robust standard errors in parentheses.
Table 13. Endogeneity testing and treatment.
(1)(2)
VariablesDIDDGSD
DID 0.0731 ***
(0.0225)
IV19330.0009 ***
(0.0001)
Constant−1.0292 ***
(0.2058)
TWFEYesYes
ControlsYesYes
Observation28,75528,755
Adj R20.726
K-P LM Statistic 269.278
(0.000)
K-P Wald F Statistic 344.169
(16.38)
Note: *** indicate significant at the 1% levels, respectively; robust standard errors in parentheses.
Table 14. Exclusion restriction.
(1)(2)(3)(4)
VariablesDGSDDGSDDGSDPSM-DID
IV19330.00000.0001 ***0.0001 ***0.0065 ***
(0.0000)(0.0000)(0.0000)(0.0022)
Constant−0.00380.05320.04200.1667 *
(0.0866)(0.0793)(0.0857)(0.0876)
Add additional control variablesNoNoYesNo
TWFEYesYesYesYes
ControlYesYesYesYes
Obs23,75128,75528,75527,105
Adj R20.8430.8410.8410.838
Note: *** and * indicate significant at the 1% and 10% levels, respectively; robust standard errors in parentheses.
Table 15. Heterogeneity analysis: regional level.
(1)(2)(3)(6)(7)
VariablesEasternCentralWesternResource-orientedNon-oriented
DID0.0062 **0.0124 ***−0.01010.00840.0073 ***
(0.0029)(0.0046)(0.0073)(0.0091)(0.0023)
Constant0.0922−0.04790.3377 *0.10680.1258
(0.1064)(0.2321)(0.874)(0.2160)(0.0896)
TWFEYesYesYesYesYes
ControlsYesYesYesYesYes
Observation20,37848403902296826,100
Adj R20.8420.8360.8250.8020.842
Note: ***, ** and * indicate significant at the 1%, 5%, and 10% levels, respectively; robust standard errors are in parentheses.
Table 16. Heterogeneity analysis: city level.
(1)(2)(3)(4)
VariablesLocal Financial CompetitivenessIndustrial Advancement
HighLowHighLow
DID0.0080 ***−0.00310.0143 ***0.0009
(0.0030)(0.0043)(0.0029)(0.0052)
Constant0.2122 *0.13850.0668−0.0472
(0.1152)(0.1467)(0.1189)(0.1830)
TWFEYesYesYesYes
ControlsYesYesYesYes
Observation12,50613,08415,19413,926
Adj R20.8150.8370.8350.837
Note: *** and * indicate significant at the 1% and 10% levels, respectively; robust standard errors in parentheses.
Table 17. Heterogeneity analysis: enterprise level.
(1)(2)(3)(4)
VariablesInitial Digitization LevelSustainability of Technological Innovation
HighLowHighLow
did0.0104 ***0.0055 **0.0063 **0.0065
(0.0040)(0.0026)(0.0032)(0.0041)
Constant0.2644 *0.10100.16190.1419
(0.1373)(0.0897)(0.594)(0.1407)
TWFEYesYesYesYes
ControlsYesYesYesYes
Observation694322,17718,43910,681
Adj R20.8530.8370.8440.842
Note: ***, ** and * indicate significant at the 1%, 5%, and 10% levels, respectively; robust standard errors are in parentheses.
Table 18. Mechanism analysis—channel effect.
(1)(2)(3)(4)(5)(6)
VariablesSADGSDGreen_TechDGSDDigital_TechDGSD
DID−0.0131 ***0.0069 ***0.8413 *0.0075 ***6.6667 ***0.0069 ***
(0.0017)(0.0022)(0.4397)(0.0022)(2.1614)(0.0022)
SA −0.0632 ***
(0.0104)
Green_Tech 0.0002 ***
(0.0001)
Digital_Tech 0.0000 ***
(0.0000)
Constant−4.0076 ***−0.1112−45.3675 ***0.1506 **−132.4388 *0.0924
(0.0705)(0.0865)(11.3266)(0.0755)(72.5004)(0.0792)
TWFEYesYesYesYesYesYes
ControlsYesYesYesYesYesYes
Observation29,12029,12029,12029,12027,08627,086
Adj R20.9640.8400.6320.8400.6990.842
Note: ***, ** and * indicate significant at the 1%, 5%, and 10% levels, respectively; robust standard errors are in parentheses.
Table 19. Mechanism analysis—modulating effect.
VariablesDGSD for Strategic Industries
DDD0.0216 ***
(0.0038)
DID−0.0020
(0.0028)
Treat × Strategy−0.0086
(0.0114)
Constant0.1428 *
(0.0755)
TWFEYes
ControlsYes
Observation29,120
Adj R20.840
Note: *** and * indicate significant at the 1% and 10% levels, respectively; robust standard errors in parentheses.
Disclaimer/Publisher’s Note: The statements, opinions and data contained in all publications are solely those of the individual author(s) and contributor(s) and not of MDPI and/or the editor(s). MDPI and/or the editor(s) disclaim responsibility for any injury to people or property resulting from any ideas, methods, instructions or products referred to in the content.