Article

Pricing Strategy for Sustainable Recycling of Power Batteries Considering Recycling Competition Under the Reward–Penalty Mechanism

Business School, University of Shanghai for Science & Technology, Shanghai 200093, China
*
Author to whom correspondence should be addressed.
Sustainability 2025, 17(16), 7224; https://doi.org/10.3390/su17167224
Submission received: 24 June 2025 / Revised: 24 July 2025 / Accepted: 6 August 2025 / Published: 10 August 2025
(This article belongs to the Topic Digital Technologies in Supply Chain Risk Management)

Abstract

With the large-scale power batteries approaching their retirement phase, efforts are being made to advance the recycling and cascade utilization of power batteries for electric vehicles (EVs). This paper constructs a closed-loop supply chain (CLSC) of power batteries led by the battery manufacturer (BM) and composed of the electric vehicle manufacturer (EVM) and third-party recycler (TPR). The study investigates the optimal pricing strategies of this CLSC with the consideration of recycling competition under the government’s reward–penalty mechanism. This paper establishes five recycling modes, namely independent recycling and cooperative recycling, under dual-channel recycling, and further discusses the effects of the government reward–penalty mechanism and recycling competition on the recycling rate, profits, and recycling pricing of the CLSC in each recycling mode. The following conclusions are found: (1) An increase in the reward–penalty intensity will increase the recycling rate, sales price of EVs, wholesale price, transfer price, recycling price, and the profit of each recycler in the CLSC. (2) An increase in the recycling competition will result in the reduction of the profit of each enterprise, and will also lead to the reduction of the recycling rate. (3) Cooperation between enterprises can inhibit the recycling volume of other enterprises to a certain extent. The cooperation between the EVM and BM can increase the recycling volume and the sales volume of EVs. (4) The leadership of the BM in the supply chain is embodied in the recycling and profit. For other members of the supply chain, it is very important to strive for cooperation with the leaders in the supply chain. These research conclusions can provide theoretical support for optimizing the power battery recycling system, formulating relevant policies, and improving the efficiency of resource recycling, thereby promoting the sustainable development of the new energy industry.

1. Introduction

Against the backdrop of growing global environmental awareness and the proposal of sustainable development goals, electric vehicles (EVs), as an important option for replacing traditional fuel vehicles, have become the mainstream direction in the global automotive industry’s development [1]. As the most critical core component of EVs, power batteries have realized a cumulative installed capacity of 548.4 GWh in the Chinese market by 2024, with a 41.5% year-on-year growth. The service life of power batteries in EVs is about 5–8 years [2], after which their remaining battery capacity can still continue to be utilized in multiple scenarios such as energy storage, communication base stations, low-speed electric vehicles, and so on. In addition, the materials of power batteries incorporate lithium, cobalt, nickel, and other rare metal resources. If they can be recycled and reused in a scientific and reasonable way, this can not only significantly reduce the pressure on resources [3,4] and bring more economic benefits [5,6], but also reduce the environmental burden of new battery production. Therefore, with the arrival of a large-scale power battery decommissioning wave, the problem of retired power battery recycling and utilization is realistic and urgent.
At present, one of the main conflicts in the power battery recycling market lies in the imbalance between recycling cost and recycling revenue. First of all, the recycling process involves the dismantling, transportation, treatment, and remanufacturing of batteries, each of which faces high capital investment. Secondly, due to the high fluctuation of rare metal prices and the lack of a transparent price mechanism in the market, recyclers often face greater cost pressure and market risk in their recycling operations. In order to help more enterprises participate in power battery recycling, different government subsidy policies have been introduced [7]. As early as 2014, Shanghai introduced a policy of subsidizing CNY 1000 for each recycled set of power batteries [8]. At the end of 2023, the National Development and Reform Commission listed the recycling and reuse of power batteries in the encouraged category of its newly released Guidelines for Industrial Structure Adjustment (2024 Edition). However, while subsidies can promote power battery recycling efforts [9], excessive reliance on subsidies may lead to subsidy fraud by some enterprises and fail to necessarily generate additional social welfare [10]. Therefore, penalty policies in which recycling enterprises are subject to government fines for failing to meet the government-specified target recycling rate are equally important [11,12,13]. Studies have shown that governments can effectively improve power battery recycling rates by implementing reasonable reward–penalty measures [14,15].
Meanwhile, it is essential to note that the power battery recycling industry involves multiple recycling entities and channels, including the electric vehicle manufacturer (EVM), third-party recycler (TPR), and battery manufacturer (BM). Competition among these recycling entities is widespread and disorderly, and its intensity in turn affects recycling prices, recycling quantities, and enterprises’ profits. In fact, many enterprises have begun to cooperate to cope with market competition. For example, Redwood Materials is responsible for the recycling and remanufacturing of power batteries and supplies them to Tesla, BMW, and other enterprises. Although choosing to cooperate with other recycling entities will affect decision-making, profit acquisition, and recycling efficiency [16,17], under the influence of different government policies and complex market competition, choosing different cooperation partners yields different effects [18]. Moreover, in the real power battery recycling market, even if recycling entities adopt cooperative strategies, recycling competition still exists, and recycling channels will not be monopolized due to cooperation among recycling entities. Therefore, under the consideration of recycling competition, studying the competition–cooperation game among multiple recycling entities is crucial and necessary for each recycling entity’s optimal decision on recycling modes and maximizing the recycling efficiency of power batteries.
In this context, this paper constructs a power battery CLSC model composed of the BM, EVM, TPR, and consumers. To ensure the existence of recycling competition in the supply chain and further discuss the competition–cooperation behaviors among recycling entities on this basis, this paper establishes five recycling modes with two recycling channels: (1) competitive recycling between the EVM and TPR (E + T), (2) competitive recycling between the BM and TPR (B + T), (3) cooperative recycling between the EVM and TPR (ET+B), (4) cooperative recycling between the BM and TPR (BT+E), and (5) cooperative recycling between the BM and EVM (BE+T). Among them, in the E + T mode and B + T mode, each recycling channel is independently operated by a single enterprise. However, in the ET+B mode, BT+E mode, and BE+T mode, one recycling channel is jointly operated by two enterprises through cooperation. By applying Stackelberg game theory to study the optimal pricing strategy of each recycling entity in different recycling modes, this research aims to resolve the following questions: (1) Under the reward-penalty mechanism, what are the optimal pricing strategies for each recycling entity across different recycling modes? (2) What is the impact of variables, such as the reward–penalty mechanism and the degree of channel competition, on power battery recycling and remanufacturing? (3) How will the competitive and cooperative relationships among CLSC members affect the profits, recycling rates, and pricing of each supply chain member?
Our main contributions are as follows:
(1)
We investigated the influence of the government reward–penalty mechanism on power battery recycling;
(2)
Under dual-channel recycling scenarios, we proposed and compared pricing schemes for two independent recycling modes and three novel cooperative recycling modes within the CLSC;
(3)
We analyzed how the intensity of the reward–penalty mechanism and channel competition affect supply chain profits, recycling rates, and pricing, and provided managerial implications based on these findings.
The paper is organized as follows. Section 2 describes the past literature related to this study. Section 3 describes the research questions, notation definitions, and model assumptions. Section 4 describes the pricing models for the five recycling models, solves the equilibrium solution for each recycling mode, and compares them. In Section 5, parametric values are incorporated for comparative analysis, and a further sensitivity analysis is conducted on the recycling rate, profits of each recycling entity, and recycling prices with respect to selected parameters. Section 6 gives managerial implications based on the results of the analysis. Section 7 summarizes the main findings and indicates future research possibilities.

2. Literature Review

First, regarding CLSC pricing models, Savaskan et al. (2004) [19] investigated pricing models for CLSCs under three recycling modes: manufacturer recycling, retailer recycling, and third-party recycling. Yu et al. (2024) [20] established a differential game model of a dual-channel CLSC and studied the recycling and pricing decision problems of a dual-channel CLSC from a dynamic perspective. Song et al. (2022) [21] constructed a four-level CLSC consisting of the government, manufacturers, retailers, and third-party recyclers. They explored the effects of government subsidies and recycling models on it. Of course, these conventional CLSC pricing models are also applicable to power battery recycling research, so many scholars often refer to previous CLSC pricing models and theories when conducting research on power battery recycling pricing. However, the recycling of power batteries is not merely about recovering batteries from consumers, but rather about further utilizing their residual value. This process involves multiple stakeholders who are respectively responsible for stages such as battery recycling, second-life utilization, dismantling, and remanufacturing. So, who is best suited to be responsible for each stage? In this regard, Zhao et al. (2022) [22] developed pricing models for three recycling modes: power battery manufacturer recycling, cooperative recycling between power battery manufacturers and automotive retailers, and third-party recycling. The study compared supply chain profits across these three modes under both decentralized and centralized decision-making frameworks, concluding that the power battery manufacturer is the most efficient recycler. Sun et al. (2022) [23] developed pricing models for three recycling modes—manufacturer recycling, retailer recycling, and hybrid recycling. They further considered the effects of carbon trading policies, the driving range of power batteries, and advertising effectiveness on recycling channel selection. Zhang et al. (2022) [18] incorporated second-life utilization enterprises and analyzed pricing models for four recycling modes under carbon cap-and-trade policies. While these studies have extensively discussed the question of who is best suited for recycling and provided some insights for the design of this paper’s CLSC, they seem to have overlooked the practical reality that there should always be competition in the power battery recycling market. In contrast, this paper incorporates recycling competition into the design of its recycling modes: by establishing two recycling channels and enabling price competition between them, it reflects the competitive status quo of the power battery recycling market.
Game theory is typically used to study the decision-making behaviors and outcomes of multiple decision-makers under strategic interactions, and it has been applied in research across various industries. Penkovskii et al. (2018) [24] employed the Cournot–Nash game in their study on the thermal energy market. Wang et al. (2025) [25] utilized the Cournot–Nash game to investigate recovery methods for multi-energy systems. Wu et al. (2022) [26] designed a new energy cooperation framework based on the asymmetric Nash bargaining model. Savaskan et al. (2004) [19] applied the Stackelberg game in 2004 to study decision-making issues in a CLSC. In previous research on power battery recycling, scholars tend to use the Stackelberg game to discuss decision-making behaviors among supply chain members. Thus, this paper also adopts the Stackelberg game to address decision-making problems in the power battery CLSC.
Government recycling policies play a critical role in power battery recycling. Chen et al. (2022) [27] compared battery wholesale prices, consumer surplus, and profits in CLSCs for power batteries under scenarios of no policy subsidies, capacity-based subsidies, and lump-sum subsidies, finding that subsidized policies outperform non-subsidized ones. Xiao et al. (2024) [16] incorporated informal recycling channels and investigated the impacts of information sharing and government subsidies on such channels. The study demonstrated that battery information sharing and subsidies can help formal recycling channels obtain more power batteries while inhibiting the development of informal channels. However, Tang et al. (2019) [28] argued that traditional subsidy policies are ineffective in the current recycling market and easily lead to dependence on government fiscal support. Scholars have explored the impacts and effectiveness of deposit–refund systems on power battery recycling [8,29]. Regarding the reward–penalty mechanism, Tang et al. (2018) [14] designed three single-channel recycling modes and three competitive dual-channel recycling modes using Beijing’s waste EV power battery recycling as a case study. They set a target recycling rate for the power battery manufacturer to provide rewards or impose penalties. They ultimately found that a high-intensity reward–penalty mechanism is more suitable for recycling modes with high recovery rates, and dual channels outperform single channels in recycling efficiency. Zhang et al. (2023) [9] studied the effects of government policies on power battery recycling across different modes, comparing the economic and environmental benefits of subsidy, deposit–refund system, and reward–penalty policies. The study revealed that subsidy policies bring the highest profits to CLSCs, deposit–refund systems effectively alleviate government fiscal pressure, and moderate reward–penalty mechanisms significantly improve recycling rates. Zhang et al. (2021) [30] also compared recycling rates and total profits under single-channel and dual-channel recycling with a reward–penalty mechanism, finding that increasing the reward–penalty intensity may reduce total social welfare. A comparative analysis of the relevant literature (summarized in Table 1) shows that studies on the reward–penalty mechanism for power battery recycling basically select the power battery manufacturer as the target of rewards and penalties, and all have discussed single-channel and dual-channel recycling. However, few studies further consider the cooperation among recycling entities under the reward–penalty mechanism and how the reward–penalty mechanism affects such cooperation. To address this gap, this paper simultaneously considers recycling competition under the reward–penalty mechanism and constructs a CLSC model comprising the EVM, BM, TPR, and consumer. It explores the optimal recycling modes considering recycling competition under the reward–penalty mechanism, as well as how parameters such as the reward–penalty mechanism and competition intensity influence the pricing of the closed-loop supply chain.

3. Model Description

3.1. Problem Description

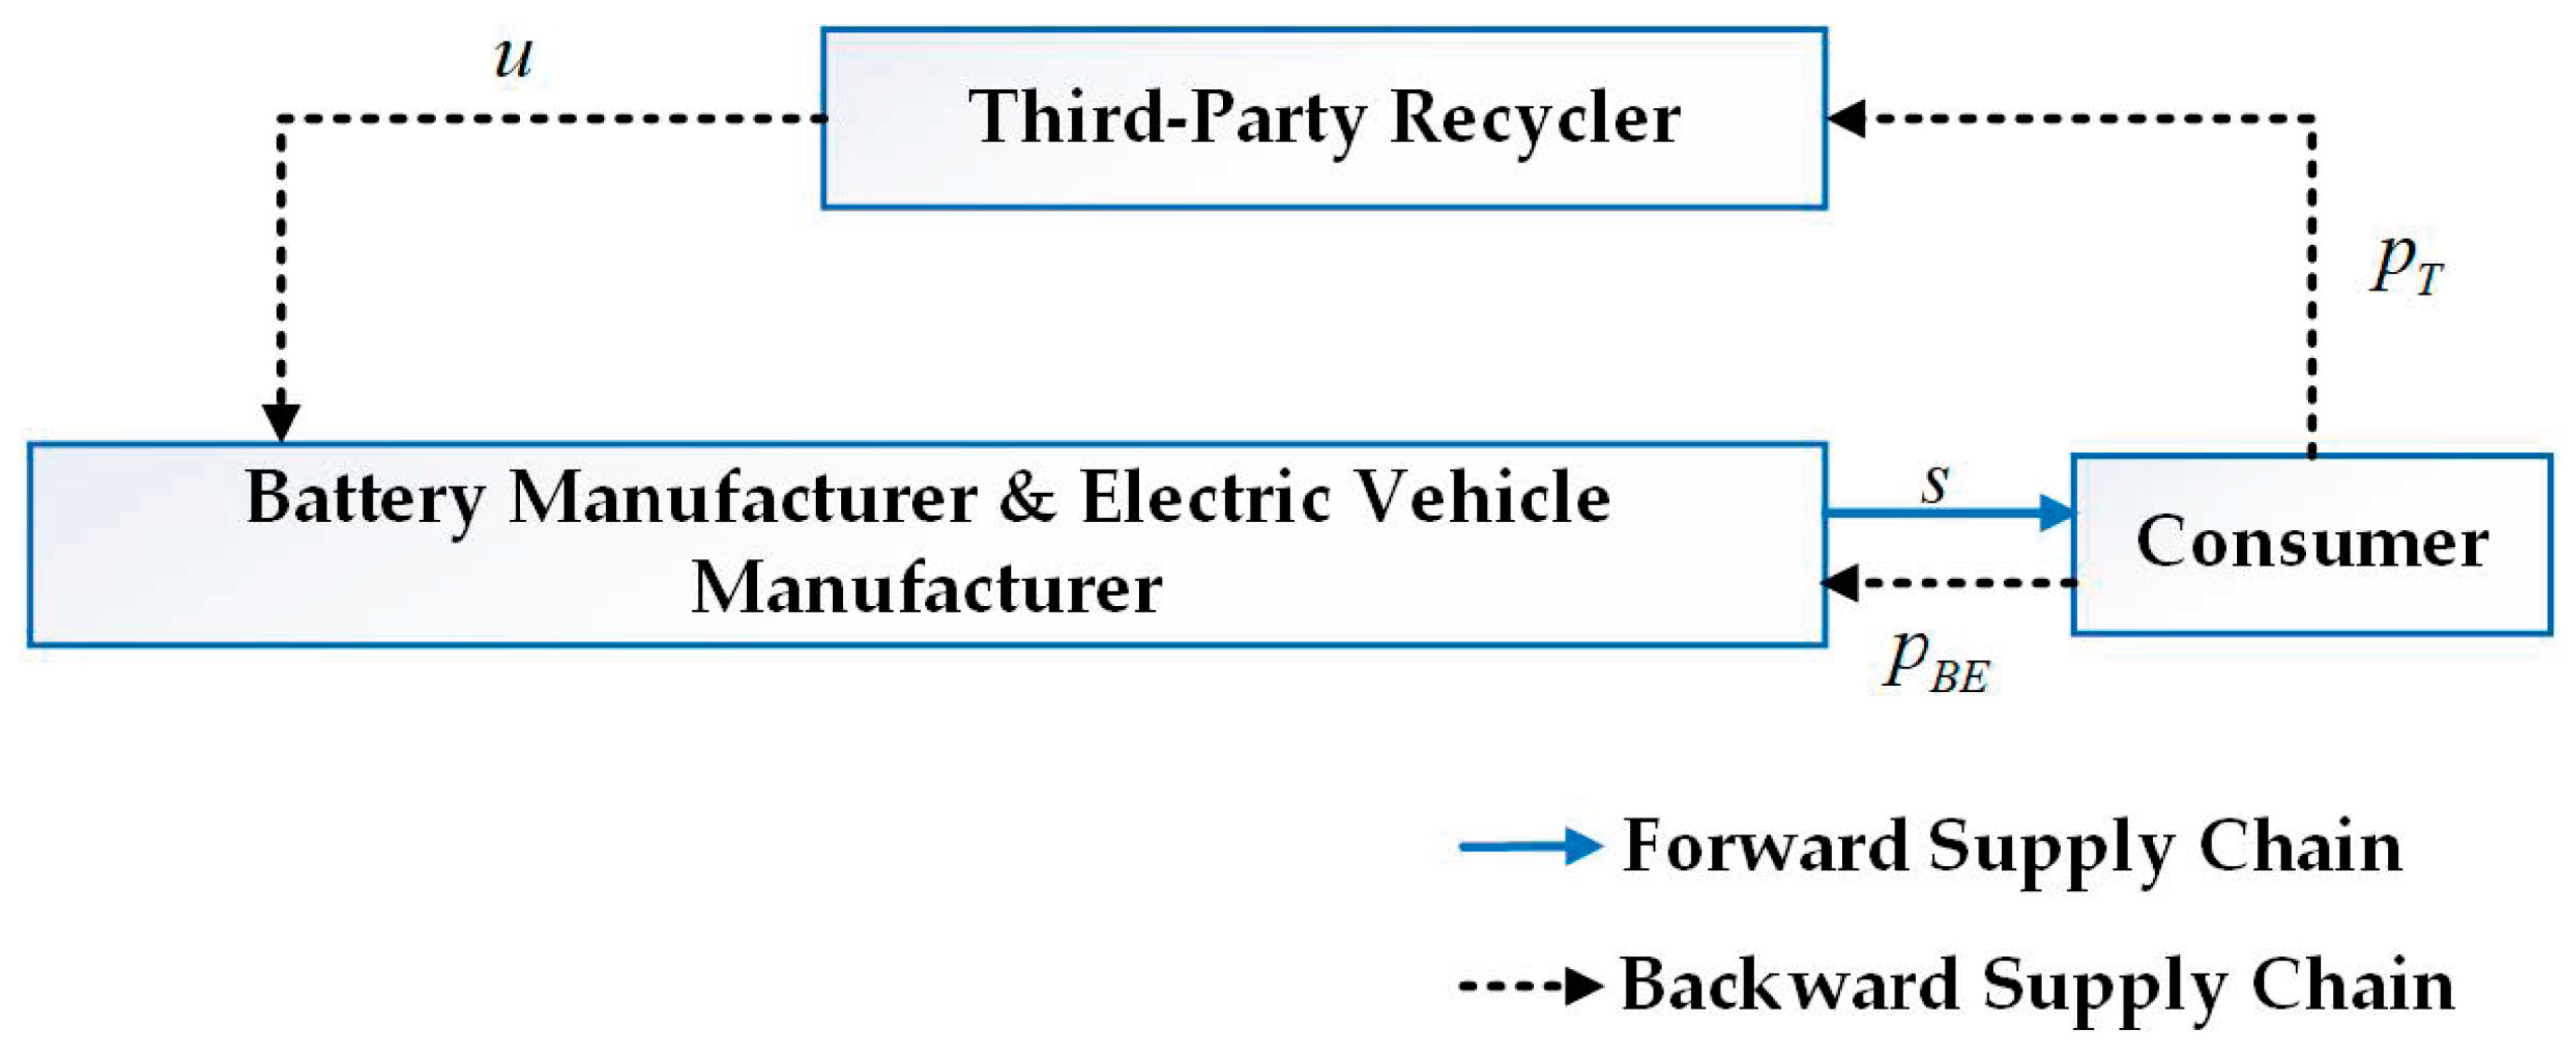
This paper constructs a CLSC for power batteries comprising EVM, TPR, BM, and consumers. The operational process of the CLSC is illustrated in Figure 1. First, consumers purchase EVs and sell power batteries to recyclers, including the BM, EVM, and TPR. All recycled power batteries are then transferred to the BM. Typically, retired power batteries retain 80% of their residual capacity [31,32] for further utilization, allowing the BM to gain economic benefits through second-life utilization. Assuming all second-life utilized power batteries can be fully recovered, they will be further dismantled by the BM to extract rare metal materials, which are used to produce remanufactured power batteries. These remanufactured batteries, together with those produced from new materials, are wholesaled to the EVM. Finally, the EVM manufactures EVs for sale to consumers. As a key producer of power batteries, the BM is responsible for the entire lifecycle of power batteries under the Extended Producer Responsibility (EPR) system. Therefore, the government will impose a certain level of rewards and penalties on the BM to ensure it actively fulfills its recycling obligations. Based on the BM’s recycling rate, the government sets a target value for it [11,14]: if the BM’s recycling rate is higher than the value set by the government, the government will provide rewards; otherwise, the BM will be penalized.
Due to the high costs of recycling channel construction and the inherent competitive advantages of the EVM and TPR in channel layout—owing to their authorized 4S stores, automotive repair centers, and other outlets—the BM may entrust the EVM or TPR to undertake power battery recycling or choose to collaborate with them [33]. For instance, several battery enterprises, including CATL and EVE Energy, have partnered with GEM to jointly establish recycling networks and fulfill recycling responsibilities. Current power battery recycling markets involve multiple recycling entities, with price competition existing between channels. To investigate the optimal pricing strategies for a dual-channel CLSC with multiple recycling entities under a reward–penalty mechanism, this paper proposes five potential recycling modes, including three cooperative modes: (1) competitive recycling between the EVM and TPR (E + T), (2) competitive recycling between the BM and TPR (B + T), (3) cooperative recycling between the EVM and TPR (ET+B), (4) cooperative recycling between the BM and TPR (BT+E), and (5) cooperative recycling between the BM and EVM (BE+T).

3.2. Description of Notations

The notations set in the model and their definitions are summarized in Table 2.

3.3. Basic Assumptions

(1)
In the presence of two alternative recycling channels, consumers will choose channels based on the prices offered, leading to competitive relations between channels. According to the assumptions in [23], in the case of dual-channel recycling, the quantity of power batteries voluntarily recycled by consumers a is equally allocated between the two recycling channels, with each channel accounting for 1/2. When a recycling channel is operated through cooperation between two enterprises, this channel essentially functions as two separate channels; in other words, the recycling market is equivalent to having three recycling channels, where a is equally divided into three parts, and this cooperative channel accounts for 2/3 [17]. For example, in the E + T mode, the recycling quantity function of the EVM can be expressed as D E = 1 2 a + b p E β p T . In the BE+T mode, the recycling quantity function of the BM and EVM cooperative channel can be expressed as D B E =   2 3 a + b p B E β p T . Here, the quantity of power batteries voluntarily recycled by consumers a mainly refers to the number of batteries that consumers have to replace when they reach the end of their service life. Moreover, b > β > 0 , indicating that the recycling price of the channel has a greater impact on its recycling quantity than the price of other channels.
(2)
In the CLSC for power batteries, decision-making among members follows a Stackelberg game [34]. When not collaborating, each stakeholder pursues its own profit maximization; when forming a coalition, they jointly optimize the collective profit of the group. As the “origin” and “terminus” of the power battery lifecycle, the BM is regarded as the leader in this game.
(3)
In order to ensure the profitability and motivation of the EVM and TPR to participate in recycling, the transfer price must be higher than their recycling price.
(4)
Since the recycling resources are limited, the quantity of remanufactured power batteries produced from them cannot meet market demand. Therefore, when producing and using remanufactured power batteries, the BM and EVM also produce and use new power batteries to supplement the remaining market demand—i.e., E equals the sum of the quantity of remanufactured power batteries and the quantity of new power batteries. The quantity of remanufactured power batteries is equal to the recycling quantity of power batteries.
(5)
Remanufactured power batteries are of the same quality as new ones. The production cost of new power batteries is C N , including raw material procurement costs and subsequent processing and production costs. The production cost of remanufactured power batteries is C R M , including disassembly costs, raw material remanufacturing costs, and subsequent processing and production costs. Compared with new power batteries, remanufactured power batteries have lower production costs [18,35], i.e., C N > C R M . For example, GEM recovers production waste from EVE Energy, and processes it to return battery-grade lithium carbonate, with the cost reduced by 35% compared to direct procurement of spodumene. The unit cost of its remanufactured batteries is 0.6 CNY/Wh, while the cost of new batteries is 0.85 CNY/Wh, showing a significant cost advantage.
(6)
This study only considers the single-cycle case, i.e., the price strategy is determined at the beginning of the period, without considering the influence of the previous cycle on the next cycle and the delay effect.
(7)
All recovered power batteries are fully utilized for second-life applications and remanufacturing, meaning there is no stockpiling of inventory. Moreover, all batteries can be collected after second-life utilization. For example, GEM’s Wuhan Park classifies and processes recycled batteries by capacity: 60% are used for echelon utilization, 40% are disassembled for recycling, and zero inventory backlog was achieved in 2024. Additionally, by disassembling recycled batteries from retired power batteries to obtain raw materials and using these materials to produce recycled power batteries, the cost of this process is lower than that of directly purchasing raw materials to produce power batteries. Thus, the profit from the reuse of each retired power battery can be divided into two parts: the cost savings from remanufacturing and the profits generated from second-life utilization, i.e., Δ = C N C R M + λ L ~ [28,36].
(8)
According to [8,9], the cost of power batteries accounts for about 40% of the total cost of EVs. Therefore, consumers’ demand for power batteries can be roughly equivalent to their demand for EVs. That is, the demand function of EVs can be expressed as E = h θ s .
(9)
Regarding the government’s reward–penalty mechanism [14], letting ξ 0 denote the target recycling rate set by the government for the BM, the target recycling quantity is ξ 0 h θ s . Based on this target, the government imposes penalties or rewards K D T o t a l ξ 0 h θ s on the BM: if the quantity of recycled power batteries by the BM exceeds the target quantity, the BM receives a reward; otherwise, it is penalized.

4. Model Construction and Solution

4.1. Competitive Recycling Between the EVM and TPR

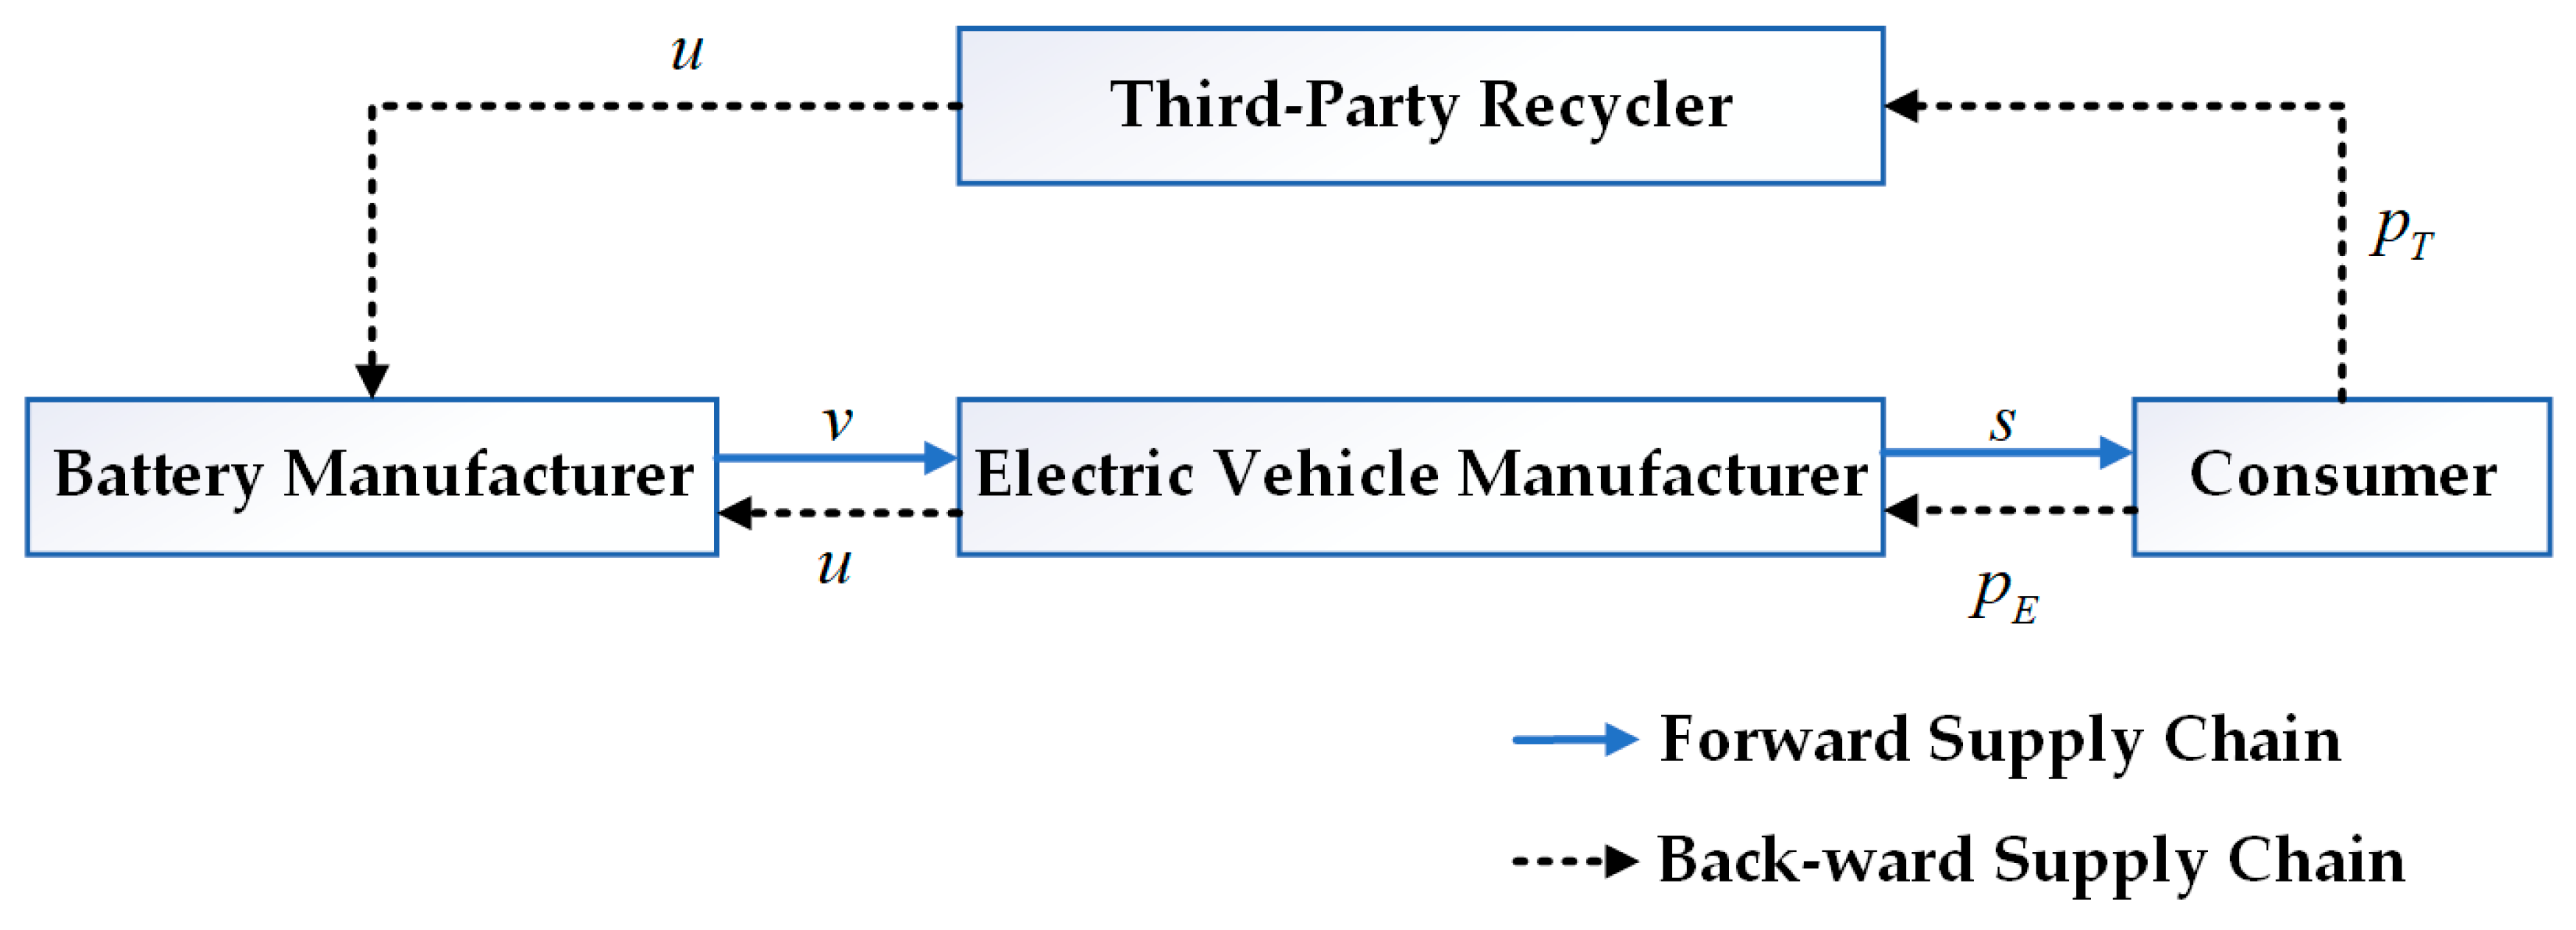
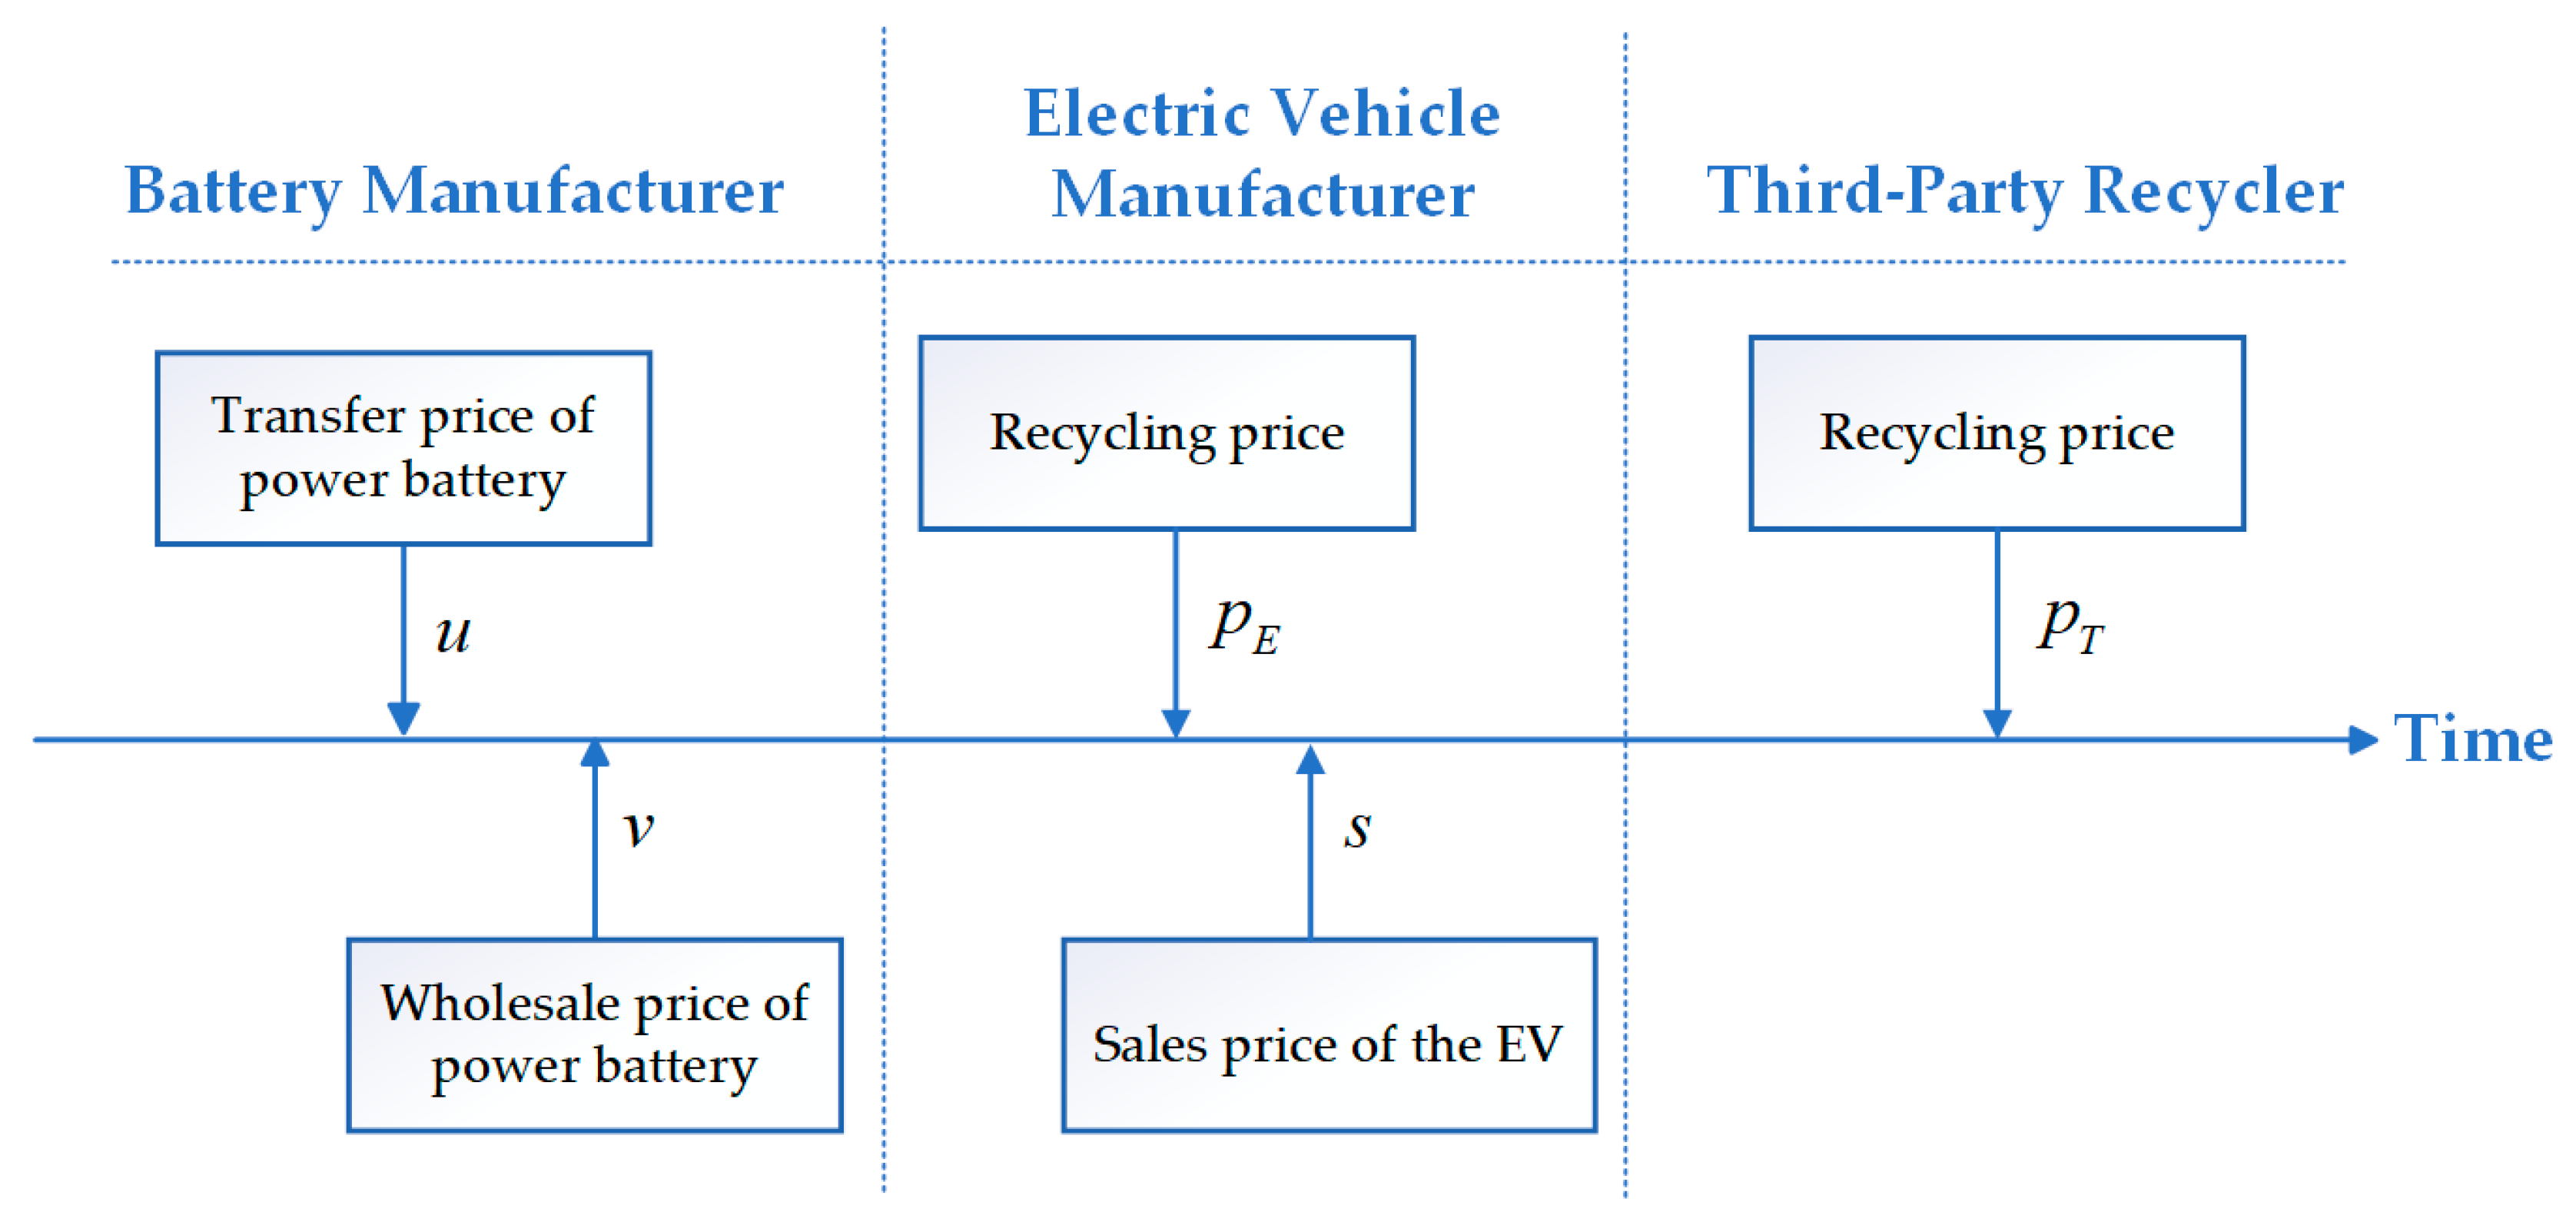
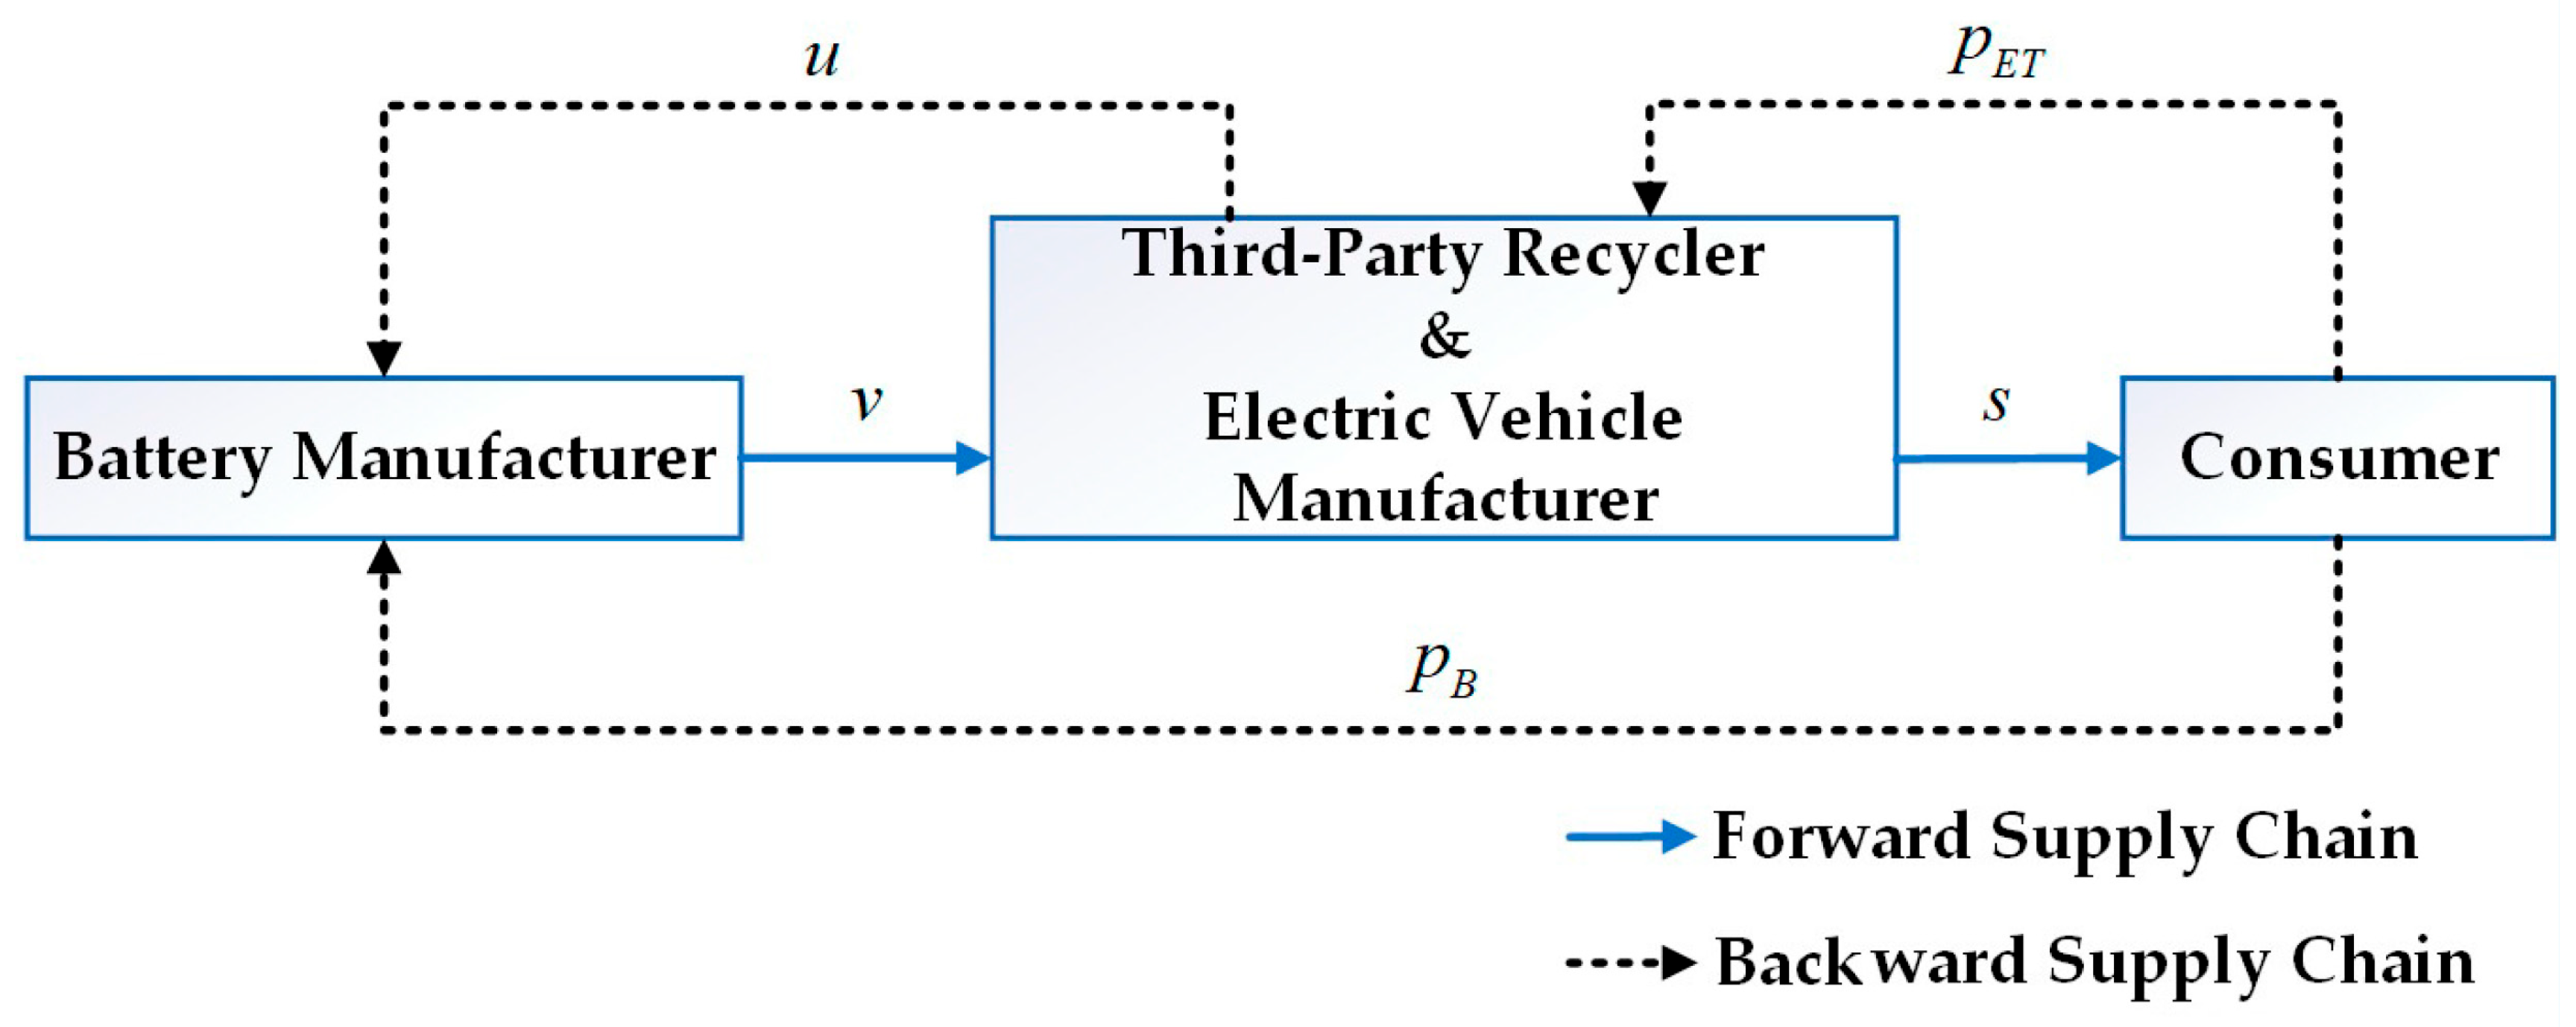
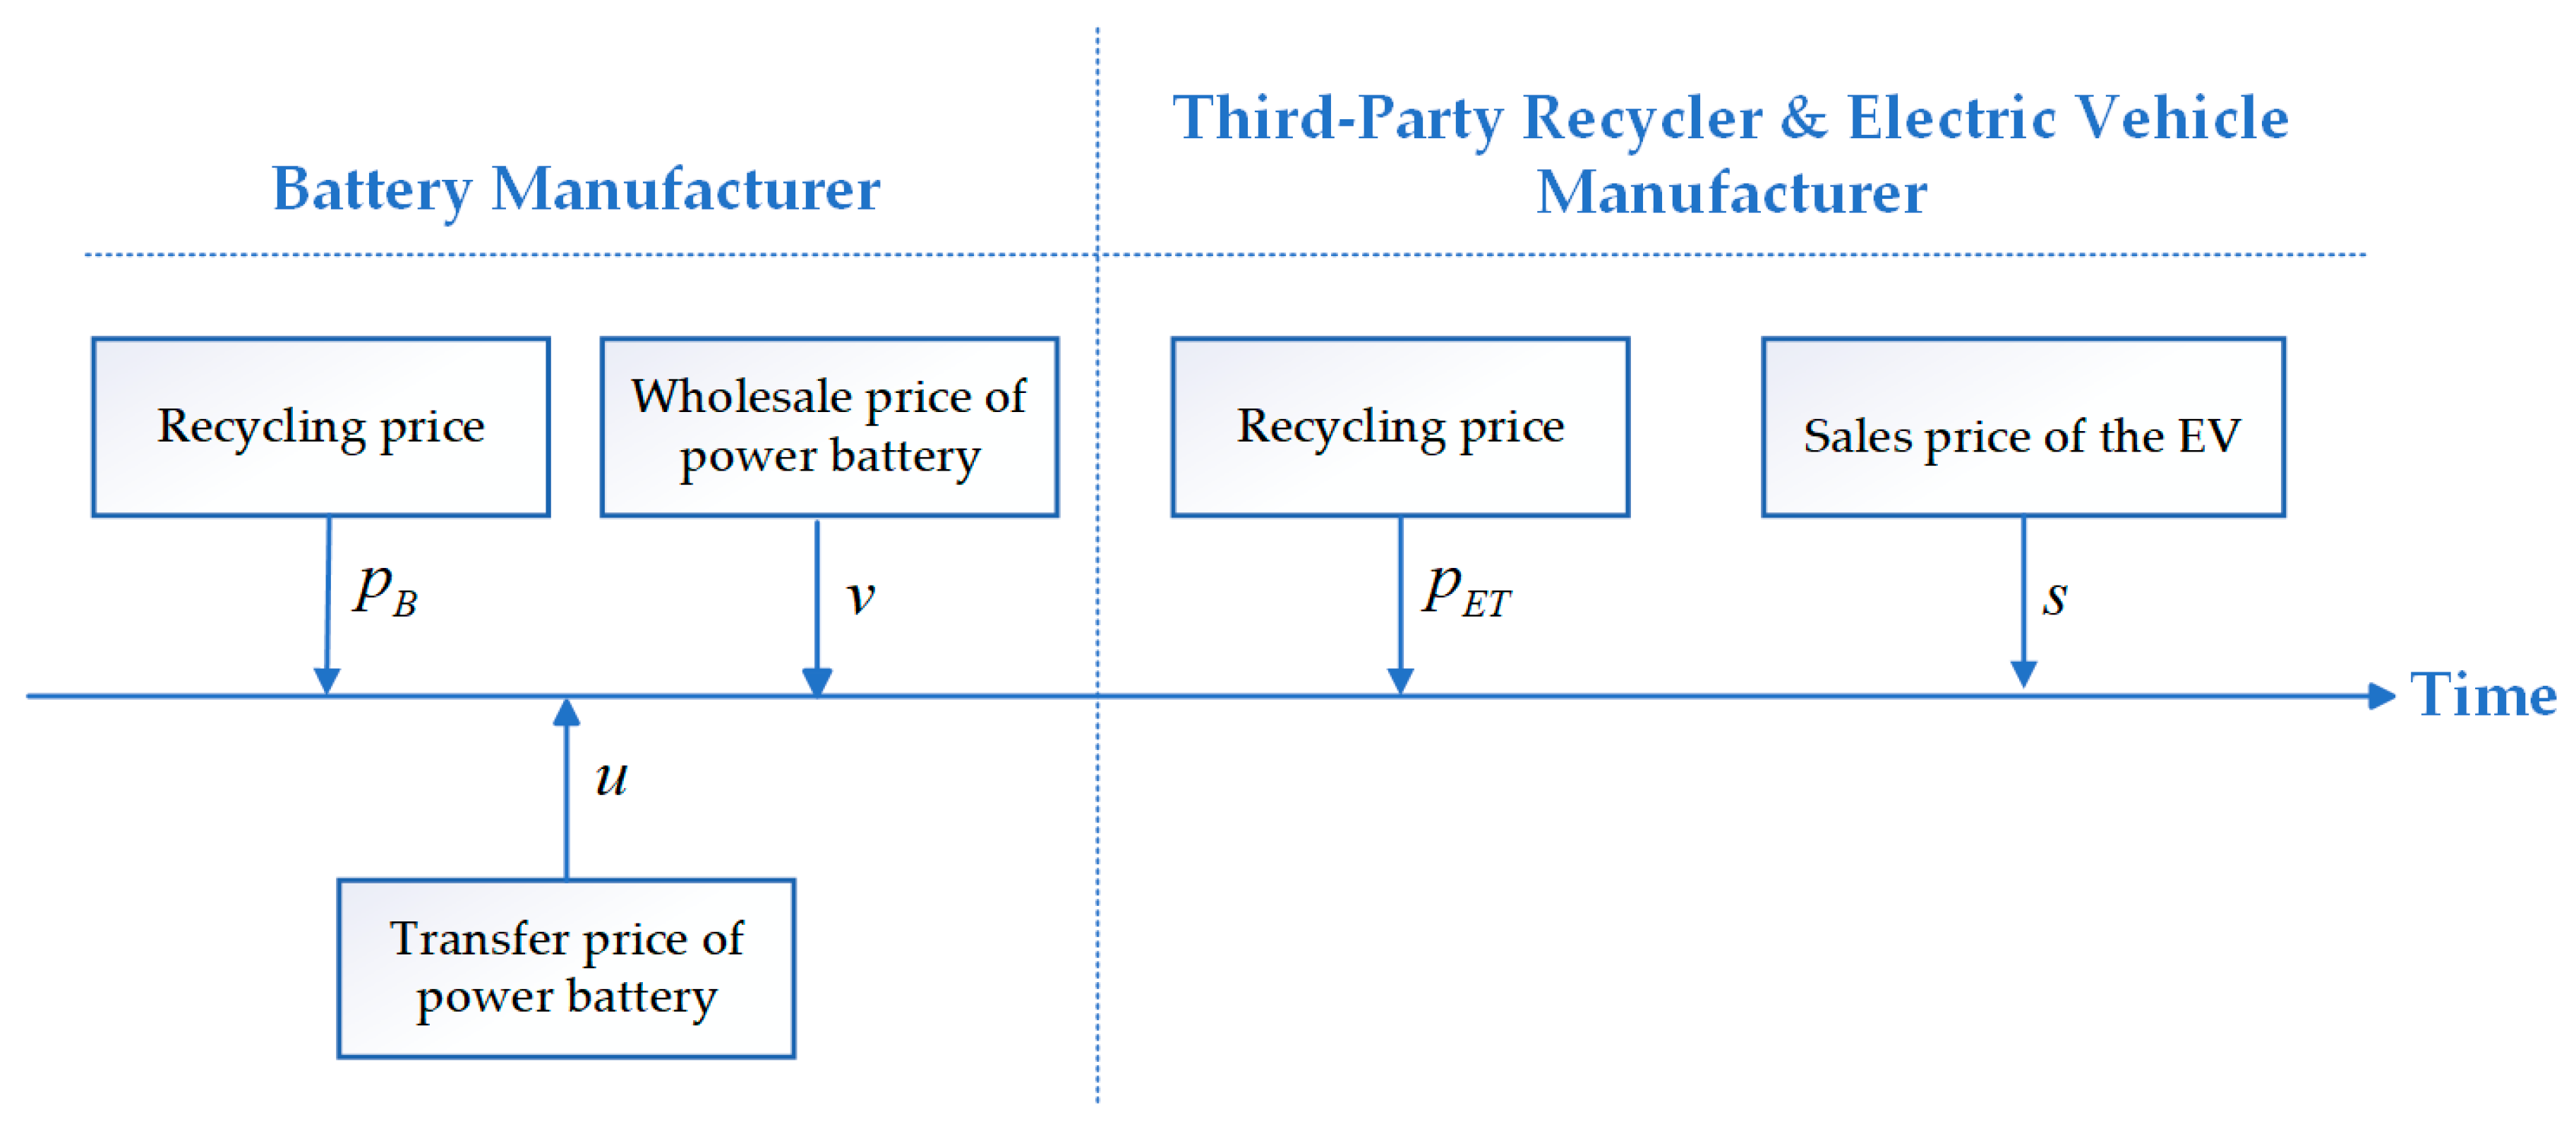
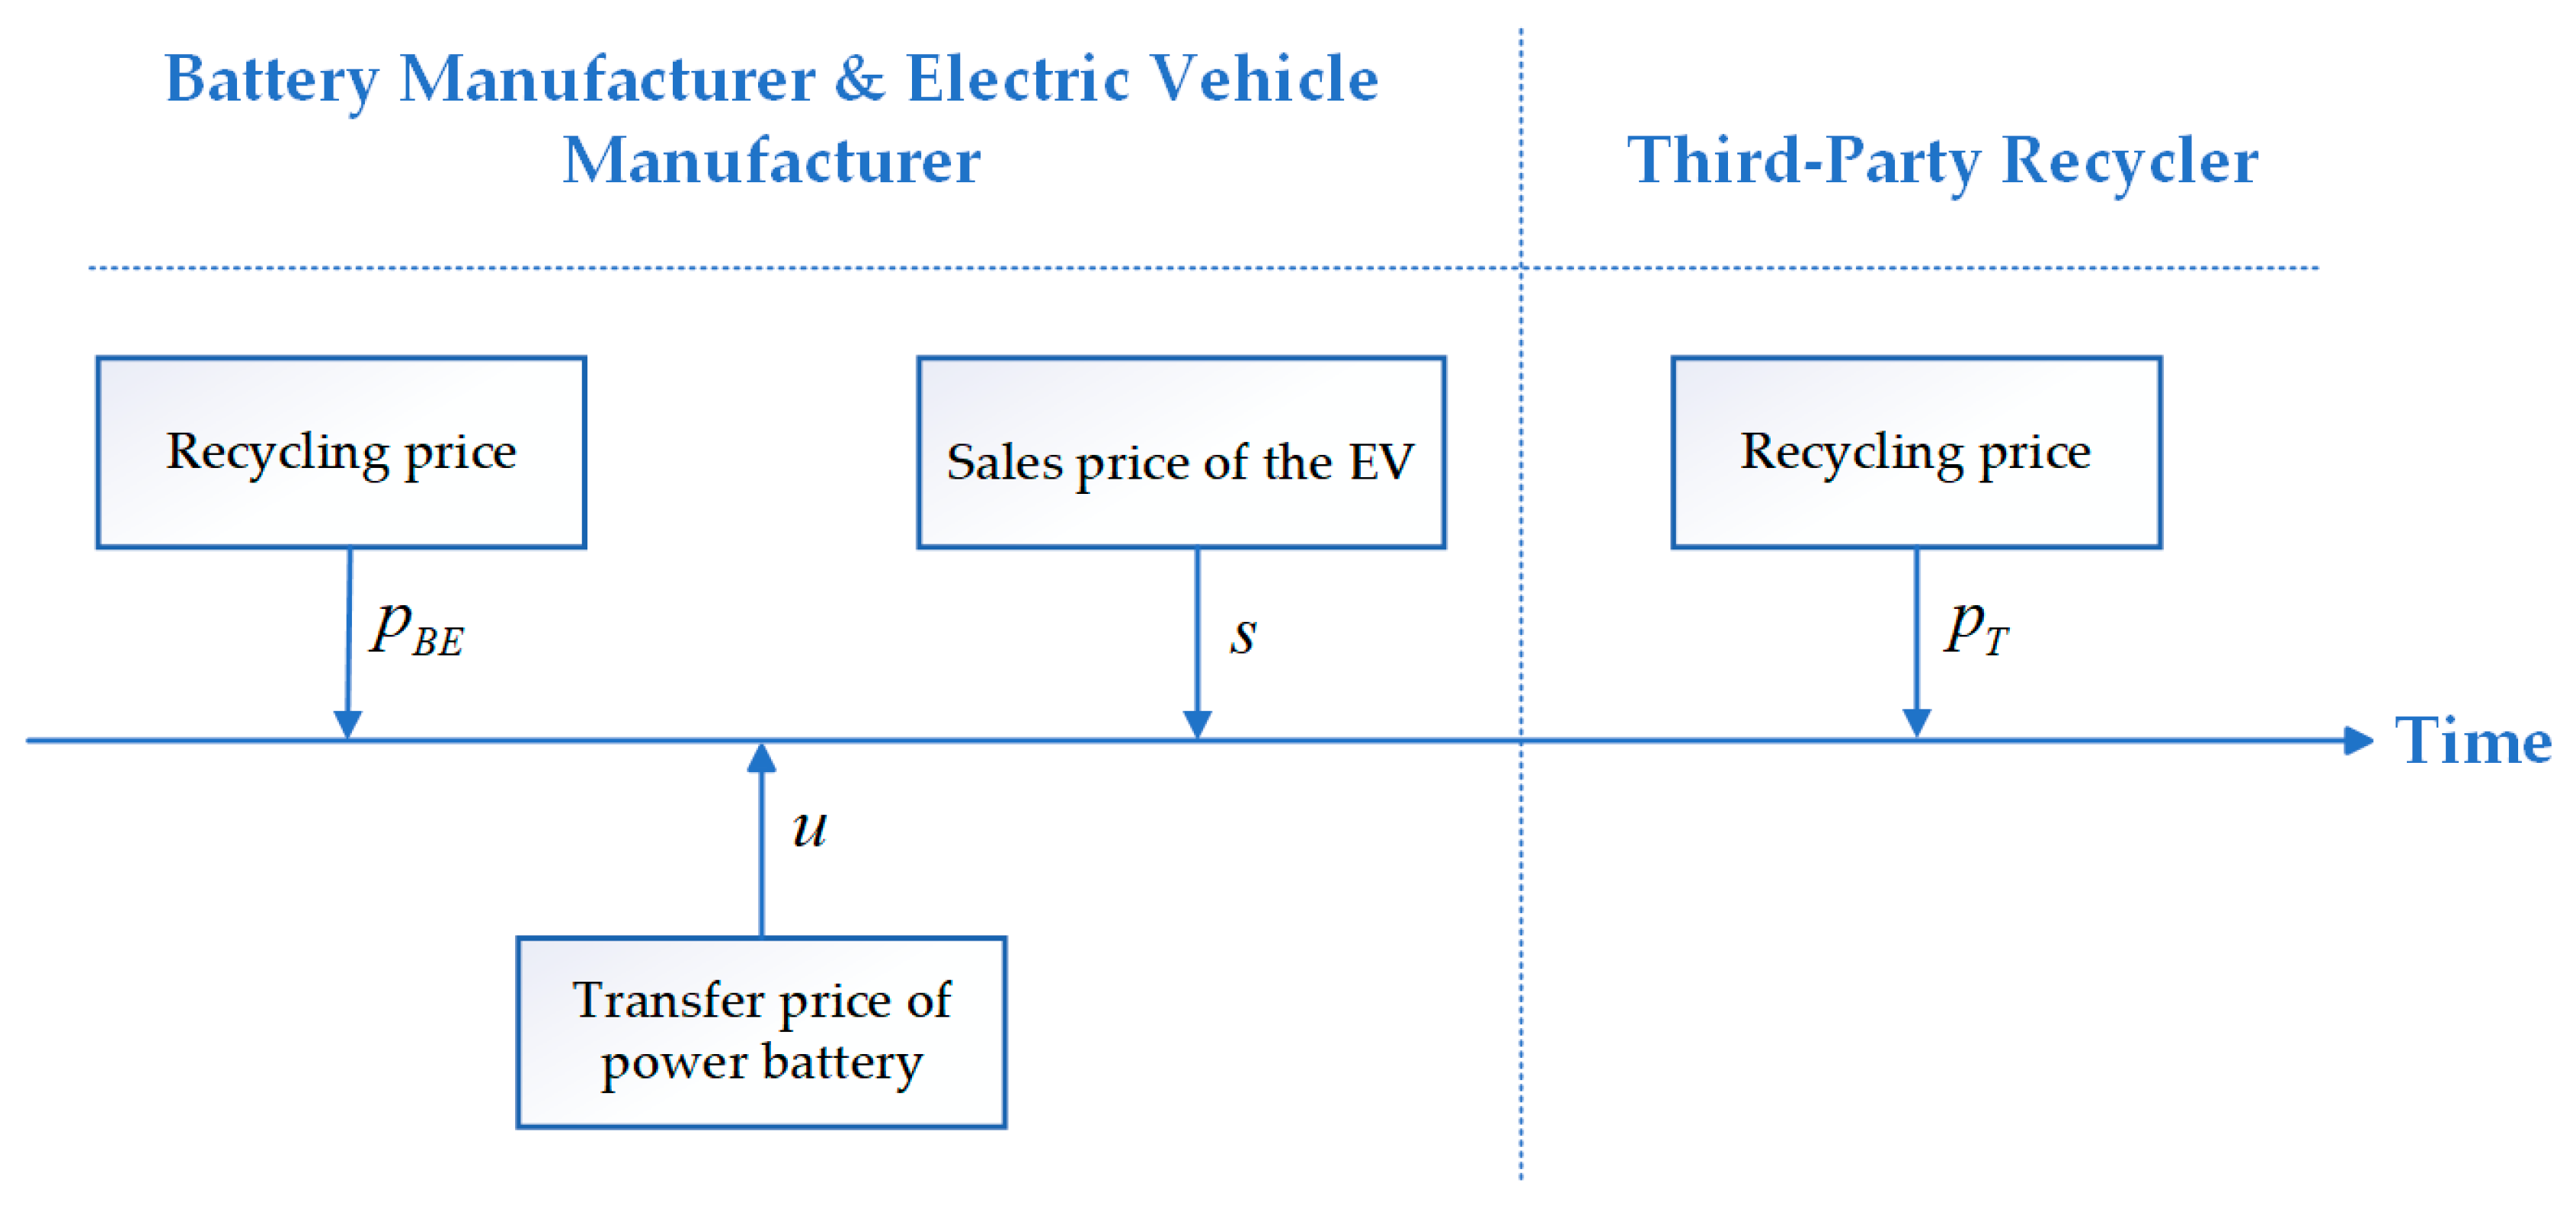
As illustrated in Figure 2, under the E + T mode, consumers recycle power batteries to the EVM and TPR, which are then transferred entirely to the BM. The BM will dismantle the recycled batteries to produce new power batteries. The EVM purchases these batteries from the BM, manufactures new energy vehicles, and sells them to consumers. The decision sequence is as shown in Figure 3: first, the power battery manufacturer determines the transfer price of the power battery u and the wholesale price of the new power battery v ; then, the EVM determines the recycling price p E and the sales price s of the EVs, and the TPR determines the recycling price p T .
In the E + T mode, each stakeholder pursues individual profit maximization, with their respective profit functions defined as follows:
π B = E v C N ξ 0 K + D E + D T Δ r u + K
π T = D T u p T q
π E = E s z v + D E u p E q
π E , π T , and π B , respectively, denote the profits of the EVM, TPR, and BM. The recycling quantity functions are D E = 1 2 a + b p E β p T and D T = 1 2 a + b p T β p E , respectively.
Proposition 1. 
In the E + T mode, the operational decisions of the CLSC members are, respectively,
p E * = a b β + 3 β 2 6 b 2 + 2 2 b 3 b 2 β 2 b β 2 + β 3 Δ q r + K 8 b β 2 b 2 β 2
p T * = a 12 b 3 2 b 2 β 7 b β 2 + β 3 + 2 4 b 4 2 b 3 β 3 b 2 β 2 + β 4 K q r + Δ 16 b b β 2 b 2 β 2
s * = 3 h 4 θ + z + C N + ξ 0 K 4
u * = Δ r + q + K 2 + a 4 β b
v * = h 2 θ + C N z + ξ 0 K 2
π E * = β 2 a + 2 β K + q + r Δ 2 θ + 16 b 4 K q r + Δ 2 θ + 4 b 2 a 2 3 β 2 K q r + Δ 2 θ + 16 b 3 h 2 2 h z θ + θ a + β K + q + r Δ K q r + Δ + z 2 θ + 4 b β a 2 θ + β 2 h 2 + 4 h z θ + θ 3 a K + q + r Δ + 2 β K q r + Δ 2 2 z 2 θ + 8 b 2 b 2 β 2 θ C N + K ξ 0 2 h + 2 z θ + θ C N + K θ ξ 0 128 b 2 b 2 β 2 θ
π T * = 4 b 2 2 b β + β 2 2 a + 2 b β K q r + Δ 2 256 b 2 b 2 + β 2 2
π B * = a 2 8 b 3 + 4 b 2 β 3 b β 2 β 3 + 4 a 8 b 4 4 b 3 β 7 b 2 β 2 + 2 b β 3 + β 4 K q r + Δ + 4 b β 8 b 4 K q r + Δ 2 7 b 2 β 2 K q r + Δ 2 + β 4 K q r + Δ 2 4 b 3 2 h z + β K q r + Δ 2 + 2 b β 2 2 h z + β K q r + Δ 2 64 b b β 2 b 2 β 2 + 8 h 2 θ + 8 z 2 θ + 8 C N + K ξ 0 2 h + 2 z θ + θ C N + K θ ξ 0

4.2. Competitive Recycling Between the BM and TPR

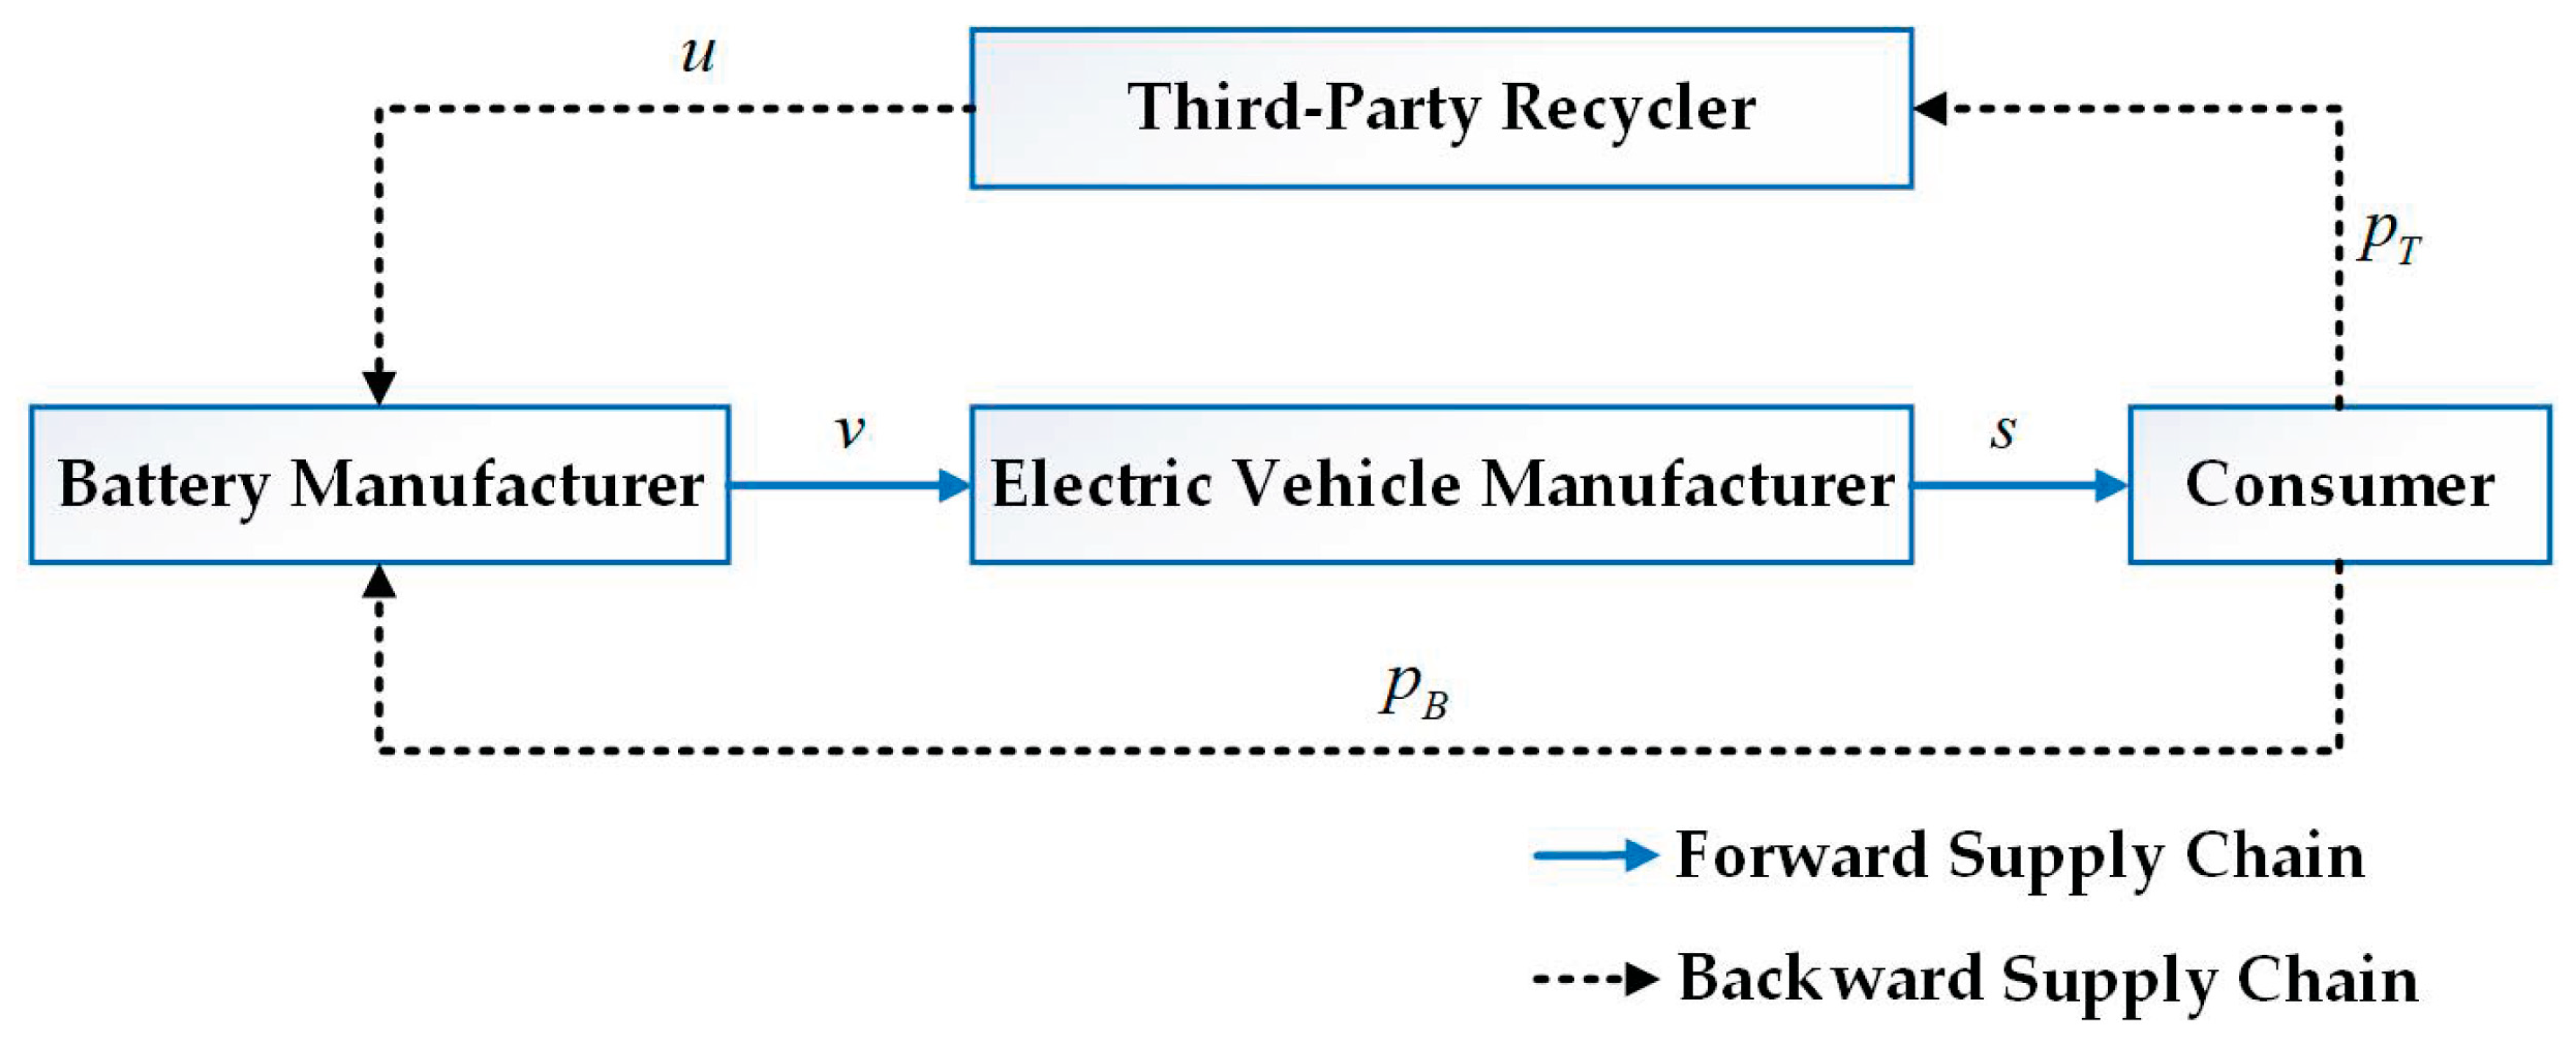
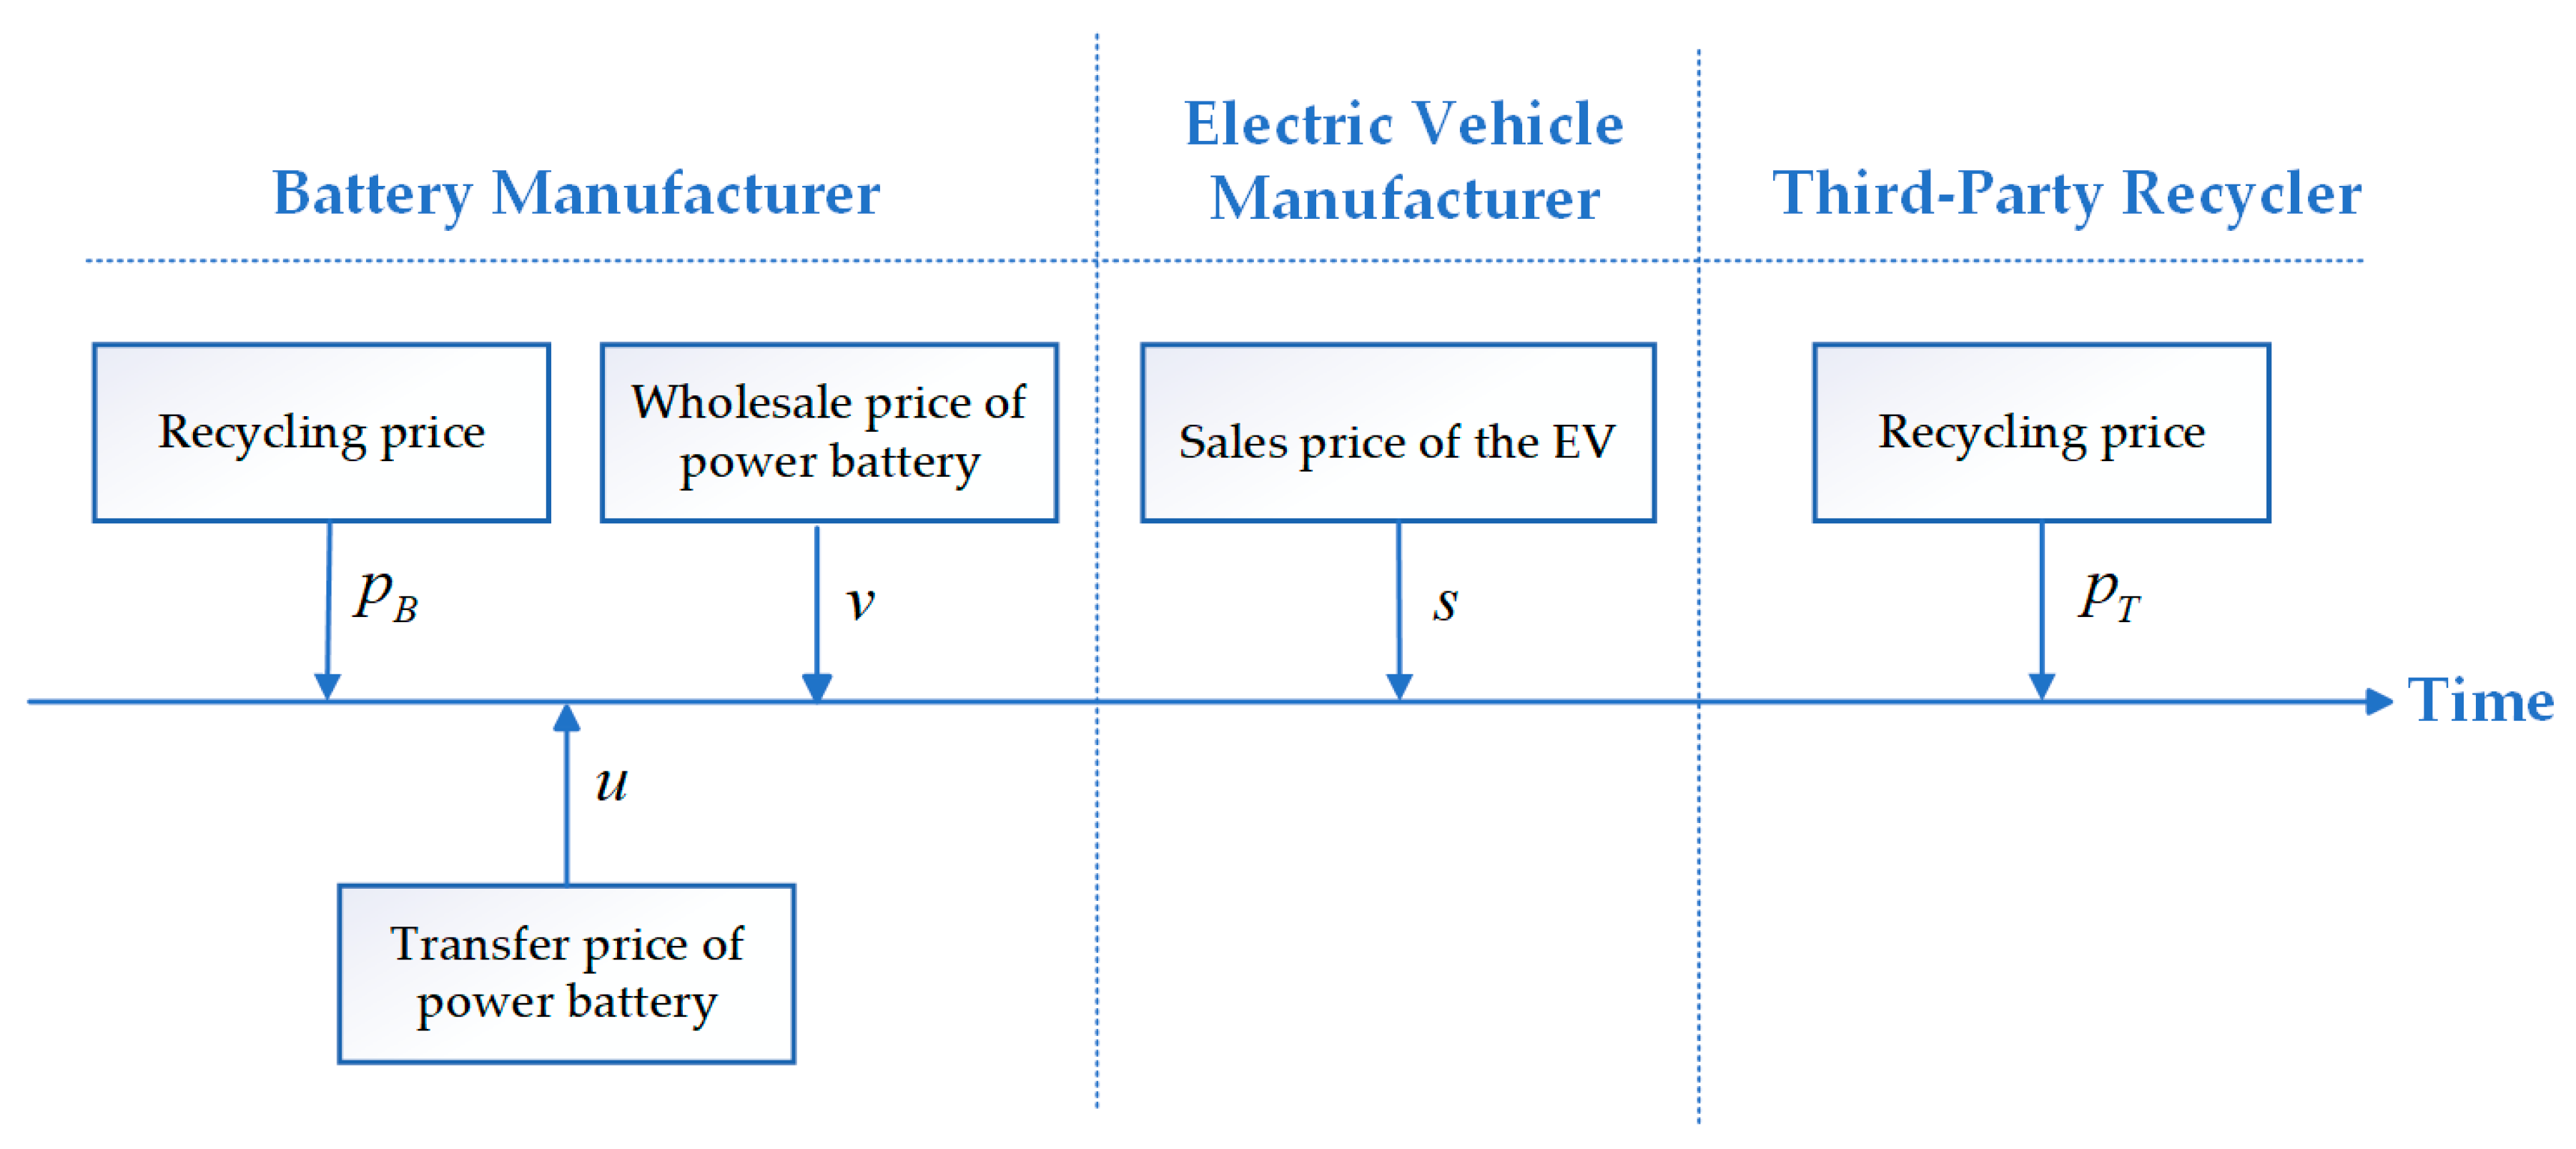
As shown in Figure 4, under the B + T mode, consumers recycle power batteries to the BM and TPR. All recovered power batteries, after second-life utilization, are dismantled by the BM to produce new power batteries. The EVM then purchases these new power batteries from the BM for manufacturing new EVs, which are sold to consumers. The decision sequence is as shown in Figure 5: first, the BM determines the recycling price p B , transfer price u , and wholesale price v of the power battery; then, the TPR determines the recycling price p T and the EVM determines the sales price s of EVs.
In the B + T mode, each stakeholder pursues individual profit maximization, with their respective profit functions defined as follows:
π B = E v C N ξ 0 K + D B + D T Δ r + K u D T D B p B + q
π E = E s z v
π T = D T u p T q
Proposition 2. 
In the B+T mode, the operational decisions of the CLSC members are, respectively,
p T * = a 3 b + β + 2 b 2 β 2 K q r + Δ 8 b b β
p B * = a 4 β b + K q r + Δ 2
u * = a 4 β b + K + q r + Δ 2
v * = h 2 θ + C N z + ξ 0 K 2
s * = 3 h 4 θ + z + C N + ξ 0 K 4
π B * = A 1 + A 2 + A 3 32 b b β θ
π T * = a + 2 b β K q r + Δ 2 64 b
π E * = h + z θ + θ C N + K θ ξ 0 2 16 θ
where
A 1 = 4 b 2 h 2 4 b h 2 β + 3 a 2 b θ + 12 a b 2 K θ + 12 b 3 K 2 θ 12 a b 2 q θ 24 b 3 K q θ + 12 b 3 q 2 θ 12 a b 2 r θ 24 b 3 K r θ + 24 b 3 q r θ + 12 b 3 r 2 θ 8 b 2 h z θ + a 2 β θ 8 a b K β θ 20 b 2 K 2 β θ + 8 a b q β θ + 40 b 2 K q β θ 20 b 2 q 2 β θ + 8 a b r β θ + 40 b 2 K r β θ 40 b 2 q r β θ 20 b 2 r 2 β θ + 8 b h z β θ 4 a K β 2 θ + 4 b K 2 β 2 θ ,
A 2 = + 4 a q β 2 θ 8 b K q β 2 θ + 4 b q 2 β 2 θ + 4 a r β 2 θ 8 b K r β 2 θ + 8 b q r β 2 θ + 4 b r 2 β 2 θ + 4 K 2 β 3 θ 8 K q β 3 θ + 4 q 2 β 3 θ 8 K r β 3 θ + 8 q r β 3 θ + 4 r 2 β 3 θ + 12 a b 2 Δ θ + 24 b 3 K Δ θ 24 b 3 q Δ θ 24 b 3 r Δ θ 8 a b β Δ θ 40 b 2 K β Δ θ + 40 b 2 q β Δ θ + 40 b 2 r β Δ θ 4 a β 2 Δ θ + 8 b K β 2 Δ θ 8 b q β 2 Δ θ 8 b r β 2 Δ θ ,
A 3 = 8 K β 3 Δ θ 8 q β 3 Δ θ 8 r β 3 Δ θ + 12 b 3 Δ 2 θ 20 b 2 β Δ 2 θ + 4 b β 2 Δ 2 θ + 4 β 3 Δ 2 θ + 4 b 2 z 2 θ 2 4 b z 2 β θ 2 + 4 b b β θ 2 C N 2 + 8 b K b β θ h + z θ ξ 0 + 4 b K 2 b β θ 2 ξ 0 2 + 8 b b β θ C N h + z θ + K θ ξ 0

4.3. Cooperative Recycling Between the EVM and TPR

As shown in Figure 6, under the ET+B mode, the EVM and TPR collaborate in recycling and jointly establish recycling stations. Both parties aim to maximize the total profit of the EVM and TPR and make decisions through joint negotiation. The BM independently builds its own recycling stations to pursue individual profit maximization. Consumers recycle power batteries to either the EVM and TPR or the BM. All recycled batteries, after second-life utilization, are uniformly dismantled by the BM into raw materials, which the BM gives priority to using in power battery production. The remanufactured power batteries and new power batteries produced are wholesaled by the BM to the EVM for manufacturing EVs, which are then sold to consumers. The decision sequence is as shown in Figure 7: first, the BM determines the recycling price p B , transfer price u , and wholesale price v of the power battery; then, the EVM and TPR determine the recycling price p E T and the sales price s of the EVs.
In the cooperative decision-making model between the EVM and TPR, the EVM and TPR pursue overall profit maximization, with their respective profit functions defined as follows:
π B = E v C N ξ 0 K + D B + D E T Δ r + K D B p B + q u D E T
π E T = E s z v + D E T u p E T q
π E T and π B denote the profits of the EVM and TPR and BM, respectively.
Proposition 3. 
In the decision-making model of cooperation between the EVM and TPR, the operational decisions of the EVM and TPR and BM, are, respectively,
p E T * = 2 a 3 b 2 + b β β 2 + 3 b β b + β 2 K q r + Δ 12 b 3 b β 2
p B * = K q r + Δ 2 a b + 2 β 6 b 2 β 2
u * = K + q r + Δ 2 a 2 b + β 6 b 2 β 2
v * = h 2 θ + C N z + ξ 0 K 2
s * = 3 h 4 θ + z + C N + ξ 0 K 4
π B * = A 4 + A 5 + A 6 + A 7 72 b b 2 β 2 θ
π E T * = 9 b h 2 + 2 a + 3 β K + q + r Δ 2 θ + 9 b 2 K q r + Δ 2 θ + 6 b 3 h z + 2 a + 3 β K + q + r Δ K q r + Δ θ + 9 b z 2 θ 2 + 9 b θ C N + K ξ 0 2 h + 2 z θ + θ C N + K θ ξ 0 144 b θ
where
A 4 = 9 b 3 h 2 9 b h 2 β 2 + 6 a 2 b 2 θ + 24 a b 3 K θ + 27 b 4 K 2 θ 24 a b 3 q θ 54 b 4 K q θ + 27 b 4 q 2 θ 24 a b 3 r θ 54 b 4 K r θ + 54 b 4 q r θ + 27 b 4 r 2 θ 18 b 3 h z θ + 8 a 2 b β θ + 12 a b 2 K β θ 18 b 3 K 2 β θ 12 a b 2 q β θ + 36 b 3 K q β θ 18 b 3 q 2 β θ 12 a b 2 r β θ ,
A 5 = 36 b 3 K r β θ 36 b 3 q r β θ 18 b 3 r 2 β θ + 4 a 2 β 2 θ 24 a b K β 2 θ 36 b 2 K 2 β 2 θ + 24 a b q β 2 θ + 72 b 2 K q β 2 θ 36 b 2 q 2 β 2 θ + 24 a b r β 2 θ + 72 b 2 K r β 2 θ 72 b 2 q r β 2 θ 36 b 2 r 2 β 2 θ + 18 b h z β 2 θ 12 a K β 3 θ + 18 b K 2 β 3 θ + 12 a q β 3 θ 36 b K q β 3 θ + 18 b q 2 β 3 θ ,
A 6 = 12 a r β 3 θ 36 b K r β 3 θ + 36 b q r β 3 θ + 18 b r 2 β 3 θ + 9 K 2 β 4 θ 18 K q β 4 θ + 9 q 2 β 4 θ 18 K r β 4 θ + 18 q r β 4 θ + 9 r 2 β 4 θ + 24 a b 3 Δ θ + 54 b 4 K Δ θ 54 b 4 q Δ θ 54 b 4 r Δ θ + 12 a b 2 β Δ θ 36 b 3 K β Δ θ + 36 b 3 q β Δ θ + 36 b 3 r β Δ θ 24 a b β 2 Δ θ 72 b 2 K β 2 Δ θ + 72 b 2 q β 2 Δ θ + 72 b 2 r β 2 Δ θ 12 a β 3 Δ θ ,
A 7 = 36 b K β 3 Δ θ 36 b q β 3 Δ θ 36 b r β 3 Δ θ + 18 K β 4 Δ θ 18 q β 4 Δ θ 18 r β 4 Δ θ + 27 b 4 Δ 2 θ 18 b 3 β Δ 2 θ 36 b 2 β 2 Δ 2 θ + 18 b β 3 Δ 2 θ + 9 β 4 Δ 2 θ + 9 b 3 z 2 θ 2 9 b z 2 β 2 θ 2 + 9 b b 2 β 2 θ 2 C N 2 + 18 b K b 2 β 2 θ h + z θ ξ 0 + 9 b K 2 b 2 β 2 θ 2 ξ 0 2 + 18 b b 2 β 2 θ C N h + z θ + K θ ξ 0

4.4. Cooperative Recycling Between the BM and TPR

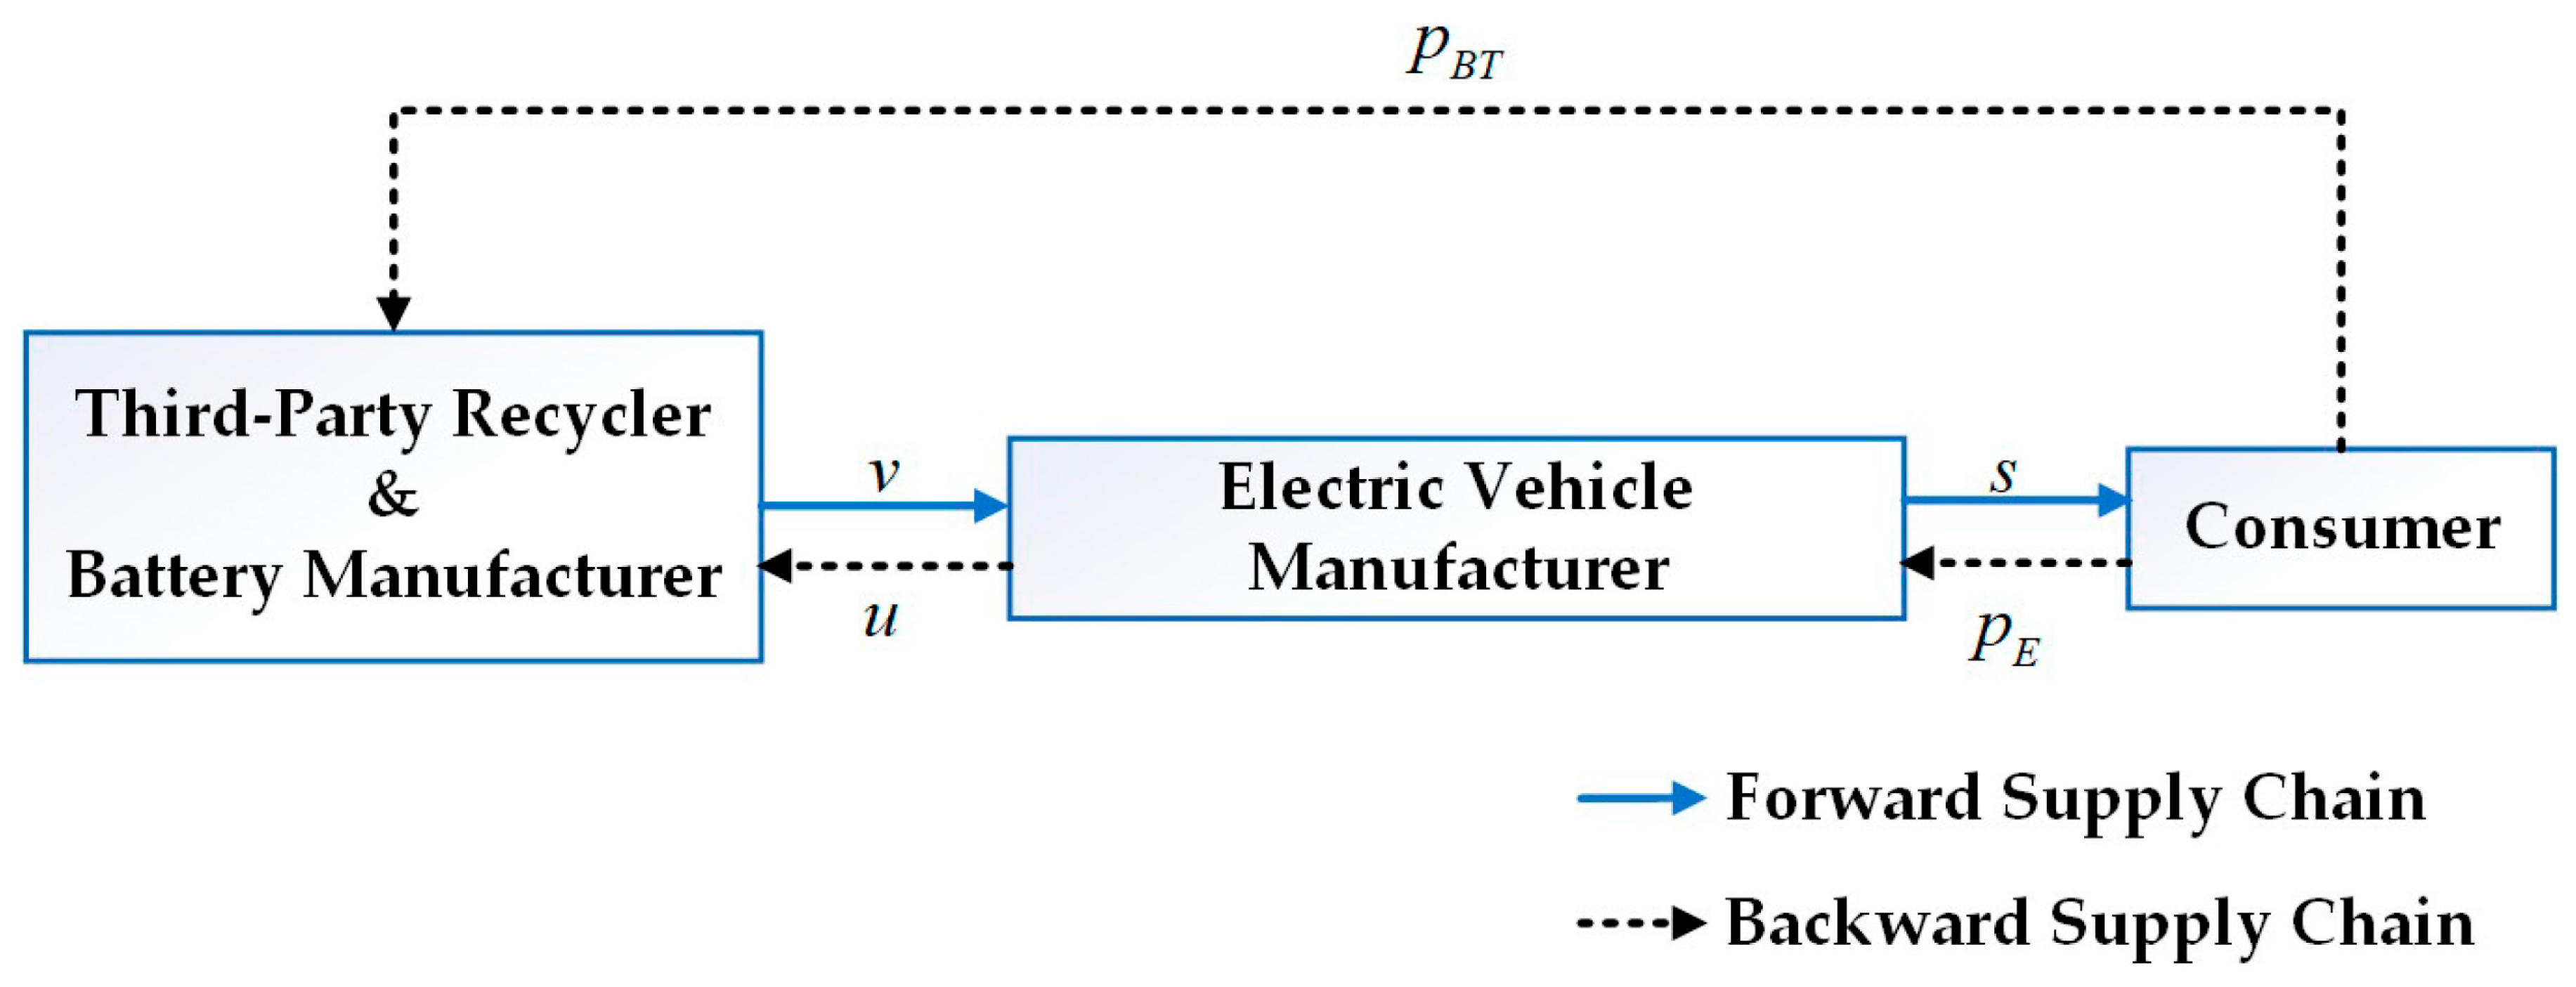
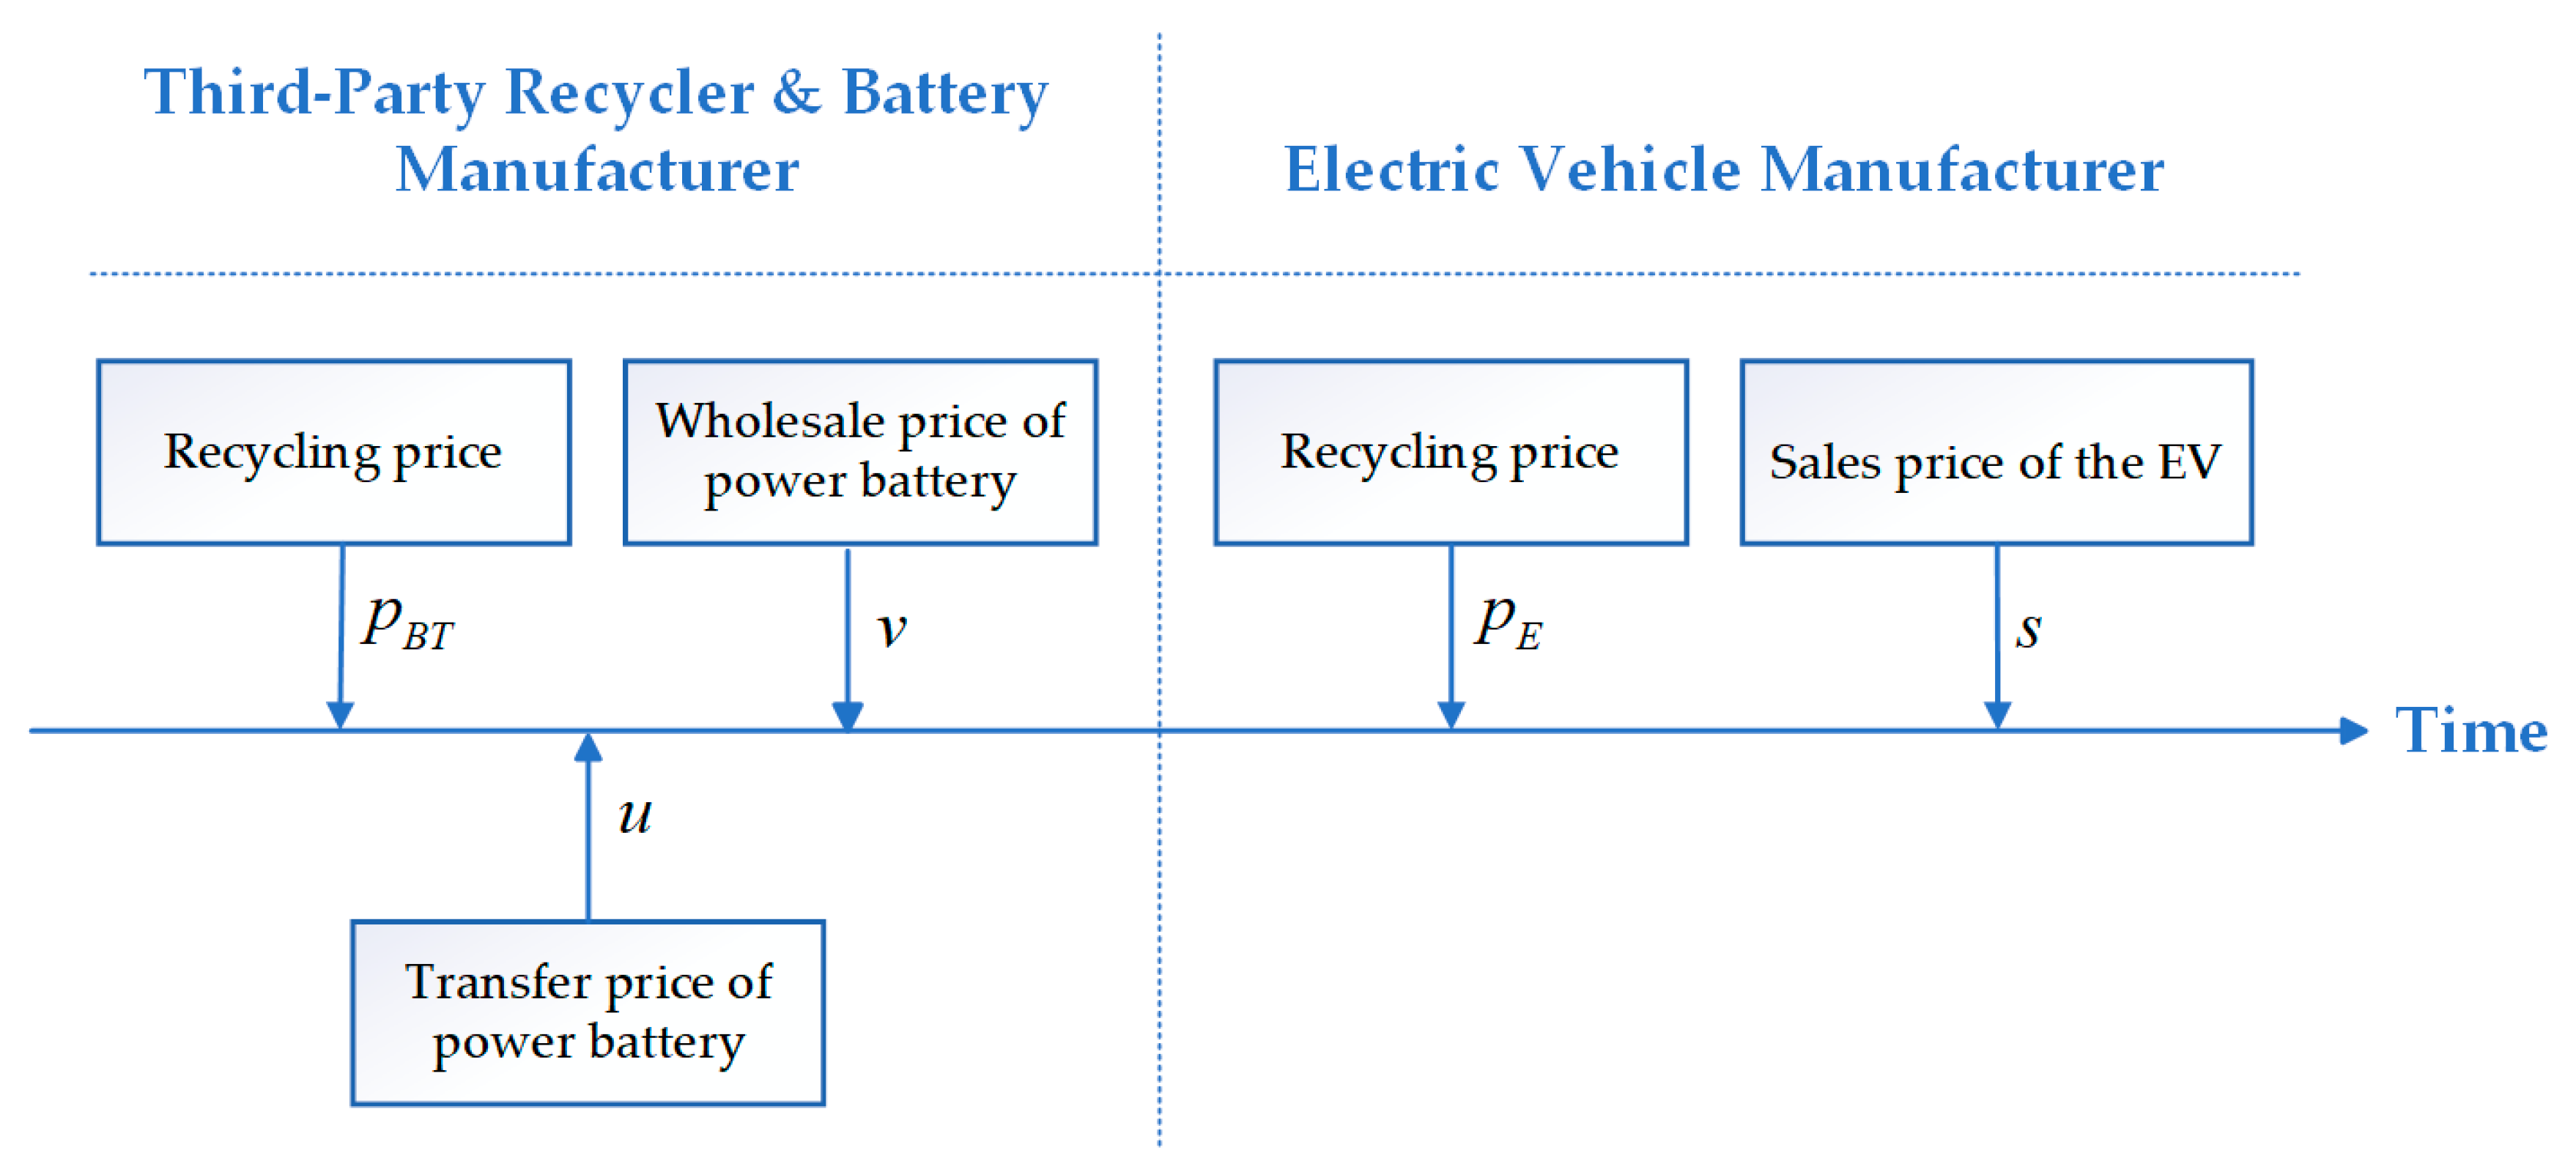
As shown in Figure 8, under the BT+E mode, the BM and TPR collaborate in recycling, allowing consumers to recycle power batteries to either the BM and TPR or the EVM. All recycled power batteries, after second-life utilization, are uniformly dismantled and remanufactured by the BM and TPR. The remanufactured power batteries and new power batteries produced are wholesaled by the BM and TPR to the EVM for manufacturing EVs, which are then sold to consumers. The decision sequence is as shown in Figure 9: first, the BM and TPR determine the recycling price p B T , transfer price u , and wholesale price v of the power battery; then, the EVM determines the recycling price p E and the sales price s of EVs.
In the cooperative decision-making model between the BM and TPR, the BM and TPR pursue overall profit maximization, while the EVM pursues individual profit maximization. Their respective profit functions are defined as follows:
π B T = E v C N ξ 0 K + D E + D B T Δ r + K D B T p B T + q u D E
π E = E s v z + D E u p E q
Proposition 4. 
In the cooperative decision model of the BM and TPR, the optimal decisions of the BM and TPR and EVM are, respectively,
p E * = a 3 b 2 4 b β + β 2 + 3 b β b + β 2 K q r + Δ 12 b 3 b β 2
p B T * = K q r + Δ 2 a 2 b + β 6 b 2 β 2
u * = K + q r + Δ 2 a b + 2 β 6 b 2 β 2
v * = h 2 θ + C N z + ξ 0 K 2
s * = 3 h 4 θ + z + C N + ξ 0 K 4
π E * = 9 b h 2 + a + 3 β K + q + r Δ 2 θ + 9 b 2 K q r + Δ 2 θ + 6 b 3 h z + a + 3 β K + q + r Δ K q r + Δ θ + 9 b z 2 θ 2 + 9 b θ C N + K ξ 0 2 h + 2 z θ + θ C N + K θ ξ 0 144 b θ
π B T * = A 8 + A 9 + A 10 + A 11 72 b b 2 β 2 θ
where
A 8 = 9 b 3 h 2 9 b h 2 β 2 + 9 a 2 b 2 θ + 30 a b 3 K θ + 27 b 4 K 2 θ 30 a b 3 q θ 54 b 4 K q θ + 27 b 4 q 2 θ 30 a b 3 r θ 54 b 4 K r θ + 54 b 4 q r θ + 27 b 4 r 2 θ 18 b 3 h z θ + 8 a 2 b β θ + 6 a b 2 K β θ 18 b 3 K 2 β θ 6 a b 2 q β θ + 36 b 3 K q β θ 18 b 3 q 2 β θ 6 a b 2 r β θ ,
A 9 = 36 b 3 K r β θ 36 b 3 q r β θ 18 b 3 r 2 β θ + a 2 β 2 θ 30 a b K β 2 θ 36 b 2 K 2 β 2 θ + 30 a b q β 2 θ + 72 b 2 K q β 2 θ 36 b 2 q 2 β 2 θ + 30 a b r β 2 θ + 72 b 2 K r β 2 θ 72 b 2 q r β 2 θ 36 b 2 r 2 β 2 θ + 18 b h z β 2 θ 6 a K β 3 θ + 18 b K 2 β 3 θ + 6 a q β 3 θ 36 b K q β 3 θ + 18 b q 2 β 3 θ ,
A 10 = 6 a r β 3 θ 36 b K r β 3 θ + 36 b q r β 3 θ + 18 b r 2 β 3 θ + 9 K 2 β 4 θ 18 K q β 4 θ + 9 q 2 β 4 θ 18 K r β 4 θ + 18 q r β 4 θ + 9 r 2 β 4 θ + 30 a b 3 Δ θ + 54 b 4 K Δ θ 54 b 4 q Δ θ 54 b 4 r Δ θ + 6 a b 2 β Δ θ 36 b 3 K β Δ θ + 36 b 3 q β Δ θ + 36 b 3 r β Δ θ 30 a b β 2 Δ θ 72 b 2 K β 2 Δ θ + 72 b 2 q β 2 Δ θ + 72 b 2 r β 2 Δ θ 6 a β 3 Δ θ ,
A 11 = 36 b K β 3 Δ θ 36 b q β 3 Δ θ 36 b r β 3 Δ θ + 18 K β 4 Δ θ 18 q β 4 Δ θ 18 r β 4 Δ θ + 27 b 4 Δ 2 θ 18 b 3 β Δ 2 θ 36 b 2 β 2 Δ 2 θ + 18 b β 3 Δ 2 θ + 9 β 4 Δ 2 θ + 9 b 3 z 2 θ 2 9 b z 2 β 2 θ 2 + 9 b b 2 β 2 θ 2 C N 2 + 18 b K b 2 β 2 θ h + z θ ξ 0 + 9 b K 2 b 2 β 2 θ 2 ξ 0 2 + 18 b b 2 β 2 θ C N h + z θ + K θ ξ 0

4.5. Cooperative Recycling Between the BM and EVM

As shown in Figure 10, under the BE+T mode, the BM and EVM collaborate in recycling, with consumers able to recycle power batteries to either the BM and EVM or the TPR. All recycled power batteries, after second-life utilization, are uniformly dismantled and remanufactured by the BM and EVM. The remanufactured power batteries and new power batteries produced are used by the BM and EVM to manufacture EVs, which are then sold to consumers. The decision sequence is as shown in Figure 11: first, the BM and EVM determine the recycling price p B E , transfer price u , and sales price s of EVs; then, the TPR determines the recycling price p T .
In the cooperative decision-making model between the BM and EVM, the BM and EVM pursue overall profit maximization, while the TPR pursues individual profit maximization. Their respective profit functions are defined as follows:
π B E = E s z C N ξ 0 K + D B E + D T Δ r + K D B E p B E + q u D T
π T = D T u p T q
Proposition 5. 
In the cooperative decision model of the BM and EVM, the optimal decisions of the BM and EVM and TPR are, respectively,
p T * = a 3 b 2 4 b β + β 2 + 3 b β b + β 2 K q r + Δ 12 b 3 b β 2
p B E * = K q r + Δ 2 a 2 b + β 6 b 2 β 2
u * = K + q r + Δ 2 a b + 2 β 6 b 2 β 2
s * = h 2 θ + C N + z + ξ 0 K 2
π T * = a + 3 b β K q r + Δ 2 144 b
π B E = A 12 + A 13 + A 14 + A 15 72 b b 2 β 2 θ
where
A 12 = 18 b 3 h 2 18 b h 2 β 2 + 9 a 2 b 2 θ + 30 a b 3 K θ + 27 b 4 K 2 θ 30 a b 3 q θ 54 b 4 K q θ + 27 b 4 q 2 θ 30 a b 3 r θ 54 b 4 K r θ + 54 b 4 q r θ + 27 b 4 r 2 θ 36 b 3 h z θ + 8 a 2 b β θ + 6 a b 2 K β θ 18 b 3 K 2 β θ 6 a b 2 q β θ + 36 b 3 K q β θ 18 b 3 q 2 β θ 6 a b 2 r β θ
A 13 = 36 b 3 K r β θ 36 b 3 q r β θ 18 b 3 r 2 β θ + a 2 β 2 θ 30 a b K β 2 θ 36 b 2 K 2 β 2 θ + 30 a b q β 2 θ + 72 b 2 K q β 2 θ 36 b 2 q 2 β 2 θ + 30 a b r β 2 θ + 72 b 2 K r β 2 θ 72 b 2 q r β 2 θ 36 b 2 r 2 β 2 θ + 36 b h z β 2 θ 6 a K β 3 θ + 18 b K 2 β 3 θ + 6 a q β 3 θ 36 b K q β 3 θ + 18 b q 2 β 3 θ
A 14 = 6 a r β 3 θ 36 b K r β 3 θ + 36 b q r β 3 θ + 18 b r 2 β 3 θ + 9 K 2 β 4 θ 18 K q β 4 θ + 9 q 2 β 4 θ 18 K r β 4 θ + 18 q r β 4 θ + 9 r 2 β 4 θ + 30 a b 3 Δ θ + 54 b 4 K Δ θ 54 b 4 q Δ θ 54 b 4 r Δ θ + 6 a b 2 β Δ θ 36 b 3 K β Δ θ + 36 b 3 q β Δ θ + 36 b 3 r β Δ θ 30 a b β 2 Δ θ 72 b 2 K β 2 Δ θ + 72 b 2 q β 2 Δ θ + 72 b 2 r β 2 Δ θ 6 a β 3 Δ θ
A 15 = 36 b K β 3 Δ θ 36 b q β 3 Δ θ 36 b r β 3 Δ θ + 18 K β 4 Δ θ 18 q β 4 Δ θ 18 r β 4 Δ θ + 27 b 4 Δ 2 θ 18 b 3 β Δ 2 θ 36 b 2 β 2 Δ 2 θ + 18 b β 3 Δ 2 θ + 9 β 4 Δ 2 θ + 18 b 3 z 2 θ 2 18 b z 2 β 2 θ 2 + 18 b b 2 β 2 θ 2 C N 2 + 36 b K b 2 β 2 θ h + z θ ξ 0 + 18 b K 2 b 2 β 2 θ 2 ξ 0 2 + 36 b b 2 β 2 θ C N h + z θ + K θ ξ 0

4.6. Comparison of Equilibrium Solutions

Comparing the optimal solutions of the above decisions in different scenarios, as shown in Table 3 and Table 4, the following inferences can be drawn.
Corollary 1. 
In the forward supply chain, the change in recycling mode of the reverse supply chain will not affect the sales price of EVs and the wholesale price of power batteries. They will be influenced by the cooperative relationships among enterprises in the forward supply chain. The sales prices of EVs under different recycling modes in the CLSC satisfy  s E + T * = s B + T * = s E T + B * = s B T + E * , and the wholesale prices of power batteries satisfy v E + T * = v B + T * = v E T + B * = v B T + E * . Since the BM and EVM collaborate, the EVM does not need to pay wholesale fees for power batteries to the BM. Therefore, when determining the sales price of EVs, this mode does not need to consider the wholesale cost of batteries as in other recycling modes. From the optimal solutions, it can be seen that the wholesale price of power batteries is mainly affected by factors such as the EV market size, consumer price sensitivity coefficient for EVs, production cost of new power batteries, production cost of EVs, recycling rate target, and reward–penalty intensity—these factors further influence the sales price. Thus, it is concluded that regardless of the recycling mode in the reverse supply chain, these influencing factors remain unchanged, and thus cannot alter the sales price or wholesale price.
Corollary 2. 
𝜕 s * 𝜕 K > 0 , 𝜕 v * 𝜕 K > 0 , 𝜕 u * 𝜕 K > 0 , 𝜕 p * 𝜕 K > 0 ; 𝜕 D * 𝜕 K > 0 , and 𝜕 E * 𝜕 K < 0 . An enhancement in reward–penalty intensity results in upward adjustments to the sales price, wholesale price, transfer price, and recycling price. The increase in recycling price and sales price causes an increase in the quantity of power batteries recycled and a decrease in the quantity of EVs sold. This is mainly because the BM, to avoid penalties for failing to meet the specified recycling rate, increases its recycling price and transfer price to recycle more power batteries, which inevitably raises its recycling costs. As the leader in the supply chain, the BM, when facing increased costs, seeks to maximize its own profits. Since the profit of each battery from second-life utilization is fixed, increasing the wholesale price of power batteries becomes the only way for the BM to boost revenue. The increase in wholesale price raises the EVM’s procurement costs. If the EVM maintains the original sales price, its profits will decrease, so the EVM appropriately increases the sales price to avoid profit losses. In summary, when the government increases the reward–penalty intensity, the BM pays more attention to achieving the recycling rate target, prompting it to increase investment in power battery recycling, which in turn stimulates the recycling enthusiasm of all recyclers in the reverse supply chain.
Corollary 3. 
u B T + E = u B E + T > u E + T = u B + T > u E T + B , p B E T + B > p B B + T > p B B T + E = p B B E + T , and u B + T > p B B + T . For the BM, the transfer prices under the BT+E and BE+T modes are the highest, but the recycling prices are the lowest; the transfer price under the ET+B mode is the lowest, while the recycling price is the highest. When the BM collaborates with other enterprises, the transfer price increases while its own recycling price decreases; when other enterprises form a coalition, the transfer price decreases and the BM’s recycling price increases. If a < 6 q b + β , then u E T + B > p B E T + B , meaning the transfer price is higher than the recycling price—i.e., the BM’s own recycling costs are lower than purchasing from other enterprises. The gap between the transfer price and recycling price is smallest under the ET+B mode, indicating little difference in unit costs for the BM regardless of the recycling channel; the gap is largest under the BT+E and BE+T modes. This is primarily because when the BM collaborates with other enterprises, consumers are more willing to recycle power batteries to the BM’s channel, forcing the other channel to increase its recycling price to address competitive disadvantages. The BM and its partners must purchase power batteries at a transfer price higher than the recycling price, further driving up the transfer price. Then, they will adjust investment to appropriately reduce the recycling price and control cost.

5. Numerical Analysis

According to the global sales data of EVs in the first half of 2024, BYD has become the most popular automobile brand in the world, with 1.52 million units sold. Therefore, this study chooses to take BYD’s best-selling model Qin L as an example. Its battery capacity is 15.87 kWh, battery type is a lithium iron phosphate battery, battery energy density is 140 Wh/kg, and the average price in December 2023 is 47.5 CNY/kg; hence, the battery cost is C N = 15.87 × 1000 ÷ 140 × 47.5 = 5384.46 . The cathode material cost of the lithium iron phosphate battery accounts for about 40% of the total cost, meaning the production cost of a remanufactured power battery is about 60% of the cost of new production, so C R M = C N × 60 % = 3230.68 . The second-life utilization price per unit of power batteries is 664 CNY/kWh, and the remaining capacity of the unit power battery obeys the normal distribution. Assuming μ L = 0.5 , then λ L ~ = 15.87 × 664 × 0.8 × 0.5 = 4215.07 and Δ = C N C R M + λ L ~ = 6368.85 . Due to the large market size of EVs and the rich diversity of brands and models, consumers have an abundance of products to choose from and will compare prices across multiple companies when purchasing EVs, so the consumer price sensitivity is θ = 3.2 . Finally, the dismantling cost, manufacturing cost, and recycling cost are assumed to be 2000, 40,000, and 500, respectively, the recycling rate ξ 0 is set to 10%, the cross-price sensitivity is set at 0.8, the quantity of power batteries voluntarily recycled by consumers is set at 500, and the sensitivity of consumers to the recycling price is set at 1.6. The final summary of all the parameters and values is shown in Table 5.
After setting the parameters, we use Mathematica 14 to calculate the profit, recycling rate, and recycling quantity of each recycling mode, respectively. The results are shown in Table 6. By observing the calculation results, we can find the following:
Corollary 4. 
π B B + T > π B E T + B > π B E + T , π E E + T > π E B T + E > π E B + T , π T E + T > π T B + T > π T B E + T ; π B E B E + T > π B B + T + π E B + T > π B E + T + π E E + T , π B T B T + E > π B E + T + π T E + T , and π E T E T + B > π E B + T + π T B + T . The BM, as a leader in the supply chain, has the right to choose whether to cooperate and with whom to cooperate in order to gain more profit.
Without cooperation, the BM’s participation in recycling competition can bring it more profit. On the one hand, according to Corollary 3, the recycling price is lower than the transfer price, so the cost of recycling is lower. On the other hand, the quantity of recycling is increased, which not only can obtain more benefits from laddering utilization, but also better fulfill the target recycling rate. In addition, if the EVM and TPR choose to cooperate, the BM’s profits will decrease because cooperation can make them more competitive in recycling competition, thereby suppressing the recycling quantity of the other party, and this situation seems to apply to the EVM as well. The TPR always participates in recycling competition, so its situation is different from that of the EVM and BM. However, the cooperation between the EVM and BM can also reduce the TPR’s profits.
Engaging in cooperation can bring more profits for both parties. In the case of participating in cooperation, the additional profits generated by the BM’s cooperation with the EVM are higher, and the cooperation between various enterprises can indeed bring more profits to both sides. However, regardless of whom the BM chooses to cooperate with, the total recycling quantity and the recycling quantity through cooperative recycling will not change. When the EVM and TPR compete in recycling, the TPR is more attractive to consumers. Since the TPR’s main profit source is recycling retired power batteries and reselling them to the BM, compared with the EVM, which needs to invest funds in the production of EVs, the TPR invests more in recycling activities, and the recycling quantity is naturally higher than that of the EVM. Therefore, when the BM cooperates with the EVM, according to Corollary 1, the BM can help the EVM save the wholesale costs of power batteries, thereby obtaining more profits in the sales of EVs, which is unattainable when the BM cooperates with the TPR.
Corollary 5. 
ξ B T + E > ξ B + T > ξ E T + B > ξ E + T > ξ B E + T  and  D B T + E = D B E + T > D B + T > D E T + B > D E + T . By comparing the recycling rates of different recycling modes, it is not difficult to find that the BT+E mode exhibits the best recycling rate, followed by the B + T mode and the ET+B mode. In contrast, the recycling rates of the E + T mode and the BE+T mode are relatively low. The formula for calculating the recycling rate is the quantity of recycled power batteries divided by the sales quantity, so the BT+E mode, with the highest recycling rate, also has the highest quantity of recycled power batteries. Interestingly, the BE+T mode, which has the same recycling quantity as the BT+E mode, has the lowest recycling rate. According to the formula for calculating the recycling rate, this indicates that the BE+T mode has the highest sales volume of EVs, which is consistent with the analysis in Corollary 4. The ranking of recycling quantities for the remaining modes is the same as that of recycling rates. As known from Corollary 1, the sales volumes of EVs in the B + T mode, ET+B mode, and E + T mode are the same; thus, the higher the recycling quantity, the higher the recycling rate.

5.1. Recycling Rate Analysis

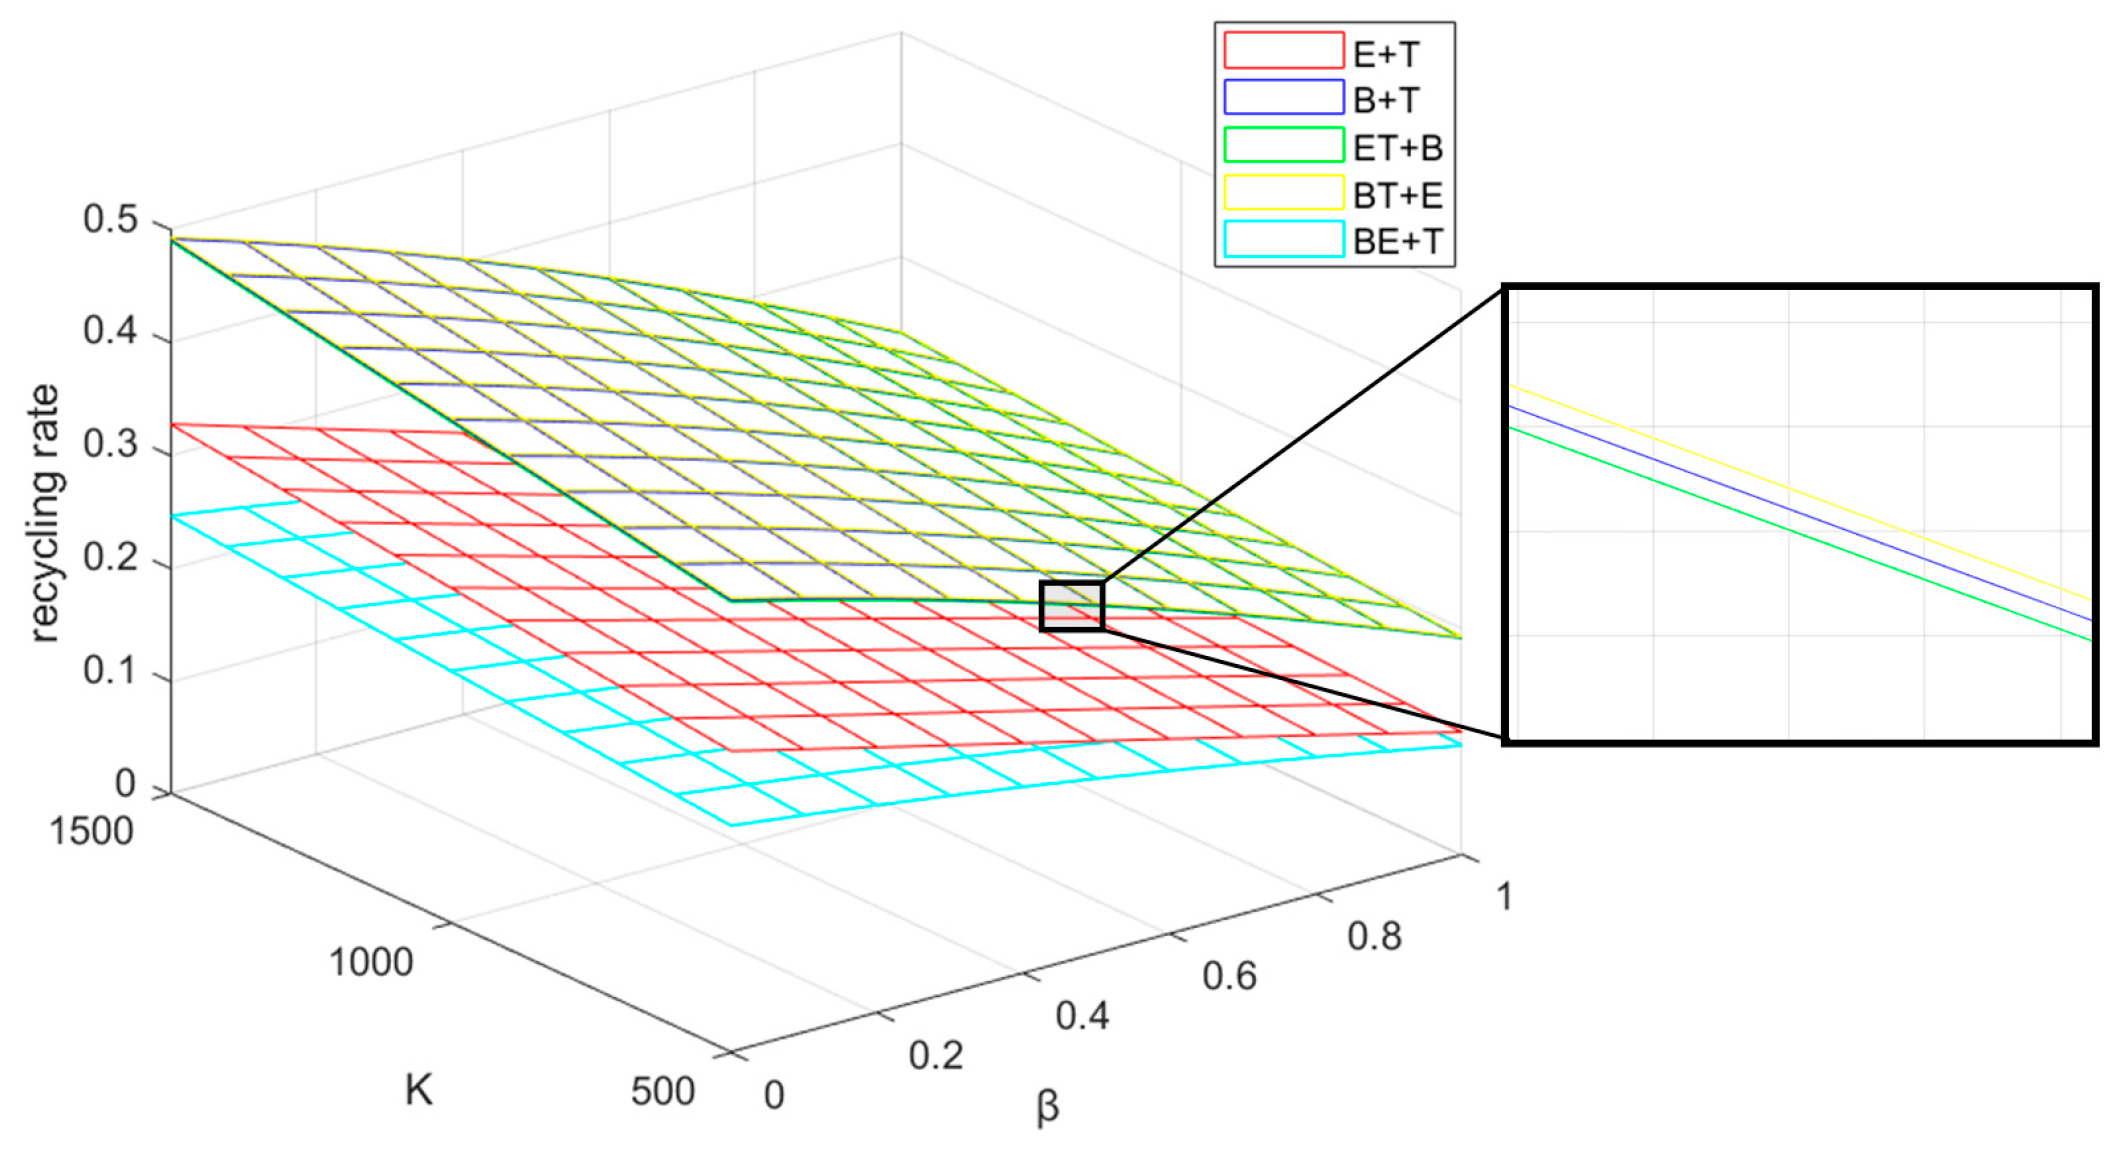
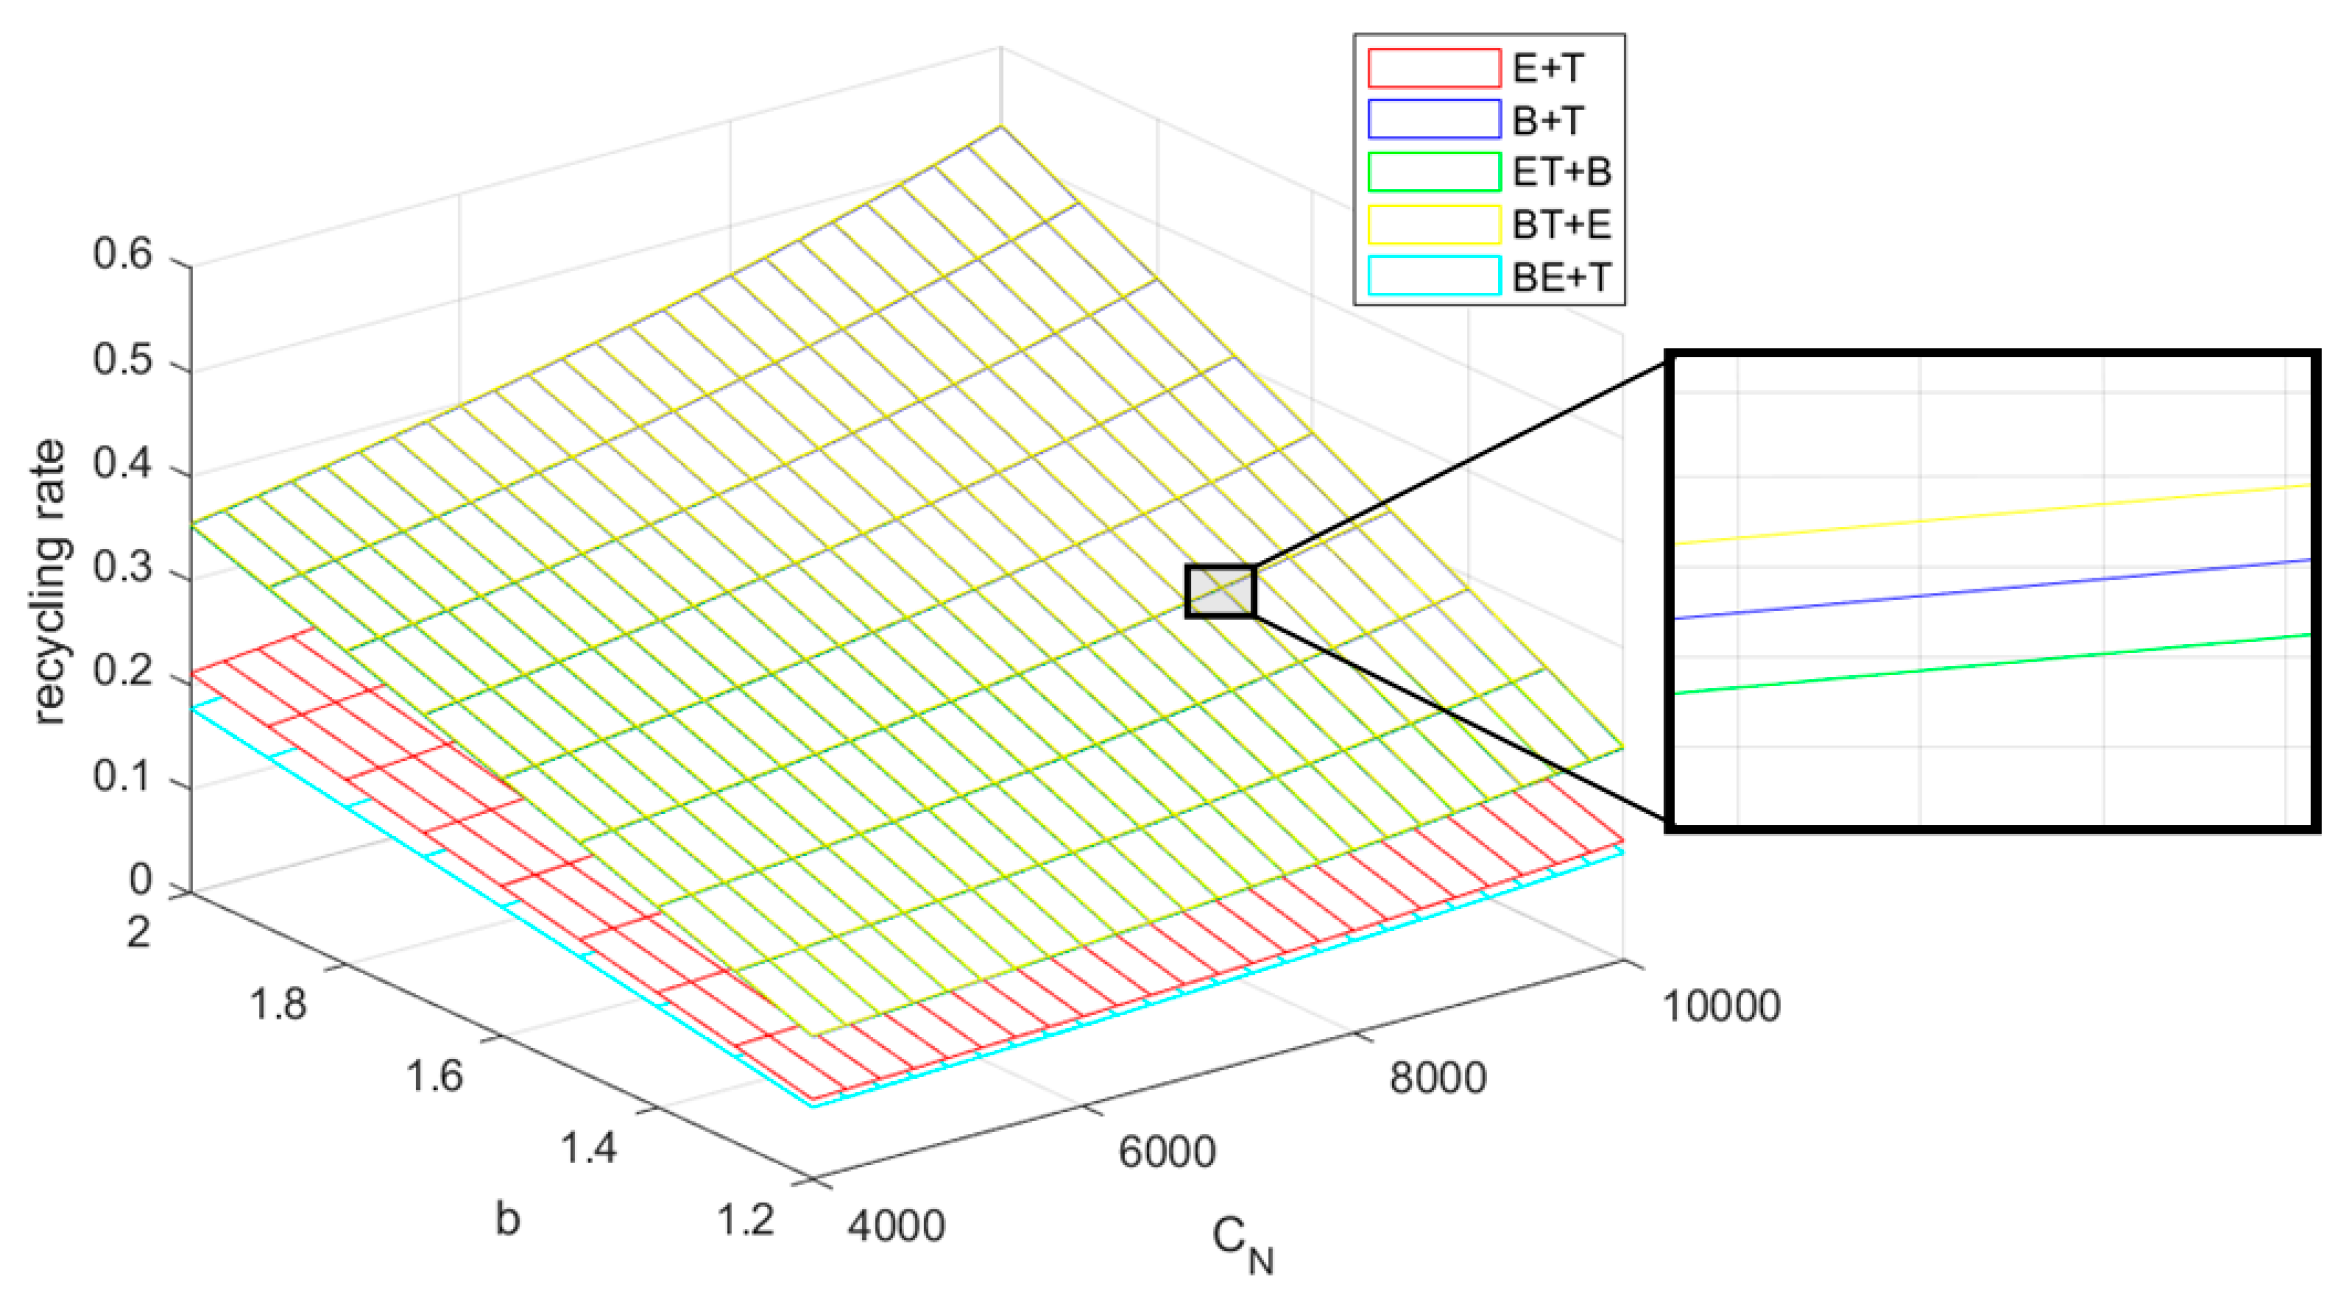
The sensitivity analysis of the recycling rates of different recycling modes regarding K , β , b , and C N is shown in Figure 12 and Figure 13.
Corollary 6. 
𝜕 ξ 𝜕 K > 0 , 𝜕 ξ 𝜕 β < 0 , 𝜕 ξ 𝜕 b > 0 , and 𝜕 ξ 𝜕 C N > 0 . By comparing the recycling rates of different recycling modes, it is easy to find that the recycling rate of the BT+E mode is always the highest, and the changes of K , β , b , and C N do not affect the ranking order of recycling rates of different recycling modes. As the reward–penalty intensity set by the government increases, the recycling rate of all recycling modes will increase to a certain extent; that is to say, the greater the reward–penalty intensity, the greater the deterrent or incentive effect for the main recycling enterprises. Additionally, the enterprises will actively carry out the recycling work of power batteries in order to avoid high penalties or to obtain high rewards. On the contrary, if the reward–penalty intensity is painless for enterprises, then the enterprises will not pay special attention to the recycling work, and the effect of promoting the recycling of power batteries will not be achieved. Therefore, if the government intends to increase the power battery recycling rate, it can appropriately adjust the reward–penalty intensity. Excessively high intensity may impose significant fiscal pressure on the government and deter other enterprises from entering the market, while excessively low intensity fails to serve as an effective deterrent or incentive.
When cross-price sensitivity increases, it signifies more intense price competition among recycling channels, leading to a decrease in recycling rates across all modes. With recycling prices unchanged, higher cross-price sensitivity reduces recycling quantities, thereby lowering the recycling rate. Currently, the power battery recycling industry involves numerous enterprises, making competition inevitable, and includes informal recycling channels that offer higher prices for power batteries, causing disorderly competition. However, unbridled competition will ultimately only lead to a lose–lose situation, and shifting from mutual competition to win–win cooperation represents a favorable choice for enterprises. This not only brings more profits to both sides but also increases power battery recycling quantities.
Contrary to cross-price sensitivity, an increase in consumers’ sensitivity to recycling prices raises the recycling rate. The higher consumers’ sensitivity is to recycling prices, the greater the quantity of power batteries recycled per unit of recycling price. Without changing the recycling price, recyclers can still recycle more power batteries. When consumers are unaware of the benefits of power battery recycling, their sensitivity to recycling prices is high, allowing recyclers to collect large quantities of batteries at relatively low prices—exploiting the so-called information asymmetry.
The production cost of new power batteries includes raw material procurement costs, and fluctuations in raw material prices inevitably impact battery production and recycling. When raw material prices rise, the production cost of new power batteries increases, prompting the BM to recycle more power batteries to reduce raw material procurement and control production costs. Meanwhile, higher raw material prices enhance the value of power batteries, attracting recyclers to intensify recycling efforts for greater profits. Thus, an increase in new power battery production costs ultimately raises the recycling rate, a phenomenon applicable to all recycling modes. The BM and recyclers can forecast based on historical price data of power battery raw materials and formulate advance recycling plans to mitigate the impact of price fluctuations.

5.2. Profit Analysis of the BM

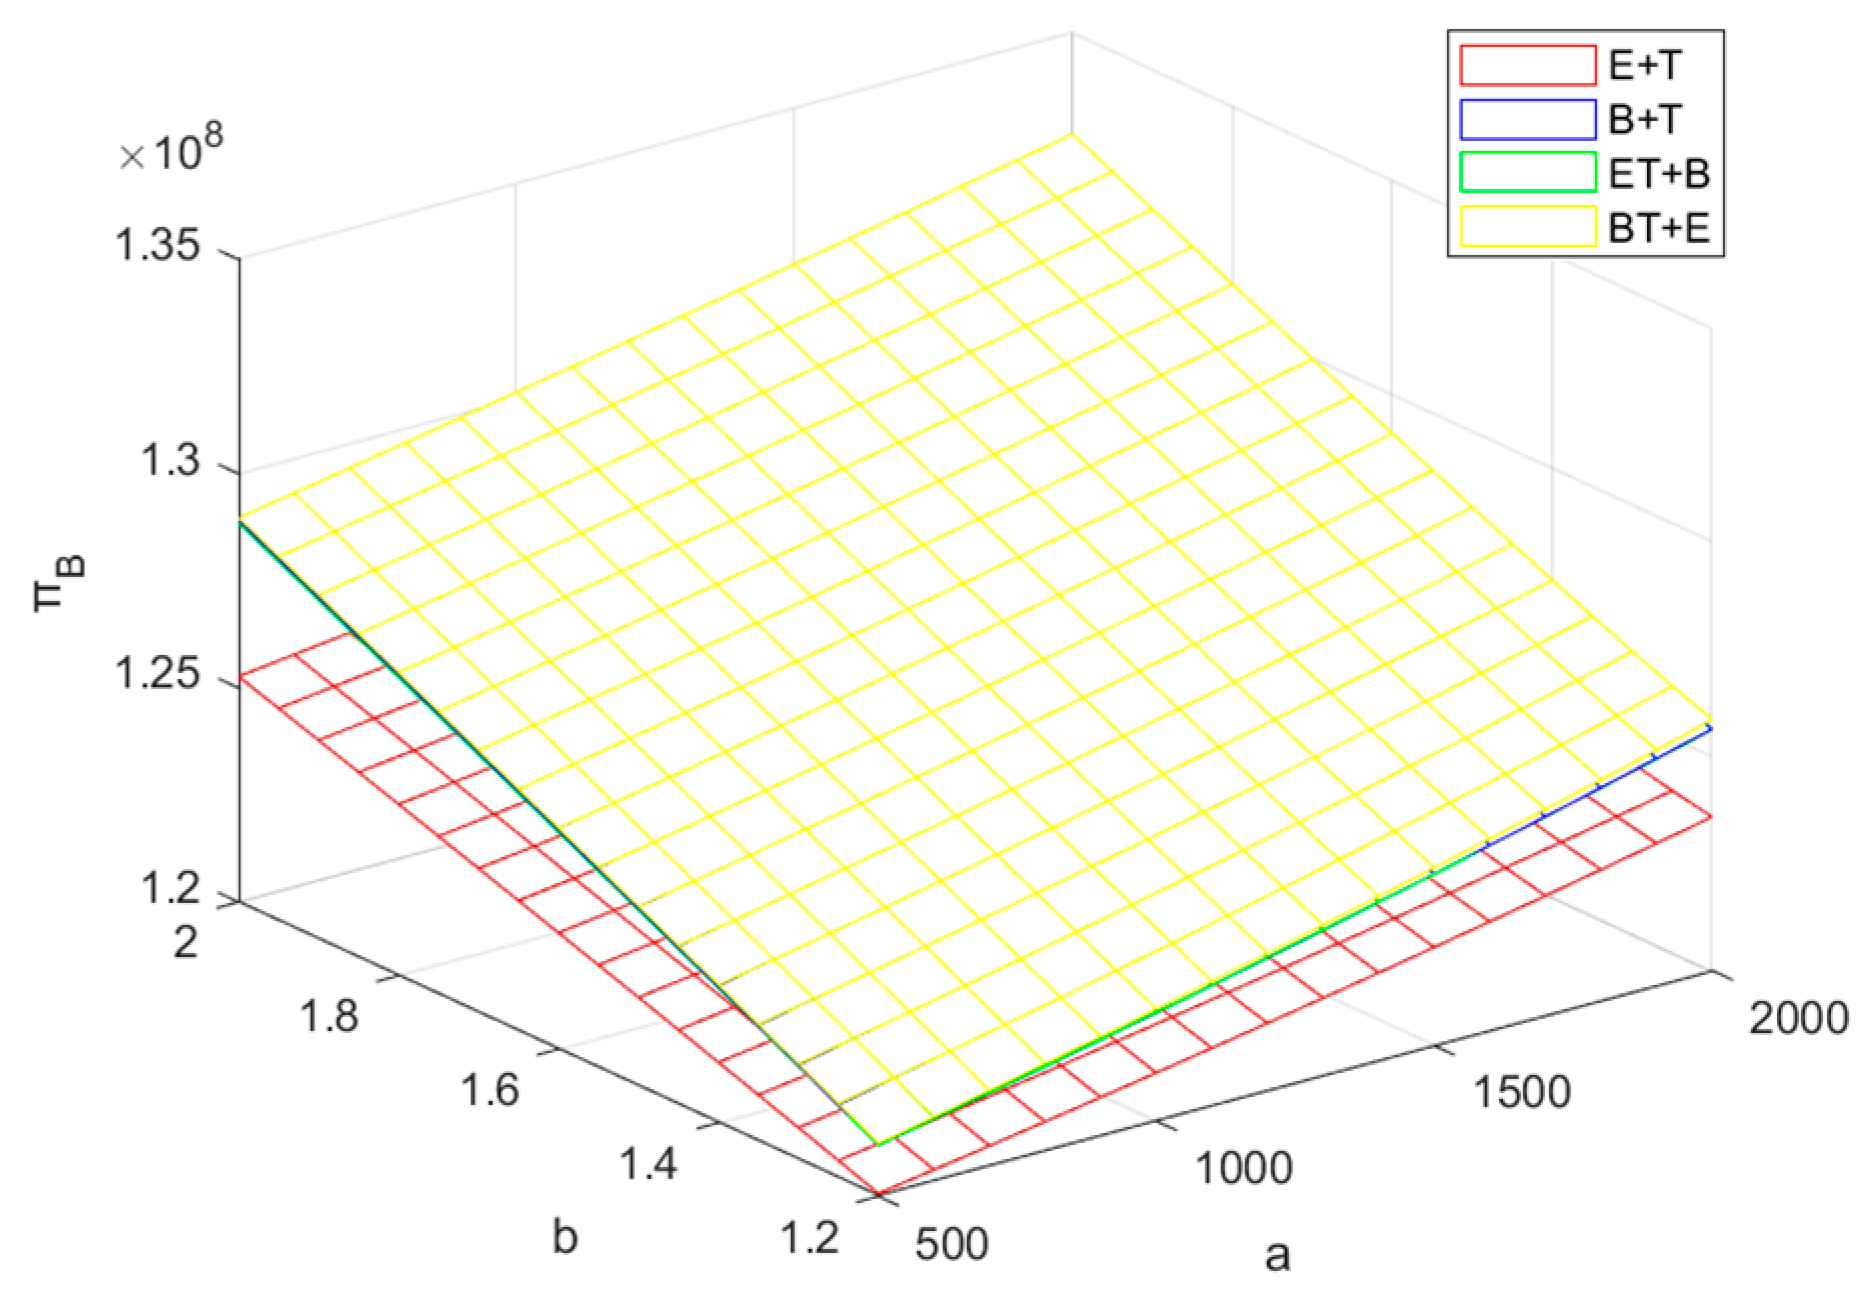
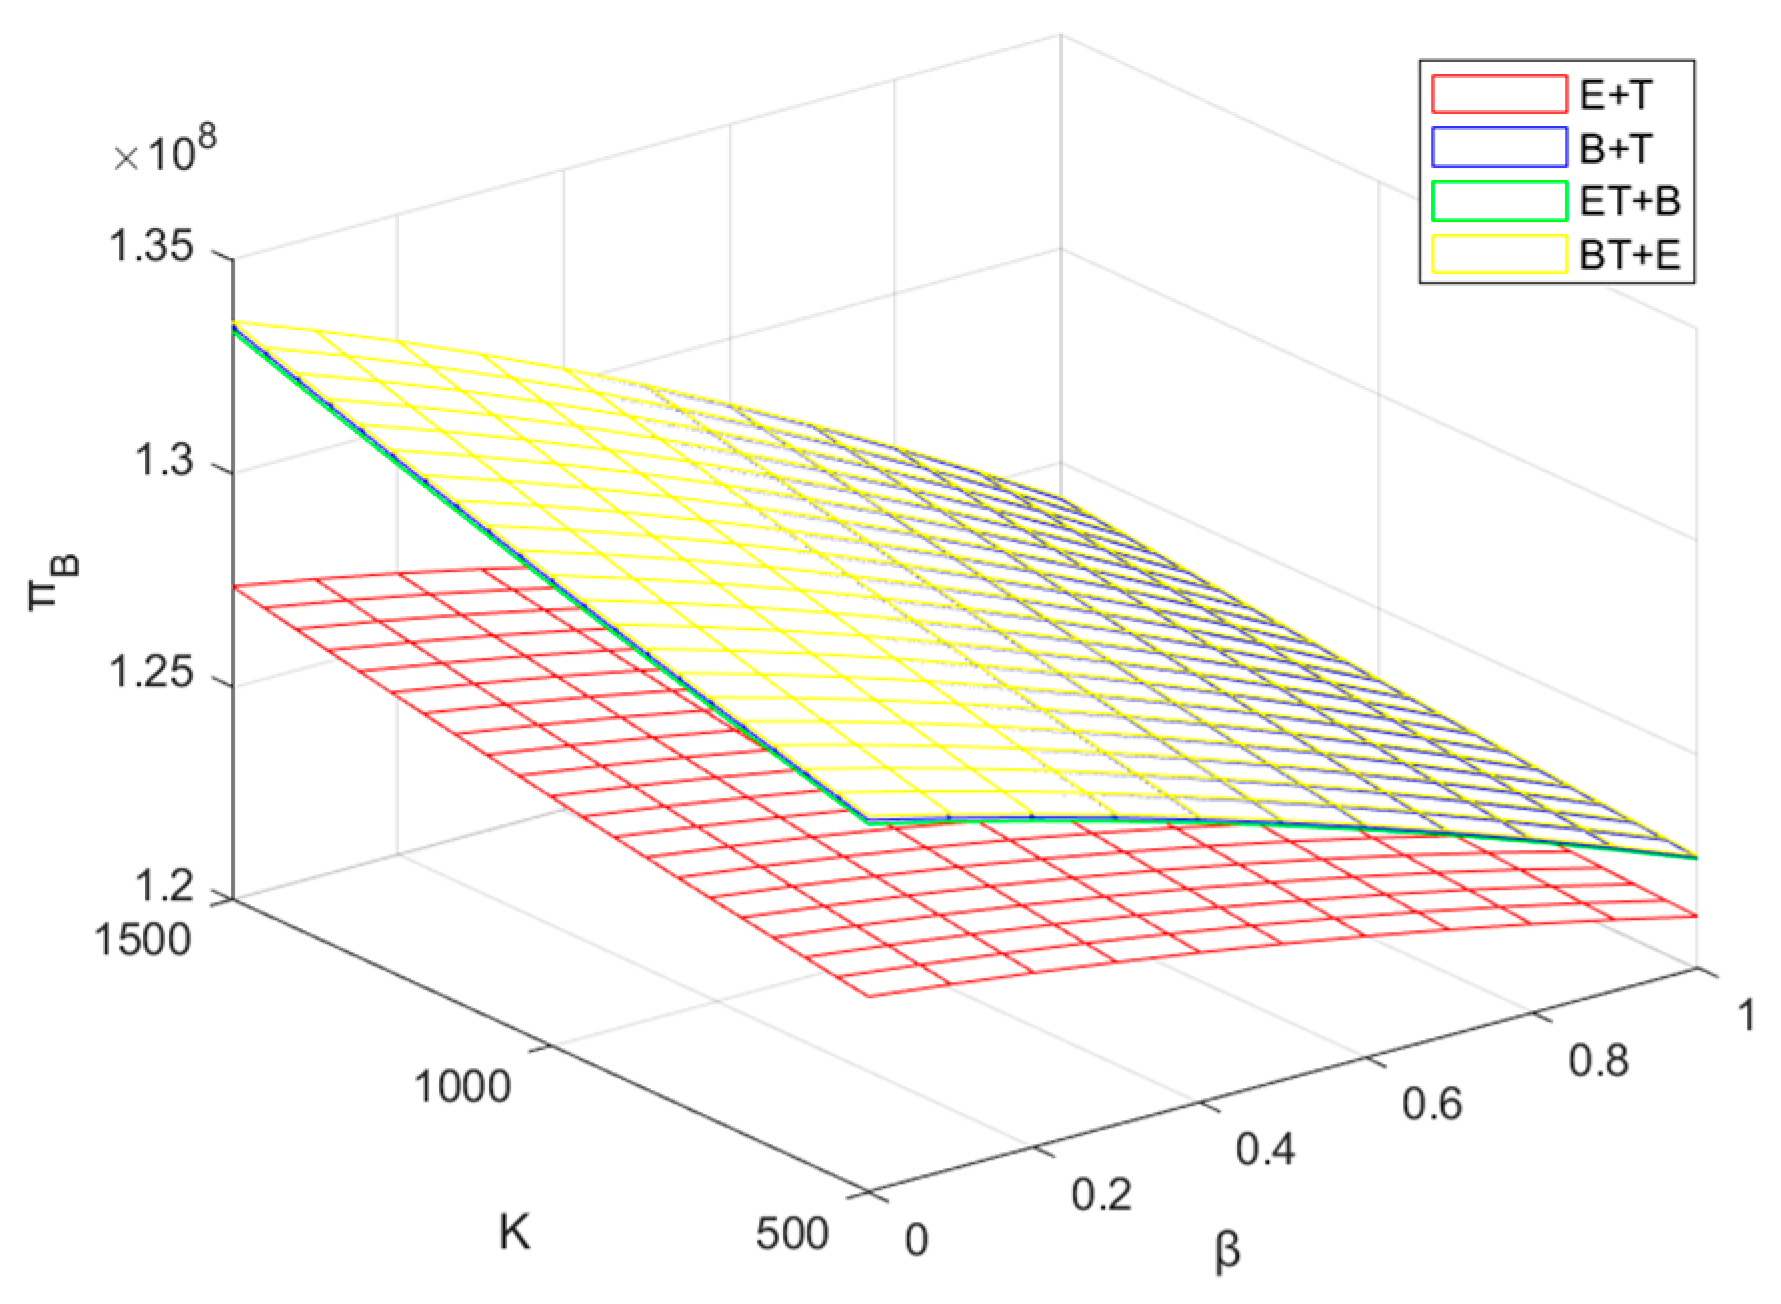
The sensitivity analysis of BM profits π B of different recovery modes regarding K , β , a , and b was conducted and the results are shown in Figure 14 and Figure 15. Since the profit of the BE+T mode is much higher than other modes and the trend is similar to that of the BT+E mode, it is not shown in the figure to better observe the trend.
Corollary 7. 
𝜕 π B 𝜕 K > 0 , 𝜕 π B 𝜕 β < 0 , 𝜕 π B 𝜕 b > 0 , and 𝜕 π B 𝜕 a > 0 . With the increase in government reward–penalty intensity, the BM’s profits also increase. Additionally, an increase in the quantity of power batteries voluntarily recycled by consumers and consumers’ sensitivity to recycling prices similarly boosts the BM’s profits. However, an increase in cross-price sensitivity leads to a decrease in the BM’s profits.
From Corollaries 2 and 6, we know that an increased reward–penalty intensity enhances the recycling enthusiasm of all recyclers in the reverse supply chain and improves the supply chain recycling rate. For the BM, a higher quantity of recycled power batteries means, on the one hand, more second-life utilization revenue and lower power battery production costs, and on the other hand, more rewards or fewer penalties—both of which contribute to profit growth for the BM. Analysis of the recycling rate shows that the recycling rates of all modes generally meet the target recycling rate in the reward–penalty mechanism. Therefore, the increase in reward–penalty intensity not only brings direct benefits to the BM but also indirectly promotes power battery recycling, further increasing the BM’s profits.
As an important factor affecting the recycling quantity, when all the prices are kept constant, the increase of cross-price sensitivity will firstly reduce the recycling quantity, which will lead to the decrease of the BM’s revenue from recycling activities. Additionally, the total profit will be reduced, which is the same for BMs in any recycling mode. In this case, the BM can buffer itself from the impact of increased competition by entering into partnerships with other enterprises in the supply chain to increase its competitiveness in the recycling competition. In addition, although the BM will be less affected if it does not participate in recycling, it can turn a loss into a profit if it enters the market in time. In contrast, an increase in the quantity of power batteries voluntarily recycled by consumers is the most direct way to increase recycling quantity, and an increase in consumers’ sensitivity to recycling prices can also lead to more power batteries being recycled without changing the recycling price. Both approaches can improve the BM’s recycling revenue. Therefore, for the BM, how to recycle more power batteries is a key issue if they want to gain more profit.

5.3. Profit Analysis of the EVM

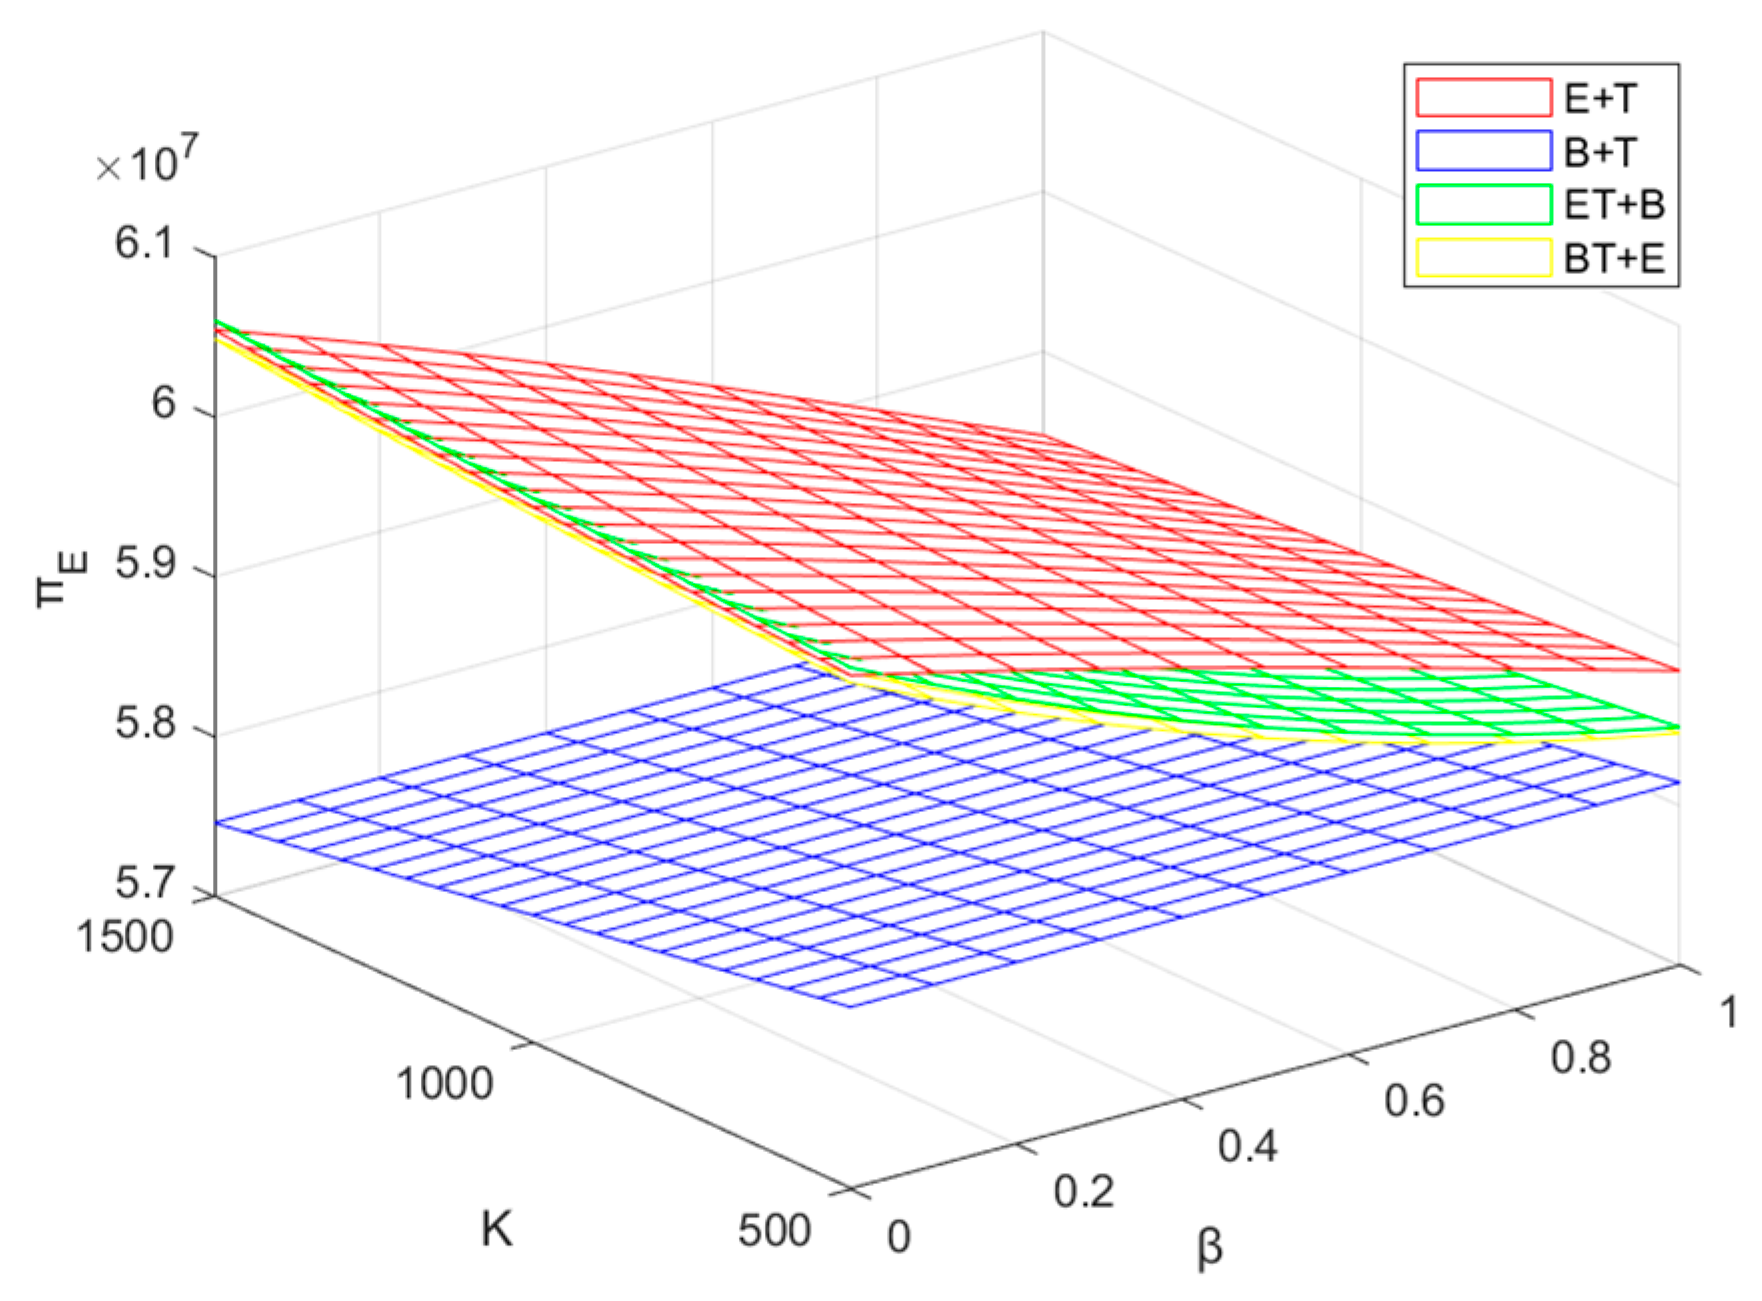
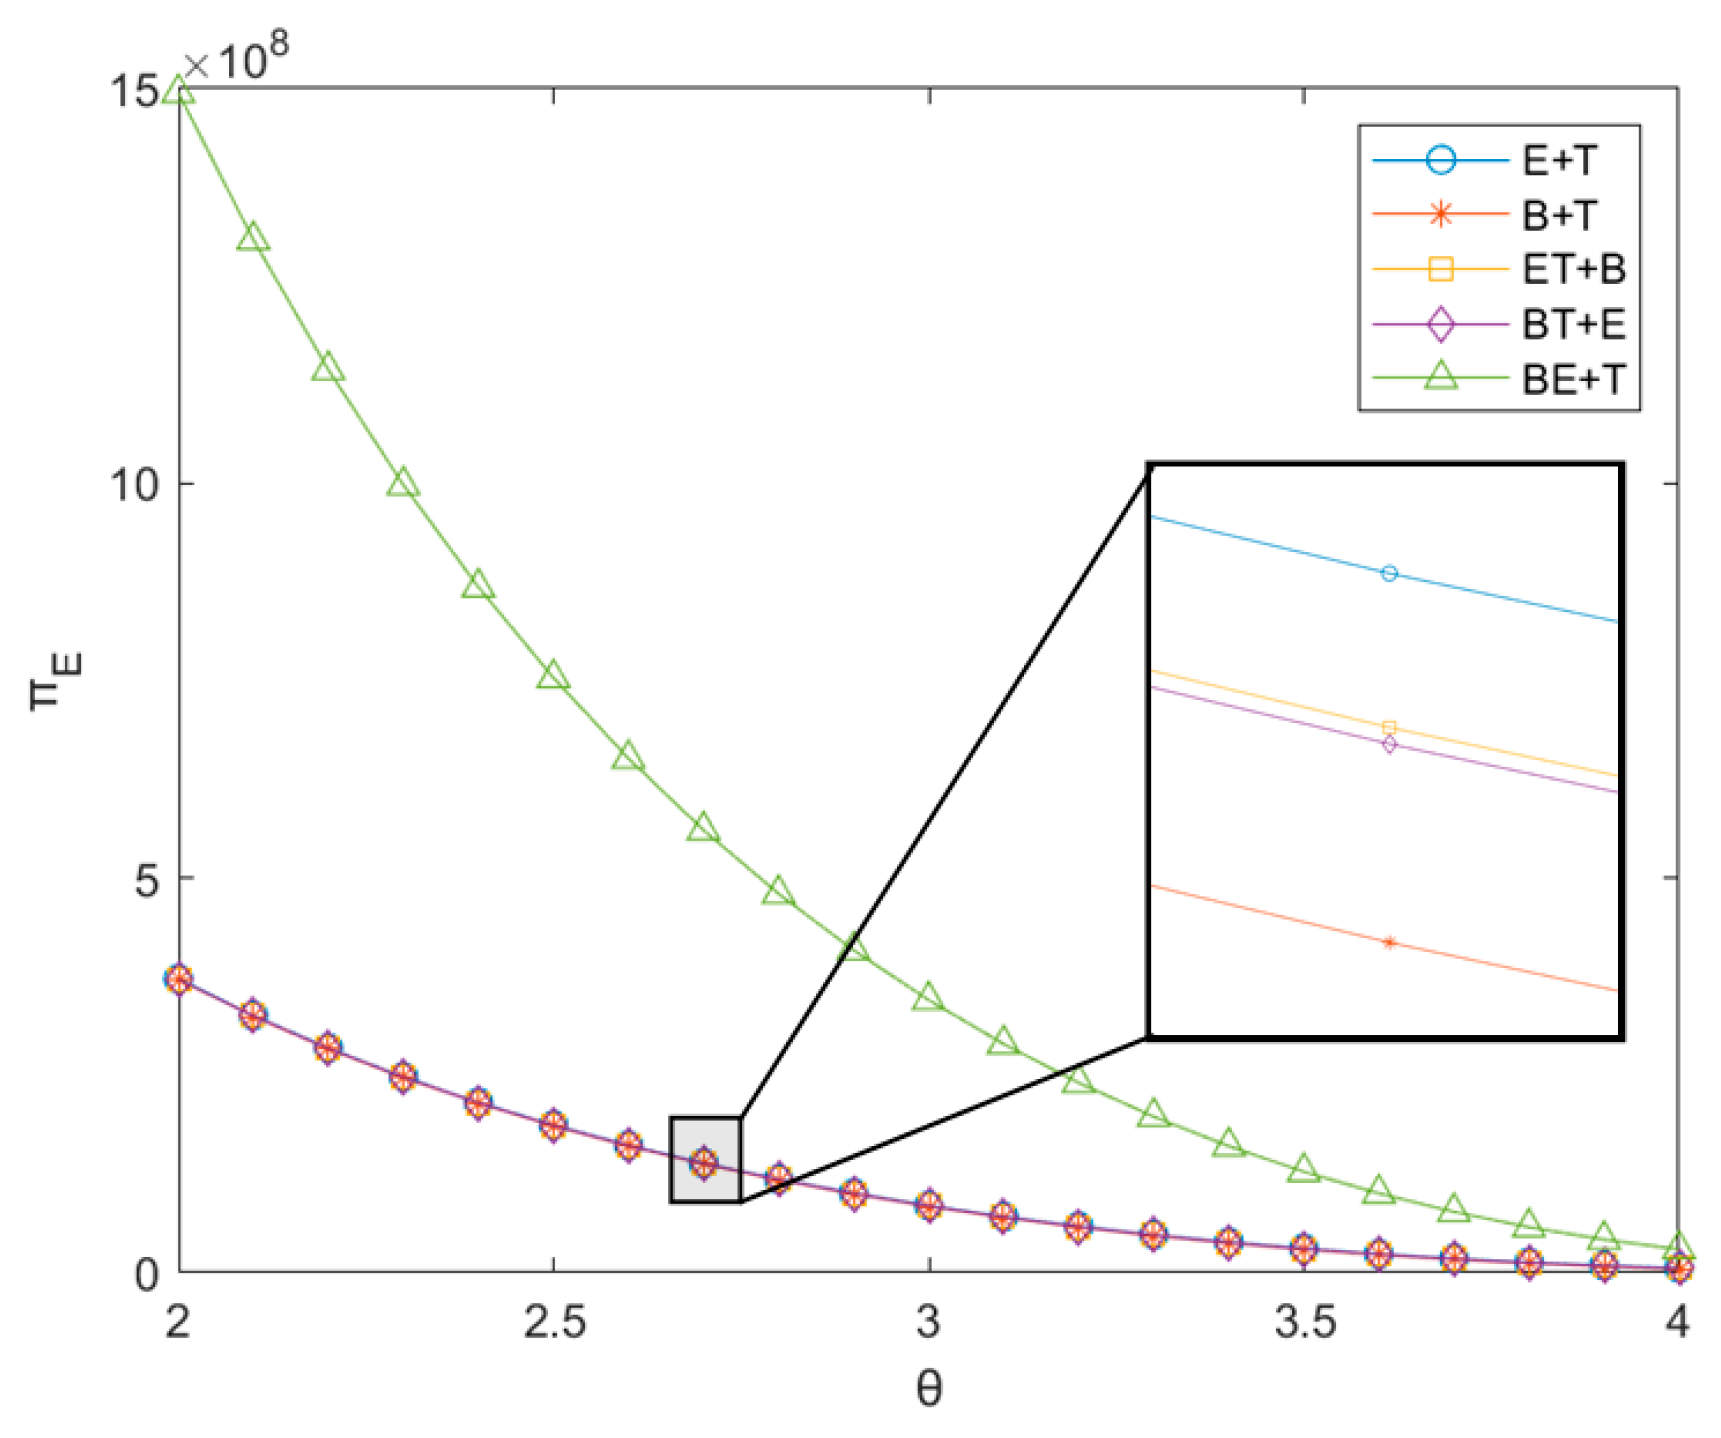
The EVM profits π E of different recycling modes regarding K , β , and θ are analyzed with sensitivity and the results are shown in Figure 16 and Figure 17. Since the profit of the BE+T mode is much higher than other modes and the trend is similar to that of the E + T mode, it is not shown in the figure to better observe the trend.
Corollary 8. 
𝜕 π E 𝜕 K > 0  (except B + T mode), 𝜕 π E 𝜕 β 0 , and 𝜕 π E 𝜕 θ < 0 . The increase in reward–penalty intensity will increase EVM profits to a certain extent, but this is only effective when the EVM participates in power battery recycling. Meanwhile, the increase in cross-price sensitivity as well as the increase in consumer sensitivity to the sales price of EVs will negatively affect EVM profits and lead to their decrease.
Although the change of reward–penalty intensity will have a direct impact on the BM, it will also indirectly transfer this impact to the EVM through the supply chain. According to Corollary 2, we can know that the increase of reward–penalty intensity will cause an increase of sales price and wholesale price, but at the same time it will lead to a decrease of sales volume. From the result, the overall profit of the EVM is increased in the end. However, when the EVM does not participate in the recycling competition, the increase of the reward–penalty intensity will instead decrease the profit of the EVM. From the expression of the optimal solution, it can be clearly seen that the skewness of the wholesale price with respect to the reward–penalty intensity is larger than that of the sales price, indicating that with the increase of the reward–penalty intensity, the difference between the sales price and the wholesale price will gradually become smaller, which, coupled with the decrease in the sales volume, will ultimately lead to a decrease in profit. It can be seen that recycling activity can bring more profit to the EVM to avoid the loss caused by the increase of the reward–penalty intensity to itself. However, an increase in cross-price sensitivity will in turn have a negative effect on the recycling activity, making it less profitable for the EVM, and this is the same situation as in Corollary 7. If the EVM does not participate in recycling competition, they will not be affected by changes in cross-price sensitivity. In addition to this, the sales of EVs, as the main means of profitability for the EVM, have the greatest impact on the profits of the EVM due to changes in their prices and quantities. When competition in the EV market intensifies, enterprises will control costs to sell EVs with lower selling prices in order to seize market share; for example, the emergence of the Xiaomi SU7 has impacted the sales of other brand EVs to a certain extent. At this time, consumers will be more picky about the price of the product due to the large number of products of the same type in the market. The same sales price will be less than the previous sales, so the profit will be reduced. Among all recycling modes, the EVM profit of the BE+T mode decreases most drastically with the increase of consumers’ sensitivity to the selling price, indicating that the effect of increased market competition on its profit is the most significant. Although this mode is not conducive to the EVM coping with the fast-changing market, it is still the most profitable recycling mode among all the recycling modes. If consumers are not sensitive to selling prices at this time, this mode can generate high profits for EVMs.

5.4. Profit Analysis of the TPR

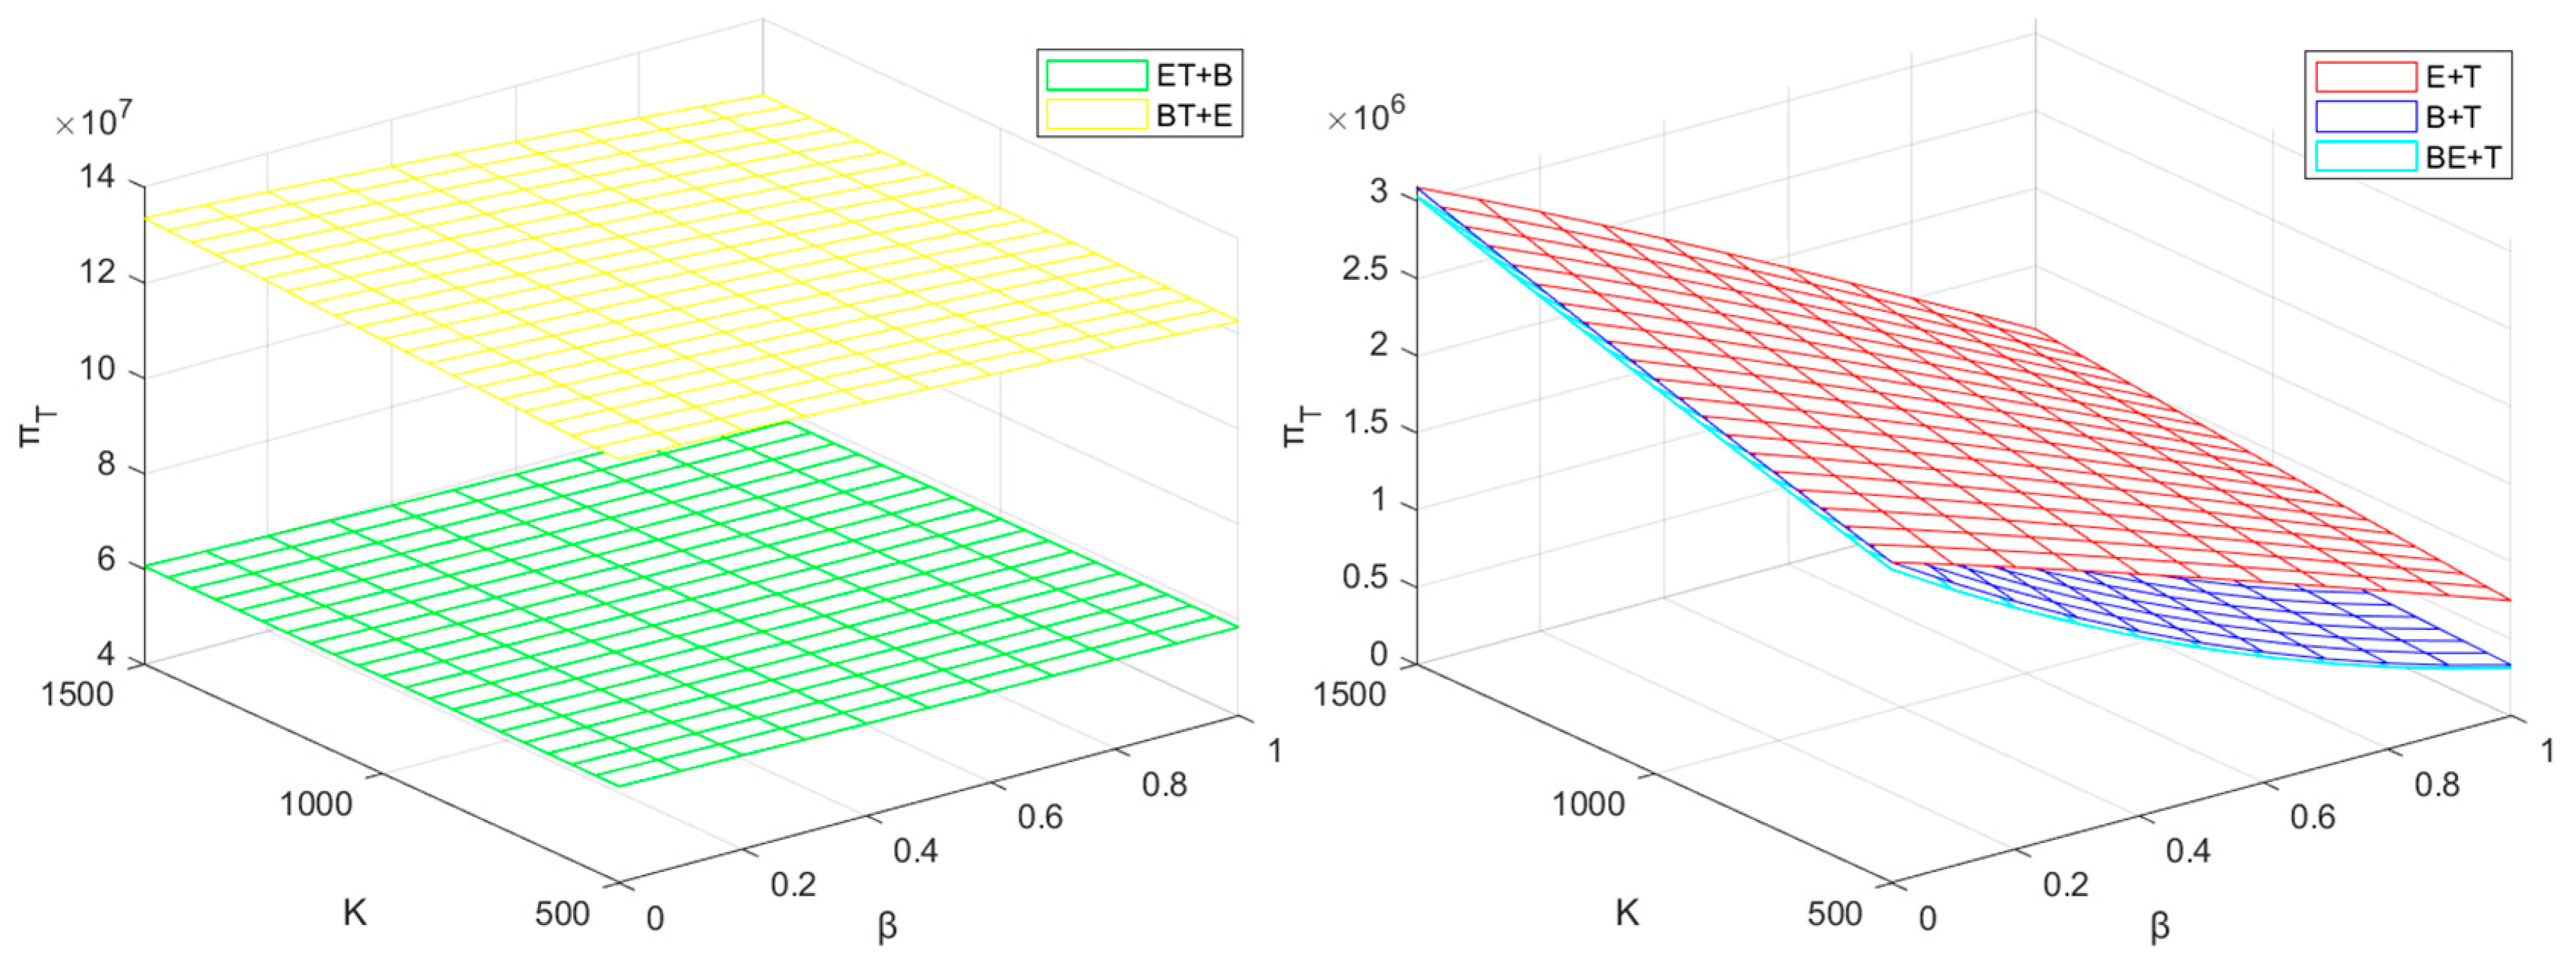
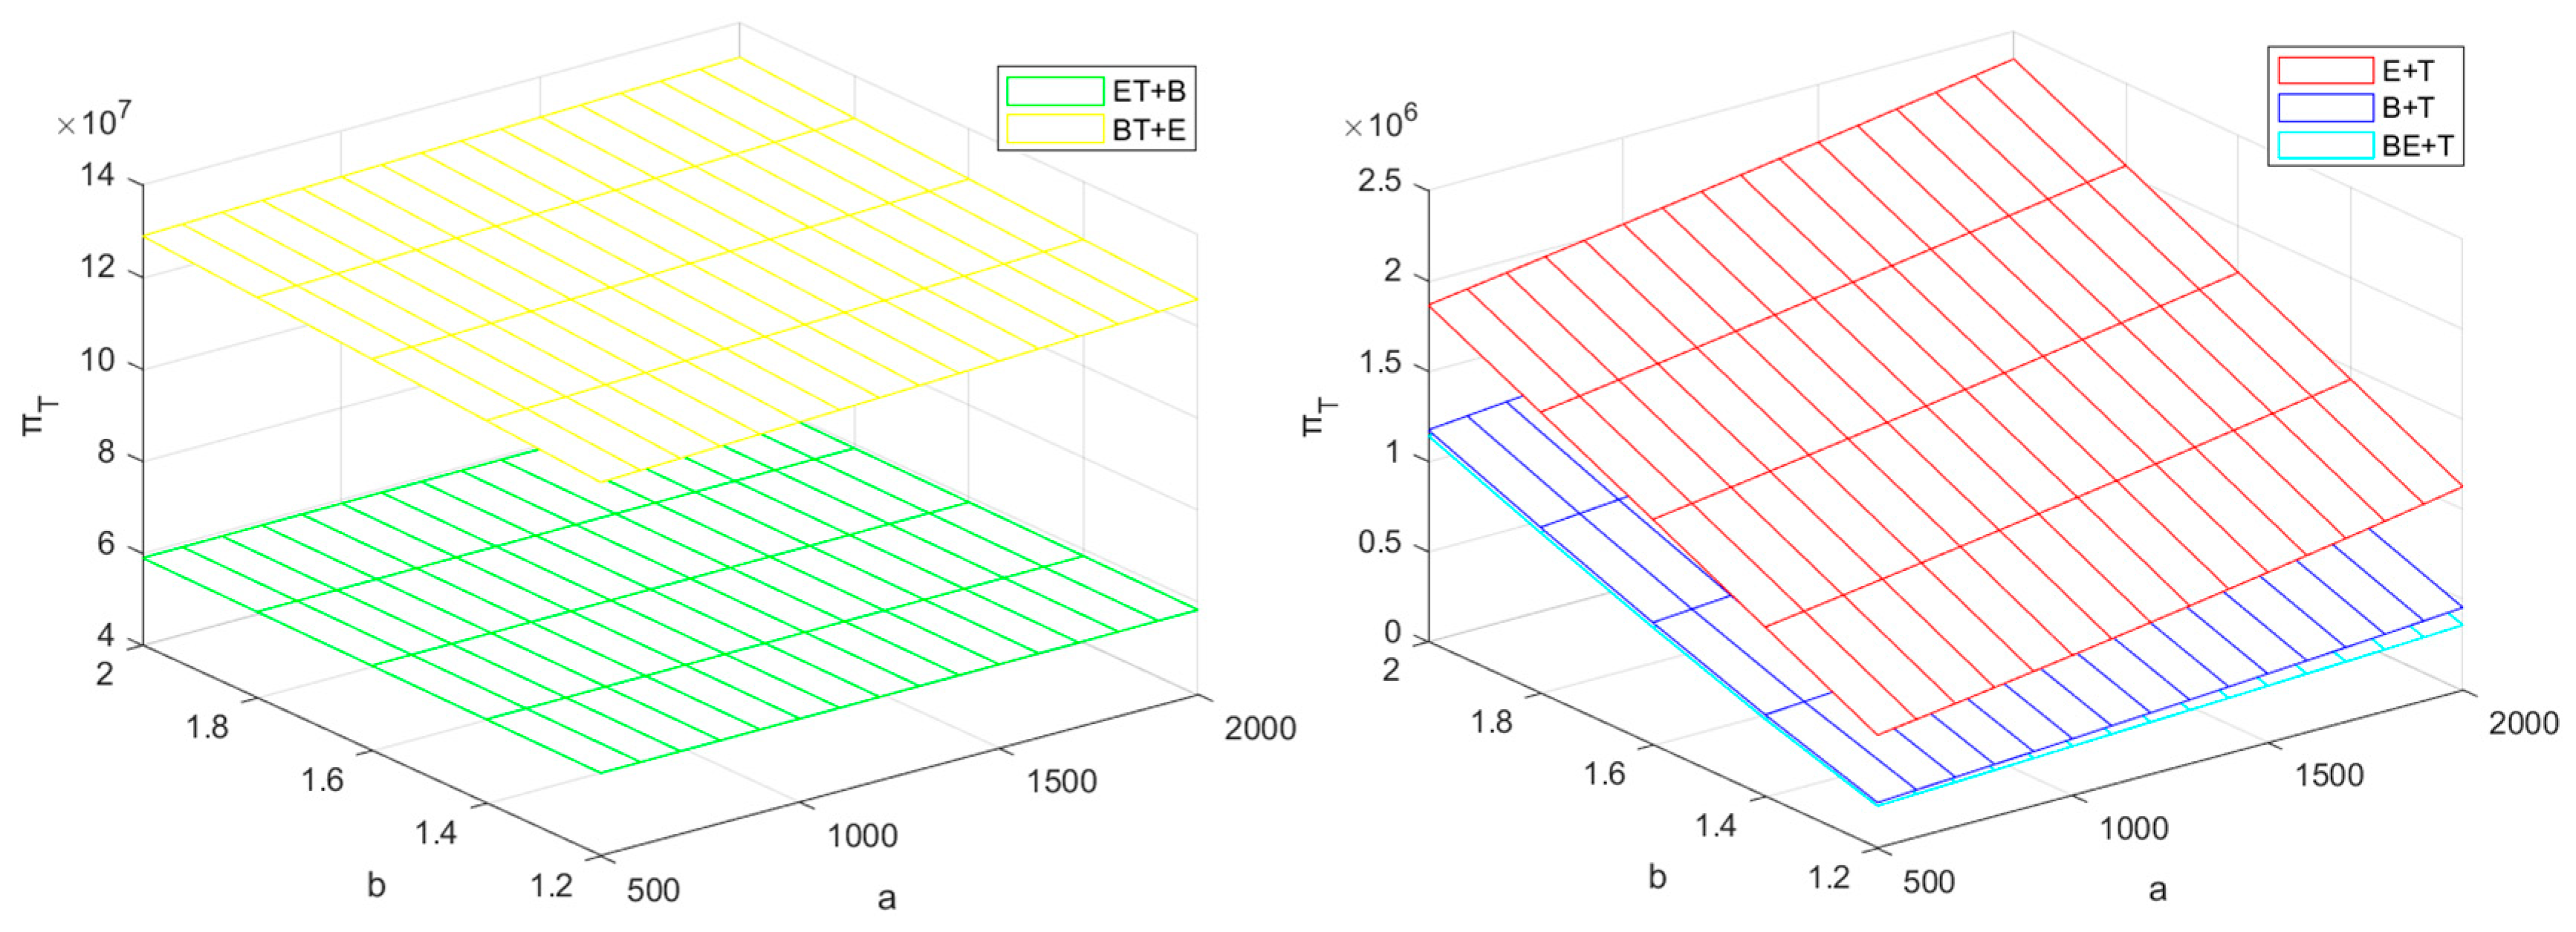
Sensitivity analysis of TPR profit π T regarding K , β , a , and b for different recycling modes is performed and the results are shown in Figure 18 and Figure 19.
Corollary 9. 
𝜕 π T 𝜕 K > 0 , 𝜕 π T 𝜕 β < 0 , 𝜕 π T 𝜕 a > 0 , and 𝜕 π T 𝜕 b > 0 . The profit of the TPR will increase with the increase of reward–penalty intensity. Since recycling of power batteries is the most important business and profit source of the TPR, and as known from Corollary 2, the BM will increase the transfer price accordingly when the reward–penalty intensity increases, this is undoubtedly a good time for the TPR to obtain more profits. In the case that the TPR does not change the recycling price, recycling the same amount of power batteries can obtain more revenue. Of course, as the main business of the TPR, in order to seize the market, the TPR will inevitably increase its own recycling price, so as to realize “higher volumes through lower margins”. In addition, cross-price sensitivity, the quantity of power batteries voluntarily recycled by consumers, and the sensitivity of consumers to recycling price are all key factors affecting the quantity and price of recycling. First of all, an increase in the quantity of power batteries voluntarily recycled by consumers can directly increase the quantity of power batteries recycled for any recycler. If the consumer’s sensitivity to recycling price also increases at this time, it will further increase the recycling quantity of the TPR. Of course, the TPR can appropriately reduce the recycling price to keep the recycling quantity unchanged in order to control the cost. From Corollary 7 and Corollary 8, it can be understood that the change of cross-price sensitivity seems to have an impact on the profit of any enterprise, including the TPR. The increase of cross-price sensitivity will increase the cost of the TPR to keep the recycling quantity stable, which will inevitably lead to some enterprises with less assets facing the problem of decreasing recycling quantity or even financial deficit, hindering the sustainable development of power battery recycling.

5.5. Recycling Price Analysis

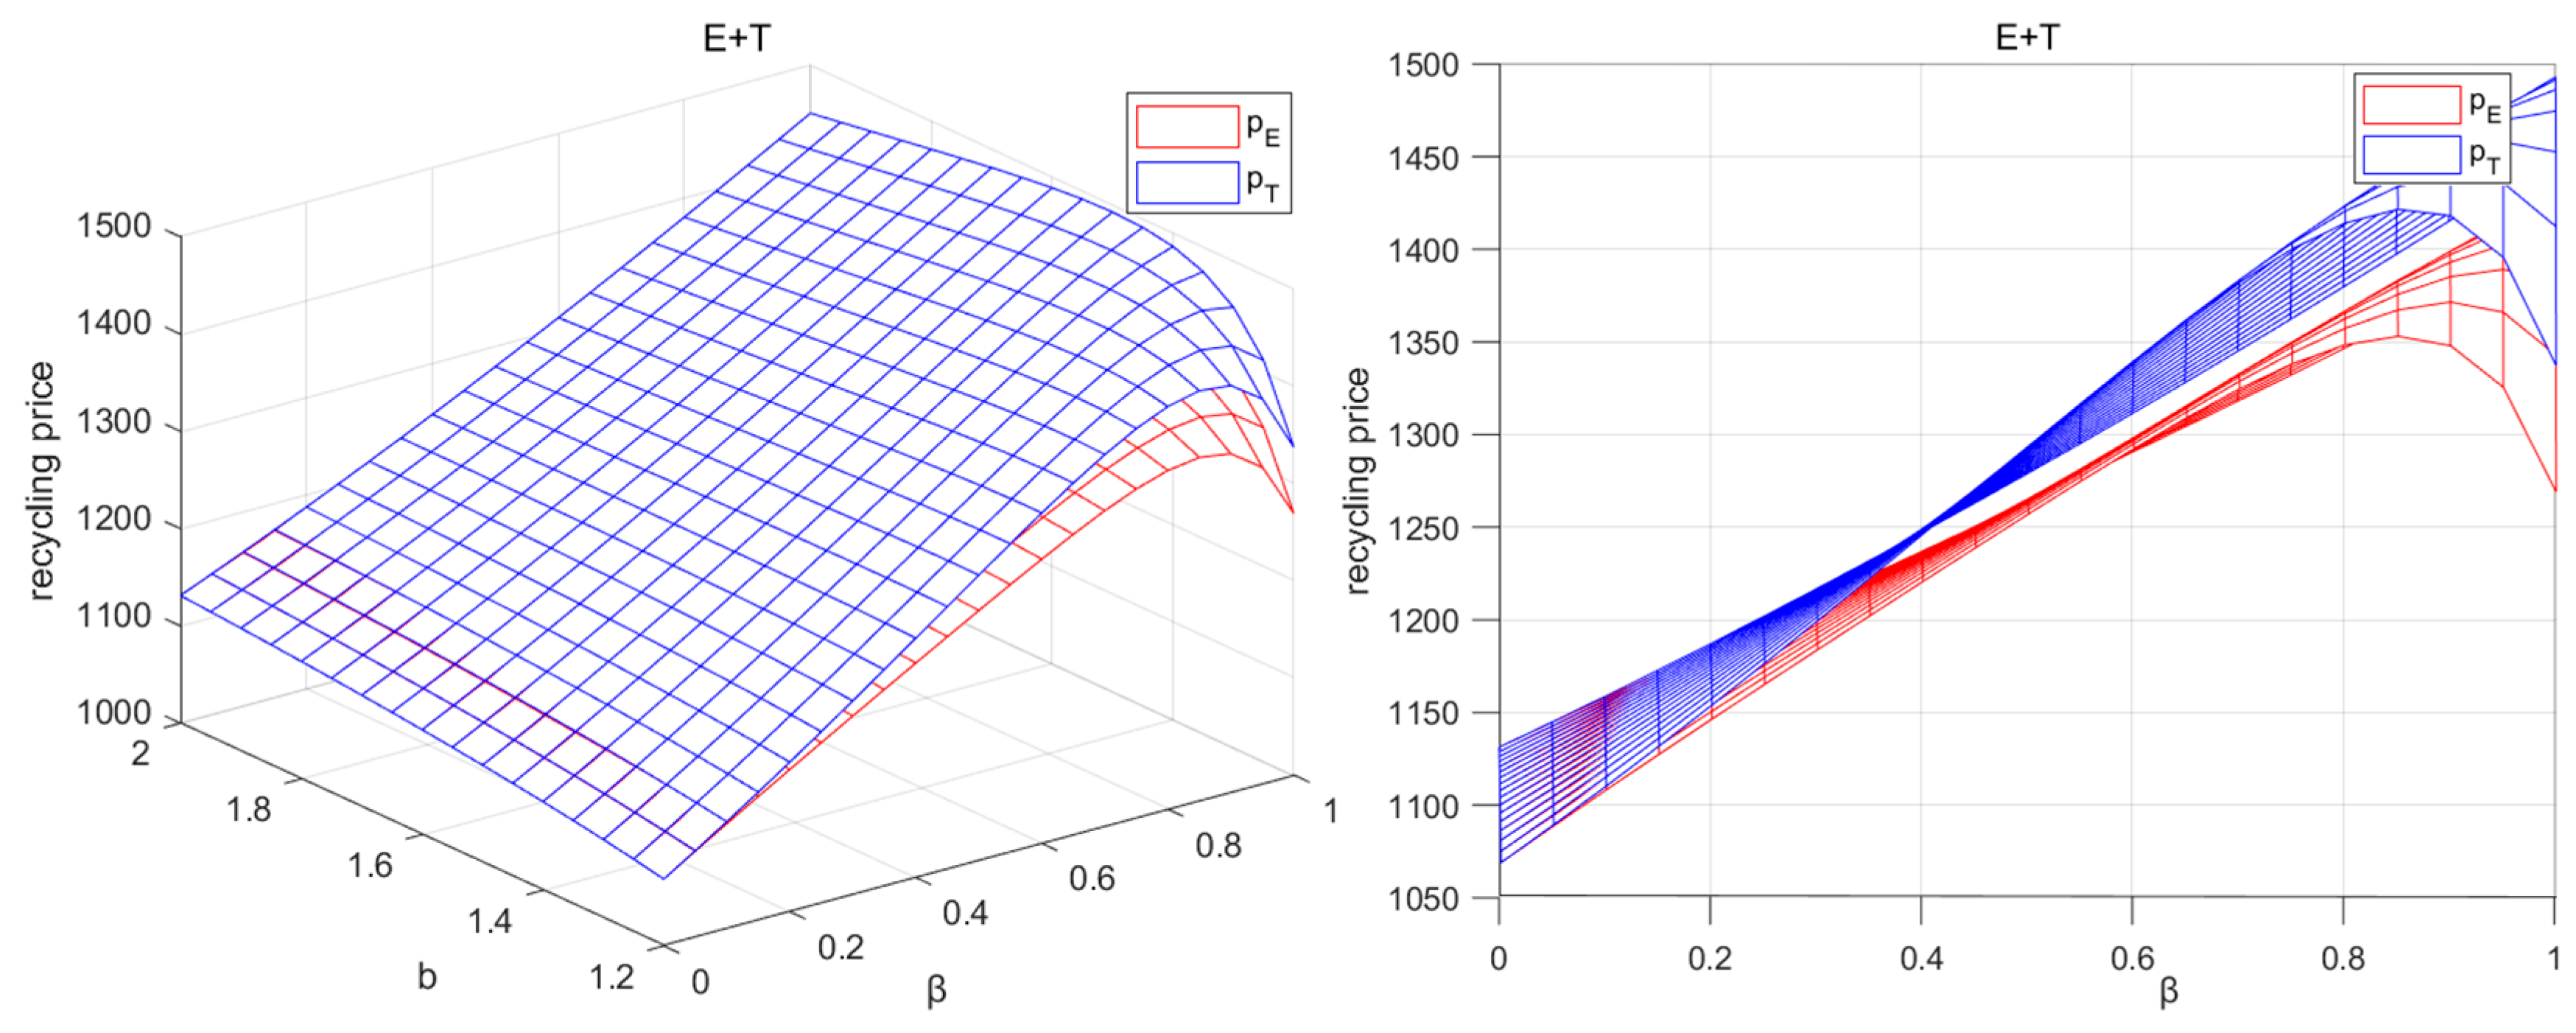
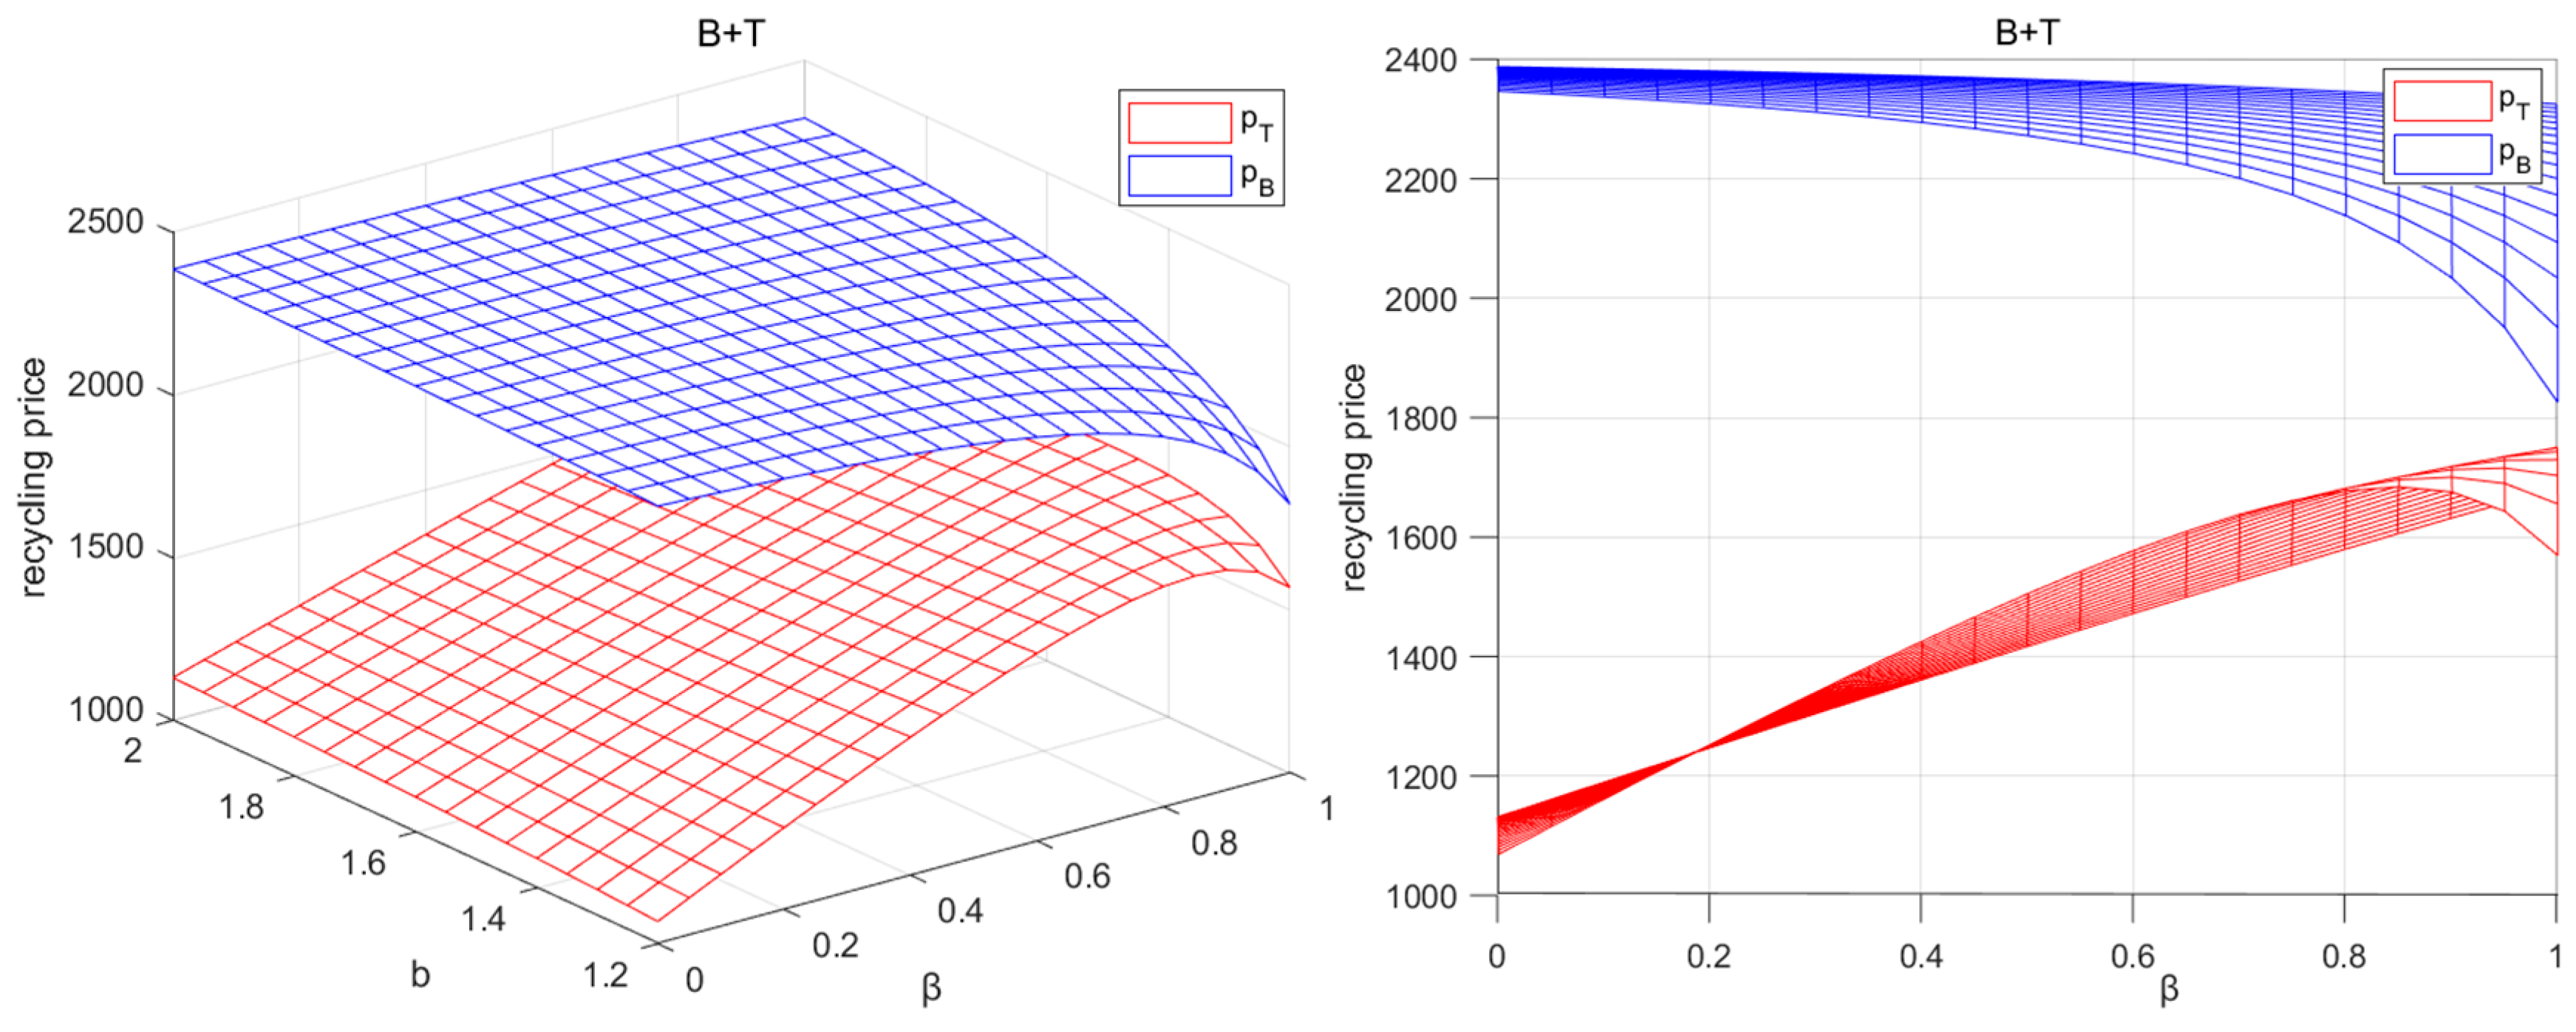
Since the recycling price of each recycling channel not only affects its own recycling volume, but also affects the recycling volume of other recycling channels, a sensitivity analysis of recycling price regarding cross-price sensitivity and consumer sensitivity to recycling price is conducted.
Corollary 10. 
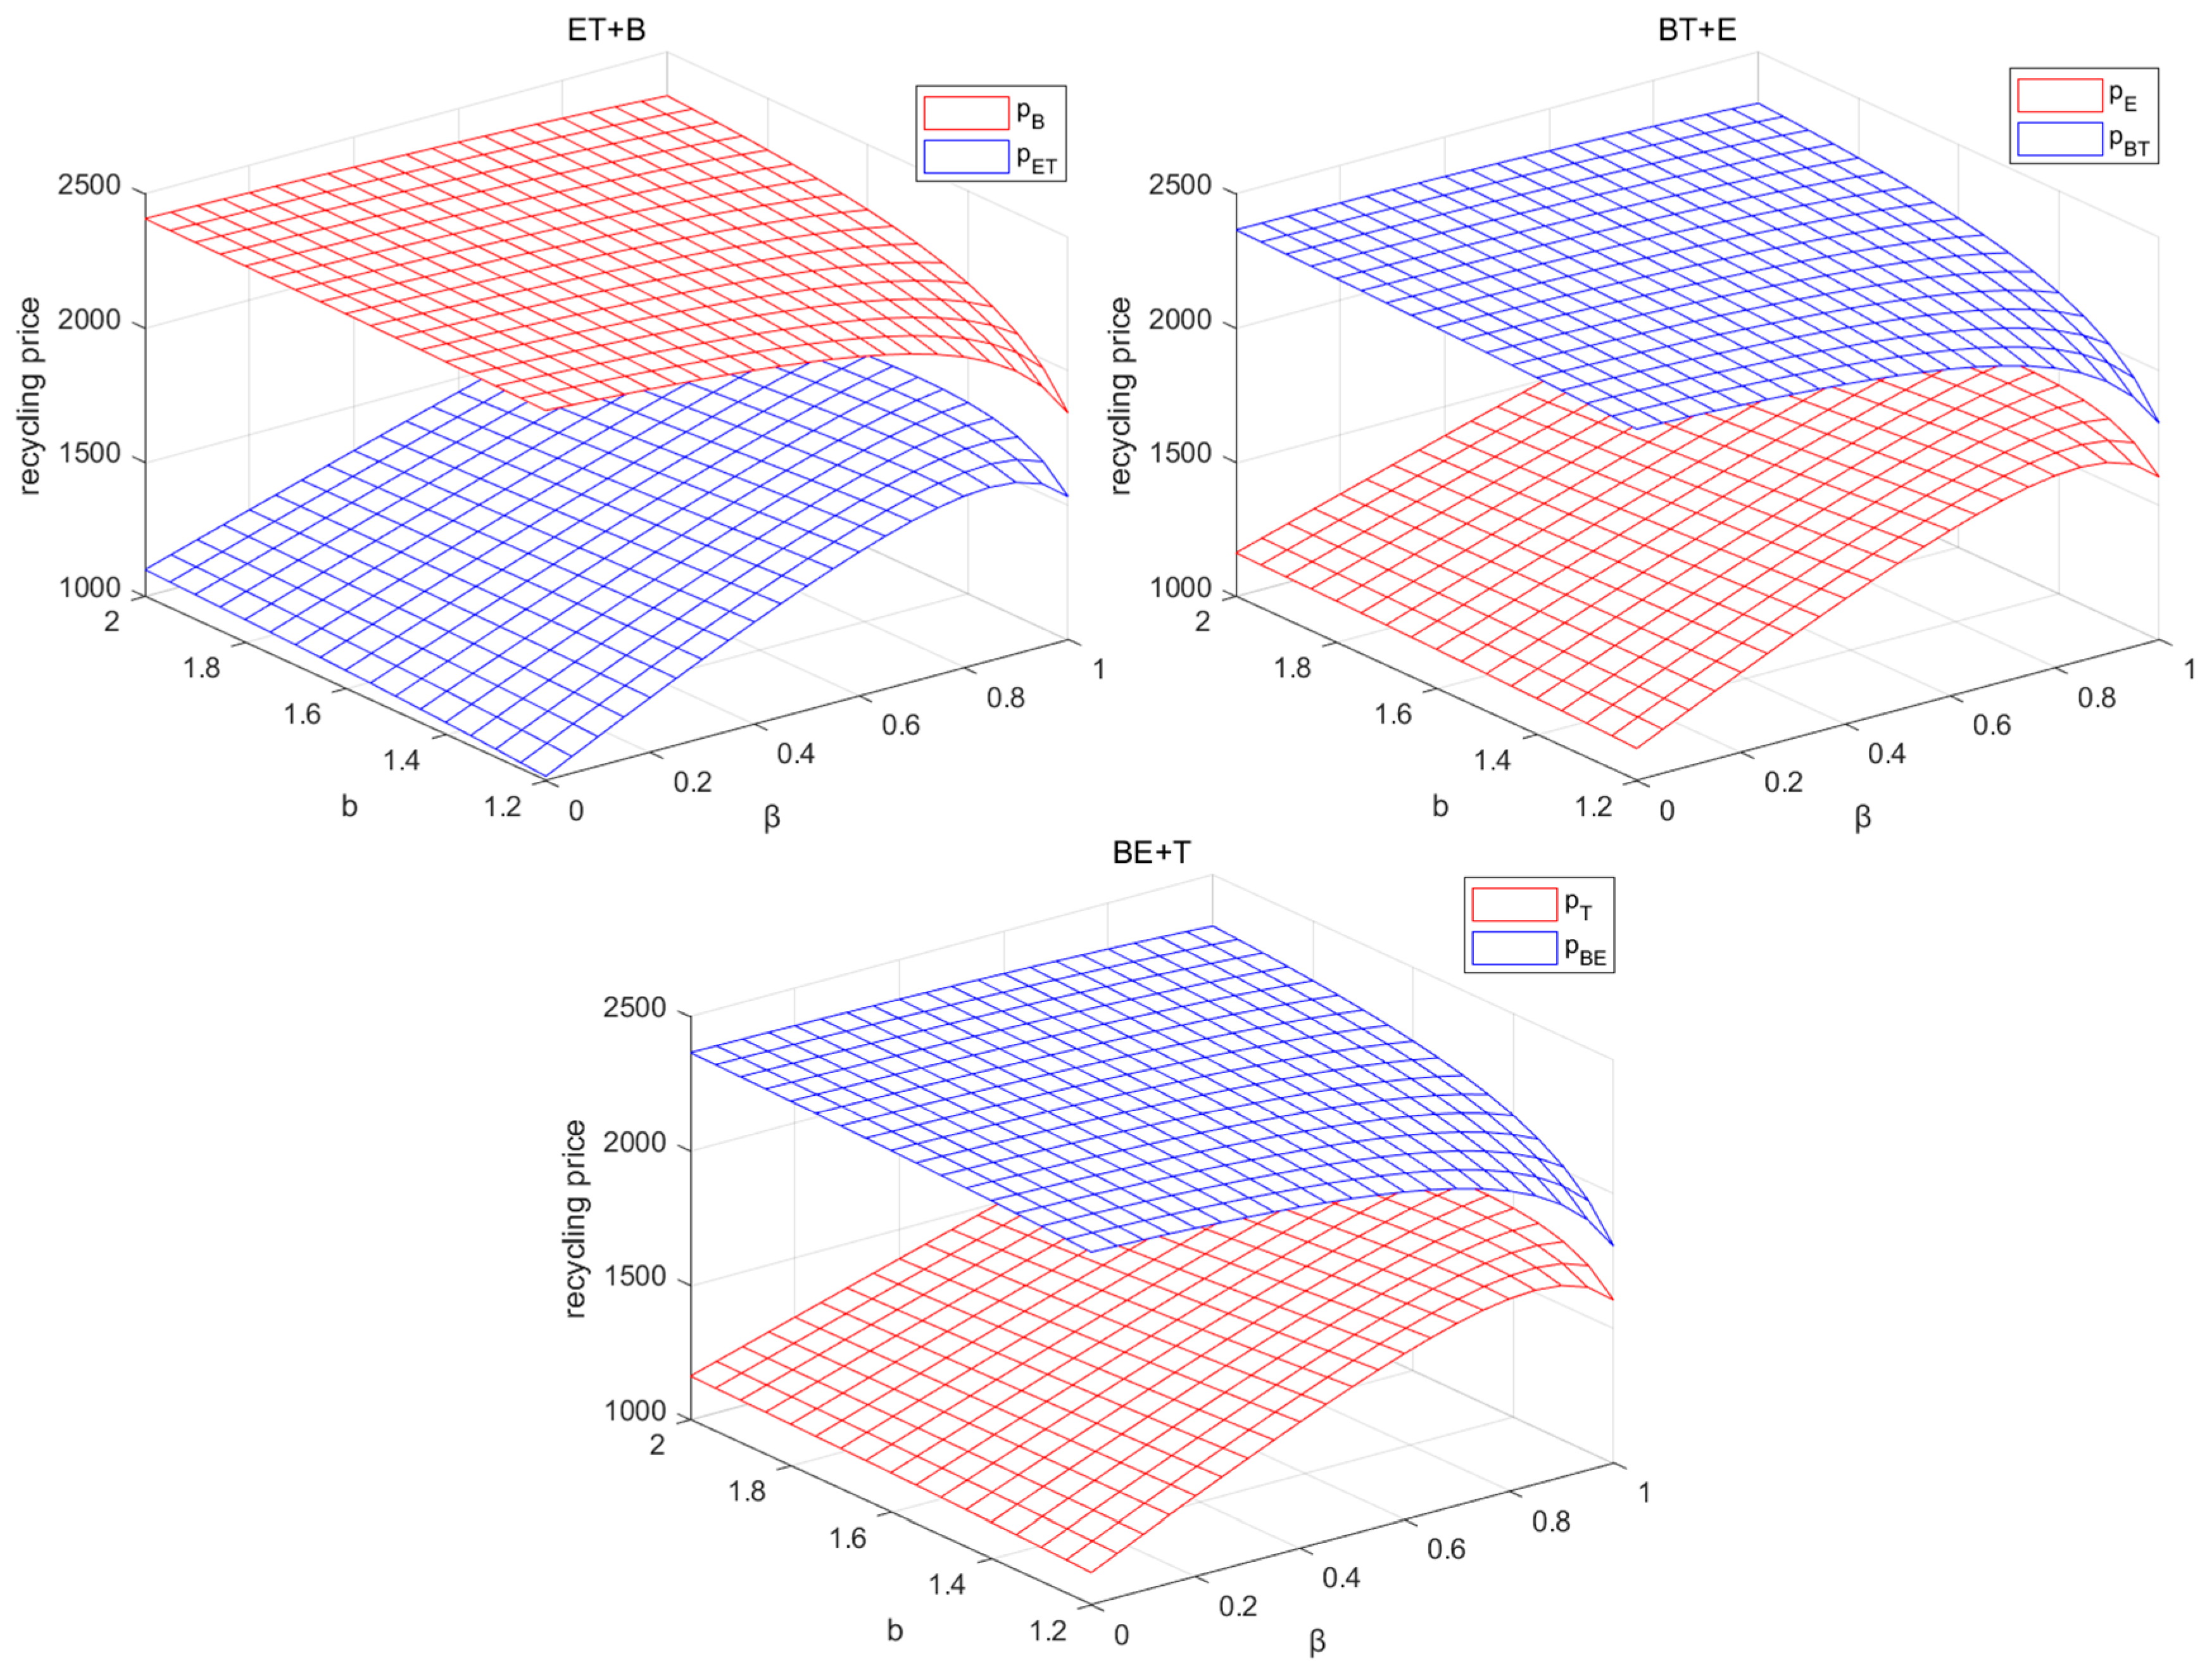
From Figure 20, Figure 21 and Figure 22, it can be seen that the recycling price changes across different recycling modes exhibit certain similarities, such as the patterns in the B + T, ET+B, BT+E, and BE+T modes. In the absence of cooperation, when the TPR and EVM compete in recycling, their recycling prices are relatively close and will increase with the rise of cross-price sensitivity. When the cross-price sensitivity exceeds a certain value, recycling prices switch from increasing with consumers’ sensitivity to recycling prices to decreasing with it; this phenomenon indicates that the recycler’s strategy began to shift from increasing the amount of recycling to controlling costs. However, when the TPR competes with the BM in recycling, the BM slightly reduces its own recycling price when the cross-price sensitivity increases. Compared with the TPR, which mainly focuses on recycling business, the BM will not significantly increase the recycling price in order to capture the market, but is more inclined to control its own recycling cost and purchase power batteries from other recyclers. However, according to Corollary 3, it can be seen that the BM transfer price is larger than the recycling price, so this practice will eventually lead to lower profits for the BM in Corollary 7. Additionally, when the cross-price sensitivity increases to a certain threshold, recycling becomes highly difficult for recyclers. At this point, recycling prices experience a cliff-like decline, necessitating that enterprises avoid vicious price competition to promote the normalization of the power battery recycling market environment. In addition, in the presence of cooperation, the BM, as the leader in the game, is always the recycling channel with the highest recycling price, and the recycling price will increase with the increase of consumers’ sensitivity to recycling prices and decrease with the increase of cross-price sensitivity.

6. Managerial Implications

Based on the above corollaries as well as the analysis, we can understand that the reward–penalty mechanism and recycling competition will affect the pricing of the CLSC and the profit of each member to a certain extent. However, there are some differences in the effects produced in different recycling modes. Therefore, the following management implications are given.
(1)
The reward–penalty mechanism, as an important tool for the government to regulate the market, needs to be reasonably adjusted according to the intensity of competition in the power battery recycling market and the government’s own financial capacity. In order to maintain the long-term incentive effect, the government can dynamically adjust reward–penalty amounts periodically, linking them to market conditions and enterprises’ performance, thereby promoting enterprises to continuously emphasize recycling work. Since increased cross-price sensitivity will intensify competition among recycling channels, the government can help recyclers mitigate the impact of increased competition on their own profits by appropriately increasing the reward–penalty intensity. Secondly, the government can also strengthen the standardized regulation of the industry to prevent informal recycling channels from disrupting the market with high prices. At the same time, it can encourage cooperation between enterprises in the field of recycling to achieve resource sharing or regional cooperation, so as to reduce vicious competition, improve the overall efficiency of recycling and corporate earnings, and establish a healthier market environment.
(2)
In order to maximize their own interests, enterprises responsible for power battery recycling must change their decision-making in a timely manner according to the changes in reward–penalty intensity of government. An increase in the reward–penalty intensity will cause the optimal recycling price, transfer price, and sales price in the CLSC to increase. Additionally, enterprises need to adjust their pricing in time to maximize their profit. Especially for the EVM, compared with other enterprises, when the reward–penalty intensity increases, the EVM needs to participate in power battery recycling as much as possible in order to avoid the formation of the B + T mode in the recycling market, which will cause its own profit loss.
(3)
Under the influence of recycling competition, recyclers participating in power battery recycling must consider the influence of channel competition intensity on themselves. Regardless of the recycling mode, the decrease in recycler profit caused by the increase in cross-price sensitivity is significant. In a competitive recycling market, it is often the best choice for recyclers to seek cooperation with other enterprises. The BM can maximize its profit by cooperating with the EVM in recycling, which on one hand can help the EVM to sell more EVs and thus gain more revenue, and on the other hand, this cooperation mode can help the BM to recycle the largest number of power batteries, which can bring more secondary utilization revenue for the BM in the laddering segment.
(4)
As a leader, the BM can recycle the most power batteries by cooperating with other enterprises, but it can choose different partners for different considerations. From the perspective of profit, cooperation with the EVM is the best choice. However, from the perspective of the recycling rate, cooperation with the TPR is the best choice. Although the BM can recycle the same amount of power batteries with both the EVM and TPR, we can see from the recycling rate that the BE+T mode sells more EVs than the BT+E mode, which further leads to a big difference in the additional profit created by cooperative recycling. This highlights the importance of the BM’s participation in cooperation to improve their profitability or recycling rate in the CLSC.
(5)
For the TPR, power battery recycling is its core business. The TPR needs to use data such as recycling price and recycling volume to assess the fluctuations in cross-price sensitivity and changes in consumer behavior that create uncertainty in the enterprise’s profitability. In the face of market competition, the TPR can moderately increase the recycling price on the basis of maintaining a reasonable profit to attract more sources of power batteries, and adopt the strategy of “higher volumes through lower margins” to stabilize the market share. At the same time, the TPR should pay close attention to the consumers’ response to recycling price in the market survey and dynamically adjust the recycling price to stimulate more consumers to participate in recycling. Especially when consumers’ sensitivity increases, lowering the recycling price or providing incentives will help further expand the recycling volume while effectively controlling costs.

7. Conclusions

For the power battery recycling pricing problem, considering recycling competition under the reward–penalty mechanism, this study constructs a three-level CLSC decision-making model consisting of the BM, EVM, TPR, and consumers. First, two independent recycling modes and three cooperative recycling modes with dual recycling channels are established, and Stackelberg game theory is used to solve the optimal recycling price, transfer price, and sales price of each recycling mode. Then, a comparative analysis of the optimal pricing decisions across different recycling modes is conducted to explore the impact of reward–penalty intensity on supply chain decisions. Finally, the real data are substituted into the equilibrium solution to compare the optimal recycling rate, recycling quantity, and optimal profit of each enterprise in different recycling modes. The sensitivity analyses of the recycling rate, BM, EVM, and TPR on the variables of reward–penalty intensity and cross-price sensitivity are carried out. The main conclusions can be summarized as follows:
(1)
The sales price of EVs and the wholesale price of power batteries in the forward supply chain will not change due to the change of recycling mode, but will be affected by the competitive relationship of enterprises in the forward supply chain.
(2)
As the reward–penalty intensity increases, the sales price, wholesale price, transfer price, recycling price, and the profit of each recycler in the CLSC will increase. At the same time, the recycling rate of power batteries is also improved. The recycling rate of the BT+E mode is always the highest.
(3)
No matter which recycling mode is used, the intensification of recycling competition will not only reduce the profit of each enterprise, but also cause the reduction of the recycling rate. The government can alleviate the loss this brings to the enterprises to a certain extent by appropriately increasing the reward–penalty intensity. When the competition is more intense, cooperation with other enterprises is often the best choice.
(4)
Cooperation between enterprises can inhibit the recycling quantities of other enterprises to a certain extent. The cooperation between the EVM and BM can not only increase the recycling quantities, but also increase the sales quantities of EVs, which will result in the reduction of the recycling rate.
(5)
The BM’s leadership in the supply chain is not only reflected in recycling, but also in profit, which is because participation in power battery recycling can bring more profit for the enterprise. Therefore, it is very important for other members of the supply chain to strive for cooperation with the leader in the supply chain if they want to obtain more profits.
The establishment of a power battery recycling system is precisely the concrete manifestation of the concept of sustainable development in the EV industry chain. Its core value lies in achieving the multidimensional unity of resource circulation, environmental governance, and industrial development. This paper studies the pricing strategy for sustainable recycling of power batteries under the reward–penalty mechanism while considering recycling competition, providing a theoretical basis for the sustainable operation of this system. A reasonable pricing strategy and reward–penalty mechanism can not only improve the efficiency of resource circulation but also reduce reliance on scarce minerals such as lithium, cobalt, and nickel through the recycling of retired battery materials, thereby lowering ecological and environmental risks. Meanwhile, cooperative models among enterprises can optimize the allocation of recycling resources, avoid efficiency losses caused by vicious competition, and provide support for the long-term sustainable development of the EV industry.
Naturally, different countries or regions have different policies regarding power battery recycling. For example, the EU-proposed Regulation on Batteries and Waste Batteries requires that the utilization rate of recycled materials in power batteries shall be no less than 12% by 2025, and enterprises failing to meet this standard will face a fine of 30% of the goods value. Although the reward–penalty mechanism discussed in this study is based on China’s power battery market, its impact on power battery recycling and its regulatory role in the recycling market provide certain reference significance for the formulation of global power battery recycling policies.
The CLSC decision-making model constructed in this study is a BM-led CLSC consisting of the BM, EVM, TPR, and consumer, whereas real-world power battery recycling may involve more enterprises and institutions. Moreover, this study only considered one policy, the reward–penalty mechanism, and did not consider other policies and the case of multiple policies in parallel. In addition, the game model studied in this paper is a static game model, which has not considered the dynamic changes in the market, supply chain, raw material prices, and the possible impact of the next cycle on the next cycle. Finally, the cooperation between enterprises lacks a coordinating mechanism to allocate profits and costs. Therefore, future research can refine the process of power battery recycling so that more related enterprises appear in the CLSC. Secondly, a cooperative coordination mechanism can be designed on the basis of this study to help the cooperative recycling to better allocate profits and costs. Finally, recycling pricing can be studied dynamically, taking into account the fluctuation of raw material prices of power batteries and other factors.

Author Contributions

Conceptualization, H.W.; Methodology, Z.Q.; Validation, H.W.; Investigation, H.W.; Data curation, Z.Q.; Writing—original draft, H.W. and Z.Q.; Writing—review & editing, H.W. and Z.Q.; Visualization, Z.Q.; Supervision, H.W.; Funding acquisition, H.W. All authors have read and agreed to the published version of the manuscript.

Funding

This work was supported by the Humanities and Social Sciences Research Project of the Ministry of Education of China (No. 22YJC630153).

Institutional Review Board Statement

Not applicable.

Informed Consent Statement

Not applicable.

Data Availability Statement

The original contributions presented in this study are included in the article. Further inquiries can be directed to the corresponding author.

Conflicts of Interest

The authors declare no conflict of interest.

References

  1. Fang, L.; Li, Y.; Govindan, K. Entry mode selection for a new entrant of the electric vehicle automaker. Eur. J. Oper. Res. 2024, 313, 270–280. [Google Scholar] [CrossRef]
  2. Ahmadi, L.; Yip, A.; Fowler, M.; Young, S.B.; Fraser, R.A. Environmental feasibility of re-use of electric vehicle batteries. Sustain. Energy Technol. Assess. 2014, 6, 64–74. [Google Scholar] [CrossRef]
  3. Gu, H.; Liu, Z.; Qing, Q. Optimal electric vehicle production strategy under subsidy and battery recycling. Energy Policy 2017, 109, 579–589. [Google Scholar] [CrossRef]
  4. Wu, W.; Cong, N.; Zhang, X.; Yue, Q.; Zhang, M. Life cycle assessment and carbon reduction potential prediction of electric vehicles batteries. Sci. Total Environ. 2023, 903, 166620. [Google Scholar] [CrossRef]
  5. Chen, M.; Zheng, Z.; Wang, Q.; Zhang, Y.; Ma, X.; Shen, C.; Xu, D.; Liu, J.; Liu, Y.; Gionet, P.; et al. Closed loop recycling of electric vehicle batteries to enable ultra-high quality cathode powder. Sci. Rep. 2019, 9, 1654. [Google Scholar] [CrossRef] [PubMed]
  6. Sathre, R.; Scown, C.D.; Kavvada, O.; Hendrickson, T.P. Energy and climate effects of second-life use of electric vehicle batteries in California through 2050. J. Power Sources 2015, 288, 82–91. [Google Scholar] [CrossRef]
  7. Wang, L.; Wang, X.; Yang, W. Optimal design of electric vehicle battery recycling network–From the perspective of electric vehicle manufacturers. Appl. Energy 2020, 275, 115328. [Google Scholar] [CrossRef]
  8. Wu, W.; Zhang, M.; Jin, D.; Ma, P.; Wu, W.; Zhang, X. Decision-making analysis of electric vehicle battery recycling under different recycling models and deposit-refund scheme. Comput. Ind. Eng. 2024, 191, 110109. [Google Scholar] [CrossRef]
  9. Zhang, M.; Wu, W.; Song, Y. Study on the impact of government policies on power battery recycling under different recycling models. J. Clean. Prod. 2023, 413, 137492. [Google Scholar] [CrossRef]
  10. Zhou, W.; Zheng, Y.; Huang, W. Competitive advantage of qualified WEEE recyclers through EPR legislation. Eur. J. Oper. Res. 2017, 257, 641–655. [Google Scholar] [CrossRef]
  11. Wang, W.; Zhang, Y.; Zhang, K.; Bai, T.; Shang, J. Reward–penalty mechanism for closed-loop supply chains under responsibility-sharing and different power structures. Int. J. Prod. Econ. 2015, 170, 178–190. [Google Scholar] [CrossRef]
  12. Lehmann, P. Justifying a policy mix for pollution control: A review of economic literature. J. Econ. Surv. 2012, 26, 71–97. [Google Scholar] [CrossRef]
  13. Wang, W.; Zhang, Y.; Fan, L.; He, L.; Da, Q. Research on the premium and penalty mechanism of the reverse supply chain considering various goals of government. Chin. J. Manag. Sci. 2015, 23, 68–76. [Google Scholar] [CrossRef]
  14. Tang, Y.; Zhang, Q.; Li, Y.; Wang, G.; Li, Y. Recycling mechanisms and policy suggestions for spent electric vehicles’ power battery-A case of Beijing. J. Clean. Prod. 2018, 186, 388–406. [Google Scholar] [CrossRef]
  15. Narang, P.; De, P.K.; Lim, C.P.; Kumari, M. Optimal recycling model selection in a closed-loop supply chain for electric vehicle batteries under carbon cap-trade and reward-penalty policies using the Stackelberg game. Comput. Ind. Eng. 2024, 196, 110512. [Google Scholar] [CrossRef]
  16. Xiao, M.; Xu, C.; Xie, F. Research on the impact of information sharing and government subsidy on competitive power battery recycling. J. Clean. Prod. 2024, 467, 142989. [Google Scholar] [CrossRef]
  17. Liu, Q.; Zhu, X. Incentive strategies for retired power battery closed-loop supply chain considering corporate social responsibility. Environ. Dev. Sustain. 2024, 26, 19013–19050. [Google Scholar] [CrossRef]
  18. Zhang, C.; Tian, Y.X.; Han, M.H. Recycling mode selection and carbon emission reduction decisions for a multi-channel closed-loop supply chain of electric vehicle power battery under cap-and-trade policy. J. Clean. Prod. 2022, 375, 134060. [Google Scholar] [CrossRef]
  19. Savaskan, R.C.; Bhattacharya, S.; Van Wassenhove, L.N. Closed-loop supply chain models with product remanufacturing. Manag. Sci. 2004, 50, 239–252. [Google Scholar] [CrossRef]
  20. Yu, H.; Mi, J.; Xu, N. Recycling, pricing decisions, and coordination in the dual-channel closed-loop supply chain: A dynamic perspective. J. Clean. Prod. 2024, 456, 142297. [Google Scholar] [CrossRef]
  21. Song, H.; Zhang, J.; Li, J. The impacts of subsidy strategies and recycling modes on the closed-loop supply chain. Manag. Decis. Econ. 2022, 43, 4106–4123. [Google Scholar] [CrossRef]
  22. Zhao, X.; Peng, B.; Zheng, C.; Wan, A. Closed-loop supply chain pricing strategy for electric vehicle batteries recycling in China. Environ. Dev. Sustain. 2022, 24, 7725–7752. [Google Scholar] [CrossRef]
  23. Sun, Q.; Chen, H.; Long, R.; Li, Q.; Huang, H. Comparative evaluation for recycling waste power batteries with different collection modes based on Stackelberg game. J. Environ. Manag. 2022, 312, 114892. [Google Scholar] [CrossRef] [PubMed]
  24. Penkovskii, A.; Stennikov, V.; Mednikova, E.; Postnikov, I. Search for a market equilibrium of Cournot-Nash in the competitive heat market. Energy 2018, 161, 193–201. [Google Scholar] [CrossRef]
  25. Wang, Z.; Hou, H.; Wei, R.; Li, Z. A Distributed Market-Aided Restoration Approach of Multi-Energy Distribution Systems Considering Comprehensive Uncertainties from Typhoon Disaster. IEEE Trans. Smart Grid 2025. [Google Scholar] [CrossRef]
  26. Wu, C.; Zhou, D.; Lin, X.; Wei, F.; Chen, C.; Ma, Y.; Huang, Y.; Li, Z.; Dawoud, S.M. A novel energy cooperation framework for community energy storage systems and prosumers. Int. J. Electr. Power Energy Syst. 2022, 134, 107428. [Google Scholar] [CrossRef]
  27. Chen, J.; Zhang, W.; Gong, B.; Zhang, X.; Li, H. Optimal policy for the recycling of electric vehicle retired power batteries. Technol. Forecast. Soc. Change 2022, 183, 121930. [Google Scholar] [CrossRef]
  28. Tang, Y.; Zhang, Q.; Li, Y.; Li, H.; Pan, X.; Mclellan, B. The social-economic-environmental impacts of recycling retired EV batteries under reward-penalty mechanism. Appl. Energy 2019, 251, 113313. [Google Scholar] [CrossRef]
  29. Li, X.; Du, J.; Liu, P.; Wang, C.; Hu, X.; Ghadimi, P. Optimal choice of power battery joint recycling strategy for electric vehicle manufacturers under a deposit-refund system. Int. J. Prod. Res. 2023, 61, 7281–7301. [Google Scholar] [CrossRef]
  30. Zhang, Q.; Tang, Y.; Bunn, D.; Li, H.; Li, Y. Comparative evaluation and policy analysis for recycling retired EV batteries with different collection modes. Appl. Energy 2021, 303, 117614. [Google Scholar] [CrossRef]
  31. Zhou, Y.; Zhang, Y.; Wahab, M.I.M.; Goh, M. Channel leadership and performance for a closed-loop supply chain considering competition. Transp. Res. Part E Logist. Transp. Rev. 2023, 175, 103151. [Google Scholar] [CrossRef]
  32. Garg, A.; Yun, L.; Gao, L.; Putungan, D.B. Development of recycling strategy for large stacked systems: Experimental and machine learning approach to form reuse battery packs for secondary applications. J. Clean. Prod. 2020, 275, 124152. [Google Scholar] [CrossRef]
  33. Wang, N.; He, Q.; Jiang, B. Hybrid closed-loop supply chains with competition in recycling and product markets. Int. J. Prod. Econ. 2019, 217, 246–258. [Google Scholar] [CrossRef]
  34. Liu, K.; Wang, C. Production and recycling of new energy vehicle power batteries under channel encroachment and government subsidy. Environ. Dev. Sustain. 2024, 26, 1313–1339. [Google Scholar] [CrossRef]
  35. Liu, L.; Wang, Z.; Xu, L.; Hong, X.; Govindan, K. Collection effort and reverse channel choices in a closed-loop supply chain. J. Clean. Prod. 2017, 144, 492–500. [Google Scholar] [CrossRef]
  36. Zhu, L.; Zhang, Q.; Lu, H.; Li, H.; Li, Y.; McLellan, B.; Pan, X. Study on crowdfunding’s promoting effect on the expansion of electric vehicle charging piles based on game theory analysis. Appl. Energy 2017, 196, 238–248. [Google Scholar] [CrossRef]
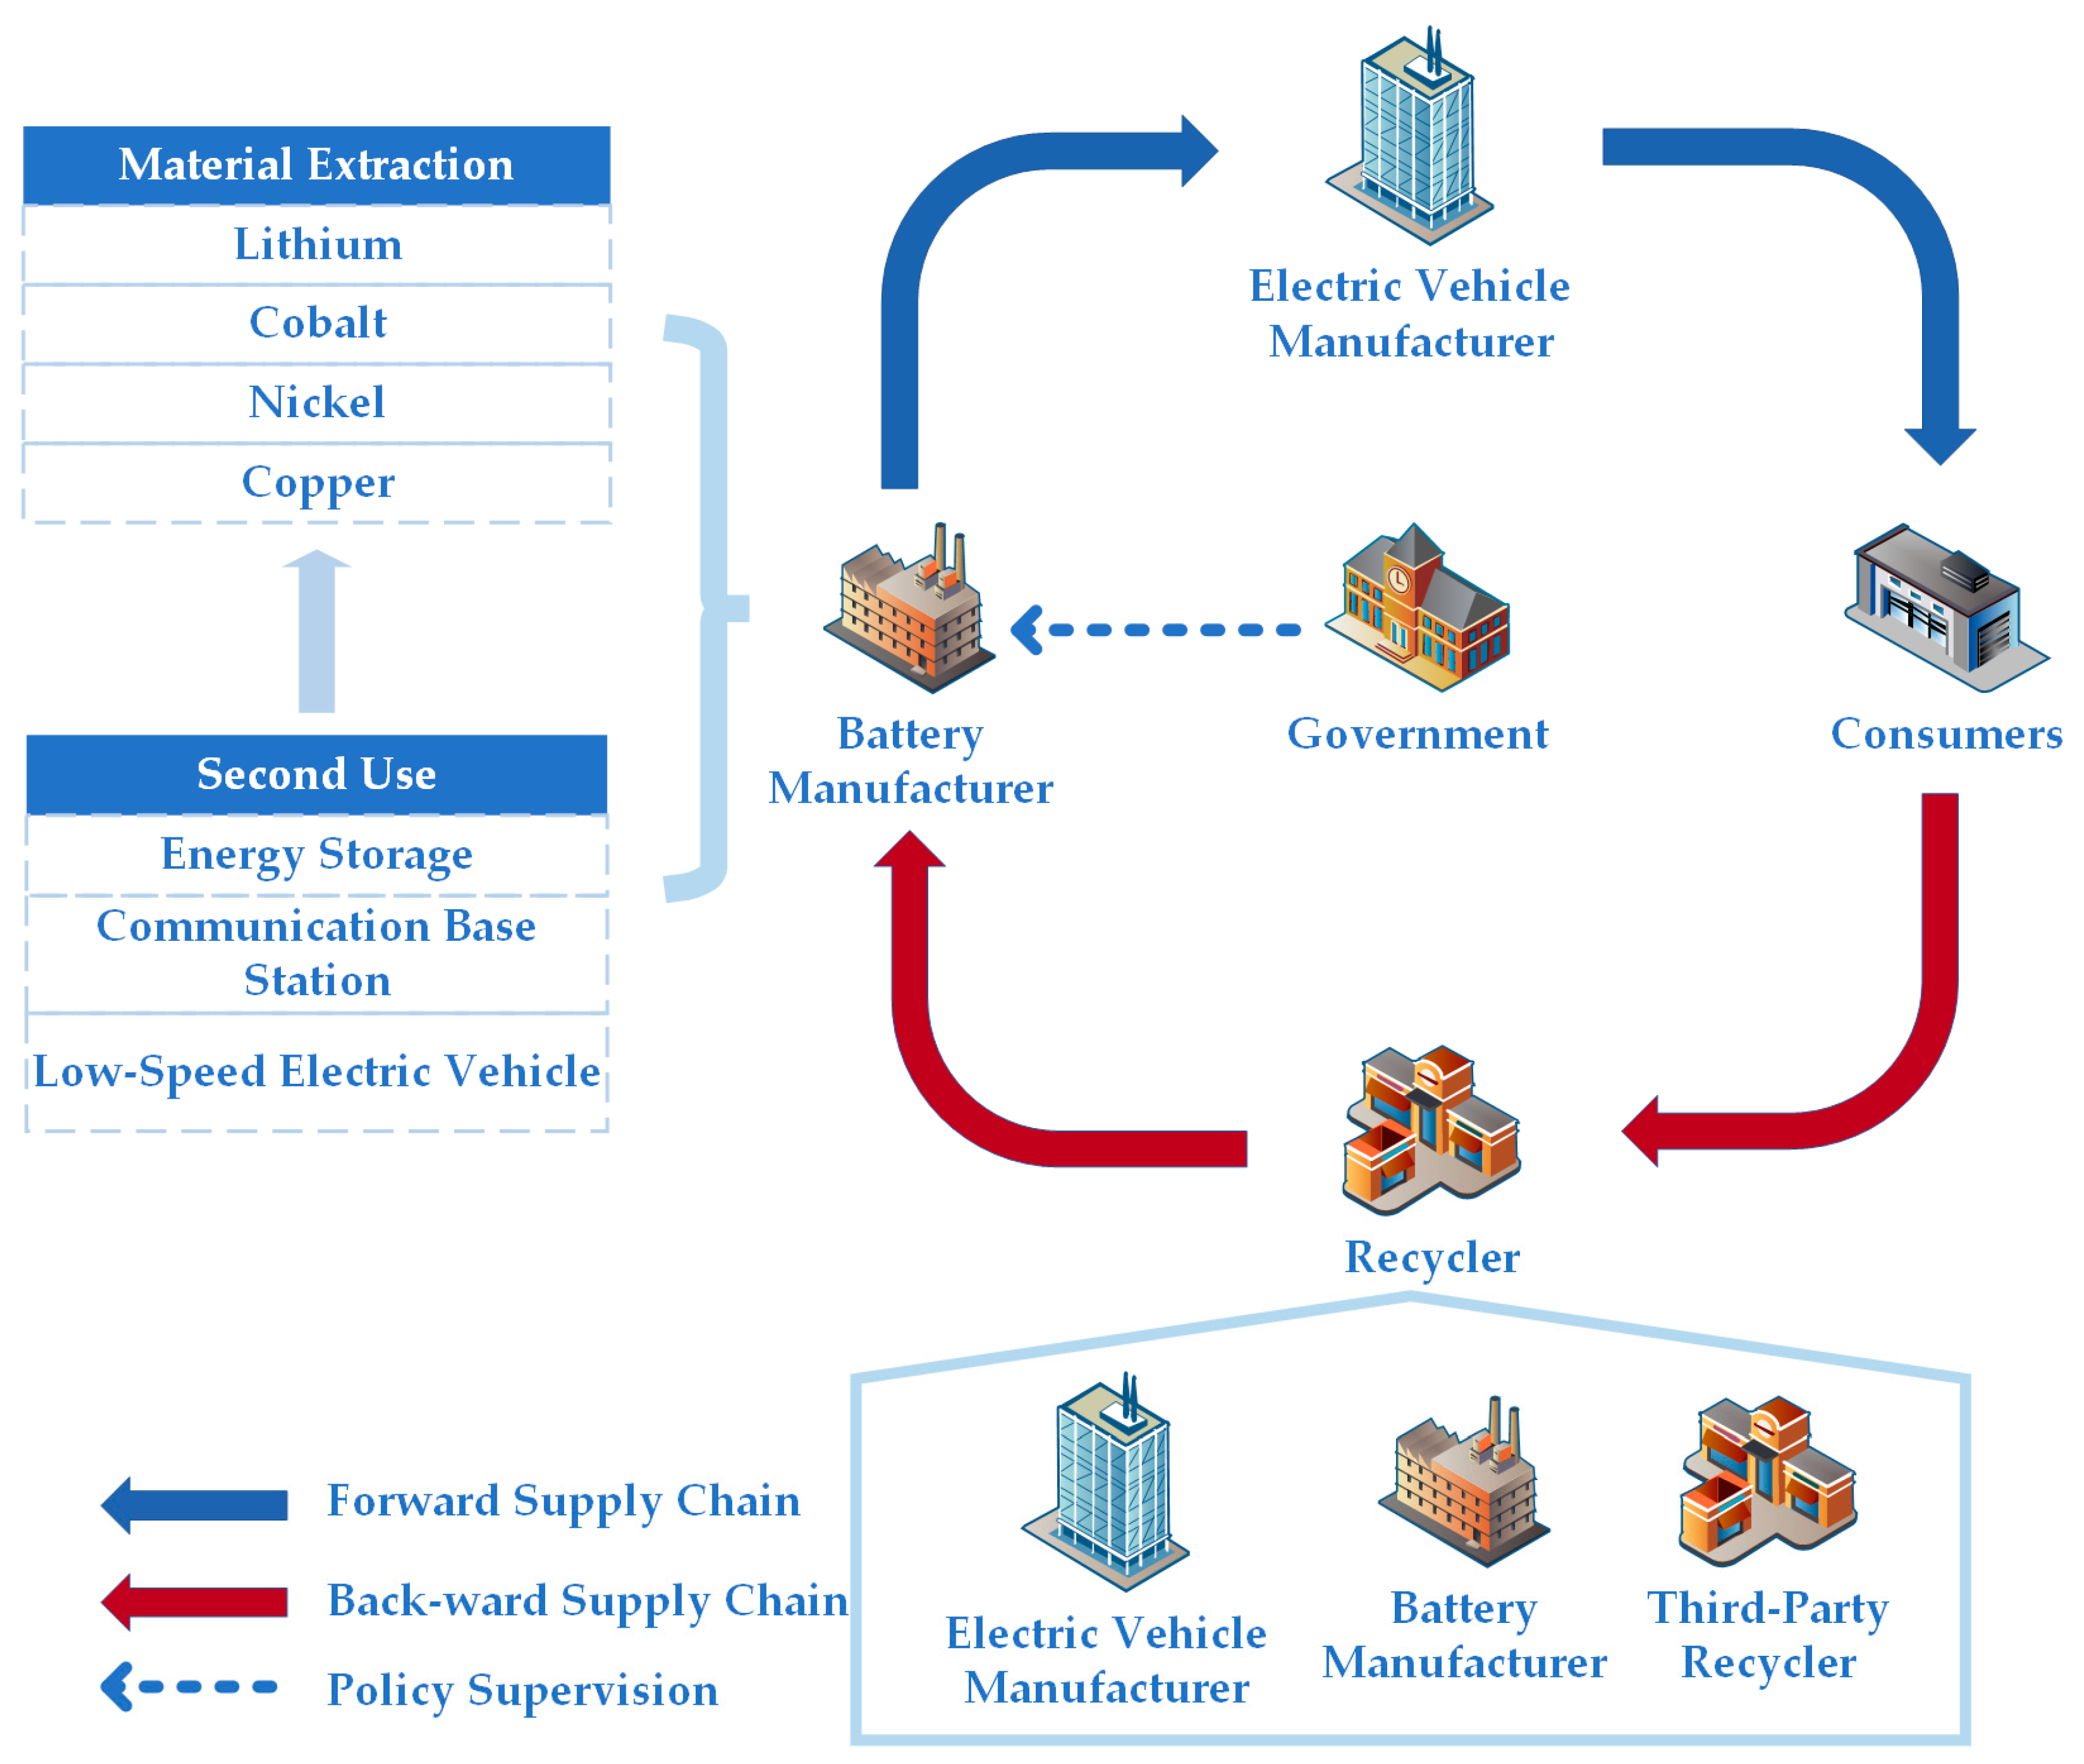
Figure 1. Framework of power batteries’ recycling process.
Sustainability 17 07224 g001
Figure 2. Framework of E + T mode.
Sustainability 17 07224 g002
Figure 3. Decision sequence for the E + T mode.
Sustainability 17 07224 g003
Figure 4. Framework of the B + T mode.
Sustainability 17 07224 g004
Figure 5. Decision sequence for the B + T mode.
Sustainability 17 07224 g005
Figure 6. Framework of the ET+B mode.
Sustainability 17 07224 g006
Figure 7. Decision sequence for the ET+B mode.
Sustainability 17 07224 g007
Figure 8. Framework of the BT+E mode.
Sustainability 17 07224 g008
Figure 9. Decision sequence for the BT+E mode.
Sustainability 17 07224 g009
Figure 10. Framework of the BE+T mode.
Sustainability 17 07224 g010
Figure 11. Decision sequence for the BE+T mode.
Sustainability 17 07224 g011
Figure 12. Effects of the reward–penalty intensity and cross-price sensitivity on recycling rates.
Sustainability 17 07224 g012
Figure 13. Effects of consumers’ sensitivity to the recycling price and the production cost of new power batteries on recycling rates.
Sustainability 17 07224 g013
Figure 14. Effects of the quantity of power batteries voluntarily recycled by consumers and consumers’ sensitivity to the recycling price on the BM’s profit.
Sustainability 17 07224 g014
Figure 15. Effects of reward–penalty intensity and cross-price sensitivity on the BM’s profit.
Sustainability 17 07224 g015
Figure 16. Effects of reward–penalty intensity and cross-price sensitivity on the EVM’s profit.
Sustainability 17 07224 g016
Figure 17. Effects of consumers’ sensitivity to the sales price on the EVM’s profit.
Sustainability 17 07224 g017
Figure 18. Effects of reward–penalty intensity and cross-price sensitivity on the TPR’s profit.
Sustainability 17 07224 g018
Figure 19. Effects of the quantity of power batteries voluntarily recycled by consumers and consumers’ sensitivity to the recycling price on the TPR’s profit.
Sustainability 17 07224 g019
Figure 20. Effects of consumers’ sensitivity to the recycling price and cross-price sensitivity on the E + T mode.
Sustainability 17 07224 g020
Figure 21. Effects of consumers’ sensitivity to the recycling price and cross-price sensitivity on the B + T mode.
Sustainability 17 07224 g021
Figure 22. Effects of consumers’ sensitivity to the recycling price and cross-price sensitivity on the ET+B, BT+E, and BE+T modes.
Sustainability 17 07224 g022
Table 1. Comparison of the related literature.
AuthorStructure CompositionReward–Penalty MechanismReward–Penalty ObjectRecycling ChannelCooperative Recycling
Tang et al. (2018) [14]Power battery manufacturer, retailer, and third-partyPower battery manufacturerSingle or dual×
Zhang et al. (2022) [18]Manufacturer, retailer, third-party recycler, and echelon utilization enterprise××Dual or more
Wu et al. (2024) [8]Power battery manufacturer, vehicle manufacturer, and third-party××Single or dual
Zhao et al. (2022) [22]Power battery manufacturer, EV retailer, and third-party××Single
Xiao et al. (2024) [16]EVB manufacturer, formal recycler, and informal recycler××Dual×
Sun et al. (2022) [23]Manufacture and retailer××Single or dual×
Li et al. (2023) [29]Power battery manufacturer, electric vehicle manufacturer, and third-party recycler××Single or dual
Chen et al. (2022) [27]Power battery manufacturer and electric vehicle manufacturer××Single×
Zhang et al. (2023) [9]Power battery manufacturer, vehicle manufacturer, and third-partyPower battery manufacturerSingle or dual
Zhang et al. (2021) [30]Manufacturer, retailer, and third-partyManufacturerSingle or dual×
Liu et al. (2024) [17]Battery manufacturer, CSR recycler, and non-CSR recycler××Dual
This paperBattery manufacturer, electric vehicle manufacturer, and third-party recyclerBattery manufacturerDual
”√” indicates that the article studies this element, while “×” indicates that it does not.
Table 2. The descriptions of the notations.
NotationDefinition
p Unit recycling price of power batteries
u Transfer price of power batteries
v Unit wholesale price of power batteries
s Unit sales price of EVs
q Investment in the recycling activity per unit of power battery, such as the construction of recycling stations, advertising, transportation, etc.
r Unit disassembly cost of scrapped power batteries
C Unit production cost of power batteries
z Unit production cost of EVs
λ Net profit per unit of remaining capacity of power batteries
π Profit of the BM, EVM, or TPR
D Quantity of power batteries recycled
a Quantity of power batteries voluntarily recycled by consumers
E Quantity of vehicles sold by the EVM
h Market size of EVs
b Sensitivity of consumers to the recycling price
β Cross-price sensitivity of one recycling channel to another
θ Sensitivity of consumers to the price of electric vehicles
L ~ Unit remaining capacity of power batteries, which follows a normal distribution
K Reward–penalty intensity set by the government
ξ Recycling rate of power batteries
Table 3. Optimal solutions of the sales price, wholesale price, and transfer price.
s * v * u *
E + T Mode 3 h 4 θ + z + C N + ξ 0 K 4 h 2 θ + C N z + ξ 0 K 2 a 4 β b + K + q r + Δ 2
B + T Mode 3 h 4 θ + z + C N + ξ 0 K 4 h 2 θ + C N z + ξ 0 K 2 a 4 β b + K + q r + Δ 2
ET+B Mode 3 h 4 θ + z + C N + ξ 0 K 4 h 2 θ + C N z + ξ 0 K 2 a 2 b + β 6 β 2 b 2 + K + q r + Δ 2
BT+E Mode 3 h 4 θ + z + C N + ξ 0 K 4 h 2 θ + C N z + ξ 0 K 2 a b + 2 β 6 β 2 b 2 + K + q r + Δ 2
BE+T Mode h 2 θ + C N + z + ξ 0 K 2 / a b + 2 β 6 β 2 b 2 + K + q r + Δ 2
Table 4. Optimal Solutions of recycling price.
p *
E + T Mode
p E a b β + 3 β 2 6 b 2 + 2 2 b 3 b 2 β 2 b β 2 + β 3 K q r + Δ 8 b β 2 b 2 β 2
p T a 12 b 3 2 b 2 β 7 b β 2 + β 3 + 2 4 b 4 2 b 3 β 3 b 2 β 2 + β 4 K q r + Δ 16 b b β 2 b 2 β 2
B + T Mode
p B a 4 β b + K q r + Δ 2
p T a β 3 b + 2 b 2 β 2 K q r + Δ 8 b b β
ET+B Mode
p E T 2 a 3 b 2 + b β β 2 + 3 b β b + β 2 K q r + Δ 12 b 3 b β 2
p B a b + 2 β 6 β 2 b 2 + K q r + Δ 2
BT+E Mode
p B T a 2 b + β 6 β 2 b 2 + K q r + Δ 2
p E a 3 b 2 4 b β + β 2 + 3 b β b + β 2 K q r + Δ 12 b 3 b β 2
BE+T Mode
p B E a 2 b + β 6 β 2 b 2 + K q r + Δ 2
p T a 3 b 2 4 b β + β 2 + 3 b β b + β 2 K q r + Δ 12 b 3 b β 2
Table 5. Summary of parameters’ values.
ParameterValueParameterValue
a 500 b 1.6
h 200,000 θ 3.2
r 2000 z 40,000
Δ 6400 q 500
ξ 0 10% C N 5400
K 1000 β 0.8
Table 6. Profits, recycling rates, and recycling quantities under different recycling modes.
E + TB + TET+BBT+EBE+T
π E 5.9013 × 1075.7800 × 1075.85067 × 1075.84524 × 107
π T 1.25107 × 1066.79254 × 1051.25165 × 1086.52377 × 105
π B 1.22684 × 1081.25110 × 1081.25056 × 108
π B E 1.81697 × 1081.82910 × 108 2.40765 × 10⁸
ξ 0.1998490.2682900.2675250.2690560.134528
D E 1303.13 1063.331021.67
D T 1414.821042.502637.51021.67
D B 2606.252575.00
D B E 2637.5
The parts with background color represent the total profit under cooperation.
Disclaimer/Publisher’s Note: The statements, opinions and data contained in all publications are solely those of the individual author(s) and contributor(s) and not of MDPI and/or the editor(s). MDPI and/or the editor(s) disclaim responsibility for any injury to people or property resulting from any ideas, methods, instructions or products referred to in the content.