Article

Carbon Dioxide Fertilization Effects Offset the Vegetation GPP Losses of Woodland Ecosystems Due to Surface Ozone Damage in China

1
Institute of Geographical Sciences, Hebei Academy of Sciences, Shijiazhuang 050011, China
2
Hubei Key Laboratory of Regional Ecology and Environmental Change, School of Geography and Information Engineering, China University of Geosciences, Wuhan 430074, China
3
Engineering Technology Innovation Center for Intelligent Monitoring and Spatial Regulation of Land Carbon Sinks, Ministry of Natural Resources, Wuhan 430078, China
4
Hebei Technology Innovation Center for Geographic Information Application, Shijiazhuang 050011, China
5
Key Laboratory of Ecosystem Network Observation and Modeling, Institute of Geographic Sciences and Natural Resources Research, Chinese Academy of Sciences, Beijing 100101, China
6
South China Botanical Garden, Guangzhou 510650, China
*
Author to whom correspondence should be addressed.
Sustainability 2025, 17(16), 7198; https://doi.org/10.3390/su17167198
Submission received: 18 June 2025 / Revised: 22 July 2025 / Accepted: 6 August 2025 / Published: 8 August 2025

Abstract

Air pollution and climate change pose an increasingly serious threat to the sustainable development of terrestrial forest ecosystems. Extensive research in China has focused on single environmental factors, such as ozone, carbon dioxide, and climate change, but the multifactor interactions remain poorly understood. Here, we coupled the interactions of climate change, elevated CO2 concentration, and increasing O3 into the BEPS_O3 model. The gross primary production (GPP) simulated by the BEPS_O3 is verified at site scale by using the eddy covariance (EC) derived gross primary production data in China. We then investigated the impact of ozone and CO2 fertilization on woodland ecosystem gross primary production in the context of climate change during 2001–2020 over China. The results of multi-scenario simulations indicate that the gross primary production of woodland ecosystems will increase by 1–5% due to elevated CO2. However, increased ozone pollution will result in a gross primary production loss of approximately 8–9%. In the historical climate, under the combined effects of CO2 and O3, the effect of ozone on gross primary production will be mitigated by CO2 to 4–7%. In most areas, the effect of ozone on woodland ecosystems is higher than that of CO2 on vegetation photosynthesis, but CO2 gradually counteracts the effect of ozone on the ecosystem. Our simulation study provides a reference for assessing the interactive responses to climate change, and advances our understanding of the interactions of global change agents over time. In addition, the comparison of individual and combined models will provide an important basis for national emission reduction strategies as well as O3 regulation and climate adaptation in different regions. This also provides a data reference for China’s sustainable development policies.

1. Introduction

Sustainable development is the core path to maintaining the health of ecosystems [1,2]. Over the past few decades, air pollution and climate change caused by global warming have been threatening the health of ecosystems [3,4]. Tropospheric ozone (O3) is the most damaging air pollutant for plants [5,6]. Ozone damages ecosystem vegetation carbon sequestration, carbon allocation, nutrient supply, biodiversity and other aspects [7,8]. As plants play a vital role in regulating the ambient environment, ozone-induced damage in plants may further accelerate environmental degradation, with severe consequences for human and ecosystem health. The few studies that have considered the effects of ozone on the carbon cycle still lack simulations of the interaction of ozone with various global change factors. As a result, we know little about the interaction of multiple global change factors on ecosystem carbon cycles.
The interaction mechanism of global change factors is very complex. Climate change affects the carbon cycle of terrestrial ecosystems directly or indirectly by changing temperature, precipitation and other factors [9,10,11,12,13]. CO2 fertilization not only increases the photosynthetic rate of plants but also reduces the risk of drought by reducing stomatal conductance [14,15]. Many previous studies have reported that CO2 fertilization offsets the possible negative effects of climate change [16]. This is because the effect of CO2 fertilization increases the leaf intercellular concentration of carbon dioxide and stimulates the photosynthesis of plants [17,18]. Although fossil records and experiments show that high concentrations of CO2 reduce stomatal pore size and total stomatal number per unit leaf area, this reduction in stomatal conductance does not affect the high intercellular CO2 concentration during vegetation photosynthesis, which is even higher than predicted by most models [19,20,21]. However, emissions of CO2 are usually accompanied by O3 precursors, which have driven a rise in tropospheric ozone ([O3]) [22]. O3 forms reactive oxygen species (ROS) within cells, causing damage to plant tissues and reduced photosynthesis [23,24,25]. In addition, ozone exposure altered the content of abscisic acid and K+ ions in plant stomatal cells, causing expansion pressure and abnormal signaling in plant guard cells [26,27]. Ozone disrupts plant photosynthesis, reduces gas exchange, induces early leaf senescence, and inhibits the growth of natural vegetation and crops [28,29,30,31,32,33,34,35]. It can be seen that the effects of [CO2] and [O3] on plants are very complex, although some scholars believe that the increase in [CO2] can reduce the impact of [O3] on vegetation [36]. However, few models take the synergistic effects of CO2, O3 climate change and other factors into consideration in the simulation [37]. Because the effects of different factors on vegetation are very complicated, it is difficult to express them by simple functions. Process-based ecosystem models can help us understand the response and adaptation of vegetation under the influence of global change factors by simulating the physiological change process of vegetation and output intermediate variables [38,39]. Therefore, it is necessary to consider multifactor modeling and reveal the interaction of global change factors based on the model.
In China, studies based on multiple variability factors have mostly focused on the effects of O3 and CO2 changes on crop yields [36], and research on carbon sinks in terrestrial ecosystems is lacking [40,41]. Refs. [42,43] simulated the net primary productivity (NPP) and net carbon exchange (NCE) of terrestrial ecosystems in China and showed that the rise in O3 led to a 7.7% decrease in carbon storage in China and an average 4.5% decrease in national NPP. NCE (Pg C yr−1) decreases by 0.4–43.1% for different forest types, and carbon dioxide and nitrogen deposition offset the damage to ecosystem productivity caused by ozone and climate change. With the increase in atmospheric emissions, the concentrations of CO2 and O3 are increasing. Given the response of vegetation to changing atmospheric conditions, previous findings may no longer be relevant in the current climate. It is necessary and urgent to simulate the carbon sink of terrestrial ecosystems with multifactor interactions. Revealing the interaction mechanism of multiple factors will help us understand the changing trend in terrestrial ecosystem productivity under future climate change.
In this study, we quantify the impacts of different global change factors on the ecosystem carbon cycle through the comparison of multi-scenario models and try to find out the mechanism of their interaction. Therefore, the BEPS model was used to (1) calculate the gross primary production (GPP) of woodland ecosystems in China under different scenarios from 2001 to 2020; (2) calculate the influence of ozone and different factors on GPP by comparing different scenarios. (3) This study focuses on demonstrating the causal relationship between O3 and CO2 and GPP. The Synergistic-Unique-Redundant Decomposition of causality (SURD) method is employed to obtain the causal relationships among all variables. By decomposing the relationship between the independent variables and the dependent variable into Redundant (R), Unique (U), and Synergistic (S), the interaction relationships among meteorological factors are explored.

2. Materials and Methods

2.1. Model Description

The boreal ecosystem productivity simulator (BEPS) is a process-based ecosystem model with half-hourly time steps developed by Liu and Chen [44]. The two-leaf enzyme kinetic terrestrial ecosystem model is the core module for calculating GPP in the BEPS model. It can calculate the instantaneous stomatal conductance of vegetation and photosynthesis, and through multiple iterations, it enables the convergence of photosynthesis and stomatal conductance [45,46]. In BEPS, the canopy-level GPP is simulated as follows:
G P P = A s u n L A I s u n + A s h L A I s h
The net photosynthetic rate (μ mol/m2 s) of the leaves is denoted by A. In Equation (1), both the photosynthetic rate and the leaf area index were divided into two parts: “sunlit” and “shaded”. LAI is the leaf area index; the sunlit LAI (LAIsun) and shaded LAI (LAIsh) are calculated as follows. The leaf area index (LAI) is divided into two parts in the model: the sunlit leaves and the shaded leaves. The sunlit leaves are represented by (LAIsun), and the shaded leaves by (LAIsh). The splitting method of the sunlit and shaded leaves is as follows: [44]:
L A I s u n = 2 c o s θ ( 1 e 0.5 Ω L / c o s θ )
L A I s h = L L A I s u n
The leaf area index (L, m2 m−2) was split into the areas of the sunlit and shaded leaves based on the diurnal variation in the solar zenith angle ( θ ).
Following [47], the net carboxylation rate at the leaf level is calculated as the minimum of
A c , i = V c   m a x C c , i Γ i * C c , i + K c ( 1 + O c , i / K o )
and
A j , i = J C c , i Γ i * 4 ( C c , i + 2 Γ i * )
where Ac,i and Aj,i are Rubiso-limited and RuBP-limited gross photosynthesis rates (μ mol/m2 s), respectively. Vcmax is the maximum carboxylation rate (μ mol/m2 s); J is the electron transport rate (μ mol/m2 s); Cc,i and Oc,i are the intercellular CO2 and O2 mole fractions (mol/mol, respectively); Γ i * is the CO2 compensation point without dark respiration (mol/mol; Kc and Ko are Michaelis–Menten constants for CO2 and O2 (mol/mol), respectively.
This research drew on the previous research ideas and improved the model by modifying the module for calculating photosynthesis [48,49,50,51].
A = A p F
In this study, the impact of ozone on photosynthesis is re-examined. The product of the original assimilation rate Ap of the BEPS model and the influence coefficient F of ozone on photosynthetic rate is recorded as the new photosynthetic rate A of the BEPS model output. F can be expressed as follows:
F = 1 α ( P O D y )
where PODy is the instantaneous leaf uptake of O3 over a vegetation-specific threshold, y, in nmol/m2 s. “α” is the coefficient by which the photosynthesis of vegetation decreases after absorbing ozone. And PODy can be expressed as follows
P O D y = O 3 R + K O 3 g
where R is the aerodynamic and boundary layer resistance between the leaf surface and reference level (s/m), g is the leaf conductance for H2O (m/s). The resistance ratio of the blade to ozone and water vapor is set as a constant kO3 = 1.67. After taking into account the effect of ozone, Equation (5) can be rewritten as:
A j , i = J C c , i Γ i * 4 ( C c , i + 2 Γ i * ) × F
By multiple iterations, the change in stomatal conductance caused by ozone concentration leads to a change in the intercellular CO2(Cc,i), resulting in a change in Jmax. Jmax and Cc,i affect the change in stomatal conductance during the next iteration, thereby reducing the absorption of O3. In this way, F converges to an appropriate value to represent the impact of ozone on photosynthesis within a single time step.

2.2. Data Sources

2.2.1. Gridded Meteorological Data

The hourly resolution reanalysis grid meteorological data including temperature, precipitation, and ozone concentration were downloaded from the European Centre for Medium-Range Weather Forecasts (ECMWF) (10.24381/cds.e2161bac) (ERA5). ERA5 thus benefits from a decade of developments in model physics, core dynamics and data assimilation [52]. In addition to a significantly enhanced horizontal resolution of 31 km, compared to 80 km for ERA-Interim, ERA5 has hourly output throughout and an uncertainty estimate from an ensemble (3-hourly at half the horizontal resolution) [53]. The re-analyzed data for ozone is 0.25°, while the remaining data are all 0.1° grid data. In this study, the ozone data were resampled to a resolution of 0.1° using bilinear interpolation, and all the data were aligned with the raster images of land cover types.

2.2.2. China-Wide LAI Map

The Leaf area index (LAI) was downloaded from GLOBMAP (https://doi.org/10.5281/zenodo.4700264 (accessed on 19 April 2021)) [54]. The GLOBMAP LAI dataset has been validated with field measurements, which have an error of 0.81 LAI on average; this results in GLOBMAP LAI having a more superior simulation effect at most stations compared to MODIS and GLASS [55]. The LAI data were resampled from 8 km to 0.1° spatial resolution in this study.

2.2.3. Land Cover Map

The land cover map was obtained from the National Earth System Science Data Center (http://www.geodata.cn/) by [56]. The types of land cover have been classified into seven categories, including evergreen needleleaf forest (ENF), deciduous needleleaf forest (DNF), deciduous broadleaf forest (DBF), evergreen broadleaf forest (EBF), mixed forest (MIX), and shrub (Figure 1). The subtropical and temperate vegetation are distinguished in order to reflect the difference in ozone sensitivity between the subtropical and temperate vegetation. In this study, we did not consider the change in land use, so only the land cover map drawn in 2000 was used.

2.2.4. Site Verification

Three flux sites were used to validate the GPP simulated by the BEPS_O3 model. The three stations are HaiBei Station (shrub-HBG), Changbaishan Station (conifer-CBS) and Dinghushan Station (hardleaf-DHS). GPP data for all three sites came from ChinaFlux. Figure 1 shows the locations of the three sites, and Table 1 shows the basic information about the three sites. These site data were downloaded from China Flux (https://www.chinaflux.org/ (accessed on 28 September 2019)), and they were obtained at the site scale through the use of eddy covariance equipment for observation. The obtained data were cleaned by the site manager and then uploaded. It can be directly applied to the conduct of research work.

2.3. Simulation Protocol

The validated BEPS_O3 model was applied to simulate the interaction effects of climate change, [CO2] and [O3] on the GPP of woodland ecosystems during 2001–2020. Through model simulation experiments, the interactive effects of [CO2] and [O3] on the woodland ecosystem GPP under the background of historical climate change were studied. The relative effects of climate change, [CO2] and [O3] on the woodland ecosystem GPP were also clarified. As a model simulation experiment scheme (Table 2), Experiment 1 (E1) studied productivity under historical climate change conditions. Model simulation Experiment 2 (E2) studied productivity under historical climate, [O3] and [CO2] conditions. Model simulation Experiment 3 (E3) studied productivity under historical O3 and climatic conditions. Model simulation Experiment 4 (E4) examined productivity under historical climatic conditions and CO2 conditions.
By comparing E1 and E2, the comprehensive effects of past climate change, carbon dioxide and ozone on vegetation can be obtained. The combined effects of ozone and climate change on vegetation can be obtained by comparing E1 and E3. The combined effects of carbon dioxide fertilization and climate change on vegetation can be obtained by comparing E1 and E4. The separate effects of ozone on vegetation can be determined by comparing E2 and E4.
In scenarios E1 and E3, we used the fixed CO2 concentration in 2001 as the CO2 input data of the model.

2.4. Causality Analysis—SURD

The SURD analysis method was used for the simulation results. SURD is a component that decomposes causal relationships into synergistic relationships, uniqueness, and redundancy [57]. SURD quantifies causality as the increments of redundant(R), unique(U), and synergistic(S) information gained about future events from past observations. It is conducive to exploring the influence process of factors such as ozone-meteorological factors and carbon dioxide on the productivity of the woodland ecosystem over a long time series.
The original SURD component was only used for analyzing the site. The SURD component was compiled based on Python 3.9 to be used for temporal causal analysis of region-scale raster data. The time series of each meteorological variable is constructed in a single grid to analyze the causal relationship between GPP. As a result, since each variable generates R, U and S causal relationships with other variables, fully presenting the causal relationships of the data is a huge and complex process.
This study focuses on demonstrating the causal relationship between O3 and CO2 and GPP. Firstly, we obtain the causal relationship analysis of all variables through SURD; secondly, we split it into R, U and S relationships; thirdly, we extract the variable combinations with the maximum values in R, U and S, respectively, to determine whether the IDs corresponding to CO2 and O3 exist among them. If IDs exist, we pass out the values. For instance, when the independent variable is GPP and the dependent variables are six factors including CO2, O3, temperature, a combination of causal analysis factors is generated within the SURD, as shown in Table 3. In this study, we first extracted the maximum values from R and S, and then determined whether there were simultaneously ID values for O3 and CO2. If such values existed, we returned that number. For the U value, if the U values corresponding to CO2 and O3 are ranked in the top two, then that value is extracted. The causal relationship of the specified variable is presented through filtering, eliminating the complex process of plotting and data filtering.
When the independent variable is GPP and the dependent variables are six factors including CO2 (id: 1), O3 (id: 2), temperature (id: 3), the combination of variables shows an exponential growth in the form of an array. The more variables there are, the more complex the variable combinations become.
In the SURD analysis, each independent variable has a combination of three values: S, U, and R. Their total sum is 1, representing the impact of different variable combinations on the dependent variable. This method utilizes the concept of stepwise regression. Through multiple regressions, it gradually incorporates each variable one by one. Each time a new observation variable is added, the total specific mutual information in the system is recalculated after the addition of the new variable. If the newly added variable merely provides duplicate information of the existing variables, then this increment is classified as redundant information. If the newly added variable provides unique information that all previous variables cannot offer, then this increment is classified as unique information. If the newly added variable and the existing variables have generated new interactions, and this information can only be obtained through their joint occurrence, then this increment is classified as collaborative information.

3. Result

3.1. Site Verification of the GPP Simulated by the BEPS_O3 Model

For information about parameter acquisition and parameter verification, see the Supplementary Materials section. Based on limited site data, we verify the GPP simulated by the BEPS_O3 model at the site scale. Validation results are mainly from previous studies [58]. We obtained GPP observational flux data from ChinaFlux at HaiBei Station (shrub-HBG), Changbaishan Station (conifer-CBS) and Dinghushan Station (hardleaf-DHS) to verify the simulation results of the model (Figures S1 and S2). The results of GPP simulated by BEPS_O3 are similar to GPP simulated by the BEPS model at site scale but still show a slight improvement. Especially in summer, it restrains the overestimation of GPP. At Haibei Station (HBG), BEPS_O3 decreased the slope from 1.26 to 1.05, R2 increased by 0.02, and RMSE decreased by 0.26. Although both models underestimated GPP at Dinghushan Station (DHS), BEPS_O3 reduced the intercept from 2.3 to 1.2. The improvement at Changbaishan (CBS) was demonstrated by a decrease in slope and 0.01 increase in R2. The BEPS_O3 model shows good correlation with GPP at the site scale and can reflect the seasonal variation in GPP.

3.2. Individual and Synergistic Effects of Climate Change, CO2 and O3

Daytime ozone concentrations have maintained a gradual increasing trend over the past two decades (we averaged the ozone concentrations for all periods with radiation greater than 50 W/m2 per hour step per day for each grid to find the annual average time distribution of ozone concentrations) (Figure S3). The average ozone concentration in the study area increased from 62 ppb in the 2000s (2001–2010) to 65 ppb in the 2010s (2011–2020). The Qinghai–Tibet Plateau and northern regions showed the largest increase in ozone concentration, with the eastern coastal region increasing by approximately 6% and the southwestern region by approximately 2%. Changes in atmospheric CO2 concentrations are derived from IPCC historical CO2 concentration data, with mean CO2 concentrations increasing from 371 ppm in 2001 to 412 ppm in 2020 (Figure S4). Under the historical climate change scenario, compared with the 2001s, the average daily temperature in the 2010s generally increased by 0.5–2 °C, and the radiation changed by −2.5–3%, relative humidity by −1–3.8%, and precipitation by −40–50% (Figure S5).
In the historical climate change scenario, excluding the effects of [O3], climate change and [CO2] led to a 0–10% change in forest GPP (Figure 2a). The subtropical forests exhibited a higher growth rate of GPP, while the temperate forests showed a relatively lower growth rate of GPP. Under historical climate conditions, the GPP loss caused by single [O3] was approximately 0–22% (Figure 2c), and the synergistic effect of [O3] and [CO2] was relatively small (Figure 2b), approximately 0–18%, which is 2–4% smaller than the effect of single [O3] in the study area (Figure 2d). With the increase in ozone concentration, the GPP loss under the influence of single [O3] was 1.9–13.2% in the 2001s and 1.9–11.9% in the 2010s (Figure S6). The GPP loss under the synergistic action of [O3] and [CO2] was 3.1–17% and 3.2–15%, respectively. CO2 mitigated the effect of O3 to a certain extent. The effect of O3 on the ecosystem may be greater than the GPP gain of the forest ecosystem caused by CO2 fertilization (Figure S7).
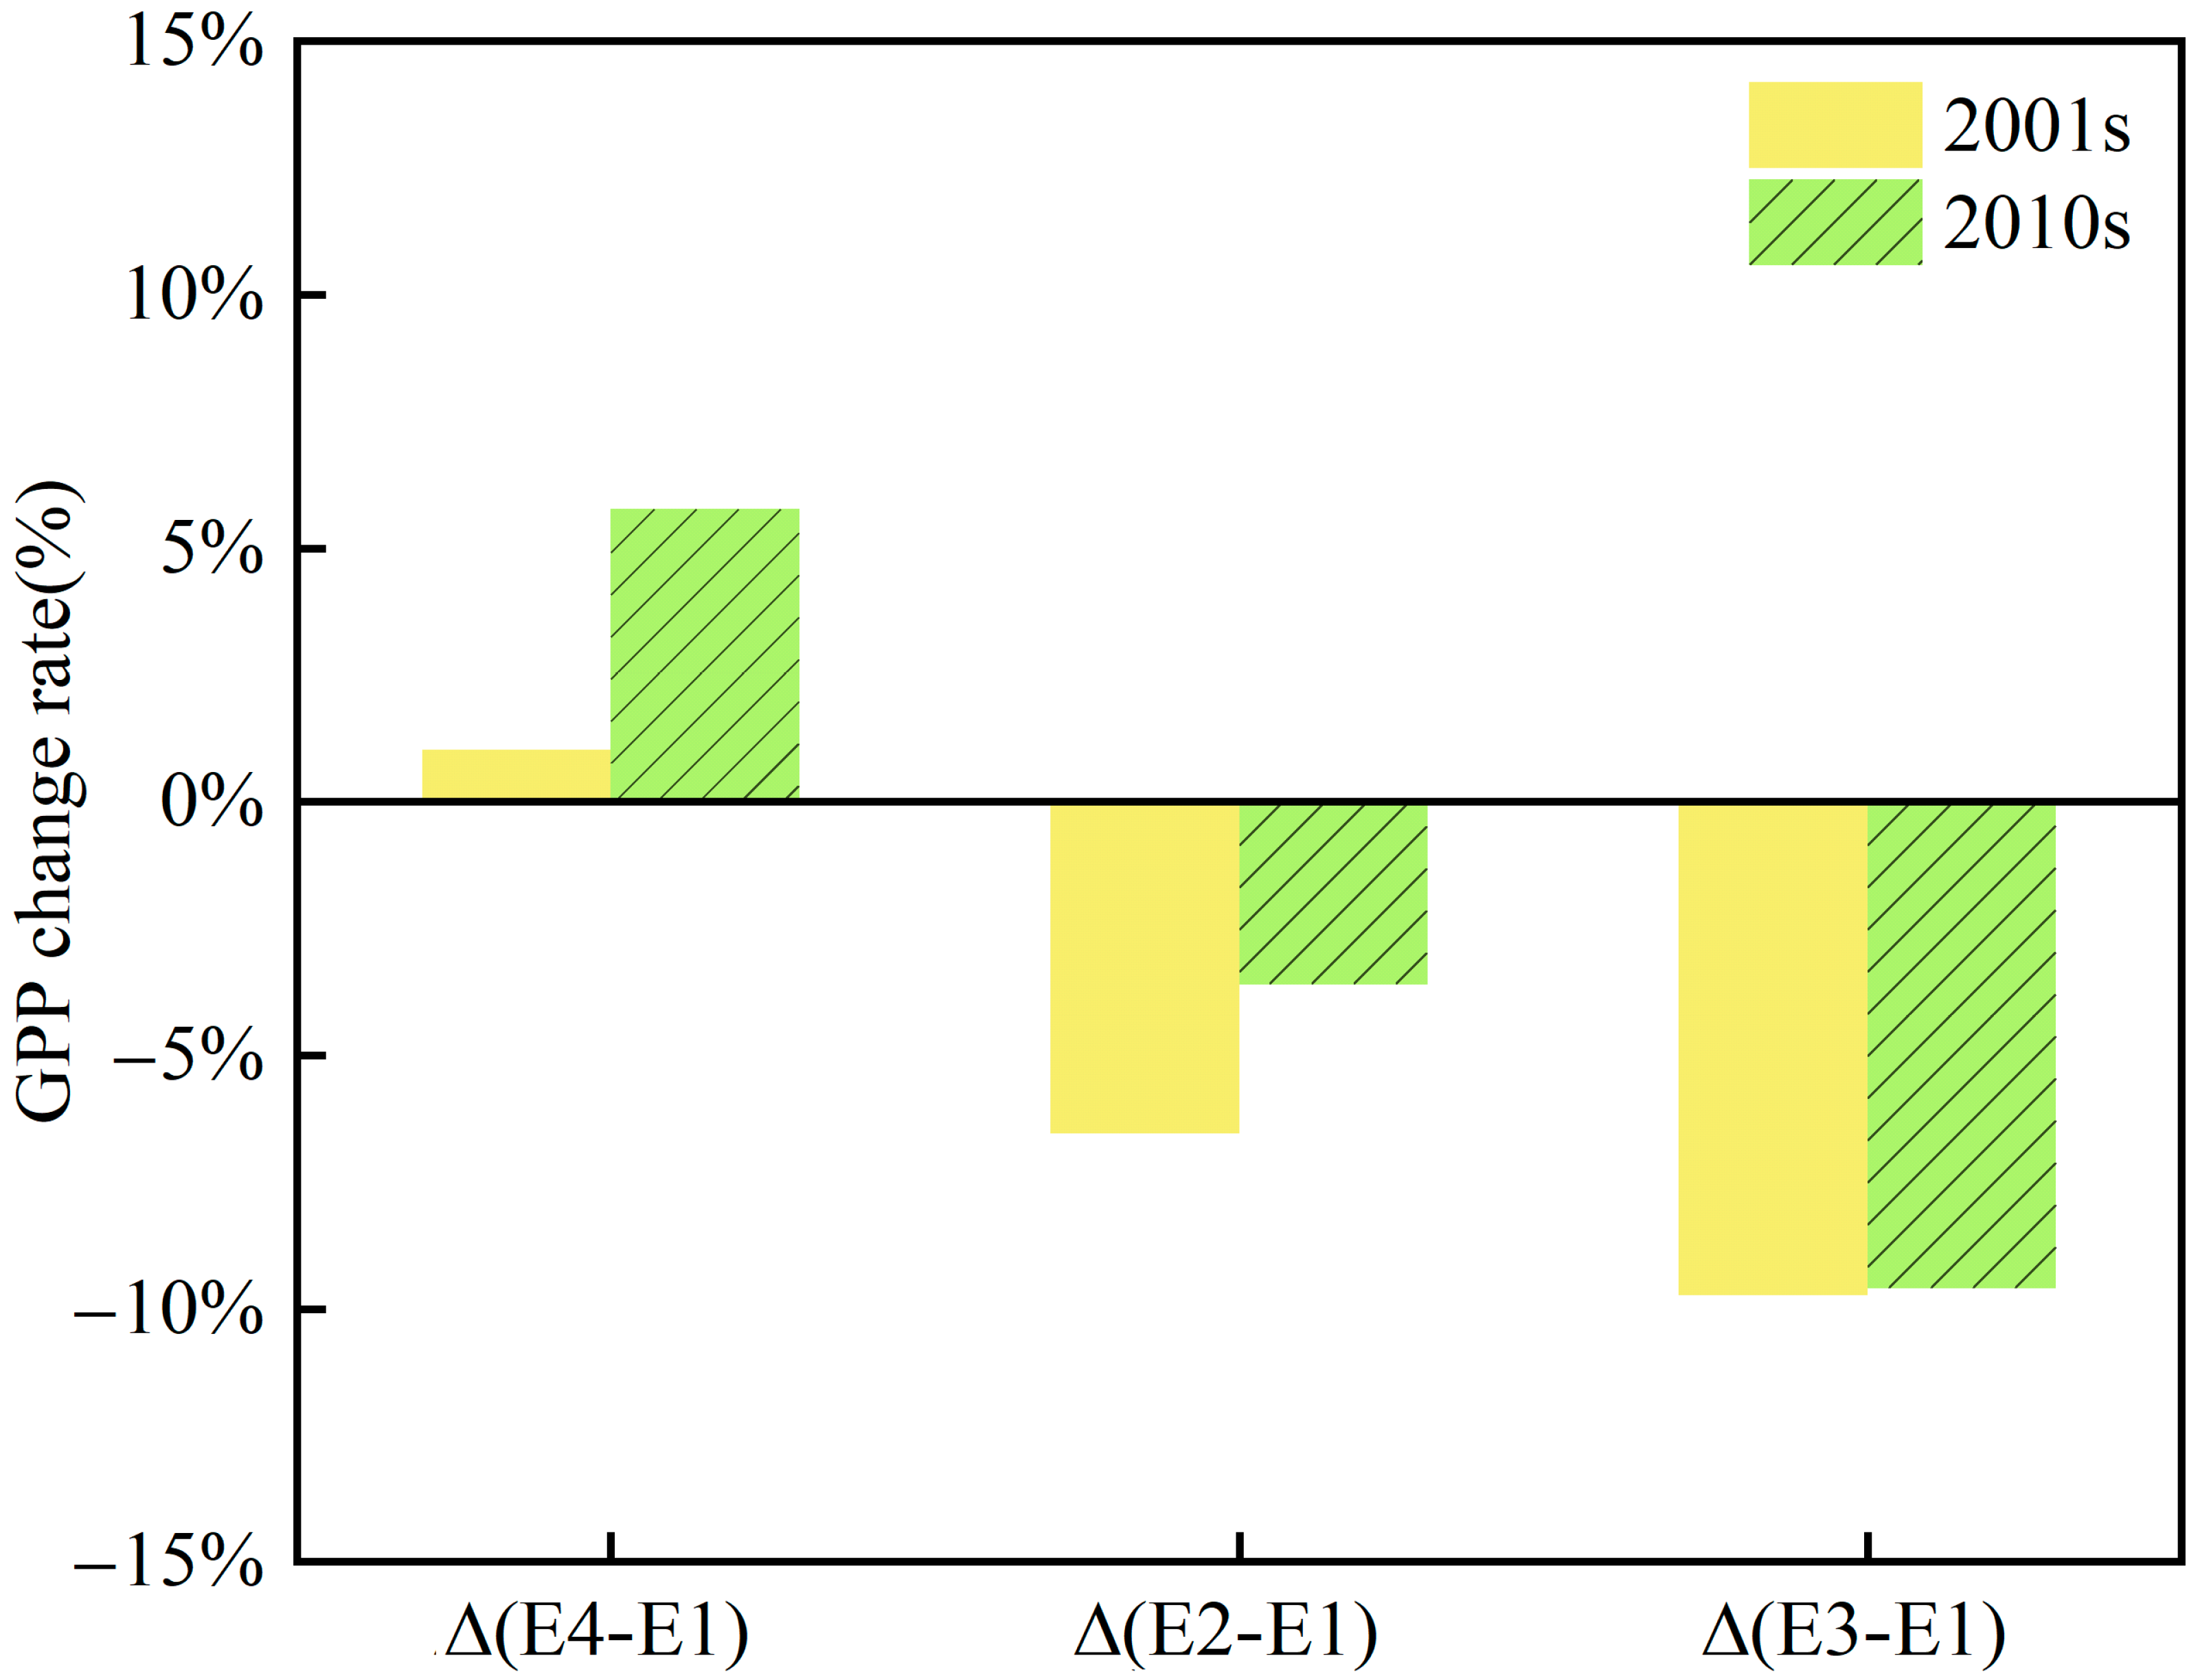
As the BEPS_O3 model is a process model driven by remote sensing data, the leaf area index (LAI), as input data, includes the promoting effect of climate change and some carbon dioxide fertilization on vegetation [59,60]. Therefore, we cannot obtain the impact of climate change on GPP by comparing the 2000s and 2010s GPP. However, it is still possible to calculate the synergistic effects of climate change and other factors on vegetation. The synergistic effect of [O3] and climate change will lead to more severe GPP reductions across the study area, with average annual GPP losses in the 2010s higher than those in the 2000s (0.9% and 1%). [CO2] and climate change significantly increased forest GPP by 1% and 5%, respectively. Under the synergistic effect of [O3], [CO2] and climate change, the effect of [O3] offset the enhancement of [CO2] on photosynthesis and still led to the decline in GPP, but the elevated [CO2] mitigated the loss of GPP caused by [O3] to a large extent (Figure 3).
Overall, although the GPP loss rate caused by ozone pollution from 2001 to 2020 decreased, the GPP loss amount showed an increasing trend. This may be due to the overall increase in the total amount of GPP between 2001 and 2020. In terms of regional variation, GPP changes caused by [O3] and [CO2] are controlled by climate. Subtropical regions are rich in temperature and precipitation, and vegetation is mainly limited to [CO2] and [O3]. The single effect of [O3] and [CO2] has a great influence in regions with abundant precipitation and high temperature. The stomatal conductance of vegetation in northern China is limited by temperature and precipitation, and ozone uptake is low. Thus, the synergistic effect of [O3] and [CO2] still shows an increase in GPP [61].

4. Discussion

4.1. The Synergistic Effect of O3 and CO2

Based on the previous statistical results, we found that there is a significant difference between [CO2] and [O3] on woodland GPP singly and in combination. Woodland GPP showed a significant upward trend under the synergistic action of climate and [CO2]. This is because the promotion of vegetation photosynthesis by [CO2] increases forest GPP, and this effect continues to increase with increasing CO2 [62,63,64]. The effect of CO2 fertilization increases GPP by 1–5% over 20 years, which is close to the results of Piao et al. (2013) [62] based on multiple model comparisons. In contrast, observations based on global carbon flux sites (0.138 ± 0.007% ppm−1; percentile per rising ppm of CO2) were slightly higher than those in our study [65]. This may be because the input LAI recorded the increase in vegetation leaf area caused by the CO2 fertilization effect.
Without considering the elevated [CO2], the GPP loss caused by [O3] and climate change showed a slow increasing trend, while the loss rate showed a slow decrease. This is consistent with the findings of Sitch (2007) [50] and Oliver (2018) [51]. O3 concentrations have increased over the past 20 years, but mainly in temperate regions of China. Woodland in temperate areas may be stressed by drought, O3 and other factors at the same time, and the decrease in stomatal conductance caused by drought stress may limit ozone uptake by vegetation [42,66].
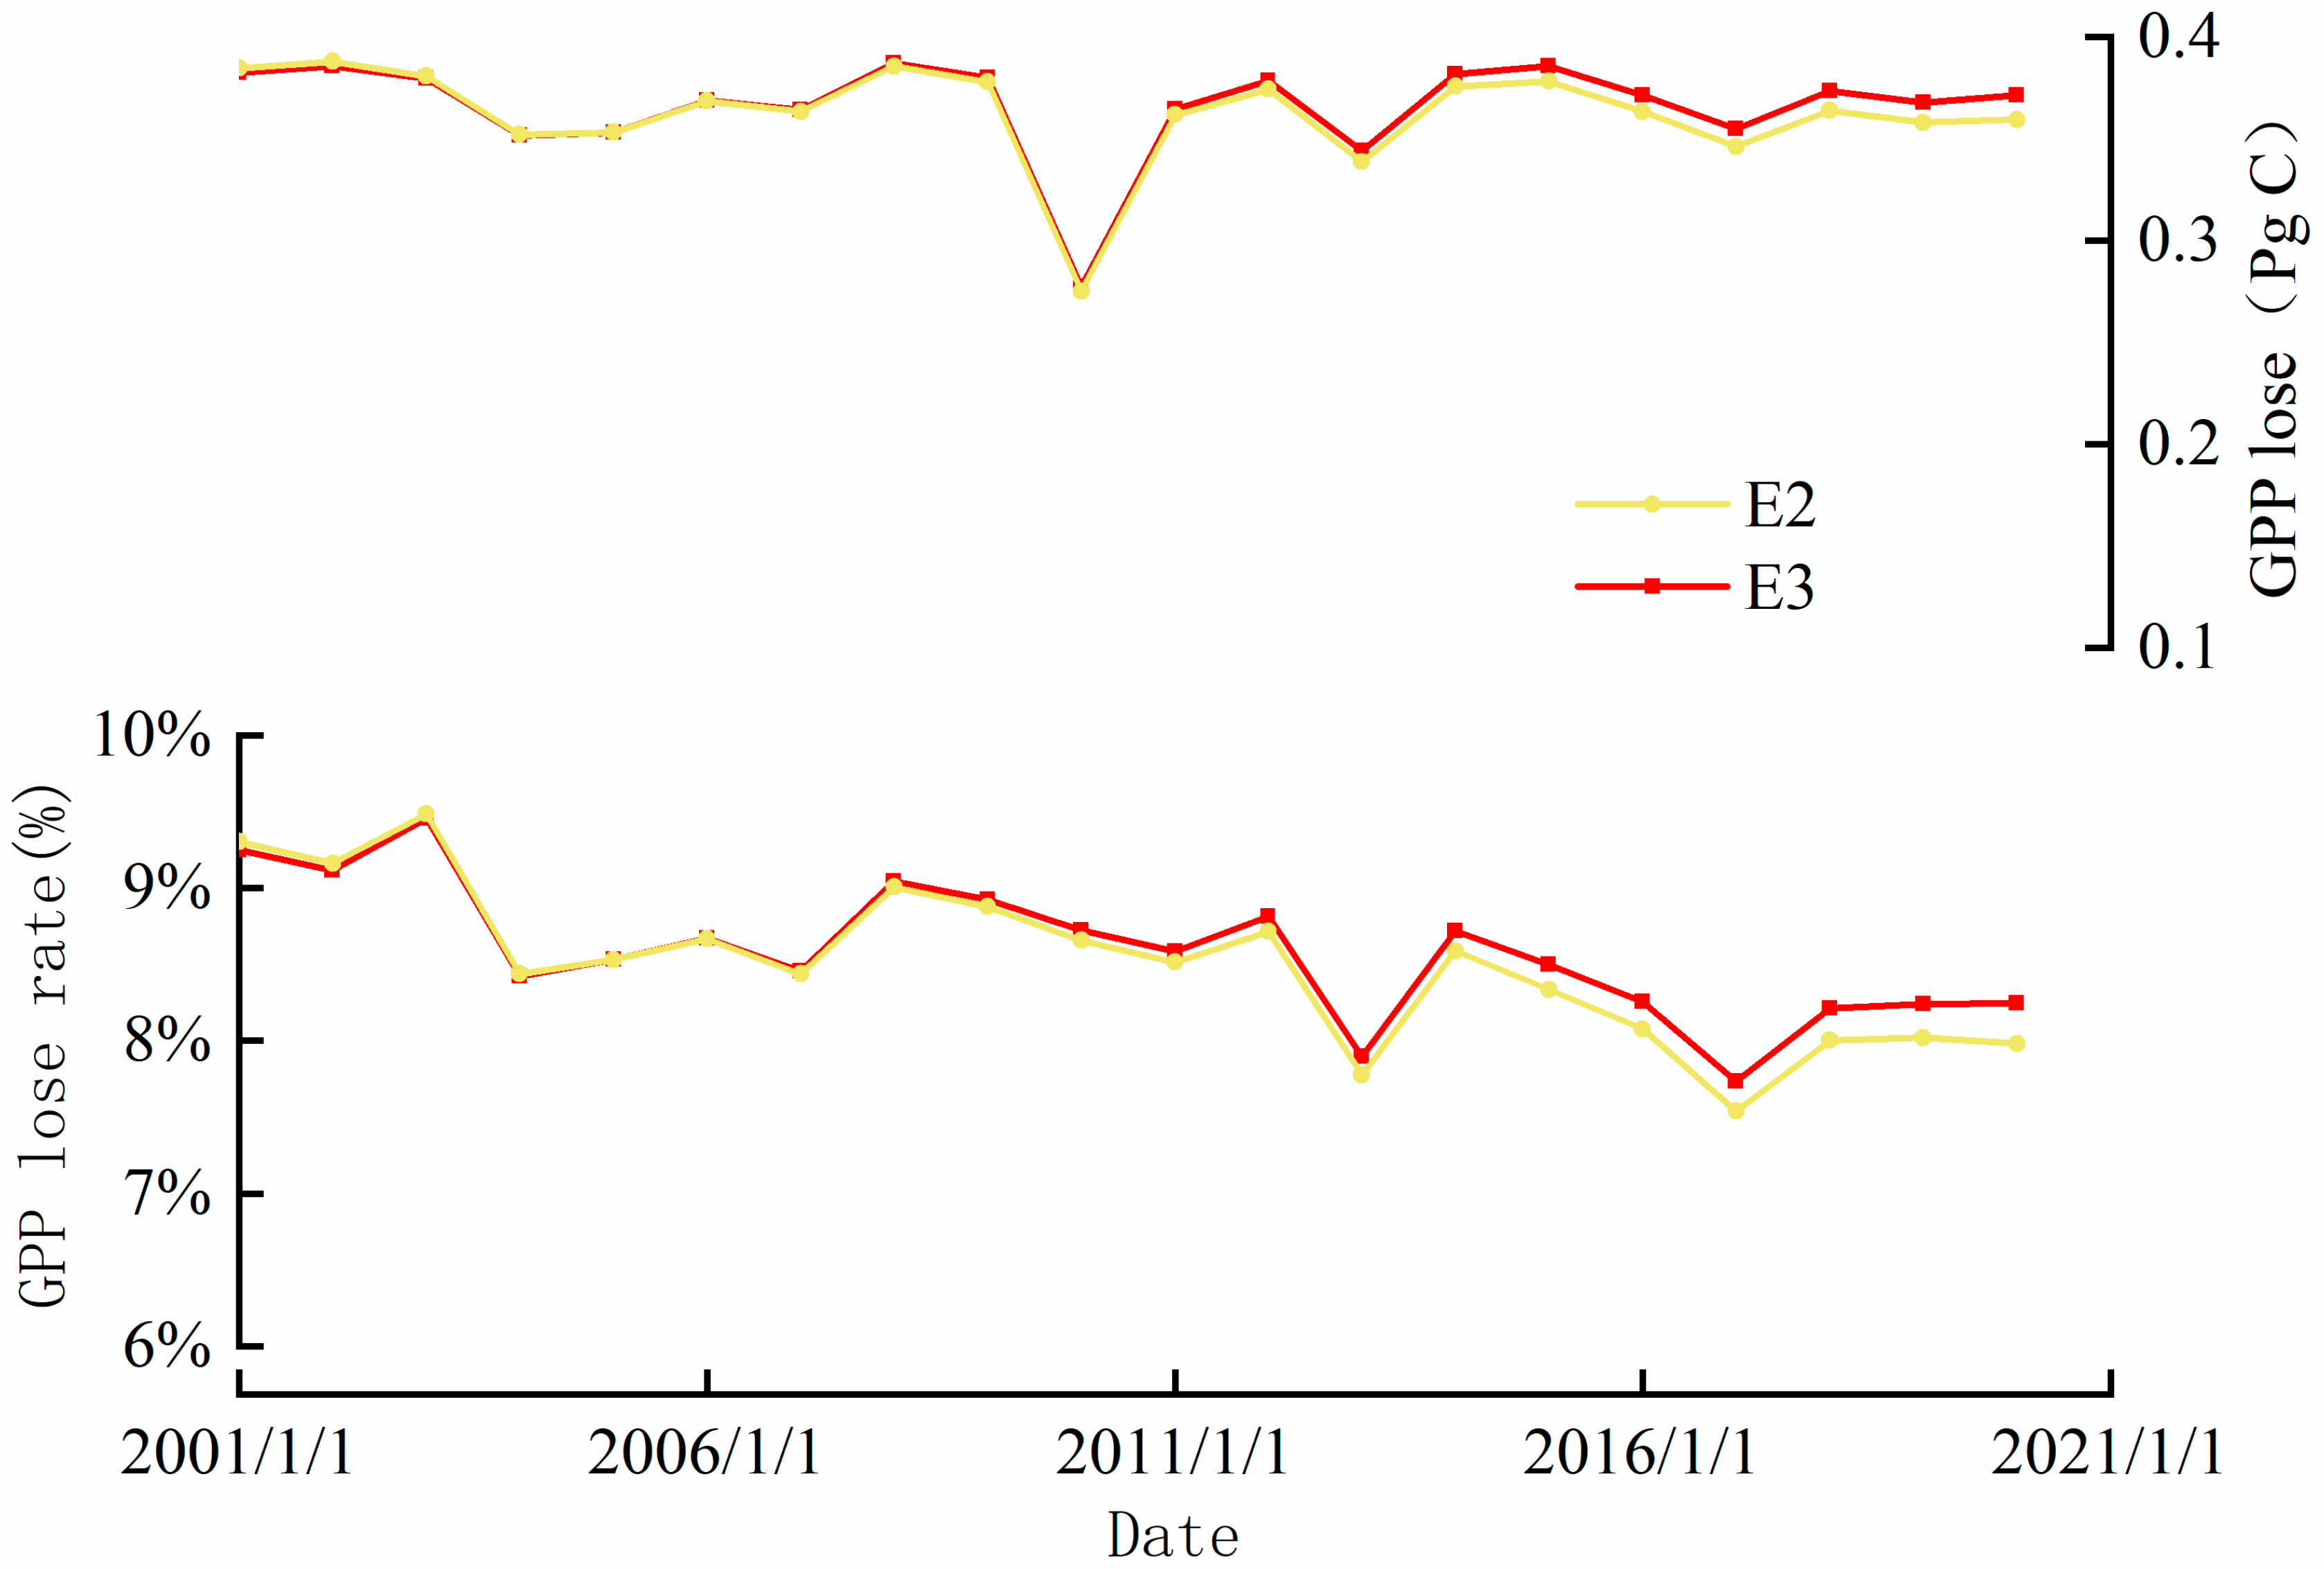
In contrast, the synergistic effect of [CO2] and [O3] on GPP decreased more slowly. After 2006, and the loss of GPP caused by [O3] alone exceeded the loss of GPP caused by the synergistic action of [O3] and [CO2] (Figure 4). Therefore, we compared the mean ozone uptake by vegetation stomata under single [O3] and [CO2 + O3] scenarios (Figure S8a). With the increase in CO2 concentration, ozone uptake by vegetation stomata gradually decreased (Figure S8b). This indicates that the synergistic effect of [CO2] and [O3] may cause a decrease in canopy conductance and prevent O3 uptake by vegetation stomata [20,21,36]. Field observation experiments have proven the adaptability of vegetation photosynthesis to the increase in CO2, and the change in stomatal conductance cannot affect the intercellular CO2 concentration of vegetation, but the adaptation of stomata to [CO2] has not been found [19,67]. This result is supported by Oliver et al. (2018) [51], whose estimates of GPP in European ecosystems demonstrate that elevated [CO2] offsets [O3] damage to GPP. The studies of Tao (2017) and Tai (2021) [36,37] on crop yield also reached a similar conclusion. Although the damage of [O3] on ecosystem GPP was greater than the gain of the CO2 fertilization effect on the ecosystem, CO2 gradually weakened the effect of ozone.
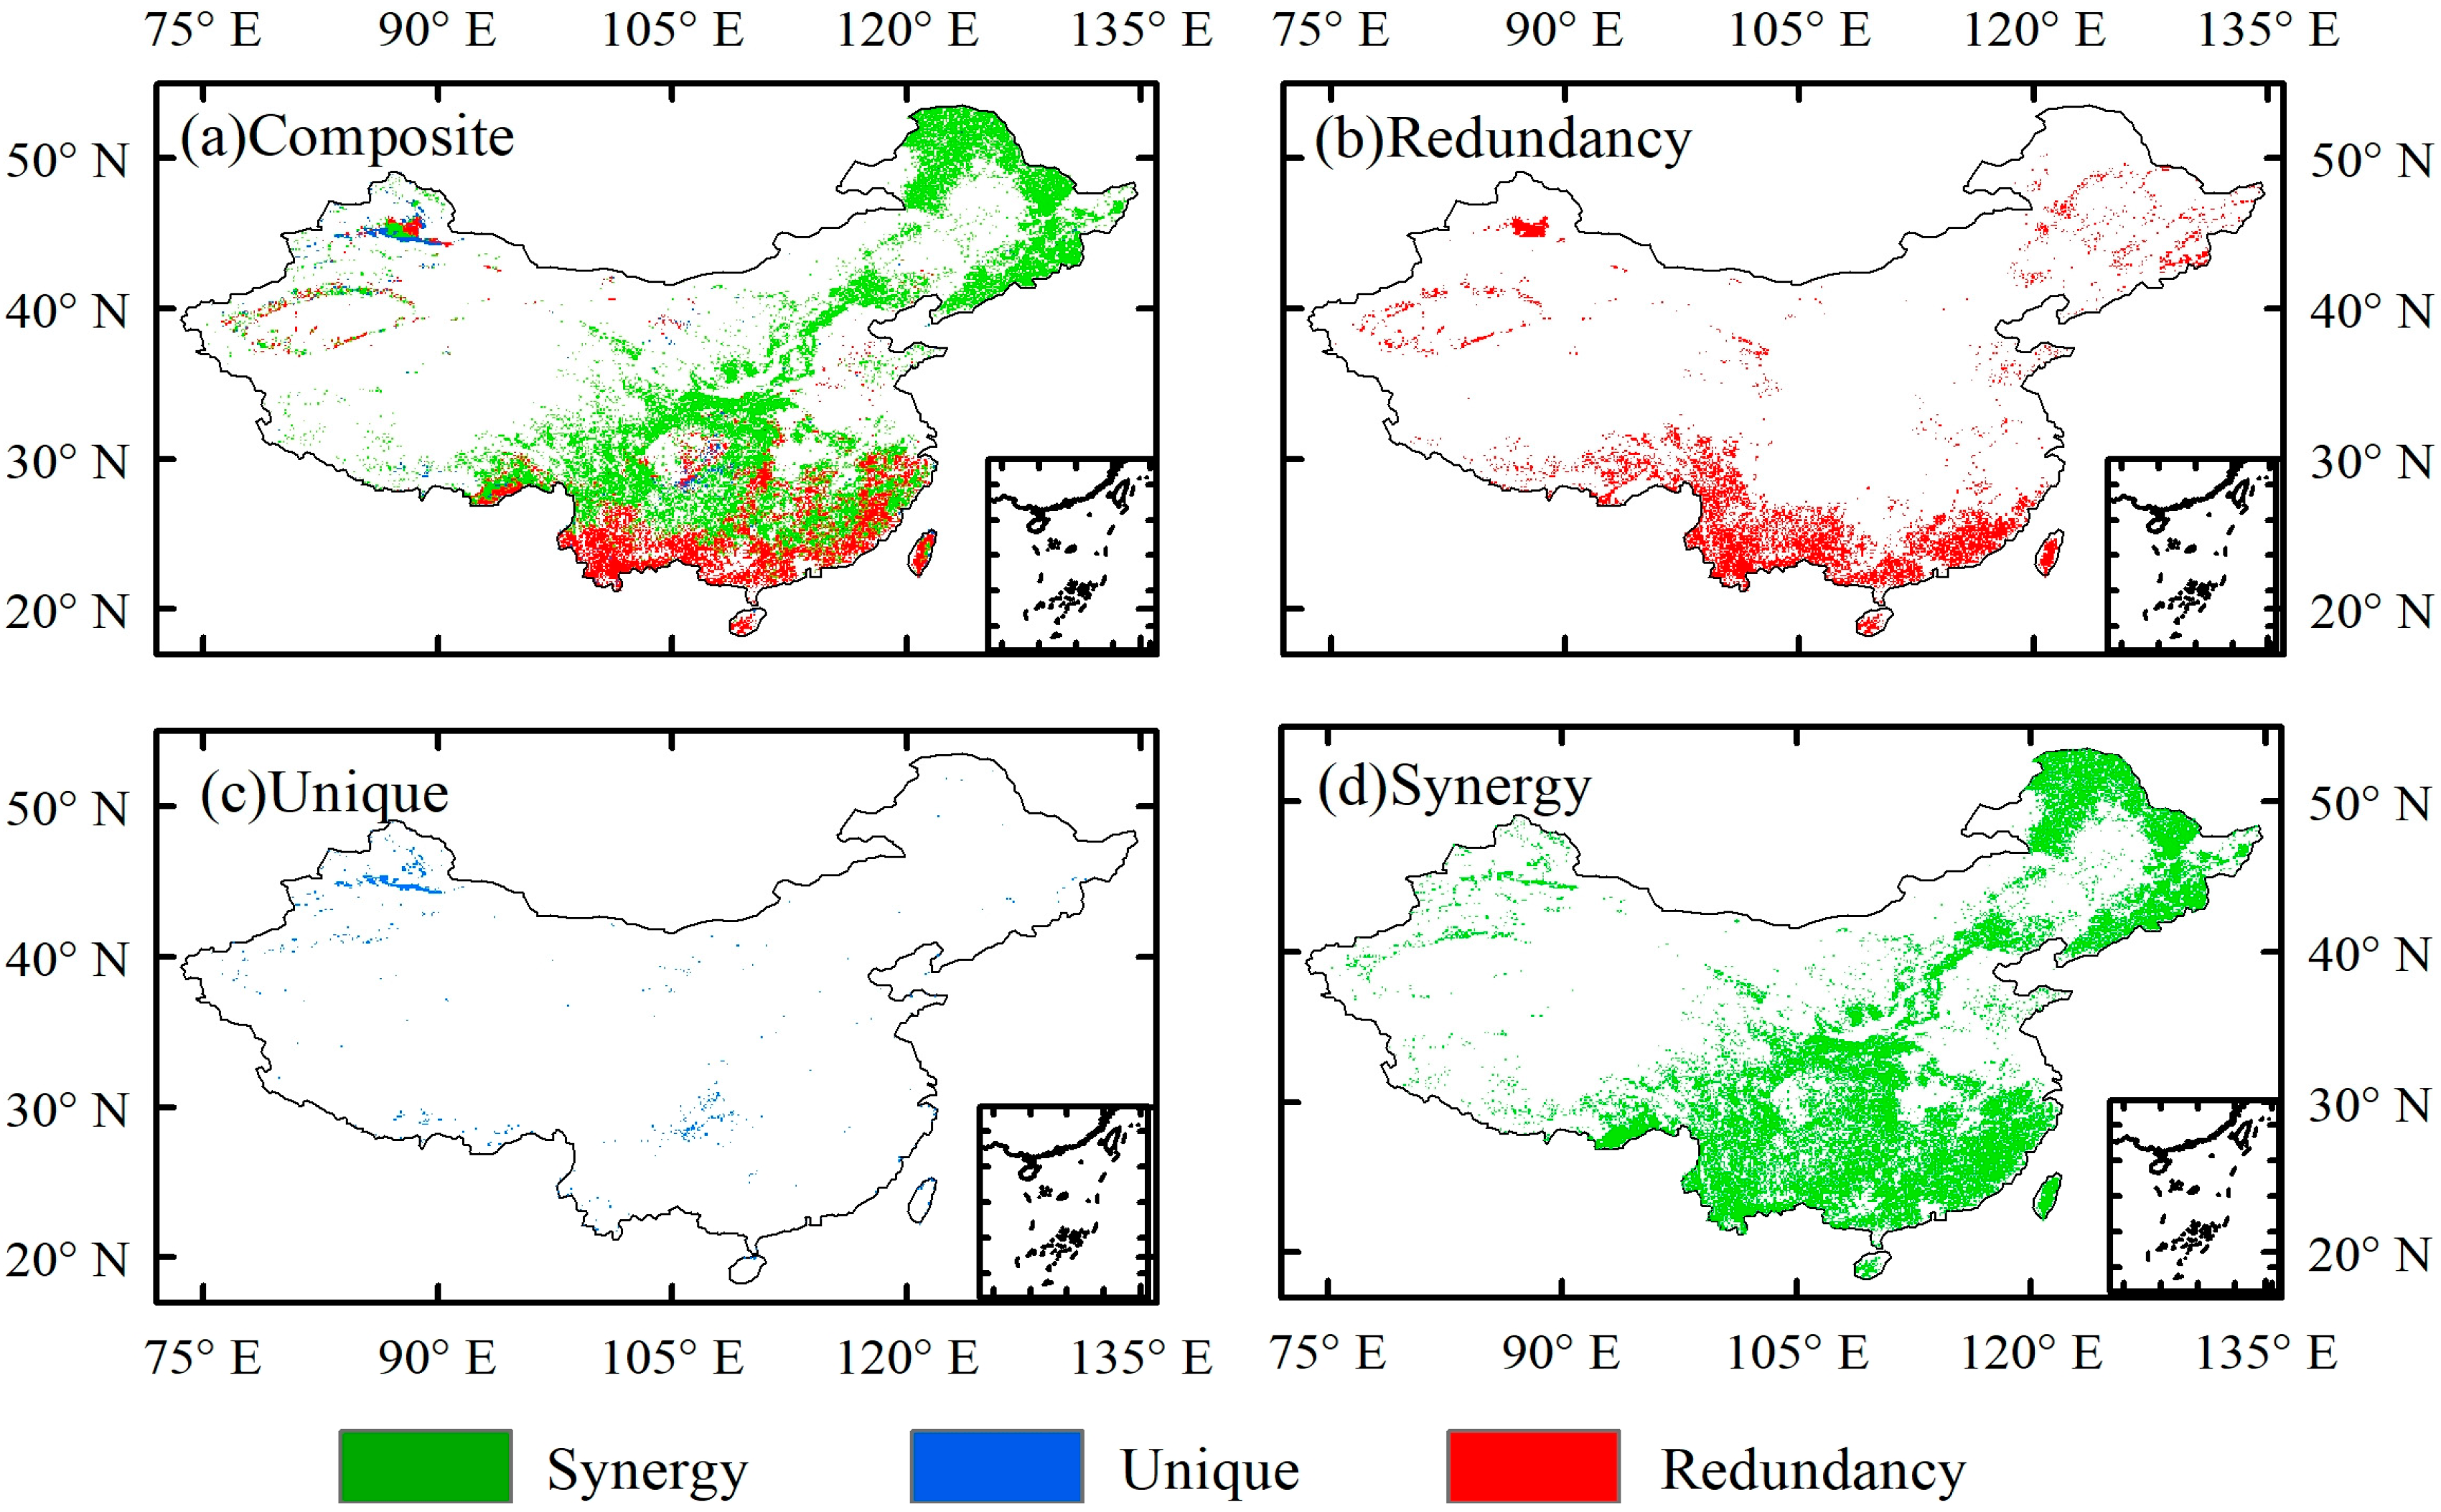
The results of causal analysis also reveal the synergistic effect of O3 and CO2, as shown in Figure 5. Most forest areas show a synergistic effect of O3 and CO2, some areas show a redundant effect of CO2 and O3, and only a few grids show uniqueness. This indicates that among the combination of meteorological factors that have the greatest impact on GPP, CO2 and O3 play a major role. Although subtropical regions are affected by ozone pollution, the better water and heat conditions result in the fact that the impact of ozone on GPP is not obvious. Therefore, the redundant effects of O3 and CO2 on GPP are mainly concentrated in subtropical regions. With the changes in water and heat conditions, O3 and CO2 show obvious synergistic regulatory effects in temperate regions.
Since the input data for the model are the LAI product rather than the LAI generated by the model’s simulation, this might cause LAI, to some extent, reflect the effect of CO2 fertilization on GPP, thereby underestimating the combined effect of O3 and CO2 on GPP. This study further conducted a SURD analysis on LAI, GPP, and CO2, and the results are shown in Figure 6.
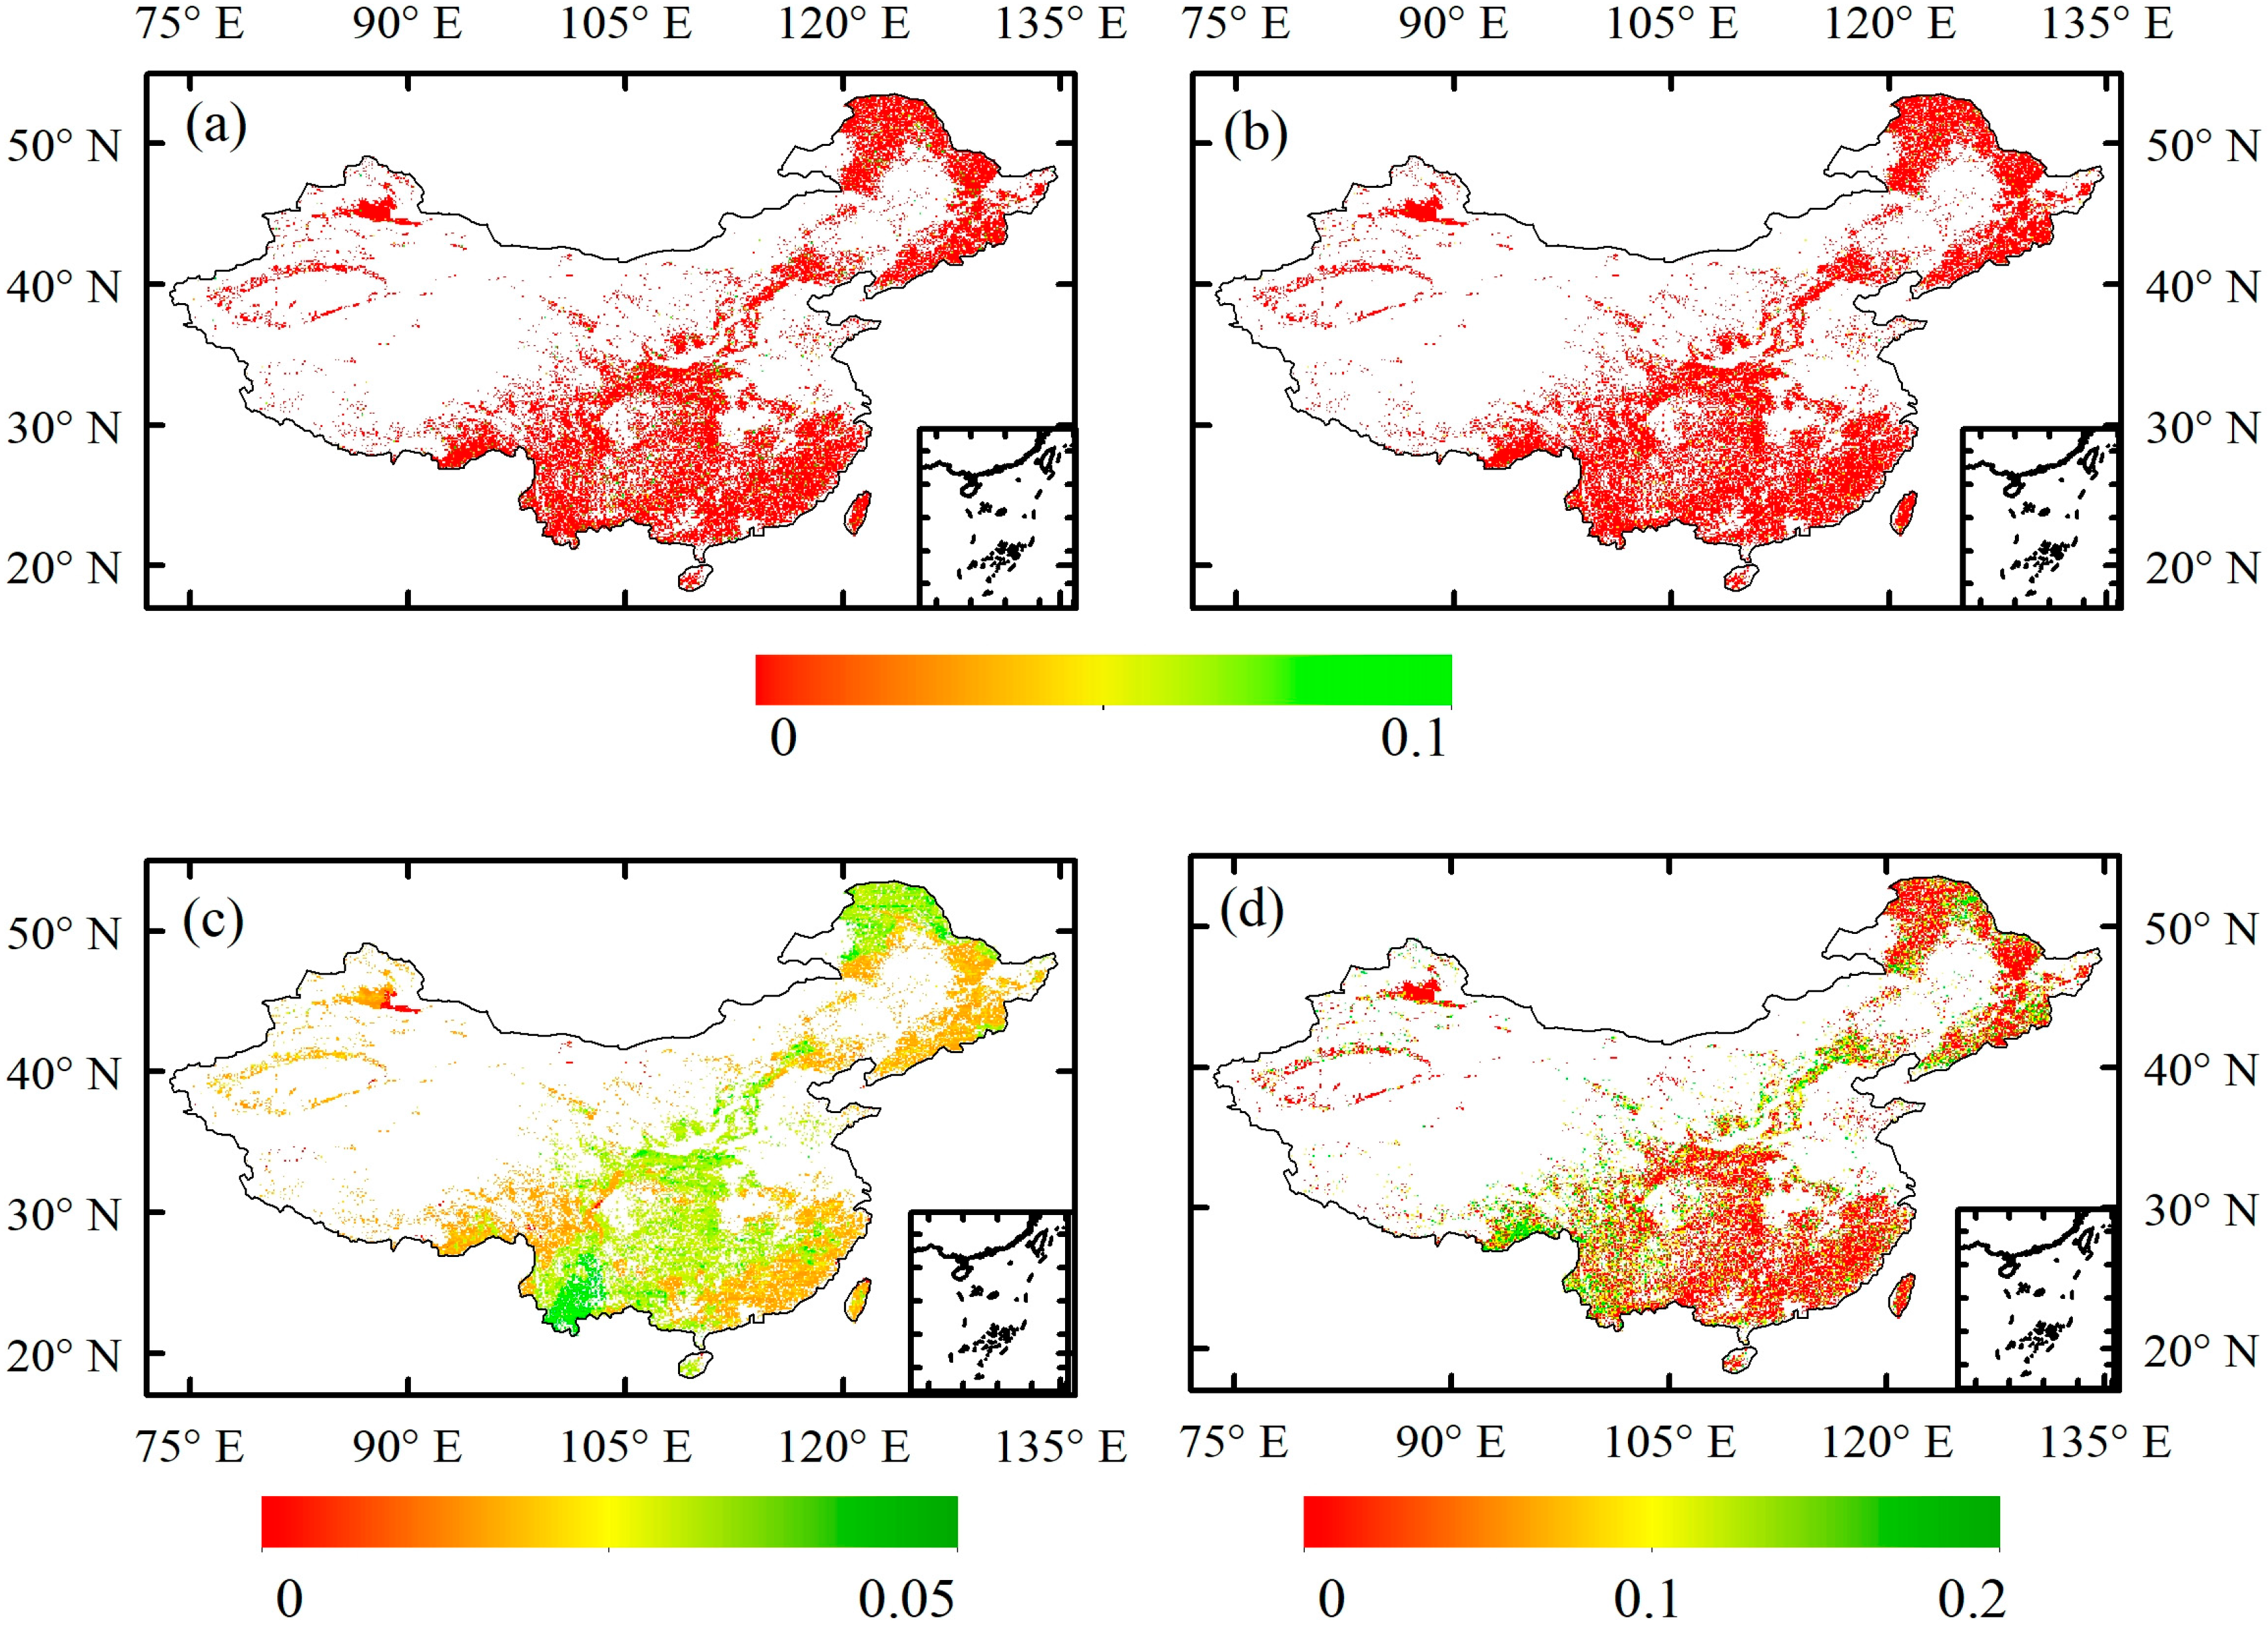
Firstly, LAI data were added to the SURD analysis, and the U value of LAI on GPP in the E2 scenario was output (Figure 6a). Further, in the second analysis, CO2 was removed, and the remaining factors were subjected to SURD analysis. The U value of LAI on GPP in the E2 scenario was again output (Figure 6b). If LAI records the CO2 fertilization effect, then after removing CO2, the U value of LAI will increase accordingly, and the increase ratio can be regarded as a part of the CO2 impact on GPP. Furthermore, LAI was used as the independent variable to investigate the U value of CO2 on LAI (Figure 6c), and the U value of CO2 on GPP from previous studies was also output (Figure 6d). It can be observed that the records of the carbon dioxide fertilization effect on LAI are relatively limited. After removing CO2, there was no significant change in the U value of GPP with respect to LAI. As can be seen from Figure 6c, the influence of CO2 on LAI shows strong spatial heterogeneity. In contrast, the effect of CO2 on GPP is more pronounced in Figure 6d.

4.2. Discussion on the Synergistic Mechanism of O3 and CO2

The effect of CO2 fertilization was mainly caused by the higher affinity of Rubisco for CO2. Due to the lack of a CO2 concentration mechanism in C3 plant cells, more photorespiration products are invested in the production of Rubisco [68,69]; as [CO2] rises, control of Asat by Rubisco (Vcmax) decreases and control by the capacity for RubP regeneration (Jmax) increases [70]. Rubisco is usually fully active and carbamylated at current [CO2] under steady-state high-light conditions [71,72]. As [CO2] increases, carbon fixation increases; there is an increasing demand for ATP (required for RubP regeneration), and the control of photosynthesis shifts from being limited by Rubisco to being limited by the capacity for RubP regeneration [73]. Succinctly, when the supply of photosynthate from chloroplasts exceeds the capacity for export and utilization by sink tissue, the imbalance in supply and demand is sensed in mesophyll cells by a mechanism that possibly involves hexokinase acting as a flux sensor [69,74]. It further leads to the decrease in stomatal conductance and the saturation of photosynthesis. However, the CO2 concentration in most areas is not enough to reach the maximum limit of Rubisco, so the increase in CO2 decreases the stomatal conductance while still enhancing the photosynthesis of vegetation.
Generally, the increase in O3 decreased the content of the Rubisco enzyme and nitrogen per unit area. This led to the decreases in Vcmax and Jmax and affected the change in stomatal conductance of vegetation [75]. A decrease in the stomatal conductance of plants leads to a decrease in ozone absorption, preventing plants from being further affected by ozone. Recently, some studies have shown that mesophyll conductance may be more significant than stomatal conductance. Ma (2022) [76] et al., based on fumigation experiments, found that ozone significantly reduced the mesophyll conductance of four woody plants but did not significantly reduce the stomatal conductance of all species. Therefore, the decrease in mesophyll conductance of ozone-controlled plants may be the main reason for the decrease in photosynthesis. However, the reciprocal mesophyll conductance (gm) of CO2 resistance during its propagation from cellular interstitium to photosynthetic carboxylation site is similar to stomatal conductance [77,78]. We believe that ozone reduces mesophyll conductance while reducing stomatal conductance, thus reducing the propagation resistance of CO2 in cells. Though this explanation lacks more solid physiological evidence, it gives us a very important implication in that ignoring the Vcmax and Jmax estimated by gm will accumulate the negative effect of O3 on gm in its effect on photosynthetic biochemical capacity. In addition, gm is a key parameter of photosynthesis models, and its inclusion in vegetation models can significantly improve the simulation accuracy of carbon and water fluxes [79].
A number of studies have indicated that using well-validated ecophysiological mechanism models to assess surface–atmosphere feedback is a better and more relevant approach [36,48,80], although this is challenging and requires further development. In addition, we also emphasize the careful consideration of model coupling using environmental factor feedback. For example, Oliver et al. (2018) [51] showed that although CO2 fertilization effects are ubiquitous in global terrestrial ecosystems, the protective effect of CO2 on O3 damage to all species at all growth stages cannot be assumed under a wide range of environmental conditions. In addition, in our study, the leaf area index, as the input data, has certain affects on the carbon allocation of vegetation, which leads to the model’s possible underestimation when responding to climate change. To further improve the modeling system, we need to continue to refine the species parameter base of the model and refine the physiological process of surface–atmosphere feedback by collecting more observational experiments.

4.3. Thoughts on Sustainable Development Resulting from Emission Reduction and Pollution Control

Over the past 20 years, China has been committed to energy conservation and emission reduction as well as air pollution control in order to address the challenges posed by future climate change [81,82]. China’s CO2 emissions reductions have been substantial: by 2020, carbon intensity decreased by 48.4% compared to 2005 levels, achieving objectives outlined in the Nationally Appropriate Mitigation Actions and Nationally Determined Contributions [83,84]. From the perspective of this study, although the increase in carbon dioxide concentration is gradually alleviating the impact of ozone on the GPP of vegetation, the damage to vegetation caused by air pollution still exists. Therefore, it is still very important to continue efforts in the control of air pollution. The emissions of SO2, NOx, and CO2 are inherent results of fossil fuel combustion, which provides a potential synergistic avenue of controlling greenhouse gas and air pollutant emissions at the same time [85]. Over the past decade, China has vigorously promoted the new energy industry and carried out afforestation programs, which precisely align with this goal [86,87,88]. Although afforestation has led to an increase in volatile organic compounds (VOCs) in some areas, it has a positive effect on overall air pollution control [89,90]. This is of great significance for the sustainable development of China’s terrestrial ecosystems.

5. Conclusions

In this study, climate change, CO2 and O3 are integrated into the ecological process model. The single and combined effects of [CO2] and [O3] on the GPP of woodland ecosystems in China under historical climate change scenarios were investigated by model setting. Our results suggest that CO2 fertilization is widespread and increasing in woodland ecosystems in China. While ozone damage may currently outweigh the gains in forest productivity of carbon dioxide, rising carbon dioxide and climate change are gradually reducing ozone damage to woodland. Particularly in boreal forest areas, where ozone concentrations are low, there has been a significant increase in GPP. However, simply reducing carbon dioxide emissions could still cause a sustained increase in O3 damage. This study demonstrates the superiority of ecological process models for assessing interactive responses to climate change. The importance of considering multiple factors in simulation research is emphasized. In addition, the comparison of individual and combined models will provide an important basis for national emission reduction strategies as well as O3 regulation and climate adaptation in different regions.

Supplementary Materials

The following supporting information can be downloaded at: https://www.mdpi.com/article/10.3390/su17167198/s1, Figure S1: Site verification of GPP simulated by BEPS_O3 model based on flux observation data at sites of different vegetation types. The red is the regression line based on the points, and the blue dotted line is the standard line with slope 1. Figure S2: Verification of seasonal variation of GPP simulated by BEPS_O3 model based on flux observation data at different vegetation type stations. The red line is the GPP diurnal variation curve of model output, and the blue line is the GPP diurnal variation curve of flux observation stations. Figure S3: Mean daytime O3 concentrations for 2001s (a) and 2020s (b), and changes in average daily O3 concentrations between the two periods (c). Figure S4: Plotted interannual changes in mean ozone concentration and atmospheric carbon dioxide concentration in study area, based on historical ozone concentration and carbon dioxide concentration. Figure S5: Mean daily temperature (a,b), radiation (d,e), relative humidity (h,i) and precipitation (k,l) in different periods. And the change of climate factors between the two periods (c,f,j,m). Figure S6: Singly and combined effects of simulated GPP owing to Climate change, [CO2], [O3]. We calculated the mean value of GPP in different periods and the variation of GPP in different periods. Figure S7: Interannual variation of singly and combined effects of climate change, [CO2], [O3] on simulated GPP. Figure S8: Interannual changes in canopy conductance and O3 uptake of woodland ecosystems under different models. The green curves in Figure a and b represent the changes of O3 uptake and canopy conductance under the condition of E3. The blue curves in Figure a and b represent O3 uptake and canopy conductance changes of vegetation under E2 conditions. The red curve represents the change of canopy conductance under E4 conditions. Figure S9: Calibration of BEPS for O3 impacts on plant productivity for each PFT. The dashed line is the regression line through the modeled points, and the solid line is the regression line from the observed dose—response relationship. The x-axis is the cumulative uptake of O3 (POD1) above the critical O3 threshold (1 nmol/m2 s). Because there were no species yield regression curves selected for different climatic zones, there was only one regression line. Table S1: Values of α for different vegetation types. References [58,91] are cited in Supplementary Materials.

Author Contributions

Q.W.: Conceptualization, Software, Writing—Original draft preparation; S.W.: Writing—Review and Editing, Supervision, Project administration; Z.L.: Software, Validation, Data Curation; S.C.: Validation, Data Curation; T.L.: Validation, Data Curation; B.C.: Review and Editing; Y.L.: Data Curation; M.H.: Writing—Review and Editing, Supervision, Project administration; L.S.: Data Curation. All authors have read and agreed to the published version of the manuscript.

Funding

This research was supported by Science and Technology Planning Project of Hebei Academy of Sciences (25103) and China University of Geosciences Fund (2019004).

Data Availability Statement

The BEPS model (site scale) for the coupled ozone module used in this article can be downloaded at the following link. https://doi.org/10.6084/m9.figshare.25476388. Meteorological data are collected from ERA5_Land. https://doi.org/10.24381/cds.e2161bac (accessed on 12 July 2019). LAI dataset products can be downloaded from this link https://doi.org/10.5281/zenodo.4700264 (accessed on 19 April 2021). Due to the confidentiality of some data acquisition, observation flux data need to be obtained through the ChinaFlux website. The following link is for data retrieval and application http://www.chinaflux.org/general/index.aspx?nodeid=25 (accessed on 28 September 2019).

Acknowledgments

We are grateful to the authors of multiple public datasets for providing free data downloads, including the leaf area index data from GLOBMAP-V3 LAI. The observed data of eddy covariance downloaded from ChinaFLUX and National Earth System Science Data Center.

Conflicts of Interest

The authors declare that they have no known competing financial interest or personal relationships that could have appeared to influence the work reported in this paper.

References

  1. Jakob, M.; Steckel, J.C. Implications of climate change mitigation for sustainable development. Environ. Res. Lett. 2016, 11, 104010. [Google Scholar] [CrossRef]
  2. Fujimori, S.; Hasegawa, T.; Takahashi, K.; Dai, H.; Liu, J.; Ohashi, H.; Xie, Y.; Zhang, Y.; Matsui, T.; Hijioka, Y. Measuring the sustainable development implications of climate change mitigation. Environ. Res. Lett. 2020, 15, 85004. [Google Scholar] [CrossRef]
  3. Hong, C.; Zhong, R.; Xu, M.; He, P.; Mo, H.; Qin, Y.; Shi, D.; Chen, X.; He, K.; Zhang, Q. Interactions Among Food Systems, Climate Change, and Air Pollution: A Review. Engineering 2025, 44, 215–233. [Google Scholar] [CrossRef]
  4. Prasad, S.; Yadav, K.K.; Kumar, S.; Pandita, P.; Bhutto, J.K.; Alreshidi, M.A.; Ravindran, B.; Yaseen, Z.M.; Osman, S.M.; Cabral-Pinto, M.M.S. Review on biofuel production: Sustainable development scenario, environment, and climate change perspectives A sustainable approach. J. Environ. Chem. Eng. 2024, 12, 111996. [Google Scholar] [CrossRef]
  5. Fares, S.; Weber, R.; Park, J.; Gentner, D.; Karlik, J.; Goldstein, A.H. Ozone deposition to an orange orchard: Partitioning between stomatal and non-stomatal sinks. Environ. Pollut. 2012, 169, 258–266. [Google Scholar] [CrossRef] [PubMed]
  6. Wedow, J.M.; Ainsworth, E.A.; Li, S. Plant biochemistry influences tropospheric ozone formation, destruction, deposition, and response. Trends Biochem. Sci. 2021, 46, 992–1002. [Google Scholar] [CrossRef]
  7. Grulke, N.E.; Heath, R.L. Ozone effects on plants in natural ecosystems. Plant Biol. 2019, 22, 12–37. [Google Scholar] [CrossRef]
  8. Li, P.; Calatayud, V.; Gao, F.; Uddling, J.; Feng, Z. Differences in ozone sensitivity among woody species are related to leaf morphology and antioxidant levels. Tree Physiol. 2016, 36, 1105–1116. [Google Scholar] [CrossRef]
  9. Chen, X.; Mo, X.; Hu, S.; Liu, S. Contributions of climate change and human activities to ET and GPP trends over North China Plain from 2000 to 2014. J. Geogr. Sci. 2017, 27, 661–680. [Google Scholar] [CrossRef]
  10. Hu, L.; Fan, W.; Yuan, W.; Ren, H.; Cui, Y. Spatiotemporal Variation of Vegetation Productivity and Its Feedback to Climate Change in Northeast China over the Last 30 Years. Remote Sens. 2021, 13, 951. [Google Scholar] [CrossRef]
  11. Liu, Y.; Liu, H.; Chen, Y.; Gang, C.; Shen, Y. Quantifying the contributions of climate change and human activities to vegetation dynamic in China based on multiple indices. Sci. Total Environ. 2022, 838, 156553. [Google Scholar] [CrossRef]
  12. Xie, S.; Mo, X.; Hu, S.; Liu, S. Contributions of climate change, elevated atmospheric CO2 and human activities to ET and GPP trends in the Three-North Region of China. Agr. For. Meteorol. 2020, 295, 108183. [Google Scholar] [CrossRef]
  13. Hao, M.; Li, Y.; Zhuang, W. Crustal movement and strain distribution in East Asia revealed by GPS observations. Sci. Rep. 2019, 9, 16797. [Google Scholar] [CrossRef]
  14. Jarvis, P.G. The interpretation of the variations in leaf water potential and stomatal conductance found in canopies in the field. Philos. Trans. R. Soc. London B Biol. Sci. 1976, 273, 593–610. [Google Scholar]
  15. Schimel, D.; Stephens, B.B.; Fisher, J.B. Effect of increasing CO2 on the terrestrial carbon cycle. Proc. Natl. Acad. Sci. USA 2015, 112, 436–441. [Google Scholar] [CrossRef] [PubMed]
  16. Porter, J.R.; Xie, L.; Challinor, A.J.; Cochrane, K.; Howden, S.M.; Iqbal, M.M.; Lobell, D.B.; Travasso, M.I. Food security and food production systems. In Climate Change 2014: Impacts, Adaptation, and Vulnerability Part A: Global and Sectoral Aspects; Cambridge University Press: Cambridge, UK, 2014. [Google Scholar]
  17. Haworth, M.; Marino, G.; Materassi, A.; Raschi, A.; Scutt, C.P.; Centritto, M. The functional significance of the stomatal size to density relationship: Interaction with atmospheric [CO2] and role in plant physiological behaviour. Sci. Total Environ. 2023, 863, 160908. [Google Scholar] [CrossRef] [PubMed]
  18. Johansson, K.S.L.; El-Soda, M.; Pagel, E.; Meyer, R.C.; Tõldsepp, K.; Nilsson, A.K.; Brosché, M.; Kollist, H.; Uddling, J.; Andersson, M.X. Genetic controls of short- and long-term stomatal CO2 responses in Arabidopsis thaliana. Ann. Bot. 2020, 126, 179–190. [Google Scholar] [CrossRef] [PubMed]
  19. Azoulay Shemer, T.; Palomares, A.; Bagheri, A.; Israelsson Nordstrom, M.; Engineer, C.B.; Bargmann, B.O.R.; Stephan, A.B.; Schroeder, J.I. Guard cell photosynthesis is critical for stomatal turgor production, yet does not directly mediate CO2-and ABA-induced stomatal closing. Plant J. 2015, 83, 567–581. [Google Scholar] [CrossRef]
  20. Engineer, C.B.; Hashimoto-Sugimoto, M.; Negi, J.; Israelsson-Nordström, M.; Azoulay-Shemer, T.; Rappel, W.; Iba, K.; Schroeder, J.I. CO2 Sensing and CO2 Regulation of Stomatal Conductance: Advances and Open Questions. Trends Plant Sci. 2016, 21, 16–30. [Google Scholar] [CrossRef]
  21. Keenan, T.F.; Hollinger, D.Y.; Bohrer, G.; Dragoni, D.; Munger, J.W.; Schmid, H.P.; Richardson, A.D. Increase in forest water-use efficiency as atmospheric carbon dioxide concentrations rise. Nature 2013, 499, 324–327. [Google Scholar] [CrossRef] [PubMed]
  22. Alexander, L.; Allen, S.; Bindoff, N.; Breon, F.; Church, J.; Cubasch, U.; Emori, S.; Forster, P.; Friedlingstein, P.; Gillett, N.; et al. Climate Change 2013: The Physical Science Basis. In Contribution of Working Group I (WGI) to the Fifth Assessment Report (AR5) of the Intergovernmental Panel on Climate Change (IPCC); Cambridge University Press: Cambridge, UK, 2013. [Google Scholar]
  23. Pellegrini, E.; Hoshika, Y.; Dusart, N.; Cotrozzi, L.; Gérard, J.; Nali, C.; Vaultier, M.; Jolivet, Y.; Lorenzini, G.; Paoletti, E. Antioxidative responses of three oak species under ozone and water stress conditions. Sci. Total Environ. 2019, 647, 390–399. [Google Scholar] [CrossRef]
  24. Saxena, P.; Srivastava, A.; Tyagi, M.; Kaur, S. Impacts of Tropospheric Ozone on Plant Metabolism—A Review. Pollut. Res. 2019, 38, 175–180. [Google Scholar]
  25. Zapletal, M.; Juran, S.; Krpeš, V.; Michna, K.; Edwards-Jonášová, M.; Cudlín, P. Effect of Ozone Flux on Selected Structural and Antioxidant Characteristics of a Mountain Norway Spruce Forest. Balt. For. 2018, 24, 261–267. [Google Scholar]
  26. Calatayud, V.; Cerveró, J.; Calvo, E.; García-Breijo, F.; Reig-Armiñana, J.; Sanz, M.J. Responses of evergreen and deciduous Quercus species to enhanced ozone levels. Environ. Pollut. 2011, 159, 55–63. [Google Scholar] [CrossRef]
  27. Paoletti, E.; Grulke, N. Does living in elevated CO2 ameliorate tree response to ozone? A review on stomatal responses. Environ. Pollut. 2005, 137, 483–493. [Google Scholar] [CrossRef]
  28. Feng, Z.; Pang, J.; Kobayashi, K.; Zhu, J.; Ort, D.R. Differential responses in two varieties of winter wheat to elevated ozone concentration under fully open-air field conditions. Glob. Change Biol. 2011, 17, 580–591. [Google Scholar] [CrossRef]
  29. Fusaro, L.; Palma, A.; Salvatori, E.; Basile, A.; Maresca, V.; Asadi Karam, E.; Manes, F. Functional indicators of response mechanisms to nitrogen deposition, ozone, and their interaction in two Mediterranean tree species. PLoS ONE 2017, 12, e185836. [Google Scholar] [CrossRef] [PubMed]
  30. Hayes, F.; Harmens, H.; Mills, G.; Bender, J.; Grünhage, L. Ozone critical levels for (semi-)natural vegetation dominated by perennial grassland species. Environ. Sci. Pollut. Res. 2021, 28, 15090–15098. [Google Scholar] [CrossRef] [PubMed]
  31. Leung, F.; Pang, J.Y.S.; Tai, A.P.K.; Lam, T.; Tao, D.K.C.; Sharps, K. Evidence of Ozone-Induced Visible Foliar Injury in Hong Kong Using Phaseolus Vulgaris as a Bioindicator. Atmosphere 2020, 11, 266. [Google Scholar] [CrossRef]
  32. Li, D.; Shindell, D.; Ding, D.; Lu, X.; Zhang, L.; Zhang, Y. Surface ozone impacts on major crop production in China from 2010 to 2017. Atmos. Chem. Phys. 2022, 22, 2625–2638. [Google Scholar] [CrossRef]
  33. Li, L.; Li, J.; Wang, X.; Wang, W.; Leung, F.; Liu, X.; Wang, C. Growth reduction and alteration of nonstructural carbohydrate (NSC) allocation in a sympodial bamboo (Indocalamus decorus) under atmospheric O3 enrichment. Sci. Total Environ. 2022, 826, 154096. [Google Scholar] [CrossRef]
  34. Tai, A.P.K.; Martin, M.V.; Heald, C.L. Threat to future global food security from climate change and ozone air pollution. Nat. Clim. Change 2014, 4, 817–821. [Google Scholar] [CrossRef]
  35. Seltzer, K.M.; Shindell, D.T.; Kasibhatla, P.; Malley, C.S. Magnitude, trends, and impacts of ambient long-term ozone exposure in the United States from 2000 to 2015. Atmos. Chem. Phys. 2020, 20, 1757–1775. [Google Scholar] [CrossRef]
  36. Tao, F.; Feng, Z.; Tang, H.; Chen, Y.; Kobayashi, K. Effects of climate change, CO2 and O3 on wheat productivity in Eastern China, singly and in combination. Atmos. Environ. 2017, 153, 182–193. [Google Scholar] [CrossRef]
  37. Tai, A.P.K.; Sadiq, M.; Pang, J.Y.S.; Yung, D.H.Y.; Feng, Z. Impacts of Surface Ozone Pollution on Global Crop Yields: Comparing Different Ozone Exposure Metrics and Incorporating Co-effects of CO2. Front. Sustain. Food Syst. 2021, 5, 534616. [Google Scholar] [CrossRef]
  38. Mo, X.; Liu, S.; Chen, X.; Hu, S. Variability, tendencies, and climate controls of terrestrial evapotranspiration and gross primary productivity in the recent decade over China. Ecohydrology 2018, 11, e1951. [Google Scholar] [CrossRef]
  39. Feng, X.; Liu, G.; Chen, J.M.; Chen, M.; Liu, J.; Ju, W.M.; Sun, R.; Zhou, W. Net primary productivity of China’s terrestrial ecosystems from a process model driven by remote sensing. J. Environ. Manag. 2007, 85, 563–573. [Google Scholar] [CrossRef] [PubMed]
  40. Ren, W.; Tian, H.; Liu, M.; Zhang, C.; Chen, G.; Pan, S.; Felzer, B.; Xu, X. Effects of tropospheric ozone pollution on net primary productivity and carbon storage in terrestrial ecosystems of China. J. Geophys. Res. 2007, 112. [Google Scholar] [CrossRef]
  41. Tian, H.; Melillo, J.; Lu, C.; Kicklighter, D.; Liu, M.; Ren, W.; Xu, X.; Chen, G.; Zhang, C.; Pan, S.; et al. China’s terrestrial carbon balance: Contributions from multiple global change factors. Glob. Biogeochem. Cycles 2011, 25. [Google Scholar] [CrossRef]
  42. Ren, W.; Tian, H.; Chen, G.; Liu, M.; Zhang, C.; Chappelka, A.H.; Pan, S. Influence of ozone pollution and climate variability on net primary productivity and carbon storage in China’s grassland ecosystems from 1961 to 2000. Environ. Pollut. 2007, 149, 327–335. [Google Scholar] [CrossRef]
  43. Ren, W.; Tian, H.; Tao, B.; Chappelka, A.; Sun, G.; Lu, C.; Liu, M.; Chen, G.; Xu, X. Impacts of tropospheric ozone and climate change on net primary productivity and net carbon exchange of China’s forest ecosystems. Glob. Ecol. Biogeogr. 2011, 20, 391–406. [Google Scholar] [CrossRef]
  44. Chen, J.M.; Liu, J.; Cihlar, J.; Goulden, M.L. Daily canopy photosynthesis model through temporal and spatial scaling for remote sensing applications. Ecol. Model. 1999, 124, 99–119. [Google Scholar] [CrossRef]
  45. Chen, J.M.; Mo, G.; Pisek, J.; Liu, J.; Deng, F.; Ishizawa, M.; Chan, D. Effects of foliage clumping on the estimation of global terrestrial gross primary productivity. Glob. Biogeochem. Cycles 2012, 26. [Google Scholar] [CrossRef]
  46. Chen, B.; Chen, J.M.; Baldocchi, D.D.; Liu, Y.; Wang, S.; Zheng, T.; Black, T.A.; Croft, H. Including soil water stress in process-based ecosystem models by scaling down maximum carboxylation rate using accumulated soil water deficit. Agric. For. Meteorol. 2019, 276–277, 107649. [Google Scholar] [CrossRef]
  47. Farquhar, G.; O’Leary, M.H.; Berry, J. On the Relationship Between Carbon Isotope Discrimination and the Intercellular Carbon Dioxide Concentration in Leaves. Aust. J. Plant Physiol. 1982, 13, 281–292. [Google Scholar] [CrossRef]
  48. Anav, A.; Liu, Q.; De Marco, A.; Proietti, C.; Savi, F.; Paoletti, E.; Piao, S. The role of plant phenology in stomatal ozone flux modeling. Glob. Change Biol. 2018, 24, 235–248. [Google Scholar] [CrossRef] [PubMed]
  49. Anav, A.; Menut, L.; Khvorostyanov, D.; Viovy, N. Impact of tropospheric ozone on the Euro-Mediterranean vegetation. Glob. Change Biol. 2011, 17, 2342–2359. [Google Scholar] [CrossRef]
  50. Sitch, S.; Cox, P.M.; Collins, W.J.; Huntingford, C. Indirect radiative forcing of climate change through ozone effects on the land-carbon sink. Nature 2007, 448, 791–794. [Google Scholar] [CrossRef] [PubMed]
  51. Oliver, R.J.; Mercado, L.M.; Sitch, S.; Simpson, D.; Medlyn, B.E.; Lin, Y.; Folberth, G.A. Large but decreasing effect of ozone on the European carbon sink. Biogeosciences 2018, 15, 4245–4269. [Google Scholar] [CrossRef]
  52. Hersbach, H.; Bell, B.; Berrisford, P.; Hirahara, S.; Horányi, A.; Muñoz-Sabater, J.; Nicolas, J.; Peubey, C.; Radu, R.; Schepers, D.; et al. The ERA5 global reanalysis. Q. J. R. Meteorol. Soc. 2020, 146, 1999–2049. [Google Scholar] [CrossRef]
  53. Bell, B.; Hersbach, H.; Simmons, A.; Berrisford, P.; Dahlgren, P.; Horányi, A.; Muñoz-Sabater, J.; Nicolas, J.; Radu, R.; Schepers, D.; et al. The ERA5 global reanalysis: Preliminary extension to 1950. Q. J. R. Meteorol. Soc. 2021, 147, 4186–4227. [Google Scholar] [CrossRef]
  54. Liu, Y.; Liu, R.; Chen, J.M. Retrospective retrieval of long-term consistent global leaf area index (1981–2011) from combined AVHRR and MODIS data. J. Geophys. Res. Biogeosci. 2012, 117. [Google Scholar] [CrossRef]
  55. Xing, X.; Wu, M.; Zhang, W.; Ju, W.; Tagesson, T.; He, W.; Wang, S.; Wang, J.; Hu, L.; Yuan, S.; et al. Modeling China’s terrestrial ecosystem gross primary productivity with BEPS model: Parameter sensitivity analysis and model calibration. Agr. For. Meteorol. 2023, 343, 109789. [Google Scholar] [CrossRef]
  56. Zhong, B.; Ma, P.; Nie, A.; Yang, A.; Yao, Y.; Lü, W.; Zhang, H.; Liu, Q. Land cover mapping using time series HJ-1/CCD data. Sci. China Earth Sci. 2014, 57, 1790–1799. [Google Scholar] [CrossRef]
  57. Martínez-Sánchez, Á.; Arranz, G.; Lozano-Durán, A. Decomposing causality into its synergistic, unique, and redundant components. Nat. Commun. 2024, 15, 9296. [Google Scholar] [CrossRef]
  58. Wang, Q.; Huang, M.; Wang, S.; Chen, B.; Liu, Z.; Wang, Z.; Chen, S.; Li, H.; Zhu, T.; Li, D.; et al. Evaluation of the impacts of ozone on the vegetation productivity of woodland and grassland ecosystems in China. Ecol. Model. 2023, 483, 110426. [Google Scholar] [CrossRef]
  59. Chen, B.; Chen, J.M.; Ju, W. Remote sensing-based ecosystem–atmosphere simulation scheme (EASS)—Model formulation and test with multiple-year data. Ecol. Model. 2007, 209, 277–300. [Google Scholar] [CrossRef]
  60. Li, Q.; Lu, X.; Wang, Y.; Huang, X.; Cox, P.M.; Luo, Y. Leaf area index identified as a major source of variability in modeled CO2 fertilization. Biogeosciences 2018, 15, 6909–6925. [Google Scholar] [CrossRef]
  61. Launiainen, S.; Katul, G.G.; Leppä, K.; Kolari, P.; Aslan, T.; Grönholm, T.; Korhonen, L.; Mammarella, I.; Vesala, T. Does growing atmospheric CO2 explain increasing carbon sink in a boreal coniferous forest? Glob. Change Biol. 2022, 28, 2910–2929. [Google Scholar] [CrossRef] [PubMed]
  62. Piao, S.; Sitch, S.; Ciais, P.; Friedlingstein, P.; Peylin, P.; Wang, X.; Ahlström, A.; Anav, A.; Canadell, J.G.; Cong, N.; et al. Evaluation of terrestrial carbon cycle models for their response to climate variability and to CO2 trends. Glob. Change Biol. 2013, 19, 2117–2132. [Google Scholar] [CrossRef]
  63. Sun, Z.; Wang, X.; Zhang, X.; Tani, H.; Guo, E.; Yin, S.; Zhang, T. Evaluating and comparing remote sensing terrestrial GPP models for their response to climate variability and CO2 trends. Sci. Total Environ. 2019, 668, 696–713. [Google Scholar] [CrossRef] [PubMed]
  64. Zhu, P.; Zhuang, Q.; Ciais, P.; Welp, L.; Li, W.; Xin, Q. Elevated atmospheric CO2 negatively impacts photosynthesis through radiative forcing and physiology-mediated climate feedback. Geophys. Res. Lett. 2017, 44, 1956–1963. [Google Scholar] [CrossRef]
  65. Ueyama, M.; Ichii, K.; Kobayashi, H.; Kumagai, T.; Beringer, J.; Merbold, L.; Euskirchen, E.S.; Hirano, T.; Marchesini, L.B.; Baldocchi, D.; et al. Inferring CO2 fertilization effect based on global monitoring land-atmosphere exchange with a theoretical model. Environ. Res. Lett. 2020, 15, 084009. [Google Scholar] [CrossRef]
  66. Otu-Larbi, F.; Conte, A.; Fares, S.; Wild, O.; Ashworth, K. Current and future impacts of drought and ozone stress on Northern Hemisphere forests. Glob. Change Biol. 2020, 26, 6218–6234. [Google Scholar] [CrossRef] [PubMed]
  67. Ainsworth, E.A.; Long, S.P. What have we learned from 15 years of free-air CO2 enrichment (FACE)? A meta-analytic review of the responses of photosynthesis, canopy properties and plant production to rising CO2. New Phytol. 2005, 165, 351–372. [Google Scholar] [CrossRef]
  68. Tcherkez, G.G.B.; Farquhar, G.D.; Andrews, T.J. Despite slow catalysis and confused substrate specificity, all ribulose bisphosphate carboxylases may be nearly perfectly optimized. Proc. Natl. Acad. Sci. USA 2006, 103, 7246–7251. [Google Scholar] [CrossRef]
  69. Ainsworth, E.A.; Rogers, A. The response of photosynthesis and stomatal conductance to rising [CO2]: Mechanisms and environmental interactions. Plant Cell Environ. 2007, 30, 258–270. [Google Scholar] [CrossRef]
  70. Long, S.P.; Ainsworth, E.A.; Bernacchi, C.J.; Davey, P.A.; Morgan, P.B.; Hymus, G.J.; Leakey, A.D.B.; Osborne, C.P. Long-Term Responses of Photosynthesis and Stomata to Elevated [CO2] in Managed Systems. In Managed Ecosystems and CO2: Case Studies, Processes, and Perspectives; Nösberger, J., Long, S.P., Norby, R.J., Stitt, M., Hendrey, G.R., Blum, H., Eds.; Springer: Berlin/Heidelberg, Germany, 2006; pp. 253–270. [Google Scholar]
  71. Portis, A.R. Rubisco activase–Rubisco’s catalytic chaperone. Photosynth. Res. 2003, 75, 11–27. [Google Scholar] [CrossRef]
  72. Von Caemmerer, S. C4 photosynthesis in a single C3 cell is theoretically inefficient but may ameliorate internal CO2 diffusion limitations of C3 leaves. Plant Cell Environ. 2003, 26, 1191–1197. [Google Scholar] [CrossRef]
  73. Long, S.P.; Drake, B.G. Chapter 4—Photosynthetic CO2 assimilation and rising atmospheric CO2 concentrations. In Crop Photosynthesis; Baker, N.R., Thomas, H., Eds.; Elsevier: Amsterdam, The Netherlands, 1992; pp. 69–103. [Google Scholar]
  74. Long, S.P.; Ainsworth, E.A.; Rogers, A.; Ort, D.R. Rising Atmospheric Carbon Dioxide: Plants Face the Future. Annu. Rev. Plant Biol. 2004, 55, 591–628. [Google Scholar] [CrossRef]
  75. Goumenaki, E.; Taybi, T.; Borland, A.; Barnes, J. Mechanisms underlying the impacts of ozone on photosynthetic performance. Environ. Exp. Bot. 2010, 69, 259–266. [Google Scholar] [CrossRef]
  76. Ma, Y.Z.; Yang, X.L.; Xu, Y.S.; Feng, Z.Z. Response of key parameters of leaf photosynthetic models to increased ozone concentration in four common trees. Chin. J. Plant Ecol. 2022, 46, 321–329. [Google Scholar] [CrossRef]
  77. Flexas, J.; Ribas-Carbó, M.; Diaz-Espejo, A.; Galmés, J.; Medrano, H. Mesophyll conductance to CO2: Current knowledge and future prospects. Plant Cell Environ. 2008, 31, 602–621. [Google Scholar] [CrossRef]
  78. Flexas, J.; Barbour, M.M.; Brendel, O.; Cabrera, H.M.; Carriquí, M.; Díaz-Espejo, A.; Douthe, C.; Dreyerc, E.; Ferrio, J.P.; Gago, J.; et al. Corrigendum to ‘Mesophyll diffusion conductance to CO2: An unappreciated central player in photosynthesis’ [Plant Sci. 193–194 (2012) 70–84]. Plant Sci. 2012, 196, 31. [Google Scholar] [CrossRef]
  79. Knauer, J.; Zaehle, S.; De Kauwe, M.G.; Bahar, N.H.A.; Evans, J.R.; Medlyn, B.E.; Reichstein, M.; Werner, C. Effects of mesophyll conductance on vegetation responses to elevated CO2 concentrations in a land surface model. Glob. Change Biol. 2019, 25, 1820–1838. [Google Scholar] [CrossRef] [PubMed]
  80. Anav, A.; Menut, L.; Khvorostyanov, D.; Viovy, N. A comparison of two canopy conductance parameterizations to quantify the interactions between surface ozone and vegetation over Europe. J. Geophys. Res. Biogeosci. 2012, 117. [Google Scholar] [CrossRef]
  81. Zhang, Y.; Zhang, F.; Wan, M.; Bo, Y.; He, K.; Liu, R. Evolution of surface ozone pollution in Yangtze Rriver Delta between 2019 and 2022: Influences of meteorology and emissions. Atmos. Environ. 2025, 358, 121339. [Google Scholar] [CrossRef]
  82. Chen, C.; Park, T.; Wang, X.; Piao, S.; Xu, B.; Chaturvedi, R.K.; Fuchs, R.; Brovkin, V.; Ciais, P.; Fensholt, R.; et al. China and India lead in greening of the world through land-use management. Nat. Sustain. 2019, 2, 122–129. [Google Scholar] [CrossRef]
  83. Nam, K.; Waugh, C.J.; Paltsev, S.; Reilly, J.M.; Karplus, V.J. Carbon co-benefits of tighter SO2 and NOx regulations in China. Glob. Environ. Change 2013, 23, 1648–1661. [Google Scholar] [CrossRef]
  84. Liu, Z.; Deng, Z.; He, G.; Wang, H.; Zhang, X.; Lin, J.; Qi, Y.; Liang, X. Challenges and opportunities for carbon neutrality in China. Nat. Rev. Earth Env. 2022, 3, 141–155. [Google Scholar] [CrossRef]
  85. Wang, B.; Wang, Y.; Zhao, Y. Collaborative Governance Mechanism of Climate Change and Air Pollution: Evidence from China. Sustainability 2021, 13, 6785. [Google Scholar] [CrossRef]
  86. Wang, Q.; Liu, Y. Evaluating the impact of new energy demonstration city construction on urban air quality: Evidence from a DID analysis of Chinese cities. Energy 2025, 332, 137108. [Google Scholar] [CrossRef]
  87. Deng, Y.; Ma, M.; Zhou, N.; Ma, Z.; Yan, R.; Ma, X. China’s plug-in hybrid electric vehicle transition: An operational carbon perspective. Energ. Convers. Manag. 2024, 320, 119011. [Google Scholar] [CrossRef]
  88. Guo, D.; Yan, W.; Gao, X.; Hao, Y.; Xu, Y.; E, W.; Tan, X.; Zhang, T. Forecast of passenger car market structure and environmental impact analysis in China. Sci. Total Environ. 2021, 772, 144950. [Google Scholar] [CrossRef]
  89. Gai, Y.; Sun, L.; Fu, S.; Zhu, C.; Zhu, C.; Li, R.; Liu, Z.; Wang, B.; Wang, C.; Yang, N.; et al. Impact of greening trends on biogenic volatile organic compound emissions in China from 1985 to 2022: Contributions of afforestation projects. Sci. Total Environ. 2024, 929, 172551. [Google Scholar] [CrossRef]
  90. Cao, J.; Situ, S.; Hao, Y.; Xie, S.; Li, L. Enhanced summertime ozone and SOA from biogenic volatile organic compound (BVOC) emissions due to vegetation biomass variability during 1981–2018 in China. Atmos. Chem. Phys. 2022, 22, 2351–2364. [Google Scholar] [CrossRef]
  91. Wang, Q.Y.; Huang, M.; Wang, Z.S.; Wang, S.Q.; Li, Y.L. Impact of ozone pollution on productivity and biomass of subtropical forests: A case study in Dinghushan. Acta Ecol. Sin. 2023, 43, 1832–1842. [Google Scholar] [CrossRef]
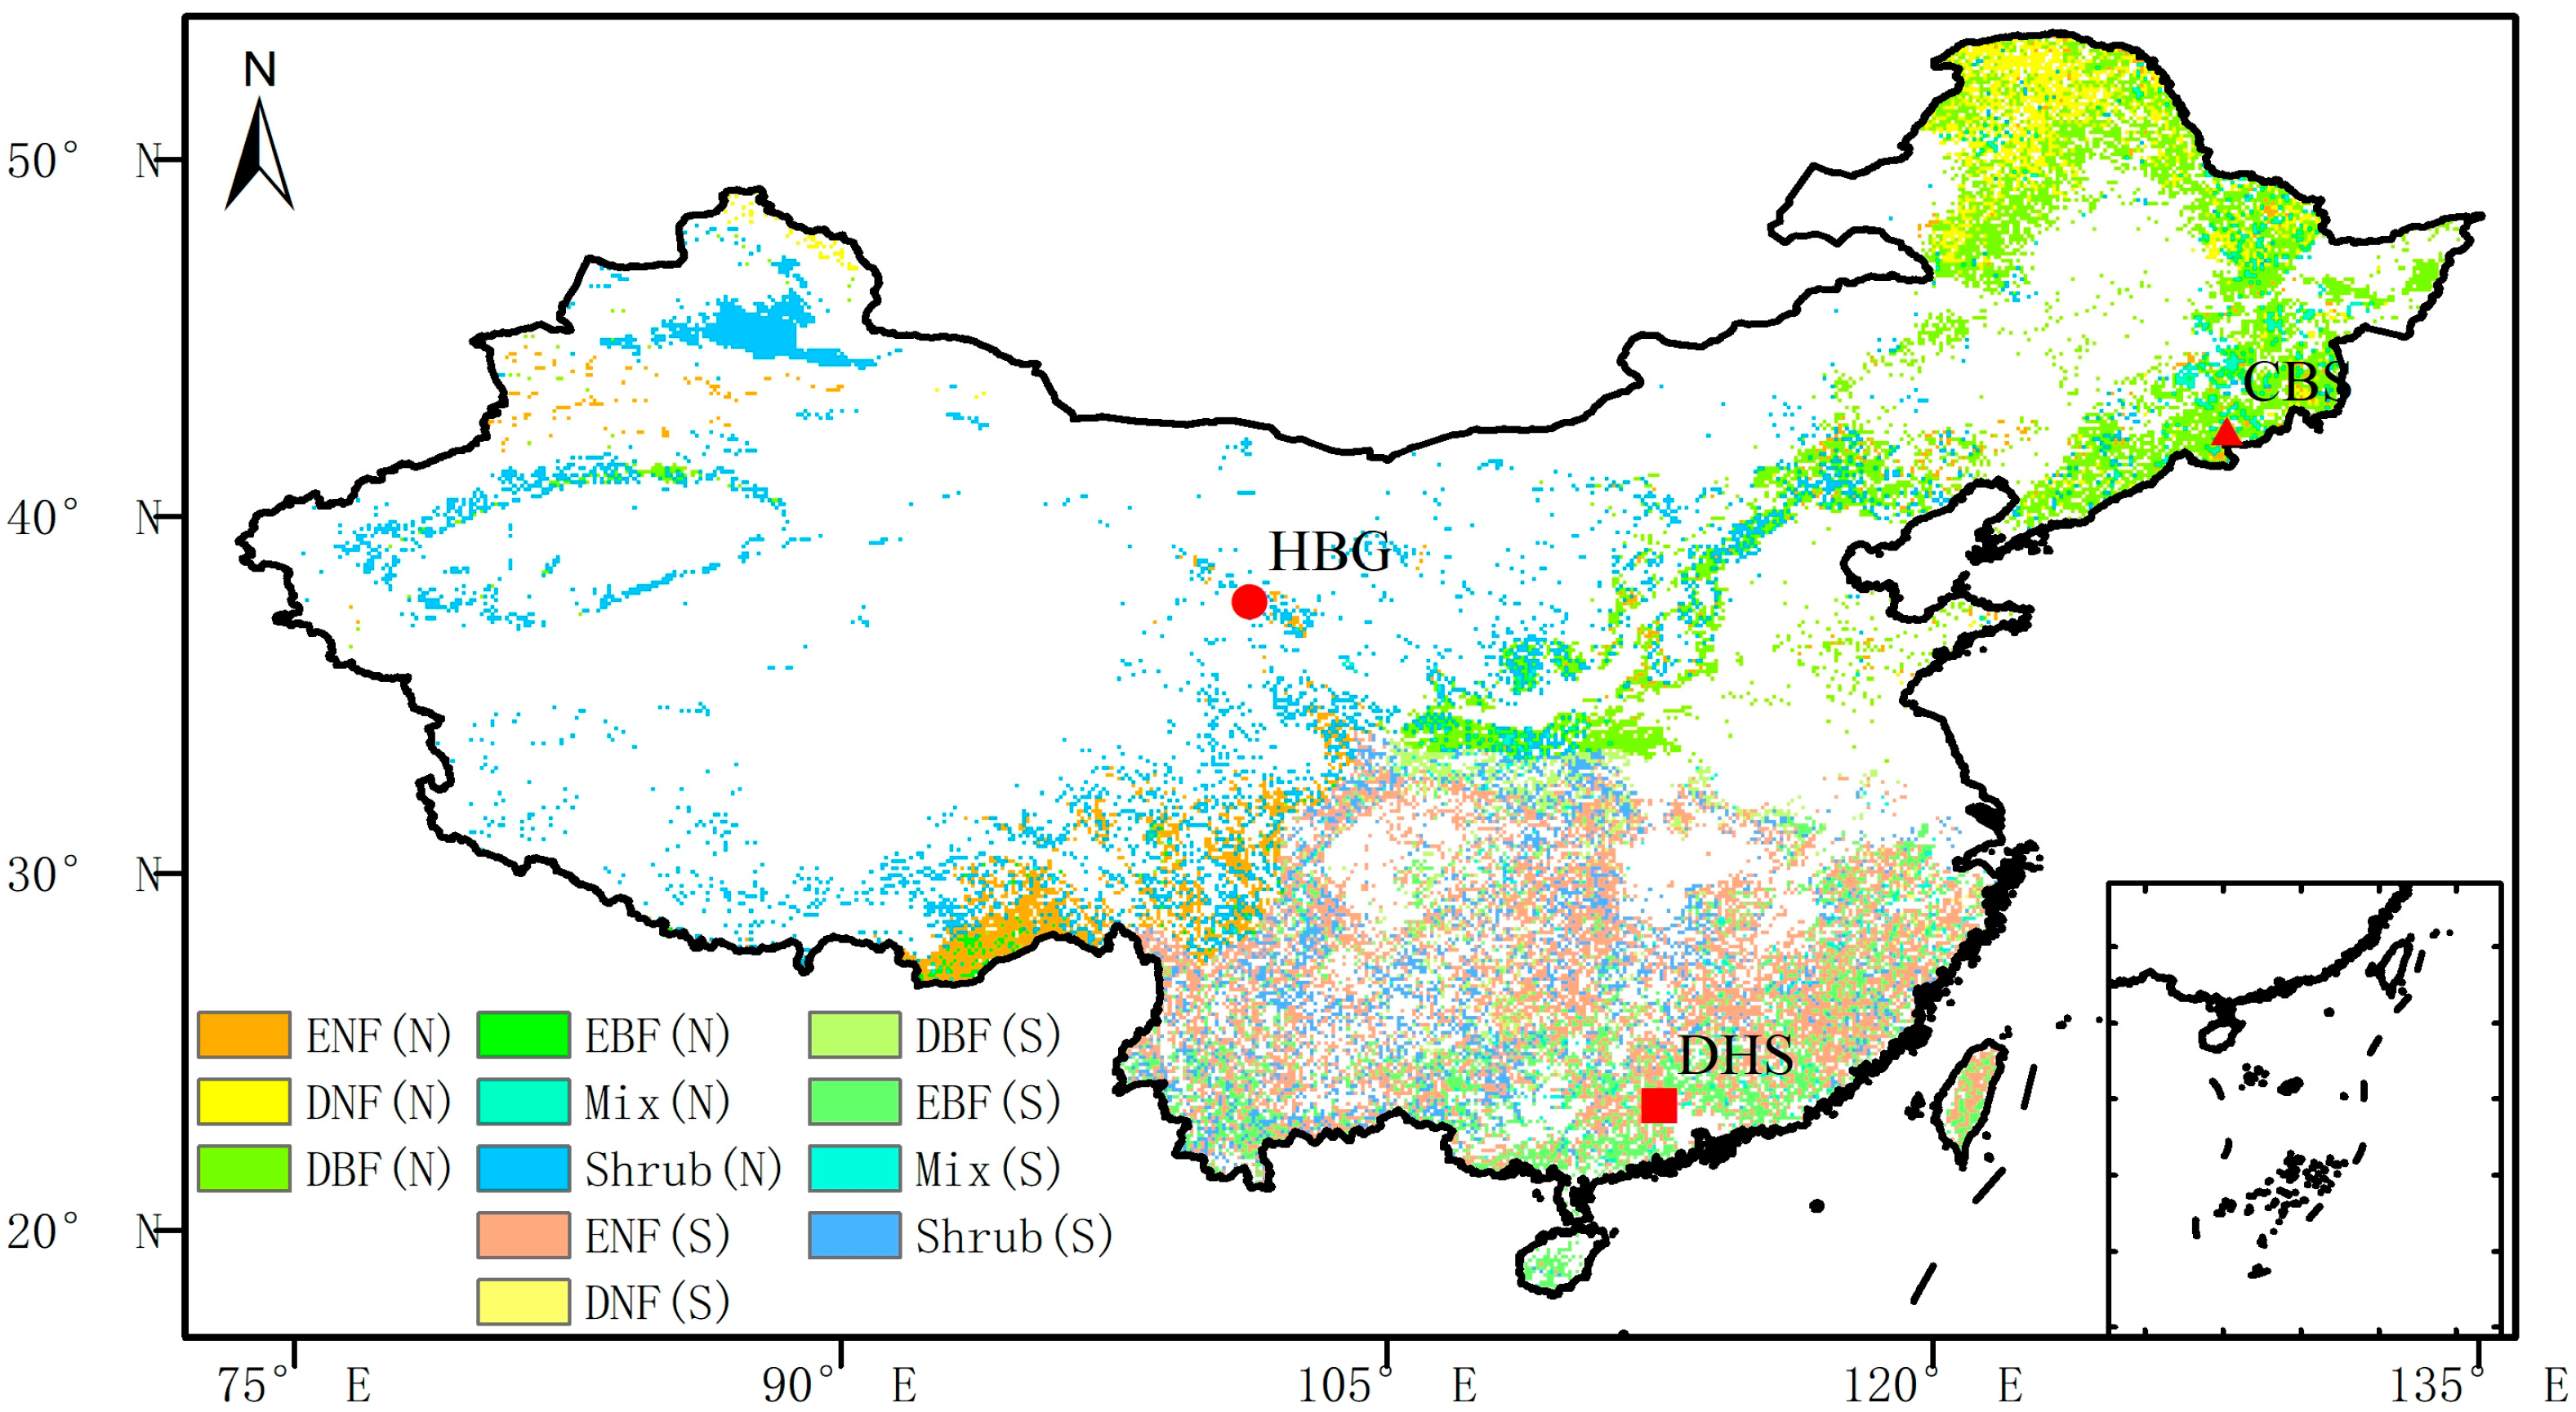
Figure 1. Land cover map. Seven vegetation types are described in the figure: evergreen needleleaf forest (ENF), deciduous coniferous forest (DNF), deciduous broad-leaved forest (DBF), evergreen broad-leaved forest (EBF), mixed forest (Mix), and shrub (Shrub). Unlike the differences in climate zones, the vegetation types in the temperate zone use (N), while those in the subtropical zone use (S). The three symbols represent the names and locations of three flux observation stations. The circular symbol represents the Haibei Shrub Observation Station (HBG), the triangular symbol represents the Changbaishan Coniferous Forest Observation Station (CBS), and the square symbol represents the Dinghushan Broadleaf Forest Observation Station (DHS).
Sustainability 17 07198 g001
Figure 2. Variation range of GPP in woodland ecosystems under different experimental models. (a) The effect of [CO2] on GPP. (b) The synergistic effect of [O3] and [CO2] on GPP. (c) The effect of [O3] on GPP under the background of [CO2]. (d) The effect of [O3] on GPP alone.
Sustainability 17 07198 g002
Figure 3. Single and combined effects of [CO2] and [O3] on the GPP of woodland ecosystems compared to climate change conditions. We divided woodland ecosystem GPP into two phases, 2001s (2001–2010) and 2010s (2010–2020), to show the trend in elevated [CO2] and [O3] over time scales.
Sustainability 17 07198 g003
Figure 4. The interannual variation in GPP under the effects of single [O3] (red line) and the interannual variation in GPP under the combined effects of [O3] and [CO2] (yellow line), compared with the GPP in woodland ecosystems under climatic background. With the increase in CO2 concentration, the loss amount and loss rate of GPP gradually decrease in the yellow line.
Sustainability 17 07198 g004
Figure 5. The SURD analysis results containing the two meteorological factors of CO2 and O3 simultaneously. Here, (a) represents the maximum value of Redundancy (R), Unique (U), and Synergy (S) each grid belongs to; (b), (c), and (d), respectively, represent the grids of the maximum values of R, U, and S of the variable IDs of CO2 and O3.
Sustainability 17 07198 g005
Figure 6. After adding LAI to the SURD analysis, the obtained analysis results were obtained. (a) Incorporate LAI as an independent variable into the SURD analysis of GPP in the E2 scenario. (b) Incorporate LAI as an independent variable into the SURD analysis conducted in the E3 scenario. (c) After conducting a SURD analysis of LAI as the dependent variable along with meteorological factors CO2, and O3, the U value of CO2 on LAI was obtained. (d) The U value of GPP in the E2 scenario with CO2. The U value here represents the “Unique” aspect in SURD, indicating the degree of influence of a single variable on the dependent variable. The sum of all U values equals 1.
Sustainability 17 07198 g006
Table 1. Basic information about three forest sites.
Site NameSite CoordinatesVegetation TypeYear of Observation GPP
HaiBei101.25 N, 37.6 EShrub2009–2010
Changbaishan128.1 N, 42.4 EConifer2009–2010
Dinghushan112.5 N, 23.5 EHardleaf2016, 2010
Table 2. Model simulation experiment protocol to investigate the interactive effects of climate change, [CO2] and [O3] on woodland GPP in 2001–2020.
Experiment No.ClimateHistory_O3History_CO2
E1
E2
E3
E4
Table 3. The variable factors generated in the SURD algorithm.
Causal RelationshipsAssociation of Variable
R (Redundant)(1,2), (1,3), (2,3), (1,2,3)
U (Unique)(1), (2), (3)
S (Synergistic)(1,2), (1,3), (2,3), (1,2,3)
Disclaimer/Publisher’s Note: The statements, opinions and data contained in all publications are solely those of the individual author(s) and contributor(s) and not of MDPI and/or the editor(s). MDPI and/or the editor(s) disclaim responsibility for any injury to people or property resulting from any ideas, methods, instructions or products referred to in the content.