Abstract
(1) Background: Educational systems across the world experienced significant changes during 2020–2022, with potential implications for progress toward Sustainable Development Goal 4 (SDG 4: Quality Education), which aims to ensure inclusive and equitable quality education and promote lifelong learning opportunities for all across European Union member states. Understanding how educational sustainability performance evolved during the pre-pandemic period (2017–2019) and the pandemic-affected period (2020–2022) is essential for developing effective educational policies. (2) Objective: This quantitative comparative study aimed to (i) assess and rank sustainable education developments across EU-27 countries in two periods, Period 1—the pre-pandemic period (2017–2019)—and Period 2—the pandemic-affected period (2020–2022); (ii) identify performance changes between these periods; and (iii) classify countries into performance groups to guide targeted interventions. (3) Methods: Using data from the Eurostat database, we evaluated six key SDG 4 indicators: low-achieving students in reading, mathematics, and science; participation in early childhood education; early school leavers; tertiary educational attainment; adult participation in learning; and adults with basic digital skills. The Multiobjective Optimization based on Ratio Analysis (MOORA) method was used to rank countries and assess sustainable education development. (4) Results: Sweden maintained the highest educational sustainability performance across both periods, while Romania and Bulgaria consistently ranked lowest. Nine countries improved their rankings during the pandemic-affected period, while others maintained stable positions or experienced declines in their rankings. Adult participation in learning showed the greatest variation among the indicators, with top performers, such as Sweden, scoring 0.445 compared to Romania’s 0.051 in Period 2. The proportion of early school leavers decreased from an EU average of 9.0% in Period 1 to 8.3% in Period 2, indicating a positive trend across the study periods. While differences were observed across countries and periods, these should not be interpreted as causally linked to the pandemic alone (5). Conclusions: The performance of educational sustainability varied across EU member states between the two periods, with some countries demonstrating remarkable resilience or improvement, while others declined. These findings underscore the need for targeted educational policies that address specific sustainability weaknesses in individual countries, particularly those in the warning and danger categories. Sweden’s consistent performance offers valuable lessons for educational sustainability, especially during and after major disruptions.
1. Introduction
Following the United Nations’ announcement of the Sustainable Development Goals (SDGs) in September 2015, sustainable development has emerged as a key topic of debate among governments, practitioners, and policymakers worldwide [1]. The framework comprises 17 SDGs and 169 targets that are to be implemented from 2016 to 2030. Among these, quality education (SDG 4: Sustainable Development Goal 4, which aims to ensure inclusive and equitable quality education and promote lifelong learning opportunities for all) has been recognized as pivotal for societal and economic resilience [2]. This study defines sustainable education development as improving education systems to ensure equitable access, lifelong learning, and skill development, distinct from environmental sustainability, focusing on SDG 4’s objectives across the EU-27 (the 27 member states of the European Union) [2].
Several research studies have highlighted the essential impact of quality education in promoting sustainable development [3,4]. The European Union integrates SDG 4 into its policies to ensure equitable access to education and increase skills for employment and entrepreneurship [1]. Six indicators were defined (low-achieving students, early childhood education, early school leavers, tertiary attainment, adult learning, and digital skills) to reflect these goals, fostering reduced inequality and employability, which are key pillars of sustainable education development [2]. This focus supports long-term societal benefits, such as economic stability and social cohesion, without implying environmental sustainability objectives. This goal also aims to eliminate gender and income disparities in educational access. Despite widespread acknowledgment of education’s importance to sustainability, the effect of major disruptions like the COVID-19 pandemic on educational sustainability performance across different national contexts remains poorly understood [3].
Most research on sustainable education development has focused on individual institutions, particularly Higher Education Institutions [4,5,6,7,8]. These studies typically develop assessment tools for universities to evaluate student competencies, teaching quality, or program effectiveness. Comparative studies examining educational sustainability across nations remain scarce and often rely on limited indicators or single-point assessments that fail to capture developmental changes over time [9,10]. Although numerous studies have investigated sustainability performance measurements using multiple-criteria decision-making (MCDM) methods (TOPSIS, DEA, PROMETHEE…) [11,12,13] their application to educational sustainability at national levels is still limited [14,15]. This study employs the Multiobjective Optimization based on Ratio Analysis (MOORA) method to assess educational sustainability across EU-27 countries, comparing the pre-pandemic (2017–2019) and pandemic-affected (2020–2022) periods. Unlike the DEA method, which focuses on efficiency, or the TOPSIS method, which uses distance measures, MOORA’s ratio-based approach offers computational simplicity and robustness. Introduced by Willem et al. [16], this method is effective for complex decision problems, as demonstrated in studies such as that by Piantari et al. [17], which evaluated scholarship applicants, and Sitorus et al. [18], which assessed computer lecturers. These examples showcase MOORA’s effectiveness in providing reliable assessments.
Furthermore, the literature lacks comprehensive analyses of how the COVID-19 pandemic affected educational sustainability across European countries using methodologies that integrate multiple, sometimes conflicting, educational sustainability indicators [19]. The COVID-19 pandemic had far-reaching impacts beyond education, severely disrupting healthcare systems with unprecedented challenges [20,21], causing significant economic contractions across Europe [22,23], and leading to the postponement of major sporting events, including the Tokyo Olympic Games and FIFA World Cup qualifiers [24].
Following the COVID-19 pandemic, the EU adopted NextGenerationEU to tackle economic recovery while accelerating green and digital transitions. In this context, measuring educational sustainability during both the pre-pandemic period (2017–2019) and the pandemic-affected period (2020–2022) becomes crucial for developing effective and sustainable education strategies for the EU as a whole and individual member states. This study therefore aimed to (i) evaluate and rank sustainable education development across EU-27 countries in the pre-pandemic period (2017–2019) and the pandemic-affected period (2020–2022) using the MOORA method; (ii) examine performance differences between these periods and identify patterns in educational system characteristics; and (iii) classify EU countries into performance groups. This study analyzes changes in educational indicators related to SDG 4 across two time periods: the pre-pandemic period (2017–2019) and the pandemic-affected period (2020–2022). We recognize that educational systems are influenced by multiple factors beyond pandemic responses, including existing policies, socioeconomic changes, and institutional structures. The findings presented in this study are significant regarding the implementation of the European Union’s educational policy and its associated sustainability objective within the 2030 Agenda of the United Nations.
2. Materials and Methods
2.1. Research Design
This study employed a quantitative comparative approach to assess sustainable education development across EU-27 countries over two periods: Period 1 (2017–2019), a pre-pandemic period reflecting stable educational systems before COVID-19 disruptions, and Period 2 (2020–2022), highlighting the acute impact of the pandemic during 2020–2021 lockdowns and the early recovery in 2022. These periods were selected to examine patterns of educational indicators across two distinct operational contexts. This temporal division allows for comparative analysis of educational sustainability performance. This temporal division enabled the evaluation of potential COVID-19 impacts on educational sustainability indicators, in line with recent evidence on how digital and social factors influenced the sustainability of EU countries during the pandemic [25]. We used the Multiobjective Optimization based on Ratio Analysis (MOORA) method to rank countries based on their performance across multiple sustainability dimensions. We addressed three objectives: (1) to evaluate educational sustainability in the pre-pandemic period (2017–2019, Period 1) and the pandemic-affected period (2020–2022, Period 2); (2) to identify changes in country rankings and indicator performance associated with pandemic-related disruptions; and (3) to classify countries into performance groups to inform effective policymaking. This framework facilitates the analysis of educational trends across distinct operational contexts, while acknowledging the complex and multifaceted nature of educational system development. Our comparative approach examines indicator patterns across two time periods, recognizing that multiple concurrent factors, including ongoing policy reforms, socioeconomic trends, demographic changes, and institutional developments, influence educational systems. Therefore, while this methodology identifies differences and trends, it cannot establish causal relationships between observed changes and specific external interventions.
2.2. MOORA Method
The present research employed a multi-criteria optimization method, MOORA, to compare EU countries. The MOORA method is a multi-criteria decision-making tool that is used to rank alternatives by comparing their performance across multiple attributes. The detailed steps of the MOORA method are listed below. The criteria are weighted equally.
Step 1: The initial phase involves constructing a decision matrix, denoted as X, where each element xij represents the performance score of the i-th alternative concerning the j-th criterion.
Step 2: The best choice selected is the square root of sum of squares of individual alternatives/attributes. This ratio is defined as follows:
where x*ij represents the normalized score of the i-th alternative on the j-th attribute in the interval [0,1].
Step 3: In the case of maximization for beneficial attributes, the normalized performances are added, while they are subtracted for minimization of non-beneficial attributes. Thus, the optimization problem can be reformulated as follows:
In the formula, “g” stands for the number of attributes that must be maximized, “(n − g)” stands for the number of attributes that must be minimized, and “yi” stands for the normalized score of the i-th alternative for all attributes.
Step 4: Depending on the direction of the attribute, the value of yi can be positive or negative. A higher value is better if the attribute is beneficial and yi is positive. A lower value is better if the attribute and yi are negative. By ranking yi values from highest to lowest, you can identify the best alternative with the highest yi and the worst alternative with the lowest yi.
2.3. Data Sources and Selection
The dataset for SDG 4 indicators utilized in this study was obtained from Eurostat [2]. To mitigate the impact of annual variability, period averages were computed for each indicator across the pre-pandemic (2017–2019) and pandemic-affected (2020–2022) periods. Six key indicators were selected based on their direct relevance to SDG 4 targets, comprehensive coverage of educational dimensions, and consistent data availability across all EU-27 member states. The selection criteria prioritized indicators that align closely with SDG 4’s core objectives, encompassing equitable access to education, lifelong learning opportunities, and skill development. These indicators were chosen for their robust and high-quality data availability across all EU-27 countries for both periods, covering diverse educational domains, including early childhood education, adult learning, and digital competencies, thereby facilitating a comprehensive assessment of educational sustainability.
2.4. Sustainable Education Indicators
This study assesses SDG 4 (Quality Education) using six indicators from the Eurostat database, selected for their alignment with SDG 4 targets, comprehensive coverage of educational dimensions, and consistent data availability across EU-27 countries from 2016 to 2021. These indicators reflect equitable access, lifelong learning, and skill development, key pillars of sustainable education. The six indicators used to measure SDG 4 are listed below:
X1: The proportion of 15-year-olds with low reading, mathematics, and science performance is an essential indicator of educational progress. It reflects the proportion of students who do not reach level 2 on the PISA scale in these crucial subjects, commonly referred to as “basic skills”. Overcoming these challenges is essential to creating a better-educated future generation.
X2: Participation in early childhood education assesses the percentage of children participating in programs. This critical indicator, derived from the PISA study, underlines the importance of early educational experiences in promoting lifelong learning and development.
X3: Early leavers from education and training measures the percentage of people aged 18 to 24 who have completed lower secondary education or less and have not participated in education or training in the four weeks before the survey. The data for this indicator is collected as part of the European Union Labour Force Survey (EU-LFS).
X4: Tertiary educational attainment measures the percentage of people aged 25 to 34 who have completed tertiary education, including university degrees or higher technical qualifications. This data is defined according to the International Standard Classification of Education (ISCED) and comes from the European Union Labour Force Survey (EU-LFS).
X5: Adult participation in learning evaluates people aged 25 to 64 who have participated in formal or non-formal education and training within the last four weeks before the survey (numerator). The denominator consists of the total population of this age group, excluding those who did not respond. The data, sourced from the European Union Labour Force Survey (EU-LFS), highlights the importance of lifelong learning and skill development.
X6: Share of adults with at least basic digital skills reflects the percentage of people aged 16 to 74 who have acquired basic digital skills that are essential in today’s technology-driven landscape. It is derived from key online activities, and the assessment has evolved since 2021 to incorporate information retrieval, communication, problem-solving, software usage, and safety skills. This indicator measures competencies at both primary and above-basic levels. The data is sourced from the European Union’s survey on the use of information and communication technology (ICT) among households and individual users, ensuring its accuracy and relevance.
2.5. Performance Indicator Classification
Table 1 presents the classification of each indicator as either a stimulant (S) or a destimulant (D). This classification determines whether higher values are considered beneficial (stimulants) or detrimental (destimulants) to sustainable education development.

Table 1.
Performance indicators.
In the MOORA, the EU countries aim to minimize the values of indicators X1 and X3, while maximizing the values of X2, X4, X5, and X6.
3. Results
3.1. Descriptive Analysis
Table 2 presents the descriptive statistics of the indicators measured during the first period (pre-pandemic, 2017–2019), including the mean, standard deviation, minimum, and maximum values. The average of low-achieving 15-year-olds in reading, mathematics, or science was 24.4%. Bulgaria was the best-performing country in this indicator, with fewer 15-year-olds achieving low levels in reading, mathematics, or science, while Estonia showed the poorest performance. This variable acts as an inhibitor; therefore, the country with the lowest value of the indicator is considered the better option. For stimulant indicators, higher values represent better performance. Participation in early childhood education was highest in Spain (100%) and lowest in Croatia (50.8%), with an overall average for EU countries of 88.2%. The EU average rate of early school leavers was 9%, with Croatia having the lowest rate (only 3%) and Spain having the highest rate (18.3%).
Table 2.
Descriptive analysis of variables during Period 1 (2017–2019).
Table 3 summarizes the statistics for six indicators during the pandemic-affected period (2020–2022). Early childhood education participation averaged 85.1%, with France achieving the highest rate and Romania the lowest. The average rate of early school leavers decreased positively to 8.3% from the first period. The rankings for the best and worst countries regarding indicator X3 were consistent across both periods.
Table 3.
Descriptive analysis of variables during Period 2 (2020–2022).
The differences observed between periods reflect the combined effects of multiple factors and should not be attributed to any single cause. These patterns indicate variation in educational indicator performance across different time periods.
3.2. MOORA Results
Six indicators from SDG 4 were used to assess the EU countries. The MOORA method was used to analyze the multidimensional view of quality education. Table 4 presents the normalized scores and rankings for Period 1. The Variance (S.D.) reports the standard deviation of annual MOORA scores (Yi) within each period, reflecting the consistency of each country’s educational sustainability performance across years.
Table 4.
Ranks with normalized assessment scores of EU countries based on the MOORA method in Period 1.
When comparing the achievements of EU countries in sustainable education development for Period 1 (2017–2019), Sweden was the highest-ranked country, followed by Finland in second place. Denmark occupied third place, while Ireland was in fourth place. The lowest-ranked country was Romania (27th). Table 5 presents the normalized scores and rankings for Period 2 (2020–2022).
Table 5.
Ranks with normalized assessment scores of EU countries by the MOORA method in Period 2.
According to the results for Period 2 (2020–2022), Sweden maintained first place with the best sustainable education development level. Luxembourg significantly improved to reach second place, followed by Ireland, Finland, and the Netherlands. The countries with the worst sustainability development performance in Period 2 were Hungary (23rd), Cyprus (24th), Greece (25th), Bulgaria (26th), and Romania (27th).
3.3. Comparative Analysis Between Periods
Table 6 presents the rankings of EU countries in both the pre-pandemic period (2017–2019) and the pandemic-affected period (2020–2022), as well as the changes between these two periods.
Table 6.
Comparative rankings of EU countries during pre-pandemic and pandemic-affected periods.
The evolution of educational sustainability performance from the pre-pandemic period (2017–2019) to the pandemic-affected period (2020–2022) reveals significant changes. Looking at individual countries, there was a noticeable improvement in sustainable education performance during the pandemic-affected period for many nations, although the rankings changed considerably. Several countries maintained stable positions (Sweden, Slovenia, Estonia, Belgium, Bulgaria, and Romania), while others experienced significant improvements or declines.
Luxembourg and Portugal (both improving by seven positions) made the most substantial improvements, followed by Malta and Slovakia (both improving by five positions) and Croatia (improving by three positions). Conversely, Poland (dropping six positions), Greece (dropping five positions), France (dropping four positions), and Denmark and Cyprus (both dropping three positions) exhibited the most significant declines.
Based on normalized assessment scores, countries were classified into four performance groups: high performance, safe performance, warning performance, and dangerous performance. In Period 1, high-performance countries included Sweden, Finland, and Denmark (see Figure 1). In Period 2, this group consisted of Sweden and Luxembourg, with the latter showing a remarkable improvement between periods (see Figure 2).
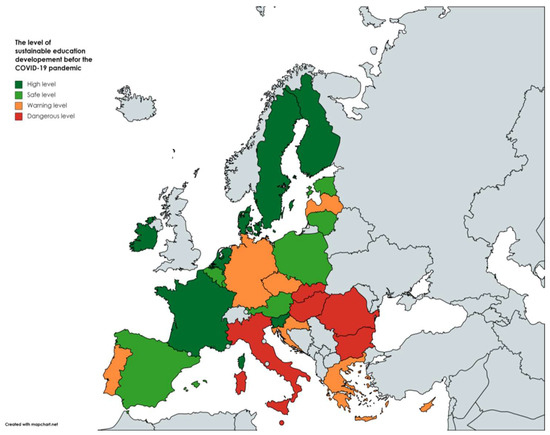
Figure 1.
Average levels of EU-27 countries in terms of sustainable education development during the pre-pandemic period (2017–2019).
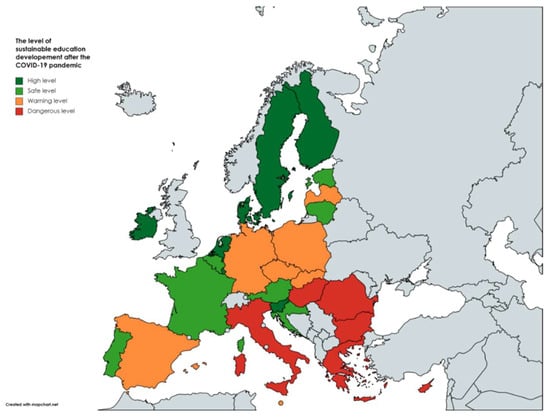
Figure 2.
Average levels of EU-27 countries in terms of sustainable education development during Period 2.
In Period 1, countries with safe performance levels included Estonia, Luxembourg, Austria, Lithuania, Poland, Belgium, and Spain. By Period 2, this group comprised Estonia, France, Lithuania, Portugal, Austria, Belgium, and Croatia, reflecting improved sustainable education development in Portugal and Croatia.
Countries that moved from safer categories to more concerning ones included Poland and Spain (from safe to warning level). Conversely, Malta and Slovakia improved from dangerous to a warning level. Hungary, Italy, Bulgaria, and Romania remained in the hazardous performance category across both periods, indicating persistent challenges in their educational sustainability development.
Some countries, such as Greece, experienced unfavorable changes in indicator values, including increases in the number of low-achieving students and decreases in tertiary educational attainment and adult participation in learning. These areas represent EU priorities for sustainable educational development, and negative trends indicate a lack of progress in improving sustainable educational performance.
Overall, nine countries (Ireland, Netherlands, Luxembourg, Lithuania, Latvia, Croatia, Italy, Malta, and Slovakia) improved their rankings in Period 2, demonstrating variation in educational system performance across different periods. Exploring the factors behind this performance could yield valuable insights for further enhancing education.
4. Discussion
This study evaluates sustainable education development across EU-27 countries, comparing the pre-pandemic period (2017–2019) with the pandemic-affected period (2020–2022). Using the MOORA method, we identify significant performance variations, with Sweden consistently ranking first, while Romania and Bulgaria remained at the bottom. Luxembourg and Portugal improved notably (seven positions each), while Poland and Greece saw declines (six and five positions, respectively). These patterns reflect diverse responses from educational systems to disruptions, although changes may stem from multiple factors, including policy reforms, socioeconomic trends, and institutional structures, rather than solely the pandemic.
The consistent top performance of Nordic countries, particularly Sweden’s first-place ranking in both periods, aligns with previous research highlighting these nations’ strong educational systems and sustainability focus. Sweden’s consistent performance suggests robust characteristics of its educational system that merit further investigation. Verhulst and Lambrechts (2015) similarly found Nordic countries leading in integrating sustainability into education, attributing this to their longstanding policy emphasis on equal access and lifelong learning [26]. However, our study extends these findings by demonstrating that even high-performing countries experienced varying resilience during the pandemic. Denmark, for example, dropped from third to sixth place despite its traditionally strong educational performance. This suggests that even well-established educational systems faced challenges in maintaining all aspects of educational sustainability during this period of significant disruption. Educational policymakers in other countries should examine Sweden’s overall approach and adaptability strategies during crisis periods, including robust digital infrastructure, teacher training for remote delivery, and systematic support mechanisms for vulnerable students.
Luxembourg’s improvement from ninth to second place is a significant finding in our analysis. This advancement differs from previous assessments, where Luxembourg showed moderate performance. This improvement likely results from multiple factors, including institutional characteristics and ongoing developments. Multiple explanations should be considered when interpreting this significant change in ranking. The country’s small size and high GDP per capita facilitated the rapid deployment of resources to maintain educational quality during disruptions. Other EU nations should consider how Luxembourg’s focused digital transformation strategies and comprehensive teacher support programs can be scaled and adapted to their contexts, particularly in terms of targeted investment in technical infrastructure and human capacity development.
The consistently poor performance of Romania and Bulgaria, ranking last and second-to-last in both periods, confirms findings from previous studies on educational challenges in these regions. Myint et al. [9] found similar educational underperformance patterns in countries with lower economic development, and historical barriers to educational modernization were identified. Our research shows that these structural disadvantages persisted across both time periods, suggesting that crisis periods may reinforce existing educational inequalities rather than create new ones. These countries require targeted EU-level interventions focusing on fundamental educational infrastructure, teacher quality, and accessibility improvements. Rather than implementing generic sustainability policies, EU’s educational support mechanisms should prioritize context-specific interventions addressing these nations’ particular structural challenges, potentially through enhanced European Social Fund allocations earmarked explicitly for improving educational quality.
Portugal’s significant improvement (from 18th to 11th place) contrasts with the decline of other Southern European countries like Greece (from 20th to 25th place). This divergence differs from pre-pandemic patterns identified by Cottafava et al. [6], who found similar educational sustainability challenges across Southern European nations. Portugal’s improvement corresponds with educational reforms that began before 2020 and continued throughout the study period, including curriculum modernization and significant investments in digital access for disadvantaged students [2]. In contrast, Greece experienced pandemic-related budget constraints that limited educational investments. This suggests that pre-existing reform momentum combined with protected educational budgeting during crises can yield significant sustainability improvements, even in challenging circumstances. Other countries facing similar economic constraints should examine Portugal’s targeted approach to educational investment protection and prioritization during periods of resource scarcity.
The generally declining performance of Central European countries, particularly Poland’s sharp drop from 12th to 18th place, reveals potential vulnerabilities in their educational sustainability frameworks. This pattern diverges from Lu et al.’s [13] pre-pandemic assessment, which indicated positive sustainability trajectories for these nations. Our findings suggest that many Central European educational systems have prioritized immediate crisis management over sustainable development principles during the pandemic. These countries should reevaluate their crisis response frameworks to better integrate long-term sustainability considerations, even during emergencies. Educational policymakers may benefit from developing explicit crisis-resilient sustainability strategies that focus on key indicators, such as digital skill development and reducing early school leaving, even when facing immediate operational challenges.
Integrating digital skills (X6) as a sustainability indicator reveals important patterns regarding technological preparedness and pandemic resilience. Countries ranking highly on this indicator (Finland, Netherlands, Sweden) generally maintained strong overall performance despite pandemic disruptions. This supports Giangrande et al.’s [27] assertion that digital competence is critical to educational sustainability. Our findings extend this understanding by demonstrating that strong pre-pandemic digital foundations directly contributed to educational resilience during crises. EU’s educational policy should therefore prioritize digital skill development, not merely as a standalone goal but as a fundamental component of overall educational sustainability and crisis preparedness. Targeted digital competence programs should be implemented across member states, with a particular emphasis on countries currently showing weaker performance in this area.
Adult participation in learning (X5) exhibited the most significant variation among indicators across countries and appears to be strongly correlated with overall sustainability rankings. Top performers, such as Sweden (0.444 in Period 1, 0.445 in Period 2), maintained exceptionally high scores compared to lower-ranked countries, like Romania (0.015 in Period 1, 0.051 in Period 2). This pattern supports Al-Kuwari et al.’s [28] findings regarding the importance of lifelong learning cultures to overall educational sustainability. Our research shows that countries with robust adult learning infrastructure were better equipped to adapt during the pandemic. This suggests that educational systems engaging citizens throughout their lifespans demonstrate greater overall resilience. Educational sustainability policies should therefore extend beyond formal education settings to create comprehensive lifelong learning ecosystems that maintain citizen engagement with educational opportunities throughout adulthood, potentially through expanded online learning platforms, workplace learning initiatives, and community education programs.
To assess the robustness of the MOORA rankings, a sensitivity analysis was conducted by varying the indicator weights. For instance, increasing the weight of digital skills (X6) by 50% resulted in minimal changes for Sweden but a two-position shift for Luxembourg. These findings confirm the stability of top performers while highlighting the influence of digital skills on rankings in Period 2, supporting the inclusion of X6 as a key indicator.
MOORA’s simplicity and objectivity are well-suited for multi-indicator ranking; however, equal weighting may overlook context-specific priorities. Sensitivity analysis confirms robustness; however, complementary methods, such as TOPSIS, could validate rankings, while qualitative case studies could explore country-specific factors.
The analysis of educational indicators across these two distinct time periods reveals varying performance patterns among EU educational systems. The observed differences suggest areas for further research into the underlying characteristics of the educational system. Countries with consistently strong performance or notable improvements merit investigation into their institutional structures and policy frameworks. Future research should employ case study methodologies and longitudinal approaches to better understand the mechanisms behind observed patterns. This comparative analysis provides a foundation for such targeted investigations into educational system development across diverse national contexts.
5. Limitations
An important limitation of this study is that it cannot establish causal relationships between pandemic responses and changes in educational indicators. Numerous factors influence educational systems, including policy initiatives, socioeconomic trends, institutional structures, and measurement approaches. While the MOORA method effectively ranks countries, it cannot determine which factors caused specific changes.
Additionally, this study has several limitations that should be considered when interpreting the results. First, the analysis relied exclusively on six indicators from the Eurostat database, which may not capture all dimensions of educational sustainability. Second, period averages for 2020–2022 combine acute pandemic disruptions with early recovery, potentially masking significant temporal variations. Third, the MOORA method assigns equal weights to all indicators, overlooking potential differences in their importance across national contexts. Fourth, classifying countries into performance groups involves arbitrary thresholds that might affect group compositions.
Future research should incorporate additional indicators that reflect social equity and economic aspects of educational sustainability, employ sensitivity analyses with different weighting schemes, and utilize qualitative approaches to better understand the mechanisms behind performance changes.
6. Conclusions
This study assessed sustainable education development across EU-27 countries using MOORA and six SDG 4 indicators. Our findings revealed significant performance variations, with Sweden consistently leading, while Romania and Bulgaria remained at the bottom across the pre-pandemic and pandemic-affected periods. Luxembourg and Portugal showed notable improvements in their rankings, while countries like Poland and Greece experienced declines.
This analysis contributes to understanding the performance of an educational system across different time periods, which is relevant to sustainability research. By examining changes in educational indicators across EU member states, we identify potential areas for interventions that could improve system resilience and adaptability, essential characteristics for educational systems facing future disruptions.
These results suggest areas for further research. Successful models, such as Sweden’s educational system, warrant investigation for their underlying characteristics. Consistently lower-performing countries may benefit from targeted analyses of their educational contexts. Furthermore, Luxembourg’s improvement indicates the potential value of developing digital education infrastructure. Policy implications include the following:
- Adopting Sweden’s model of robust digital infrastructure and teacher training.
- Prioritizing digital skill programs in countries like Romania to boost resilience.
- Allocating EU funds (e.g., the European Social Fund) for targeted interventions in low-performing countries.
- Developing crisis-resilient strategies focusing on lifelong learning and digital competencies.
Our methodology provides a valuable framework for ongoing monitoring of educational sustainability, enabling the identification of emerging gaps and the prioritization of resources as the EU continues to work toward its 2030 sustainability targets.
Author Contributions
Conceptualization, I.K. and I.D.; methodology, I.K., H.İ.C. and I.D.; formal analysis, H.B. and I.K.; investigation, F.A., V.S. and R.-I.M.; writing—original draft preparation, I.K., H.B., H.İ.C., I.D., V.S., R.-I.M. and F.A.; writing—review and editing, I.K., H.B., H.İ.C., I.D., V.S., R.-I.M. and F.A.; visualization, H.B.; supervision, H.İ.C. and I.D.; project administration, I.D. All authors have read and agreed to the published version of the manuscript.
Funding
This research received no external funding.
Institutional Review Board Statement
Not applicable.
Informed Consent Statement
Not applicable.
Data Availability Statement
Available from the corresponding author.
Acknowledgments
In preparing this paper, the authors used the ChatGPT model 4 on 15 February 2025, to revise some passages of the manuscript, to double-check for any grammar mistakes, or improve the academic English only [29]. After using this tool, the authors reviewed and edited the content as necessary, taking full responsibility for the publication’s content.
Conflicts of Interest
The authors declare no conflicts of interest.
References
- ONU. Transformar Nuestro Mundo: La Agenda 2030 para el Desarrollo Sostenible. In Proceedings of the A/RES/70/1, Santiago, Chile, 21 October 2015. [Google Scholar]
- Eurostat. Sustainable Development in the European Union: Monitoring Report on Progress Towards the SDGs in an EU Context, 2023 ed.; Publications Office of the European Union: Luxembourg, 2023. [Google Scholar]
- Bikfalvi, A.; Hoz, E.V.; Leal, G.G.; González-Carrasco, M.; Mancebo, N. Riding the wave of sustainability: Integrating OSH into education. Saf. Sci. 2024, 170, 106370. [Google Scholar] [CrossRef]
- Taşçı, G.; Titrek, O. Evaluation of Lifelong Learning Centers in Higher Education: A Sustainable Leadership Perspective. Sustainability 2019, 12, 22. [Google Scholar] [CrossRef]
- Leiber, T. Impact evaluation of quality management in higher education: A contribution to sustainable quality development in knowledge societies. Eur. J. High. Educ. 2018, 8, 235–248. [Google Scholar] [CrossRef]
- Cottafava, D.; Ascione, G.S.; Corazza, L.; Dhir, A. Sustainable development goals research in higher education institutions: An interdisciplinarity assessment through an entropy-based indicator. J. Bus. Res. 2022, 151, 138–155. [Google Scholar] [CrossRef]
- Abo-Khalil, A.G. Integrating sustainability into higher education challenges and opportunities for universities worldwide. Heliyon 2024, 10, e29946. [Google Scholar] [CrossRef]
- Holst, J.; Singer-Brodowski, M.; Brock, A.; de Haan, G. Monitoring SDG 4.7: Assessing Education for Sustainable Development in policies, curricula, training of educators and student assessment (input-indicator). Sustain. Dev. 2024, 32, 3908–3923. [Google Scholar] [CrossRef]
- Myint, K.K.; Thein, N. Implementation of MCDM Techniques for Estimating Regional Education Development in Myanmar. In Proceedings of the 2020 IEEE 9th Global Conference on Consumer Electronics (GCCE), Kobe, Japan, 13–16 October 2020; pp. 76–77. [Google Scholar] [CrossRef]
- Roszkowska, E.; Filipowicz-Chomko, M. Measuring Sustainable Development Using an Extended Hellwig Method: A Case Study of Education. Soc. Indic. Res. 2021, 153, 299–322. [Google Scholar] [CrossRef]
- Jorge-García, D.; Estruch-Guitart, V.; Aragonés-Beltrán, P. How does the type of MCDM method affect the results of the prioritization and assessment of ecosystem services? A case study in the Ebro River Delta (Spain). J. Clean. Prod. 2023, 429, 139637. [Google Scholar] [CrossRef]
- Yadegaridehkordi, E.; Hourmand, M.; Nilashi, M.; Shuib, L.; Ahani, A.; Ibrahim, O. Influence of big data adoption on manufacturing companies’ performance: An integrated DEMATEL-ANFIS approach. Technol. Forecast. Soc. Chang. 2018, 137, 199–210. [Google Scholar] [CrossRef]
- Lu, M.-T.; Hsu, C.-C.; Liou, J.J.H.; Lo, H.-W. A hybrid MCDM and sustainability-balanced scorecard model to establish sustainable performance evaluation for international airports. J. Air Transp. Manag. 2018, 71, 9–19. [Google Scholar] [CrossRef]
- Brodny, J.; Tutak, M. Assessing the Energy and Climate Sustainability of European Union Member States: An MCDM-Based Approach. Smart Cities 2023, 6, 339–367. [Google Scholar] [CrossRef]
- Dergaa, I.; Musa, S.; Romdhani, M.; Souissi, A.; Abdulmalik, M.; Chamari, K.; Saad, H.B. FIFA World Cup 2022: What can we learn from the inspiring Tokyo 2020 Olympic Games held in COVID-19 times? Biol. Sport 2022, 39, 1073–1080. [Google Scholar] [CrossRef]
- Willem, K.B.; Kazimieras, E.Z. The MOORA method and its application to privatization in a transition economy. Control. Cybern. 2006, 35, 445–469. [Google Scholar]
- Piantari, N.K.A.; Putra, I.N.T.A.; Widiastutik, S.; Kartini, K.S. Comparative Analysis of The MOORA Method for Evaluating The Effectiveness of Scholarship Acceptance. J. Galaksi 2024, 1, 22–32. [Google Scholar] [CrossRef]
- Sitorus, Z.; Karim, A.; Nasyuha, A.H.; Aly, M.H. Implementation of MOORA and MOORSA Methods in Supporting Computer Lecturer Selection Decisions. J. Infotel 2024, 16, 554–566. [Google Scholar] [CrossRef]
- Dergaa, I.; Saad, H.B.; Souissi, A.; Musa, S.; Abdulmalik, M.A.; Chamari, K. Olympic Games in COVID-19 times: Lessons learned with special focus on the upcoming FIFA World Cup Qatar 2022. Br. J. Sports Med. 2022, 56, 654–656. [Google Scholar] [CrossRef] [PubMed]
- Varma, J.K.; Feldkamp, C.; Alexander, M.; Norman, E.; Agerton, T.; Davis, R.; Long, T. COVID-19 Transmission Due to Delta Variant in New York City Public Schools from October to December 2021. JAMA Netw. Open 2022, 5, e2213276. [Google Scholar] [CrossRef]
- Smallwood, N.; Harrex, W.; Rees, M.; Willis, K.; Bennett, C.M. COVID 19 infection and the broader impacts of the pandemic on healthcare workers. Respirology 2022, 27, 411–426. [Google Scholar] [CrossRef]
- Enaifoghe, A.O.; Maramura, T.; Ndlovu, M. Critically Assessing the Effect of COVID-19 beyond the Pandemic: The Social and Economic Impacts in Sub-Saharan Africa. J. Hum. Ecol. 2021, 74, 40–48. [Google Scholar] [CrossRef]
- Chen, J.; Tian, D.C.; Zhang, C.; Li, Z.; Zhai, Y.; Xiu, Y.; Gu, H.; Li, H.; Wang, Y.; Shi, F.D. Incidence, mortality, and economic burden of myasthenia gravis in China: A nationwide population-based study. Lancet Reg. Health-West. Pac. 2020, 5, 100063. [Google Scholar] [CrossRef]
- Dergaa, I.; Saad, H.B.; Zmijewski, P.; Farhat, R.; Romdhani, M.; Souissi, A.; Washif, J.; Taheri, M.; Guelmami, N.; Souissi, N.; et al. Large-scale sporting events during the COVID-19 pandemic: Insights from the FIFA World Cup 2022 in Qatar with an analysis of patterns of COVID-19 metrics. Biol. Sport 2023, 40, 1249–1258. [Google Scholar] [CrossRef] [PubMed]
- Nosratabadi, S.; Atobishi, T.; Hegedűs, S. Social Sustainability of Digital Transformation: Empirical Evidence from EU-27 Countries. Adm. Sci. 2023, 13, 126. [Google Scholar] [CrossRef]
- Verhulst, E.; Lambrechts, W. Fostering the incorporation of sustainable development in higher education. Lessons learned from a change management perspective. J. Clean. Prod. 2015, 106, 189–204. [Google Scholar] [CrossRef]
- Giangrande, N.; White, R.M.; East, M.; Jackson, R.; Clarke, T.; Saloff Coste, M.; Penha-Lopes, G. A Competency Framework to Assess and Activate Education for Sustainable Development: Addressing the UN Sustainable Development Goals 4.7 Challenge. Sustainability 2019, 11, 2832. [Google Scholar] [CrossRef]
- Al-Kuwari, M.M.; Du, X.; Koç, M. Performance assessment in education for sustainable development: A case study of the Qatar education system. Prospects 2022, 52, 513–527. [Google Scholar] [CrossRef]
- Dergaa, I.; Saad, H.B.; Glenn, J.M.; Aissa, M.B.; Taheri, M.; Swed, S.; Guelmami, N.; Chamari, K. A thorough examination of ChatGPT-3.5 potential applications in medical writing: A preliminary study. Medicine 2024, 103, e39757. [Google Scholar] [CrossRef] [PubMed]
Disclaimer/Publisher’s Note: The statements, opinions and data contained in all publications are solely those of the individual author(s) and contributor(s) and not of MDPI and/or the editor(s). MDPI and/or the editor(s) disclaim responsibility for any injury to people or property resulting from any ideas, methods, instructions or products referred to in the content. |
© 2025 by the authors. Licensee MDPI, Basel, Switzerland. This article is an open access article distributed under the terms and conditions of the Creative Commons Attribution (CC BY) license (https://creativecommons.org/licenses/by/4.0/).