Article

Simulation and Control of Water Pollution Load in the Xiaoxingkai Lake Basin Based on a System Dynamics Model

1
Yunnan Key Laboratory of Plateau Geographical Process and Environmental Change, Faculty of Geography, Yunnan Normal University, Kunming 650500, China
2
Institute of Geographic Sciences and Natural Resources Research, Chinese Academy of Sciences, Beijing 100101, China
3
University of Chinese Academy of Sciences, Beijing 100049, China
4
Yellow River Institute of Hydraulic Research, Yellow River Conservancy Commission (YRCC), No. 45 Shunhe Road, Zhengzhou 450003, China
5
Key Laboratory of Lower Yellow River Channel and Estuary Regulation, Ministry of Water Resources (MWR), No. 45 Shunhe Road, Zhengzhou 450003, China
*
Author to whom correspondence should be addressed.
Sustainability 2025, 17(15), 7167; https://doi.org/10.3390/su17157167 (registering DOI)
Submission received: 3 July 2025 / Revised: 3 August 2025 / Accepted: 4 August 2025 / Published: 7 August 2025

Abstract

With the rapid development of the social economy, human activities have increasingly disrupted water environments, and the continuous input of pollutants poses significant challenges for water environment management. Taking the Xiaoxingkai Lake basin as the study area, this paper develops a social–economic–water environment model based on the system dynamics methodology, incorporating subsystems for population, agriculture, and water pollution. The model focuses on four key indicators of pollution severity, namely, total nitrogen (TN), total phosphorus (TP), chemical oxygen demand (COD), and ammonia nitrogen (NH3-N), and simulates the changes in pollutant loads entering the river under five different scenarios from 2020 to 2030. The results show that agricultural non-point sources are the primary contributors to TN (79.5%) and TP (73.7%), while COD primarily originates from domestic sources (64.2%). NH3-N is mainly influenced by urban domestic activities (44.7%) and agricultural cultivation (41.2%). Under the status quo development scenario, pollutant loads continue to rise, with more pronounced increases under the economic development scenario, thus posing significant sustainability risks. The pollution control enhancement scenario is most effective in controlling pollutants, but it does not promote socio-economic development and has high implementation costs, failing to achieve coordinated socio-economic and environmental development in the region. The dual-reinforcement scenario and moderate-reinforcement scenario achieve a balance between pollution control and economic development, with the moderate-reinforcement scenario being more suitable for long-term regional development. The findings can provide a scientific basis for water resource management and planning in the Xiaoxingkai Lake basin.

1. Introduction

Lakes are important reservoirs of surface water resources, playing an irreplaceable role in supplying domestic water, regulating river runoff, providing water sources for industrial and agricultural activities, and improving the surrounding ecological environment [1,2,3,4]. However, with the acceleration of population growth, industrialization, and urbanization, lake ecosystems are facing increasingly severe pollution pressures [5]. A large number of pollutants enter lakes through agricultural runoff, domestic sewage, and industrial emissions [6], not only threatening lake water environmental safety and human health but also inhibiting regional socio-economic development [7], thus forming a vicious cycle in which ecological and economic factors constrain each other [8]. Therefore, balancing economic development with water environmental protection has become a common challenge for sustainable development worldwide [9,10].
Currently, the primary methods for studying the interrelationship between regional socio-economic development and the environment include the Fuzzy Comprehensive Evaluation Method [11], Coupling Coordination Degree Models [12], and the Environmental Kuznets Curve hypothesis [13]. These methods have certain advantages in static assessment and quantitative analysis, but they are typically based on linear or unidirectional causal relationships, making it difficult to reveal the dynamic evolution and nonlinear feedback between variables in complex systems [14]. In particular, in the context where pollutant emissions are influenced by multiple factors, these traditional methods struggle to simulate the dynamic response of the system under the combined effects of policy regulation, economic development, and population changes. System dynamics (SD), as an effective tool for simulating the dynamic behavior and feedback mechanisms of complex systems, models the dynamic changes of a system over time through the causal relationships and feedback loops between internal variables [15]. It can reveal the dynamic behavior and development mechanisms of a system [16] and explore the different behavioral patterns formed by the interaction of causal and feedback structures [17]. It is widely applied to solve practical problems characterized by nonlinearity, uncertainty, and dynamic complexity [18]. Currently, research on system dynamics in water resource management has made significant progress, covering multiple aspects such as water quantity, water environment, and ecology [15,19,20]
Xingkai Lake is the largest freshwater lake in East Asia and a border lake between China and Russia, located in Heilongjiang Province and the Primorsky Krai of Russia. It is divided into two parts: Xingkai Lake and Xiaoxingkai Lake. With the expansion of agricultural activities, the rapid development of tourism, and the acceleration of urbanization in the basin [21], the water environmental issues in Xingkai Lake have become increasingly severe [22]. Xiaoxingkai Lake, the “upstream lake” of Xingkai Lake, has overall poor water quality and severe eutrophication [23]. Xiaoxingkai Lake is connected to Xingkai Lake via a floodgate, and there is a certain degree of hydraulic connection between the two. During periods of connectivity, pollutants from Xiaoxingkai Lake can enter Xingkai Lake [24]. Therefore, understanding the load of major pollutants in the Xiaoxingkai Lake basin is crucial for water environment management in the basin and ecological protection of Xingkai Lake, and it also holds significant importance for promoting China–Russia cooperation in water resource management in the Xingkai Lake basin.
This study focuses on the Xiaoxingkai Lake basin within China, examining the challenges of balancing pollution control with socio-economic development in the context of rapid regional growth. Based on the interactive relationships between basin population, economy, and pollutant emissions, a pollution load model based on system dynamics is constructed. The model simulates the trends of four pollution indicators—total nitrogen (TN), total phosphorus (TP), chemical oxygen demand (COD), and ammonia nitrogen (NH3-N)—entering the river under different scenarios and assesses the impacts of various development patterns on the water environment. The results aim to provide a scientific basis for water resource management and planning in the Xiaoxingkai Lake basin and offer theoretical and methodological references for the integrated management of similar transboundary water bodies.

2. Materials and Methods

2.1. Study Area

Xingkai Lake is located at the border between the Primorsky Krai of Russia and the Heilongjiang Province of China and is the largest freshwater lake in Asia. The northern part of Xingkai Lake belongs to China, while the southern part belongs to Russia. It consists of Xingkai Lake and Xiaoxngkai Lake. Xiaoxingkai Lake (45°16′ N–45°24′ N, 132°20′ E–132°50′ E) is located in the northern part of Xingkai Lake and is an inland lake in China [25]. Xingkai Lake and Xiaoxingkai Lake are separated by natural sand dunes and are connected via a floodgate. During the connection period, pollutants from Xiaoxingkai Lake may enter Xingkai Lake. The main rivers flowing into Xiaoxingkai Lake are mostly located on the northern shore, with the Muling River being the primary water source. The Xiaoxingkai Lake basin has a temperate continental monsoon climate, characterized by long winters and short summers. The annual average temperature is 3.1 °C, with temperatures below freezing from October to April. Annual precipitation averages 574 mm, primarily concentrated during the rainy season from May to September [26]. The Xiaoxingkai Lake basin encompasses Jixi City and Muling City (Figure 1). The total population of the basin in 2020 was 1,933,700, including 696,800 agricultural residents and 1,236,900 non-agricultural residents, with an overall urbanization rate of 63.97%. The regional gross domestic product (GDP) was 70.357 billion yuan, with a per capita GDP of 36,384 yuan. The added value of the primary, secondary, and tertiary industries was 24.56 billion, 18.355 billion, and 27.433 billion yuan, respectively. Land use is primarily dominated by cropland and forestland [27].

2.2. Data Sources

The basin boundary data were downloaded from the Hydro SHEDS database (https://www.hydrosheds.org/) as HYDROBASIN level 6. Socio-economic data, including population, livestock numbers, and cropland area, were obtained from the “Jixi City Statistical Yearbook (2009–2021)” [29] and the “Mudanjiang City Statistical Yearbook (2009–2021)” [30]. Water environment-related data were obtained from the “Heilongjiang Province Ecological Environment Status Bulletin” [31].

2.3. System Dynamics Modeling

2.3.1. Model Boundaries and Structure

System dynamics is a scientific discipline that integrates system science theory with computer simulation to study the feedback structures and behaviors of systems. Based on nonlinear dynamics theory, it combines qualitative and quantitative analysis and employs systematic reasoning methods to address complex system issues. This study takes the Xiaoxingkai Lake basin as the system spatial boundary, combining administrative divisions to define the study area as the entire city of Jixi and Muling City under the jurisdiction of Mudanjiang City, with a system area of approximately 28,500 km2. The system simulation period, from 2010 to 2030, is divided into two phases: the first phase from 2010 to 2020 (historical years) and the second phase from 2021 to 2030 (projected years). The simulation time step is set to one year.
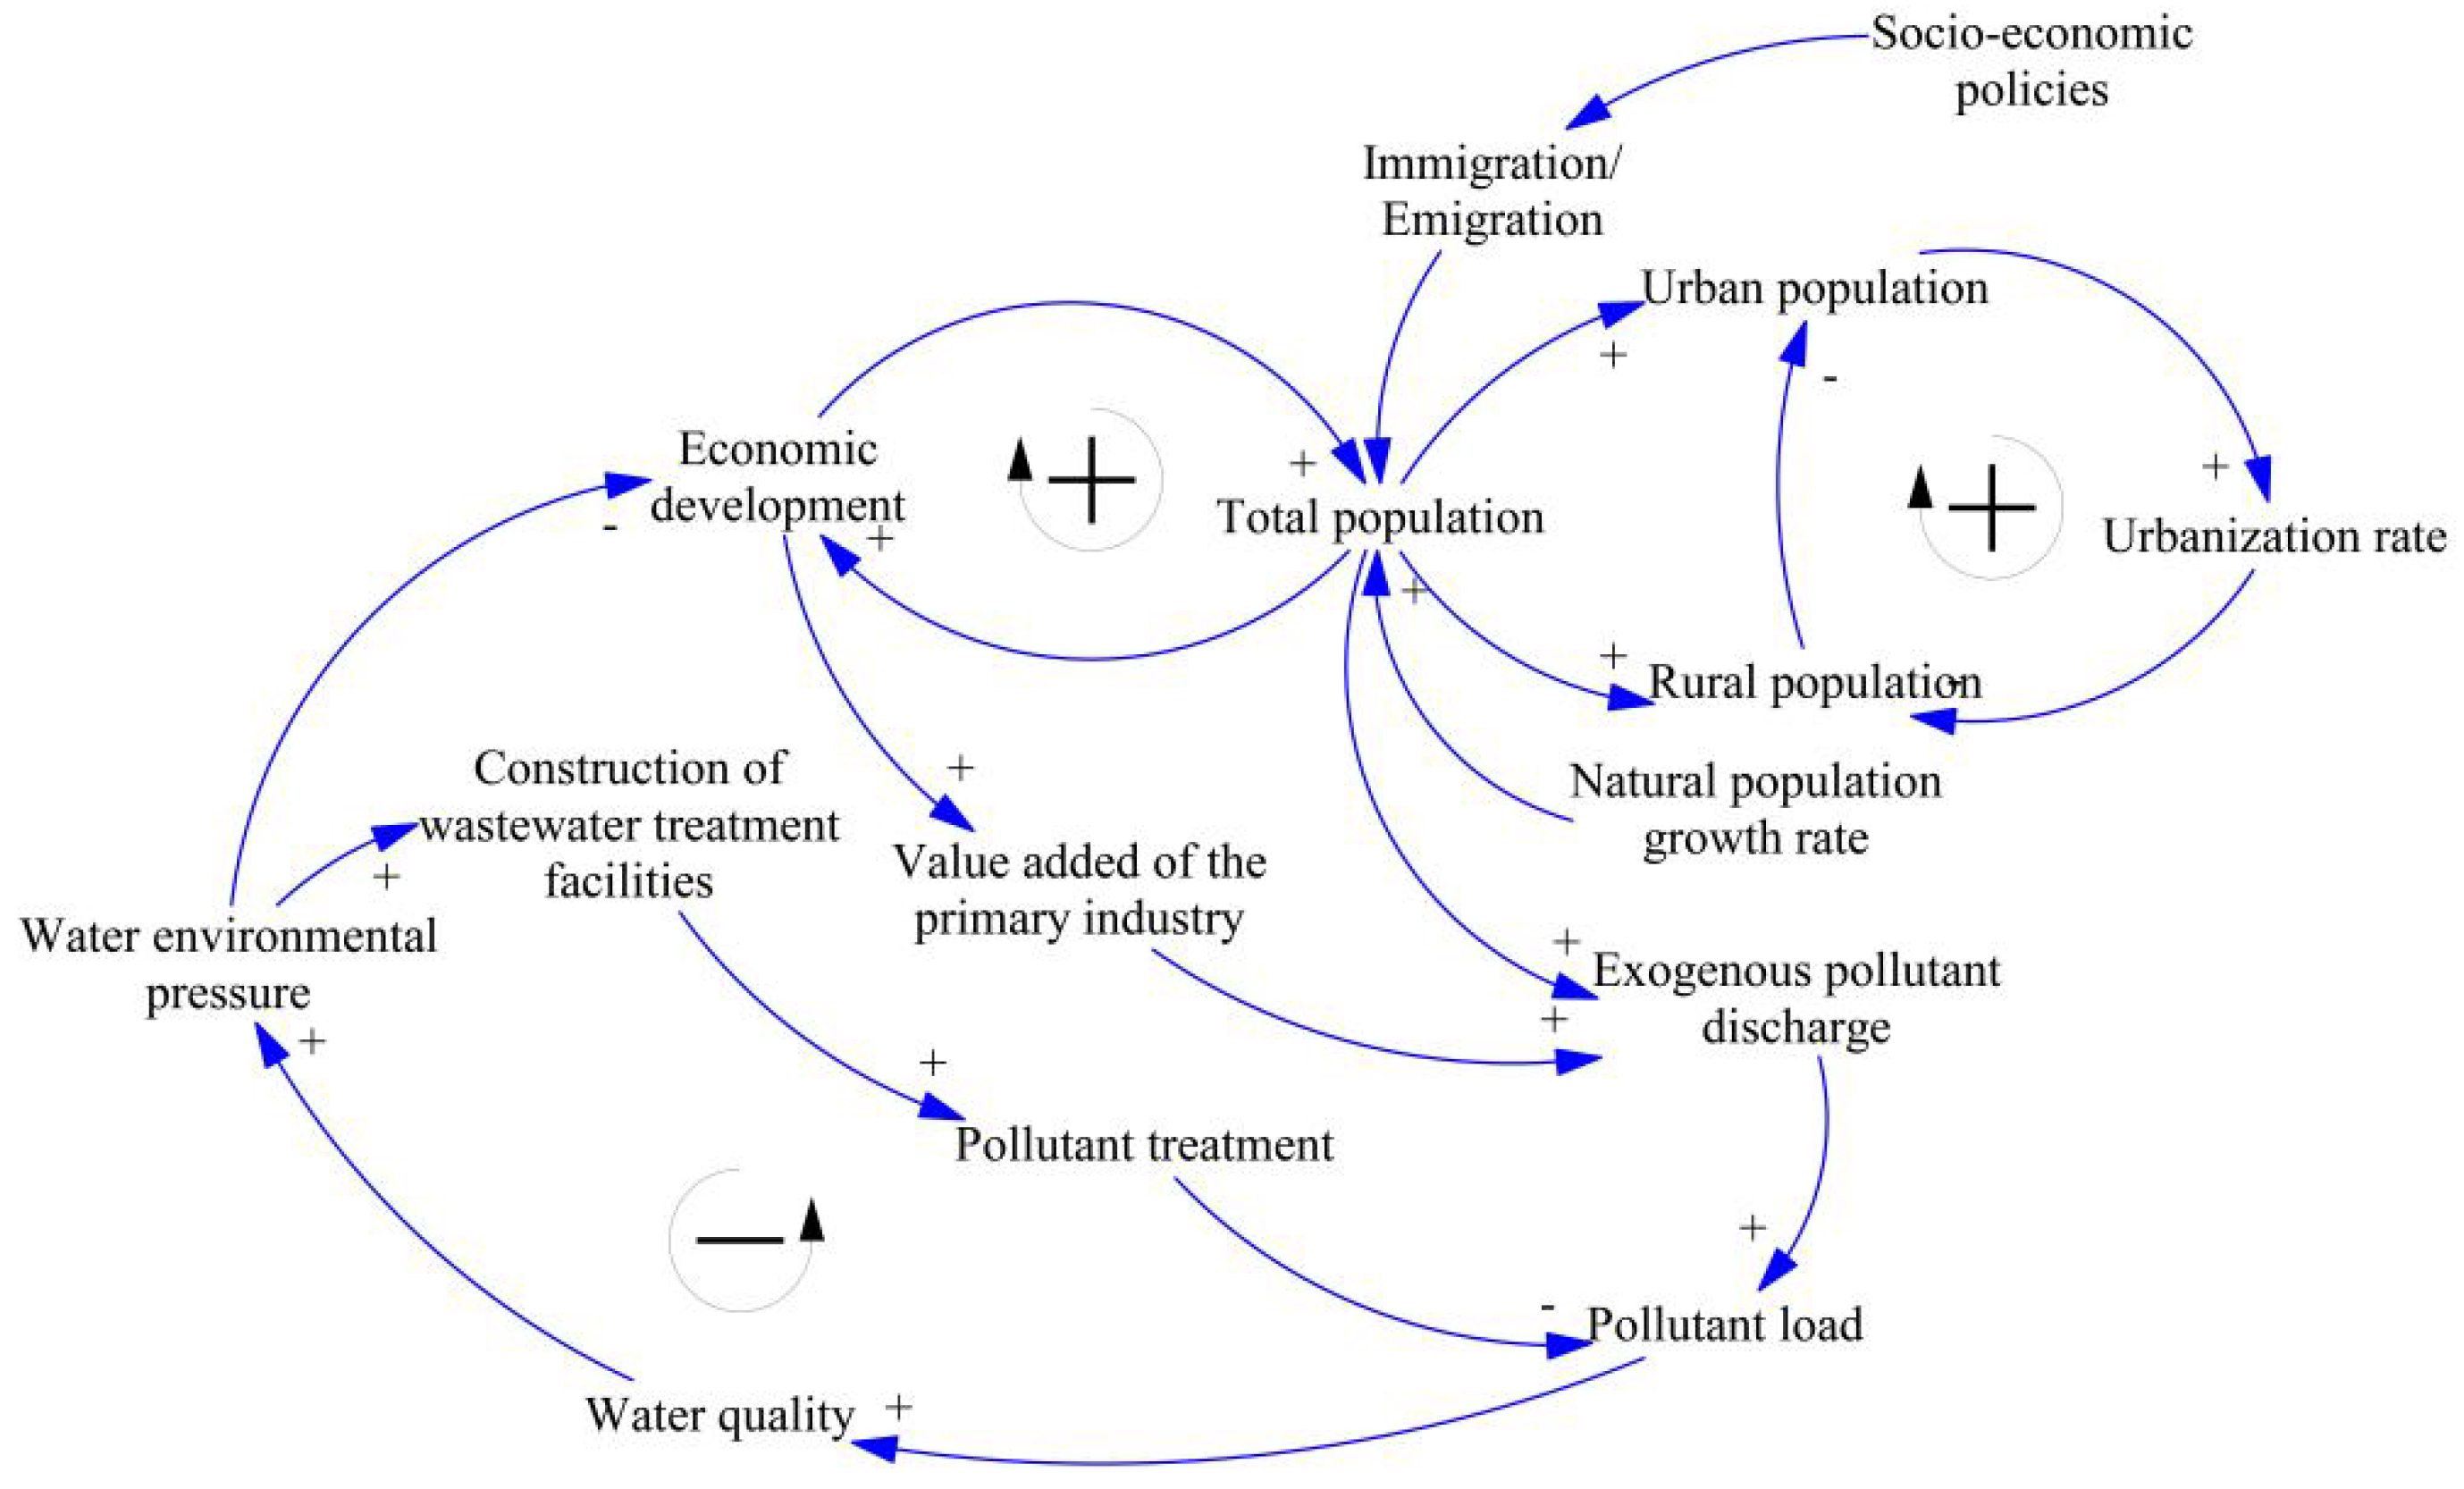
In the study area, TN, TP, COD, and NH3-N mainly originate from agricultural and domestic sources, while industrial sources account for a relatively small proportion. Based on this, the water pollution load system of the Xiaoxingkai Lake basin is divided into three subsystems: the population subsystem, the agricultural subsystem, and the water pollution subsystem. The causal relationships within the system are shown in Figure 2.
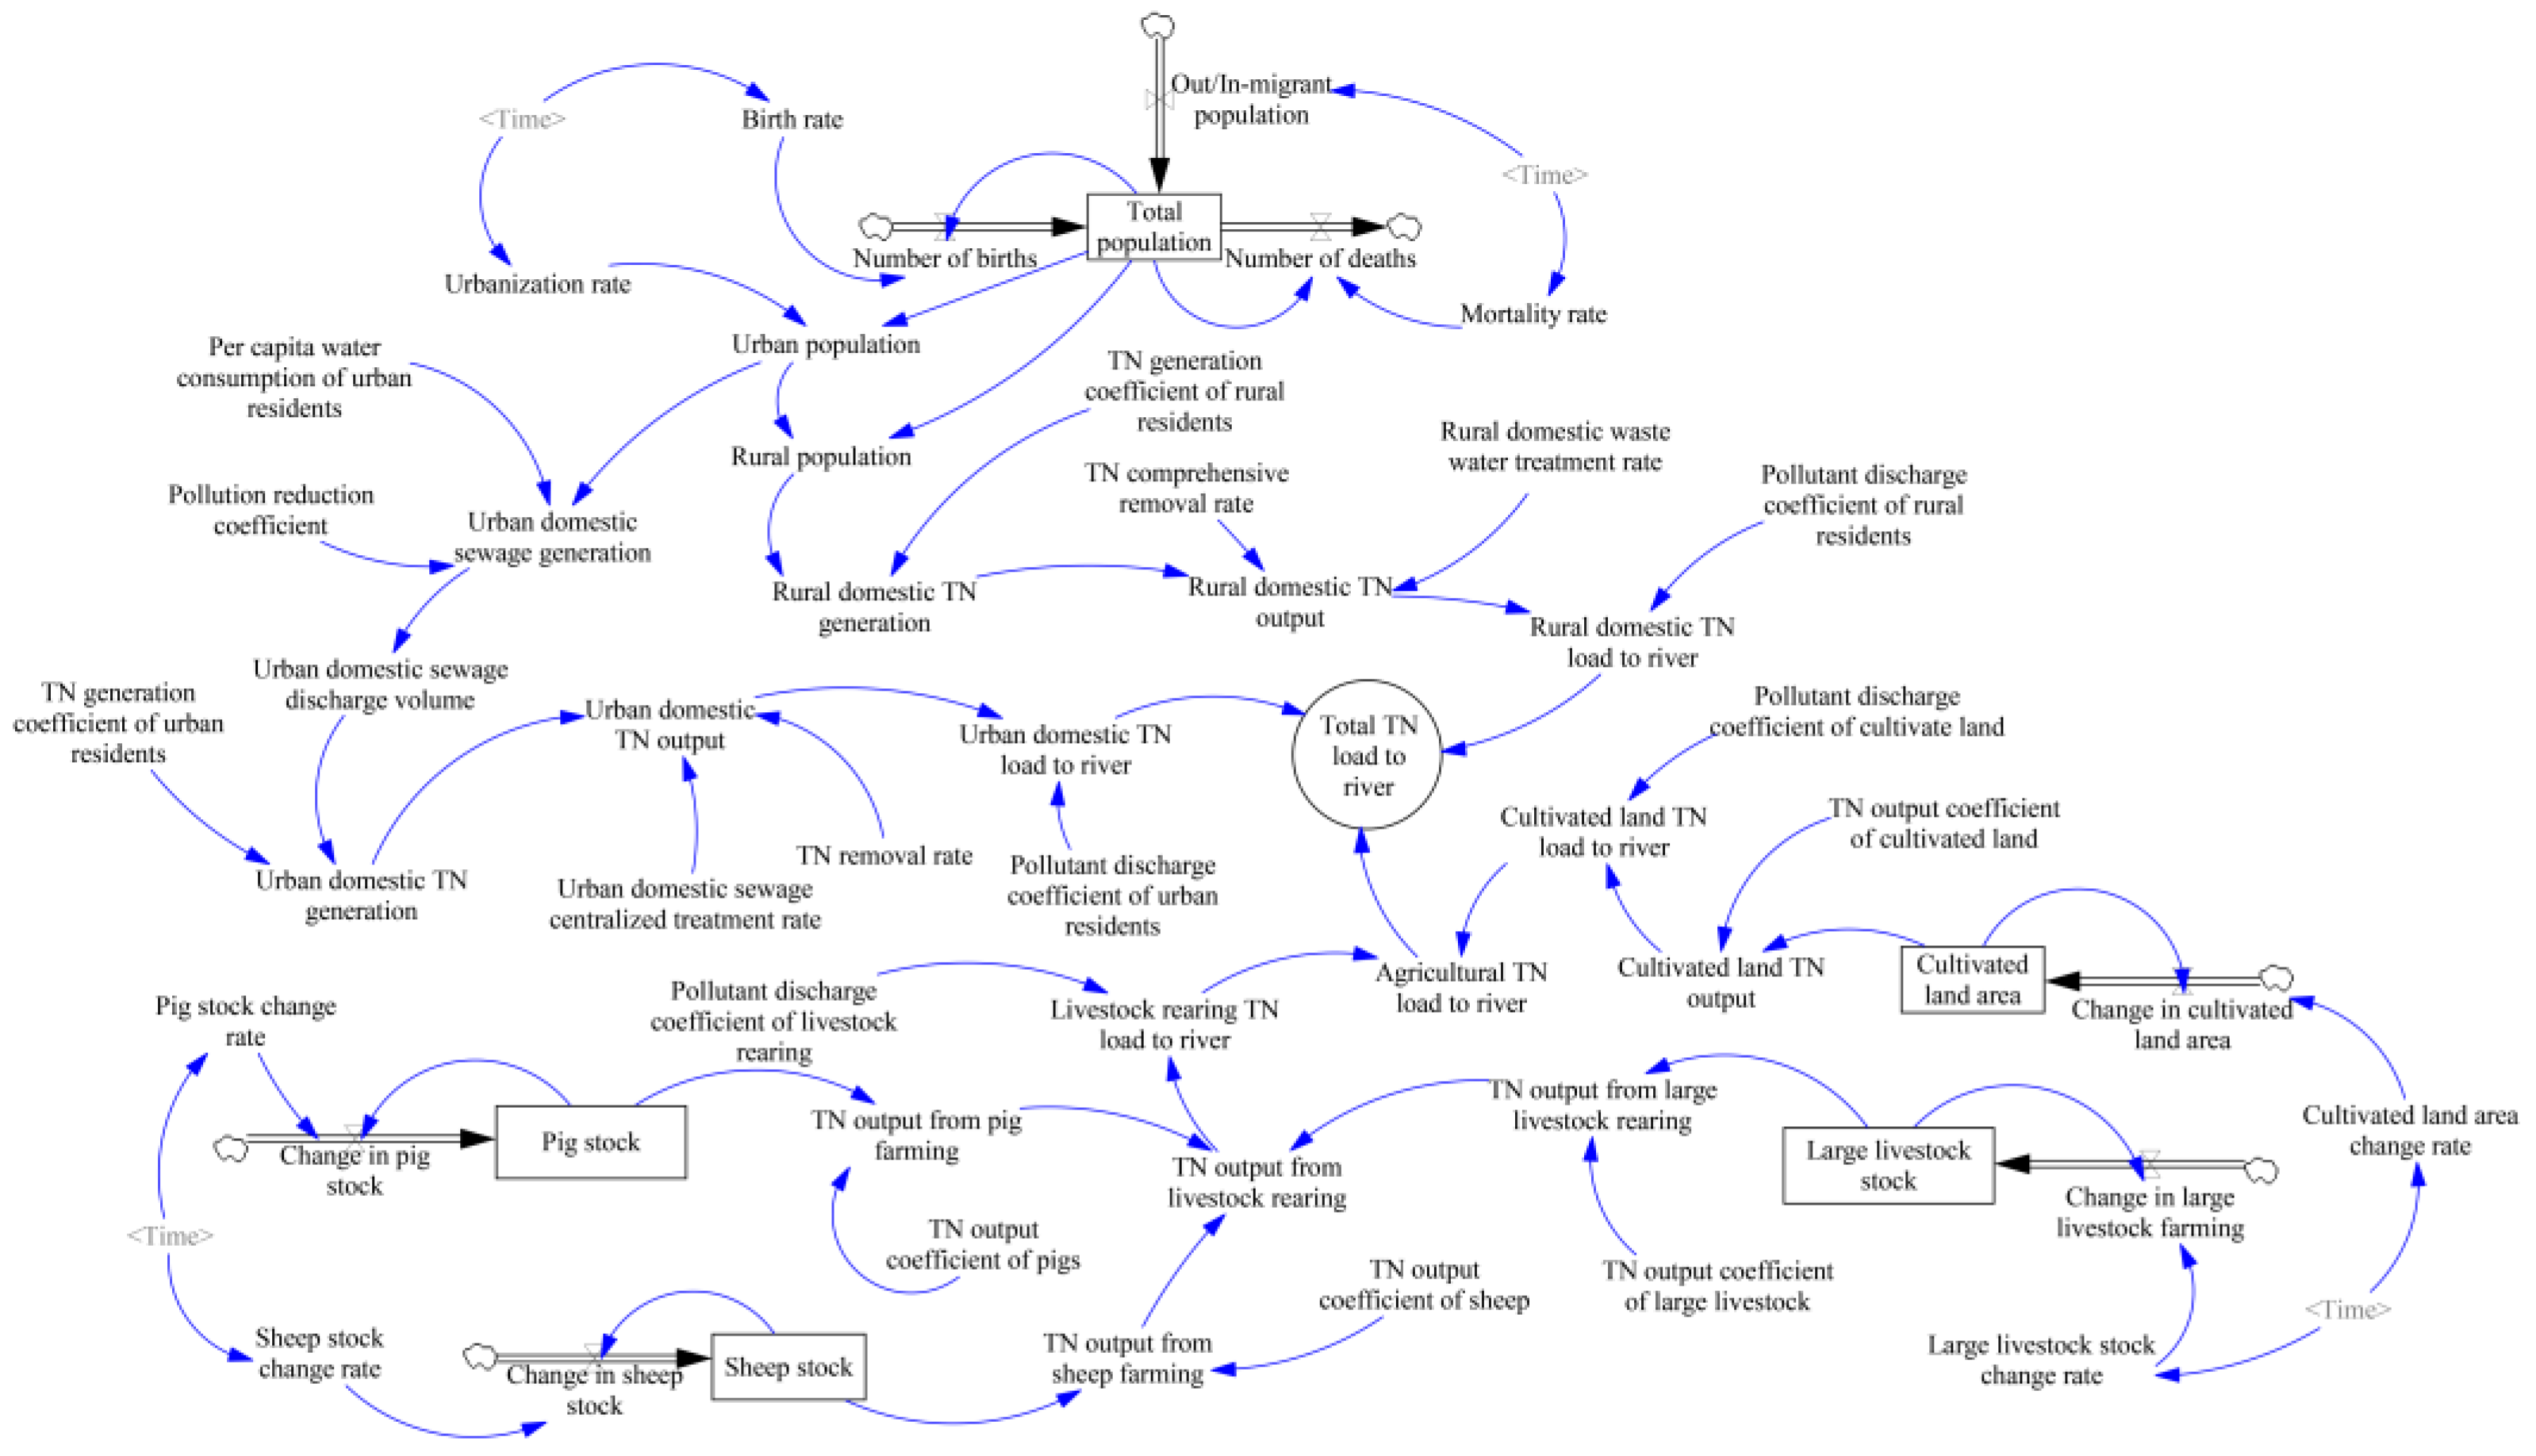
Based on the established causal relationship diagram, the functional relationships between the variables are processed, and the level variables, rate variables, auxiliary variables, constants, and table functions in the model are defined. A pollution load SD stock flow diagram for the Xiaoxingkai Lake basin (using TN as an example) is constructed, as shown in Figure 3.

2.3.2. Model Parameters and Equations

The SD simulation model includes multiple variables. The main relevant parameters and system dynamics equations used in this study are shown in Table 1.

2.3.3. Model Validity Testing

After the model is constructed, it must be validated [32] to ensure that the simulation results are consistent with reality and can be used for subsequent scenario simulations [33]. Among these, model error validation is the most direct method for assessing whether the model meets simulation requirements. Historical validation, as a common and effective system dynamics validation method, offers advantages such as strong operability, relatively easy data acquisition, and intuitive validation results. By verifying the consistency between simulated values and actual historical data [34], one can determine whether the model structure is reasonable and whether parameter settings are accurate, thereby further validating the model’s usability and reliability. The calculation formula is shown in (1):
C i = R i r i r i × 100 %
Among them, Ci represents the relative error of the variable; Ri and ri represent the simulated results and historical data values of the variable, respectively.

2.3.4. Scenario Design

To analyze the trends in pollutant load changes in the Xiaoxingkai Lake basin under different development scenarios, key parameters in the system dynamics (SD) model were adjusted with reference to the “Jixi City’s 14th Five-Year Plan for Environmental Protection” [35], the “Master Plan for the Territorial Space of Jixi City (2021–2035)” [36], the “Mudanjiang City’s 14th Five-Year Plan for Environmental Protection” [37], and the “Master Plan for the Territorial Space of Muling County (2021–2035)” [38], combined with regional development expectations. Five scenario modes were designed: status quo continuation, economic development scenario, pollution control enhancement scenario, dual-reinforcement scenario, and moderate-reinforcement scenario. By comparing the simulation results of the system dynamics model under different schemes, while considering pollutant loads in the Xiaoxingkai Lake basin under different schemes, specific parameter settings are shown in Table 2:
(1)
Status quo scenario (S0): The development of the Xingkai Lake basin will remain unchanged from 2021 to 2030. The parameters of the plan will be based on the 2020 values, and the changes in pollutant loads during the period from 2021 to 2030 will be simulated and used as a reference for other scenarios.
(2)
Economic development scenario (S1): Based on the status quo scenario, this scenario assumes that the study area prioritizes economic development, with economic development at a high level and pollution control measures remaining unchanged. This scenario mainly reflects social and economic development by increasing parameters such as livestock and poultry farming scale, population growth rate, and domestic water consumption and simulates the amount of pollutants entering rivers under conditions of rapid economic development.
(3)
Pollution control enhancement scenario (S2): Building on the status quo type, this approach prioritizes environmental protection as its primary objective. It primarily achieves this by increasing the sewage treatment rates for urban and rural domestic wastewater, as well as the treatment rates for domestic pollutants in urban and rural areas. Additionally, agricultural pollution control is enhanced by employing technological measures to reduce the pollutant output coefficients from livestock farming, thereby maintaining environmental protection at a high level. This approach simulates pollutant inflows into rivers under conditions of stringent pollutant control.
(4)
Dual-reinforcement scenario (S3): This scenario combines high economic growth and strong environmental protection, integrating high-intensity parameter settings from both the economic development and pollution control scenarios. It assumes an increase in industrial scale and population growth while implementing stringent pollutant reduction measures. It simulates pollutant loads under conditions of rapid economic growth combined with intensive pollution control.
(5)
Moderate-reinforcement scenario (S4): This scenario represents a balanced approach with moderate levels of economic growth and environmental protection. Compared to the economic development scenario, the growth rates of livestock and poultry farming and population are moderately reduced; compared to the pollution control scenario, the decline in pollutant output coefficients is slowed down. This scenario simulates pollutant loads under conditions of moderate economic growth combined with moderate pollution control. This scenario aims to simulate the common “economic-environmental trade-off” approach found in real-world basin planning, balancing the sustainability of regional economic development with the costs and feasibility of environmental governance, aligning with the governance pathways frequently adopted in policy-making practices.

3. Results

3.1. Model Validity Verification

Based on statistical data from the statistical yearbooks of Jixi City and Mudanjiang City, the total population, rural population, urban population, and cropland area from 2010 to 2020 were selected as historical verification indicators. Historical data were compared to simulation results, and Formula (1) was used to verify the rationality of the model system structure and the accuracy of the simulation results. The specific results are shown in Figure 4.
According to the test results in Figure 4, both the historical and simulated values of the total population show a declining trend year by year, with a relative error ranging from −1.56% to 0.12%. The historical and simulated values of the rural population also show a declining trend year by year, with a relative error ranging from −1.57% to 0.1%. The urban population shows a fluctuating downward trend, with a relative error ranging from −1.56% to 0.13%; the cultivated land area showed little change and remained at a relatively low level before 2016 but saw a significant increase in 2016. The relative error between the simulated values and historical statistical values is relatively large, ranging from −3.9% to 3.5%, but it remains within the acceptable error range. In summary, the relative error between the simulated values and historical statistical values for the selected variables is less than 5%, and their trends are similar, indicating that the simulation model constructed in this study has high accuracy and reliability.

3.2. Contribution Analysis of Contamination Sources

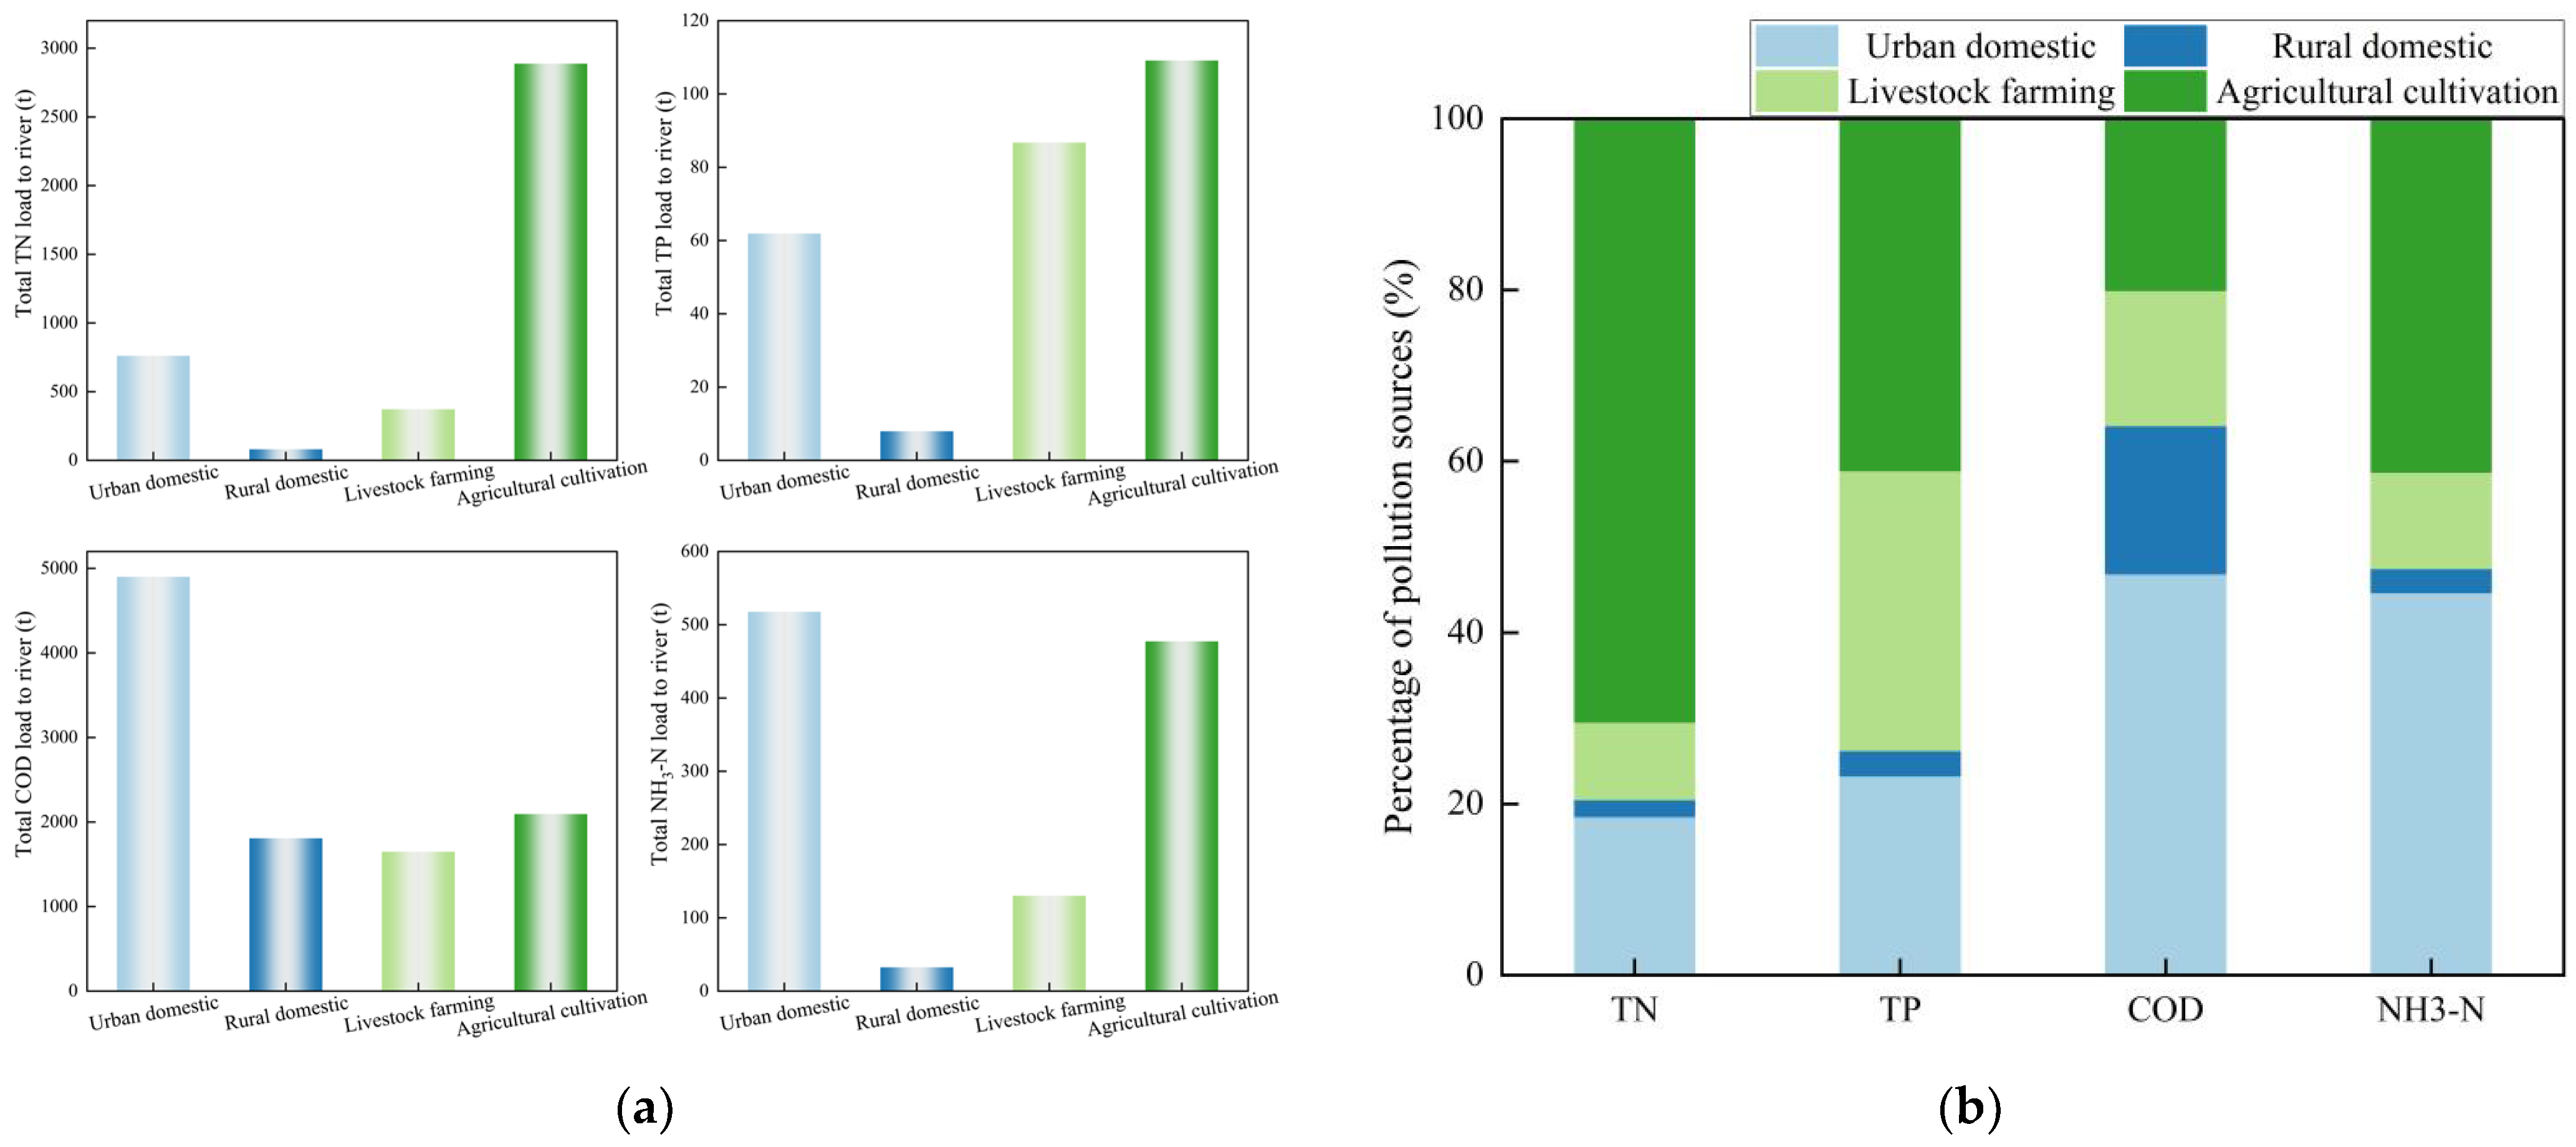
Based on the constructed system dynamics model, simulations were conducted to estimate the riverine loads of four pollution indicators—TN, TP, COD, and NH3-N—and the contribution rates of different pollution sources for the year 2020. The results are presented in Figure 5. The riverine loads of TN, TP, COD, and NH3-N were 4100.7 t, 265.7 t, 10,445 t, and 1157.5 t, respectively. The primary source of TN inflow load is agricultural cultivation, accounting for 70.4% of the contribution rate, followed by urban domestic activities and livestock farming, with contribution rates of 18.6% and 9.1%, respectively. Rural domestic activities contribute the least, at 2.0%. The primary source of TP pollution load is agricultural cultivation, accounting for 41.1%, followed by livestock farming and urban domestic activities, contributing 32.6% and 23.3%, respectively; COD primarily originates from urban domestic activities, accounting for 46.9%, with rural domestic activities, agricultural cultivation, and livestock farming contributing 17.3%, 20.0%, and 15.8%, respectively. NH3-N primarily originates from urban domestic activities (44.7%) and agricultural cultivation (41.2%), with livestock farming and rural domestic activities contributing 11.2% and 2.8%, respectively.
Overall, there are significant differences in the impact of different pollution sources on these four pollutants. TN and TP pollutants primarily originate from agricultural non-point source pollution, indicating that agricultural activities dominate nitrogen and phosphorus loads. COD primarily originates from domestic sources, indicating that domestic wastewater is the core source of organic pollution in the watershed. NH3-N is jointly dominated by both sources.

3.3. Changes in Pollution Load Under Different Circumstances

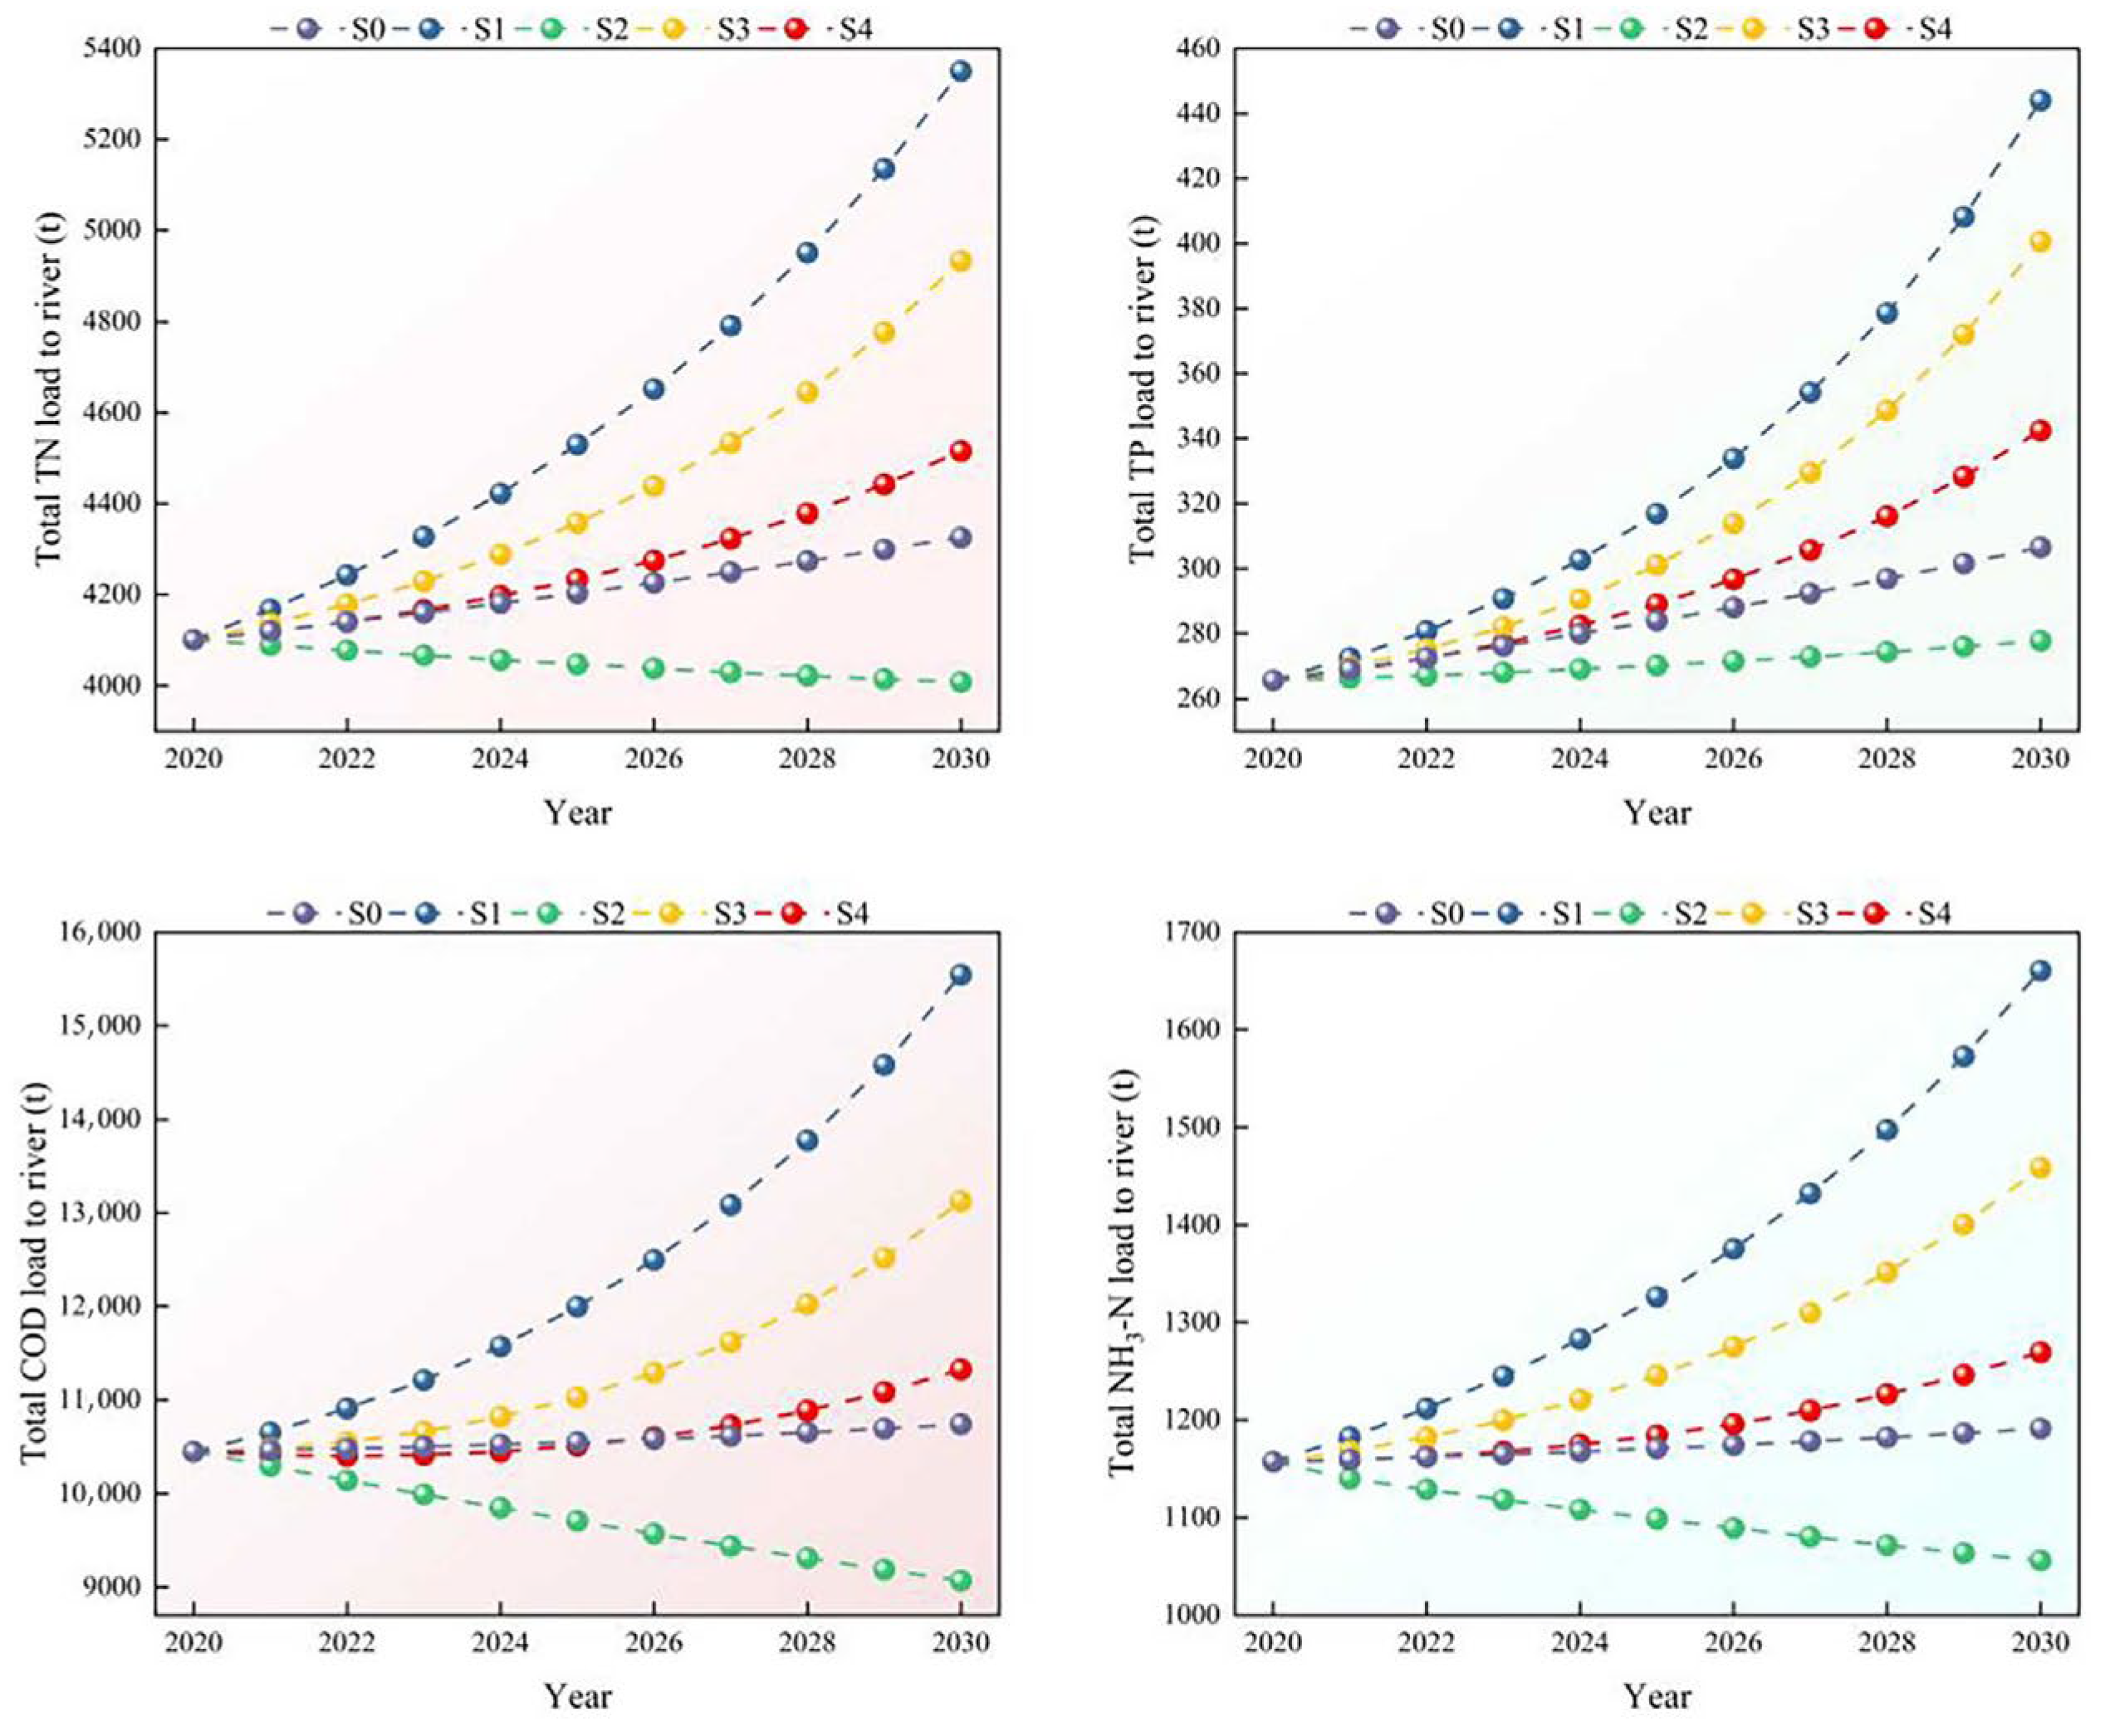
Based on the constructed system dynamics model, the trends in the four types of pollution indicators entering the river under five scenarios for the 2020–2030 period in the Xiaoxingkai Lake basin are shown in Figure 6.
Under the current development scenario (S0), the annual discharge of four pollutants into the river basin has been increasing year by year. Specifically, from 2020 to 2030, the annual discharge of total nitrogen (TN) into the Xiaoxingkai Lake basin increased from 4100.7 tons to 4325.7 tons, with an average annual growth rate of 0.54%. TP will increase from 265.7 tons to 306.6 tons, with an average annual growth rate of 1.44%. COD will increase from 10,450 tons to 10,742.8 tons by 2030, with an average annual growth rate of 0.28%. The river inflow of NH3-N increased from 1157.5 tons to 1191.6 tons, with an annual growth rate of 0.29%. Among these, the growth rates of TP and TN were relatively faster, while those of COD and NH3-N were relatively slower. This indicates that future water environmental issues in the basin will primarily focus on agricultural non-point source pollution.
Under the economic development scenario (S1), the river inflow of all pollutants is higher than under the status quo continuation scenario and shows a significant upward trend. The river inflow of TN increased from 4100.7 tons to 5350.4 tons, with an average annual growth rate of 2.7%; the average annual growth rate of TP was 5.27%, ranging from 265.7 to 444 tons; COD shows an annual growth rate of 4.05%, increasing from 10,450 tons in 2020 to 15,544.6 tons in 2030; and NH3-N shows an annual growth rate of 3.67%, increasing from 1157.5 to 1660.6 tons. The annual growth rates of all four pollutants are relatively high, indicating that under conditions of rapid economic development and unchanged pollution control measures, the burden on water environments will intensify.
Under the pollution control enhancement scenario (S2), the annual discharge of TP into rivers shows a slow upward trend, with an average annual growth rate of 0.44%, increasing from 265.7 t to 277.8 t; meanwhile, TN, COD, and NH3-N exhibit a decreasing trend year by year, with average annual growth rates of −0.23%, −1.41%, and −0.91%, respectively. The annual TN inflow decreased from 4100.7 t to 4008.5 t, COD decreased from 10,450 t to 9069 t, and NH3-N inflow decreased from 1157.5 t to 1056.2 t. Under this scenario, maintaining the same economic growth rate, improving domestic wastewater treatment rates, and reducing pollutant output coefficients have a good effect on pollutant control in the Xiaoxingkai Lake basin.
Under the dual-reinforcement scenario (S3), pollutant inputs into rivers fall between the economic development scenario and the status quo scenarios and also show a significant upward trend. Specifically, TN inputs increased from 4100.7 t to 4932.8 t, with an average annual growth rate of 1.86%; TP shows an average annual growth rate of 4.19%, ranging from 265.7 t to 400.6 t; COD increased at an average annual rate of 2.31%, from 10,450 tons in 2020 to 13,127.3 tons in 2030; and NH3-N increased at an average annual rate of 2.34%, from 1157.5 to 1458.8 tons. Under this scenario, environmental governance measures are significantly strengthened, while the intensity of socio-economic activities also increases significantly. Pollutant inputs into rivers show an upward trend, but the growth rate is slower compared to the economically driven scenario, indicating that pollution control measures can, to some extent, mitigate the growth of pollution loads.
Under the moderate-reinforcement scenario (S4), pollutant inputs into rivers show a slow upward trend, falling between the dual-reinforcement scenario and the status quo scenario. Among these, TN inflows increased to 4515.6 t, with an annual growth rate of 0.97%; TP inflows increased to 342.5 t, with an annual growth rate of 2.57%; COD increased to 11,326.2 t, with an annual growth rate of 0.81%; and NH3-N increased at an annual growth rate of 0.93%, ranging from 1157.5 to 1269.5. In the early stage of the simulation, the river inflow of COD and NH3-N was slightly lower than the status quo model, but in the later stage, the river inflow of pollutants showed a significant increase. This indicates that moderate-intensity governance measures have a certain effect in the early stage under moderate-intensity socio-economic development, but further strengthening of pollution control is needed in the later stage.

4. Discussion

4.1. Sources and Countermeasures of Basin Pollution Load

Based on the system dynamics simulation of the riverine input of four pollution indicators (TN, TP, COD, and NH3-N), this study analyzes the pollution sources in the Xiaoxingkai Lake basin from agricultural cultivation, livestock breeding, urban domestic activities, and rural domestic activities. Agricultural cultivation is the dominant contributor to TN, TP, and NH3-N input. In China, the average utilization rates of nitrogen and phosphorus fertilizers are approximately 30–35% and 10–20%, respectively [39], indicating relatively low fertilizer use efficiency. The nitrogen and phosphorus not fully absorbed by crops can enter water bodies through surface runoff and infiltration, leading to continuous increases in non-point source pollution loads [40] and, consequently, deteriorating lake water quality. In addition, livestock breeding contributes significantly to TP pollution. Livestock and poultry manure are rich in both organic and inorganic phosphorus [41]. The uncontrolled discharge of manure facilitates the accumulation of phosphorus in the environment, exacerbating TP pollution [42]. Urban domestic activities are major sources of COD and NH3-N. Urban sewage contains large amounts of organic matter. Although wastewater treatment facilities have been established, they cannot completely remove pollutants from domestic sewage [43], thus posing threats to the water environment of the basin. To mitigate pollution from agricultural cultivation, it is essential to promote scientific fertilization practices, optimize fertilizer application rates, and reduce pesticide use. Designating planting zones and establishing vegetative buffer strips can also help minimize pollution. For livestock-related pollution, a circular agricultural model should be promoted by integrating crop and livestock production. Manure should be collected and processed to convert it into usable resources, such as organic fertilizers, thereby enhancing resource recycling and strengthening the linkage between livestock and crop farming. Regarding pollution from domestic sources, efforts should focus on advancing treatment technologies and improving pollutant removal efficiency. Although rural domestic sources contribute less to overall pollution, the centralized treatment rate of rural sewage in the Xiaoxingkai Lake basin remains low. Measures should be taken to establish effective collection systems, develop targeted treatment standards, and improve solid waste management infrastructure in rural areas.

4.2. Scenario Comparison and Future Regulatory Recommendations

The economic development scenario prioritizes rapid socio-economic development and promotes population concentration through regional economic growth. Under this scenario, livestock and poultry farming numbers increase significantly, and population growth drives an increase in urban domestic water consumption. However, this scenario neglects environmental protection and fails to simultaneously enhance pollutant control measures, leading to a significant increase in pollutant discharge into rivers. While short-term economic benefits are evident, pollutant emissions continue to rise, resulting in a sustained decline in environmental quality. Continuous deterioration of environmental quality will, in turn, inhibit socio-economic development [44]; for example, declining water quality will affect the safety of agricultural irrigation and residential water use [45]. In the long term, environmental degradation will become a key factor limiting regional socio-economic development. Therefore, single-minded economic expansion cannot achieve coordinated development of socio-economic and ecological protection.
The pollution control enhancement scenario focuses on pollutant control and achieves good control of pollutant emissions. Under this scenario, the growth rates of the four categories of pollution severity indicators are low, with some pollution indicators showing a downward trend, resulting in significant environmental benefits. However, this approach has limited promotional effects on socio-economic development, as it continues the economic development model of the base year (2020), which may hinder regional economic growth. Additionally, stringent pollution control measures require substantial fiscal investment [46], resulting in high implementation costs. Therefore, this scenario is more suitable for ecologically fragile regions or areas with urgent environmental restoration needs.
The dual-reinforcement scenario simultaneously promotes economic growth and pollutant control to achieve coordinated development of socio-economic and environmental protection. Under this scenario, while ensuring rapid socio-economic development, strengthening pollution control can, to some extent, achieve a balance between economic growth and pollution control. However, simultaneously strengthening socio-economic and environmental protection may lead to relatively high fiscal pressures and governance costs [47], making it less feasible. Under high-intensity pollution control measures, the regional pollutant emission growth rate remains significant, resulting in low environmental benefits. While initial governance efforts yield significant results, the diminishing marginal benefits of pollution reduction lead to rising governance costs in later stages, resulting in a decline in per-unit environmental benefits [48]. As shown in Figure 6, although the dual-reinforcement scenario demonstrates good pollution control effects in the early stages of simulation, the pollutant load entering rivers significantly increases in later stages, second only to the economically driven scenario. This indicates that despite the implementation of high-intensity environmental governance, the effectiveness of pollutant control is limited in the later stages under high-intensity economic development, and the contradiction between socio-economic development and the environment becomes increasingly prominent in the later stages. Therefore, the overall practical feasibility of this scenario is relatively low.
In contrast, the moderate-reinforcement scenario moderately controls the pace of economic expansion to avoid exacerbating pollution due to rapid socio-economic development while advancing pollution control measures, thereby achieving effective control of pollution loads. Compared to the dual-intensive scenario, this scenario involves fewer pollution control efforts, resulting in lower implementation costs. However, the growth rate of pollution loads entering rivers is significantly lower, and the scenario continues to demonstrate good pollution control effects in the later stages of the simulation. This indicates that under this scenario, socio-economic development maintains orderly growth while also addressing environmental protection needs, with good pollution control outcomes and higher operational feasibility and practical adaptability. Therefore, under conditions of limited resource allocation, this scenario offers relatively higher cost-effectiveness and implementation feasibility, making it an optimal choice for currently coordinating the advancement of economic and environmental objectives in the region.
In conjunction with the “Jixi City National Economic and Social Development 14th Five-Year Plan and 2035 Long-Term Goals Outline” “https://www.jixi.gov.cn/jixi/c100328/202103/c06_1024.shtml (accessed on 30 July 2025)”, the current development planning priorities for the Xiaoxingkai Lake basin focus on promoting economic growth and infrastructure construction while increasing environmental governance investments. The overall development path aligns more closely with the moderate-reinforcement scenario development model. This scenario achieves a dynamic balance between pollutant control and economic growth. However, it is worth noting that, compared to the baseline scenario (S0), pollutant inflows into rivers still show an upward trend in this scenario, and the gap in pollutant inflows between the two scenarios widens over time. Therefore, in the later stages of the simulation, efforts should be further intensified to strengthen pollution control, with a focus on controlling point source pollution while shifting the emphasis to addressing agricultural non-point source pollution, thereby achieving true coordination between socio-economic development and environmental protection.
Further integration of land use status, population density, cropland ratio, and livestock density within the basin is essential for a comprehensive assessment of suitable development scenarios for each region (Figure 1b,c). In the central part of the basin, the urban areas of Jixi City, Jidong County, and Mishan City exhibit high livestock density and population density. Additionally, Mishan City, which is the county where Xiaoxingkai Lake and Xingkai Lake are located, boasts extensive cropland. It is recommended that this region prioritize the implementation of a moderate-reinforcement or pollution control enhancement scenario to achieve synergistic development between pollution control and agricultural economics. Additionally, Muling City, as an upstream region in the basin with high livestock farming density, should focus on controlling livestock farming pollution. Hulin City, as a downstream region in the basin, has a lower overall population density and livestock farming density, and can appropriately implement an economically prioritized scenario model.
The pollution control measures in the scenario settings are all focused on source control. However, due to the unique geographical location of the Xiaoxingkai Lake basin, it is necessary to further integrate measures such as intercepting pollutants along transmission pathways and end-of-pipe treatment. For example, establishing ecological buffer zones around Xingkai Lake, diverting farm drainage into ecological ditches, and constructing artificial wetlands can more comprehensively achieve pollution control in the basin through source control, process interception, and end-of-pipe treatment. As a transboundary lake, to achieve overall ecological security in the basin, it is necessary to promote the establishment of a China–Russia cross-border water body joint governance mechanism. This includes strengthening data sharing between the two sides in water quality monitoring and pollution flux estimation, constructing joint automatic water quality monitoring stations, and jointly establishing cross-border ecological buffer zones based on different land use patterns to promote China–Russia collaborative management of water resources in the Xingkai Lake basin.

5. Conclusions

This study employs system dynamics to construct a “socio-economic-water environment” model for the Xiaoxingkai Lake basin, systematically analyzing the trends in typical pollution indicators entering the river under five different development scenarios. The results indicate that, under the current development model, pollutant levels in the basin continue to rise, and water environmental pressure continues to intensify. In particular, under the economic development scenario, regional economic expansion leads to a significant increase in pollutant emissions, posing a serious threat to the water environment. In contrast, under the pollution control enhancement scenario, pollution control is highly effective, with a significant decrease in typical pollutant loads entering the river and a noticeable improvement in water environmental quality, although this slows economic development. Under the “dual-reinforcement scenario” and “moderate-reinforcement scenario” comprehensive scenarios, a certain balance is achieved between environmental and economic objectives, with the moderate-reinforcement scenario demonstrating stronger feasibility. This study not only reveals the future trends in pollutant loads in the Xiaoxingkai Lake basin but also provides references for regional water environment governance and comprehensive pollution prevention and control.
It should be noted that this study endeavors to incorporate as many factors influencing pollutant inputs into rivers as possible, including population growth and agricultural activities. However, it cannot encompass all elements, leading to certain factors being excluded from the model, such as the impact of climate change on pollution loads, the enforcement strength of local government policies, and farmers’ responses to policies. These behaviors often play a crucial role in basin governance. Additionally, system dynamics models have drawbacks, such as high parameter uncertainty (pollutant output coefficients) and weak spatial representation capabilities. To enhance the accuracy and applicability of future research, machine learning methods can be employed to assist in parameter estimation, thereby improving model precision. Additionally, integrating GIS technology can enhance the spatial simulation capabilities of system dynamics models.

Author Contributions

Conceptualization, P.W.; methodology, P.W. and F.L.; data curation, Y.W.; formal analysis, Y.W.; investigation, Y.W.; resources, P.W. and F.L.; writing—original draft preparation, Y.W. and D.C.; writing—review and editing, D.C., M.F., P.W., L.H. and C.D.; visualization, Y.W.; Supervision, P.W. and C.D.; project Administration, P.W. and F.L.; funding Acquisition, P.W. and F.L. All authors have read and agreed to the published version of the manuscript.

Funding

This research was funded by the National Key Research and Development Program of China—Science & Technology Cooperation Project of Chinese and Russian Government “Sustainable Transboundary Nature Management and Green Development Modes in the context of Emerging Economic Corridors and Biodiversity Conservation Priorities in the South of the Russian Far East and Northeast China (No. 2023YFE0111300)”.

Institutional Review Board Statement

Not applicable.

Informed Consent Statement

Not applicable.

Data Availability Statement

No new data were created or analyzed in this study. Data sharing is not applicable to this article.

Conflicts of Interest

The authors declare no conflicts of interest.

References

  1. Mu, J.; Wu, Y.; Qi, P.; Chen, L.; Yuan, Y.; Wu, H. Spatial and temporal change of hydrological connectivity in the Wusuli River Basin. J. Hydrol. Reg. Stud. 2024, 53, 101814. [Google Scholar] [CrossRef]
  2. Woolway, R.I.; Kraemer, B.M.; Lenters, J.D.; Merchant, C.J.; O’Reilly, C.M.; Sharma, S. Global lake responses to climate change. Nat. Rev. Earth Environ. 2020, 1, 388–403. [Google Scholar] [CrossRef]
  3. Nakayama, T.; Watanabe, M. Role of flood storage ability of lakes in the Changjiang River catchment. Glob. Planet. Change 2008, 63, 9–22. [Google Scholar] [CrossRef]
  4. Reid, A.J.; Carlson, A.K.; Creed, I.F.; Eliason, E.J.; Gell, P.A.; Johnson, P.T.J.; Kidd, K.A.; MacCormack, T.J.; Olden, J.D.; Ormerod, S.J.; et al. Emerging threats and persistent conservation challenges for freshwater biodiversity. Biol. Rev. 2019, 94, 849–873. [Google Scholar] [CrossRef]
  5. Sun, Y.; Huang, X.; Paerhati, B.; Zhou, K. Collaborative solutions for agricultural water pollution in smallholder economies: Farmers and local governments unite. Agric. Water Manag. 2025, 313, 109499. [Google Scholar] [CrossRef]
  6. Liu, H.; Benoit, G.; Liu, T.; Liu, Y.; Guo, H. An integrated system dynamics model developed for managing lake water quality at the watershed scale. J. Environ. Manag. 2015, 155, 11–23. [Google Scholar] [CrossRef]
  7. Li, J.; Qu, B.; Jiang, E.; Hao, L.; Liu, C.; Liu, Y.; Bian, Y. Coevolution and its influencing factors of the water resources–economy–society–environment composite system in the Yellow River basin. Ecol. Indic. 2025, 172, 113304. [Google Scholar] [CrossRef]
  8. Hu, X.; Wang, H.; Fang, Q.; Chang, C.; Li, A.; Wang, H. Integrating ecosystem services trade-off, drivers and zoning into watershed water environment management in Nansihu Lake Basin, China. Ecol. Indic. 2024, 167, 112642. [Google Scholar] [CrossRef]
  9. Qin, B.Q.; Zhang, Y.L.; Deng, J.M.; Zhu, G.W.; Liu, J.G.; Hamilton, D.P.; Paerl, H.W.; Brookes, J.D.; Wu, T.F.; Peng, K.; et al. Polluted lake restoration to promote sustainability in the Yangtze River Basin, China. Natl. Sci. Rev. 2022, 9, nwab207. [Google Scholar] [CrossRef]
  10. Morales-García, M.; García-Rubio, M.A. Security vs. efficiency of the water-energy-food nexus. A study of the economies of the regions of Spain. Environ. Sustain. Indic. 2024, 24, 100543. [Google Scholar] [CrossRef]
  11. Gai, M.; Yang, Q. Synergistic study of the green efficiency and economic resilience of agriculture from a sustainable development perspective: Evidence from Northeast China. Environ. Sci. Pollut. Res. 2023, 30, 77568–77592. [Google Scholar] [CrossRef]
  12. Xu, Y.; Yang, L.; Sun, K.; Zhu, J. Synergistic security relationships and risk measurement of water resources-social economy-ecological environment in Beijing-Tianjin-Hebei region. Ecol. Indic. 2025, 175, 113512. [Google Scholar] [CrossRef]
  13. Shahbaz, M.; Nejati, M.; Du, A.M.; Jiao, Z. A recursive dynamic CGE approach to investigate environmental Kuznets curve. J. Environ. Manag. 2024, 370, 122359. [Google Scholar] [CrossRef]
  14. Qin, X.; Hu, X.; Xia, W. Investigating the dynamic decoupling relationship between regional social economy and lake water environment: The application of DPSIR-Extended Tapio decoupling model. J. Environ. Manag. 2023, 345, 118926. [Google Scholar] [CrossRef] [PubMed]
  15. Tao, M.; Zhao, Y.; Jiang, Q.; Wang, Z.; Li, B. Study on the coupled coordination of water resources consumption and economic development in Heilongjiang province under different scenarios based on SD model. Agric. Water Manag. 2025, 315, 109560. [Google Scholar] [CrossRef]
  16. Li, J.; Shen, Z.; Liu, G.; Jin, Z.; Liu, R. The effect of social economy-water resources-water environment coupling system on water consumption and pollution emission based on input-output analysis in Changchun city, China. J. Clean. Prod. 2023, 423, 138719. [Google Scholar] [CrossRef]
  17. Sterman, J.D. Learning in and about complex systems. Syst. Dyn. Rev. 1994, 10, 291–330. [Google Scholar] [CrossRef]
  18. Hao, L.; Yu, J.; Du, C.; Wang, P. A policy support framework for the balanced development of economy-society-water in the Beijing-Tianjin-Hebei urban agglomeration. J. Clean. Prod. 2022, 374, 134009. [Google Scholar] [CrossRef]
  19. Mashaly, A.F.; Fernald, A.G.; Geli, H.M.E.; Salim Bawazir, A.; Steiner, R.L. Dynamic simulation modeling for sustainable water management with climate change in a semi-arid environment. J. Hydrol. 2024, 644, 132126. [Google Scholar] [CrossRef]
  20. Wang, Z.; Fu, X. Scheme simulation and predictive analysis of water environment carrying capacity in Shanxi Province based on system dynamics and DPSIR model. Ecol. Indic. 2023, 154, 110862. [Google Scholar] [CrossRef]
  21. Chu, H.; Venevsky, S.; Wu, C.; Wang, M. NDVI-based vegetation dynamics and its response to climate changes at Amur-Heilongjiang River Basin from 1982 to 2015. Sci. Total Environ. 2019, 650, 2051–2062. [Google Scholar] [CrossRef]
  22. Wu, Y.; Chen, D.; Liu, Y.; Li, F.; Wang, P.; Wang, R.; Shamov, V.V.; Zhu, A.-X.; Deng, C. Water Quality Changes in the Xingkai (Khanka) Lake, Northeast China, Driven by Climate Change and Human Activities: Insights from Published Data (1990–2020). Water 2024, 16, 3080. [Google Scholar] [CrossRef]
  23. Zheng, K.; Xiang, X. Water Quality Evaluation Model of Xiaoxingkai Lake Based on AHM-CRITIC Weighting. Water Sav. Irrig. 2020, 79–83, (In Chinese with English abstract). [Google Scholar]
  24. Yuan, Y.; Jiang, M.; Liu, X.; Yu, H.; Otte, M.L.; Ma, C.; Her, Y.G. Environmental variables influencing phytoplankton communities in hydrologically connected aquatic habitats in the Lake Xingkai basin. Ecol. Indic. 2018, 91, 1–12. [Google Scholar] [CrossRef]
  25. Yu, S.L.; Li, X.Y.; Wen, B.L.; Chen, G.S.; Hartleyc, A.; Jiang, M.; Li, X.J. Characterization of Water Quality in Xiao Xingkai Lake: Implications for Trophic Status and Management. Chin. Geogr. Sci. 2021, 31, 558–570. [Google Scholar] [CrossRef]
  26. Song, K.S.; Wang, Z.M.; Li, L.; Tedesco, L.; Li, F.; Jin, C.; Du, J. Wetlands shrinkage, fragmentation and their links to agriculture in the Muleng-Xingkai Plain, China. J. Environ. Manag. 2012, 111, 120–132. [Google Scholar] [CrossRef]
  27. Xiao, F.; Wang, X.; Fu, C. Impacts of land use/land cover and climate change on hydrological cycle in the Xiaoxingkai Lake Basin. J. Hydrol. Reg. Stud. 2023, 47, 101422. [Google Scholar] [CrossRef]
  28. Yang, J.; Huang, X. The 30 m annual land cover dataset and its dynamics in China from 1990 to 2019. Earth Syst. Sci. Data 2021, 13, 3907–3925. [Google Scholar] [CrossRef]
  29. China Statistical. Jixi Statistical Yearbook (2009–2021); China Statistics Press: Beijing, China, 2021. [Google Scholar]
  30. China Statistical. Mudanjiang Statistical Yearbook (2009–2021); China Statistics Press: Mudanjiang, China, 2009. [Google Scholar]
  31. Heilongjiang Provincial Department of Ecology and Environment. Report on the State of the Ecology and Environment in Heilongjiang Province. 2023. Available online: http://sthj.hlj.gov.cn/sthj/c116217/202506/c00_31846931.shtml (accessed on 30 July 2025).
  32. Ahmadi, M.H.; Zarghami, M. Should water supply for megacities depend on outside resources? A Monte-Carlo system dynamics simulation for Shiraz, Iran. Sustain. Cities Soc. 2019, 44, 163–170. [Google Scholar] [CrossRef]
  33. Wang, G.; Xiao, C.L.; Qi, Z.W.; Meng, F.A.; Liang, X.J. Development tendency analysis for the water resource carrying capacity based on system dynamics model and the improved fuzzy comprehensive evaluation method in the Changchun city, China. Ecol. Indic. 2021, 122, 107232. [Google Scholar] [CrossRef]
  34. Li, L.; Zhou, Y.; Li, M.; Cao, K.; Tao, Y.; Liu, Y. Integrated modelling for cropping pattern optimization and planning considering the synergy of water resources-society-economy-ecology-environment system. Agric. Water Manag. 2022, 271, 107808. [Google Scholar] [CrossRef]
  35. Ji Xi Municipal People’s Government. Jixi City’s 14th Five-Year Plan for Environmental Protection. Available online: https://www.jixi.gov.cn/jixi/c100108/202206/c06_2574.shtml (accessed on 2 July 2025).
  36. People’s Government of Helongjiang Province. Approval by the People’s Government of Heilongjiang Province on the “Master Plan for the Territorial Space of Jixi City (2021–2035)”. Available online: https://www.hlj.gov.cn/hlj/c108379/202405/c00_31736517.shtml (accessed on 2 July 2025).
  37. Mudanjiang Municipal People’s Government. Mudanjiang City’s 14th Five-Year Plan for Environmental Protection. Available online: https://www.mdj.gov.cn/mdjsrmzf/c100019/202210/c03_64679.shtml (accessed on 2 July 2025).
  38. People’s Government of Helongjiang Province. Approval by the People’s Government of Heilongjiang Province on the Overall Land Use Plan for Suifenhe City and Five Other Counties (Cities) (2021–2035). Available online: https://www.muling.gov.cn/mdjmlsrmzf/c103570/202406/c03_956516.shtml (accessed on 2 July 2025).
  39. Li, N.; Han, W.; Shen, M.; Yu, S. Load evaluation of non-point source pollutants from reservoir based on export coefficient modeling. Trans. Chin. Soc. Agric. Eng. 2016, 32, 224–230. [Google Scholar]
  40. Shah, S.; Sen, S.; Sahoo, D. State of Indian Northwestern Himalayan lakes under human and climate impacts: A review. Ecol. Indic. 2024, 160, 111858. [Google Scholar] [CrossRef]
  41. Ran, X.; Deng, Y.; Uppuluri, N.S.T.; Li, B.; Zheng, Y.; Chen, P.; Dong, R.; Müller, J.; Guo, J.; Oechsner, H. Hotspots and future trends of phosphorus recycling from livestock manure: A bibliometric review. Sci. Total Environ. 2023, 892, 164346. [Google Scholar] [CrossRef]
  42. Sampat, A.M.; Hicks, A.; Ruiz-Mercado, G.J.; Zavala, V.M. Valuing economic impact reductions of nutrient pollution from livestock waste. Resour. Conserv. Recycl. 2021, 164, 105199. [Google Scholar] [CrossRef]
  43. Küçükbayrak, M.; Alver, A. Innovative and cost-effective approaches to enhance nutrient removal and energy efficiency in conventional wastewater treatment plants. J. Environ. Manag. 2025, 382, 125350. [Google Scholar] [CrossRef]
  44. Fallahi, A.; Taheriyoun, M.; Asghari, K. Water footprint assessment in an industrial symbiosis system based on environmental, economic, and social sustainability indices. J. Clean. Prod. 2024, 454, 142227. [Google Scholar] [CrossRef]
  45. Yang, M.; Yu, J.; Li, Z.; Guo, Z.; Burch, M.; Lin, T.-F. Taihu Lake Not to Blame for Wuxi’s Woes. Science 2008, 319, 158. [Google Scholar] [CrossRef]
  46. Cheng, Q.; Lin, A.-P.; Yang, M. Green innovation and firms’ financial and environmental performance: The roles of pollution prevention versus control. J. Account. Econ. 2025, 79, 101706. [Google Scholar] [CrossRef]
  47. Nie, S.; Zeng, G.; Zhang, H.; Ji, J. The local government fiscal pressure’s effect on green total factor productivity: Exploring mechanisms from the perspective of government behavior. Int. Rev. Econ. Financ. 2024, 96, 103702. [Google Scholar] [CrossRef]
  48. Li, L.; McMurray, A.; Li, X.; Gao, Y.; Xue, J. The diminishing marginal effect of R&D input and carbon emission mitigation. J. Clean. Prod. 2021, 282, 124423. [Google Scholar] [CrossRef]
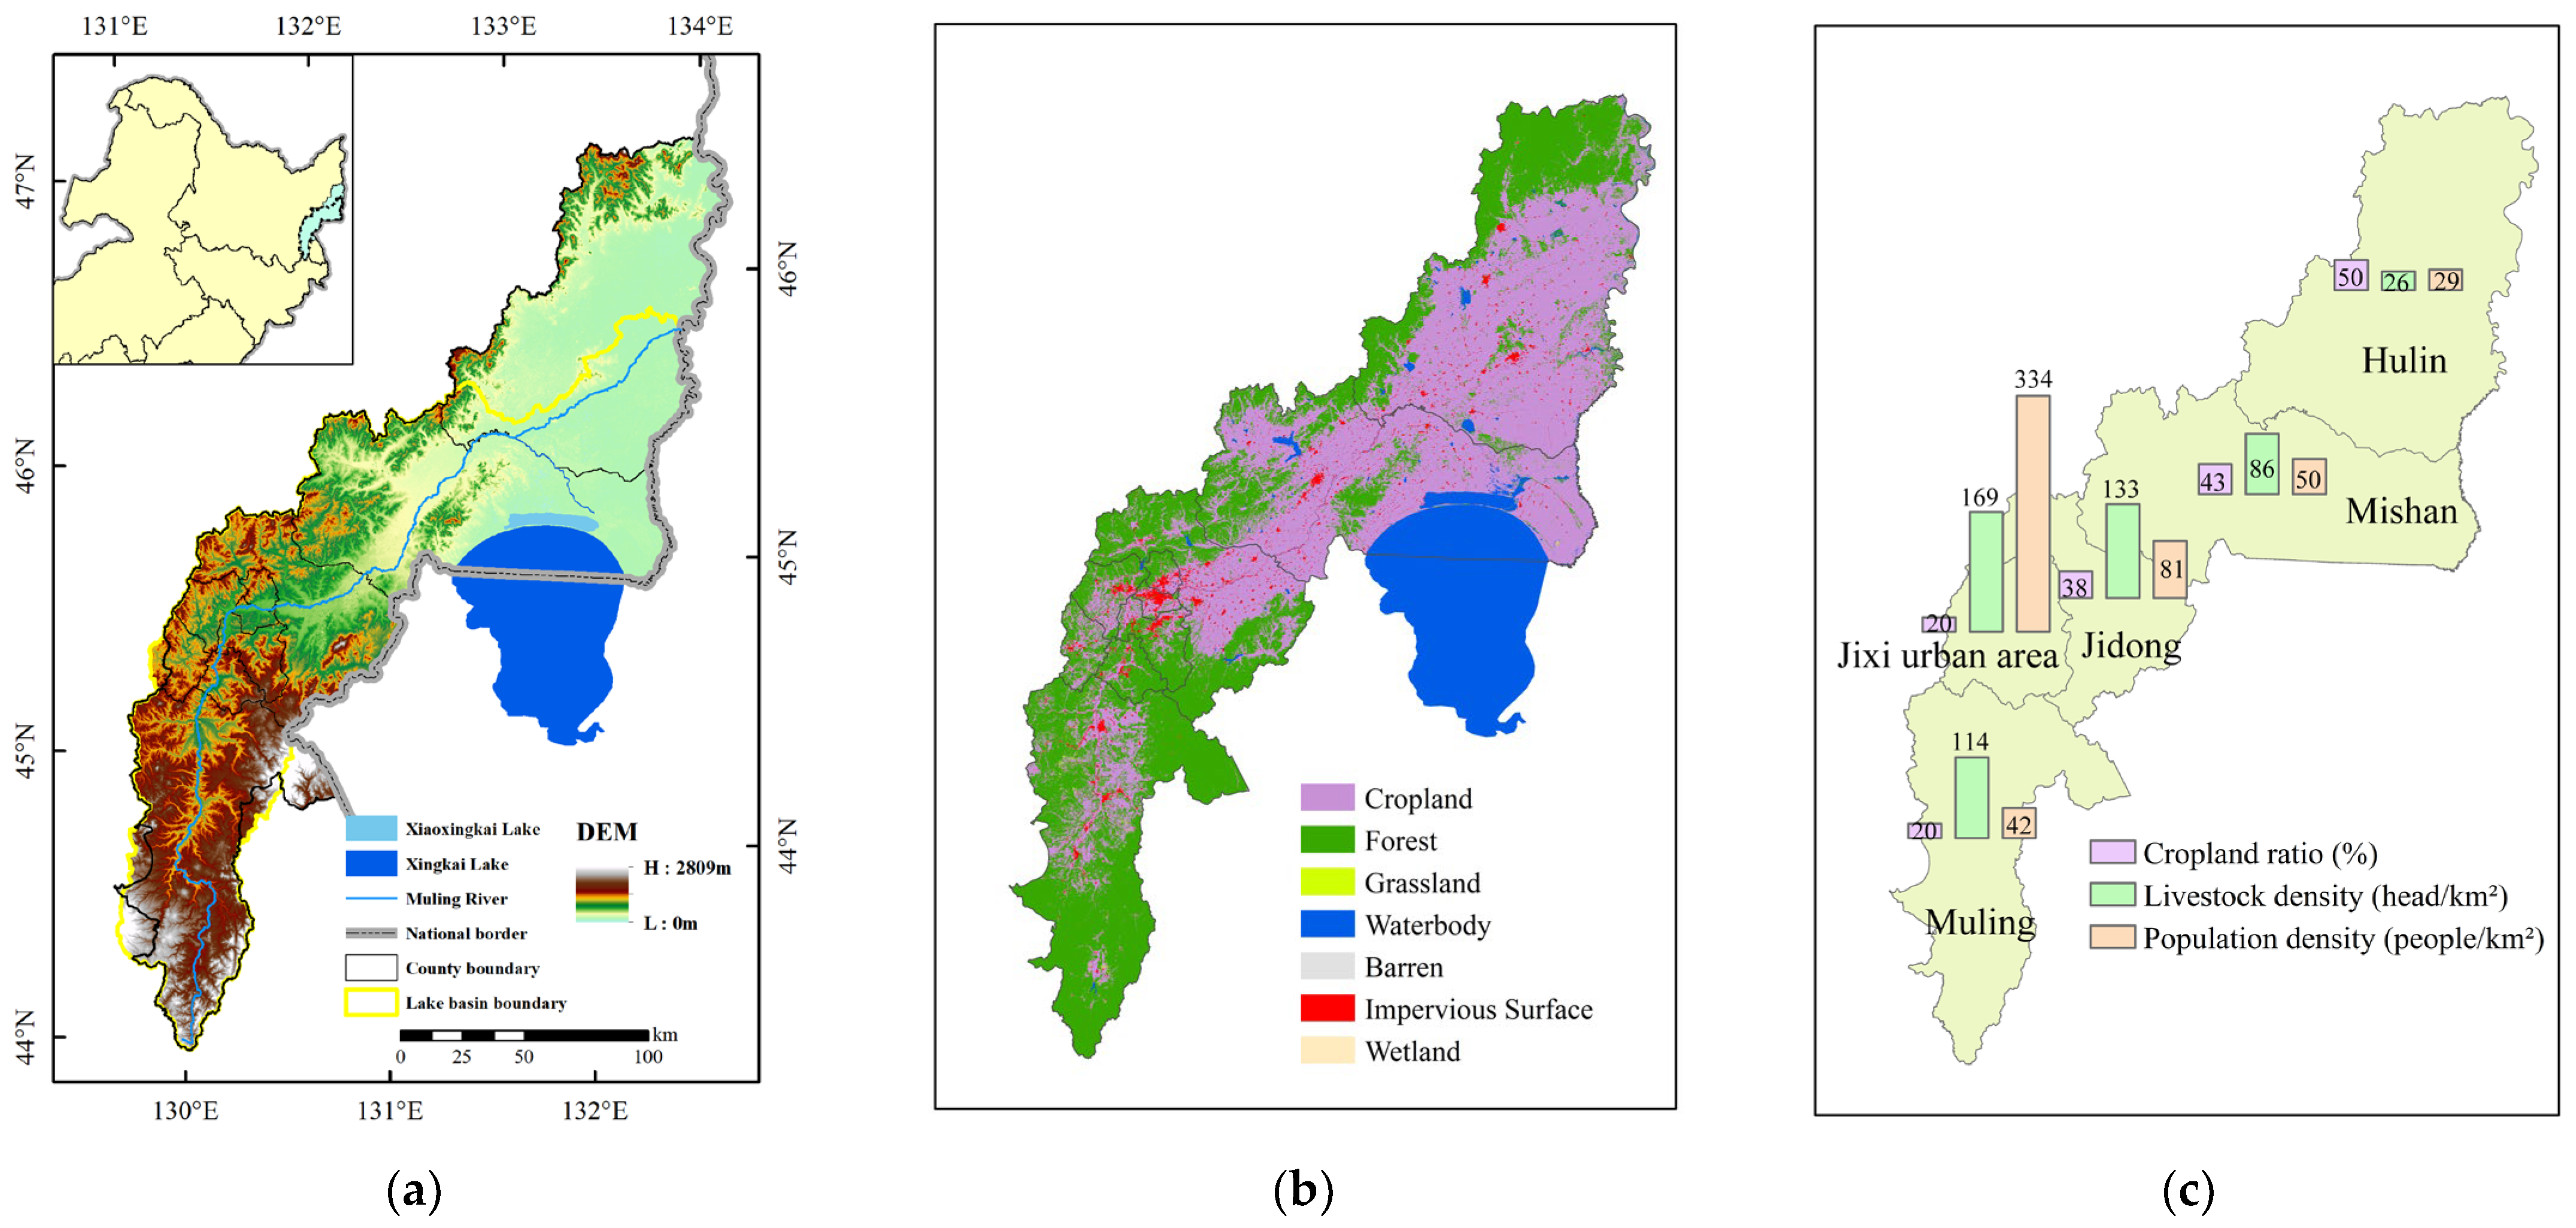
Figure 1. Overview of the research area: (a) Geographical location of the study area; (b) land use and land cover in the Xiaoxingkai Lake basin (Data from: [28]); and (c) spatial distribution of population density, cropland ratio, and livestock density in the Xiaoxingkai Lake basin.
Sustainability 17 07167 g001
Figure 2. Causal loop diagram of the water pollution load system (note: + indicates a positive feedback loop between variables, while − indicates a negative feedback loop between variables).
Sustainability 17 07167 g002
Figure 3. Stock and flow diagram of the water pollution load system.
Sustainability 17 07167 g003
Figure 4. Comparison of statistical values and simulation values for total population, rural population, urban population, and cultivated land area in the Xiaoxingkai Lake basin.
Sustainability 17 07167 g004
Figure 5. Contribution of different pollution sources for the year 2020: (a) Load of different types of pollution sources and (b) contribution rates of different types of pollution sources.
Sustainability 17 07167 g005
Figure 6. Simulation results of pollutant discharge into rivers under five different scenarios for the 2020–2030 period.
Sustainability 17 07167 g006
Table 1. Main model parameters and equation settings.
SubsystemVariablesVariable UnitsEquations and Values
Population subsystemTotal populationLevel×104 personsINTEG (Number of births − Number of deaths − Out-migrant Population + In-migrant population, 218)
Number of birthsAuxiliaryTotal population × Birth rate
Number of deathsTotal population × Mortality rate
Birth rateRateTable (time)
Out-migrant populationAuxiliary×104 persons
Urban populationTotal population × Urbanization rate
Urbanization rateRate%Table (time)
Water contamination subsystemUrban domestic sewage generationAuxiliarytUrban population × Pollution reduction coefficient × Per capita water consumption of urban residents × 365/1000
Urban domestic TN generationTN generation coefficient of urban residents × Urban domestic sewage discharge volume/100
Rural domestic TN generationRural population × TN generation coefficient of rural residents × 365/1000
Urban domestic TN outputUrban domestic TN generation × (1 − TN removal rate × Urban domestic sewage centralized treatment rate)
Rural domestic TN outputRural domestic TN generation × (1 − TN comprehensive removal rate × rural domestic wastewater treatment rate)
Urban domestic TN load to riverUrban domestic TN output × Pollutant discharge coefficient of urban residents
Rural domestic TN load to riverRural domestic TN output × Pollutant discharge coefficient of rural residents
Agricultural subsystemCultivated land areaLevel×104 haINTEG (change in cultivated land area, 59.63)
Change in cultivated land areaAuxiliaryCultivated land area × change in cultivated land area rate
Cultivated land area change rateRate%Table (time)
Livestock stockLevel×104 heads INTEG (change in livestock farming volume, 330.80)
Change in livestock farmingAuxiliaryLivestock stock × Livestock stock change rate
Livestock stock change rateRate%Table (time)
Water contamination subsystemTN output from livestock rearingAuxiliarytLivestock stock × TN output coefficient of livestock stock
Livestock rearing TN load to riverTN output from livestock rearing × Pollutant discharge coefficient of livestock rearing
Total TN load to riverAgricultural TN load to river + Rural domestic TN load to river + Urban domestic TN load to river
Agricultural TN load to riverCultivated land TN load to river + Livestock rearing TN load to river
Table 2. Scenario design parameters.
ParametersUnitsS0S1S2S3S4
Urbanization rate%63.976863.976866
Birth rate3.464.53.464.53.8
In-migrant population×104 persons05052.5
Out-migrant population1.20.21.20.20.5
Urban domestic TN removal rate%7575777776
Urban domestic TP removal rate8484878786
Urban domestic COD removal rate8484878786
Urban domestic NH3-N removal rate8383858584
Rural domestic TN comprehensive removal rate4646484847
Rural domestic TP comprehensive removal rate4646484847
Rural domestic COD comprehensive removal rate6161646463
Rural domestic NH3-N comprehensive removal rate5050535352
Livestock farming TN output coefficientkg/piece·a0.60.60.560.560.58
Livestock farming TP output coefficient0.140.140.130.130.14
Livestock farming COD output coefficient2.662.662.52.52.58
Livestock farming NH3-N output coefficient0.210.210.20.20.2
Arable land TN output coefficientkg/(hm2·a)26.1927.7624.8826.4525.93
Arable land TP output coefficient0.991.050.9410.98
Arable land COD output coefficient18.9920.1318.0419.1818.8
Arable land NH3-N output coefficient4.334.594.114.374.29
Rural domestic sewage treatment rate%12.512.5505045
Urban domestic sewage centralized treatment rate6262727270
Livestock farming change rate0.040.150.040.150.095
Per capita water consumption of urban residentsL/person·day115150115150130
Disclaimer/Publisher’s Note: The statements, opinions and data contained in all publications are solely those of the individual author(s) and contributor(s) and not of MDPI and/or the editor(s). MDPI and/or the editor(s) disclaim responsibility for any injury to people or property resulting from any ideas, methods, instructions or products referred to in the content.