Article

Research on the Main Influencing Factors and Variation Patterns of Basal Area Increment (BAI) of Pinus massoniana

1
College of Tourism, Xinyang Normal University, Xinyang 464000, China
2
Henan Dabieshan National Field Observation and Research Station of Forest Ecosystem, Zhengzhou 450046, China
3
Xinyang Academy of Ecological Research, Xinyang 464000, China
4
College of Computer and Information Technology, Xinyang Normal University, Xinyang 464000, China
5
Research Institute of Forest Resource Information Techniques, Chinese Academy of Forestry, Beijing 100091, China
6
College of Forestry, Henan Agricultural University, Zhengzhou 450046, China
7
Affairs Center, Henan Jigongshan National Nature Reserve, Xinyang 464000, China
*
Authors to whom correspondence should be addressed.
Sustainability 2025, 17(15), 7137; https://doi.org/10.3390/su17157137
Submission received: 9 July 2025 / Revised: 27 July 2025 / Accepted: 4 August 2025 / Published: 6 August 2025

Abstract

Understanding the environmental drivers of radial growth in the Pinus massoniana (lamb.) is essential for improving forest productivity and carbon sequestration in subtropical ecosystems. This study used the basal area increment (BAI) as an indicator of radial growth to investigate the main factors affecting the radial growth rate of P. massoniana and the changes in BAI with these factors. A total of 58 high quality tree ring series were analyzed. Six common methods were used to comprehensively analyze the importance of nine factor variables on the BAI, including tree age, competition index, average temperature, and so on. Generalized additive models (GAMs) were developed to explore the nonlinear relationships between each selected variable and the BAI. The results revealed the following: (1) Age and Competition Index was identified as the primary driving force; (2) BAI increased with Age when tree age was below 69 years; (3) from the overall trend, the BAI of P. massoniana decreased with the increase in the Competition Index. These findings provide a scientific basis for developing management plans for P. massoniana forests.

1. Introduction

Forest ecosystems constitute a vital component of terrestrial carbon sinks and are central to climate regulation and water resource conservation [1]. These ecological functions are closely associated with the sustainable development of human society. Under normal conditions, forests with a higher standing volume tend to exhibit greater growth capacity. Enhanced forest growth not only reflects robust ecosystem functioning but also strengthens the forest’s ability to sequester carbon and regulate hydrological processes. Therefore, maintaining both forest volume and growth capacity is critical for improving carbon sink efficiency and sustaining ecosystem services.
The radial growth of trees, reflected in annual ring width, represents a physiological response to environmental variability. Studying variations in tree ring width provides insight into long-term growth patterns and historical climate conditions, while also enabling predictions of how future climatic changes may influence forest productivity [2]. Given these advantages, dendrochronology has become a key approach for understanding how forest ecosystems adapt to climate change [3].
Under the background of global warming, tree rings have become an important proxy in climate research due to their broad spatial distribution, ease of sampling, accurate dating, and high temporal resolution. They are widely used to assess the influence of climate on tree growth and to reconstruct past climate changes on a temporal scale [4,5,6]. Recent studies have combined the tree ring width series with climate data to examine the relationships between radial growth and climate variables in a systematic way [7,8,9]. Tree species often show distinct sensitivities to the climate. For example, Picea yunnanensis (Franch.), Larix speciosa (Cheng et Law.), and oak species differ in their responses to temperature and precipitation, reflecting species-specific adaptation strategies [10,11]. In southern China, Huang et al. found that temperature had a stronger effect than precipitation or humidity on the radial growth of Cunninghamia lanceolata (Linn.) [12]. In the northern Greater Khingan Range, Qiu et al. reported that Larix gmelinii (Rupr.) growth was mainly limited by temperature, while Pinus sylvestris var. mongolica (Litv.) was influenced by both temperature and precipitation [13]. Ma et al. showed that the growth of Larix principis-rupprechtii (Mayr.) from mid-May to early August was jointly driven by temperature and soil moisture [14].
Beyond climatic influences, tree growth is also regulated by intrinsic physiological traits and non-climatic environmental factors [15,16,17]. It is generally recognized that increasing tree age leads to a gradual decline in ring width, a pattern reflecting the combined effects of changing growth rates and resource allocation strategies [18]. In addition, topographic variables such as elevation [16,19] and slope [20,21], along with soil properties [22,23] and stand competition, play significant roles in shaping radial growth. Luo et al. reported that in the L. gmelinii forests of northern Greater Khingan, tree growth at lower elevations was primarily driven by precipitation, whereas at higher elevations, it was more strongly controlled by temperature [24]. Similarly, Wang et al. found that in the Minshan Mountains on the eastern edge of the Tibetan Plateau, the influence of climate variables on Abies fargesii (Rehd.) increased along an elevational gradient. Trees at low elevations responded mainly to the average maximum temperature in April of the current year, those at mid-elevations were sensitive to October temperatures of the previous year, and those at high elevations were most strongly affected by precipitation in June [25]. These findings suggest that elevational differences significantly modulate the response of radial growth to climatic drivers, highlighting the spatial heterogeneity of growth mechanisms across environmental gradients. Furthermore, stand competition can indirectly constrain growth by limiting resource availability and, under certain conditions, may either amplify or attenuate the effects of climatic factors, resulting in complex interactive controls [26,27].
Although many studies have identified environmental drivers of tree growth, two notable gaps remain: first, in assessing radial growth, traditional studies have commonly used ring width as a proxy for tree growth. However, ring width does not adequately account for differences in tree size and may fail to capture true trends in the stem volume increment. In the context of carbon sink monitoring and biomass assessment, the basal area increment (BAI) offers greater ecological relevance as a growth indicator. The BAI directly reflects changes in cross-sectional volume and is closely linked to carbon sink potential. Moreover, while ring width can be influenced by tree form and structural variability, the BAI reduces such biases and provides a more accurate representation of actual growth dynamics. Given the limitations in height measurements and the tendency of tree height to plateau with age, the BAI also offers greater stability and reliability as a long-term growth metric. Accordingly, this study adopts the BAI in place of ring width as the primary indicator of Pinus massoniana growth; second, although substantial progress has been made in elucidating the relationships between climatic factors and tree growth, considerable variation remains across regions and species [28,29], and the underlying drivers may involve complex nonlinear interactions. It is therefore essential to evaluate the relative importance and response patterns of environmental variables within specific regions and target species [30]. Traditional multivariate statistical methods, such as correlation analysis [31,32] and principal component analysis (PCA) [33], etc., have been widely applied in forestry for variable selection. However, their reliance on linear assumptions may obscure latent nonlinear mechanisms and neglect some important variables to growth regulation [34].
With the development of artificial intelligence, an increasing number of researchers are exploring machine learning (ML) algorithms in forestry applications [34,35,36,37]. Unlike classical regression models, ML approaches are capable of handling complex nonlinear relationships and high-dimensional data while uncovering latent structures within datasets [35]. In multifactorial contexts, integrating various feature selection algorithms can effectively identify key variables that significantly influence radial growth, laying the foundation for more accurate modeling.
This study used a more ecologically significant indicator, BAI, to investigate the radial growth pattern of P. massoniana in Jigong Mountain Nature Reserve and the main factors affecting BAI. Firstly, a set of candidate variables that affect the radial growth rate of trees were selected based on prior ecological knowledge and data availability, including tree age, Competition Index, elevation, soil thickness, slope, as well as temperature (maximum, minimum, and mean) and precipitation. Then, six universal variable importance assessment methods, including multivariate statistics algorithms and ML algorithms, were used to evaluate the importance of each variable to the BAI. Key variables were identified based on their importance. Finally, generalized additive models (GAMs) were used to construct the nonlinear response relationships between each selected variable and the BAI. This integrative approach allows us to (1) overcome limitations of conventional proxies and selection techniques; (2) improve our understanding of growth determinants for P. massoniana in a subtropical montane context; and (3) provide a scientific basis for precision silviculture and adaptive management strategies under climate change.
However, the methodology has potential limitations. The use of multiple feature selection algorithms introduces risks of multicollinearity, and the application of GAMs, while effective in capturing nonlinear relationships, may be sensitive to outliers and edge effects. Furthermore, the limited geographic replication within the sampling design may constrain the generalizability of the conclusions across broader subtropical forest ecosystems.

2. Materials and Methods

2.1. Study Area

The Jigong Mountain Nature Reserve (114°01′ E–114°06′ E, 31°46′ N–31°52′ N) is located at the border between the southern Henan and northern Hubei provinces. This area is recognized as a typical climatic boundary zone in China and a region highly sensitive to climate change. Influenced by the East Asian monsoon, the local climate is classified as a marginal northern subtropical monsoon mountain climate, characterized by four distinct seasons and a strong synchrony between rainfall and temperature. Spring features large temperature fluctuations, summer is hot and rainy, autumn is mild and dry, and winter is cold with little snowfall. The mean annual temperature is 15.2 °C, with recorded extremes ranging from a maximum of 40.9 °C to a minimum of −20.0 °C. Annual Precipitation averages 1346.9 mm, with most rainfall occurring in late spring and summer [38]. The dominant soil types are yellow–brown soil and mountain brown soil, both of which are conducive to plant growth. Vegetation is diverse and represents a transitional zone from northern subtropical evergreen broad-leaved forests to warm temperate deciduous broad-leaved forests. Common tree species in the reserve include Quercus acutissima (Carruth.), Quercus variabilis (Blume.), Quercus serrata var. brevipetiolata (A. DC.), Pistacia chinensis (Bunge.), P. massoniana, Pinus tabuliformis (Carr.), and Cunninghamia lanceolata. In 2022, eight permanent P. massoniana plots (20 m × 20 m each) were established in the study area, as shown in Figure 1. The map was created by the authors based on field survey data, and the basemap was derived from the publicly available satellite imagery service provided by ESRI (https://services.arcgisonline.com/arcgis/rest/services/World_Imagery/MapServer, accessed on 3 August 2025).

2.2. Data Collection

2.2.1. Plot Information and Increment Core Collection

Field sampling was conducted in October 2023 in 8 permanent plots (20 m × 20 m) of P. massoniana established in the Jigong Mountain Nature Reserve. The elevation, slope, and soil thickness of each plot were measured and recorded. Each plot was subdivided into four 10 m × 10 m quadrats. The relative coordinates, tree height, crown width, diameter at breast height (DBH), and other factors of each tree in the sample plot were measured. In each quadrat, one dominant, one intermediate, and one suppressed tree were selected based on crown position and competitive status. Owing to the insufficient number of P. massoniana individuals, with fewer than three trees present in three quadrats, no samples were collected from these quadrats. Ultimately, 87 individual trees were selected in 29 quadrats for increment coring. Increment cores were extracted from each tree at breast height (1.3 m) using a 5 mm increment borer. All increment cores were placed in labeled plastic tubes and transported to the laboratory for further processing.
Of the 87 increment cores, 27 were discarded due to failure to reach the pith. The remaining 60 cores were fixed, labeled, air-dried, and polished until the tree ring boundaries were clearly visible. Ring widths were measured using WINDENDRO (2005a) software, followed by preliminary cross-dating. The accuracy of the cross-dating was then verified using the COFECHA program [39]. Cores with low correlation to the master chronology were excluded, yielding 58 high quality samples for further analysis.
Tree ring widths were converted into the BAI using the following formula [26]:
B A I = π R a 2 R a 1 2 ,
where R a and R a 1 represent the tree radius at the current and previous year, respectively.
The statistics of tree age and plot information are shown in Table 1.

2.2.2. Competition Index

The Hegyi competition index was calculated using the ForestStatTool [40] package in R (version 4.4.3). For each subject tree, the index was computed based on its three nearest neighboring trees within a 10 m × 10 m rectangular plot, using a fixed-number method (k = 3). To correct for edge effects, a buffer zone method was applied, excluding subject trees located within 4.9 m of the plot boundaries. The spatial coordinates of all trees were preprocessed using the Coord_Move function to normalize their positions within each plot. This implementation follows the standard form of the Hegyi index [41], which is defined in Equation (2):
C I i = j = 1 n d j d i L i j ,
where C I i is the Competition Index for subject tree i; d i and d j are the DBH (cm) of the subject tree i and competitor tree j, respectively; n is the number of competitor trees within the competition unit; and L i j is the distance (m) between the subject tree i and competitor tree j.

2.2.3. Climate Data

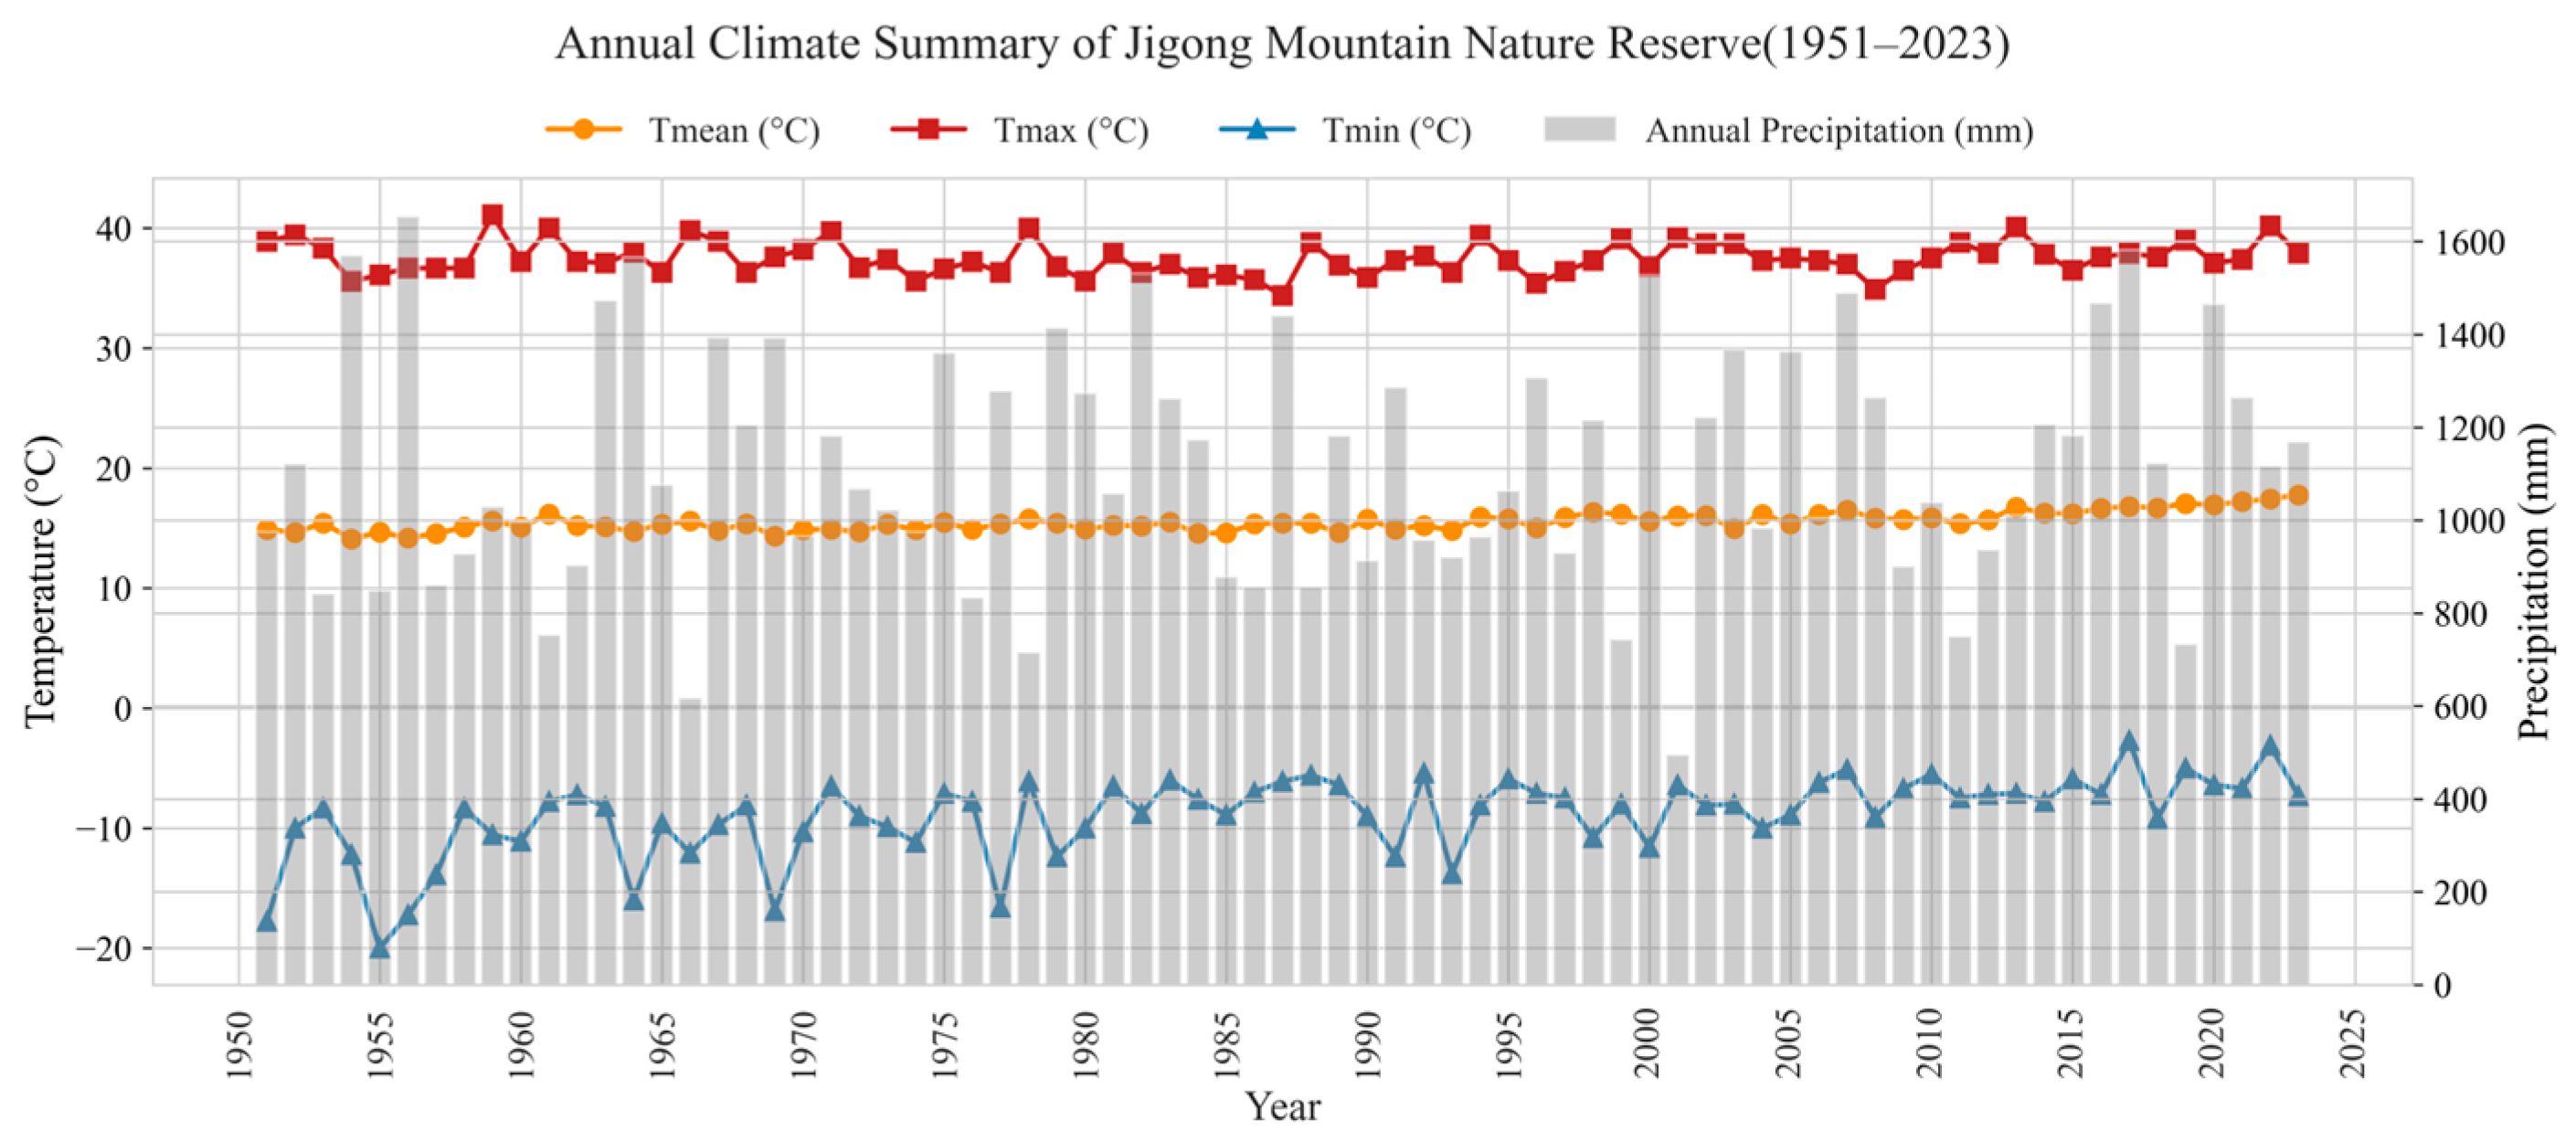
Climate data used in this study were obtained from the Xinyang meteorological station (114°03′ E, 32°06′ N; elevation 114.5 m), which is the closest station with long-term continuous observations. To align with the age of the oldest tree ring samples, annual climate records from 1951 to 2023 were selected for analysis. Although the elevation of the sampling plots in the Jigong Mountain ranges from approximately 203 to 240 m, no higher elevation meteorological station with comparable temporal coverage was available. Therefore, the Xinyang station data were adopted as the best available proxy for regional climate conditions. The dataset includes Annual Precipitation, annual mean temperature, annual maximum temperature, and annual minimum temperature. Climate data were sourced from the NOAA National Centers for Environmental Information (https://www.ncei.noaa.gov/maps/hourly/, accessed on 3 August 2025). The charts of various climate variables are shown in Figure 2, and the statistics information of the climatic variables are shown in Table 2.

2.3. Methods for Evaluating the Importance of Variables

2.3.1. Principal Component Analysis (PCA)

In this study, the PCA was used to evaluate the importance of variables in relation to tree radial growth. Principal components with a cumulative variance contribution exceeding 85% were retained, and two methods were applied to quantify the importance of the original variables: the principal component regression judgment method (PCAr) and the sum of squared loadings method (PCAl) [42].
For the PCAr, a multiple linear regression model was constructed using the selected principal components as independent variables and the BAI as the dependent variable. The importance of each original variable was calculated by taking the weighted sum of the products of standardized regression coefficients and variable loadings, according to the following formula:
I m p o r t a n c e i = j β j s t d × L o a d i n g i j
where I m p o r t a n c e i is the importance of the i-th original variable; β j s t d is the standardized regression coefficient of the j-th principal component; and L o a d i n g i j is the loading of the i-th variable on the j-th principal component.
For the PCAl, the importance of each variable was determined by calculating the sum of the squared loadings across all retained principal components, with the relative magnitude used as an indicator of importance.
While both PCAr and PCAl aim to assess the importance of original variables, they differ in their conceptual focus. PCAr evaluates variable importance indirectly through the influence of principal components on the BAI, thereby incorporating the response variable into the importance calculation. In contrast, the PCAl derives importance solely from the data structure of the predictor variables, without reference to the BAI. This dual approach allows both supervised (PCAr) and unsupervised (PCAl) perspectives to be considered, enhancing the robustness of the variable selection process.

2.3.2. Redundancy Analysis (RDA)

RDA is a ranking method combining regression analysis and principal component analysis [43], capable of revealing linear relationships between independent and dependent variables. In this study, RDA was implemented using a first-order canonical correlation analysis (CCA) model, with the BAI as the univariate response. As a result, only one canonical axis (RDA1) was available for interpretation. This axis explained 26.8% of the total variance in the BAI, representing the primary gradient of variation attributable to environmental variables. Given its uniqueness and explanatory strength, RDA1 was selected as the basis for assessing variable importance. All variables were standardized prior to analysis. Canonical axes were fitted using the sklearn.cross_decomposition.CCA module in Python (version 3.11.13). The absolute value of each variable’s loading on the first canonical axis, including ecological (e.g., elevation, soil thickness), climatic (e.g., temperature, precipitation), and dendrometric factors (e.g., Age, Competition Index), was extracted to represent its contribution to variations in the BAI. These loading values were then normalized to facilitate the comparison of the relative importance among all factors.

2.3.3. Random Forest (RF)

In the RF analysis, variable importance was assessed using a permutation-based approach on out-of-bag (OOB) data. A random forest model comprising 500 decision trees was constructed using the Mean Squared Error (MSE) as the impurity criterion and a fixed random state of 42 to ensure reproducibility. The procedure included (1) computing the baseline prediction error on OOB samples; (2) permuting each predictor variable independently and recalculating the OOB error; and (3) computing the mean increase in prediction error over 30 permutation repetitions as the importance score for each variable.
The resulting scores were normalized to percentage values for comparison. This procedure was implemented using the permutation_importance function from the sklearn.inspection module in Python.

2.3.4. Boosted Regression Tree (BRT)

The BRT constructs a sequence of regression trees iteratively, calculating the importance of each variable based on the average reduction in MSE resulting from splits involving that variable [44]. In this study, we set the number of trees to 500, the maximum depth to the default value of 3, and the learning rate to 0.05. The final importance scores were normalized to percentages to facilitate direct comparison across variables. The BRT implementation was conducted using the sklearn.ensemble.GradientBoostingRegressor module in Python.

2.3.5. Extreme Gradient Boosting (XGBoost)

XGBoost, an efficient ensemble learning method, was used to effectively capture nonlinear relationships and interactions among variables [45]. In this study, the model was implemented using the xgboost.XGBRegressor module in Python, with all hyperparameters set to default values to ensure comparability across methods. Variable importance was assessed using the gain metric, which reflects the contribution of each feature to the model’s predictive performance. The resulting importance scores were normalized.

2.4. Generalized Additive Model (GAM)

GAM represents a non-parametric extension of traditional Generalized Linear Models, offering a composite framework for simultaneously addressing both linear and nonlinear relationships. Notably, the GAM can partition independent variables into multiple continuous intervals, allowing each interval to be fitted with independent linear or nonlinear functions. This capability proves particularly effective in modeling complex, nonlinear relationships between independent and dependent variables [46]. The general form of a GAM can be expressed as:
g y = β 0 + f 1 x 1 + f 2 x 2 +     + f n x n ,
where y represents the dependent variable; g is the link function; β 0 is the intercept; x 1 , , x n are the independent variables; and f 1 , , f n are smooth functions connecting the independent variables to the dependent variable.
In this study, GAMs were implemented using the mgcv package (version 1.9-1) in R (version 4.4.3). Smooth terms employed penalized regression splines, specifically thin plate regression splines (tp) and cubic regression splines (cr), with smoothing parameters estimated via the restricted maximum likelihood (REML).

3. Results

3.1. Results of the Importance of Different Variables

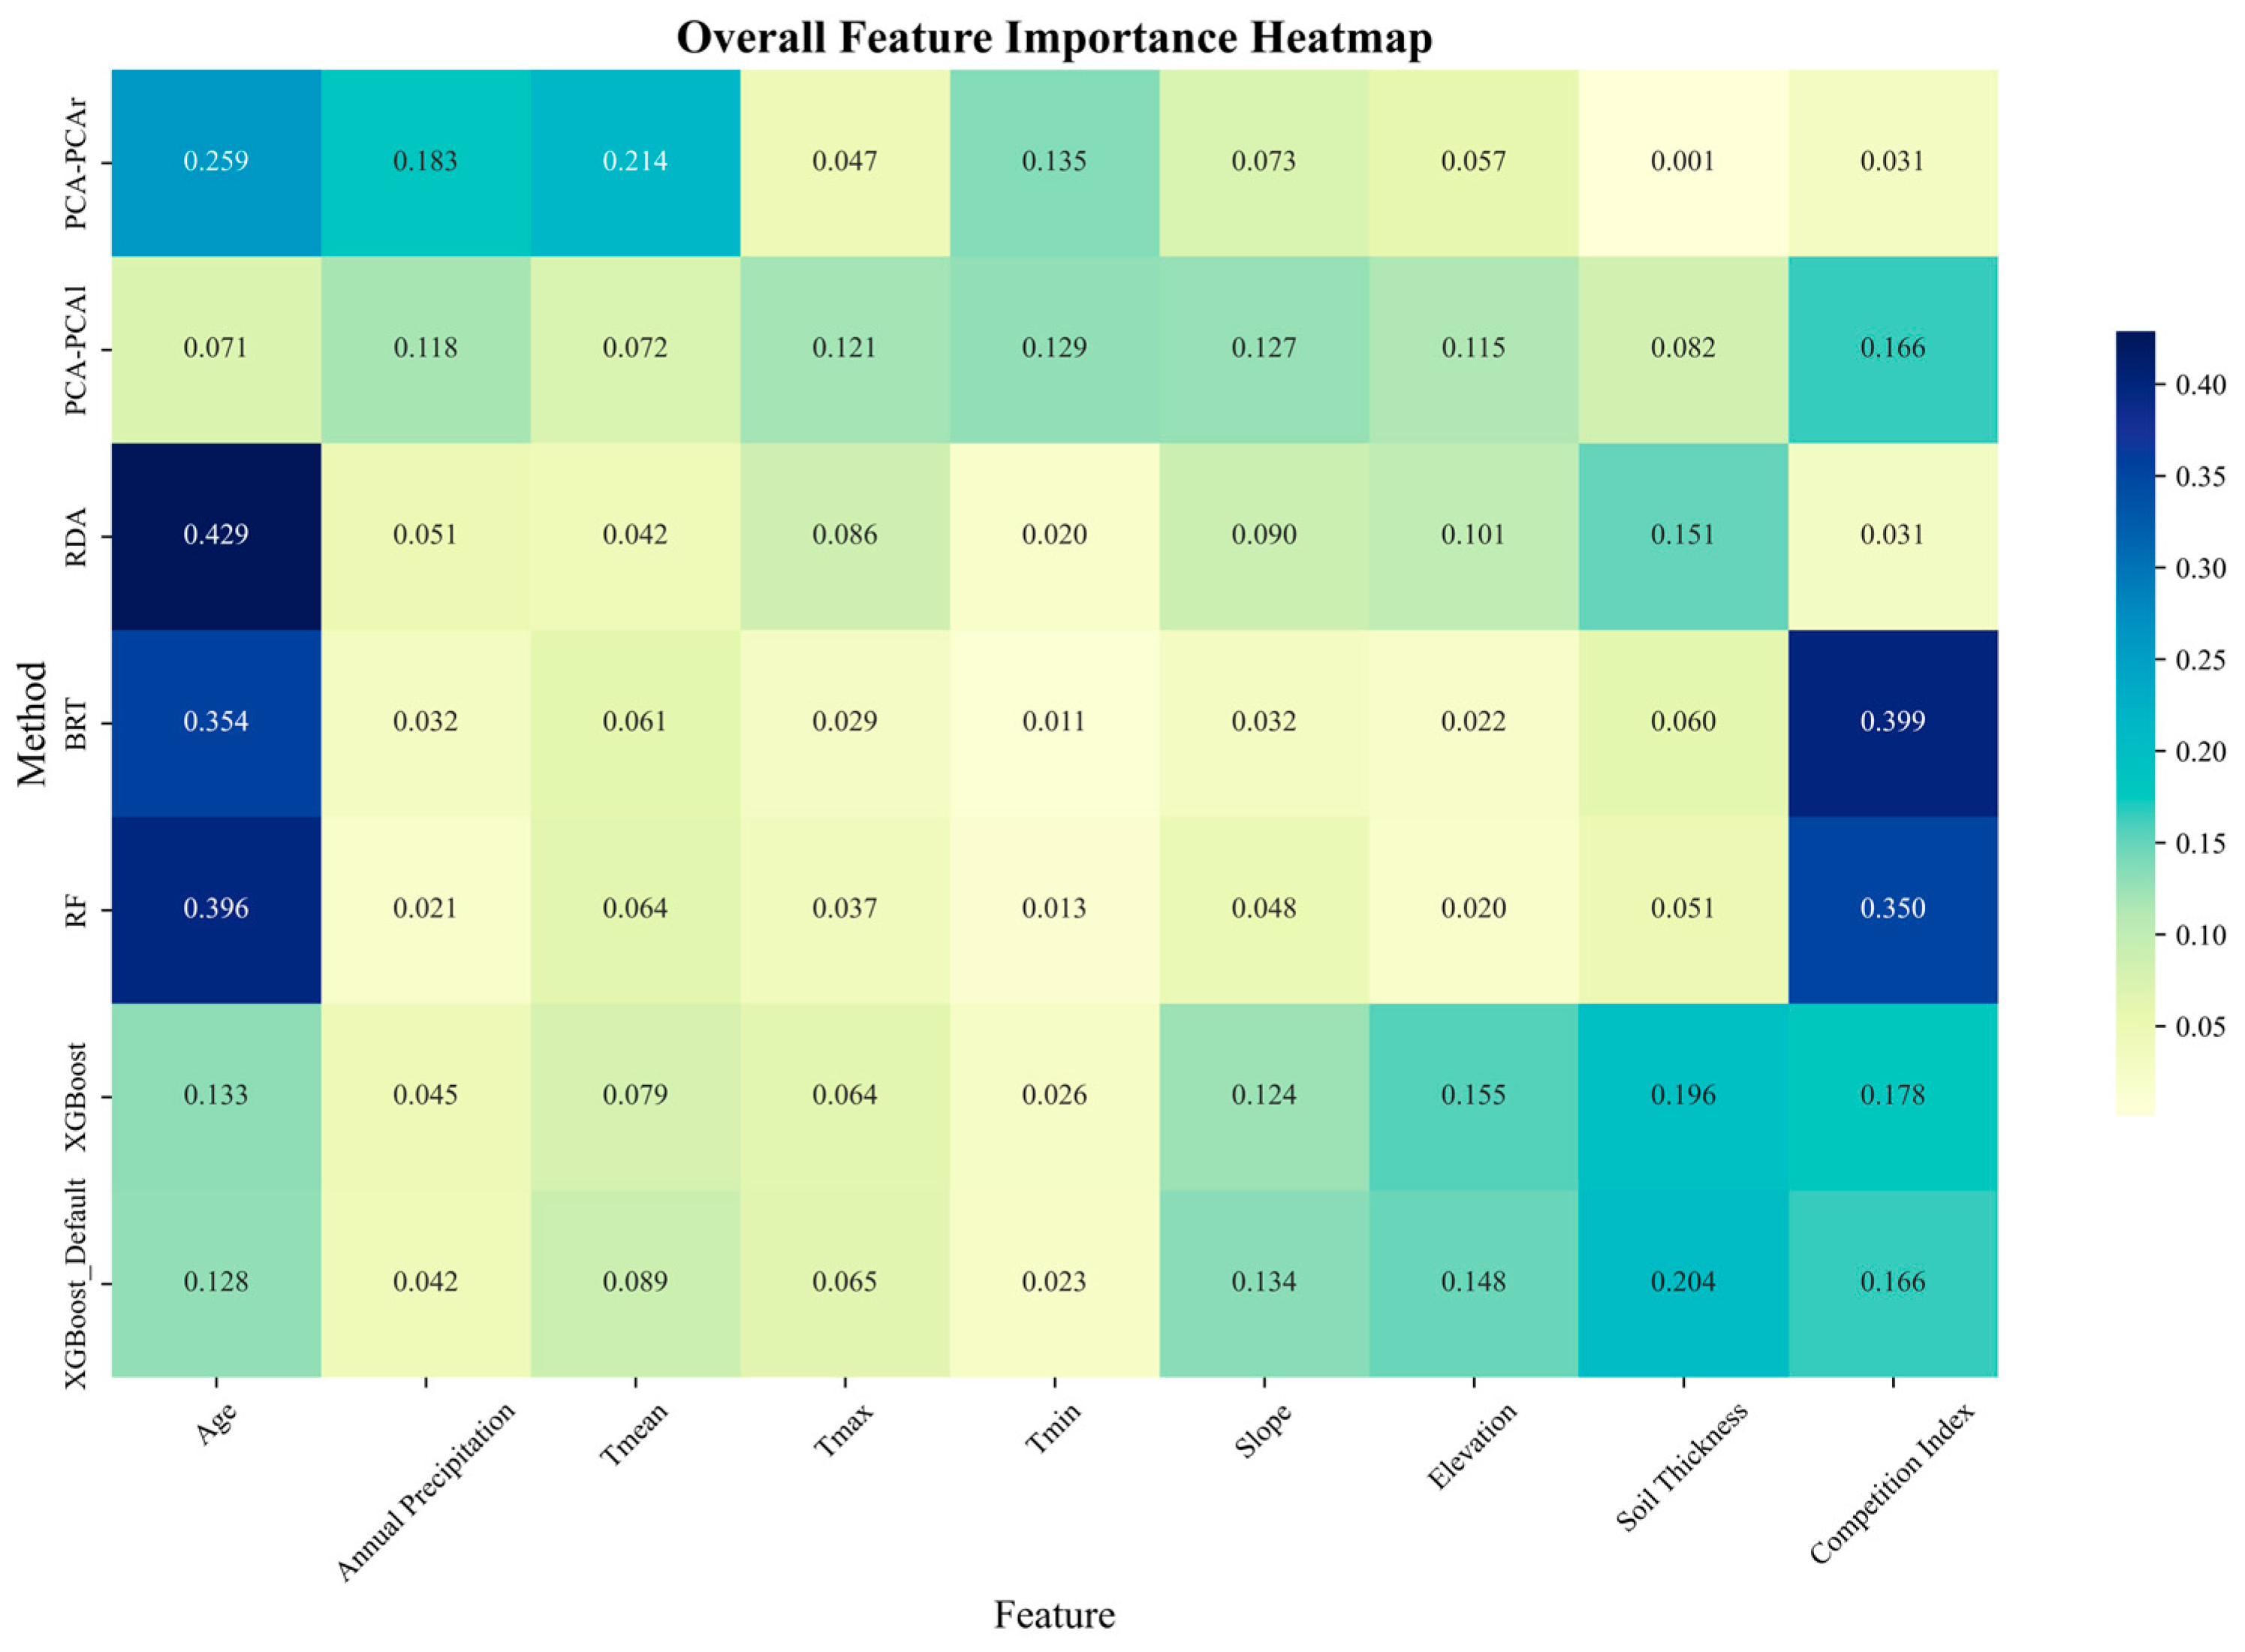
To quantify the influence of environmental and biological factors on the BAI of P. massoniana, six variable importance assessment methods were employed, including the PCA-PCAr, PCA-PCAl, RDA, BRT, RF, and XGBoost. To ensure comparability across methods, the importance of all factors was normalized. The heatmap of the importance of different variables calculated by each method are shown in Figure 3. Although the relative rankings differed across methods, several consistent and divergent patterns emerged. Tree age exhibited high importance in the PCA-PCAr, RDA, BRT, and RF, while its contribution was less prominent in the PCA-PCAl and XGBoost. Conversely, the competition index was ranked highest in the BRT, RF, and XGBoost but showed lower importance in PCA-based methods and the RDA. These method-specific discrepancies likely reflect the differing sensitivities of linear and nonlinear models to interaction effects and variable distributions.
Despite such variations, tree age and Competition Index consistently ranked among the most influential variables overall, suggesting their central role in shaping the BAI of P. massoniana. In contrast, climatic and topographic variables generally exhibited lower and more method-dependent importance, indicating their more moderate or context-specific effects.
To reduce bias caused by methodological mechanisms, this study used the average importance of six methods as the importance of each variable. The results are shown in Table 3.
The results showed that (1) Age exhibited the highest average importance score, with a value of 0.274, substantially exceeding all other variables and suggesting that Age exerted the strongest influence on the BAI of P. massoniana; (2) the average importance of the Competition Index was the second highest, with a value of 0.193, also significantly higher than the remaining feature factors, highlighting the considerable role of competitive interactions in tree growth; (3) the average importance scores of the remaining feature factors ranged from 0.050 to 0.100, indicating that these variables had a certain impact on the BAI of P. massoniana, but their individual effects were comparatively limited.

3.2. The Modeling Process of GAMs

3.2.1. Parameter Selection of GAMs

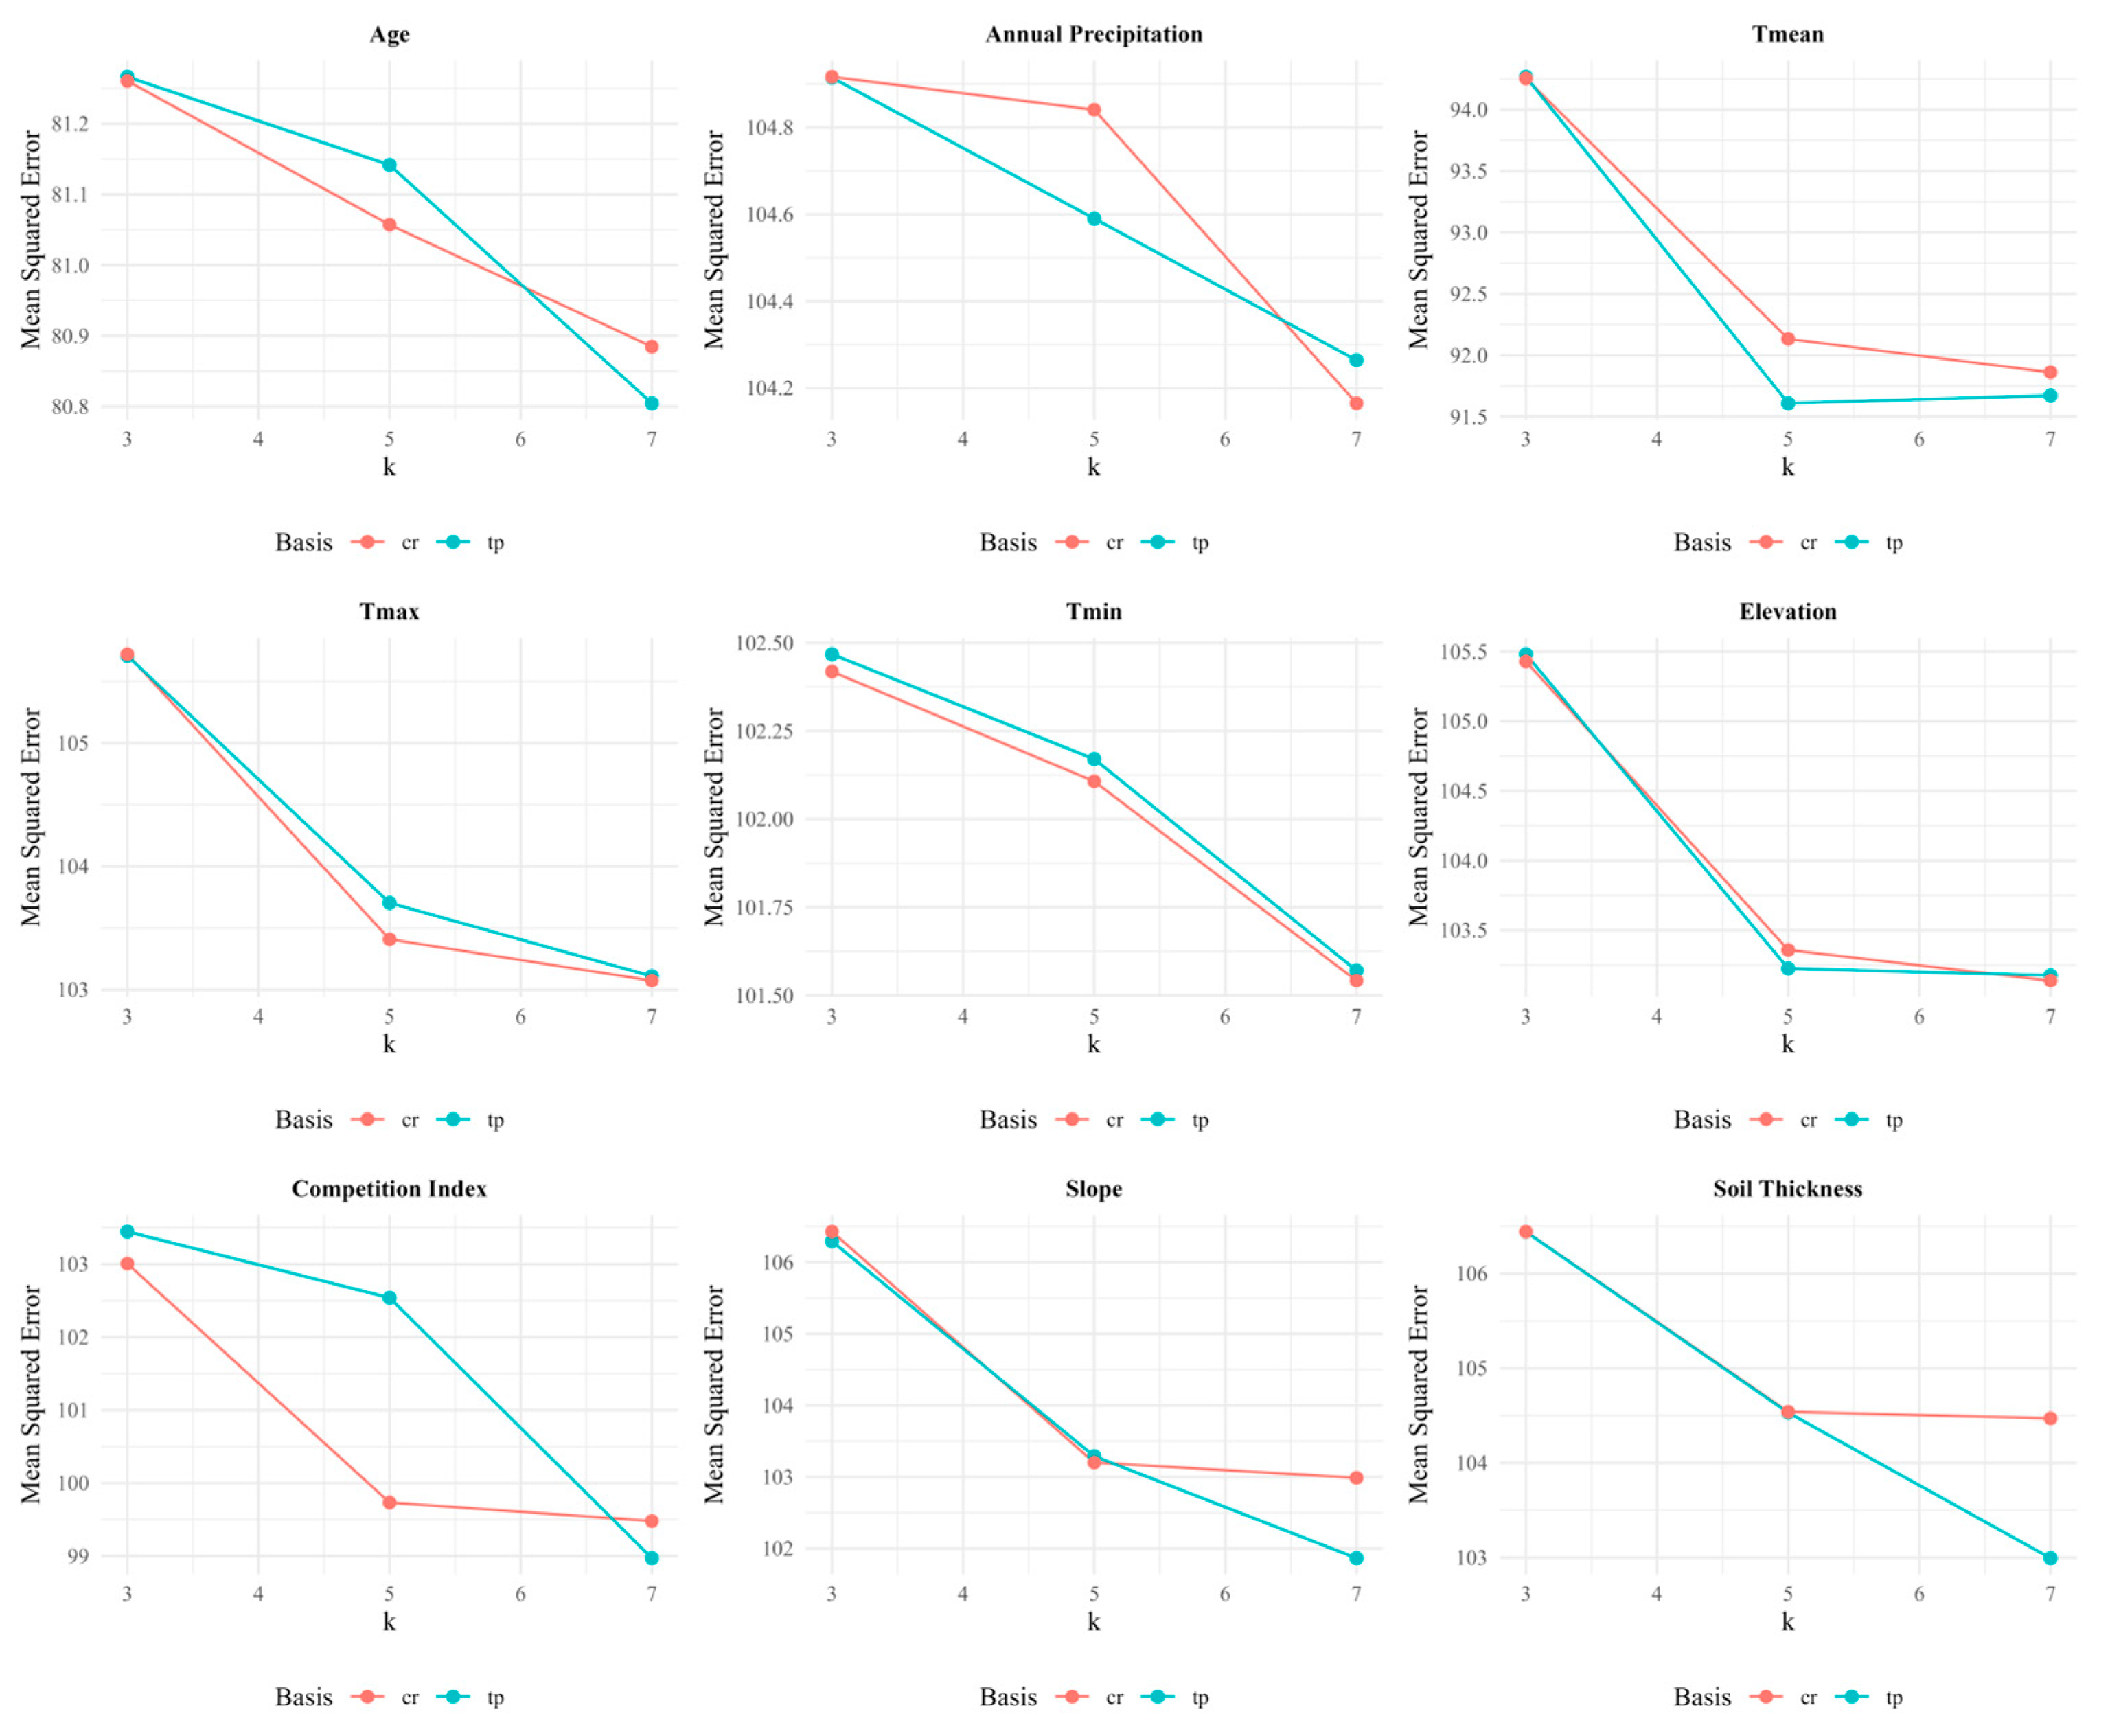
The selection of smoothing functions and their corresponding basis dimensions (k) in the GAM has a substantial impact on model performance. To systematically assess the combined effects of different basis smoothing functions (bs) and basis dimensions (k), this study employed a cross-combination framework using two commonly applied bs (tp, cr) and three k values (three, five, and seven). The selected range of k was determined based on the size and structure of the dataset, as the study included only eight sampling plots. Some variables, such as soil thickness, presented only eight distinct values, making higher k values susceptible to overfitting or convergence issues. Smaller k values were also avoided to prevent under-smoothing. For each bs-k combination, the MSE was calculated through a 10-fold cross-validation. During training, the dataset was randomly partitioned into 10 subsets. In each iteration, nine subsets were used for model fitting and one for testing, with MSE serving as the evaluation metric. GAM fitting was conducted in R (version 4.4.3) using the mgcv package (version 1.9-1), which applies penalized regression splines by default to control overfitting. The cross-validation errors for each variable under different bs-k configurations are shown in Figure 4.
According to Figure 4, the combination with the minimum MSE from the six bs-k combinations was selected as the optimal parameter combination of the GAM for each variable. For example, when bs = tp and k = 7, the MES of the Age variable was minimized. Therefore, this combination was used to construct the GAM between Age and the BAI. The optimal parameter selections for each variable are shown in Table 4.

3.2.2. Fitting Results of GAMs

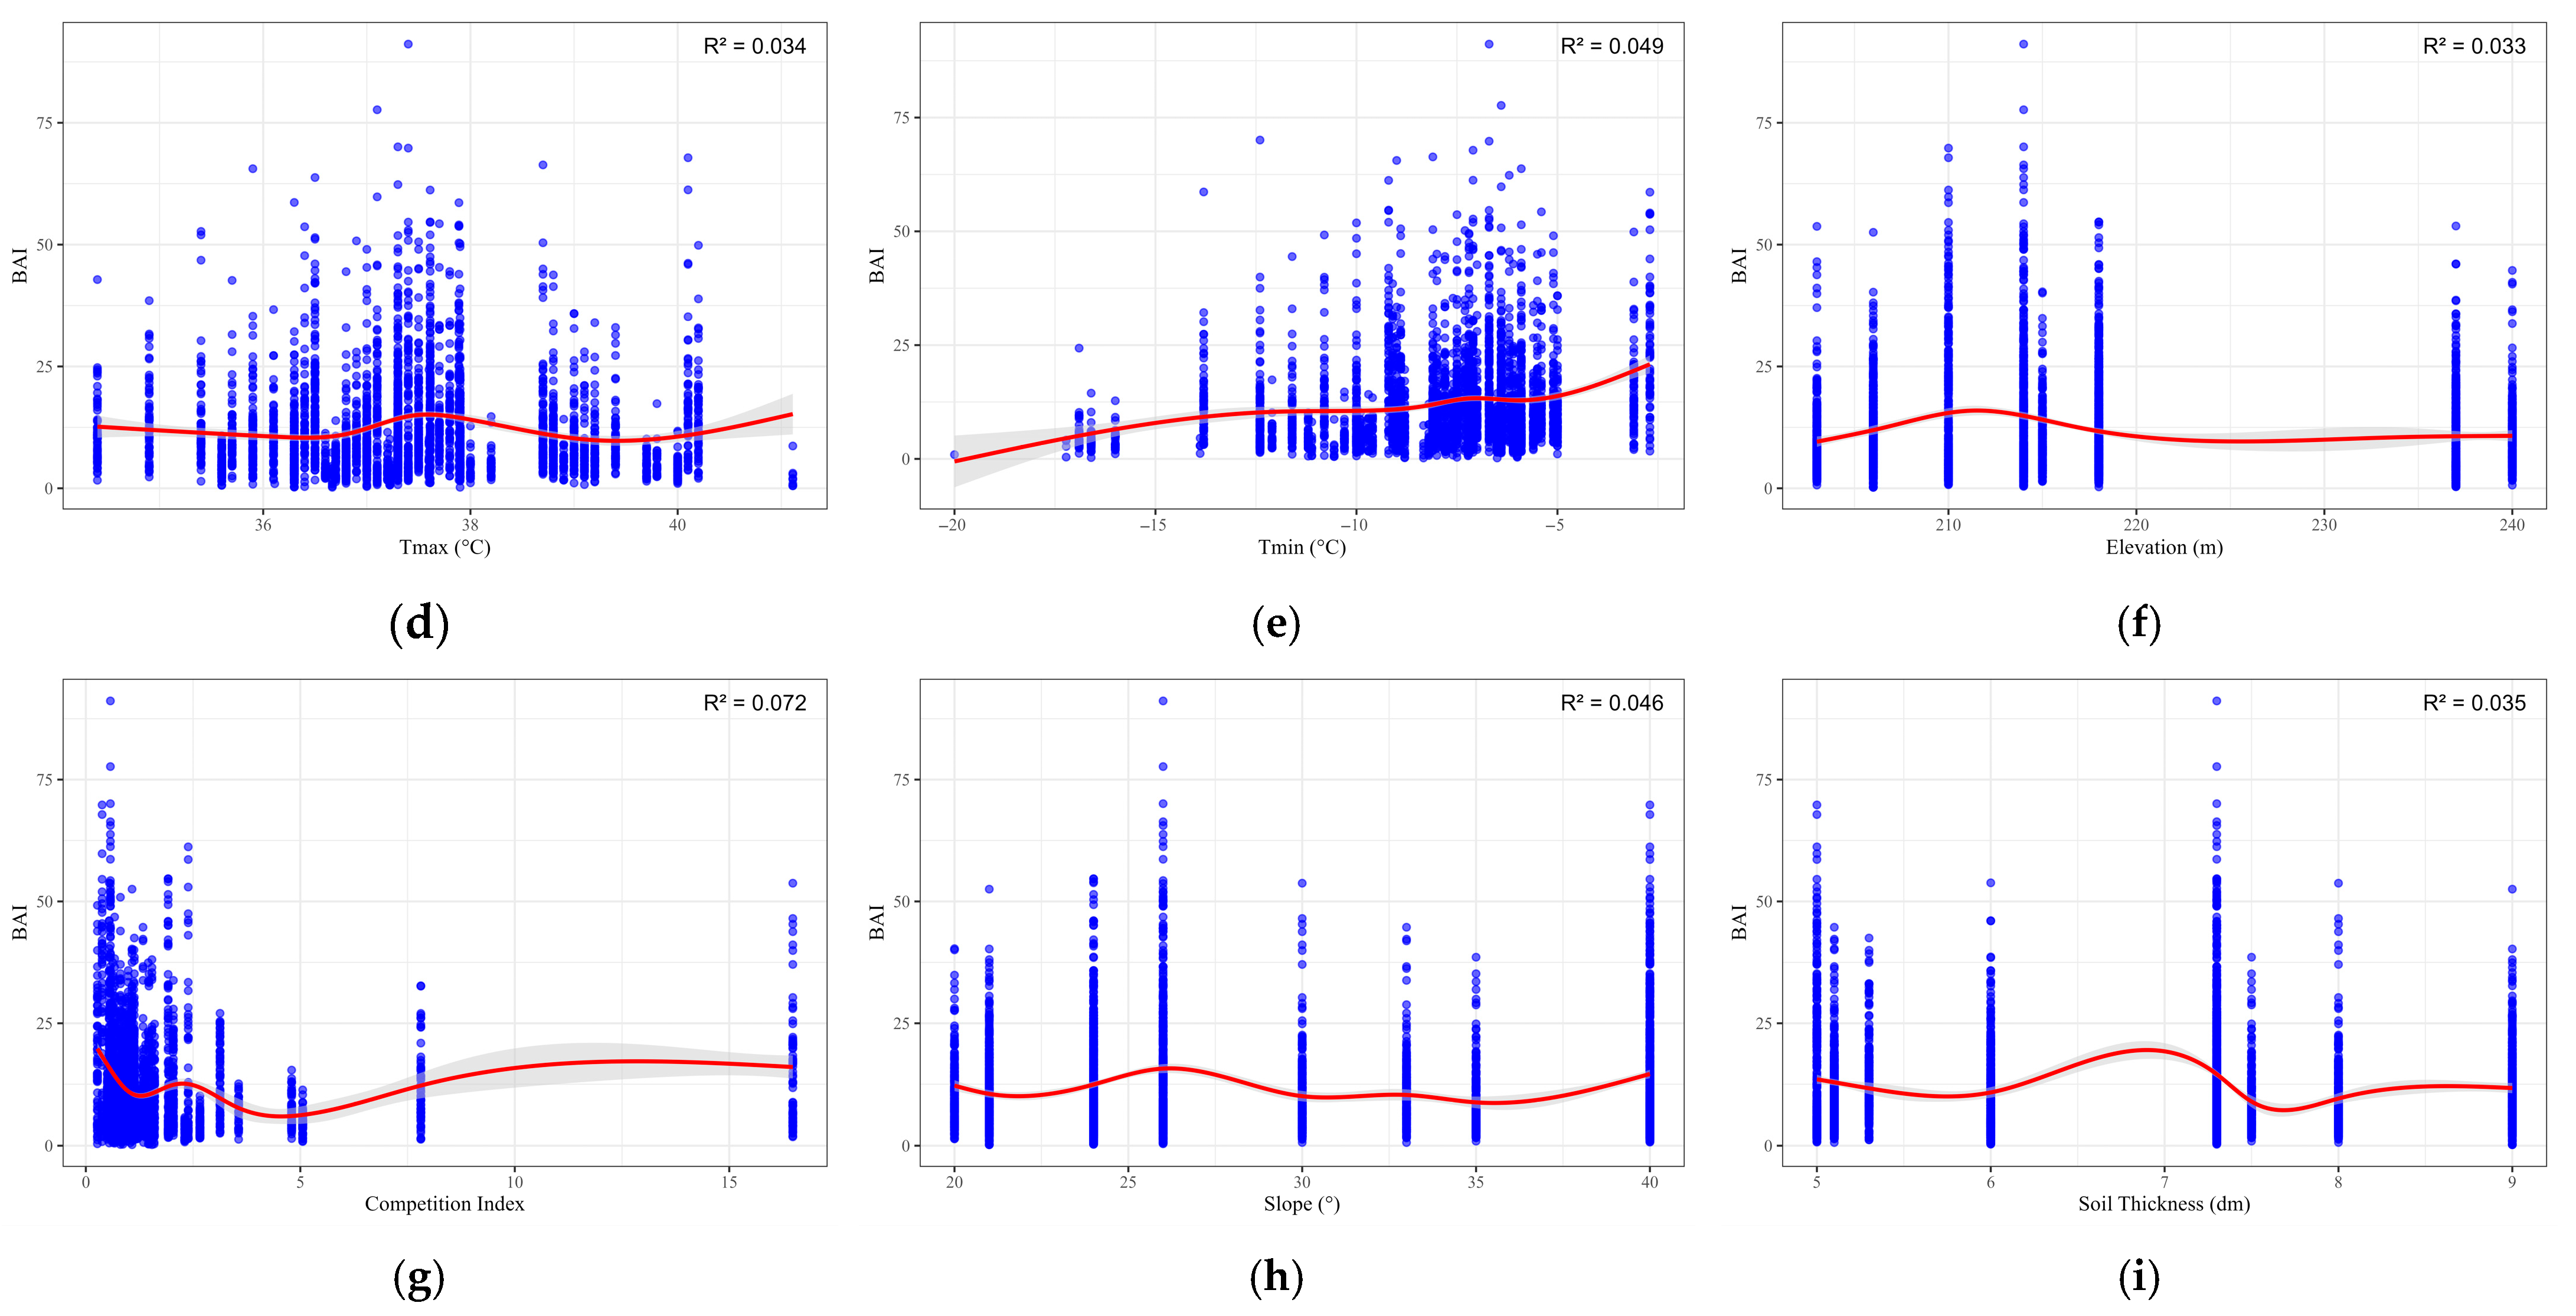
To reveal the relationship between each variable and the BAI of P. massoniana, GAMs were constructed separately using the optimal combination parameters of each variable. The GAMs fitting results between each variable and the BAI are shown in Figure 5.
In Figure 5, the red curve represents the GAM fitting curve, which intuitively reflects the relationship between the BAI and various variables; the blue scatter plot represents the distribution of actual data between the BAI and each variable. From Table 5, it can been seen that (1) the BAI increased with Age when tree age ranged from 0 to 69 years; (2) the BAI increased steadily with increasing Annual Precipitation; (3) the BAI exhibited a unimodal response to Tmean, initially increasing and then declining as Tmean rose; (4) a similar unimodal pattern was observed with Tmax; (5) the BAI increased with rising Tmin; (6) the BAI showed an initial increase followed by a decline as elevation increased; (7) the BAI demonstrated an overall decreasing trend with an increasing Competition Index; and (8) the effects of slope and soil thickness on the BAI were not significant.
The main statistical characteristic parameters of each GAM are shown in Table 5, including the effective degrees of freedom (EDF) of the basis smoothing functions, F-value, p-value, R2, and deviance explained.
As shown in Table 5, the EDF ranged from 3.894 to 5.863, and all p-values were below 0.001, indicating a high level of statistical significance. The F-values ranged from 12.395 to 170.452, R2 values ranged from 0.025 to 0.244, and the proportion of deviance explained varied between 2.64% and 24.53%.
Based on the F-values and deviance explained, Age (F = 170.452, deviance explained = 24.53%), Tmean (F = 124.755, deviance explained = 14.26%), and Competition Index (F = 40.341, deviance explained = 7.33%) are the three variables with the strongest explanatory power for the BAI. Age and Competition Index exhibit the highest average importance, confirming their role as primary drivers of P. massoniana growth. In contrast, Tmax and soil thickness have lower F-values and R2, indicating limited individual effects, although they may exert significant influence through interactions with other variables.
In addition to the overall model performance, the peak points of the GAM response curves and their 95% confidence intervals were estimated based on the fitted smoothing functions and standard errors derived from the model predictions. These estimates provide a quantitative reference for identifying the optimal ecological ranges of each variable for maximizing the BAI. As summarized in Table 6, variables showed clear optima within the observed data range. For instance, the maximum BAI was achieved at approximately 69 years of age (95% CI: 20.726–27.697) and at a Tmean of 16.96 °C (95% CI: 19.233–20.971), indicating the existence of a physiological optimum under the regional climate conditions.

4. Discussion

4.1. Comparisons Among Different Importance Evaluation Methods

This study employed three multivariate statistical methods and three ML algorithms to assess the importance of variables for the Generalized Additive Model (GAM) of the BAI in P. massoniana. These methods differ in their assumptions and outputs. For instance, some focus on statistical significance while others emphasize the detection of nonlinear interactions. While each individual method provides valuable insights, the estimated importance values varied across methods due to their distinct computational frameworks.
Two key reasons contribute to these discrepancies. First, certain predictor variables may exhibit nonlinear relationships with the BAI that are not well captured by linear models such as the PCA and RDA. In contrast, ML algorithms (e.g., RF, BRT, and XGBoost) can detect complex, nonlinear effects and higher-order interactions that traditional statistical methods often overlook. Second, the treatment of multicollinearity varies: linear models tend to downplay correlated variables, while ensemble methods are more tolerant and can extract useful information even from collinear predictors. For example, the Competition Index showed low importance in PCA and RDA but was consistently identified as influential by ML methods.
Given these methodological differences, relying on a single model may introduce bias or fail to reflect the full spectrum of influencing factors. Averaging the importance values across multiple methods helps to mitigate individual model biases and provides a more balanced and robust estimate. This ensemble-style evaluation enhances interpretability, reduces uncertainty, and increases confidence in the selection of variables for modeling the BAI [47,48]. Therefore, the averaged importance values offer a scientifically reliable basis for identifying dominant growth drivers in P. massoniana and guiding further ecological modeling efforts within the Jigong Mountain Nature Reserve.

4.2. Influencing Variables of BAI in P. massoniana

The BAI is a biologically meaningful indicator widely used in forest ecology and management. It directly reflects the increase in the cross-sectional stem area, thereby providing a robust proxy for biomass accumulation and carbon sequestration potential. In forest management, the BAI is often employed to evaluate stand productivity, guide thinning and harvesting schedules, and forecast long-term timber volume dynamics. Unlike ring width, the BAI reduces the confounding effect of tree size and better represents physiological growth trends. Moreover, it integrates the cumulative effects of intrinsic factors (e.g., Age, competition) and extrinsic environmental conditions (e.g., temperature, soil properties), making it suitable for assessing growth responses under varying ecological scenarios.
We developed single-variable GAMs for Age, Annual Precipitation, Tmean, Tmax, Tmin, elevation, Competition Index, slope, and soil thickness. Among these factors, Age, Competition Index, and Tmean exerted the most substantial influence on the BAI of P. massoniana. Age not only exhibited the highest average importance across all selection methods but also accounted for the largest deviance explained in the GAM results. As shown in Figure 5, the BAI increases with Age when tree age ranges from 0 to 69 years. This pattern aligns with general tree growth dynamics: in the juvenile phase, biomass accumulates rapidly and radial growth proceeds at a high rate [49,50]. As trees mature, growth gradually slows due to physiological senescence, increased maintenance demands, and declining resource-use efficiency [51]. However, the trees sampled in this study were generally younger, and the BAI turning point was not yet reached. In future research, including trees with older ages will help to capture the full trajectory of radial growth dynamics.
The Competition Index demonstrated a pronounced negative relationship with the BAI, consistent with previous studies [52]. Radial growth declined substantially when the Competition Index exceeded approximately 0.6, highlighting the role of stand density in suppressing individual tree performance. This reflects classical ecological theories of a density-dependent growth limitation, whereby increased intraspecific competition for light, water, and nutrients suppresses individual growth. This result emphasizes the ecological relevance of stand thinning and structural regulation in maintaining growth capacity. Although the Competition Index ranked second in average importance across the six variable selection methods, its deviance explained in the GAMs was lower than that of the Tmean, placing it third. This discrepancy may reflect differences in how each method quantifies importance. ML approaches consider both marginal effects and variable interactions, whereas the GAM analysis isolates the independent nonlinear contribution of each factor. Furthermore, the slight increase in BAI at higher values of the Competition Index may be explained by sparse data availability in this range, which could reduce model stability and affect the reliability of the fitted response. For instance, two plots with a relatively high Competition Index still exhibited high BAI values, possibly due to plot-specific conditions, while other plots with concentrated lower Competition Index values shaped the overall pattern. These results suggest that the interaction between stand structure and site condition may complicate the role of competition [53,54].
Tmean exhibited a distinct nonlinear relationship with the BAI, characterized by an optimal temperature threshold for growth. Specifically, the GAM results indicated that radial growth peaked when Tmean approached approximately 16.96 °C within the observed temperature range, suggesting the existence of a physiological optimum. This pattern aligns with the understanding that moderate temperatures enhance key metabolic processes, promoting biomass accumulation. At these optimal thermal conditions, the balance between photosynthesis and respiration is maintained efficiently, enabling greater carbohydrate allocation to the cambial zone. Enzymatic activities responsible for cell wall biosynthesis and cell division are also upregulated, facilitating vigorous xylem formation. However, once temperatures surpass the thermal optimum, the risk of protein denaturation increases, stomatal regulation becomes impaired, and maintenance respiration rises—all of which can suppress cambial activity and constrain the radial increment [7,55,56]. These physiological thresholds likely underpin the sharp decline in the BAI observed at higher Tmax levels, with the fitted GAM curve showing a peak around 37.5 °C followed by a pronounced drop. Compared to other climatic variables, the Tmean accounted for a relatively high proportion of deviance explained in the GAMs, ranking second among all variables, underscoring its pivotal role in regulating radial growth. This finding is consistent with previous studies; for instance, Nie et al. reported that mean temperatures from January to June positively influenced the growth of P. massoniana in Guizhou Province [57]. Furthermore, the mean annual temperature of the study area is close to the identified optimum, which may amplify the observed sensitivity of the BAI to small changes in Tmean. Once a certain thermal threshold is exceeded, further increases in temperature may inhibit xylem formation and reduce cambial activity [58]. Tmin exhibited a clear positive association with the BAI, with radial growth increasing steadily as Tmin rose. This trend is biologically plausible, as lower minimum winter temperatures can prolong cambial dormancy and suppress early season xylem development, resulting in narrow growth rings. Rising Tmin values can shorten cambial dormancy and promote the earlier onset of cell division in spring, thereby extending the growing season and enhancing cumulative xylem production. This supports the observed positive relationship between the Tmin and BAI.
Previous studies have suggested that both temperature and precipitation jointly shape the climate–growth relationship of P. massoniana [59]. For instance, Hacket-Pain et al. found that significant positive correlations between growth and summer precipitation were associated with higher temperatures [60]. However, our findings indicate that the influence of Annual Precipitation on the BAI is limited under the climatic conditions of the Jigong Mountain Nature Reserve. As shown in Figure 5, although the BAI tends to increase with precipitation, the response curve appears comparatively flat relative to other climatic variables across the observed range. This suggests that precipitation is not a primary limiting factor for P. massoniana growth in this region. Our results are consistent with those of Nie et al., who reported no significant relationship between radial growth and precipitation in central Guizhou [55], and with Li et al., who found that xylem growth in P. massoniana was only weakly related to relative humidity and precipitation [61]. From a physiological perspective, P. massoniana is characterized by traits typical of drought-tolerant species, such as narrow vessels, high wood density, and conservative stomatal regulation, which allow it to maintain growth under variable moisture conditions. These traits reduce its dependence on short-term fluctuations in precipitation and contribute to its relatively stable BAI across a broad precipitation range. The low precipitation sensitivity observed may be attributed to the species’ ecological strategy as a moderately drought-tolerant pioneer tree. The average Annual Precipitation of 1116.2 mm in the study region likely satisfies the species’ basic water requirements during the growing season. As a result, variations in precipitation have little impact on radial growth. In fact, excess precipitation during certain periods may even suppress growth by reducing soil aeration, promoting pathogen incidence, or limiting root activity, though further research is needed to confirm these mechanisms.
The influences of elevation, slope, and soil thickness on the BAI of P. massoniana were found to be notably limited. Elevation may exert its effects on growth indirectly through its interactions with other environmental variables such as temperature, humidity, and soil properties. For instance, Huang et al. suggested that high-elevation areas may experience suppressed growth in P. massoniana due to reduced evapotranspiration and increased atmospheric humidity, which in turn decreases soil aeration and inhibits root respiration. This may partially explain why the relationship between growth and July–September precipitation was nonsignificant in certain high-elevation sites [59]. However, in the present study, the relatively narrow elevational gradient among the sampled plots likely constrained the detection of such elevation effects. In general, tree species tend to exhibit faster radial growth on gentle slopes compared to steep slopes. On the one hand, gentle slopes facilitate the accumulation of organic matter and nutrients; on the other hand, they improve the water retention capacity by intercepting more precipitation. Enhanced soil moisture not only improves water availability to plants but also accelerates the decomposition of humus, thereby enriching soil organic matter and nutrient content [20,62,63]. However, in this study, slope showed only a weak and inconsistent association with the BAI. One likely reason is the limited variability in slope conditions across the plots, which diminishes the statistical power to detect its effect in the GAM framework. Additionally, the generally mesic conditions of the study region may buffer potential differences in slope-related microenvironments. Soil thickness also exerted a slight influence on the BAI. A possible explanation is that, in most plots, soil depth already exceeded the minimum physiological requirement necessary to sustain adequate water and nutrient supply for tree growth. Once this requirement is fulfilled, additional increases in soil depth may no longer translate into an enhanced radial increment. Furthermore, the limited range of soil depth values observed in the field may have restricted the model’s ability to capture nonlinear effects.

4.3. Limitations and Future Directions

To better assess the generalizability of our findings beyond the Jigong Mountain Nature Reserve, we compared our results with previous studies conducted in other regions. For instance, Nie et al. reported that temperature was the dominant factor influencing radial growth of P. massoniana in central Guizhou [57], consistent with our identification of Tmean as a major driver. Gu et al. demonstrated that in northern regions of P. massoniana distribution, growth was significantly influenced by mean temperatures from February to May, whereas precipitation during September to November was the limiting factor in southern regions [64]. Moreover, several studies found that growth in the northern range is related to the squares of the temperature during February, May, and August, highlighting the complex nonlinear temperature–growth relationship [65,66]. In contrast, Jing et al. observed that P. massoniana in Hunan exhibited low sensitivity to precipitation, with moisture and temperature jointly controlling radial growth patterns [67]. Similarly, Li et al. reported that growth accelerated during periods of higher relative humidity [68]. These findings are consistent with our observation that precipitation was not a major limiting factor for the BAI under the humid subtropical conditions of the Jigong Mountain.
Taken together, these regional comparisons suggest that temperature-related variables exert consistently strong influences on P. massoniana growth across its range, whereas the importance of precipitation appears to vary depending on site-specific moisture regimes. Therefore, our conclusions are most directly applicable to regions with similar climatic and ecological conditions to the Jigong Mountain, particularly the subtropical to warm-temperate transition zones of central China.
Despite robust findings, this study has several limitations. First, the sampled trees were generally younger than 70 years, potentially limiting the detection of late-stage growth dynamics such as age-related decline or plateau phases. Second, the number of sampled plots was limited, and the associated environmental heterogeneity (e.g., variation in slope, elevation, and soil depth) was relatively low. This constrained the model’s capacity to detect broader ecological gradients and weakened the generalizability of the findings across more diverse site conditions. Future studies should incorporate older trees, expand the elevation coverage, and include plots with contrasting aspects and slopes to better capture environmental heterogeneity and improve the ecological applicability of the models.
Moreover, the climate variables used in this study were aggregated at the annual scale, which may obscure important seasonal effects on radial growth. Tree physiological processes, particularly cambial activity and xylem development, are highly sensitive to intra-annual climate variability. For instance, temperatures during April to May have been shown to strongly regulate cambial reactivation and earlywood formation in conifer species across temperate and boreal regions [69]. Warmer conditions during this period are typically associated with enhanced cell division and increased xylem production [69,70]. Therefore, the use of coarse temporal resolution may therefore fail to capture key climatic drivers that operate during specific phenological windows. Future studies should incorporate climate data at finer temporal scales, such as seasonal or monthly averages, to better disentangle the timing and magnitude of climate–growth interactions.
In summary, the GAMs results reveal that the radial growth of P. massoniana is driven by multiple factors, with a significant difference in effect strength and direction. These diverse response patterns reflect the species’ complex ecological adaptation strategies. The fitted curves not only offer intuitive insights into the individual effects of each variable on the BAI but also provide a scientific basis for ecological suitability assessments and precision silvicultural planning. For instance, the results can guide site selection and stand density adjustment for P. massoniana plantations, optimizing growth under varying environmental conditions.

5. Conclusions

To enhance the carbon storage capacity and carbon sink potential of forests, this study investigated the key factors influencing the BAI of P. massoniana in Jigong Mountain Nature Reserve and analyzed the variations in BAI associated with these factors. The main conclusions are as follows:
  • Among all the candidate variables, Age, Competition Index, and Tmean exhibited the most significant influence on the BAI in P. massoniana.
  • When the tree age was less than 70 years, the BAI of P. massoniana increased with the increase in Age.
  • From the overall trend, the BAI of P. massoniana decreased with the increase in Competition Index.
This study revealed that the radial growth of P. massoniana is governed by a complex interplay of factors, with tree age and Competition Index emerging as the dominant drivers. While climatic and topographic variables exerted secondary influences, their effects were contingent upon specific environmental conditions. Since the BAI is widely used as a proxy for stand-level productivity and carbon accumulation, the observed variations provide valuable insights into the carbon sequestration potential and general productivity of P. massoniana forests. Although no active forest management is conducted in the Jigong Mountain Nature Reserve, P. massoniana is an ecologically important species in this region. Investigating its growth characteristics is therefore critical for the protection of mixed P. massoniana–broadleaf forest ecosystems. By analyzing BAI dynamics, this study contributes to forecasting future growth trends under changing environmental conditions. These results offer both a theoretical foundation and practical insights for the sustainable management, growth optimization, and ecological conservation of P. massoniana forests within the Jigong Mountain Nature Reserve and analogous regions. Specifically, forest managers should implement age-structured stand regulations and reduce excessive stand density through targeted thinning, particularly in plots exhibiting high competition indices. Furthermore, afforestation and management efforts should be prioritized in areas where the mean annual temperature is close to 17 °C, which aligns with the optimal growth range identified in this study. These strategies are expected to enhance radial growth and improve the carbon sink potential of P. massoniana forests. Future research endeavors should incorporate long-term monitoring data and employ multi-scale analytical frameworks to further elucidate the dynamic growth responses of P. massoniana to ongoing climate change, as well as to assess the impacts of anthropogenic disturbances on the carbon sequestration potential and overall productivity of these natural forest ecosystems.

Author Contributions

Methodology, Z.L., J.L. and J.Y.; Software, Z.L.; Validation, Z.L. and D.H.; Formal analysis, Z.L.; Investigation, C.Z., J.Y., M.Z. and D.H.; Data curation, C.Z. and M.Z.; Writing—original draft, Z.L.; Writing—review and editing, J.L. and Y.L.; Project administration, J.Y. All authors have read and agreed to the published version of the manuscript.

Funding

This research was funded by the Natural Science Foundation of Henan Province (232300421167); Xinyang Academy of Ecological Research Open Foundation (2023XYQN04); Xinyang Academy of Ecological Research Open Foundation (2023XYZD02); and Postgraduate Education Reform and Quality Improvement Project of Henan Province (YJS2023SZ23).

Institutional Review Board Statement

Not applicable.

Informed Consent Statement

Not applicable.

Data Availability Statement

Some or all data that support the findings of this study are available from the corresponding author upon reasonable request.

Conflicts of Interest

The authors declare no conflicts of interest.

References

  1. Boukhris, I.; Marano, G.; Dalmonech, D.; Valentini, R.; Collalti, A. Modeling Forest Growth Under Current and Future Climate. Curr. For. Rep. 2025, 11, 17. [Google Scholar] [CrossRef]
  2. Wei, Y.; Ye, Q.; Lu, G.; Feng, W.; Han, X.; Huang, Z.; Deng, W. Response of Radial Growth of Cunninghamia lanceolata to Climate Change in the Jinggangshan National Nature Reserve. Chin. J. Agrometeorol. 2025, 46, 179–188. (In Chinese) [Google Scholar]
  3. Wang, T.; Sun, Y.; Qiao, J. Response of tree-ring width of Pinus massoniana to climate change in the Jiangle Forest Farm. J. Beijing For. Univ. 2019, 41, 30–39. (In Chinese) [Google Scholar]
  4. Yang, L. Response of Pinus massoniana and Pinus tabuliformis Growth to Climatic Factors in Jigong Mountain. Master’s Thesis, Henan University, Kaifeng, China, 2020. (In Chinese). [Google Scholar]
  5. Pandey, U.; Nakatsuka, T.; Mehrotra, N.; Zhen, L.; Kato, Y.; Sano, M.; Shah, S.K. Tree-Rings Stable Isotope (δ18O and δ2H) Based 368 Years Long Term Precipitation Reconstruction of South Eastern Kashmir Himalaya. Sci. Total Environ. 2023, 892, 164640. [Google Scholar] [CrossRef] [PubMed]
  6. Ortega Rodriguez, D.R.; Sánchez-Salguero, R.; Hevia, A.; Granato-Souza, D.; Cintra, B.B.L.; Hornink, B.; Andreu-Hayles, L.; Assis-Pereira, G.; Roig, F.A.; Tomazello-Filho, M. Climate Variability of the Southern Amazon Inferred by a Multi-Proxy Tree-Ring Approach Using Cedrela fissilis Vell. Sci. Total Environ. 2023, 871, 162064. [Google Scholar] [CrossRef]
  7. Harvey, J.E.; Smiljanić, M.; Scharnweber, T.; Buras, A.; Cedro, A.; Cruz-García, R.; Drobyshev, I.; Janecka, K.; Jansons, Ā.; Kaczka, R.; et al. Tree Growth Influenced by Warming Winter Climate and Summer Moisture Availability in Northern Temperate Forests. Glob. Change Biol. 2020, 26, 2505–2518. [Google Scholar] [CrossRef]
  8. Kasper, J.; Leuschner, C.; Walentowski, H.; Petritan, A.M.; Weigel, R. Winners and Losers of Climate Warming: Declining Growth in Fagus and Tilia vs. Stable Growth in Three Quercus Species in the Natural Beech–Oak Forest Ecotone (Western Romania). For. Ecol. Manag. 2022, 506, 119892. [Google Scholar] [CrossRef]
  9. Yuan, D.; Zhu, L.; Cherubini, P.; Li, Z.; Zhang, Y.; Wang, X. Species-Specific Indication of 13 Tree Species Growth on Climate Warming in Temperate Forest Community of Northeast China. Ecol. Indic. 2021, 133, 108389. [Google Scholar] [CrossRef]
  10. Bose, A.K.; Scherrer, D.; Camarero, J.J.; Ziche, D.; Babst, F.; Bigler, C.; Bolte, A.; Dorado-Liñán, I.; Etzold, S.; Fonti, P.; et al. Climate Sensitivity and Drought Seasonality Determine Post-Drought Growth Recovery of Quercus petraea and Quercus robur in Europe. Sci. Total Environ. 2021, 784, 147222. [Google Scholar] [CrossRef]
  11. Su, J.; Gou, X.; HilleRisLambers, J.; Deng, Y.; Fan, H.; Zheng, W.; Zhang, R.; Manzanedo, R.D. Increasing Climate Sensitivity of Subtropical Conifers along an Aridity Gradient. For. Ecol. Manag. 2021, 482, 118841. [Google Scholar] [CrossRef]
  12. Huang, Y.; Deng, X.; Zhao, Z.; Xiang, W.; Yan, W.; Ouyang, S.; Lei, P. Monthly Radial Growth Model of Chinese Fir (Cunninghamia lanceolata (Lamb.) Hook.), and the Relationships between Radial Increment and Climate Factors. Forests 2019, 10, 757. [Google Scholar] [CrossRef]
  13. Qiu, Y.; Wang, Z.-P.; Zhang, D.-Y.; Li, X.-Y.; Luo, T.-R.; Wang, X.-R.; Li, L.-L.; Zhao, Y.-R. Responses of Radial Growth of Different Tree Species to Abrupt Temperature Change in the Northern Greater Khingan Mountains, China. Chin. J. Appl. Ecol. 2024, 35, 2933–2941. [Google Scholar] [CrossRef]
  14. Ma, J.; Guo, J.; Wang, Y.; Liu, Z.; Gao, D.; Hong, L.; Zhang, Z. Variations in Stem Radii of Larix principis-rupprechtii to Environmental Factors at Two Slope Locations in the Liupan Mountains, Northwest China. J. For. Res. 2021, 32, 513–527. [Google Scholar] [CrossRef]
  15. Carrer, M.; Urbinati, C. Age-Dependent Tree-Ring Growth Responses to Climate in Larix decidua and Pinus cembra. Ecology 2004, 85, 730–740. [Google Scholar] [CrossRef]
  16. Yun, Z.; Yin, C.; Tian, K.; Zhang, W.; He, R.; He, W.; Sun, J.; Liu, Z. Radial Growth Responses of Picea likiangensis to Climate Variabilities at Different Altitudes in Yulong Snow Mountain, Southwest China. Chin. J. Plant Ecol. 2018, 42, 629. [Google Scholar] [CrossRef]
  17. Shan, Q.; Wang, Z.; Ling, H.; Zhang, G.; Yan, J.; Han, F. Unreasonable Human Disturbance Shifts the Positive Effect of Climate Change on Tree-Ring Growth of Malus sieversii in the Origin Area of World Cultivated Apples. J. Clean. Prod. 2021, 287, 125008. [Google Scholar] [CrossRef]
  18. Zhang, J.; Gou, X.; Rademacher, T.; Wang, L.; Li, Y.; Sun, Q.; Wang, F.; Cao, Z. Interaction of Age and Elevation on Xylogenesis in Juniperus przewalskii in a Cold and Arid Region. Agric. For. Meteorol. 2023, 337, 109480. [Google Scholar] [CrossRef]
  19. Cuapio-Hernández, L.; Reyes-Ortiz, J.L.; Rosa, A.B.D.L.; Pavón, N.P.; López-Herrera, M.; Villanueva-Díaz, J.; Sánchez-González, A. Is There a Response Pattern between Radial Growth of Trees and Elevation Gradient? Tree-Ring Res. 2023, 79, 12–26. [Google Scholar] [CrossRef]
  20. Diao, Y.; Zhang, S.; Liu, Y.; Jin, G.; Tian, S.; Liu, Y. Effects of Topography on Radial Growth of Tree Species with Different Mycorrhizal Types. Forests 2023, 14, 546. [Google Scholar] [CrossRef]
  21. Li, J.; Peng, J.; Wei, X.; Peng, M.; Li, X.; Liu, Y.; Li, J. Stability Assessment of Tree Ring Growth of Pinus Armandii Franch in Response to Climate Change Based on Slope Directions at the Lubanling in the Funiu Mountains, China. J. For. Res. 2024, 35, 44. [Google Scholar] [CrossRef]
  22. Kobal, M.; Grčman, H.; Zupan, M.; Levanič, T.; Simončič, P.; Kadunc, A.; Hladnik, D. Influence of Soil Properties on Silver Fir (Abies alba Mill.) Growth in the Dinaric Mountains. For. Ecol. Manag. 2015, 337, 77–87. [Google Scholar] [CrossRef]
  23. Meyer, M.D.; North, M.P.; Gray, A.N.; Zald, H.S.J. Influence of Soil Thickness on Stand Characteristics in a Sierra Nevada Mixed-Conifer Forest. Plant Soil 2007, 294, 113–123. [Google Scholar] [CrossRef]
  24. Luo, T.; Wang, Z.; Zhang, D.; Li, X.; Wang, X. Response of Radial Growth of Dahurian Larch (Larix gmelinii) to Climate Factors at Different Altitudes in the Northern Part of the Greater Khingan Mountains. Front. For. Glob. Change 2024, 7, 1434773. [Google Scholar] [CrossRef]
  25. Wang, S.; Jiang, Y.; Liu, J.; Yuan, S.; Cui, M.; Xiong, Q.; Waili, Y.; Kang, M.; Xu, H. Divergent Responses to Climatic Conditions in Radial Growth of Abies fargesii along Elevation at the Eastern Edge of the Tibetan Plateau. Trees-Struct. Funct. 2024, 38, 1035–1048. [Google Scholar] [CrossRef]
  26. Lu, K.; Chen, N.; Zhang, C.; Dong, X.; Zhao, C. Drought Enhances the Role of Competition in Mediating the Relationship between Tree Growth and Climate in Semi-Arid Areas of Northwest China. Forests 2019, 10, 804. [Google Scholar] [CrossRef]
  27. Ford, K.R.; Breckheimer, I.K.; Franklin, J.F.; Freund, J.A.; Kroiss, S.J.; Larson, A.J.; Theobald, E.J.; HilleRisLambers, J. Competition alters tree growth responses to climate at individual and stand scales. Can. J. For. Res. 2017, 47, 53–62. [Google Scholar] [CrossRef]
  28. Wang, Y.; Deng, X.; Zhang, X.; Xiao, F.; Zheng, R.; Yang, B.; Xiang, W. Variations of Monthly Radial Growth of Chinese Fir [Cunninghamia lanceolata (Lamb.) Hook.] Considering Its Responses to Climatic Factors. Eur. J. For. For. Res. 2024, 143, 1525–1539. [Google Scholar] [CrossRef]
  29. Xie, S.; Yan, T.; Sun, X.; Chen, H.; Sun, M.; Zhang, Y. Radial Growth Response of Pinus yunnanensis to Climate in High Mountain Forests of Northwestern Yunnan, Southwestern China. Front. For. Glob. Change 2024, 7, 1343730. [Google Scholar] [CrossRef]
  30. Li, Q. Intra-Annual Radial Growth Dynamics of Common Tree Species and Its Influencing Factors in the Tianma National Nature Reserve, Anhui, China. Master’s Thesis, East China Normal University, Shanghai, China, 2024. (In Chinese). [Google Scholar]
  31. Liu, P.; Hu, S.; Wei, H.; He, W.; Zhou, Y.; Wang, Y. Response of Radial Growth of Pinus sylvestris Var. Mongolica of Different Stand Ages to Climate and Extreme Drought Events in the Semi-Arid Region of Western Liaoning, Northeast China. Front. For. Glob. Change 2023, 6, 1272477. [Google Scholar] [CrossRef]
  32. Liu, Z.; Li, J.; Shi, S.-L.; Yang, R.; Luo, W.-W.; Ma, Y.-L.; Bie, X.-J.; Wang, G.-Y. Response of Radial Growth of Different Timberline Species to Climate Change in Yading Nature Reserve, Sichuan, China. Chin. J. Appl. Ecol. 2024, 35, 1177–1186. [Google Scholar] [CrossRef]
  33. Scolforo, J.R.S.; Maestri, R.; Ferraz Filho, A.C.; de Mello, J.M.; de Oliveira, A.D.; de Assis, A.L. Dominant Height Model for Site Classification of Eucalyptus Grandis Incorporating Climatic Variables. Int. J. For. Res. 2013, 2013, 139236. [Google Scholar] [CrossRef]
  34. He, X.; Lei, X.; Xu, Q.; Lan, J.; Wu, B.; Guo, H.; Gao, W.; Liu, D. Combining Multiple Feature Selection Methods and Structural Equation Modelling for Exploring Factors Affecting Stand Biomass of Natural Coniferous-Broad Leaved Mixed Forests. Sci. Total Environ. 2024, 954, 176669. [Google Scholar] [CrossRef] [PubMed]
  35. Hosseini, S.F.; Jalilvand, H.; Fallah, A.; Asadi, H.; Tafazoli, M. Machine Learning Methods for Basal Area Prediction of Fagus orientalis Lipsky Stands Based on National Forest Inventory. Trees-Struct. Funct. 2025, 39, 40. [Google Scholar] [CrossRef]
  36. He, X.; Lei, X.; Liu, D.; Lei, Y. Developing Machine Learning Models with Multiple Environmental Data to Predict Stand Biomass in Natural Coniferous-Broad Leaved Mixed Forests in Jilin Province of China. Comput. Electron. Agric. 2023, 212, 108162. [Google Scholar] [CrossRef]
  37. Bui, Q.-T.; Pham, Q.-T.; Pham, V.-M.; Tran, V.-T.; Nguyen, D.-H.; Nguyen, Q.-H.; Nguyen, H.-D.; Do, N.T.; Vu, V.-M. Hybrid Machine Learning Models for Aboveground Biomass Estimations. Ecol. Inf. 2024, 79, 102421. [Google Scholar] [CrossRef]
  38. Wei, X.-X.; Peng, J.-F.; Peng, M.; Li, X.; Cui, J.-Y.; Li, J.-K.; Wei, Y.-F. Response of Radial Growth of Pinus tabuliformis to Climatic Factors in the North-South Transition Zone of China—A Case Study of Jigong Mountain National Nature Reserve. Geogr. Sci. 2024, 44, 1643–1652. (In Chinese) [Google Scholar]
  39. Holmes, R.L. Computer-Assisted Quality Control in Tree-Ring Dating and Measurement. Tree-Ring Soc. 1983, 43, 69–78. [Google Scholar]
  40. He, X.; Lei, X.; Zhou, C.; Duan, G.; Zhou, M.; Shi, J. Application of R program package ForestStatTool in statistics of individual tree and stand factors in forestry. J. Beijing For. Univ. 2024, 46, 125–135. [Google Scholar] [CrossRef]
  41. Hegyi, F. A simulation model for managing jack-pine stands. In Growth Models for Tree and Stand Simulation; Fries, J., Ed.; Research Note No. 30; Royal College of Forestry: Stockholm, Sweden, 1974; pp. 74–90. [Google Scholar]
  42. Yoon, S.; Lee, W.-H. Methodological Analysis of Bioclimatic Variable Selection in Species Distribution Modeling with Application to Agricultural Pests (Metcalfa pruinosa and Spodoptera litura). Comput. Electron. Agric. 2021, 190, 106430. [Google Scholar] [CrossRef]
  43. Rao, C.R. The Use and Interpretation of Principal Component Analysis in Applied Research. Sankhyā Indian J. Stat. Ser. A (1961–2002) 1964, 26, 329–358. [Google Scholar]
  44. Soykan, C.U.; Eguchi, T.; Kohin, S.; Dewar, H. Prediction of Fishing Effort Distributions Using Boosted Regression Trees. Ecol. Appl. 2014, 24, 71–83. [Google Scholar] [CrossRef]
  45. Win, K.; Sato, T.; Hiroshima, T. Applicability of Remote Sensing and Machine Learning for Predicting Bulk Soil Electrical Conductivity under Different Forest Types in Central Japan. Soil Adv. 2025, 3, 100045. [Google Scholar] [CrossRef]
  46. Yao, J.; Lei, X.; Wang, X.; Fu, L.; Zheng, Y.; Guo, X.; Duan, G.; Song, X. Influence of moisture content on needle resistance measured by micro-drilling resistance device. J. Cent. South Univ. For. Technol. 2022, 42, 137–147. (In Chinese) [Google Scholar]
  47. Bolón-Canedo, V.; Alonso-Betanzos, A. Ensembles for Feature Selection: A Review and Future Trends. Inf. Fusion 2019, 52, 1–12. [Google Scholar] [CrossRef]
  48. Zhang, X.; Lei, Y.; Cao, Q.V.; Chen, X.; Liu, X. Improving Tree Survival Prediction with Forecast Combination and Disaggregation. Can. J. For. Res. 2011, 41, 1928–1935. [Google Scholar] [CrossRef]
  49. Ryan, M.G.; Binkley, D.; Fownes, J.H. Age-Related Decline in Forest Productivity: Pattern and Process. In Advances in Ecological Research; Begon, M., Fitter, A.H., Eds.; Academic Press: Cambridge, MA, USA, 1997; Volume 27, pp. 213–262. [Google Scholar]
  50. Mencuccini, M.; Martínez-Vilalta, J.; Vanderklein, D.; Hamid, H.A.; Korakaki, E.; Lee, S.; Michiels, B. Size-Mediated Ageing Reduces Vigour in Trees. Ecol. Lett. 2005, 8, 1183–1190. [Google Scholar] [CrossRef] [PubMed]
  51. Gower, S.T.; McMurtrie, R.E.; Murty, D. Aboveground Net Primary Production Decline with Stand Age: Potential Causes. Trends Ecol. Evol. 1996, 11, 378–382. [Google Scholar] [CrossRef]
  52. Rozendaal, D.M.A.; Phillips, O.L.; Lewis, S.L.; Affum-Baffoe, K.; Alvarez-Davila, E.; Andrade, A.; Aragão, L.E.O.C.; Araujo-Murakami, A.; Baker, T.R.; Bánki, O.; et al. Competition influences tree growth, but not mortality, across environmental gradients in Amazonia and tropical Africa. Ecology 2020, 101, e03052. [Google Scholar] [CrossRef]
  53. Looney, C.E.; Zhang, J. Site Quality and Intensive Early Stand Management Practices Affect Growth Dominance, Structural Complexity, and Tree Growth in Ponderosa pine Plantations. For. Ecol. Manag. 2022, 519, 120318. [Google Scholar] [CrossRef]
  54. Pretzsch, H.; Bravo-Oviedo, A.; Hilmers, T.; Ruiz-Peinado, R.; Coll, L.; Löf, M.; Ahmed, S.; Aldea, J.; Ammer, C.; Avdagić, A.; et al. With increasing site quality, asymmetric competition and mortality reduce Pinus sylvestris L. stand structuring across Europe. For. Ecol. Manag. 2022, 520, 120365. [Google Scholar] [CrossRef]
  55. Chen, S.Y.; Zhao, S.Y.; Jin, F.; Hu, S.B.; Fang, K.Y. Environmental information recorded by Pinus massoniana of different ages on Gushan Mountain, Fuzhou. J. Subtrop. Resour. Environ. 2019, 14, 19–27. (In Chinese) [Google Scholar]
  56. Schwab, N.; Kaczka, R.J.; Janecka, K.; Böhner, J.; Chaudhary, R.P.; Scholten, T.; Schickhoff, U. Climate Change-Induced Shift of Tree Growth Sensitivity at a Central Himalayan Treeline Ecotone. Forests 2018, 9, 267. [Google Scholar] [CrossRef]
  57. Nie, K.; Xu, M.; Yang, Y.L.; Zhang, J.; Wen, C.Y.; Zhang, J. Response of Pinus massoniana radial growth to climate change in central Guizhou. J. Southwest For. Univ. (Nat. Sci.) 2023, 43, 32–38. (In Chinese) [Google Scholar]
  58. Yan, J.; Liu, X.; Tang, X.; Yu, G.; Zhang, L.; Chen, Q.; Li, K. Substantial Amounts of Carbon Are Sequestered during Dry Periods in an Old-Growth Subtropical Forest in South China. J. Res. 2013, 18, 21–30. [Google Scholar] [CrossRef]
  59. Huang, X.; Dai, D.; Xiang, Y.; Yan, Z.; Teng, M.; Wang, P.; Zhou, Z.; Zeng, L.; Xiao, W. Radial Growth of Pinus massoniana Is Influenced by Temperature, Precipitation, and Site Conditions on the Regional Scale: A Meta-Analysis Based on Tree-Ring Width Index. Ecol. Indic. 2021, 126, 107659. [Google Scholar] [CrossRef]
  60. Hacket-Pain, A.J.; Cavin, L.; Friend, A.D.; Jump, A.S. Consistent Limitation of Growth by High Temperature and Low Precipitation from Range Core to Southern Edge of European Beech Indicates Widespread Vulnerability to Changing Climate. Eur. J. For. Res. 2016, 135, 897–909. [Google Scholar] [CrossRef]
  61. Li, J.Y.; Guo, M.G.; Sui, D.D.; Bai, C.M.; Zhao, W.D.; Jiang, W.J.; Huang, S.Q.; Guo, X.L. Intra-annual xylem formation dynamics of Pinus massoniana in southern Guangxi and its response to climate. Quat. Sci. 2024, 44, 996–1007. [Google Scholar] [CrossRef]
  62. Wu, Q.; Ding, J.; Yan, H.; Zhang, S.; Fang, T.; Ma, K. Effects of Simulated Precipitation and Nitrogen Addition on Seedling Growth and Biomass in Five Tree Species in Gutian Mountain, Zhejiang Province, China. Chin. J. Plant Ecol. 2011, 35, 256. [Google Scholar] [CrossRef]
  63. Xiao, S.G. Effect of site conditions on the growth of Cotinus coggygria in Yiling District of Yichang Municipality. J. Southwest For. Univ. 2009, 29, 31–34. [Google Scholar] [CrossRef]
  64. Gu, H.; Wang, J.; Ma, L.; Shang, Z.; Zhang, Q. Insights into the BRT (Boosted Regression Trees) Method in the Study of the Climate-Growth Relationship of Masson Pine in Subtropical China. Forests 2019, 10, 228. [Google Scholar] [CrossRef]
  65. Lan, T.; Xia, B.; He, S. Tree Ring Analysis on Relation of Pinus massoniana Growth to Climate Factors. Chin. J. Appl. Ecol. 1994, 5, 422. [Google Scholar]
  66. Xia, B.; Lan, T.; He, S. Nonlinear Response Function of Growth of Pinus massomiana to Climate. Chin. J. Plant Ecol. 1996, 20, 51–56. [Google Scholar]
  67. Jing, M.; Zhu, L.; Cherubini, P.; Yuan, D.; Li, Z.; Wang, X.; Liu, S. Responses of Radial Growth of Pinus massoniana and Castanopsis eyrei to Climate Change at Different Elevations in South China. Ecol. Indic. 2022, 145, 109602. [Google Scholar] [CrossRef]
  68. Li, D.; Fang, K.; Li, Y.; Chen, D.; Liu, X.; Dong, Z.; Zhou, F.; Guo, G.; Shi, F.; Xu, C.; et al. Climate, Intrinsic Water-Use Efficiency and Tree Growth over the Past 150 Years in Humid Subtropical China. PLoS ONE 2017, 12, e0172045. [Google Scholar] [CrossRef]
  69. Rossi, S.; Anfodillo, T.; Čufar, K.; Cuny, H.E.; Deslauriers, A.; Fonti, P.; Frank, D.; Gričar, J.; Gruber, A.; Huang, J.-G.; et al. Pattern of Xylem Phenology in Conifers of Cold Ecosystems at the Northern Hemisphere. Glob. Change Biol. 2016, 22, 3804–3813. [Google Scholar] [CrossRef]
  70. Zhai, L.; Bergeron, Y.; Huang, J.-G.; Berninger, F. Variation in Intra-Annual Wood Formation, and Foliage and Shoot Development of Three Major Canadian Boreal Tree Species. Am. J. Bot. 2012, 99, 827–837. [Google Scholar] [CrossRef]
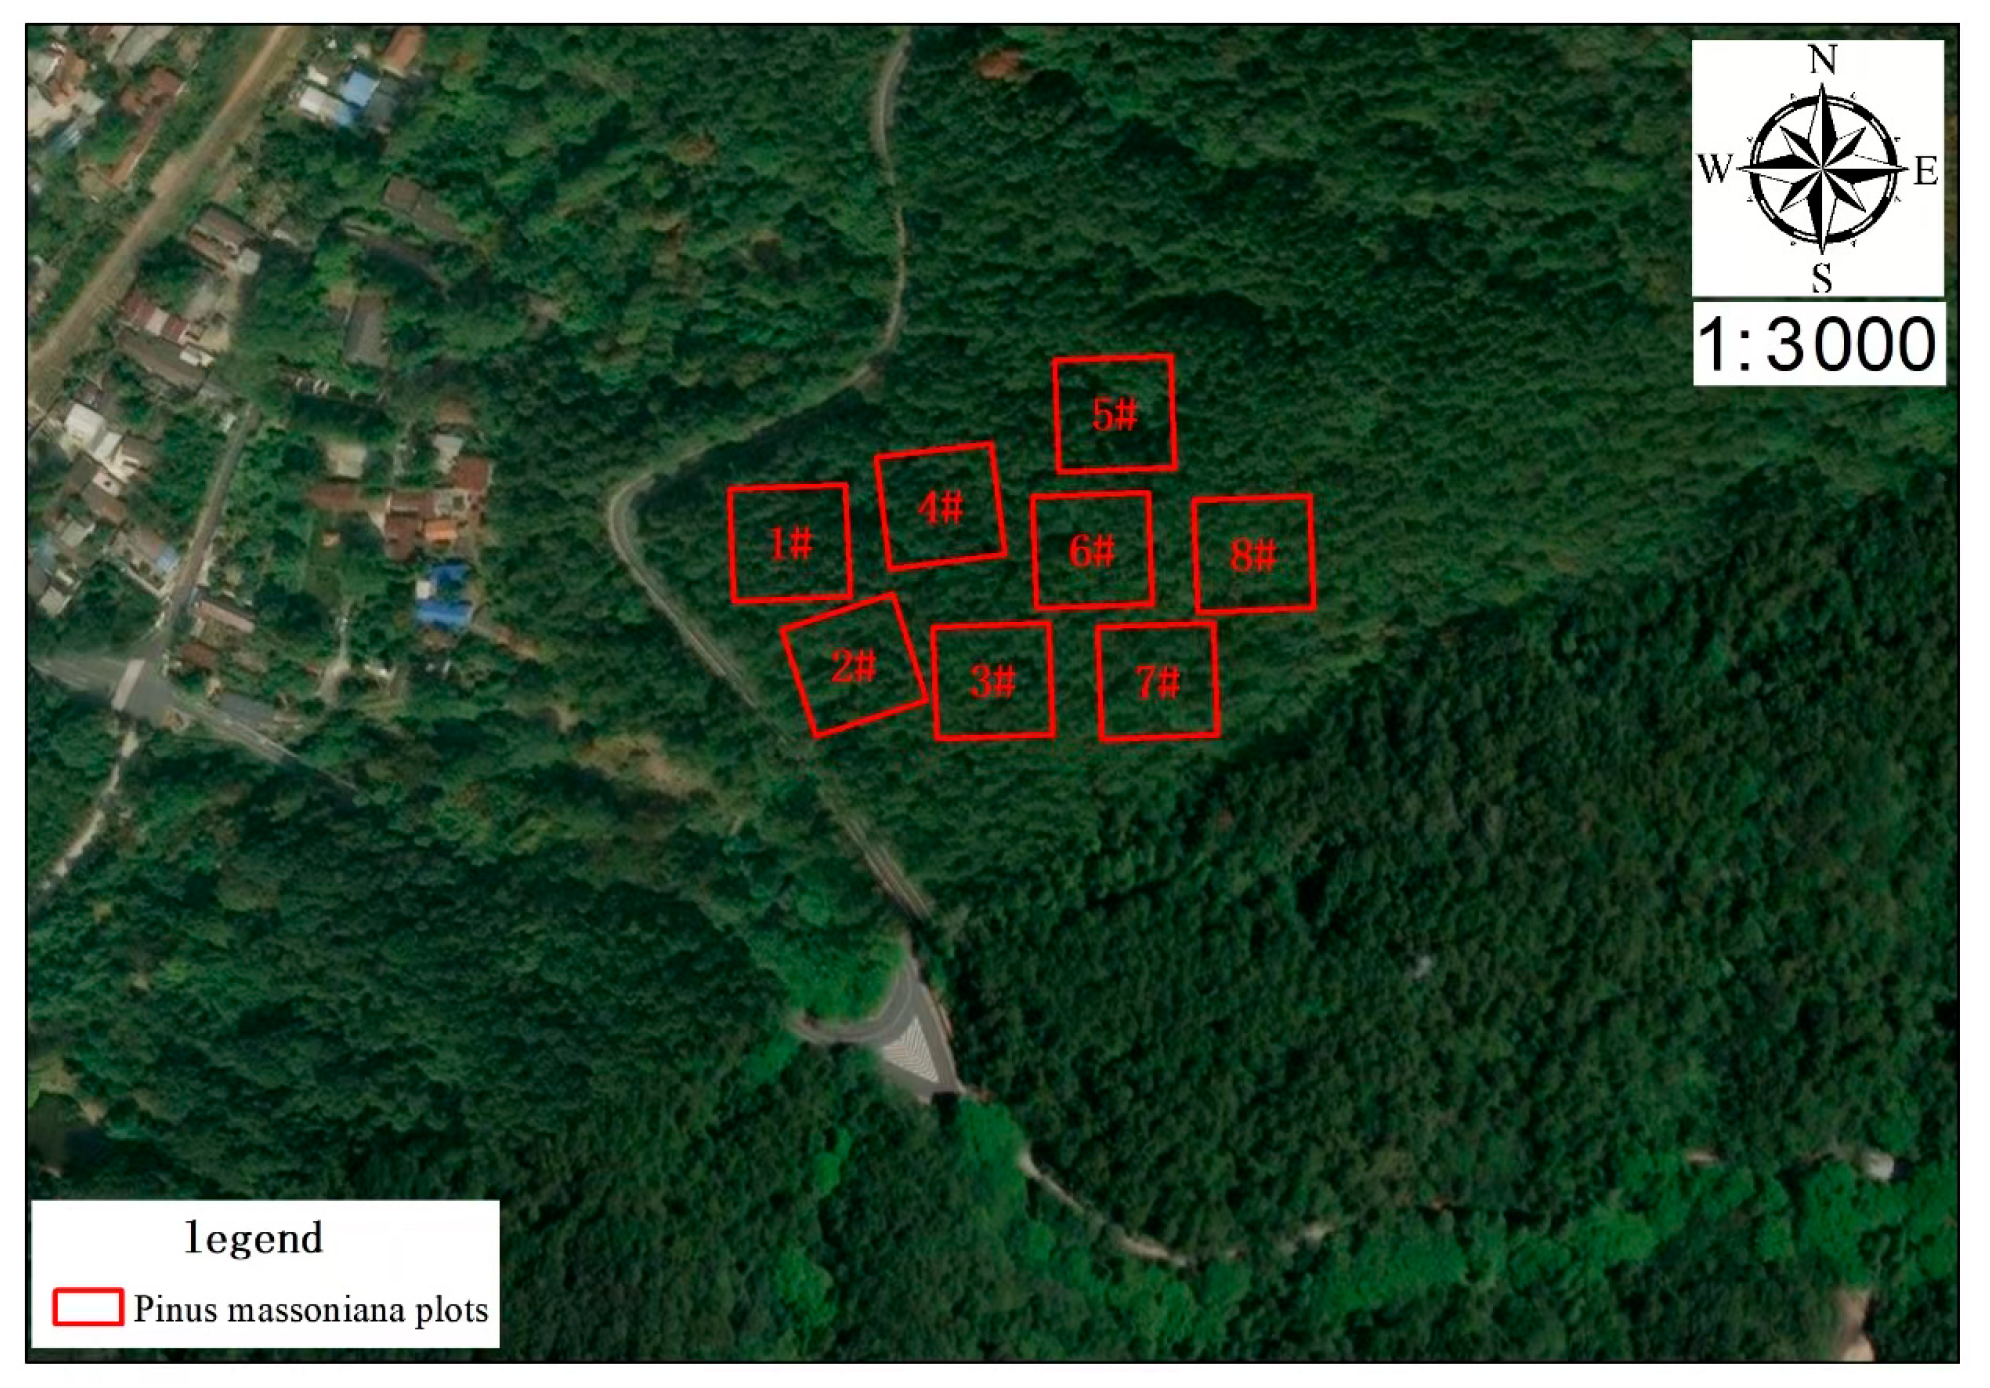
Figure 1. The distribution map of Pinus massoniana plots in Jigong Mountain Nature Reserve.
Sustainability 17 07137 g001
Figure 2. Annual climate change in Jigong Mountain Nature Reserve from 1951 to 2023.
Sustainability 17 07137 g002
Figure 3. Heatmap of variables’ importance for each method.
Sustainability 17 07137 g003
Figure 4. MSE for different bs-k combinations of each variable.
Sustainability 17 07137 g004
Figure 5. GAM fitting results between each variable and BAI: (a) Age; (b) Annual Precipitation; (c) Tmean; (d) Tmax; (e) Tmin; (f) elevation; (g) Competition Index; (h) slope; and (i) soil thickness.
Sustainability 17 07137 g005aSustainability 17 07137 g005b
Table 1. Data statistics of tree age and plot information.
VariablesMeanStandard DeviationMaxMin
Age/a52.47011.32069.00025.000
Elevation/m217.90012.032240.000203.000
Slope/°29.3007.43940.00020.000
Soil Thickness/dm6.5601.4389.0005.000
Table 2. Data statistics of the climatic variables.
VariablesMeanStandard DeviationMaxMin
Annual Mean Temperature (Tmean)/°C15.5400.78017.77014.100
Annual Max Temperature (Tmax)/°C37.4801.38041.11034.400
Annual Min Temperature (Tmin)/°C−8.9303.410−2.700−20.000
Annual Precipitation/mm1116.220259.2901653.790494.300
Table 3. The importance of each variable evaluated by different methods.
FeaturePCA-PCArPCA-PCAlRDABRTRFXGBoostAvgImportance
Age0.2590.0710.4290.3540.3960.1330.274
Annual Precipitation0.1830.1180.0510.0320.0210.0450.075
Tmean0.2140.0720.0420.0610.0640.0790.088
Tmax0.0470.1210.0860.0290.0370.0640.064
Tmin0.1350.1290.0200.0110.0130.0260.056
Slope0.0730.1270.0900.0320.0480.1240.082
Elevation0.0570.1150.1010.0220.0200.1550.078
Soil Thickness0.0010.0820.1510.0600.0510.1960.090
Competition Index0.0310.1660.0310.3990.3500.1780.193
Table 4. Optimal parameter combinations for each variable.
VariableBSKMSE
AgeTP780.805
Annual PrecipitationCR7104.165
TmeanTP591.610
TmaxCR7103.073
TminCR7101.542
ElevationCR7103.138
Competition IndexTP798.972
SlopeTP7101.867
Soil ThicknessTP7102.994
Table 5. Results of GAM fittings of each variable to BAI.
VariableEDF p F R 2 Deviance Explained/%
Age5.278<0.001170.4520.24424.53
Annual Precipitation5.486<0.00112.3950.0252.64
Tmean3.894<0.001124.7550.14114.26
Tmax5.567<0.00118.5220.0343.53
Tmin5.312<0.00126.6890.0495.11
Elevation5.12<0.00118.970.0333.51
Competition Index5.863<0.00140.3410.0727.33
Slope5.766<0.00125.3530.0464.76
Soil Thickness5.849<0.00118.6650.0353.68
Table 6. Estimated optimum values and 95% confidence intervals of GAM response curves for each variable.
VariableOptimum (X)Max BAI95% CI for BAI
Age6924.21120.726–27.697
Annual Precipitation1653.7920.0517.058–23.041
Tmean16.9620.10219.233–20.971
Tmax41.1115.22711.056–19.398
Tmin−2.720.79718.845–22.750
Elevation211.5515.95314.972–16.934
Competition Index0.2719.80918.636–20.982
Slope26.2315.74314.780–16.706
Soil Thickness6.8919.51117.685–21.337
Disclaimer/Publisher’s Note: The statements, opinions and data contained in all publications are solely those of the individual author(s) and contributor(s) and not of MDPI and/or the editor(s). MDPI and/or the editor(s) disclaim responsibility for any injury to people or property resulting from any ideas, methods, instructions or products referred to in the content.