1. Introduction
In the context of global efforts to address climate change and China’s “dual carbon” goals, China has introduced tradable green certificate (TGC), green power trading and carbon emission trading (CET) as important market mechanisms to promote the green and low-carbon transformation of energy. Among them, CET policy is a market-oriented environmental policy tool aimed at reducing greenhouse gas emissions, particularly CO2 emissions, through market mechanisms. The government sets an overall carbon emission target and allocates carbon emission allowances to emission entities. These entities can freely buy and sell these allowances in the market according to their actual operational conditions, thereby turning them into valuable assets. The TGC policy involves electronic certificates issued by the National Energy Administration, which represent the environmental attributes of 1000 kWh of renewable energy electricity. These certificates serve as the sole proof and consumption voucher for the environmental attributes of renewable energy power. The buyer and seller only trade the green certificates, which are not tied to physical electricity. Green power trading refers to a type of electricity trading where the subject matter is green power and its corresponding environmental value. The traded electricity is accompanied by green certificates to meet the needs of power generation enterprises, electricity sales companies, power users, and other parties in selling or purchasing green power. Green power trading requires a physical grid connection between the two parties involved in the transaction. While these three markets are independent and perform different policy functions, they also interact with each other to some extent [
1,
2].
Electricity-CET-TGC markets are becoming the core pathway for promoting energy green transformation and achieving economic sustainability. In recent years, China has introduced various policies to promote the deep integration of the green electricity market, CET market and TGC market, such as improving the link between green certificates and carbon accounting mechanisms, establishing channels for green certificates to interact with the voluntary emission reduction market, promoting the high-quality development of the TGC market, and strengthening the connection between green certificates and the renewable energy electricity consumption guarantee mechanism and carbon emission accounting [
3,
4,
5,
6,
7,
8,
9,
10]. However, the complexity of market synergy means that generators, grid companies, electricity users and load aggregators face challenges such as differing transaction rules and inefficient value transmission.
In this context, exploring the trading strategies of multiple subjects in the synergy of the electricity-CET-TGC markets holds significant practical significance. The resources, risk preferences, and interests of different stakeholders are different, and their trading behaviour not only affects their own economic efficiency, but also the overall efficiency of market resource allocation and the achievement of emission reduction targets. How to formulate a scientific and reasonable trading strategy in an environment where policy constraints and market opportunities coexist, to achieve a win-win situation for economic and environmental benefits, is a key issue that needs to be solved.
The current literature mainly focuses on three areas: the synersystic mechanism design of the electricity-CET-TGC markets, the electricity-CET-TGC markets research model, and the electricity-CET-TGC markets’ multi-agent trading strategies.
In terms of the design of the electricity-CET-TGC markets, study [
11] proposes a two-layer game-based dispatch model for the electricity-CET market, analysing the electricity–CET market interaction mechanism by treating the CET market as a series of transactions with the same time scale as the electricity market. Study [
12] proposes a mixed-generation group’s participation in the electricity-CET market through a year–week–day multi-scale coupled decision-making mechanism and optimisation model. The multi-market decision-making process was simulated, and the feasibility of the decision model was verified, proving the effectiveness of the electricity-CET market and CET as an economic means for power groups to achieve low-carbon development. Study [
13] establishes a TGC-TGC equivalent interaction mechanism, which converts the TGC corresponding to 1 MWh green power into a fixed amount of carbon emission reduction and directly participates in CET market. In addition, to simultaneously addresses the attack issues and reward distribution fairness problems in the traditional proof-of-stake consensus mechanism, effectively promoting renewable energy trading, study [
14] proposes a TGC-CET markets joint incentive mechanism based on blockchain, which incentivises market participants to engage in renewable energy product trading. Study [
15] systematically reviews carbon reduction pathways for power generation, grid, load, and storage from both technological and policy perspectives, proposing a multi-level integrated energy system architecture. It evaluates key technologies such as backpressure regulation, flexible DC transmission, and virtual energy storage to enhance energy efficiency and reduce carbon emissions. Study [
16] develops an integrated forecasting framework combining macro-market models with regional market models to predict China’s carbon price trends from 2025 to 2026, while examining inter-regional heterogeneity and synergistic impacts with electricity markets. Study [
17] further analyses spatiotemporal variations in carbon allowance prices, focusing on their fluctuation patterns and spatial distribution, particularly regional differences in carbon market prices. A Vector Autoregression (VAR) model is constructed to empirically assess the dynamic impact of carbon emissions on carbon prices and related feedback effects.
The theoretical basis of the electricity-CET-TGC synergy research model mainly involves market equilibrium theory, system dynamics theory, and multi-agent game theory. The multi-agent game theory is widely used to analyse the decision-making behaviour of various market participants and their interactions. In terms of market equilibrium theory, study [
18] constructs a multi-electric producer—electric consumer—carbon transaction game model that considers the electricity-CET synergy mechanism. It uses Walrasian general equilibrium theory to solve for the electricity-CET markets synergy equilibrium price and reveals the mechanism by which the electricity-CET synergy mechanism affects the market equilibrium price and social welfare. In terms of system dynamics, study [
19] uses system dynamics theory to build an electricity-CET markets dynamic interaction mechanism model, showing that carbon prices are transmitted to market participants through generation costs.
Furthermore, regarding multi-level collaborative optimisation, study [
20] proposes a two-stage bi-level clearing model for the electricity-CET market. In this model, the upper layer aims to maximize the total profit of the coal-fired power system and renewable energy units, while the lower layer targets the minimization of total electricity purchase cost. The research results show that the proposed model can significantly reduce carbon emissions, increase the grid-connected capacity of renewable energy, and optimize the power generation structure of the coal-fired power system.
Regarding multi-agent game theory, study [
21] establishes a multi-power plant game with differentiated dynamic carbon emission characteristics in a dual-layer equilibrium model of the electricity market and the CET market and proposes a mechanism that combines interaction with other industries to further enhance the electricity-CET market’s synergistic effect. Study [
22] presents a dual-layer game model of the electricity-CET coupled markets in the trading modes of bilateral negotiation and centralised auction. It proposes a framework for the day-ahead electricity-CET coupled markets and uses MATLAB 2021a to perform simulation analysis and scheme comparison, verifying the feasibility of the optimal pricing strategy and dynamic carbon price mechanism. Study [
23] constructs a dynamic computable general equilibrium (CGE) model to explore the impact of carbon price and electricity market liberalisation on China’s sustainable energy transition. The results show that electricity market liberalisation improves the efficiency of carbon price by eliminating price distortions, boosts GDP, and reduces emission reduction costs. Study [
24] identifies the key points of fluctuations in CET and electricity markets through an analysis based on the EU coupling and coordination model and uses the GPT large-scale model to analyse the policy factors that have a significant impact on transactions in CET and electricity markets. The research findings indicate that market regulation policies and expectation management policies have the most substantial impact on the coupling degree of CET and electricity markets, while the impact of secondary policies such as international cooperation policies and structural adjustment policies is relatively minor. Study [
25] establishes a dynamic coupled trading model integrating medium-to-long-term electricity market, spot market, and CET markets. The results demonstrate that the coordinated implementation of CET and TGC mechanisms enhances the electricity market’s adaptability to high renewable energy penetration. Study [
26] constructed an enterprise-level electricity–carbon model focusing on energy consumption and production processes. The validation tests revealed that the carbon model developed in this study exhibits advantages including high cost-effectiveness, frequent measurement frequency, and superior precision.
Regarding the research on multi-subject trading strategy under electricity-CET-TGC markets synergy, study [
27] constructs a wind and thermal power co-generation operation optimisation model under electricity-CET market coupling on the basis of considering the current distribution of power generation resource endowment and the market trading environment, and carried out a scenario analysis of market coupling implementation on the operation results, which was used to enhance the enthusiasm of each subject to participate in the synergistic operation. Study [
28] constructs a simulation model of green cooperative market behaviour of multiple loads under the evolutionary optimisation of the new power system, and the decision-making process of multiple loads as well as the simulation process of the whole process of electricity market transactions, and the results show that the proposed model can effectively simulate the green cooperative market behaviour of multiple loads, improve the economic efficiency of multiple loads and the rate of new energy consumption, and enhance the ability of optimal allocation of resources in the new power system. Study [
29] proposes an optimal scheduling strategy for multi-energy entities considering the coupling of CET-TGC by constructing a multi-object optimisation operation model for energy operators, users, and load aggregators, which can significantly improve the operating economics of the system, optimise the electricity price in the electricity market, and enhance the benefits of TGC and CET. Study [
30] innovatively selects governments, developers, and construction enterprises as game participants to construct an evolutionary game model of three-party participation in carbon emission reduction from a carbon trading perspective. Study [
31] explores the synergistic impact of CET and market participants on green innovation, demonstrating that CET drives corporate green innovation mechanisms and exhibits synergistic effects between CET and market participants in promoting corporate green innovation.
Additionally, in terms of the trading strategies of power source–grid–load–storage market entities, study [
32] constructs a multi-subject model of wind power, photovoltaic, controllable distributed power, energy storage and flexible loads, analyses the correlation between carbon price changes and wind and solar consumption rate, carbon emissions and revenue, and further explores the impact of carbon sink resource trading on power price, output and energy demand change rate. Study [
33] proposes a cost–benefit analysis method for multiple market players under demand response and coupled electricity-CET market, and constructs a cost–benefit analysis model for the generation side, customer side, load aggregator, energy storage operator and grid side, which shows that the CET market operation will raise the electricity market clearing price, and affect the costs and benefits of the relevant players. Study [
34] proposes a source–grid–load–storage collaborative planning method that considers electricity-CET coupling and flexibility supply-demand balance, and analyses the flexibility supply capacity of the flexibility resources in the power system, which is conducive to the source-grid-load-storage collaborative planning work. Literature [
35] constructs a green power trading model with the objective function of maximising the joint system benefits, showing that the benefit allocation can effectively improve the benefits of the energy storage system, promote the joint participation of wind-solar-storage in green power trading, and promote the realisation of the green electricity value. In the research with different policies as variables, study [
36] the virtual power plant is placed in the electricity-CET markets coupling scenario, and the multi-agent collaboration between VPP and renewable energy generators, load aggregators and carbon trading institutions is described. Study [
37] constructed a multi-agent game model coupled with electricity-CET-TGC markets, and took power generators as the decision-making subject to study their optimal bidding strategies under different policy combinations.
From the above analysis, it is found that the existing research mainly focuses on the behavioural decision-making of the power generation side, customer side, load aggregator, energy storage operator, and grid side under the coupling of the electricity and CET market, while the design of the electricity-CET-TGC synergistic mechanism and its impact on the trading strategies of the thermal power plant operators, renewable energy vendors, power users and load aggregators have not been explored in depth. In order to achieve the dual carbon goals and promote the large-scale consumption of green power, there is an urgent need to design the electricity-CET-TGC synergy mechanism and analyse its impacts on the source–network–load side and the operation of the power system. Therefore, this paper systematically analyses the composition and relationship between the main players in the electricity-CET-TGC markets and designs the electricity-CET-TGC synergy mechanism, based on which it constructs the optimal profit model for thermal power plant operators, renewable energy manufacturers, power grid enterprises, power users and load aggregators under the electricity-CET-TGC synergy, and analyses the behavioural decision-making of the main players in the electricity-CET-TGC synergy as well as the power system, thereby optimising the transactions of the main players. This will provide theoretical support and policy guidance for the promotion of low-carbon transformation of energy structure and the realisation of dual-carbon and sustainable development goals.
The structure of this paper is as follows:
Section 2 introduces the composition and characteristics of market trading entities and designs the coupling mechanism of the electricity-CET-TGC markets.
Section 3 constructs the optimal profit models for market entities under the synergy of electricity-CET-TGC markets.
Section 4 presents the analysis and discussion of numerical simulation results.
Section 5 provides conclusions and policy recommendations.
2. Design of the Coupling Mechanism for the Electricity-CET-TGC Markets
The main participants in the electricity-CET-TGC markets include power generators, power grid enterprises, power users, and load aggregators. The characteristics of each participant are as follows:
2.1. Composition and Characteristics of Market Participants
The green power market transaction modes are mainly divided into two types: “point-to-grid” and “point-to-point.” Under the “point-to-grid” transaction model, power grid enterprises assist power users in purchasing electricity from power generators on their behalf, while relying on independent energy storage systems for electricity scheduling. In the “point-to-point” transaction model, power users can negotiate contract prices directly with power generators for electricity purchase. In addition to power generators, power grid enterprises, and power users, load aggregators also play a significant role. When facing demand response, load aggregators can integrate scattered demand response resources to participate in the operation of the power system and sign bilateral contracts with various market participants such as retailers, power generators, and system operators to generate revenue.
- (1)
Power generators
Power generators are industrial enterprises whose primary business is electricity generation, including thermal power plant operators using fossil fuels and renewable energy manufacturers producing green power. Power generators generate revenue through electricity production and sales. Among them, thermal power plant operators, due to the stability of their electricity generation and the inherent pollution associated with their operations, are often used as auxiliary energy sources during peak-shaving periods. As a result, they may receive certain subsidies in the form of coal-based power capacity fees.
- (2)
Power grid enterprises
Power grid enterprises are responsible for the transformation, transmission, and distribution of electricity, as well as the daily management of the power system. They generate profits by transmitting electricity produced by power generators to power users, while also bearing some of the network loss costs. Due to the volatility of renewable energy, power grid enterprises can also utilise independent energy storage systems for electricity regulation and scheduling.
- (3)
Power users
Power users refer to entities or devices that consume electrical energy within the power system, including agricultural production, residential living, general industry and commerce, and large industrial users. Power users can purchase electricity through power grid enterprises, paying the retail electricity price as well as transmission and distribution fees. They may also enter into power load agreements with load aggregators or negotiate electricity prices directly with power generators for transactions. In addition, power users can participate in demand response programs, adjusting production schedules to achieve corresponding economic returns. When power users are required to meet carbon compliance targets, they can fulfil carbon reduction tasks by purchasing carbon allowances, CCER, or green power. For power users who need to meet renewable energy consumption targets, this can be achieved by purchasing green certificates.
- (4)
Load aggregators
Generally, load aggregators are electricity retail companies or firms with qualifications as “Industrial Power Demand-Side Management Service Providers.” Load aggregators generate revenue through electricity sales and purchases by participating in the electricity market. During periods of high market demand, load aggregators can also earn income through demand response. They purchase electricity from power generators and sell it to power users, with demand response earnings shared between load aggregators and power users according to a fixed ratio. Load aggregators can also supply electricity through renewable energy generation methods, such as solar power or wind power.
2.2. Design of the Electricity-CET-TGC Markets Coupling Mechanism
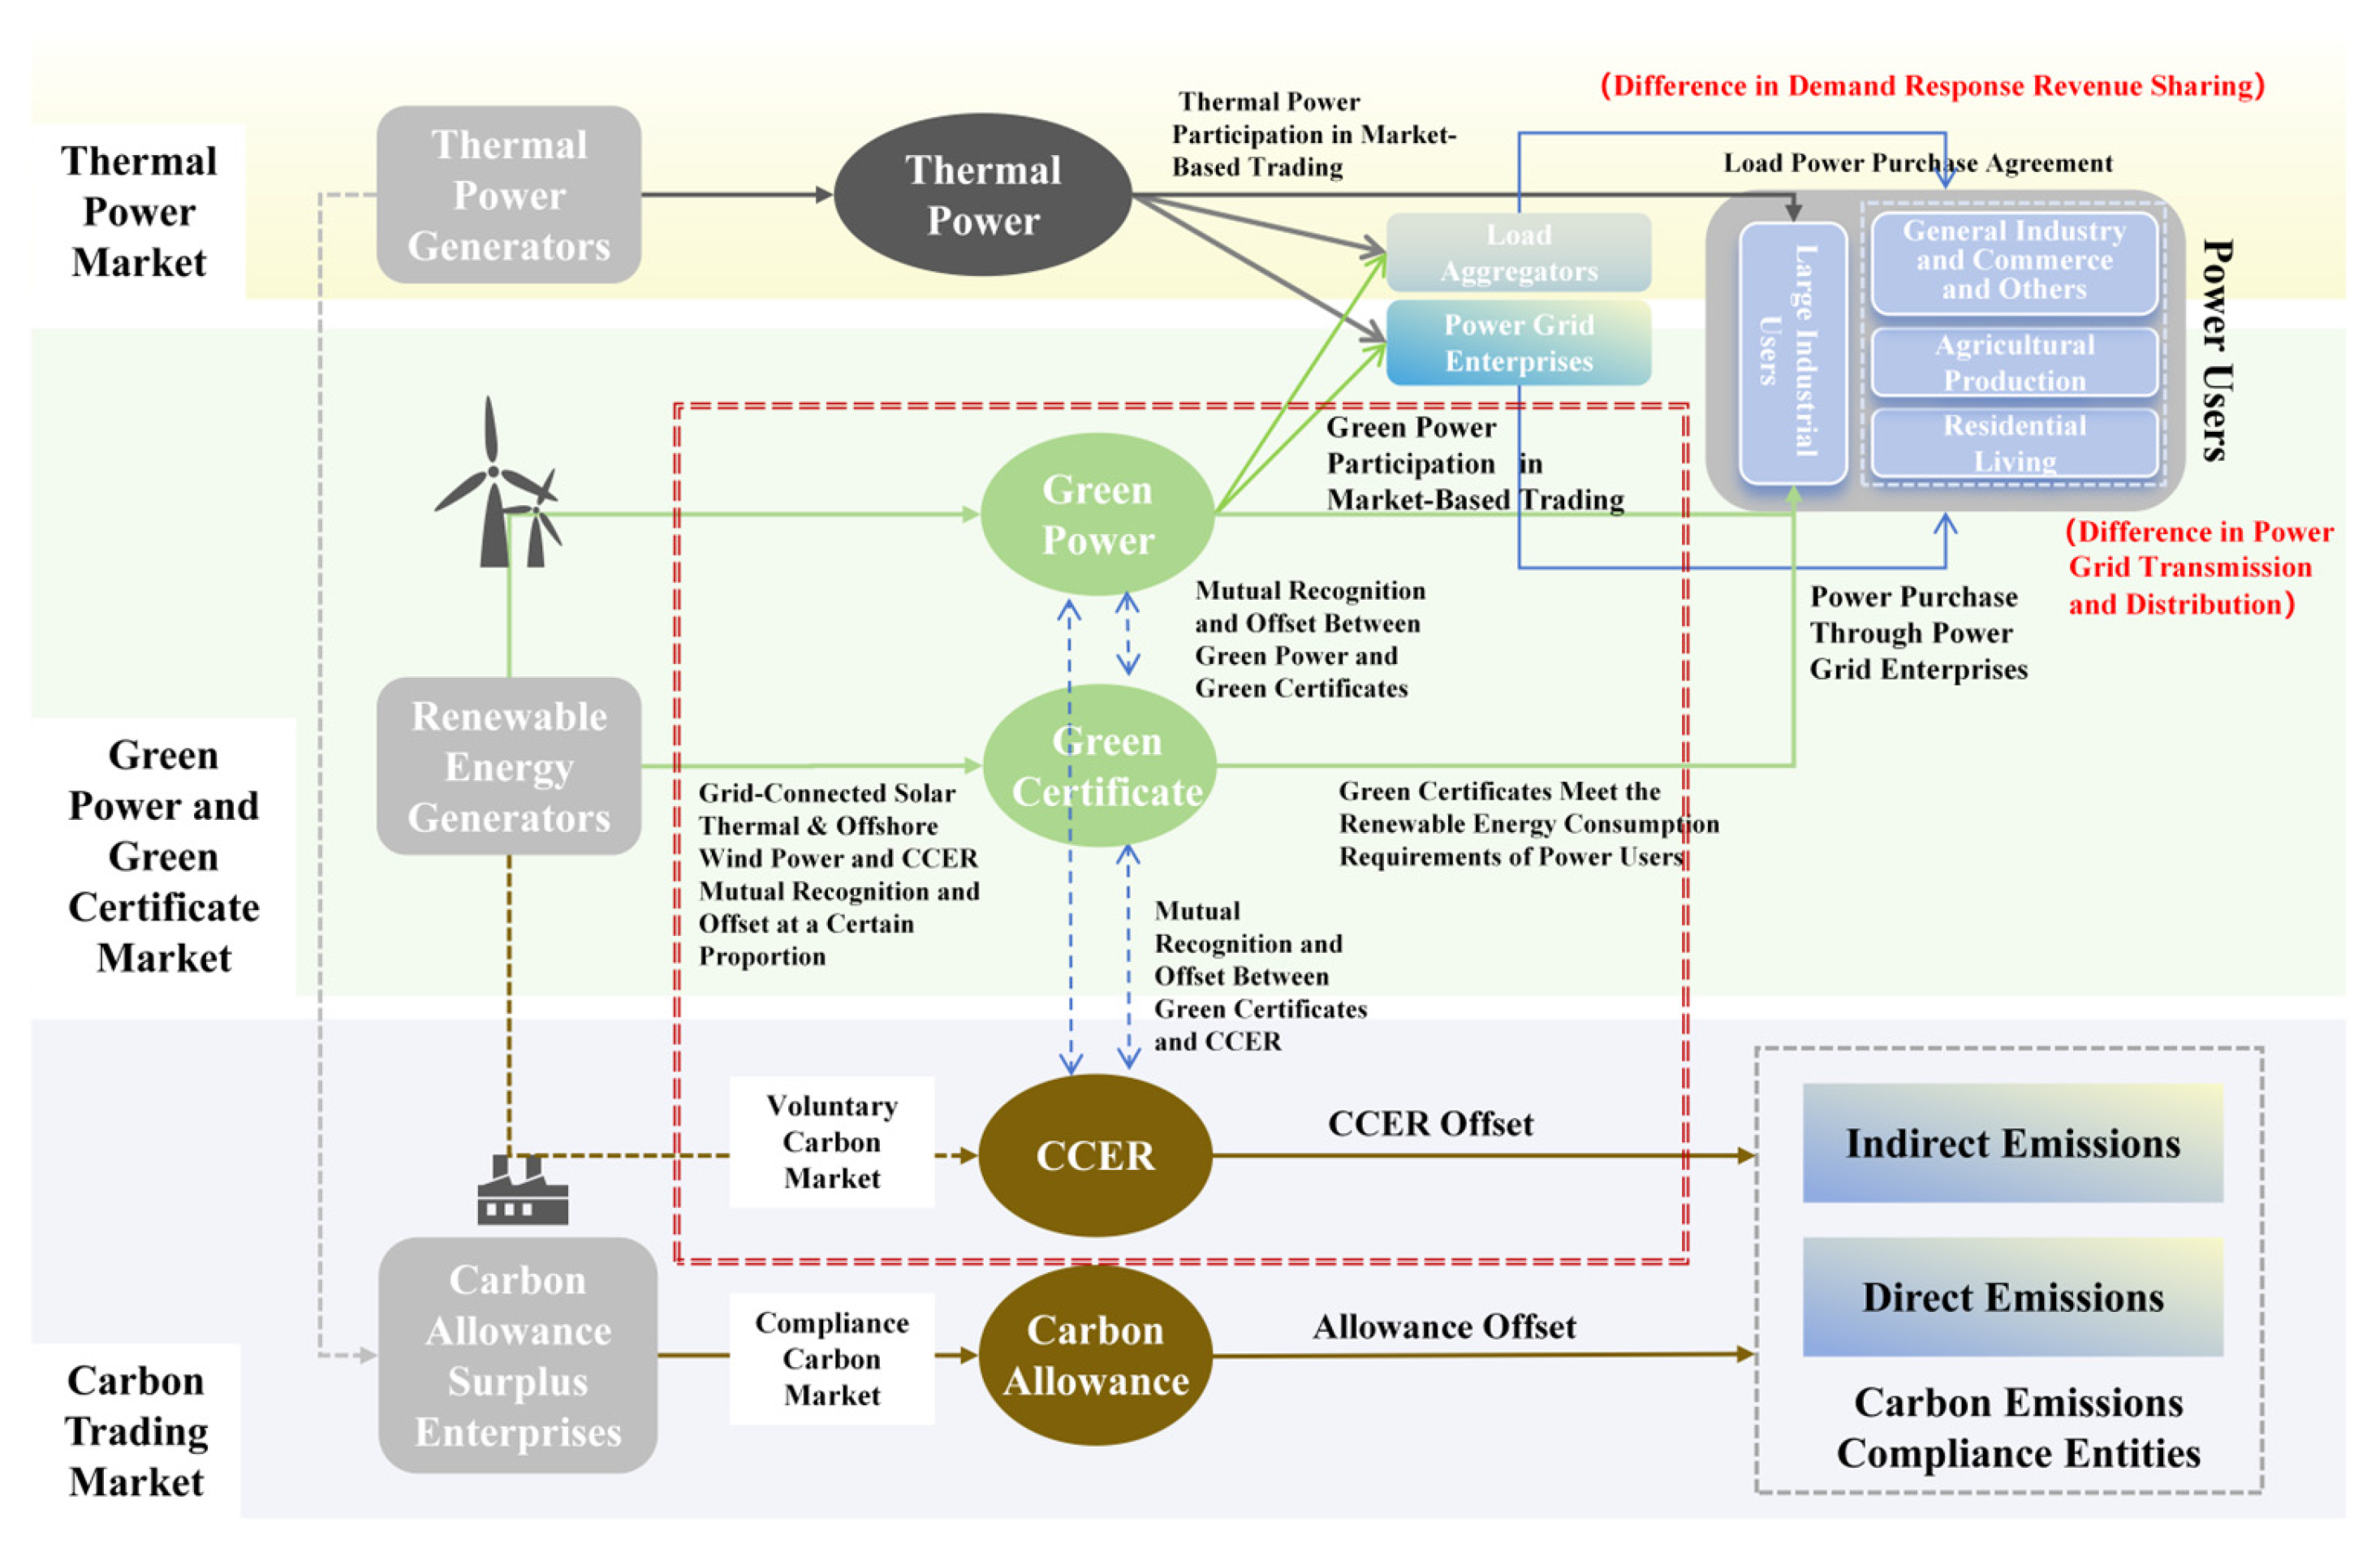
The coupling mechanism between the green power market, CET mechanism, and TGC market is illustrated in
Figure 1. Power generators include both green power manufacturers and traditional energy producers, while power users consist of large industrial users, agricultural production, residential consumption, general industry and commerce, and other categories. The electricity produced by green power manufacturers can be directly traded in the market, exchanged for green certificates to help power users fulfil their renewable energy consumption obligations, or applied for conversion into China Certified Emission Reduction (CCER). To avoid double counting of environmental rights, the same green power cannot be used for both TGC conversion and CCER conversion, and can only be claimed for one or the other. Power grid enterprises are responsible for aggregating the demand of power users, purchasing electricity products, and registering demand information, such as electricity quantity and price, on the electricity trading platform. In addition, power grid companies can lease energy storage power stations to store electricity when there is a difference between electricity supply and demand curves. Furthermore, to better facilitate flexible electricity scheduling and respond to grid electricity demand, load aggregators, as emerging market participants, engage in electricity market transactions to generate revenue through the sale and purchase of electricity. During peak demand periods, load aggregators can also earn revenue through demand response. For power users, non-large industrial users can enter into power purchase agreements with load aggregators or buy guaranteed green power products from power grid enterprises. Large industrial users directly purchase either thermal power or green power from power generators. Additionally, power users can also participate in grid demand response programs to earn compensation.
The current market mechanism is developing in a coupled manner. Under the existing system, the circulation of green certificates has facilitated the coupling between the green power market and the TGC market. Grid-connected solar thermal and offshore wind power in renewable energy can apply for CCER, thus achieving the coupling between the green power market and the CET market. However, there is currently no clear coupling mechanism between the TGC market and the CCER market. This study innovatively adds a coupling mechanism between the TGC market and the CCER market based on the existing system, as shown in the red box in
Figure 1. We considered the impact of two dimensions—environmental rights duplication and exchange ratio range—to further constrain and clarify the coupling mechanism in this study. Green power generators in a certain region can only choose one of two methods for issuing green power: directly participating in green power transactions or exchanging green certificates. Market entities purchasing green power or green certificates must first meet the annual renewable energy power consumption responsibility weight ratio before considering exchanging green certificates for CCERs. The exchange ratio for green certificates to CCERs is set at a maximum of 5%, referencing the CCER carbon offset quota ratio.
4. Results and Discussion
Using an adaptive particle swarm-genetic optimisation algorithm, which combines the advantages of genetic algorithms in avoiding local optimal and particle swarm optimisation in rapid convergence, key parameters such as learning inertia weight coefficients, inertia weight decay rates, individual learning factors, and global learning factors are set. The dynamic update of particle mutation probabilities based on optimisation results is considered, ultimately yielding Pareto optimal solutions and determining the optimal trading strategies for each entity.
4.1. Behavioural Decision Analysis of Electricity Generators and Electricity Users in the Electricity-CET-TGC Markets
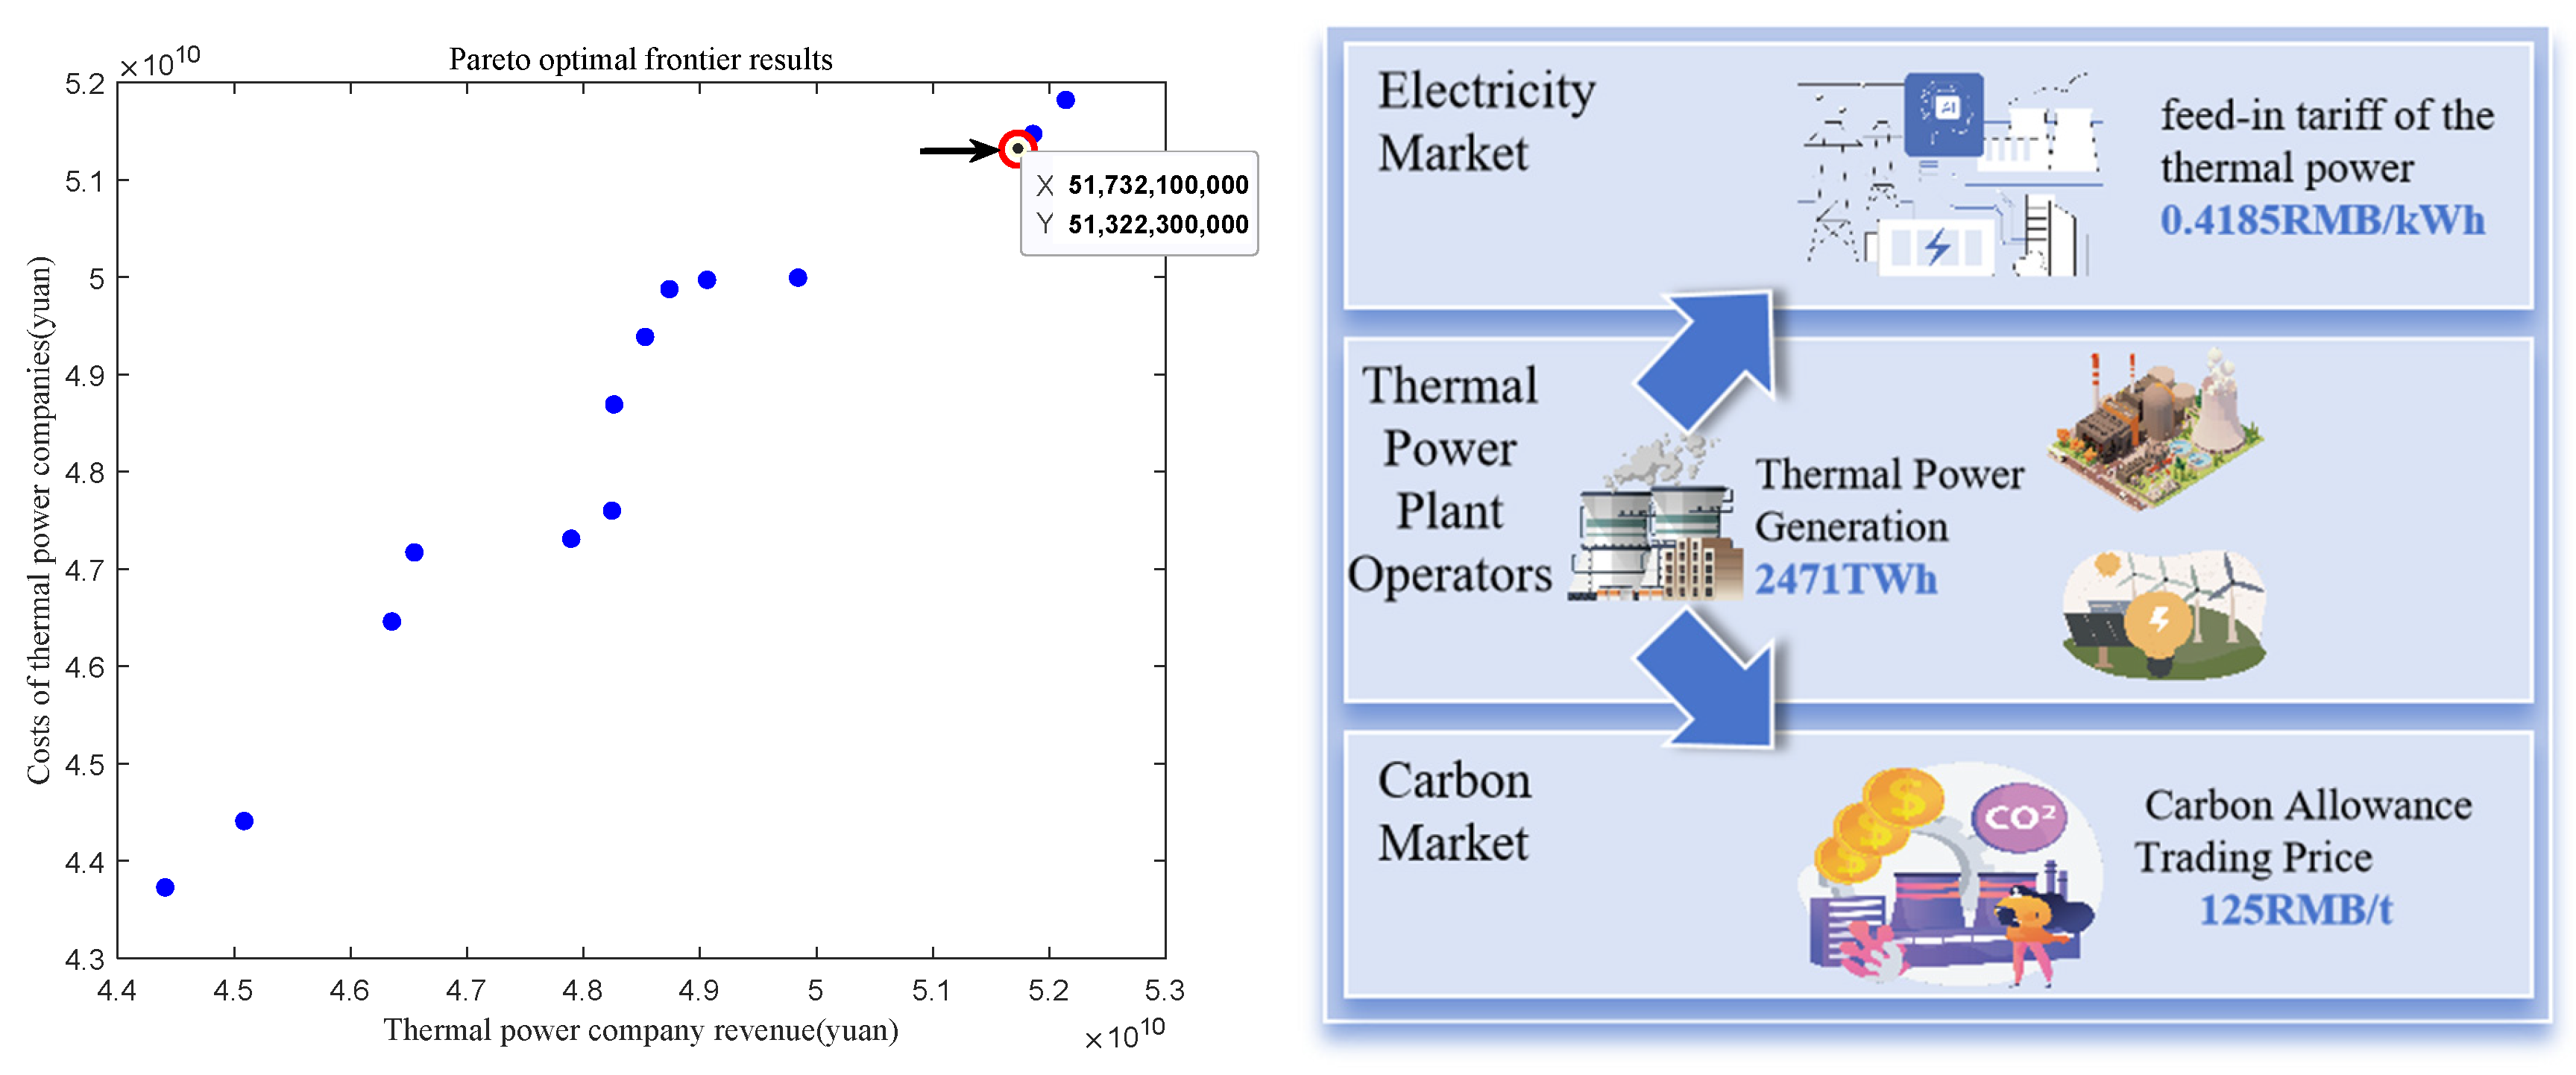
The optimal trading decision for thermal power generators is shown in
Figure 2. For thermal power companies, when the optimal point is achieved under the two objective functions of maximum power sales revenue and minimum cost, the thermal power tariff is 0.4185 RMB/kWh, the proportion of thermal power generation is 50%, the generation capacity is 247.1 billion kWh, and the carbon price is CNY 125/tonne. It can be seen that at high thermal power tariffs, high generation capacity, and high thermal power generation ratio, thermal power companies have higher earnings from electricity sales, while low carbon price levels make the cost of corporate carbon emissions lower, thus combining to make the most profit.
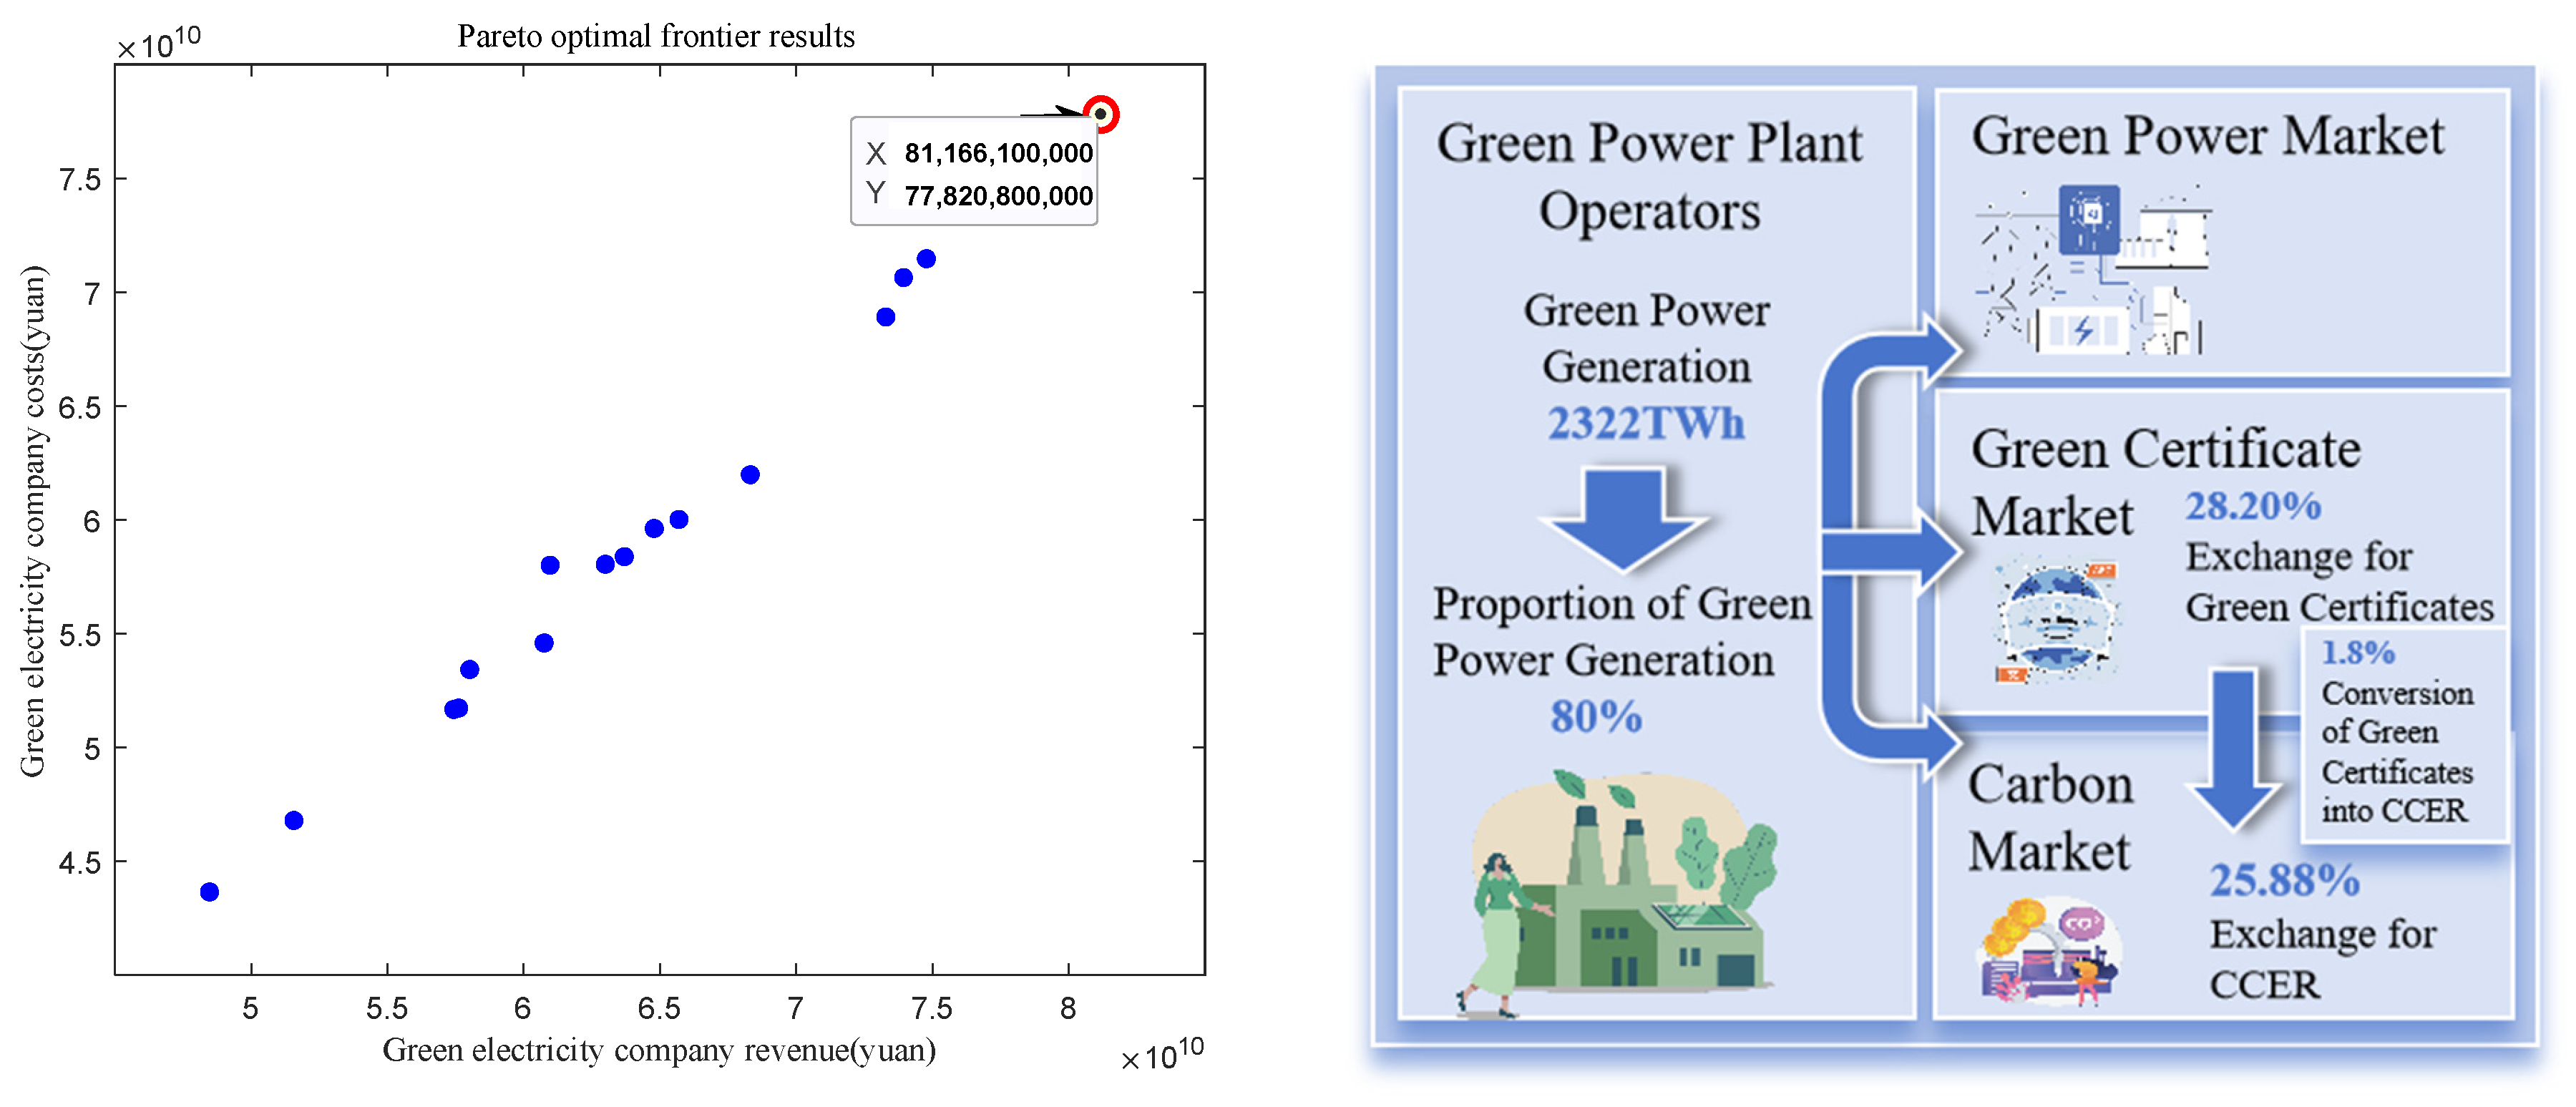
The optimal trading decision for the green power generator is shown in
Figure 3. For green power companies, when the optimal point is achieved under the two objective functions of power sales revenue and cost minimisation, the thermal power feed-in tariff is 0.3952 RMB/kWh, the green power generation ratio is 80%, the power generation capacity is 232.2 billion kWh, and the carbon price is CNY 258.86/tonne. This shows that the profit is the largest in the case of high green power generation ratio and high carbon price ratio. From the point of view of the specific trading purpose of the green power generated, 45.92% of it is used for direct trading, 28.2% of it is used for exchanging TGC, 25.88% of it is used for exchanging CCER, and 1.8% of it is used for exchanging TGC for CCER. It can be seen that at present the green power is mainly involved in the market-oriented trading directly, and the proportion of exchanging TGC and exchanging CCER is relatively flat in terms of mutual recognition of the environmental rights and interests of the products and swapping them out.
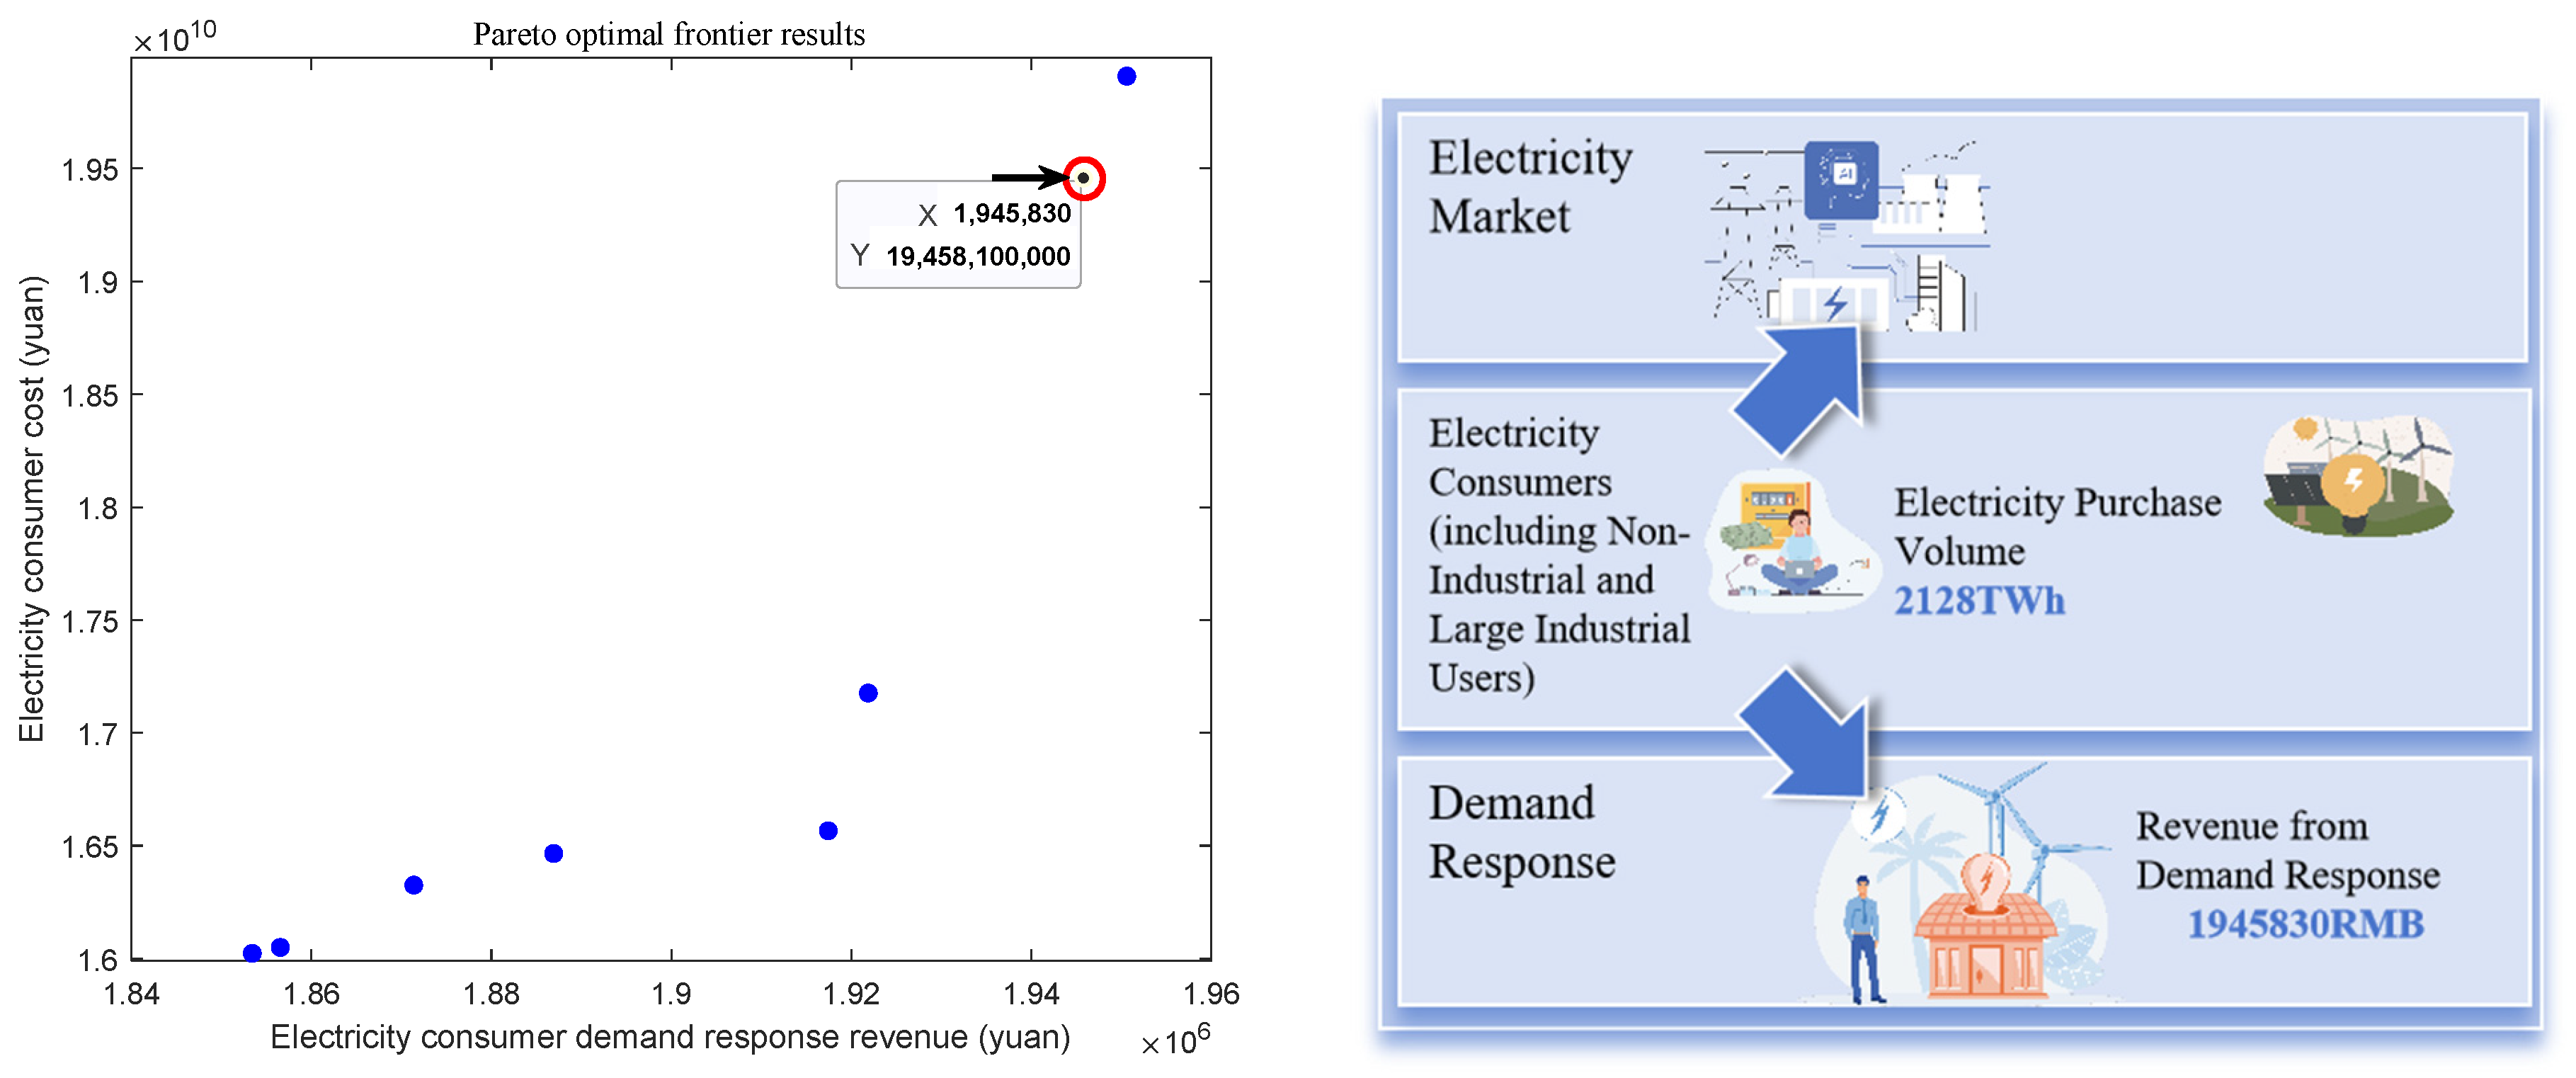
The optimal trading decision for electricity consumer is shown in
Figure 4. For electricity consumers, when the optimal point is achieved under the objective function of minimising the cost of power purchase, the thermal power feed-in tariff is CNY 0.4186/kWh, the proportion of green power generation is 56.1%, of which the proportion of purchased green certificates is 10%, and the amount of purchased power is 212.8 billion kWh. This is because the higher the thermal power feed-in tariff, the greater the demand response benefits, while the lower the proportion of green certificates purchased, the lower the amount of purchased power, and the smaller the cost to electricity users.
4.2. Decision-Making Analysis of Market Load Aggregator Behaviour in the Electricity-CET-TGC Markets
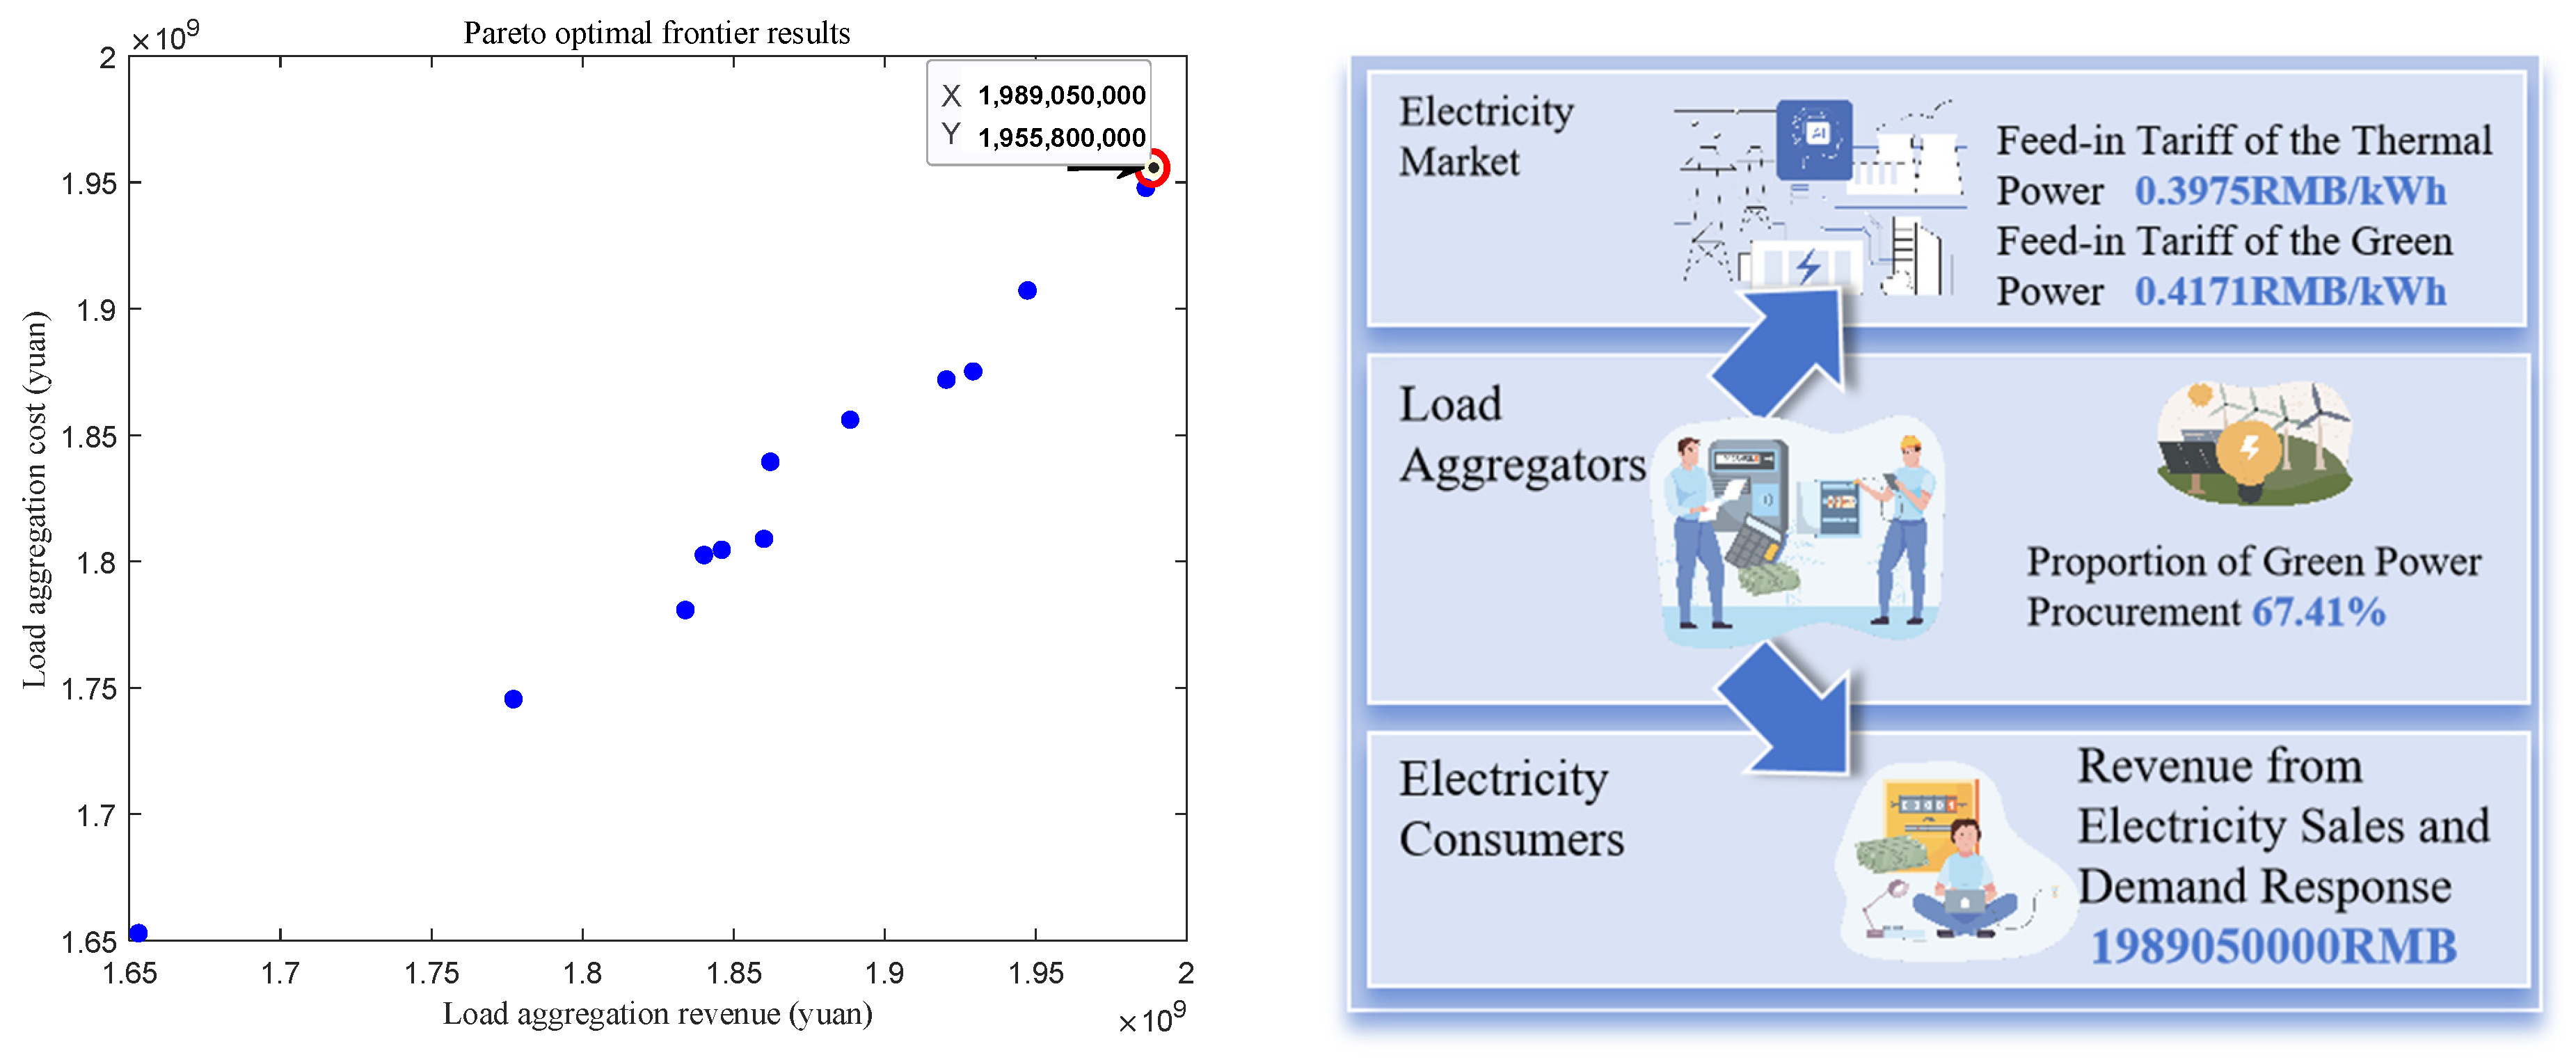
The optimal trading decision of the load aggregator is shown in
Figure 5. For the load aggregator, when it achieves the optimal point under the two objective functions of maximising demand response revenue and minimising cost, the thermal power feed-in tariff is CNY 0.3975/kWh, the proportion of green power generation is 67.41%, and the power generation capacity is 249.5 billion kWh. This is because the larger the generation capacity, the more electricity corresponding to the power purchase and sale contract with the load aggregator, and the larger the load aggregator’s gain from power sales, while the higher feed-in tariff also promotes the increase in demand response gain.
4.3. Behavioural Decision Analysis of Grid Companies in the Electricity-CET-TGCs Market
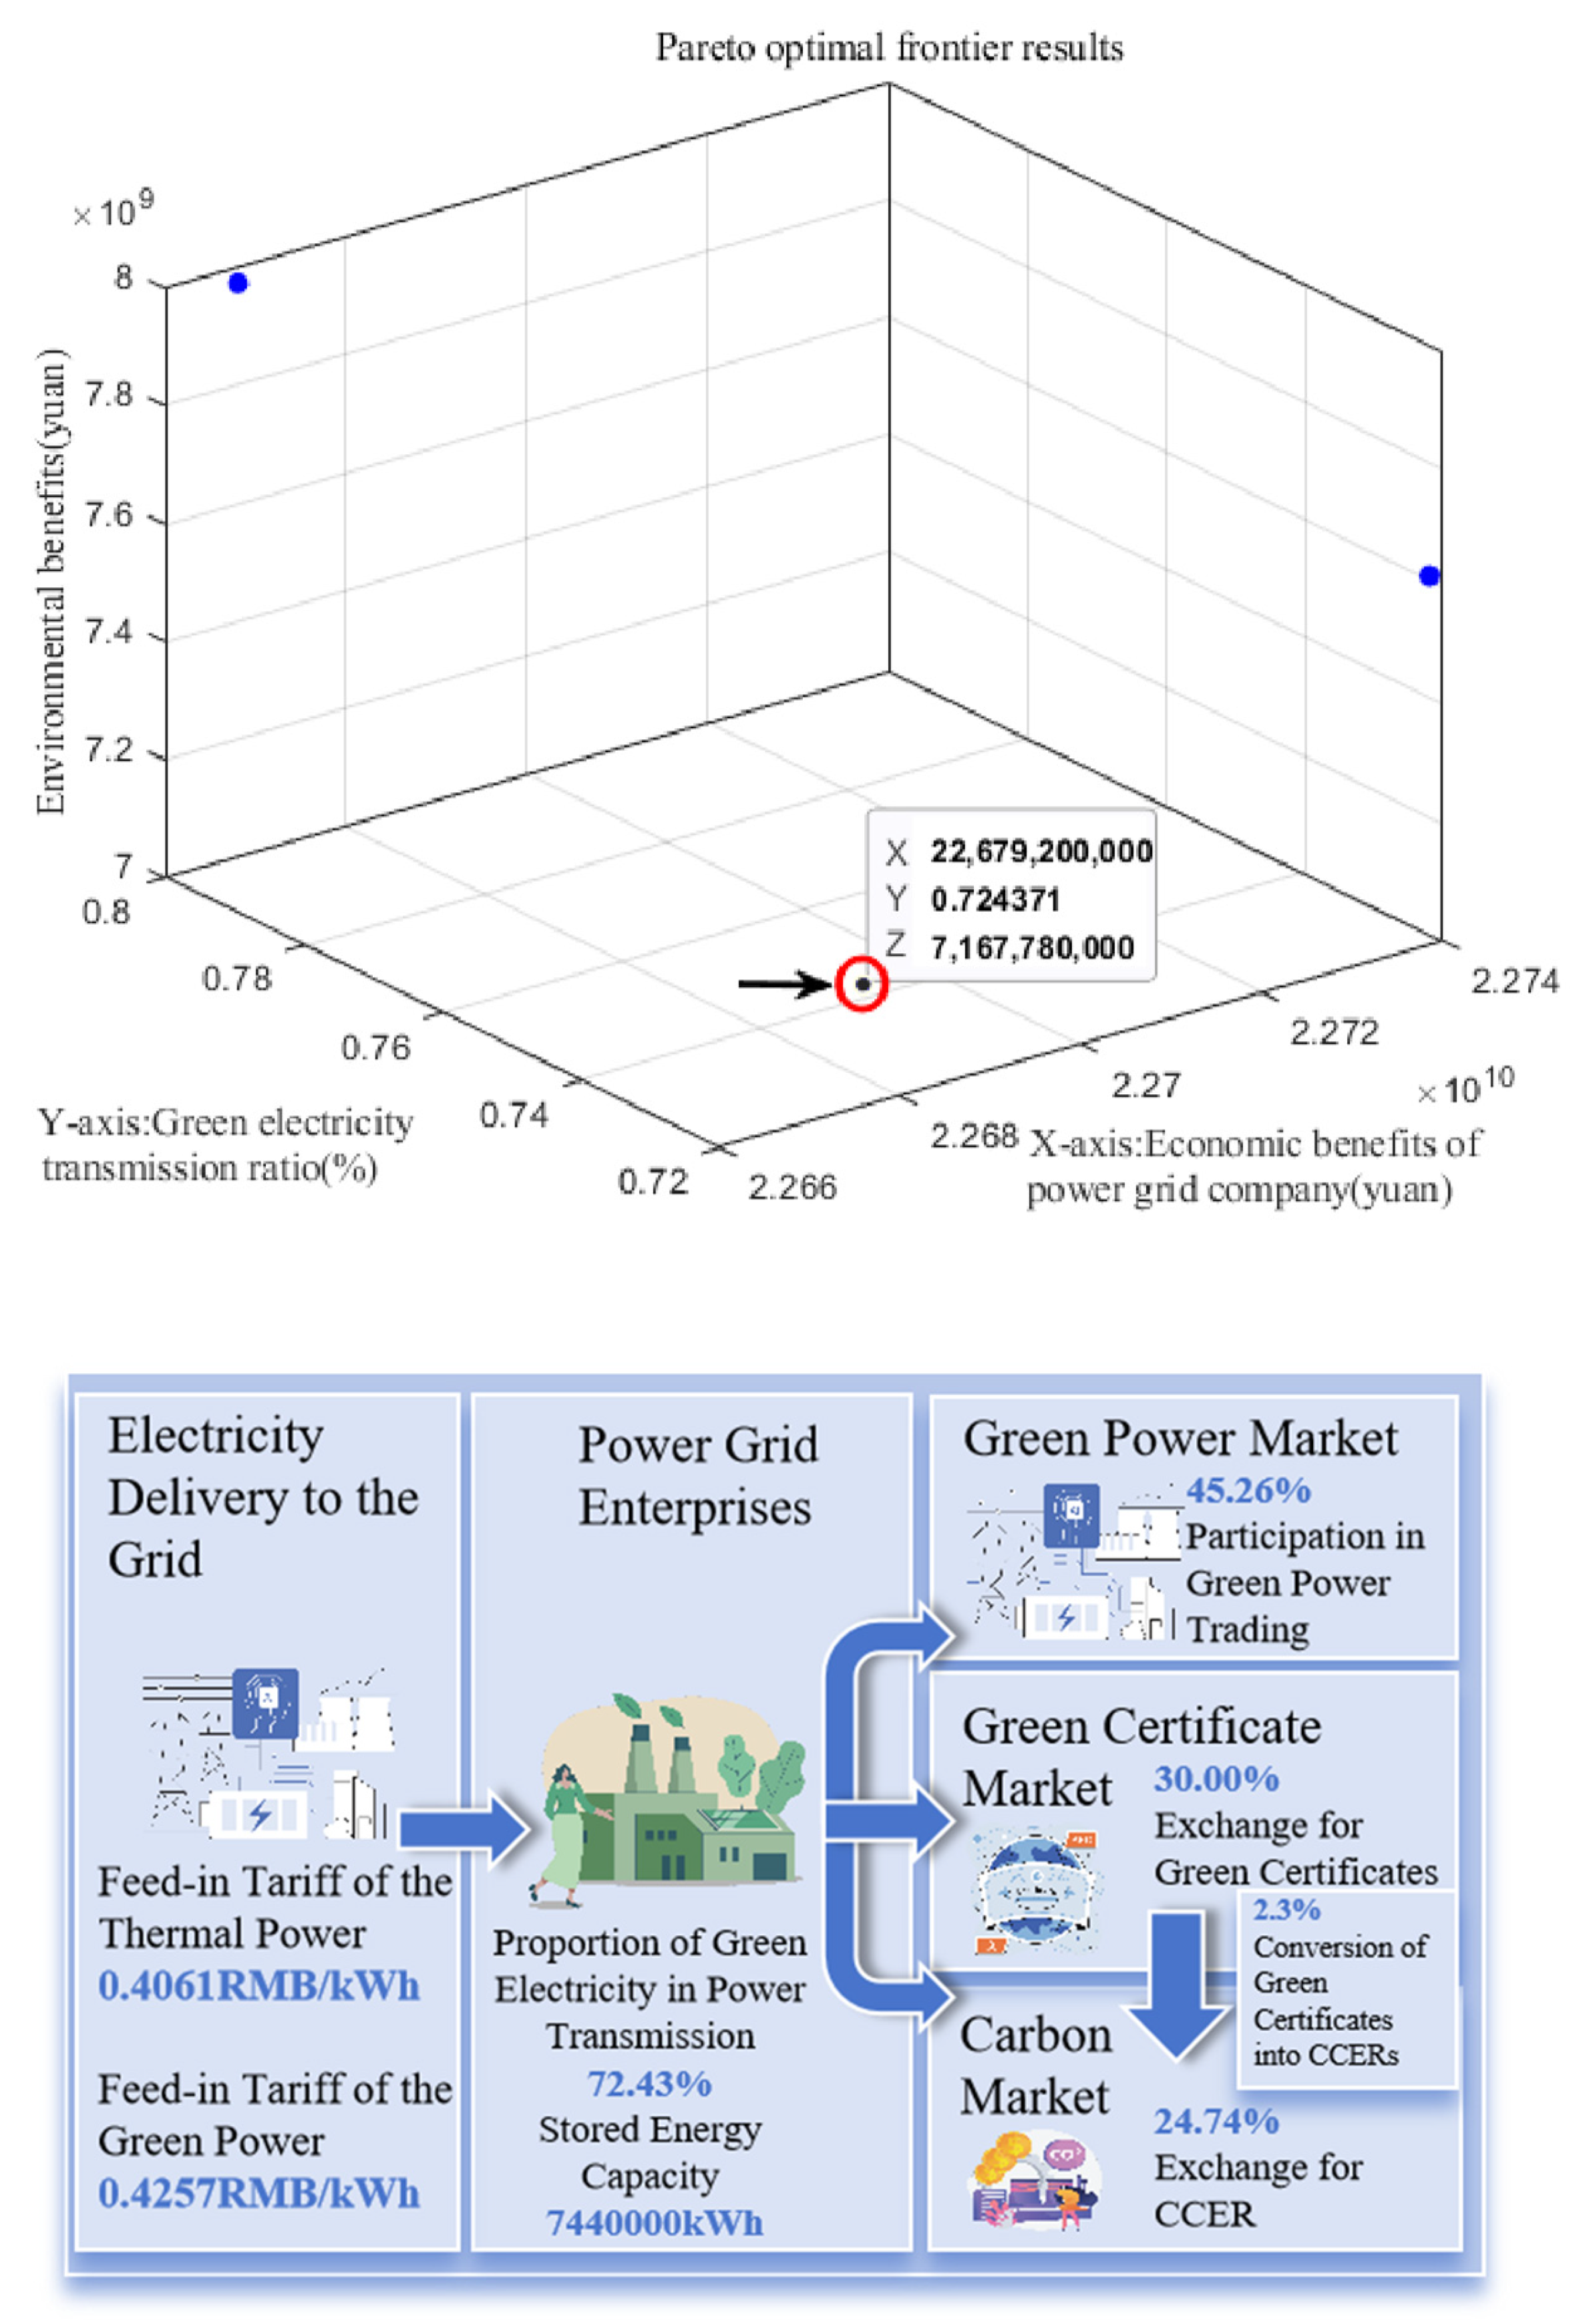
The optimal trading decision of the grid company is shown in
Figure 6. At this time, the profit of the power grid company is CNY 22.679 billion, the environmental benefit is CNY 7.167 billion, and the proportion of green power transport in the power grid company is 72.43%. This shows that the implementation of the energy storage power plant has a positive impact on both economic and environmental benefits under the goal of ensuring power structure transformation.
In terms of specific indicator values, the thermal power feed-in tariff at this time was CNY 0.4061/kWh, with 45.26 per cent of the green power generated being traded in the market, 30 per cent of the green power exchanged for green certificates, 24.74 per cent of the green power exchanged for CCER, and a proportion of 2.3 per cent of TGC exchanged for CCER, and with 7.44 million kW of the green power generated being used for storage, and the rest being purchased from the market. In terms of the way in which the green power generated participates in the market, the green power mainly participates in market-based transactions and slightly prefers to redeem TGC. This may be due to the fact that the proportion of green power redeemed for TGC is facilitated by the saturation of demand in the CCER market under the current price mechanism and market demand mechanism. In terms of the storage of electricity in independent energy storage power stations, the proportion of electricity stored in them reached 61%, which indicates that the utilisation rate of independent energy storage power stations is high, and that they are equipped to regulate the decision-making behaviour of the grid company’s power transmission and scheduling and have a positive impact on the grid company’s economic efficiency.
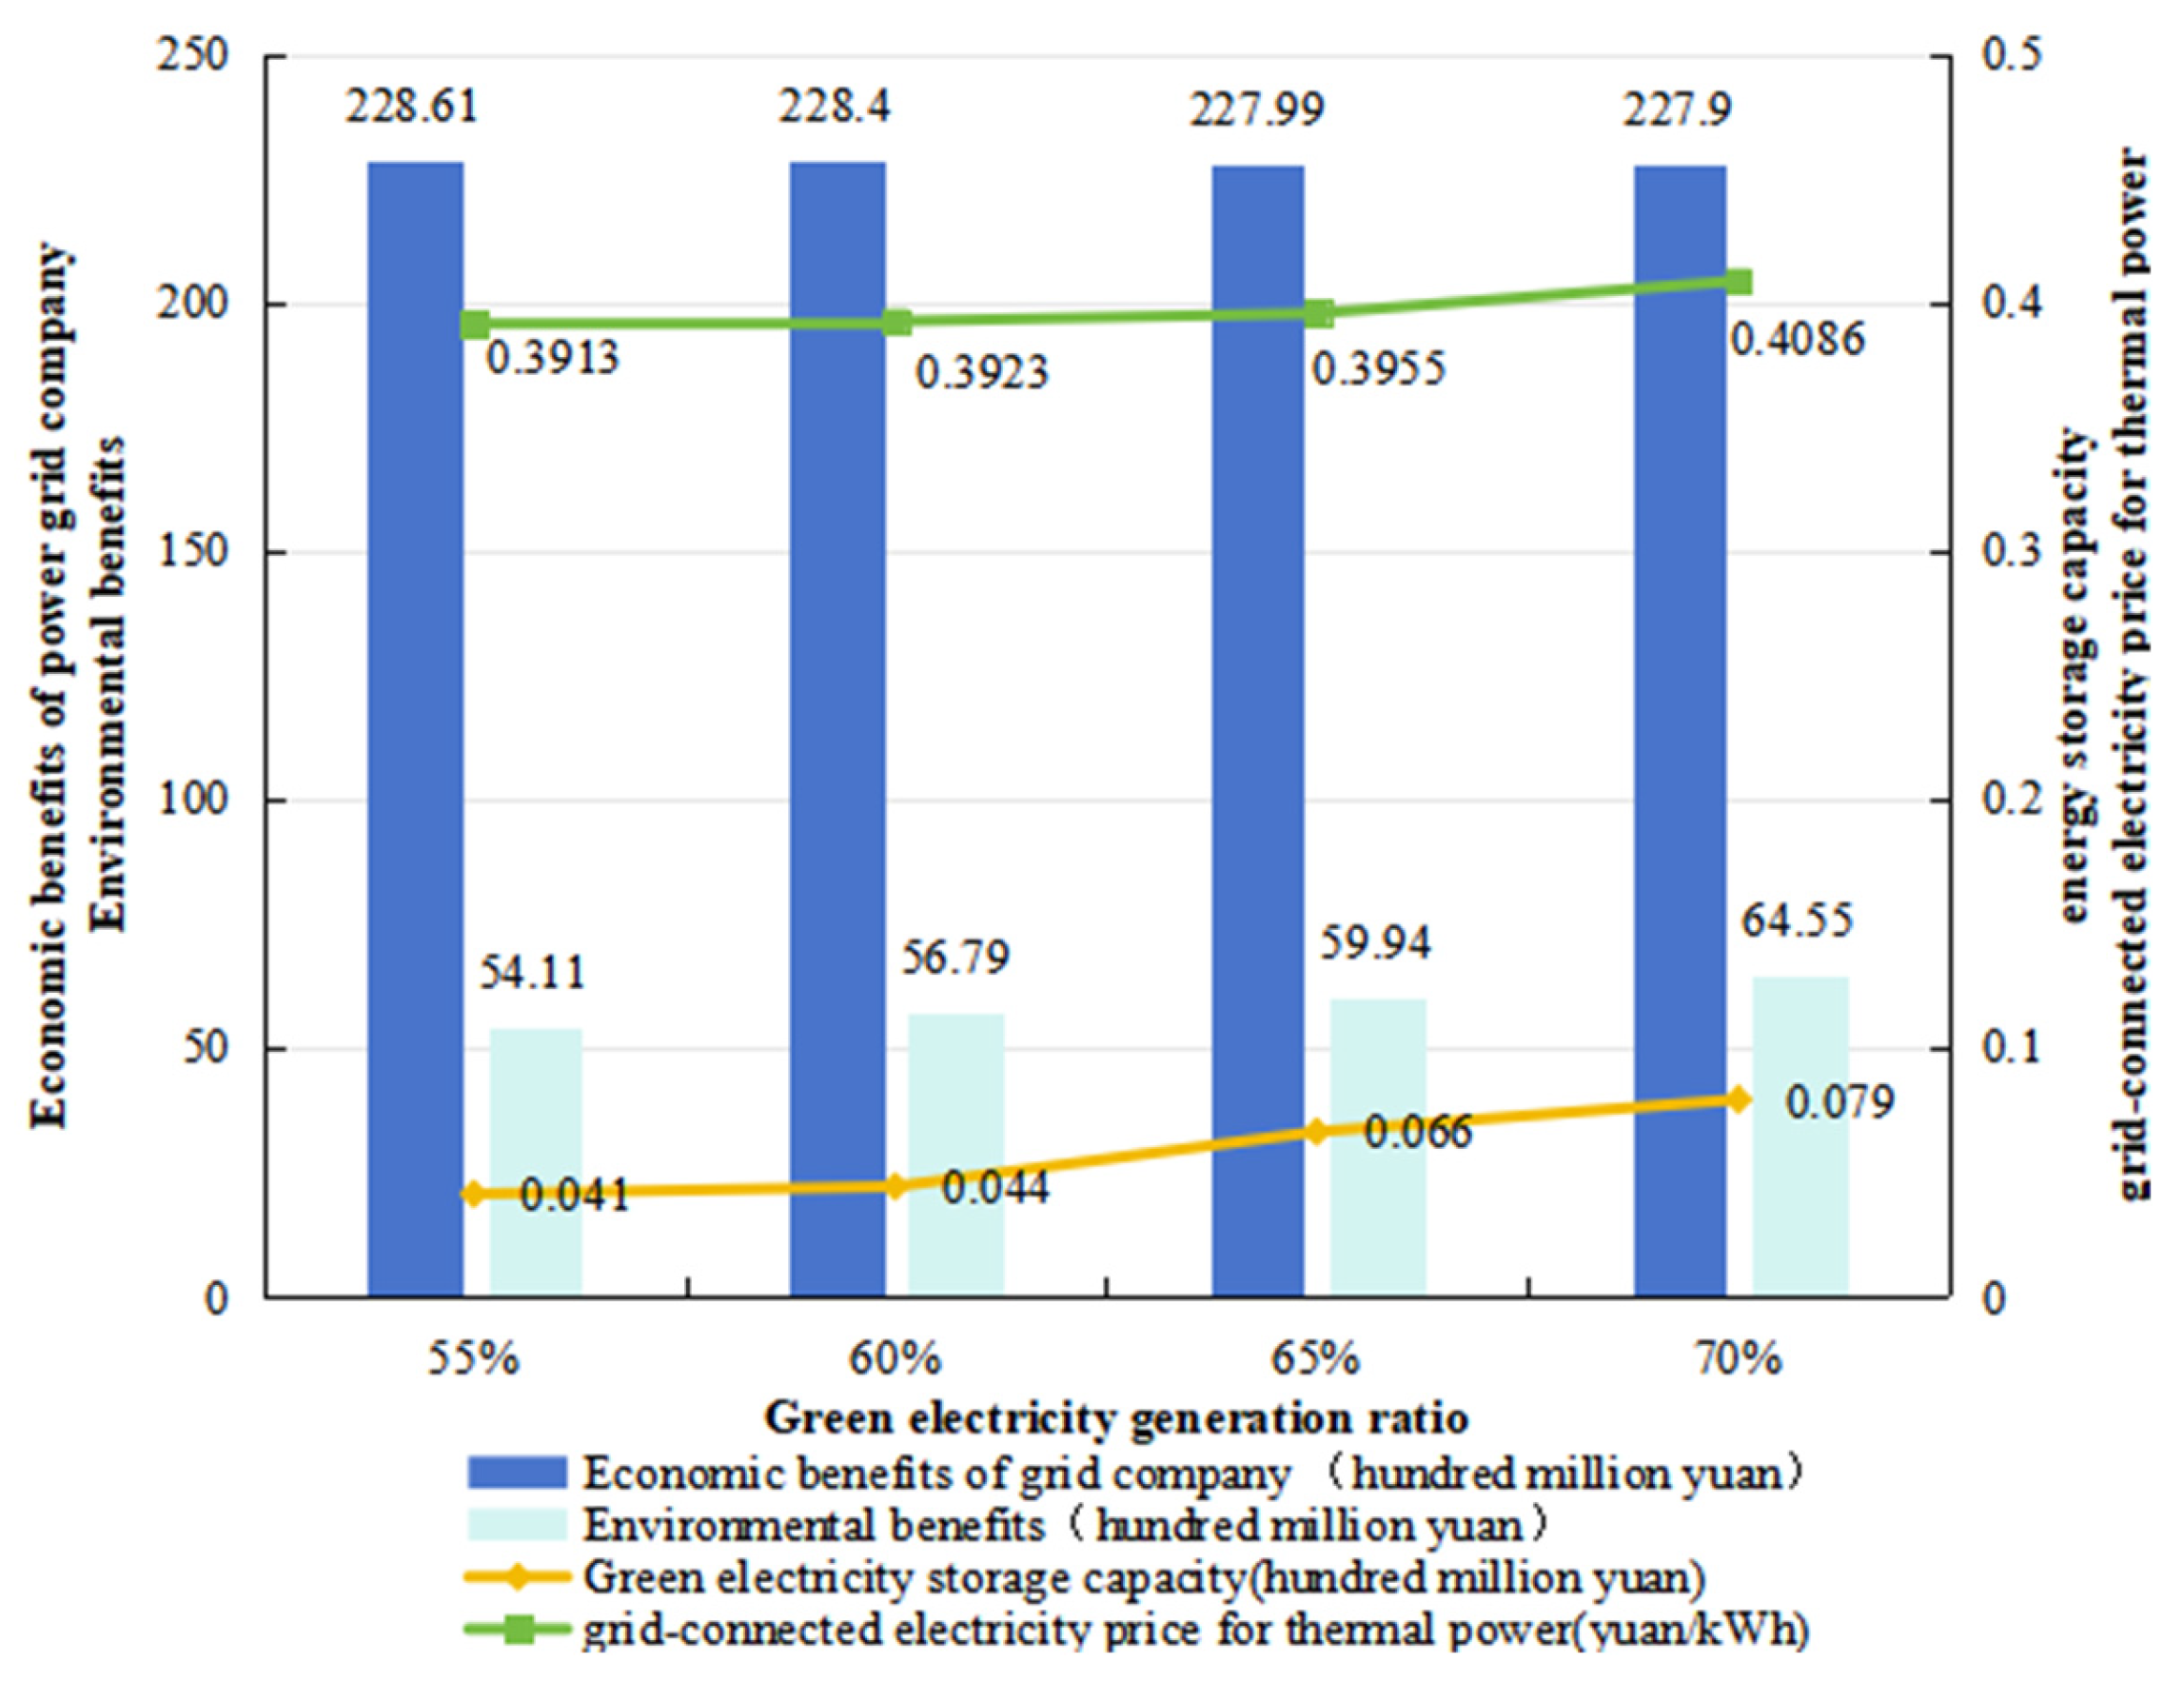
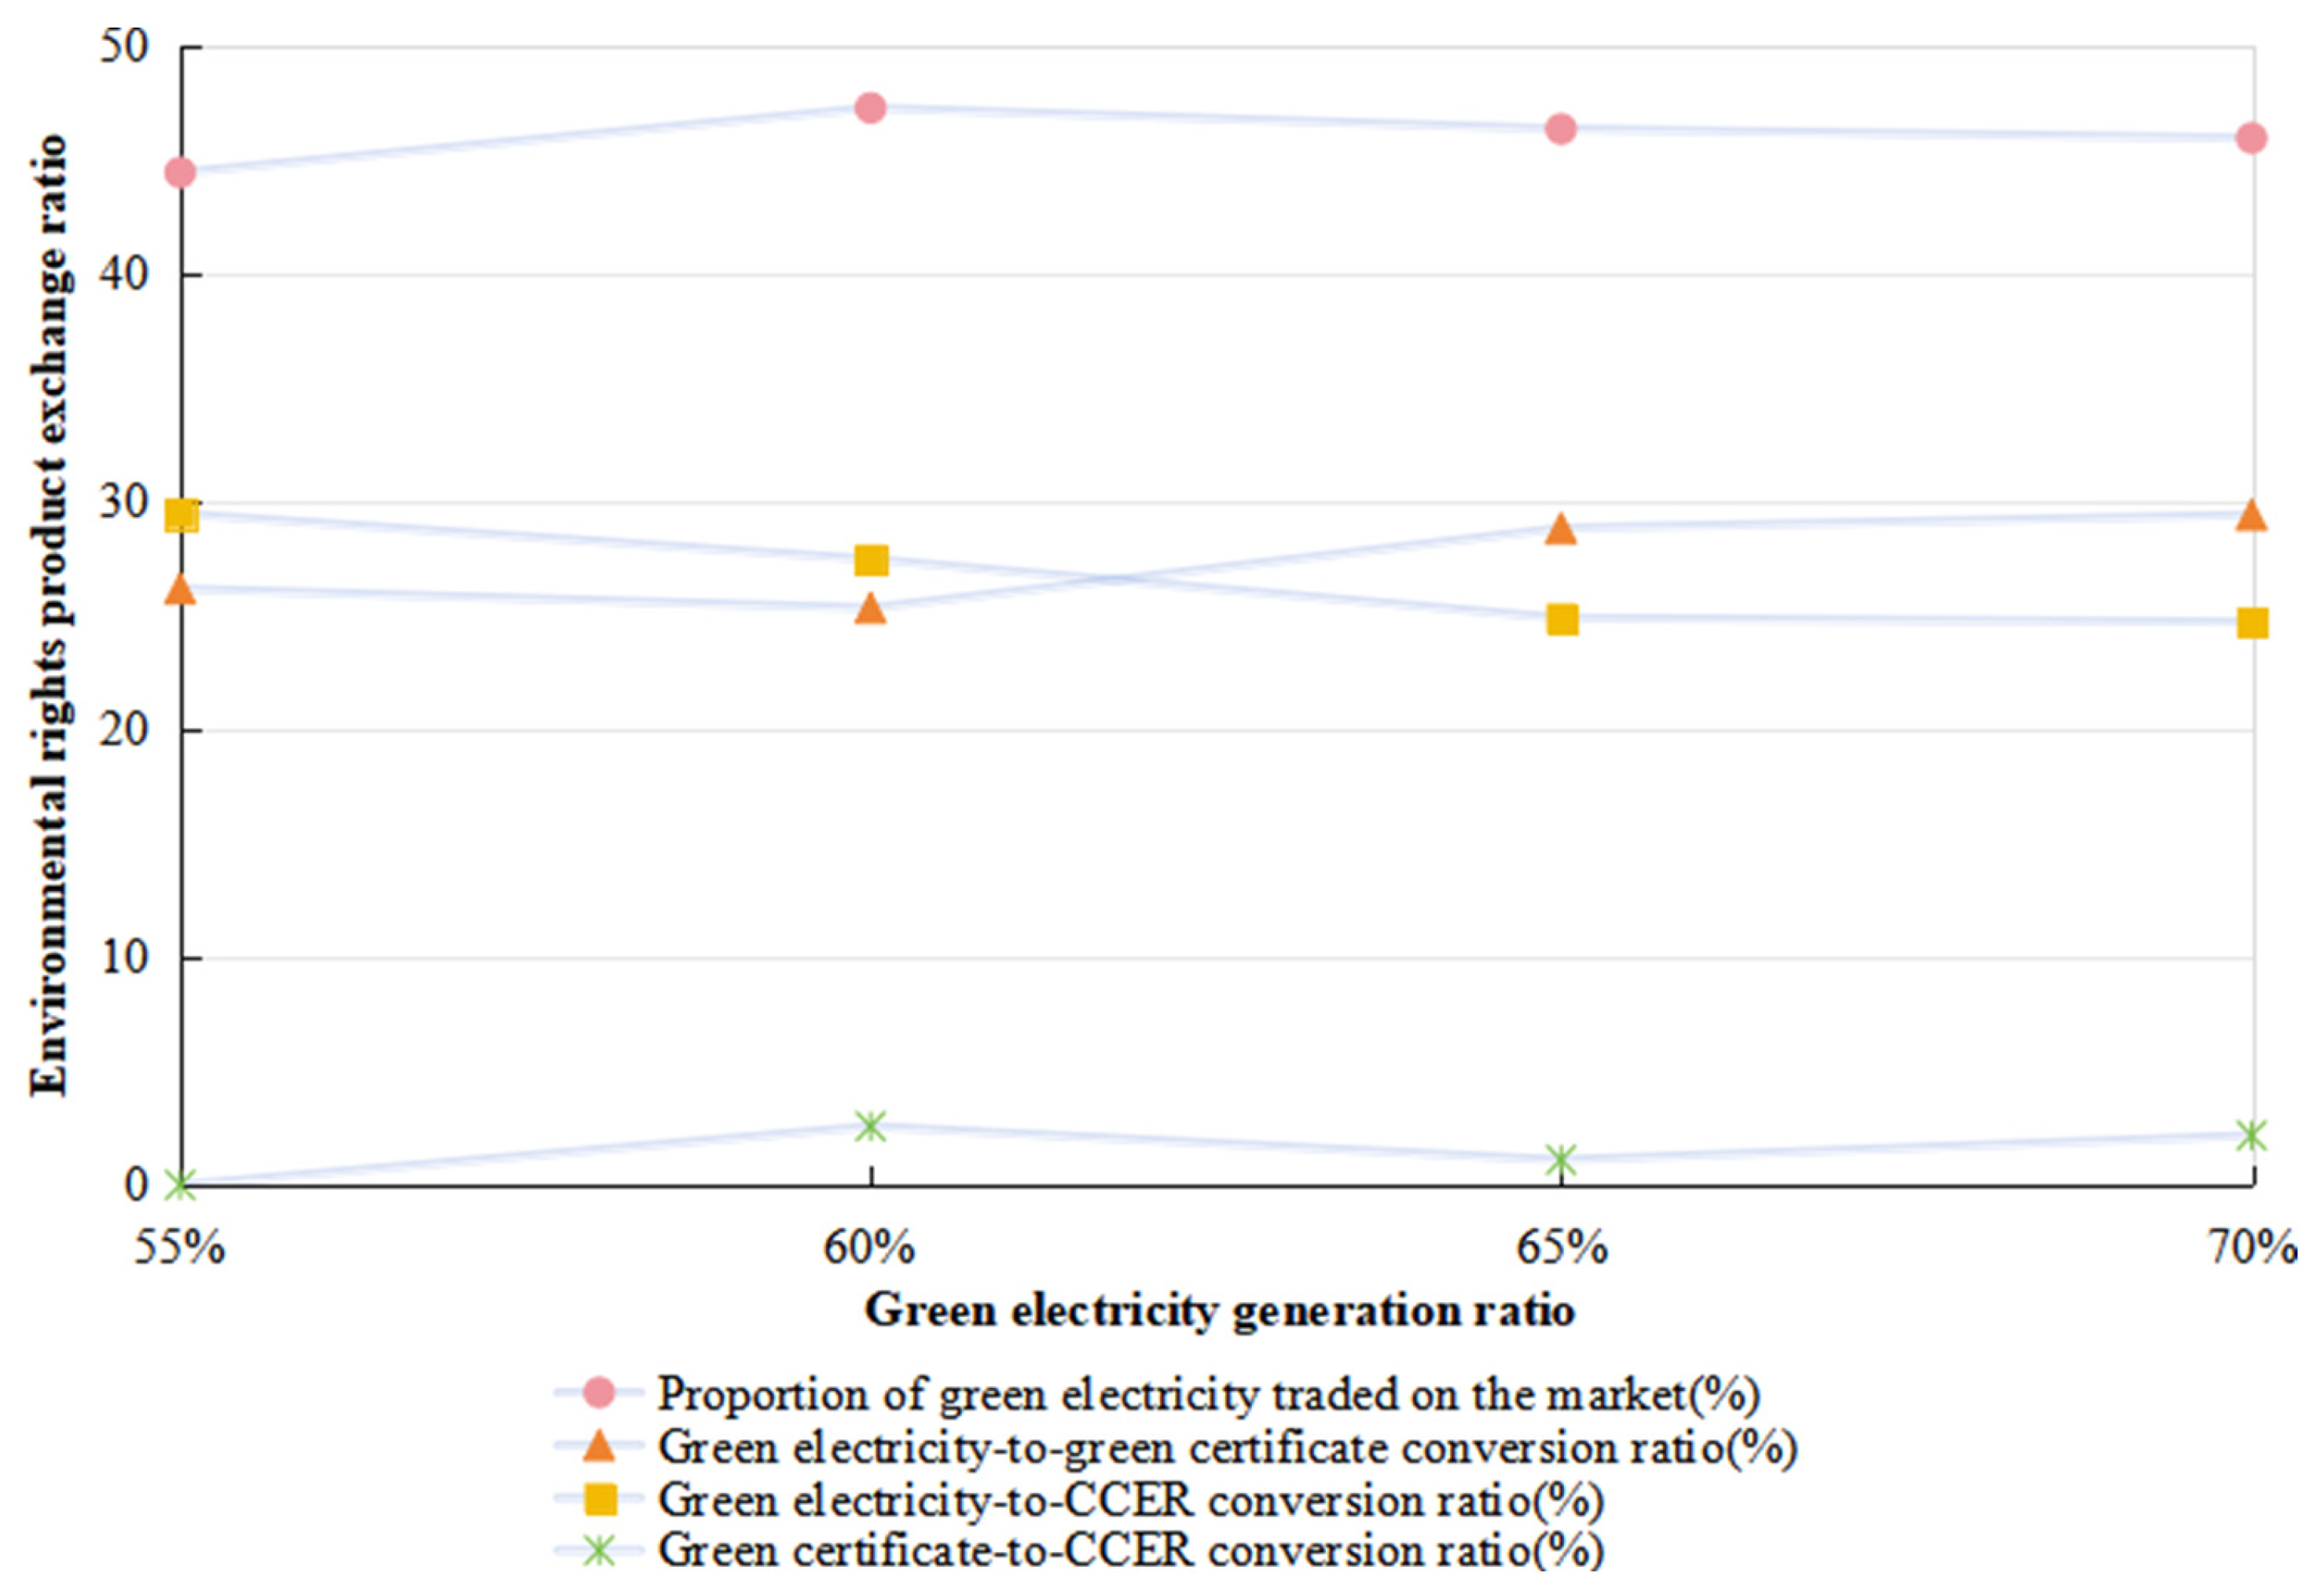
Considering that the actual green power market demand and consumption capacity cannot reach 72.43% of the green power transmission ratio in the short term, it is necessary to further explore the optimal decision-making behaviour of the grid company in the process of the gradual increase in the green power ratio. In this section, the optimal decision-making behaviour of the grid company is considered under four scenarios of 55%, 60%, 65% and 70% of the green power transmission and distribution ratio of the grid company, respectively, and the results are shown in
Figure 7 and
Figure 8:
Firstly, from the objective function values at the optimal behavioural decisions of grid companies under different green power transmission ratios, the grid company profits are higher than the profits at the optimal behavioural decisions of grid company with a single subject and the values of grid company profits at the optimal behavioural decisions of the power system, which indicates that the independent energy storage power plant equipping can improve the operating efficiency of grid company. At the same time, it can be found that the profit of the grid company decreases slowly, and the social welfare, independent energy storage power, and thermal power feed-in tariff increase slowly, which may be due to the fact that the increase in thermal power tariff will improve the economic benefit of independent energy storage power to participate in the transaction, which promotes the rise in independent energy storage power, and this part of the green power will produce environmental benefits, so it will further increase the value of the social welfare. Additionally, as the thermal power tariff rises, the sales tariff rises, and the sales tariff rises will further affect the grid company’s net loss cost, and the net marginal benefit of the unit power transmission shows a decreasing trend, which leads to a slow decline in the grid company’s profit.
From the perspective of the specific market participation of power grid companies in the supply of green power, the primary approach is direct participation in market-based transactions, with this proportion remaining around 45%. In terms of the exchange of environmental rights products, it was observed that as the proportion of green power increases, the ratio of green power exchanged for TGC initially falls below the ratio of green power exchanged for CCER, followed by the ratio of green power exchanged for TGC slightly exceeding the ratio of green power exchanged for CCER. This may be because, as the proportion of green power generation increases, although the supply of CCER in the market becomes more abundant, there is an upper limit on market demand for CCER. Once the demand in the CCER trading market reaches saturation, the preference for exchanging environmental rights shifts from CCER to TGC.
4.4. Behavioural Decision Analysis of the Electricity System in the Electricity-CET-TGC Market
To identify the most suitable transaction strategy results, we calculated the score for each decision point’s X, Y, and Z objective function values by dividing them by the average of all decision points’ X, Y, and Z objective function values. In this study, we assume that the power system places equal importance on the three objective functions of economic benefits, environmental benefits, and power source structure, and therefore assign each a weight of 1/3. By performing a weighted summation, the point with the highest score is identified as the Pareto optimal solution. This selection process is illustrated in
Table 1, Among the 10 points mentioned, point 1 has a final score of 0.264773074, which is the highest among the ten points and is highlighted in bold in
Table 1.
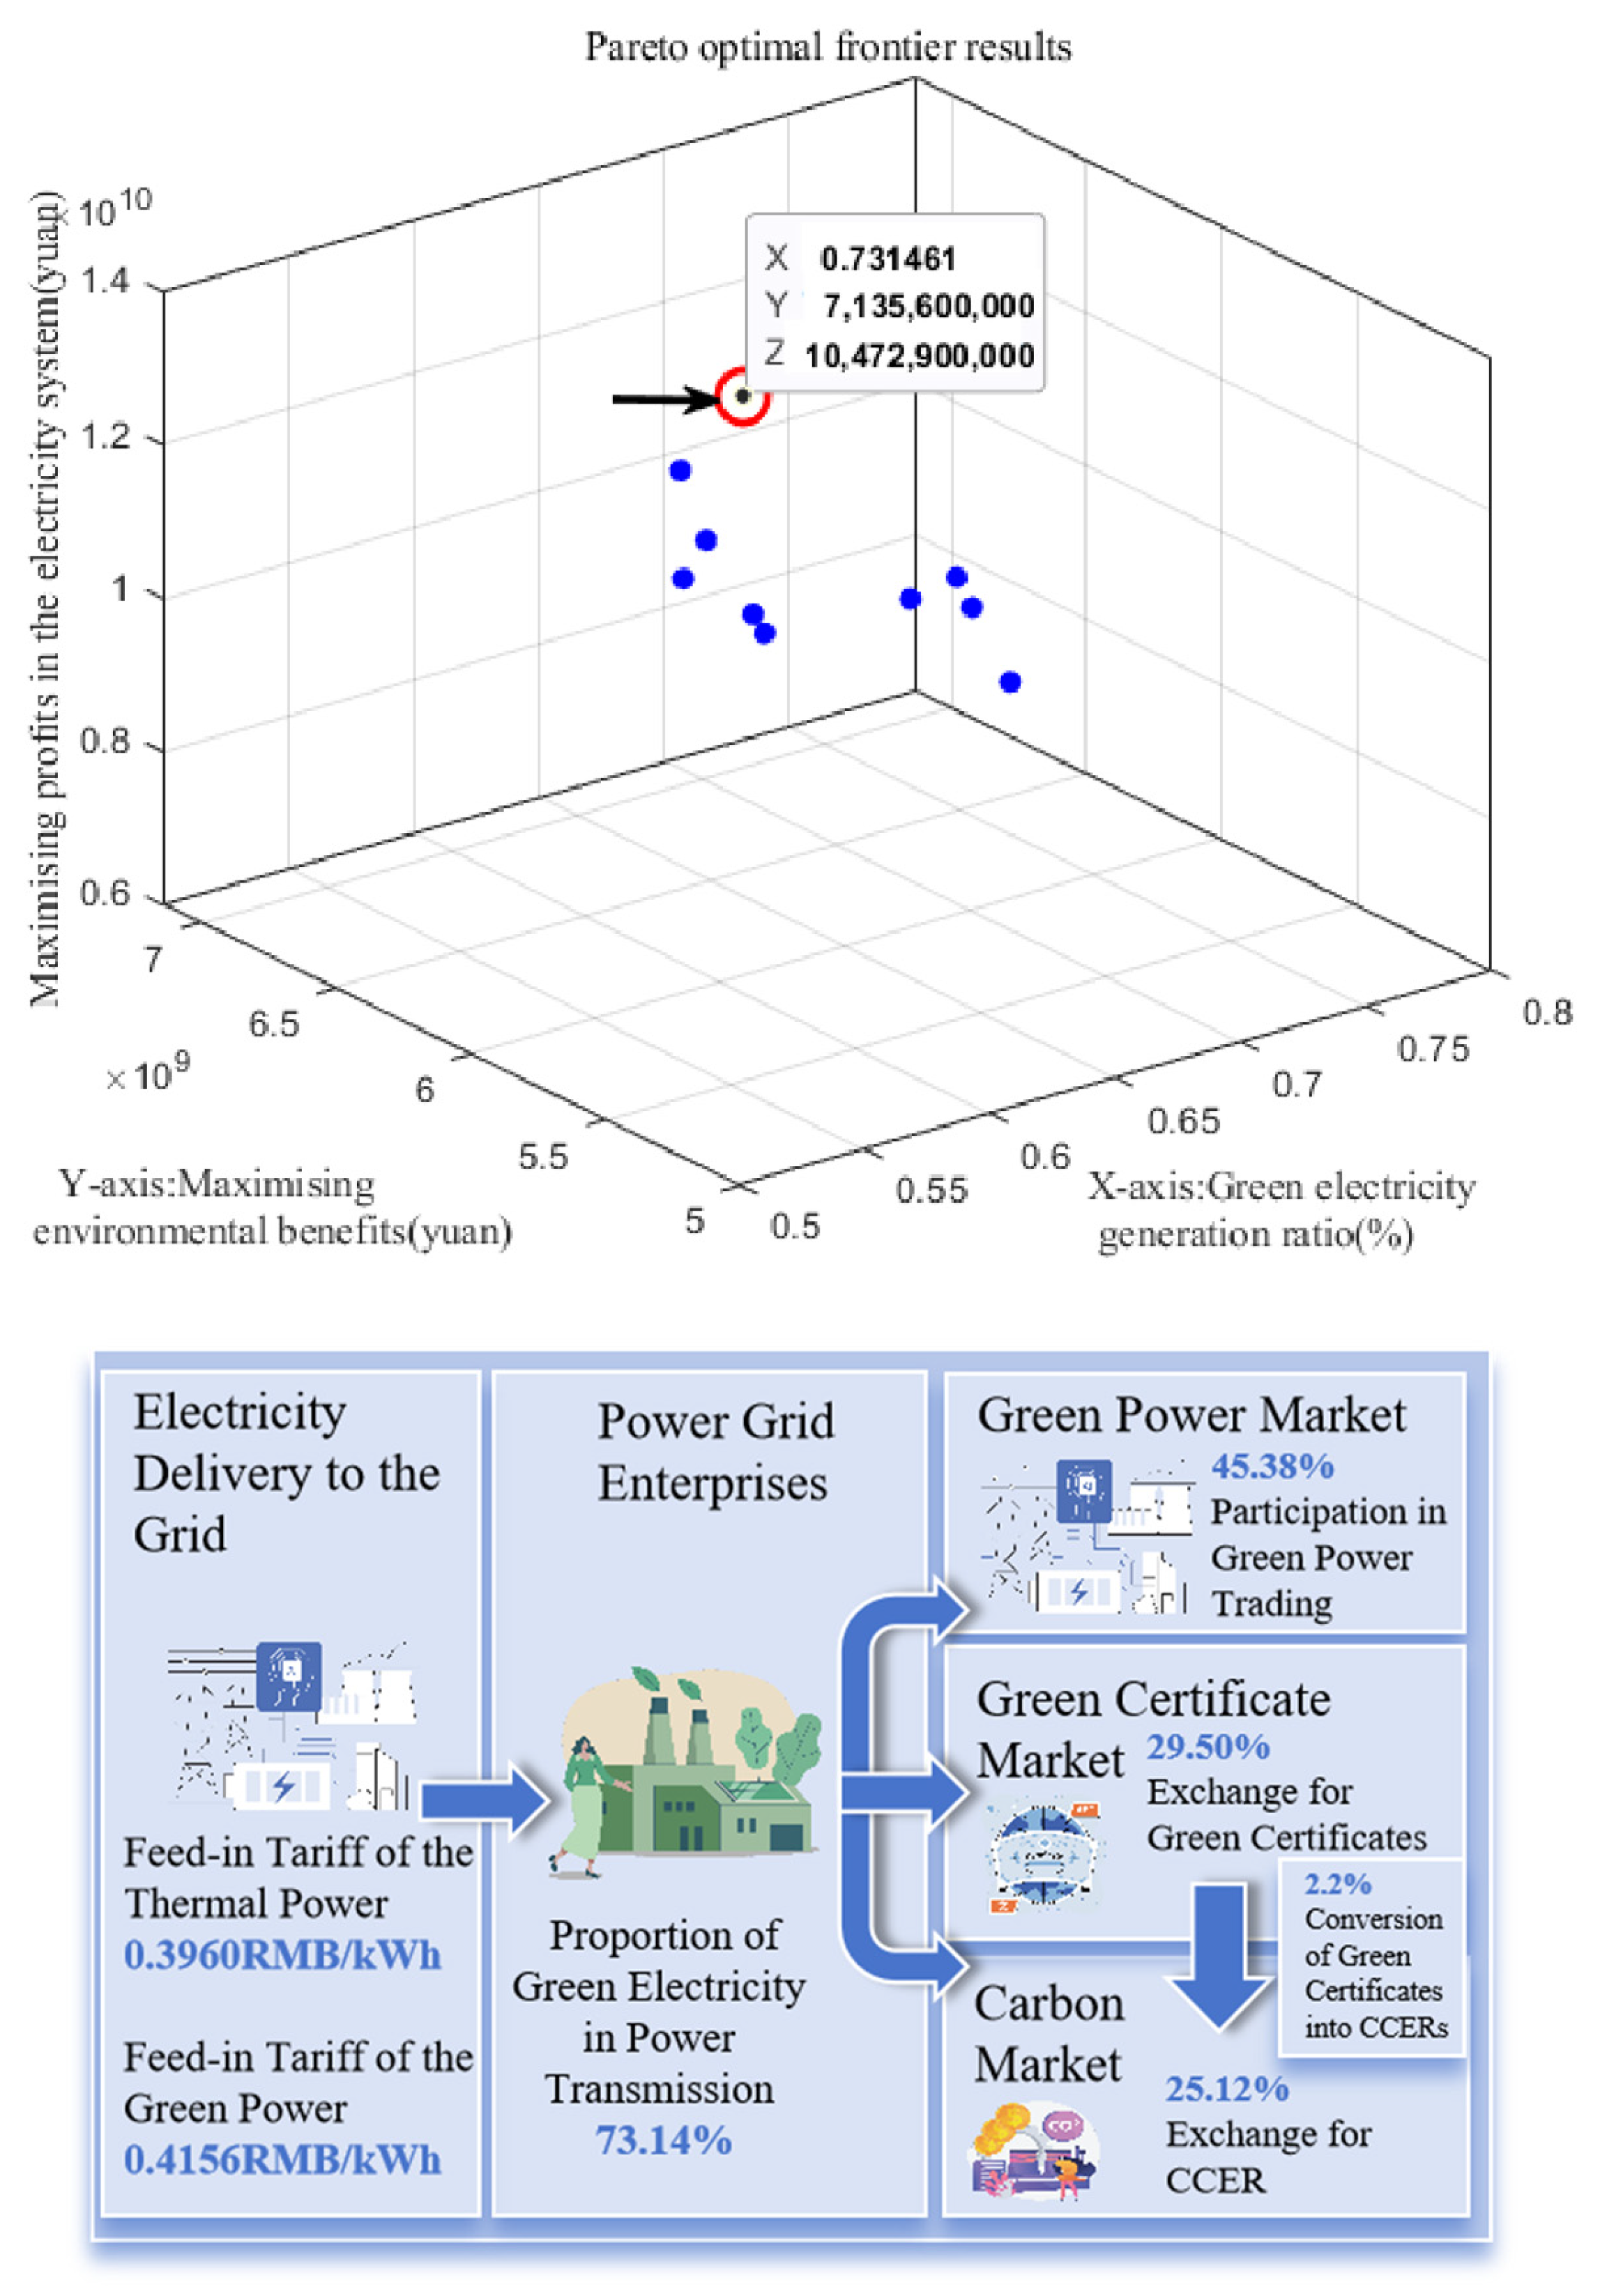
The optimal decision-making behaviour of the power system under the three objective functions, as shown in
Figure 9, can be seen that at the optimal point the profit of the power system is CNY 10.47 billion and the environmental benefit is CNY 7.135 billion. At this time, the thermal power feed-in tariff is CNY 0.396/kWh. The proportion of green power generation is 73.14%, of which 45.38% green power is directly traded, 29.5% green power is exchanged for TGC, and 25.12% green power is exchanged for CCER, with a carbon price of CNY 238.68/tonne, and a power generation capacity of 241.7 billion kWh, and 2.2% TGCs are used for exchanging for CCERs. In comparison to the optimal decision-making of the various trading entities in the power market, when the power system behavioural decision-making is optimal. The feed-in tariff is similar to the price of the corresponding indicator when the optimal behavioural decision is made by a single subject, and the proportion of green power generation is close to the transformation target disclosed in the social responsibility report of province in 2030, which aims to be 80% green power generation. At the same time, the main use of the green power generated is still to directly participate in market-based trading, and the proportion of green power exchanged for TGC and green power exchanged for CCER is also showing a flat trend in terms of mutual recognition and swap. The carbon price level and annual generation capacity are both between the optimal point of thermal power and the optimal point of green power, which moderates the decision-making behaviour of the two types of power producers.
5. Conclusions and Policy Recommendations
5.1. Conclusions
This paper analyses the multi-principal trading strategies under the electricity-CET-TGC markets synergy, and constructs a multi-objective optimisation model to study the optimal trading behaviour of each market participant in the electricity markets. The conclusions are as follows:
When the power system simultaneously achieves optimal economic and environmental benefits, the share of green power generation reaches 73.14%, and the carbon price reaches CNY 238.68/tonne, both of which are higher than the relevant indicators in China’s current data. This indicates that as the transformation goals of the new power system progress and the CET market gradually matures, the trading decision-making behaviour of the power system will continue to undergo positive optimisation, with expectations to reach optimal conditions by 2028.
From the perspective of the mutual recognition and exchange ratio of environmental rights products, green power primarily participates in market-based trading. In terms of the exchange of environmental rights products, as the proportion of green power generation increases, the exchange ratio of TGC initially remains lower than that of CCER, and later, the exchange ratio of TGC slightly exceeds that of CCER. This indicates that with the increase in the share of green power generation, although the supply of CCER in the market becomes more abundant, the demand for CCER in the market has an upper limit. Once the demand in the CCER trading market reaches saturation, the tendency for environmental rights exchange shifts from CCER to TGC.
The implementation of independent energy storage stations can help regulate the trading behaviour of power grid enterprises, and the utilisation rate of the energy storage stations has reached 61%. This indicates that independent energy storage stations possess significant development potential and can serve as a solution for renewable energy absorption, as well as alleviating the mismatch between the power load curve and the user electricity consumption curve. In the future, they can be developed as a promising method for renewable energy consumption, fully leveraging the role of energy storage in regulating the power system.
5.2. Policy Recommendations
Explore the path of multi-market synergy and participate in the construction of the mutual recognition and exchange mechanism for electricity-CET-TGC markets. The construction of the green power—TGC—CCER mutual recognition and exchange mechanism should be accelerated, and the boundaries and ratios of mutual recognition and exchange between green power and TGC, green power and CCER, and TGC and CCER should be defined. Pilot cities should be selected to initiate small scale electricity-CET-TGC markets synergy operations, forming effective nationwide operational experiences. This will provide electricity market participants with a wider range of environmental rights products to choose from, develop more flexible market trading strategies, and promote trading activity. This will provide practical experience for the establishment of the electricity-CET-TGC markets mutual recognition and exchange mechanism.
It will be important to take action on the following points: Promote the market-based trading of environmental rights products to fully realize their environmental value. Fully develop the certification of CCER methodology projects, while improving the CCER market mechanism. Research relevant data traceability technologies to provide real-time and accurate generation and consumption data for CCER project emissions reductions, ensuring the traceability and authenticity of the emissions reductions. Leveraging smart grid technology, the actual operation of renewable energy projects can be monitored, reducing the risk of data falsification and enhancing the trust in the CCER market regarding emissions reductions.
Develop independent energy storage and explore new avenues for renewable energy absorption. It is essential to deepen electricity market reforms and promote independent energy storage stations to obtain revenue through diversified channels such as participation in the electricity spot market, ancillary services market, and capacity price mechanisms. Explore the development of carbon emissions reduction accounting methodologies for energy storage projects and encourage these projects to participate in the CET market. By trading CCER, the environmental benefits can be transformed into economic returns. At the same time, establish a public disclosure system for the environmental benefits of energy storage projects, regularly releasing data on emissions reductions, ecological contributions, and other relevant information, and subjecting these to public supervision. For large industrial users, green power direct connection projects can be considered to reduce their own carbon emission costs while promoting green power consumption. For green power companies and power grid companies, ultra-high voltage direct current and alternating current projects can be established to enable rapid response to green power transmission and distribution, thereby promoting green power consumption.
