Abstract
The connection between sugar and ethanol prices is in line with concerns about the connection between oil and food prices. This paper studies the nexus between Colombia’s ethanol and sugar prices and the role that weather shocks play. Data on production and prices from the sugar mills and climate data on precipitation and temperature are used to estimate two ways to capture the relationship between prices and the role of weather shocks. First, a reduced-form estimation is made, where the study finds evidence of the pass-through of the international price to domestic prices and how high precipitation and temperature shocks increase prices. Then, the study addresses potential simultaneity problems between prices and estimates a VEC model with exogenous variables such as weather shocks. Results show that all domestic prices are affected by the international price, and the international price is affected by the white sugar domestic prices. Additionally, sugar prices react to shocks in ethanol prices, but ethanol prices do not react to shocks in sugar prices. Finally, weather shocks affect sugar prices, with daytime temperature shocks being the most damaging.
1. Introduction
Biofuels have been criticized by politicians and the media, who see them as a threat to food security since their production uses food resources, such as corn in the US or sugarcane in Colombia, which can increase the prices of these essential goods for feeding millions of people [1]. In addition, the increase in crude oil prices could raise ethanol prices, which, together with many national regulations that imply the obligation to mix a percentage of biofuels with the fuels sold to final consumers, would imply that a greater demand for biofuels would also increase the demand and costs of raw materials. Thus, biofuel production could aggravate the relationship between fuel and food prices, which could be detrimental to some emerging economies. This result implies a connection between spikes in energy and food prices, which can generate vulnerability for a large part of the world’s population. However, international evidence does not seem to support this rather pessimistic hypothesis [2,3].
In Colombia, biofuel production is supplied by two strategic agro-industrial sectors: sugarcane and palm oil [4]. The production of ethanol and biodiesel in the country is the result of the creation of a national biofuel policy (Law 693 of 2001 [5] and Law 939 of 2004 [6]). These laws are motivated by supporting the production of these fuels under the premise that they are a factor that contributes to energy self-sufficiency, environmental sanitation, rural development, and employment [7]. To comply with these laws, the Ministry of Mines and Energy has various incentive mechanisms for promoting these biofuels. The most notable is the mandate for blending biofuels and fossil fuels, i.e., a portion of gasoline sold at service stations must have a biofuel component. In a recent paper, Palacio-Ciro and Vasco-Correa [4] studied how the national biofuel policy reconfigured the productive dynamics of Colombia’s sugar and palm oil sectors. Through an ARDL model, the authors find that this policy of promoting the use of biofuels has transformed the dynamics of the sugar and palm oil sectors, such that ethanol production generated a substitutive production relationship with export sugar. At the same time, biodiesel allowed for a more significant expansion of the entire palm oil sector. Motivated by these results, this paper studies how climate affects the formation of sugar and ethanol prices. To do so, sugarcane production is the fundamental mechanism that connects both prices, sugar and ethanol. Section 2 shows a sum mary of the literature on how sugarcane cultivation responds to variations in climatic conditions.
Sustainability is the normative basis that justifies biofuel policy through objectives such as energy self-sufficiency, environmental sanitation, rural development, and job creation. At the same time, the international debate on the potential adverse effects of biofuels on food security highlights a tension between environmental sustainability and social justice. In Colombia, ethanol and biodiesel production has positively transformed the sugarcane and palm agro-industrial sectors, strengthening their economic sustainability. By analyzing the impact of climate shocks on prices, this paper incorporates a dimension of adaptation to climate change, demonstrating that sustainability also entails strengthening the resilience of the Colombian agro-energy sector to environmental risks [8].
Data on sugar prices from the Agricultural Sector Price and Supply Information System (SIPSA, for its acronym in Spanish) provided by the National Institute of Statistics of Colombia (DANE, for its acronym in Spanish) are used. For ethanol prices, the study uses data from the Association of Sugarcane Growers of Colombia (Asocaña) on the maximum price of ethanol in force according to the Ministry of Mines and Energy. Likewise, from Asocaña, our study takes the reference price of sugar in Colombia, which corresponds to the price of raw sugar in the US. As a reference price for ethanol in Colombia, the price of ethanol in the US is used. Our dataset is available monthly from January 2013 to October 2023. Regarding the collection of climate data and the definitions of shocks, our study follows Otero-Cortés and Bohorquez-Penuela [9] and Otero-Galindo and Perez [10]. It uses CHIRPS precipitation data and Copernicus temperature data at the municipality level and with daily frequency, following Otero-Galindo and Perez [10], who study the effects of climate on the rice market in Colombia. Then, it aggregates the climate information across all sugar-producing municipalities, weighting each observation by the official area of each municipality to obtain a single climate measure per period. Finally, our study defines climate shocks following the strategy of Otero-Cortés and Bohorquez-Penuela [9] and Otero-Galindo and Perez [10]. Both works are applied to Colombia.
This paper presents two sets of results as an empirical strategy: an approach through reduced-form estimation and an exploration through a VEC model with exogenous variables. In the reduced-form approach, it studies the relationship between the sugar price and the ethanol price with weather shocks, controlling for the pass-through of the international prices. This strategy is standard in the literature [11,12]. Finally, it addresses the endogeneity problem due to the simultaneity between the variables of interest through a VEC model with exogenous variables. This paper assumes that the exogenous components of the model are the weather shocks and estimates the OIRFs between the prices.
In the field of sustainable finance, this research addresses a critical gap by analyzing how climate shocks affect the formation of sugar and ethanol prices in emerging markets such as Colombia, two strategic and sensitive sectors linked to agribusiness and national biofuel policy. In this sense, this study incorporates a robust econometric approach that integrates reduced-form estimates and VEC models with exogenous variables to capture simultaneity and incomplete price transmission. The results obtained from the reduced-form estimation are consistent with the literature on the effects of weather shocks in the sugar market. It is evident that daytime temperature shocks, as well as high precipitation events, tend to increase both sugar and ethanol prices. Additionally, a pass-through effect from international sugar prices to domestic sugar and ethanol prices is identified, estimated to range between 11% and 28%, which constitutes evidence of incomplete pass-through. Upon estimating the Vector Error Correction (VEC) model, four key findings emerge: first, a shock in international sugar and ethanol prices leads to an increase in domestic prices of both products; second, a shock in white sugar prices affects U.S. raw sugar prices; third, an increase in ethanol prices impacts sugar prices, but the reverse effect is not observed; and finally, weather shocks influence sugar prices, with daytime temperature shocks being the most detrimental. These findings offer a novel perspective on the resilience of the Colombian agribusiness and energy sectors to climate change, and articulate the objectives of economic, environmental, and social sustainability in an emerging economy highly exposed to climate risks.
This paper is composed of seven sections. Section 2 summarizes how the literature has addressed the relationship between sugar and ethanol prices and how climatic conditions influence the primary input that connects both in the case of Colombia, which is sugarcane. Section 3 presents some characteristics of Colombia’s sugar and ethanol markets. SSection 4 presents the data, and Section 5 the empirical strategy. Finally, Section 6 and Section 7 present the results and conclusions.
2. Sugar, Ethanol, and Weather Conditions
Sugarcane is the main input from which sugar mills make sugar. Likewise, mills choose to use sugarcane to produce ethanol. This implies that the connection between climate and sugar and ethanol prices occurs through sugarcane production. Lima et al. [13] show that variations in sugarcane production in Brazil are the most important factor to explain variations in sugar and ethanol prices, above factors such as variations in international prices. The climate and sugarcane production literature shows that precipitation and temperature are key climatic factors to explain variations in sugarcane yield and production. A notable work in the literature is Greenland [14], which studies how climate variability affects the annual sugarcane yield in Louisiana, US. The relationship between different climatic measures and sugarcane crop yield is studied through different methods, such as an experiment for a single weather station and the surrounding crop, surveys of producers, or a comprehensive data set for different cropping areas. Their results show that sugarcane yield has a positive relationship with maximum temperature and a negative relationship with precipitation.
More recent work, applied to the case of sugarcane in Australia, shows the devastating effects of rainfall. Everingham and Reason [15] find evidence that the 2010 La Niña phenomenon, which brought substantial increases in rainfall over the New South Wales region, implied substantial falls in sugarcane production. Carter et al. [16] have addressed the effects of this event on sugar prices and production in Australia. Their results show that extreme rainfall events are associated with notable reductions in sugarcane yield and substantial reductions in production. This translates into notable increases in sugar production costs and final sugar prices. The authors show that this series of events resulted in substantial economic losses for sugar mills and producers due to the poor management of risk coverage by Australia’s main sugar exporting corporation.
Regarding the link between sugar and ethanol prices, the works of Carpio [17] and Palazzi et al. [18] applied to the case of Brazil are highlighted. Brazil is a market with similar aspects to Colombia; its sugarcane production tends to be used for sugar and ethanol production. Carpio [17] study oil prices’ long- and short-term effects on ethanol, gasoline, and sugar prices through a VECX model. International oil prices represent the exogenous component of the model. The main results show that oil prices have long-term effects on ethanol, gasoline, and sugar prices. This result has already been previously documented by Balcombe and Rapsomanikis [19], also for the case of Brazil. Regarding the short term, ethanol and gasoline prices are more sensitive to variations in the oil price. Additionally, they highlight that the volatility of sugar prices is lower than that of ethanol and gasoline. This paper follows a strategy similar to Carpio [17]. However, our exogenous component will be weather shocks, which do not depend on the production and price formation decisions of the agents. This paper allows international prices to be endogenous, then it evaluates the exogeneity of international prices to domestic prices in Colombia.
Palazzi et al. [18] study the mechanisms underlying the asymmetric transmission of changes in international energy and agricultural product prices to the price of ethanol in the Brazilian domestic market. To do so, they use a NARDL model, which allows them to flexibly address the problem of potential non-linearities in the relationship between domestic fuel prices and their international fundamentals. Their results show that reformulated blendstock for oxygenate blending prices has had both short- and long-term asymmetric effects on domestic gasoline prices in Brazil. In contrast, sudden increases in heating oil prices have decreased ethanol prices.
In the review conducted for Colombia, we did not find any work that studies the link between sugar and ethanol prices. This paper is the first to address this issue in Colombia. Additionally, we are not aware of any work applied at the international level that studies the link between climate and sugar and ethanol prices. The works by Carpio [17] and Palazzi et al. [18] focus on how variations in international prices are transmitted to the domestic level.
3. The Sugar and Ethanol Markets in Colombia
According to the Ministerio de Agricultura [20], the vast majority of sugarcane production in Colombia is located in 47 municipalities, in the departments of Valle del Cauca, Cauca, Caldas, and Risaralda. These municipalities share a common area of the country called Valle del Río Cauca (not to be confused with the department of Valle del Cauca). The sugarcane agro-industry generates more than 286,000 direct and indirect jobs. In 2019, sugarcane was planted on 3362 farms, generating over 91,000 direct and 65,000 indirect jobs. Additionally, 65.3% of the farms planted with sugarcane have an area equal to or less than 60 hectares (ha). Sugarcane growers in the Valle del Río Cauca tend to form associations through guilds, which negotiate the price of sugarcane production with the sugar mills. The sugar mills then transform the sugarcane production into sugar and other commercial products such as ethanol.
The agro-industrial sugar production is carried out in 12 mills with an installed milling capacity of 94 thousand tons daily. These mills in the Valle del Río Cauca are associated in the Asocaña guild, which coordinates the actions of the mills about the prices set for refined sugar. In addition to sugar production, some of these mills specialize in producing ethanol from sugarcane. It is estimated that their maximum daily production capacity is 1.7 million liters, and 34.6 million liters of storage capacity. These mills are also dedicated to co-generating electricity from sugarcane bagasse. The sector has 12 co-generation plants with a 1.6 gigawatt (GW) installed capacity. Finally, some mills have companies that produce paper from bagasse. In 2019, agricultural activity for sugarcane production contributed 1.5% of the added value of the agricultural sector, and the industrial process of sugar production represented 1.3% of the industry’s added value. In total, the sugarcane agro-industry contributed 0.27% of the total added value of the Colombian economy.
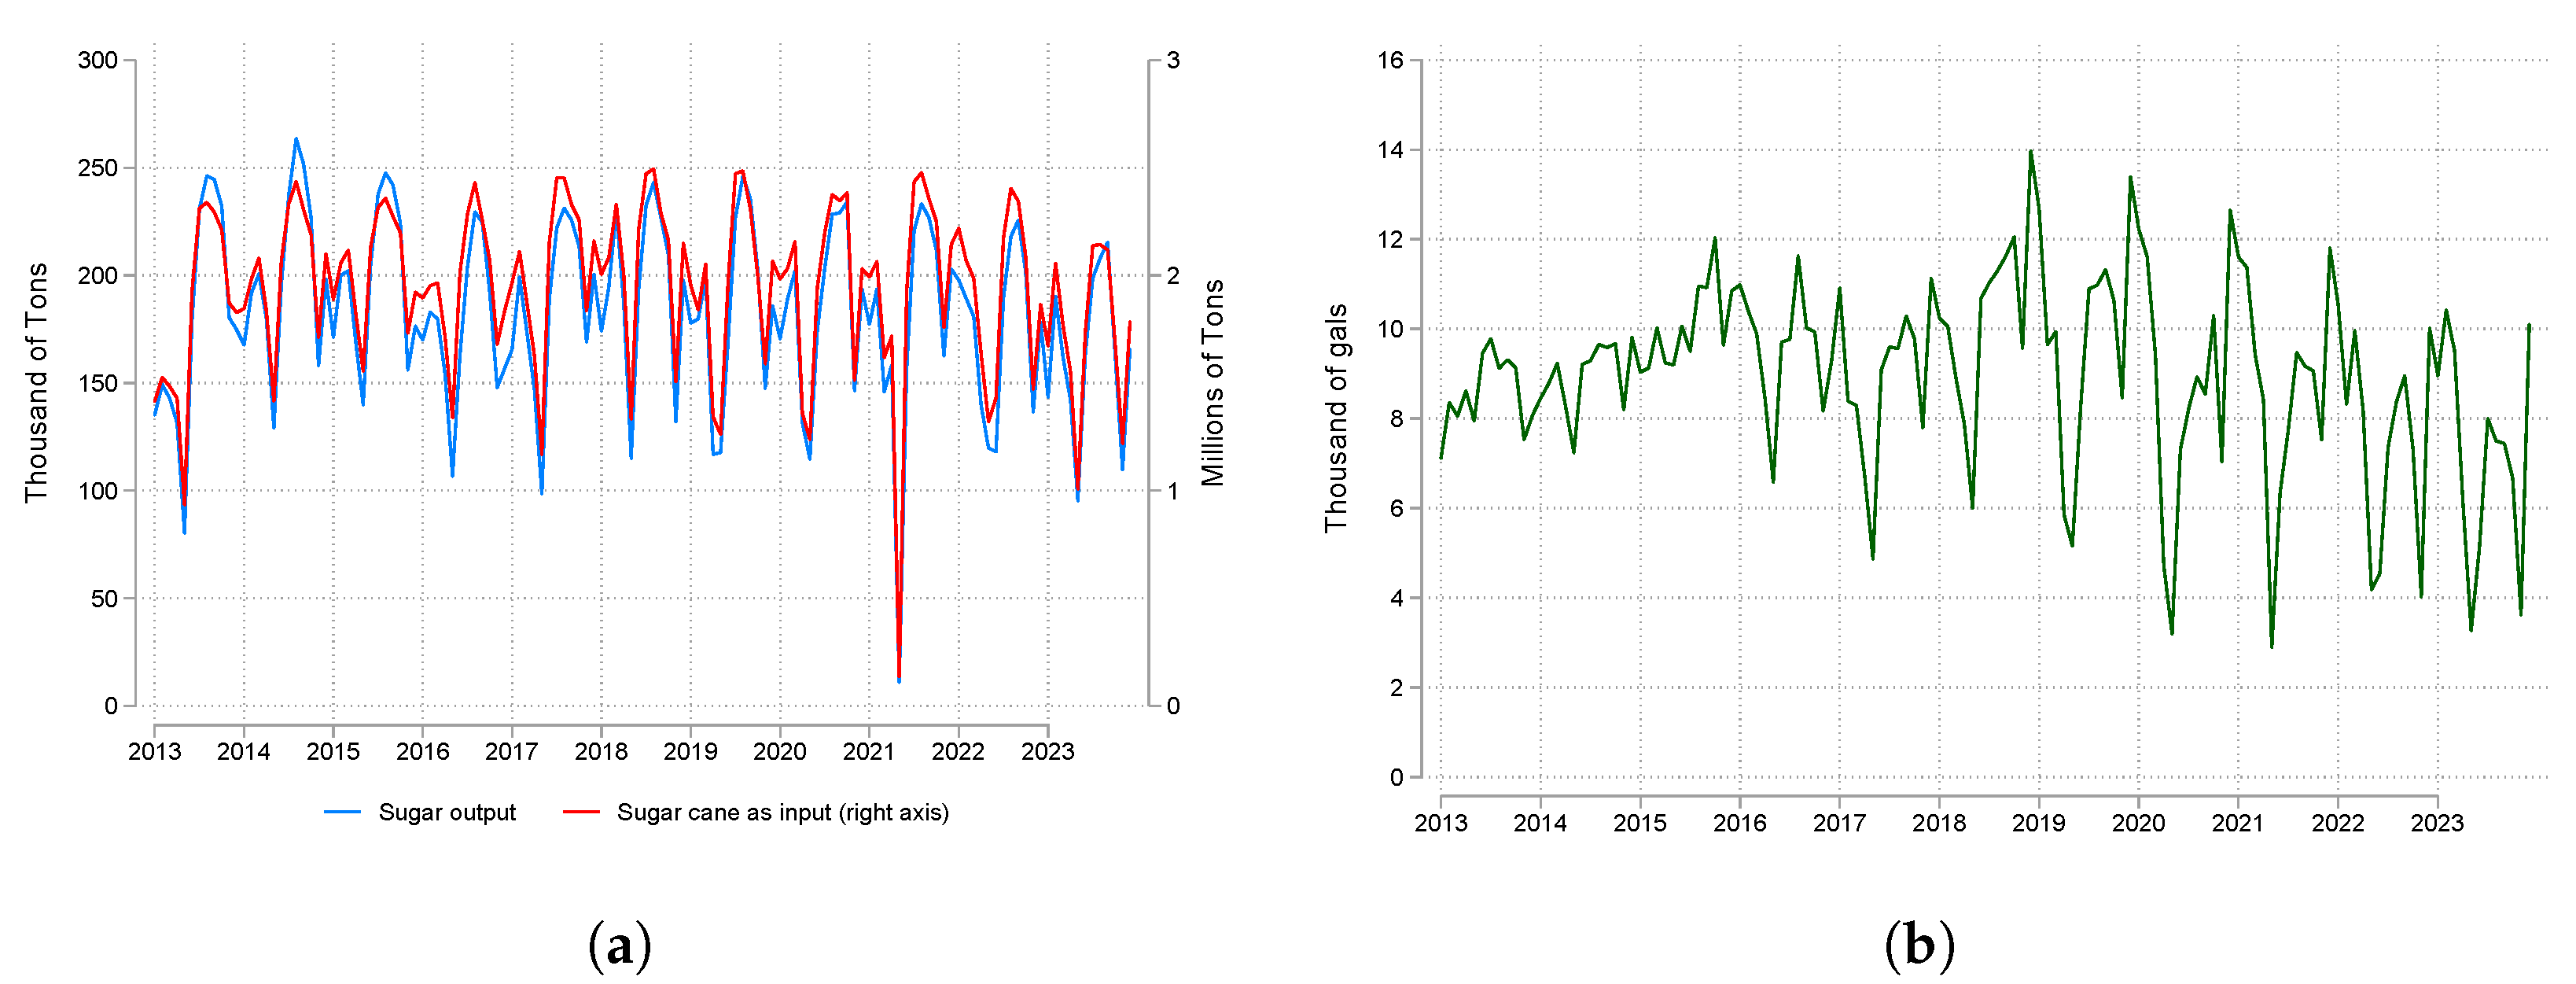
Figure 1 shows the monthly sugar mill production time series for sugar and ethanol and the amount of sugarcane used as input. Information is reported from Asocaña. Panel a graphs the case of sugar, using sugarcane as input on the right axis since the process of transforming sugarcane into sugar involves a significant reduction in the total mass of the product, and in panel b, the case of ethanol is graphed. The graph highlights the seasonal behavior of sugar and ethanol production, with a tendency to decrease during the first months of the year, then beginning to grow from April, with the arrival of the rainy regime in this area of the country, and remaining at high levels and then beginning to decrease as the next year approaches [21]. This pattern is also seen in the case of ethanol production, although less clearly than in the case of sugar. The sugarcane used as an input by the mills reflects the behavior of sugar production, which shows that, to a large extent, the mills use sugarcane mainly to produce sugar and have a lesser dedication to ethanol.
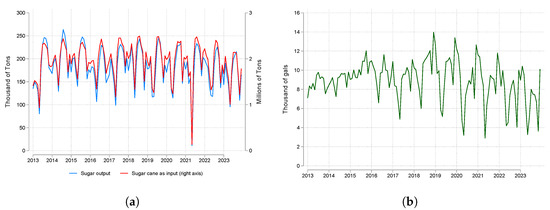
Figure 1.
Production of sugar and ethanol, and use of sugarcane as input. (a) Sugar. (b) Ethanol. Source: Asocaña and DANE.
In Colombia, the international reference prices for sugar are the price of refined white sugar (USD/Ton) contract No. 5 of the London Stock Exchange and raw sugar (USDcent/lb) contract No. 11 of the New York Stock Exchange, in cents per pound. Both reference prices behave similarly over time. Based on these reference prices, the Andean community defines price bands on which duties or tariff reductions are granted. The Andean price band system aims to stabilize the cost of importing agricultural products with volatile behavior, such as sugar. In addition to this regulatory mechanism, the sugar market has the Sugar Price Stabilization Fund (FEPA, for its acronym in Spanish). This fund is crucial in providing remunerative income for national producers, regulating national production, and increasing exports. The FEPA is of a zero-balance nature, meaning that all transfer income is used to pay compensations and the costs of its operation. A sugar mill transfers its income to the fund when it handles sugar in high-price markets, and compensation is generated from the fund to a sugar fund when it sells sugar in low-price markets. The FEPA is of a zero-balance nature because the transfers and compensations evolve synchronized. The high volatility between one year and the next is because the value of the transfers and compensations depends on factors such as the international price of sugar, the exchange rate with the dollar, the level of sales, and the decisions made by each sugar mill on how to distribute its sales between the national and foreign markets, as well as the price difference between these markets. Regarding fuel alcohol or ethanol, the Ministry of Energy sets the price based on the behavior of international fuel prices (e.g., ethanol price in the US or Brazil) and the availability of raw materials for its production (sugarcane).
4. Data
Regarding data collection, this paper followed the strategy of Otero-Galindo and Perez [10]. This paper used four sources of information: two on agricultural production and prices in Colombia and two databases with climate information. It took data from Asocaña between January 2013 and October 2023 related to sugar and ethanol production by sugar mills and sugarcane as an input. This information is available at an aggregate level every month. Regarding sugar prices, it used data from the Agricultural Sector Price and Supply Information System (SIPSA), a platform in charge of reporting the wholesale prices of agricultural and food products marketed in the country, as well as information on inputs and factors associated with agricultural production and the level of food supply in the main cities. It takes data on white and brown sugar prices reported in SIPSA for the eight supply centers located in the Valle del Río Cauca: Manizales, Pereira, Popayán, Cali, Palmira, Buenaventura, Tuluá, and Cartago. This price is measured in Colombian pesos per pound (COP/lb) and has a monthly frequency from January 2013 to October 2023. It uses the Consumer Price Index, aggregated at the national level and every month, to deflate sugar prices. Additionally, it uses data on the price of raw sugar in the United States, white sugar in the United Kingdom, ethanol in Colombia, and ethanol in the US, with a monthly frequency, taken from Asocaña. The price in the US is measured in USD cents/lb and in the UK in USD/ton, and the study converts it to COP/kg using the average monthly exchange rate of COP/USD. Raw sugar is used to produce white and brown sugar. The prices set in the US and the UK are a reference for the price of sugar in Colombia. Ethanol prices in the US are used as a measure of the international price of ethanol. The price of ethanol in the US is measured in USD/gal, converted to COP using the average monthly exchange rate of COP/USD.
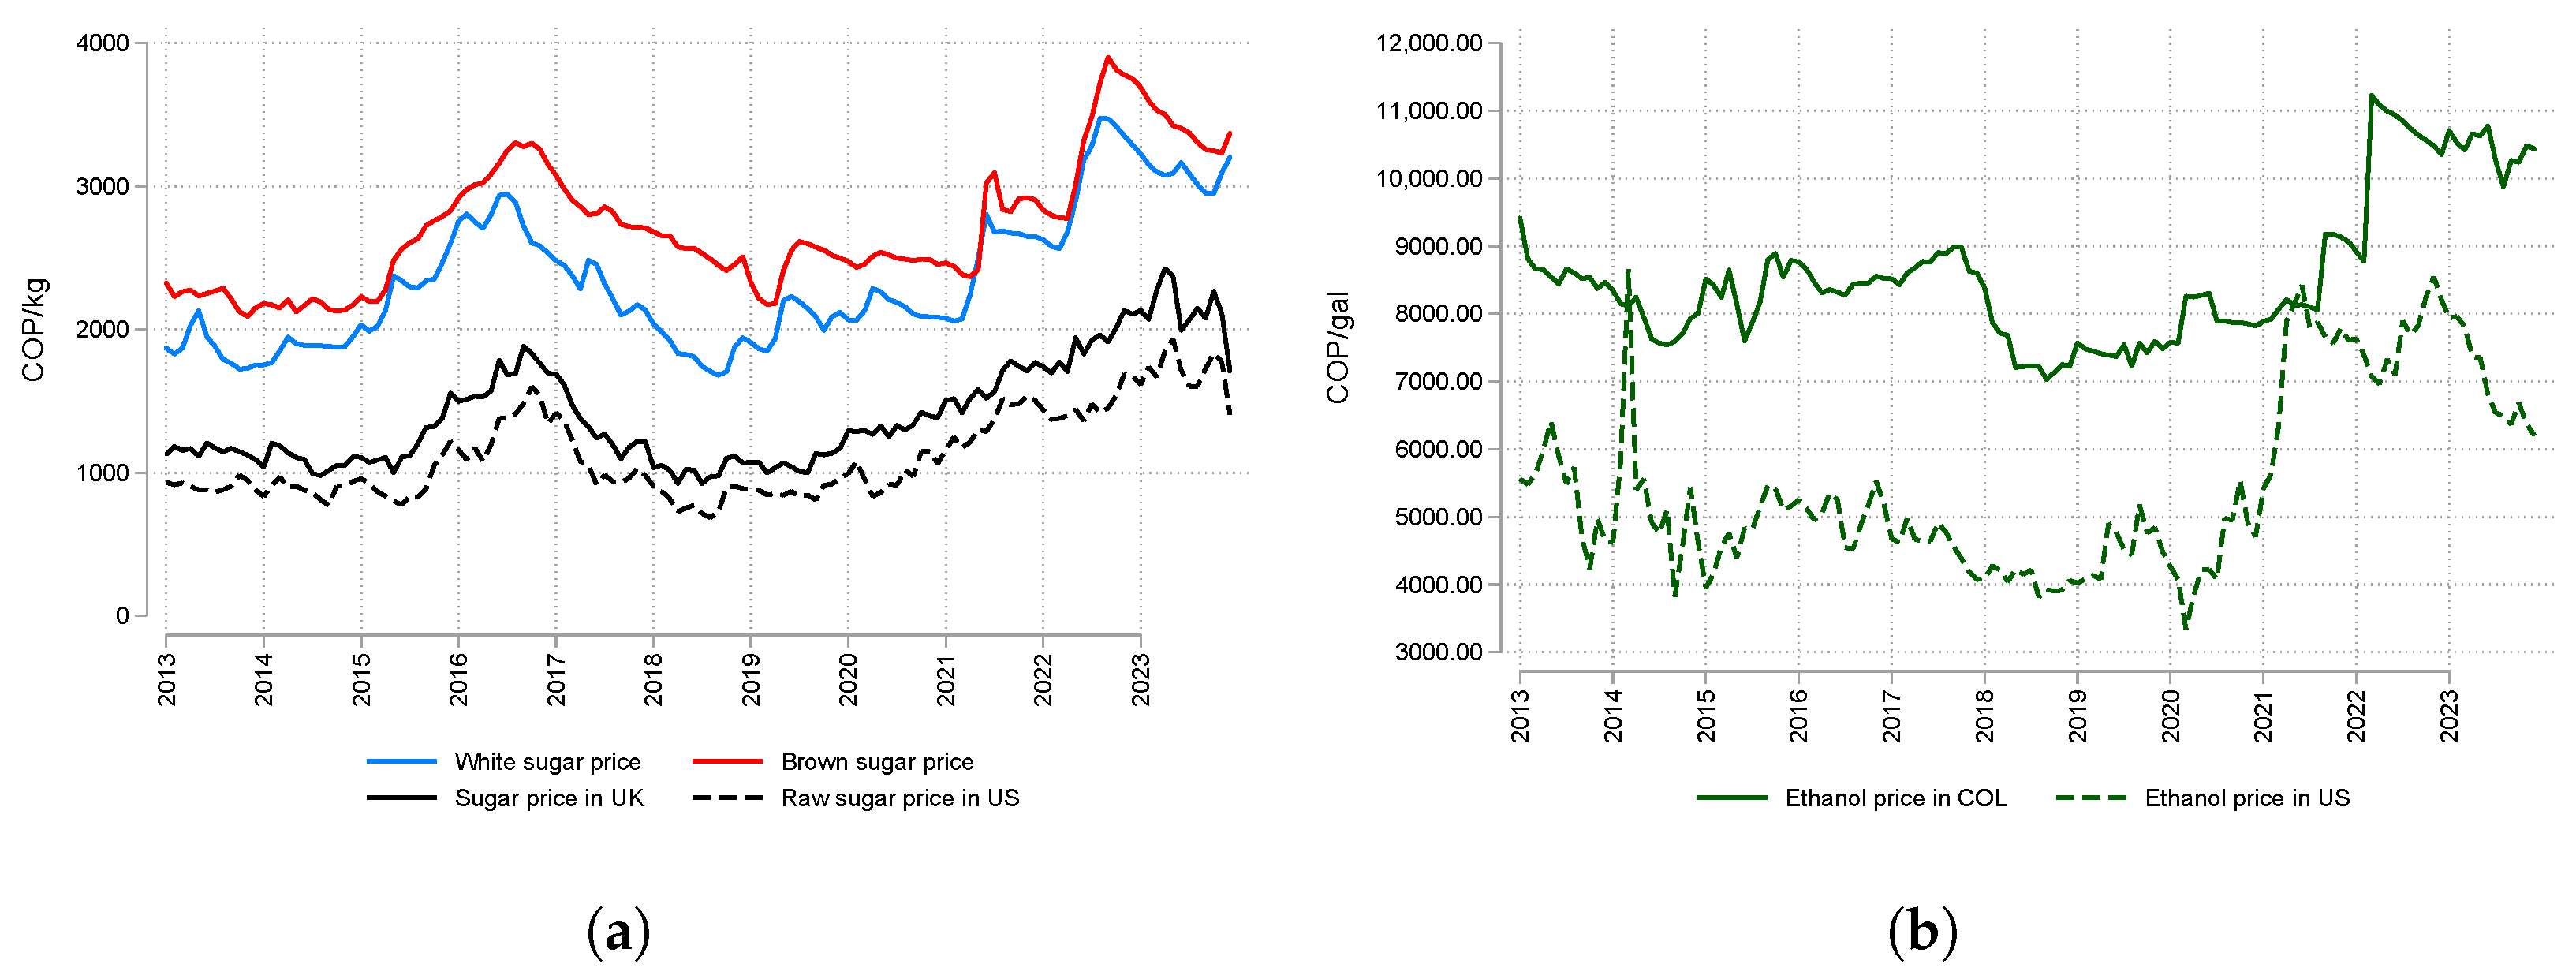
Figure 2 shows the time series of the price of white and brown sugar, together with the international prices of sugar (Panel a) and the price of ethanol with the international price (Panel b). It highlights that the behavior of the sugar price is similar to that of the international prices, which is reasonable given the pricing policy mentioned in the previous section. The price of white sugar tends to fluctuate between 1800 and 3500 COP/kg, and the price of brown sugar is between 2100 and 4000 COP/kg. Regarding the international prices of sugar, its prices fluctuates between 750 and 2500 COP/kg. From 2013 to 2015, the price of sugar was stable; between 2015 and 2016, it experienced an upward trend, which coincided with a fall in sugarcane production. Between 2017 and 2021, the price of sugar decreased and stabilized as production recovered. Finally, between 2021 and 2023, it experienced a sharp rise. The increase in mid-2021 coincided with the National Protests that affected the transportation of inputs and products in Valle del Río Cauca. The pricing policy mentioned above establishes that when ethanol is high, sugarcane growers have incentives to allocate more of their production to ethanol and less to sugar. However, it is not evident in the figure that there is any joint movement in sugar and ethanol prices, except in the period 2021–2023 when sugar and ethanol prices follow a similar behavior. Colombian ethanol prices range between 7000 and 11,000 COP/gal, with strong rises and falls, and US ethanol prices range between 4000 and 9000 COP/gal. Finally, Colombian ethanol prices do not follow international prices as closely as sugar prices.
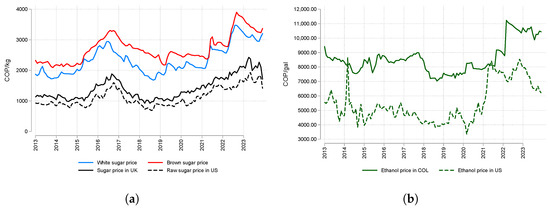
Figure 2.
Prices of sugar and ethanol in Colombia and international prices. (a) Sugar. (b) Ethanol. Source: SIPSA and Asocaña.
Table 1 presents some descriptions of our variables of interest. It highlights that, on average, ethanol prices in Colombia tend to be 56% higher than international prices, and domestic sugar prices tend to be more than double the price of raw sugar. Regarding price variability, international prices tend to be more variable, with a higher ratio of standard deviations to the mean compared to domestic prices.

Table 1.
Descriptive statistics.
The climate data come from two sources: satellite data from Copernicus and data that combine satellite information with weather stations from CHIRPS. The Copernicus data have information at the 30 km grid level for temperature (measured in degrees Fahrenheit, °F). The data are available from 1981 to 2023, with daily frequency. From the shapefile for Colombia, climate data can be added at the municipality level from 1981 to 2023. This paper uses minimum and maximum temperature data converted to Celsius (°C). The European Centre publicly provides these data for Medium-Range Weather Forecasts (ECMWF). Regarding the CHIRPS data, these are available for 1981–2023 and have a 5 km grid level. It uses information on the precipitation level in mm for each grid and averages it to show the municipality’s accumulated daily precipitation for each day. Finally, it aggregates the climate information for all the sugar-producing municipalities in the Valle del Río Cauca, weighting each observation by the official area of each municipality. In this way, it has a measure of daily precipitation in mm and the average daily maximum and minimum temperatures for the Valle del Río Cauca.
Finally, to conclude this data section, the study explains how it constructed the weather shocks in precipitation and temperature. To do so, it closely followed the strategy proposed by Otero-Cortés and Bohorquez-Penuela [9] and Otero-Galindo and Perez [10]. Weather shocks capture extreme behaviors in the climate. These can be calculated for both Copernicus data and CHIRPS data. Since data have a wide time window, they can accurately identify those climate events’ anomalous behaviors [9]. This work calculates weather shocks in the Valle del Río Cauca; that is, it identifies anomalous behaviors in the climate of Valle del Río Cauca for each month of the period 2013–2023.
To identify a temperature shock during the night or day, this study calculates, for the period 1981–2023, the 10th and 90th percentile for minimum temperature for the night and the 10th and 90th percentile for maximum temperature for the day. For each month of the year, it has two thresholds for temperature during the night and another two for the day, a historically low temperature level corresponding to the 10th percentile and a historically high level corresponding to the 90th percentile. This exercise is carried out for each month of the year to consider the seasonal behavior of the climate. Subsequently, it adds the days with a low- or high-temperature shock, in day or night, for each month of 2013–2023. For precipitation, it calculates the total monthly precipitation for each month in 1981–2023 and defines thresholds with the 10th and 90th percentiles for each calendar month, similar to how it is done with temperature. Finally, it defines a weather shock in precipitation for 2013–2032 when the precipitation level is above the 90th percentile threshold or below the 10th percentile threshold. As a robustness exercise, it also calculates the 80th and 20th percentiles of the distributions and defines shocks with these. This way of defining the shocks indicates that it has a measure of the number of days with a temperature shock in the month and a dummy variable for precipitation that measures whether or not there was a precipitation shock in the month.
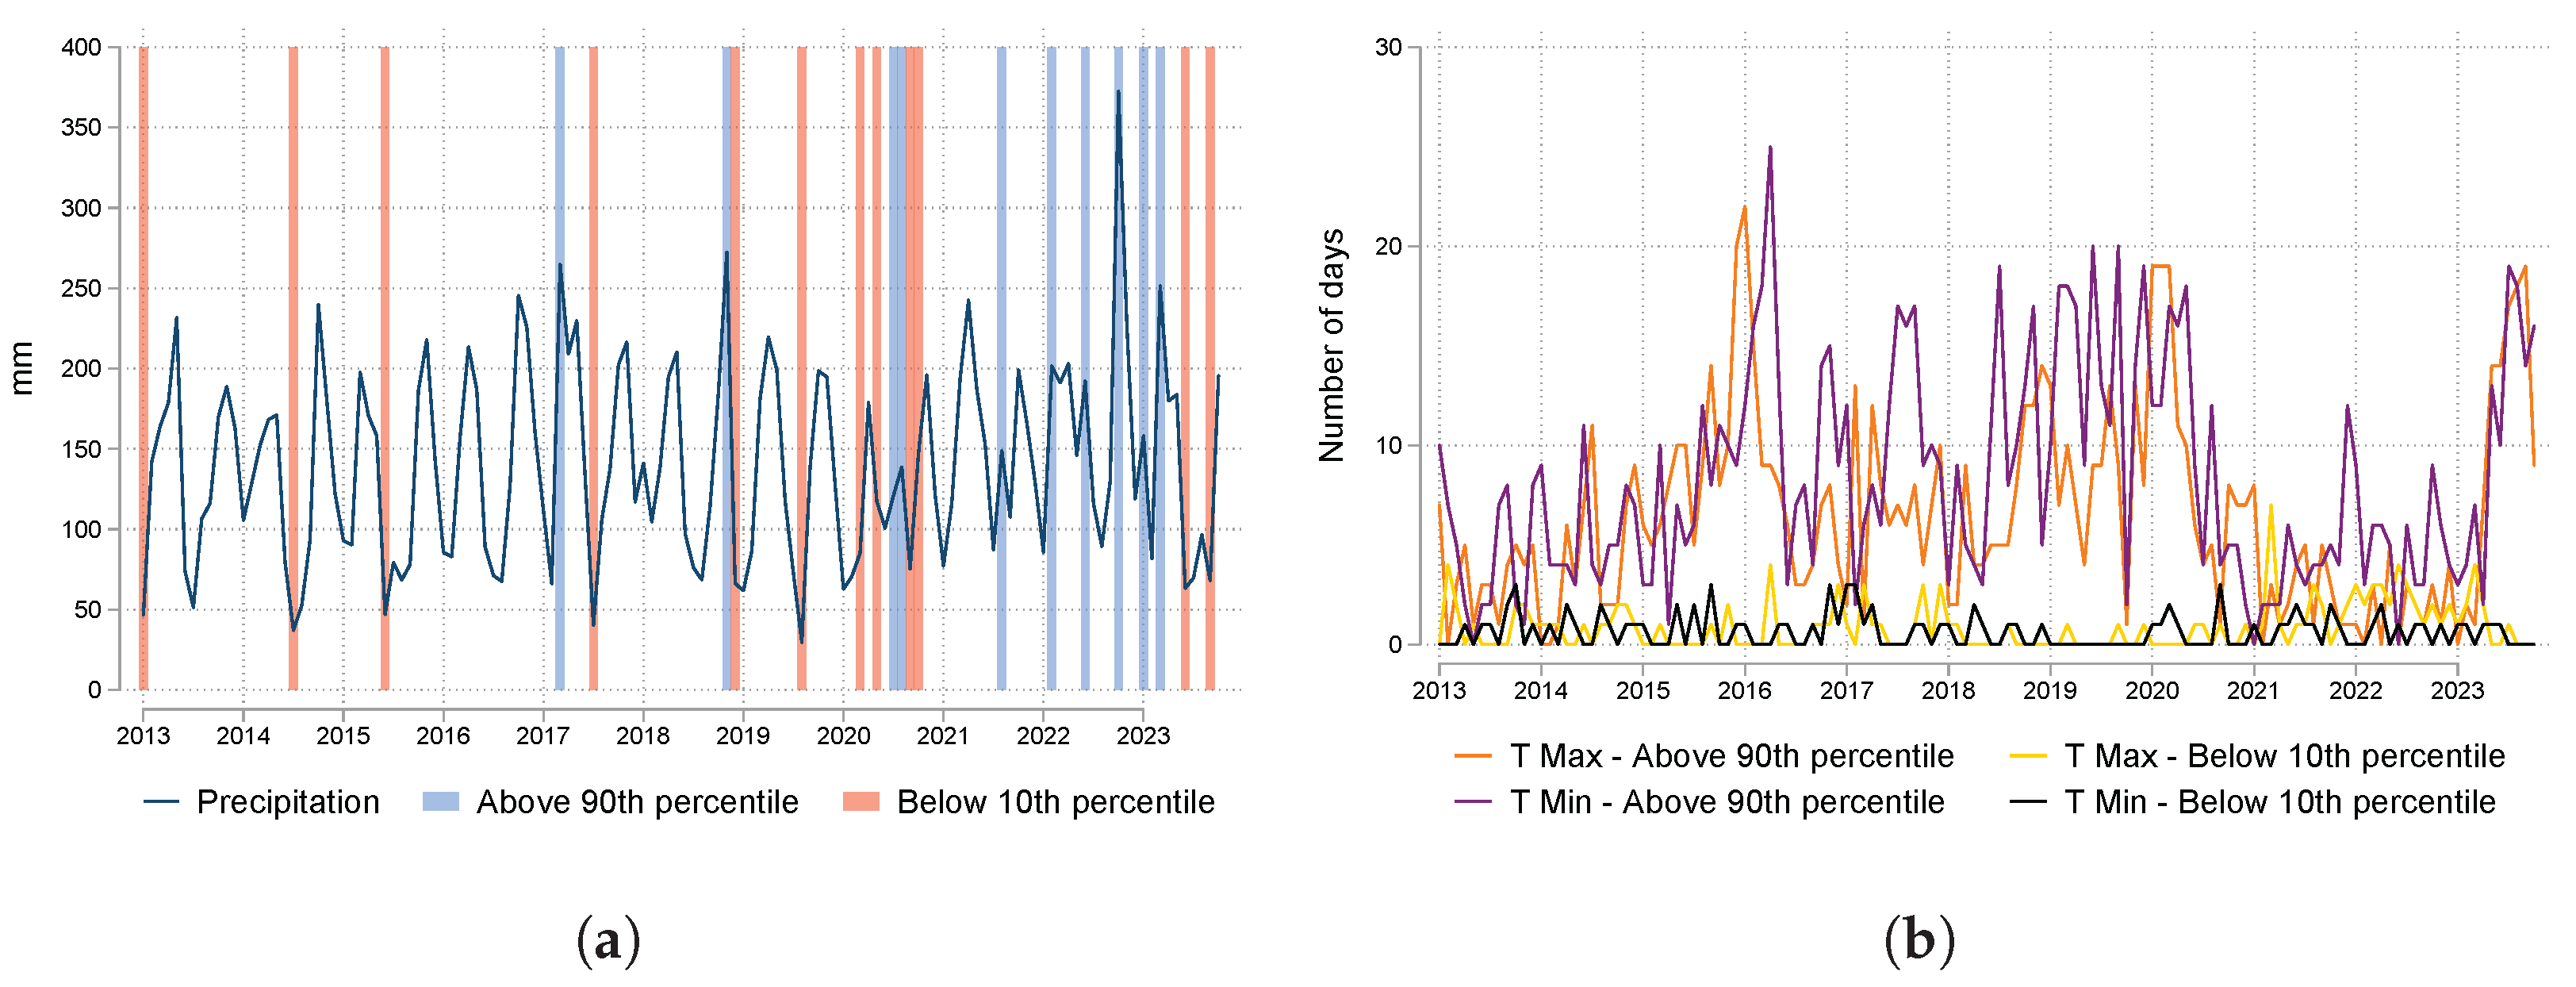
In Figure 3, panel a presents the accumulated precipitation and the presence of weather shocks, while panel b shows the number of days with temperature shocks. All panels present data for each month between January 2013 and October 2023. It uses the shocks defined from the 10th and 90th percentiles of the historical distribution of the Copernicus temperature and CHIRPS precipitation climate series. It highlights that, to a greater extent, sugarcane-growing municipalities have been exposed to high-temperature shocks. The periods 2015–2016 and 2019–2020 are those in which Valle del Río Cauca was exposed to high-temperature shocks, with around 20 days of the month experiencing a high-temperature shock during the day or at night. Regarding precipitation, it finds that the sugarcane-growing municipalities have largely faced both types of shocks, both high and low precipitation. However, low rainfall shocks are the most common in the first part of the study period, and high rainfall the most common in the final part.
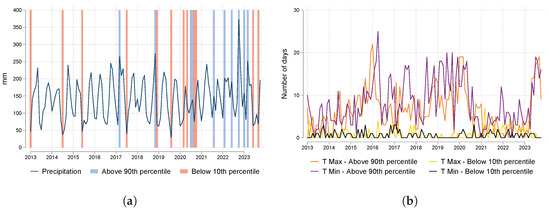
Figure 3.
Climate variables and weather shocks in the Valle del Río Cauca. (a) Precipitation. (b) Temperature. Source: Chirps and Copernicus.
5. Empirical Strategy
5.1. Reduced-Form Evidence
Following Letta et al. [11] and Osborne [12], this study proposes a model that relates the logarithm of prices with variables that identify weather shocks. Sugar prices are reported monthly at supply centers. It proposes a model that relates the average sugar price among supply centers with climatic variables of the sugarcane-producing municipalities in the Valle del Río Cauca and the international prices of reference. It calculates the average value for the last 12 months of weather shocks in precipitation and temperature to do this. It uses the last 12 months of the climatic variables since this corresponds to the minimum expected for the sugarcane cultivation period. This implies it has measurements of the proportion of the last 12 months in which the region experienced precipitation shocks. For temperature, it has the proportion of days in the last 365 days (12 months) in which a temperature shock was recorded. It does not perform additional calculations on the ethanol price since these are reported monthly and do not present a geographical variation.
In this way, our paper studies the effect that weather shocks have on the price of sugar (white or brown) or ethanol r in period t with the following econometric model:
where is the raw sugar price in the US in period , representing the reference price for forming the domestic price of sugar. is the price of ethanol in the US in period . In this way, the model quantifies the pass-through from international to domestic prices. l is the quantity of sugarcane used as an input by sugar mills in the Valle del Río Cauca in period . This variable measures the availability of the primary input in the mills’ sugar and ethanol production. and measure the proportion of the last 12 months with high-precipitation shocks and the proportion of the last 365 days with high-temperature shocks (maximum and minimum). Similarly, and measure the proportion of the last 12 months with low-precipitation shocks and the proportion of the last 365 days with low-temperature shocks (maximum and minimum). As a robustness exercise, thresholds can be defined for the 80th and 20th percentiles of the historical data. represents fixed effects by calendar month to control for seasonality. Finally, is a random error term. Equation (1) is estimated by OLS, and calculates robust standard errors.
5.2. VEC Model with Exogenous Variables
Following Carpio [17], the model defines the vector where y represent the price of brown sugar, white sugar, ethanol in Colombia, raw sugar in the US, and ethanol in the US, respectively. Letting be the first difference operator, it proposes that , where k is the number of lags, has the following form:
represents the exogenous components of the model. Among the elements that it assumes are exogenous are the weather shocks in precipitation and temperature in the Valle del Río Cauca. The assumption that these are exogenous events to the price system is reasonable, given that prices do not influence weather shocks. Still, these events have repercussions on sugarcane production and, therefore, on sugar and ethanol prices. The disturbance term has zero mean, a variance–covariance matrix , and is not autocorrelated. It estimates the system Equation (2) using OLS. Finally, it constructs Orthogonalized Impulse Response Functions (OIRFs) between the endogenous variables of the model and presents in a table how weather shocks affect sugar and ethanol prices. Since it includes the raw sugar price and ethanol price in the US, it can test some interesting hypotheses about the degree of exogeneity of the international prices. That is, it expects that domestic prices in Colombia will not determine the international prices and that weather shocks in Colombia will not affect the formation of prices in the US.
6. Results
6.1. Sugar Prices, Ethanol Price, and Weather Shocks in Reduced Form
Table 2 presents the results of estimating Equation (1), which represents a reduced-form relationship between sugar prices and ethanol prices with weather shocks, controlling for relevant variables to the formation of prices. Columns 1–3 present the estimates with the price of white sugar as dependent variable; in columns 4–6, with the price of brown sugar; and in columns 7–9, with ethanol. Columns 1, 4, and 7 do not include measures of weather shocks and only include the relevant variables such as the international prices, and the amount of sugarcane used as input by sugar mills. In columns 2, 5, and 8, it adds measures of weather shocks defined with the 90th and 10th percentiles, and in columns 3, 6, and 9, it has weather shocks defined with the 80th and 20th percentiles. Standard errors are computed from OLS.

Table 2.
Reduced-form estimations.
The results in Table 2 show that there is a 58% pass-through from the raw sugar price in the US to the price of brown sugar and 65% for white sugar; however, when controlling for weather shocks, these fall to around 13% and 23%, respectively. Considering that the FEPA softens the impact of variations in international sugar prices on domestic sugar, the existence of an incomplete pass-through from raw sugar in the US to domestic sugar is reasonable. However, it is noteworthy that this pass-through is lower in the presence of extreme weather events, which indicates that mills tend to be more reluctant to move their prices in response to potential shocks in production, which is consistent with mills’ exercise of market power to decide sugar prices. Regarding the price of ethanol in the US, it finds a direct relationship with the price of brown and white sugar, which is consistent with the hypothesis that sugar mills substitute sugar and ethanol as ethanol prices are higher, forcing sugar prices to rise to make its production more profitable for sugar mills due to the opportunity cost that ethanol represents. For Colombian ethanol prices, it finds evidence of a direct relationship with raw sugar prices in the US. This is reasonable given that sugar and ethanol compete for the input of sugarcane, and an increase in sugar prices increases the opportunity cost of using sugarcane to produce ethanol. It does not find a significant relationship between domestic and international ethanol prices, which is evidence that the sugar price is the primary reference for setting ethanol prices in Colombia.
Regarding weather shocks, it finds evidence that they have relevant effects on sugar and ethanol prices. On the temperature side, low- and high-temperature shocks during the day tend to increase sugar and ethanol prices. This evidence is consistent with the results of Otero-Galindo and Perez [10] on the drops in production due to high-temperature shocks during the day. On the precipitation side, low-precipitation shocks reduce sugar prices, and high-precipitation shocks increase sugar and ethanol prices. This evidence is consistent with the results of Otero-Galindo and Perez [10] and Carter et al. [16] about high-precipitation shocks as negative supply shocks. However, these results are subject to a potential endogeneity problem. The following section explores how to address the simultaneity problem between sugar and ethanol prices.
6.2. Results of VEC Model with Exogenous Variables
Table 3 presents evidence that the price series have a unit root. The ADF test, whose null hypothesis is the presence of a unit root, does not reject the hypothesis for the series in levels but does for the series in first differences. With this evidence, the estimation of a VEC form is suggested. Table 4 presents the results of the Johansen procedure, which show evidence of cointegration between the series; the null hypothesis of zero cointegration vectors () is rejected. These results suggest the estimation of a VEC form. Following the AIC and BIC information criteria, this model chooses lags for the VEC estimation. In Table A1 and Table A2 in the Appendix A, the tests of VEC stability and autocorrelation of the error term are presented. These tests indicate that no specification problems are presented by the VEC model that we are proposing. Additionally, the fact that the variables in levels have a unit root and cointegration between them indicates that the results of Table 2 can be interpreted as long-term relationships between the variables of interest.

Table 3.
Unit-root tests.

Table 4.
Cointegration tests.
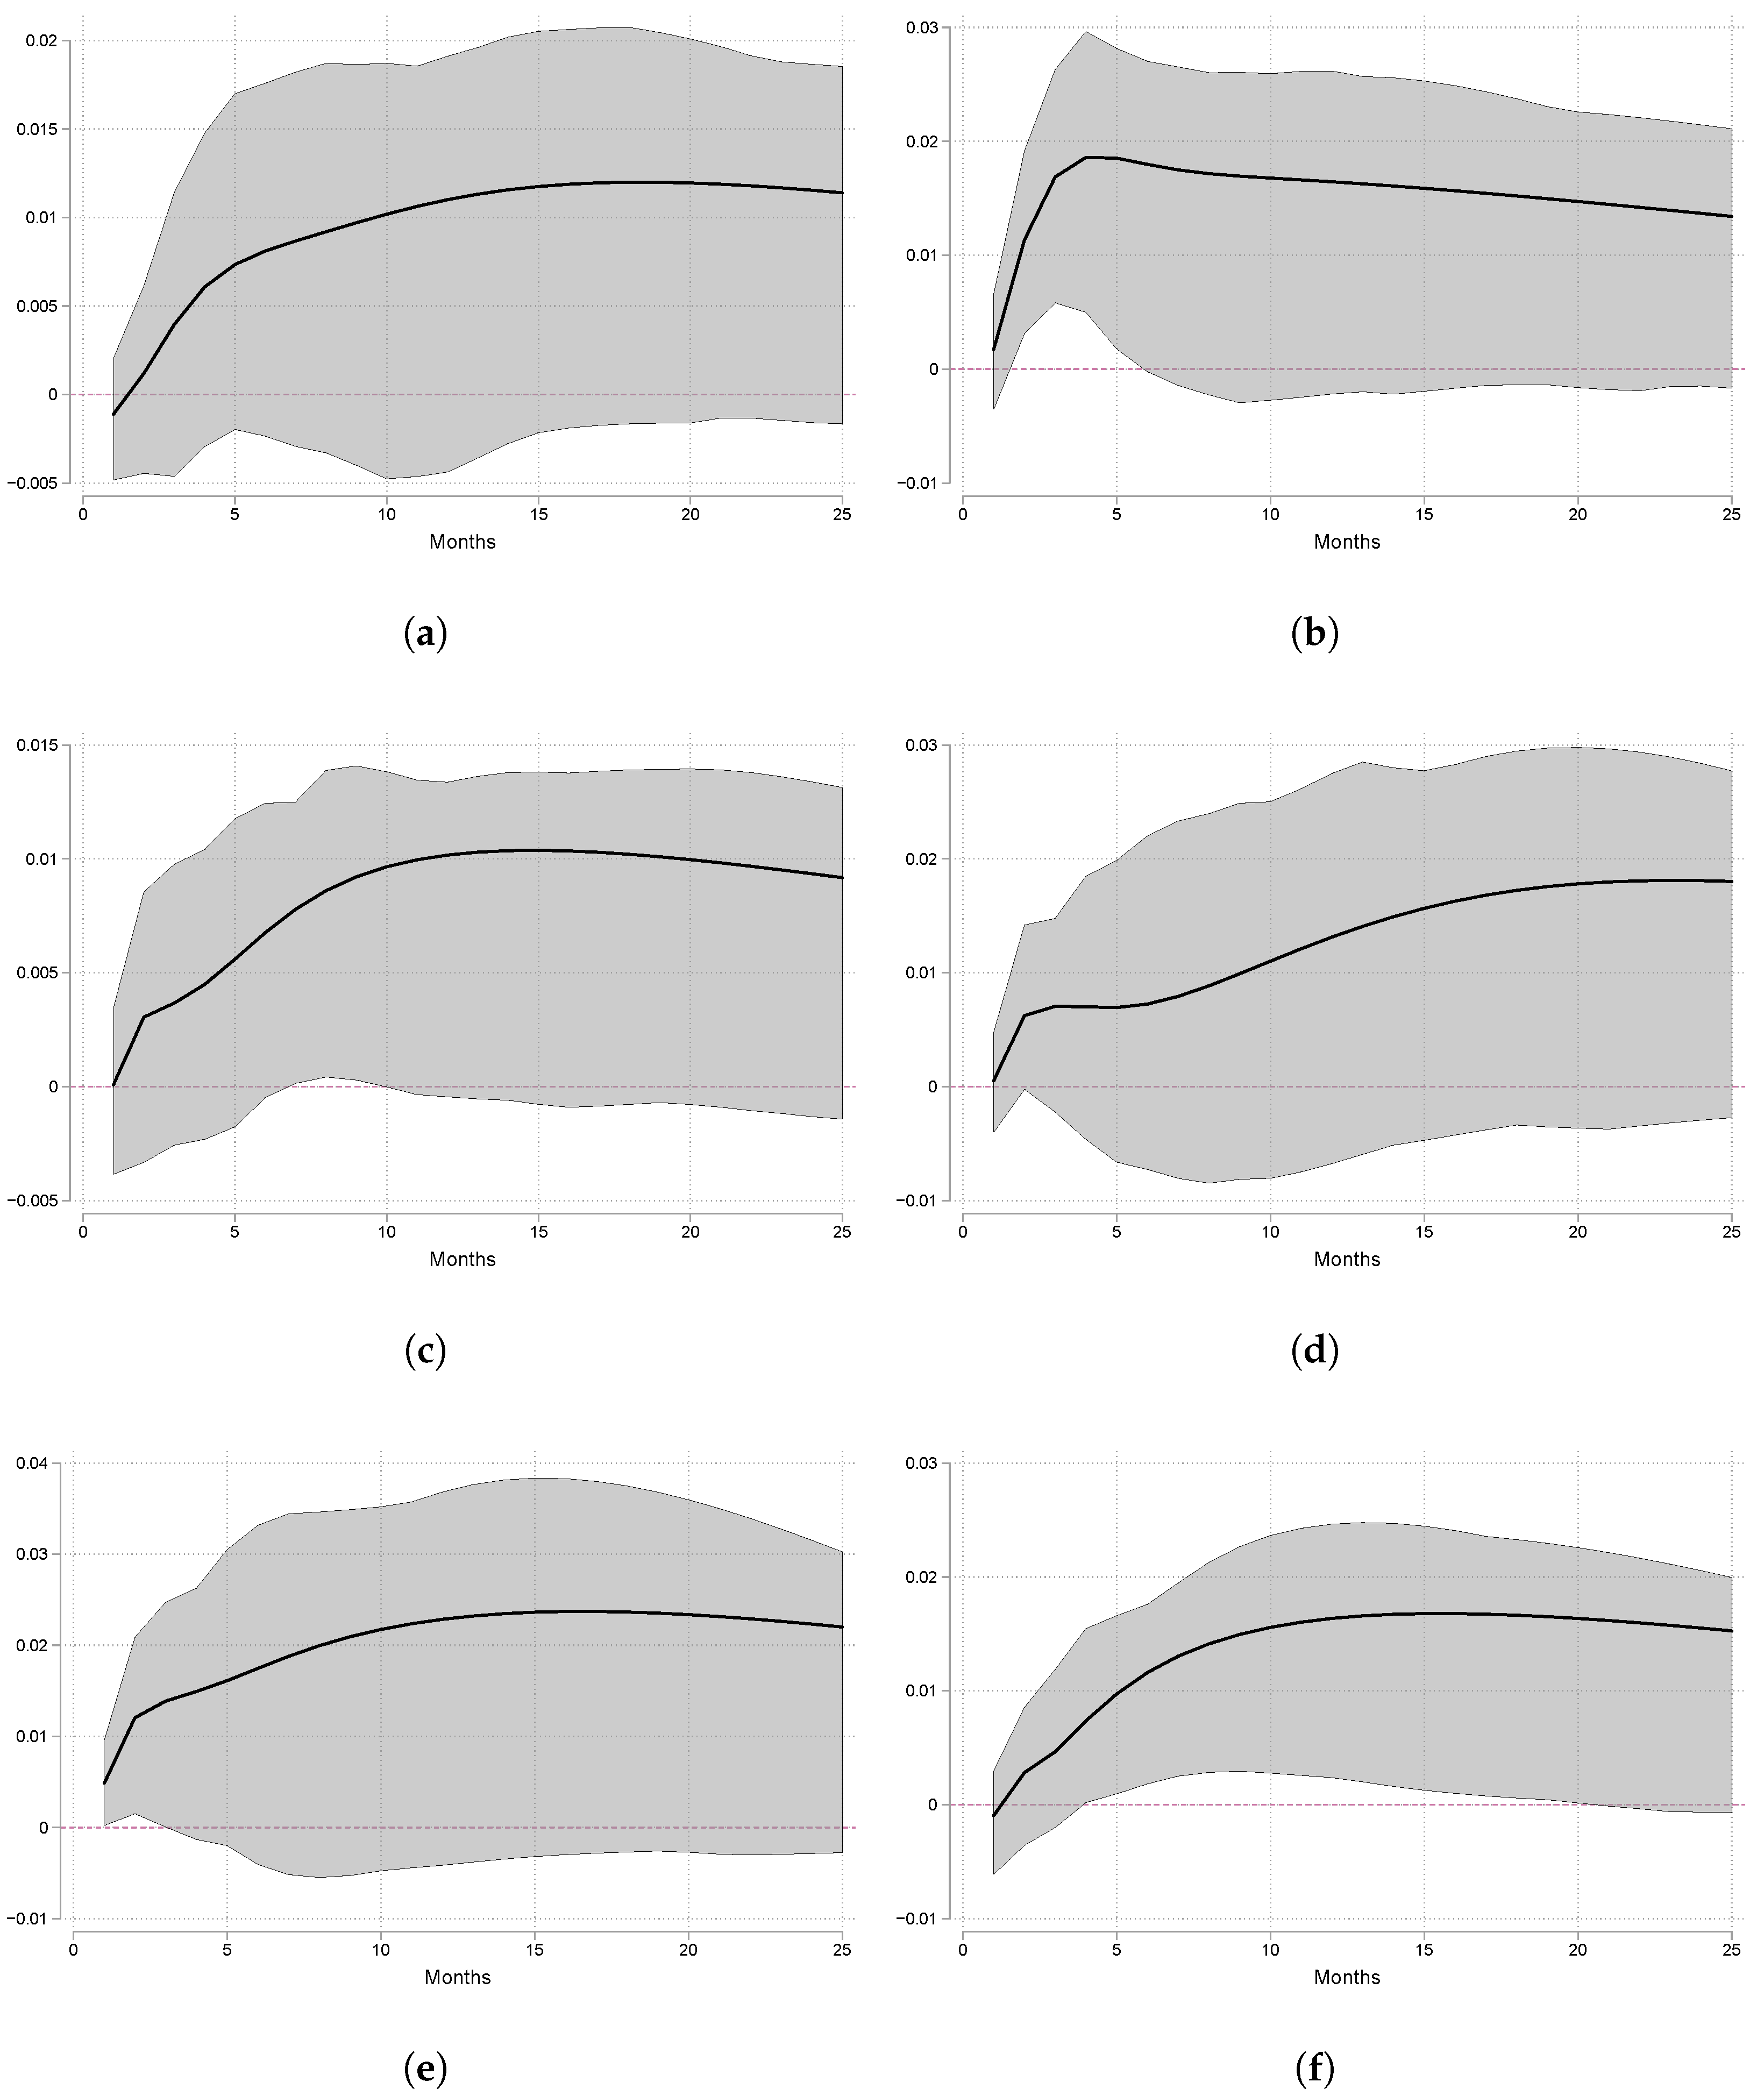
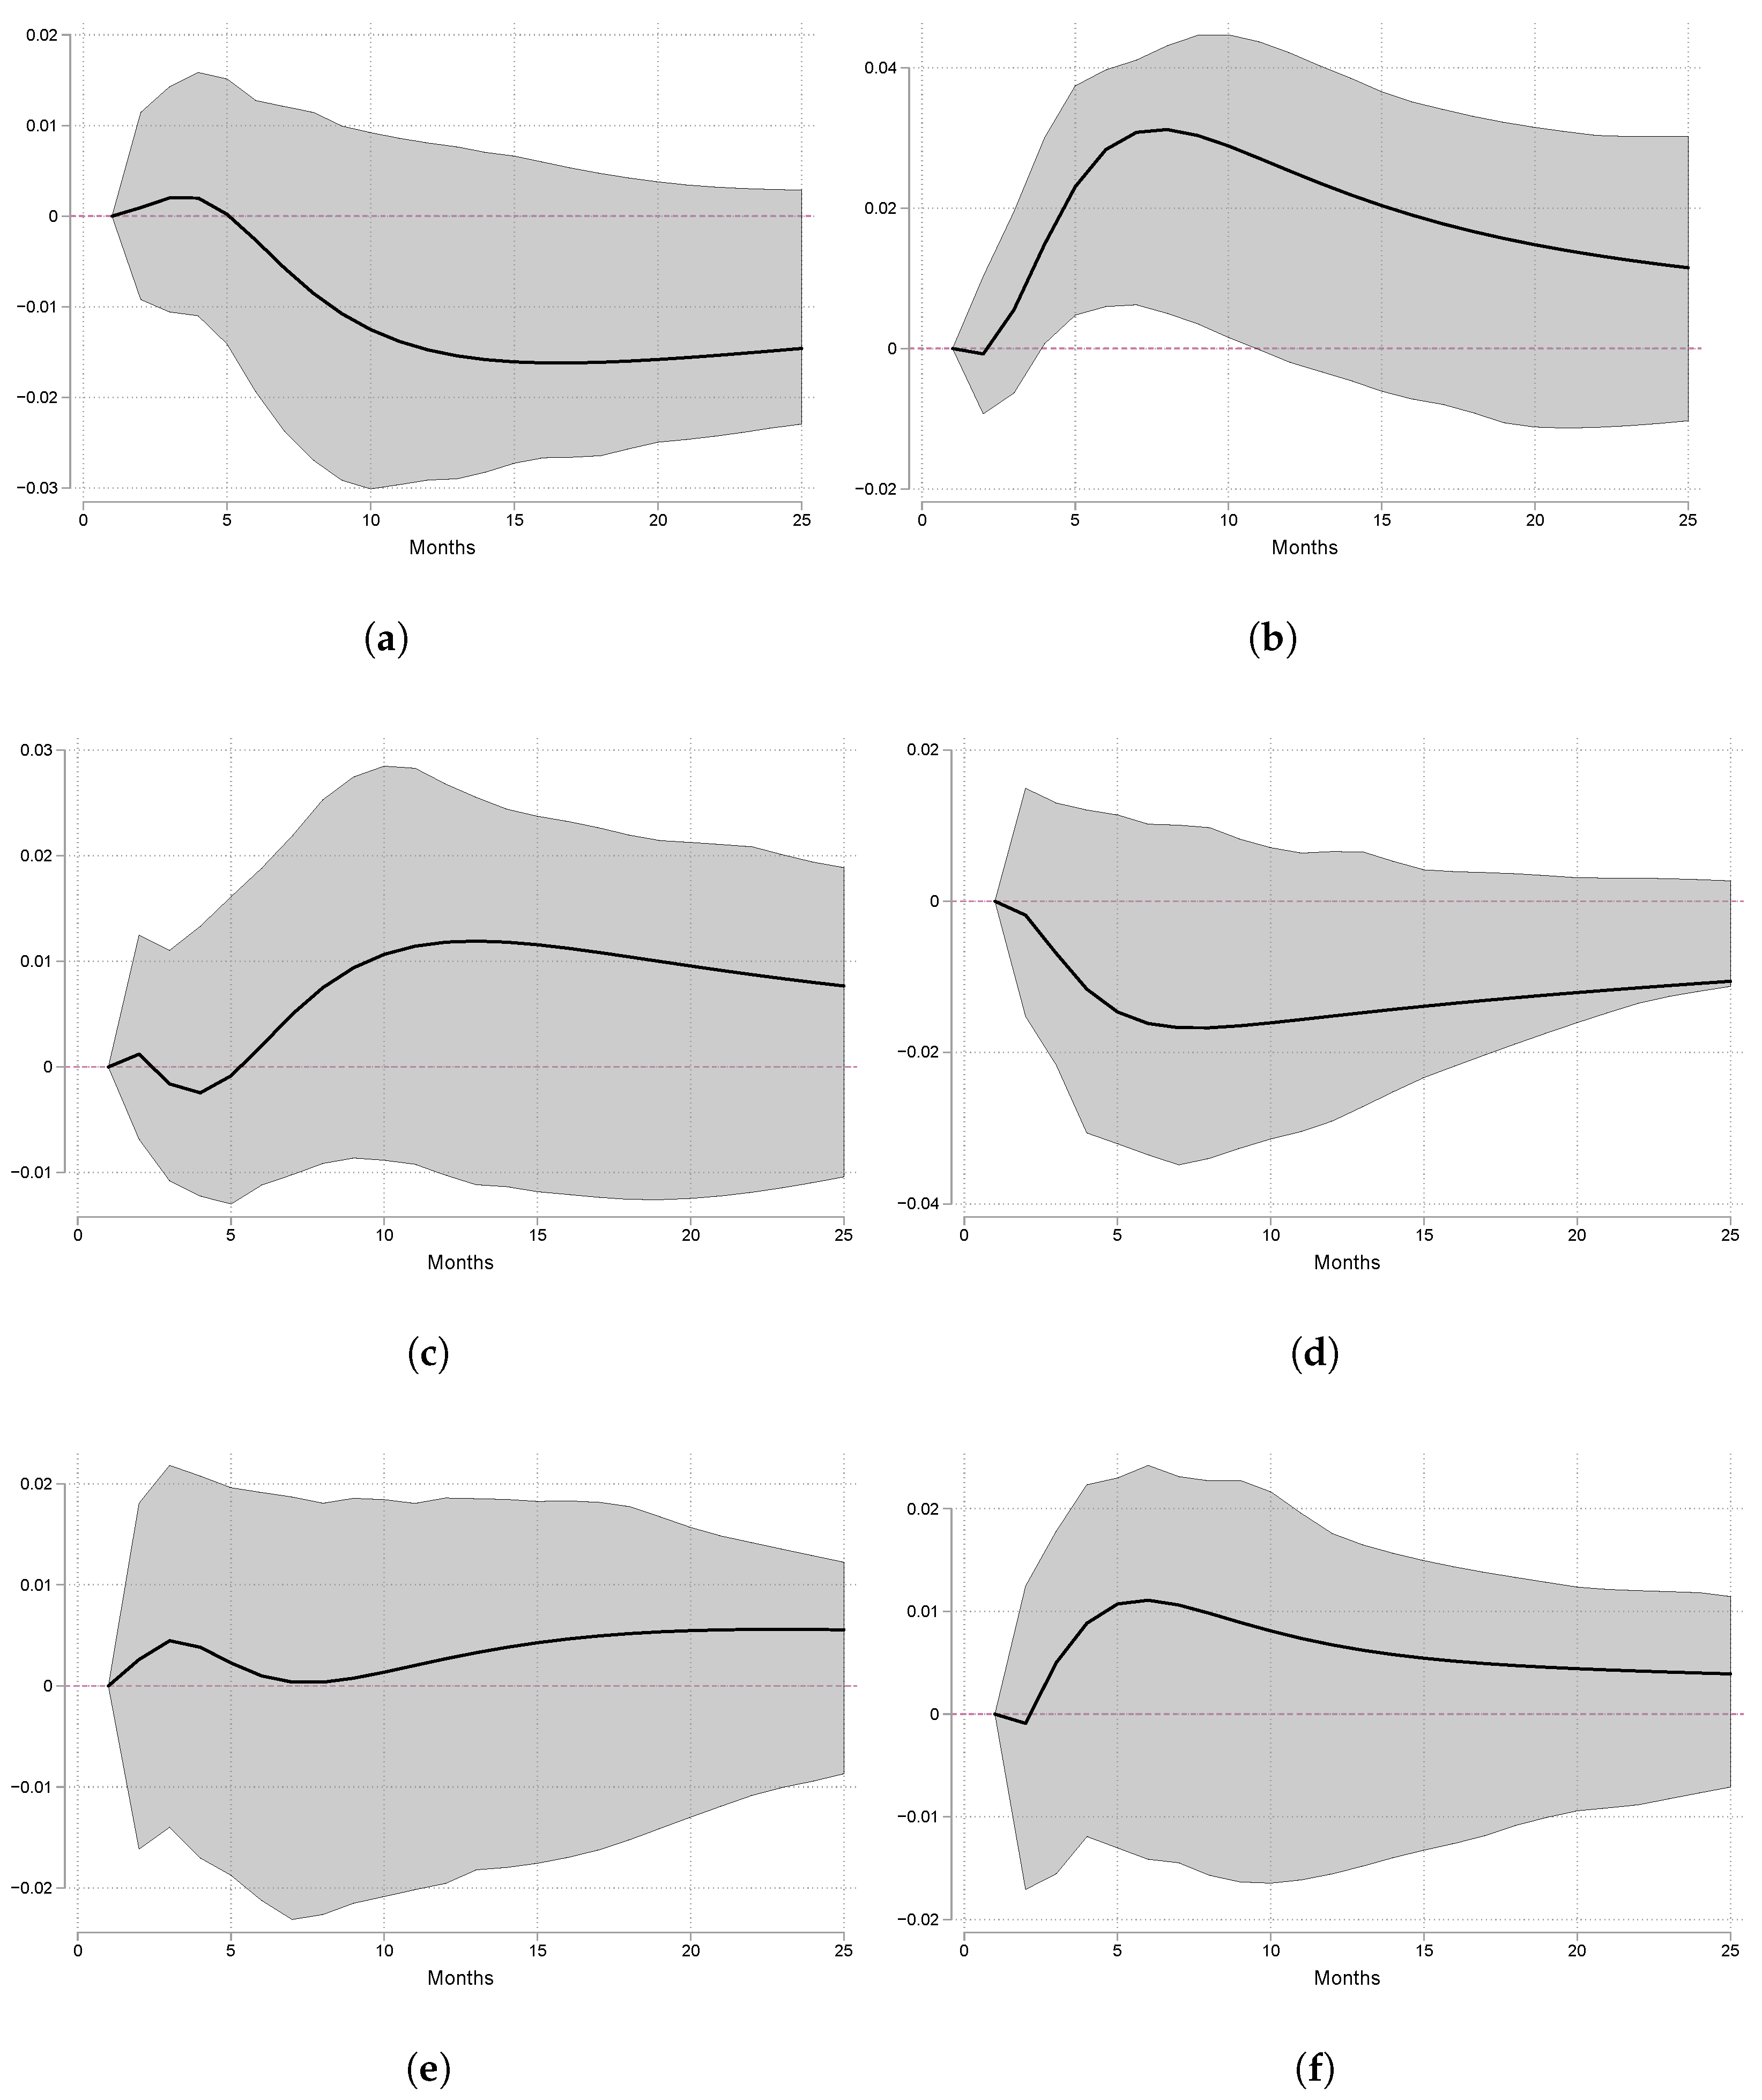
Figure 4 presents the OIRF of the domestic sugar and ethanol price series in response to a shock in international prices. The evidence indicates that white sugar and ethanol prices tend to increase in response to a shock in international prices in sugar and ethanol. White sugar prices react to raw sugar prices in the US, while brown sugar prices do not, which can be explained by the fact that brown sugar represents an additional step in the production chain to the white sugar production process. Regarding the price of ethanol, the magnitude of the effect on the latter is smaller, which is reasonable given that raw sugar is not an input for producing ethanol. However, it does determine its price, given that sugar competes with ethanol for the input, which is sugarcane. Regarding the reaction to a shock in ethanol price in the US, the response of Colombian ethanol is greater and longer than that of white sugar, which responds for only a few months.
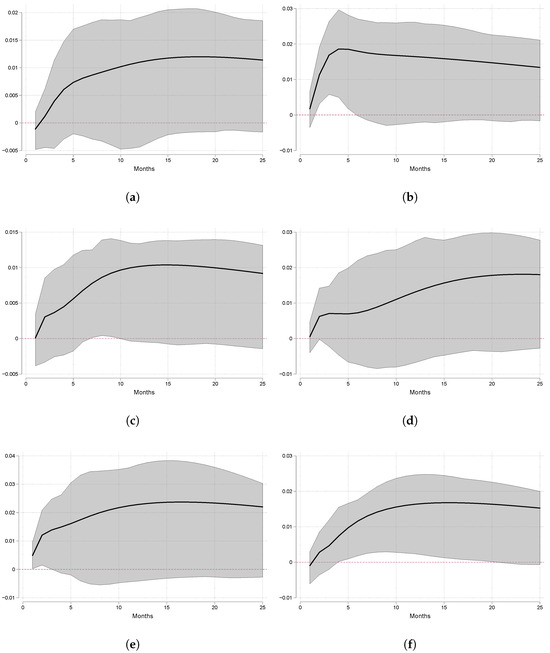
Figure 4.
OIRF with international prices as impulse (95% CI). (a) Brown sugar (Impulse: Raw sugar in US). (b) White sugar (Impulse: Raw sugar in US). (c) Ethanol (Impulse: Raw sugar in US). (d) Brown sugar (Impulse: Ethanol in US). (e) White sugar (Impulse: Ethanol in US). (f) Ethanol (Impulse: Ethanol in US).
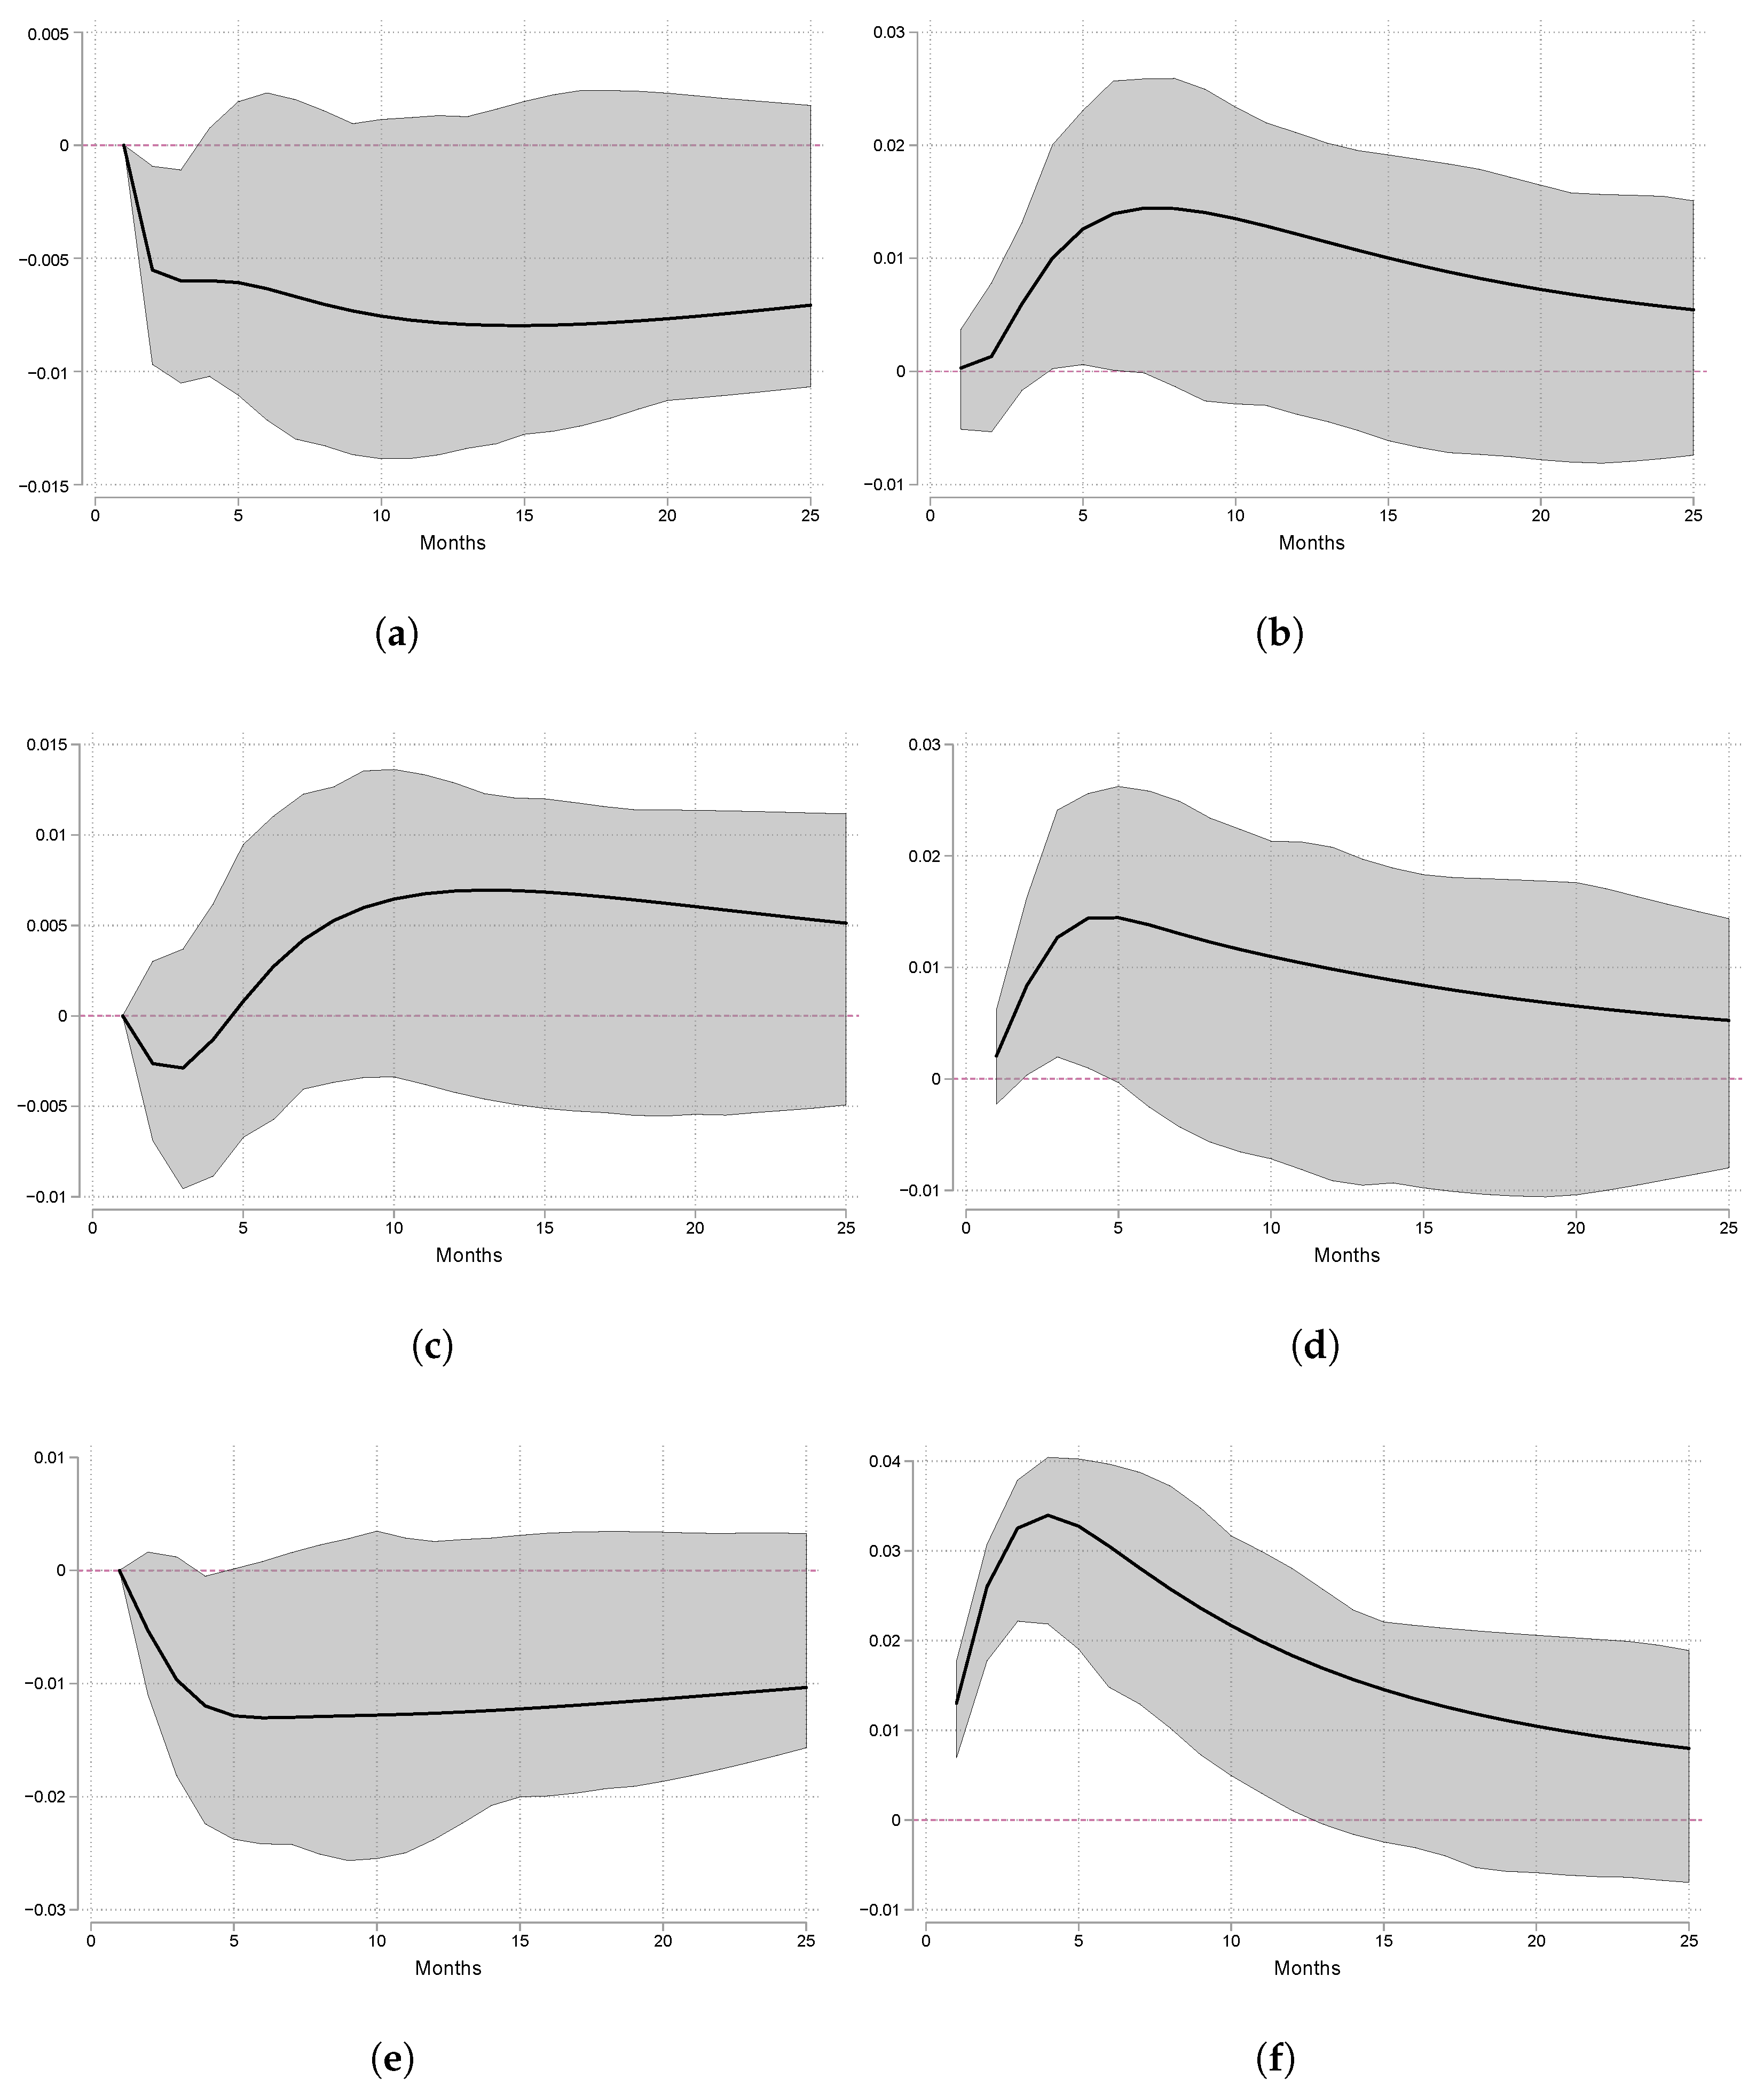
On the other hand, Figure 5 presents the OIRF of the raw sugar and ethanol price in the US as a response to a shock in domestic prices. The evidence indicates that international prices do not react to shocks in ethanol and brown sugar prices. However, there is a period in which the international price of raw sugar reacts to shocks in the price of white sugar. Colombia’s sugar exportations to international markets such as the US explain this result. This evidence shows that the international sugar price is not entirely exogenous, as one might initially suggest. Additionally, the evidence indicates that US ethanol prices are exogenous to Colombian prices.
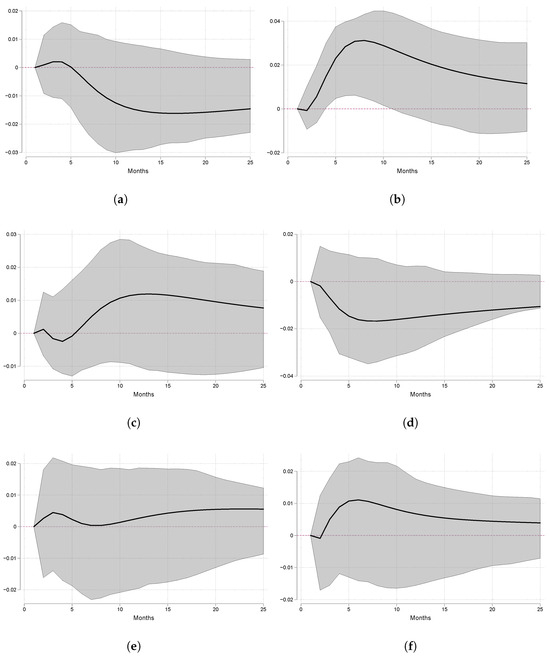
Figure 5.
OIRF with international prices as response (95% CI). (a) Raw sugar in US (Impulse: Brown sugar). (b) Raw sugar in US (Impulse: White sugar). (c) Raw sugar in US (Impulse: Ethanol). (d) Ethanol in US (Impulse: Brown sugar). (e) Ethanol in US (Impulse: White sugar). (f) Ethanol in US (Impulse: Ethanol).
Regarding how domestic prices are simultaneously determined, Figure 6 presents the OIRF between the domestic, sugar, and ethanol price series. It highlights that there is evidence that shocks in the price of ethanol increase sugar prices, but shocks in the price of sugar decrease the price of ethanol. However, the decrease in the price of ethanol is small—in practical terms, zero. This exercise shows that the sugar mills set their sugar prices by watching with interest how the Ministry chooses the ethanol prices. However, when setting the ethanol prices, the Ministry shows no interest in the sugar prices decided by the mills. Regarding how the prices of white and brown sugar are determined by each other, it finds that white sugar prices do not react to shocks in brown sugar prices, except during the fourth month, when a slight reduction is recorded with a 95% confidence interval. Furthermore, brown sugar prices increase with a shock in white sugar. This is reasonable given that brown sugar is refined sugar with an added caramel; it is an additional step to producing white sugar.
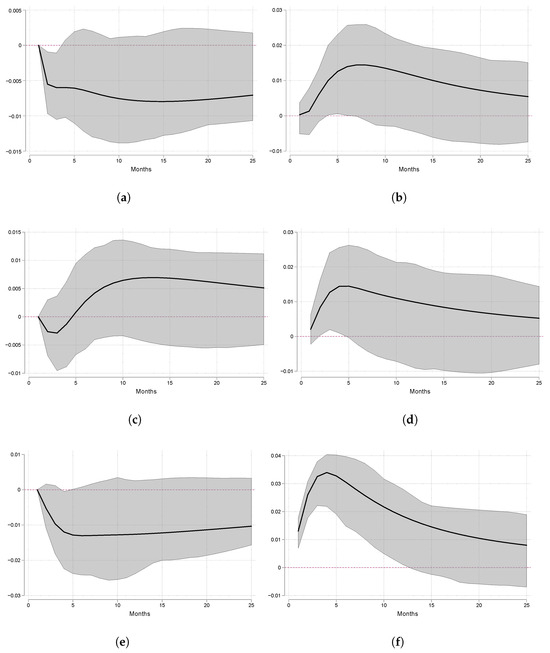
Figure 6.
OIRF between domestic prices of sugar and ethanol (95% CI). (a) Ethanol (Impulse: Brown sugar). (b) Brown sugar (Impulse: Ethanol). (c) Ethanol (Impulse: White sugar). (d) White sugar (Impulse: Ethanol). (e) White sugar (Impulse: Brown sugar). (f) Brown sugar (Impulse: White sugar).
An advantage of estimating OIRFs is that they give us indications of the order of exogeneity of the variables of interest, or in other words, show which variables are the most endogenous in the system. Based on the analysis of the previous OIRF, it highlights that the most exogenous variable in the system is the price of ethanol in the US, followed by raw sugar in the US, which are determined by a wide range of international factors, not just the Colombian prices. Next in order of exogeneity is the domestic price of ethanol, which is reasonable given that this variable is determined by the Ministry of Energy based on fuel prices and the observation of the availability of the primary input (sugarcane) for its production. Among the sugar prices, the most endogenous is the price of brown sugar, which is reasonable given that brown sugar is refined sugar with an addition of caramel, an additional step to the process for white sugar. Therefore, it is reasonable that brown sugar is the most endogenous. This order respects global economic relations and the production processes linking these products.
Table 5 presents how the variables of interest of the VEC react to the exogenous components of the model, which are the weather shocks. Table 5 shows that international sugar prices do not react to weather shocks. This is explained because the effects of climatic events on sugarcane are indirectly transmitted to international sugar prices through Colombian sugar prices, not directly. However, the model found evidence that the international price of ethanol decreases when high-temperature shocks at night occur in Colombia’s sugarcane-producing area. We believe that this result may reflect the effect of the correlation between climatic phenomena in Colombia and other producing countries, given that high temperatures at night are usually associated with phenomena such as El Niño, which also has detrimental effects on sugarcane production in Brazil and Australia. Furthermore, domestic sugar prices increase with low- and high-temperature shocks during the day. These shocks are associated with negative supply shocks in sugarcane production, making the primary sugar production input more expensive and raising sugar prices. These results are consistent with Table 2. Regarding Colombian ethanol price, the model finds no evidence that it is affected by weather shocks.

Table 5.
VEC estimation: prices and weather shocks.
Finally, this paper discusses how weather shocks are transmitted to the entire system. Since weather shocks are an exogenous component of the VEC, this implies that they can be interpreted as unanticipated shocks. One climate shock of interest is high-temperature shocks; due to global warming, such shocks are expected to become more frequent and severe during the next decades. From Table 5, it is known that daytime high-temperature shocks raise sugar prices, both white and brown. From the OIRFs the study has presented, an unanticipated shock in white and brown sugar implies an increase in the international sugar price, it has no practical effect on the international and domestic ethanol prices, and the price of brown sugar reacts more strongly since an unexpected increase in the price of white sugar raises its price. This implies that, in the event of high-temperature shocks, the price of brown sugar increases substantially, followed by white sugar prices and, to a lesser extent, international sugar prices. These shocks have practically no effect on ethanol’s international and domestic price.
7. Conclusions
This paper studies the link between sugar and ethanol prices and the role played by weather shocks, using data from Colombia’s main sugar-producing area, Valle del Río Cauca. This area produces sugar for both the domestic and export markets. The study utilizes climate information found on CHIRPS (precipitation) and Copernicus (temperature). Then, it proposes two ways to address the relationship between sugar, ethanol, and weather shocks. First, it proposes a reduced-form approach where sugar and ethanol prices are a function of the international prices and weather shocks. Second, to address the potential simultaneity problem between the variables, it estimates a VEC with exogenous variables, with the exogenous component being the weather shocks.
When the study performs stationarity tests on the variables in levels, it finds that the unit root hypothesis is not rejected. Additionally, the Johansen test indicates that cointegration exists. This implies that the proposed reduced-form approach can be interpreted as long-term relationships between the variables of interest. It found a 13–24% pass-through from the international price to domestic prices of sugar, controlling for weather shocks. Regarding the international price of ethanol, the study finds a direct relationship with the domestic prices of sugar, which is consistent with the hypothesis that sugar mills substitute sugar and ethanol as ethanol prices are higher, forcing sugar prices to rise to make its production more profitable for sugar mills due to the opportunity cost that ethanol represents. Regarding weather shocks, it finds evidence that they have relevant effects on sugar prices. On the temperature side, low- and high-temperature shocks during the day and high-precipitation shocks tend to increase sugar prices, and low- and high-temperature shocks during the night tend to decrease prices.
The study finds four interesting results when approaching the simultaneity problem through a VEC form. First, a shock to the international prices increases the domestic prices of sugar and ethanol. Second, a shock in white sugar prices increases the US raw sugar prices. This result shows that the international price of raw sugar is not completely exogenous to the formation of the domestic price in Colombia due to the connection between these prices through export markets. Third, a shock to ethanol prices increases sugar prices, but a shock to sugar prices does not affect ethanol prices. Finally, it found that temperature shocks during the day increase sugar prices. These results are consistent with the reduced form.
The study highlighted that the most exogenous variable in the system is the price of ethanol in the US, followed by the raw sugar in the US, which is determined by a wide range of international factors, not just the Colombian market. Next in order of exogeneity is the price of ethanol in Colombia, which is reasonable given that this variable is determined by the Ministry of Energy based on fuel prices and the observation of the availability of the primary input (sugarcane) for its production. Among the sugar prices, the most endogenous is the price of brown sugar, which is reasonable given that brown sugar is refined sugar with an addition of caramel, an additional step to the process for white sugar. Therefore, it is reasonable that brown sugar is the most endogenous. This order respects global economic relations and the production processes linking these products.
Our study reveals several relevant public policy implications for Colombia. First, given that weather shocks affect sugar prices, climate change adaptation policies in the sugar sector must be strengthened through agricultural insurance, resilient technologies, and climate monitoring. Second, the influence of the ethanol price on sugar indicates a substitution relationship that should be considered in designing more flexible energy policies and stabilization mechanisms between sectors. Third, the partial transmission of international prices to the domestic market, along with the ability of local prices to influence international prices, suggests that Colombia should strengthen its commercial intelligence and strategically position itself in global markets. Fourth, given that the state determines the price of ethanol in Colombia but affects sugar asymmetrically, regulatory frameworks should be reviewed to ensure consistency between agricultural profitability and energy objectives. Finally, the greater endogeneity of the price of brown sugar compared to white sugar and ethanol justifies segmenting policies by product type, promoting value-added markets and differentiated support lines according to the degree of processing.
Author Contributions
Conceptualization, A.P.L. and L.A.M.C.; methodology, J.A.C.; software, J.A.C. and B.Q.; validation, D.C. and A.P.G.; formal analysis, J.A.C. and L.A.M.C.; data curation, B.Q., D.C. and A.P.G.; writing—original draft preparation, J.A.C. and A.P.L.; writing—review and editing, L.A.M.C. and B.Q. All authors have read and agreed to the published version of the manuscript.
Funding
This research received no external funding.
Data Availability Statement
https://drive.google.com/drive/folders/1redo7dAioaA1dtS_F2hORyYrU7H2XDl5?usp=drive_link, accessed on 1 February 2025.
Conflicts of Interest
The authors declare no conflicts of interest.
Abbreviations
The following abbreviations are used in this manuscript:
| SIPSA | Sistema de Informacion de Precios y Abastecimiento del Sector Agropecuario |
| DANE | Departamento Administrativo Nacional de Estadistica |
| FEPA | Fondo de Estabilizacion de Precios del Azucar |
| Asocaña | Asociacion de Cultivadores de Caña de Azucar |
Appendix A

Table A1.
VEC estimation: test of stability.
Table A1.
VEC estimation: test of stability.
| Eigenvalue | Modulus |
|---|---|
| 1 | 0.9751535 |
| 2 | 0.8874618 |
| 3 | 0.8014257 |
| 4 | 0.7187569 |
| 5 | 0.7187569 |
| 6 | 0.4701873 |
| 7 | 0.4701873 |
| 8 | 0.1899152 |
| 9 | 0.1000248 |
| 10 | 0.1000248 |

Table A2.
VEC estimation: test of autocorrelation.
Table A2.
VEC estimation: test of autocorrelation.
| Breusch-Godfrey LM Test | Edgerton-Shukur Test | |
|---|---|---|
| Lags | p-Value | p-Value |
| 1 | 0.25637 | 0.3794 |
| 2 | 0.39653 | 0.58341 |
| 3 | 0.34609 | 0.57402 |
| 4 | 0.42188 | 0.67971 |
| 5 | 0.20134 | 0.38304 |
| 6 | 0.11241 | 0.23269 |
| 7 | 0.08308 | 0.13906 |
| 8 | 0.18132 | 0.30343 |
| 9 | 0.03644 | 0.04251 |
| 10 | 0.0276 | 0.02974 |
| 11 | 0.03413 | 0.03359 |
| 12 | 0.03424 | 0.04598 |
References
- Tanaka, T.; Guo, J.; Wang, X. Did biofuel production strengthen the comovements between food and fuel prices? Evidence from ethanol-related markets in the United States. Renew. Energy 2023, 217, 119142. [Google Scholar] [CrossRef]
- Guo, J.; Tanaka, T. Energy security versus food security: An analysis of fuel ethanol-related markets using the spillover index and partial wavelet coherence approaches. Energy Econ. 2022, 112, 106142. [Google Scholar] [CrossRef]
- Vacha, L.; Janda, K.; Kristoufek, L.; Zilberman, D. Time–frequency dynamics of biofuel–fuel–food system. Energy Econ. 2013, 40, 233–241. [Google Scholar] [CrossRef]
- Palacio-Ciro, S.; Vasco-Correa, C.A. Biofuels policy in Colombia: A reconfiguration to the sugar and palm sectors? Renew. Sustain. Energy Rev. 2020, 134, 110316. [Google Scholar] [CrossRef]
- Congreso de Colombia. Ley 693 de Septiembre 19 de 2001; Congreso de la República de Colombia: Bogotá, Colombia, 2001. Available online: https://www.funcionpublica.gov.co/eva/gestornormativo/norma.php?i=19114 (accessed on 1 February 2025).
- Congreso de Colombia. Ley 939 de Diciembre 31 de 2004; Congreso de la República de Colombia: Bogotá, Colombia, 2004. Available online: https://www.funcionpublica.gov.co/eva/gestornormativo/norma.php?i=15594 (accessed on 5 February 2025).
- Garcia, H.; Calderon, L. Evaluación de la Política de Biocombustibles en Colombia; Fedesarrollo: Bogotá, Colombia, 2012; Available online: http://hdl.handle.net/11445/338 (accessed on 7 March 2025).
- Meneses-Ceron, L.A.; van Klyton, A.; Rojas, A.; Muñoz, J. Climate Risk and Its Impact on the Cost of Capital—A Systematic Literature Review. Sustainability 2024, 16, 10727. [Google Scholar] [CrossRef]
- Otero-Cortés, A.; Bohorquez-Penuela, C. Blame It on the Rain: The Effects of Weather Shocks on Formal Rural Employment in Colombia; Documento de Trabajo sobre Economía Regional y Urbana; Banco de la Republica de Colombia: Bogotá, Colombia, 2020. [Google Scholar]
- Otero-Galindo, D.; Perez, A. From paddy rice to white rice: Weather shocks and the Rice Market in Colombia. Rev. Agric. Food Environ. Stud. 2025, in press.
- Letta, M.; Montalbano, P.; Pierre, G. Weather shocks, traders’ expectations and food prices. Am. J. Agric. Econ. 2022, 104, 1100–1119. [Google Scholar] [CrossRef]
- Osborne, T. Market news in commodity price theory: Application to the Ethiopian grain market. Rev. Econ. Stud. 2004, 71, 133–164. [Google Scholar] [CrossRef]
- Lima, C.R.A.; de Melo, G.R.; Stosic, B.; Stosic, T. Cross-correlations between Brazilian biofuel and food market: Ethanol versus sugar. Phys. A Stat. Mech. Its Appl. 2019, 513, 687–693. [Google Scholar] [CrossRef]
- Greenland, D. Climate variability and sugarcane yield in Louisiana. J. Appl. Meteorol. Climatol. 2005, 44, 1655–1666. [Google Scholar] [CrossRef]
- Everingham, Y.L.; Reason, C.J.C. Interannual variability in rainfall and wet spell frequency during the New South Wales sugarcane harvest season. Int. J. Climatol. 2011, 31, 144–152. [Google Scholar] [CrossRef]
- Carter, C.A.; Schaefer, K.A.; Scheitrum, D. Raising cane: Hedging calamity in Australian sugar. J. Commod. Mark. 2021, 21, 100126. [Google Scholar] [CrossRef]
- Carpio, L.G.T. The effects of oil price volatility on ethanol, gasoline and sugar price forecasts. Energy 2019, 181, 1012–1022. [Google Scholar] [CrossRef]
- Palazzi, R.B.; Meira, E.; Klotzle, M.C. The sugar-ethanol-oil nexus in Brazil: Exploring the pass-through of international commodity prices to national fuel prices. J. Commod. Mark. 2022, 28, 100257. [Google Scholar] [CrossRef]
- Balcombe, K.; Rapsomanikis, G. Bayesian estimation and selection of nonlinear vector error correction models: The case of the sugar-ethanol-oil nexus in Brazil. Am. J. Agric. Econ. 2008, 90, 658–668. [Google Scholar] [CrossRef]
- Ministerio de Agricultura. Cadena Caña de Azúcar: Dirección de Cadenas Agrícolas y Forestales, Segundo Trimestre de 2021; Ministerio de Agricultura y Desarrollo Rural de Colombia: Bogotá, Colombia, 2021.
- Preciado-Vargas, M.; Chica-Ramirez, H.A.; Solarte-Rodriguez, E.; Carbonell-Gonzalez, J.A.; Peña-Quiñones, A.J. Regional wind pattern, a basis for defining the appropriate lapse of time for sugarcane burning in the Cauca Valley (Colombia). Environ. Dev. Sustain. 2021, 23, 9477–9492. [Google Scholar] [CrossRef]
Disclaimer/Publisher’s Note: The statements, opinions and data contained in all publications are solely those of the individual author(s) and contributor(s) and not of MDPI and/or the editor(s). MDPI and/or the editor(s) disclaim responsibility for any injury to people or property resulting from any ideas, methods, instructions or products referred to in the content. |
© 2025 by the authors. Licensee MDPI, Basel, Switzerland. This article is an open access article distributed under the terms and conditions of the Creative Commons Attribution (CC BY) license (https://creativecommons.org/licenses/by/4.0/).

