Article

Assessing Thermal Comfort in Green and Conventional Office Buildings in Hot Climates

by
Abdulrahman Haruna Muhammad
*,
Ahmad Taki
and
Sanober Hassan Khattak
Institute of Sustainable Futures, De Montfort University, Leicester LE1 9BH, UK
*
Author to whom correspondence should be addressed.
Sustainability 2025, 17(15), 7078; https://doi.org/10.3390/su17157078
Submission received: 24 May 2025 / Revised: 26 July 2025 / Accepted: 31 July 2025 / Published: 5 August 2025

Abstract

Green buildings are recognised for their potential to reduce energy consumption, minimise environmental impact, and improve occupants’ well-being, benefits that are especially critical in rapidly urbanising regions. However, questions remain about whether these buildings fully meet occupant comfort expectations while delivering energy efficiency. This is particularly relevant in Africa, where climate conditions and energy infrastructure challenges make sustainable building operation essential. Although interest in sustainable construction has increased, limited research has examined the real-world performance of green buildings in Africa. This study helps address that gap by evaluating indoor thermal comfort in a green-certified office building and two conventional office buildings in Abuja, Nigeria, through post-occupancy evaluation (POE). The Predicted Mean Vote (PMV) and Thermal Sensation Vote (TSV) were used to assess comfort, revealing discrepancies between predicted and actual occupant responses. In the green building, PMV indicated near-neutral conditions (0.28), yet occupants reported a slightly cool sensation (TSV: −1.1). Neutral temperature analysis showed that the TSV-based neutral temperature (26.5 °C) was 2.2 °C higher than the operative temperature (24.3 °C), suggesting overcooling. These findings highlight the importance of incorporating occupant feedback into HVAC control. Aligning cooling setpoints with comfort preferences could improve satisfaction and reduce unnecessary cooling, promoting energy-efficient building operation.

1. Introduction

Over the last century, heating, ventilation, and air conditioning (HVAC) systems have become widely used to create comfortable indoor environments. However, these systems are energy-consuming, consuming up to 30–50% of a building’s energy [1] and contributing about 15% to the global consumption of energy [2]. With the high energy consumption and environmental impacts, the concept of “green buildings” has been developed to promote resource-efficient and sustainable building practices [3]. Green buildings are designed to minimise health risks while increasing the occupants’ comfort and productivity [4]. In recent years, the application of green building practices has significantly increased all over the world [5].
Certification systems such as BREEAM in the United Kingdom, LEED in the United States, and Green Star in Australia have been developed to improve the quality of buildings with regard to energy efficiency, ecological sustainability, and occupant comfort [6]. These certification systems measure different performance dimensions, such as energy consumption, environmental impacts, and occupants’ satisfaction, against standards that address design, construction and continuous management [7]. Since their origination in the 1970s, green building rating systems have shifted from an initial focus on energy efficiency and occupant health, including concerns about sick building syndrome to broader sustainability issues, such as environmental health risks and material emissions, climate change issues, and the concept of “healthy buildings” [8].
In Nigeria, although the adoption of green building practices is still relatively new, the number of green-certified projects is gradually increasing [9]. Although still perceived as costly and constrained by limited availability of green materials and weak infrastructure, the market is growing, particularly with the introduction of programmes such as IFC’s EDGE certification, which targets 20% certification of new buildings in select sub-sectors by 2023. As of 2025, projections indicate that green-certified office buildings could represent up to 25% of new builds within their sub-sector, with an overall market penetration of 13% across all building types [10]. Despite this growing interest, there is still a research gap in the aspect of operational performance of green buildings in Nigeria. It remains unclear whether such buildings meet expectations, or their occupants are satisfied with their indoor environmental conditions.

1.1. Occupant Satisfaction in Green Office Buildings

Building designers strive for higher levels of green certification by adopting green building practices to improve environmental performance. Those practices can also impact the indoor environment perception of occupants [11]. While green certification systems rate buildings on a range of criteria, such as energy efficiency, water conservation, and materials selection, the extent to which these systems affect occupants’ satisfaction with IEQ factors continues to be a topic of active debate [6]. Previous research has shown that occupant satisfaction with indoor environmental quality tends to be higher in certified green buildings than in conventional ones. For example, Lee and Kim [12] compared IEQ in LEED-certified and non-LEED-certified U.S. office buildings, finding superior thermal comfort in the LEED-certified. Similarly, a study on IEQ satisfaction among office workers in Taiwan by Liang et al. [13] found that people working in green buildings were more satisfied with the thermal condition than those working in conventional buildings. Menadue, Soebarto and Williamson [4] likewise found a slightly greater satisfaction with thermal comfort in green office buildings. Recent results from Harčárová and Vilčeková [5] demonstrated that LEED-certified offices generally offered acceptable thermal comfort. Similarly, Mao et al. [14] showed that green buildings in Guangzhou provided better thermal comfort, which could significantly enhance the satisfaction level of occupants compared to non-green buildings.
However, some studies could not identify a correlation between green building certification and increased occupant satisfaction with indoor environmental conditions. In the study by Nkini et al. [15] on both green and non-green office buildings in Dar es Salaam, Tanzania, they found that occupants of green buildings reported dissatisfaction with temperature control, which they cited to be a result of overly cold air conditioning. Similarly, Gou et al. [16] established that despite green certification, a significant proportion of green office building occupants complained about discomfort associated with thermal conditions, particularly during the peak seasons of summer and winter. In another study, Gou and Lau [17] found that although a green office building was able to keep its expected level of thermal environment, occupants still complained of discomfort, caused by low temperatures in both summer and winter. Research in a Malaysian green office building by Lakhiar et al. [18] found discrepancies between the objective measurements and occupants’ perceptions, where the environment met the thermal comfort criteria based on the Predicted Mean Vote (PMV) model, but still the occupants felt it cooler than expected. These studies, along with their key findings, are also outlined in Table 1.

1.2. Previous Thermal Comfort Studies on Office Buildings in Nigeria

Thermal comfort research in Nigeria, though relatively limited, has provided valuable insights into the comfort conditions of office buildings across different climatic zones. Several studies have focused on identifying neutral temperatures and comfort ranges in Nigerian office environments. Adebamowo, Sangowawa and Godwin [24] examined air-conditioned office buildings in Lagos, proposing a summer operative temperature range of 22–24 °C. However, their study suggested that raising the design temperature to 25 °C ± 2 °C could improve energy efficiency without significantly affecting thermal comfort. Similarly, Jimoh and Demenongu-Demshakwa [25] investigated thermal sensation and acclimatisation in naturally ventilated office buildings in Jos, establishing a neutral temperature of 29.4 °C.
Jimoh and Umar [26] further explored thermal comfort in 10 naturally ventilated administrative office buildings in Jos, employing the adaptive psychrometric chart based on the ASHRAE 55 adaptive method. Their findings indicated a neutral operative temperature of 29.0 °C. Meanwhile, Musa et al. [27] assessed thermal comfort and occupant satisfaction in a mixed-mode office building in Bauchi. Despite air temperatures exceeding the PMV model’s comfort range, respondents reported high satisfaction and comfort levels, reinforcing the argument that acclimatisation plays a key role in thermal perception. In Enugu, Efeoma [28] identified a neutral temperature of 28.8 °C for office workers, with 80% of occupants experiencing thermal satisfaction within a comfort range of 25.4 °C to 32.2 °C.
The literature suggests that while green-certified buildings are designed to improve energy efficiency while enhancing occupant comfort, evidence of their performance in improving occupant satisfaction with indoor thermal conditions remains inconsistent. In Nigeria, research on thermal comfort has largely focused on conventional office buildings, with limited studies investigating occupant experiences in green-certified buildings. This study addresses that gap by evaluating thermal comfort conditions in a LEED-certified office building in Abuja and comparing the findings with those from two conventional buildings. The specific objectives are as follows:
  • To compare occupant satisfaction with indoor thermal conditions in green-certified and conventional office buildings.
  • To evaluate discrepancies between predicted and actual occupant perceptions of thermal comfort.
  • To analyse the neutral temperature range in both building types based on thermal sensation responses.

2. Methods

This study adopts post-occupancy evaluation (POE) to compare thermal comfort levels in green-certified with conventional office buildings in Abuja, Nigeria. POE has become one of the important methodologies in assessing building performance, providing a framework to examining occupied buildings to derive lessons that will enhance their operational conditions and inform future design practice [29,30]. The primary objective of ‘green’ design is to develop buildings that successfully fulfil their designated purposes upon occupation [31]. As thermal comfort is a critical aspect of occupant satisfaction and operational success, POE enables direct feedback from users, making it particularly well-suited for evaluating indoor environmental quality in real-world contexts.
Significant research has been conducted to examine the relationship between green office buildings and occupant satisfaction using POE. For example, Esfandiari et al. [32] integrated full-scale measurements and a questionnaire survey in the assessment of occupants’ satisfaction in green-certified office buildings in tropical climates; Elnaklah et al. [19] used POE to examine how transitioning from conventional to green office buildings affects occupant satisfaction, while Kim and Kim [11] emphasised that POE is essential for identifying the factors affecting satisfaction and dissatisfaction to improve IEQ in green buildings.
The study combines two essential elements of the POE method: subjective assessments to collect occupants’ responses on their perception of thermal comfort, as well as objective measurements of thermal comfort parameters, including air temperature, mean radiant temperature, air velocity, and relative humidity. These parameters were used to determine the predicted mean vote (PMV), a widely used model for predicting thermal comfort in air-conditioned environments [33,34]. The integration of the PMV calculations with the survey enabled an in-depth assessment of the indoor environmental conditions.

2.1. Study Area

Abuja, the Federal Capital Territory of Nigeria, is situated at latitude 9°07′ N and longitude 7°48′ E. Abuja sits at an elevation of 840 m (2760 ft) above sea level and lies within West Africa’s coverage area and savannah vegetation region interspersed with small areas of rainforest [35,36]. This city has a tropical climate that experiences two seasons, i.e., the rainy season and the dry season. The rainy season is the period from April to October and receives rainfall of between 305 and 762 mm (12–30 inches). The dry season, which is similar to summer in the temperate parts of the world, lasts from November to March, with daytime temperatures reaching up to 40 °C and nighttime temperatures dropping as low as 12 °C due to dry winds [35,36,37].

2.2. Buildings’ Description

The study began with the selection of two green-certified office buildings in Abuja. To enable a comparison, two conventional office buildings (CBs) were also selected. Comparing a green-certified office building with conventional counterparts allows for a performance benchmark to be established. This helps evaluate whether green buildings truly deliver improved thermal comfort and energy efficiency, or whether specific design and operational strategies, such as fixed cooling setpoints, might reduce thermal satisfaction. The recruitment of participants for the study involved sending invitation letters and, in some cases, personal requests, which included the presentation of identification documents for verification to ensure the authenticity of the researcher. While both CBs agreed to participate, only one of the green buildings (GBs) was willing to consent to taking part in the study. The other GB refused due to some unease about security. The participating GB is LEED-certified under LEED BD+C: New Construction v3—LEED 2009, indicating compliance with internationally recognised standards for sustainable design, construction, and operational efficiency.
Fieldwork was conducted over a two-month period, from August to September 2023, in the aforementioned office buildings: one GB (Figure 1), and two CBs—CB1 (Figure 2) and CB2 (Figure 3). This timeframe was based on availability granted by the building management teams. As shown in Table 2, the GB is fully air-conditioned and features a centrally controlled Variable Refrigerant Flow (VRF) system, while both CBs rely on individual split AC units for cooling. Although all buildings have operable windows in accordance with building regulations, they remain consistently closed in practice. Additionally, the GB uses a centrally controlled temperature regulation system, whereas temperature control in CB1 and CB2 is manually adjustable by occupants. All buildings primarily rely on the national electricity grid. Due to frequent grid instability in Abuja, diesel-powered backup generators are also used. However, the GB supplements its energy use with solar photovoltaic panels, which supply a portion of its electricity demand.

2.3. Objective Measurements

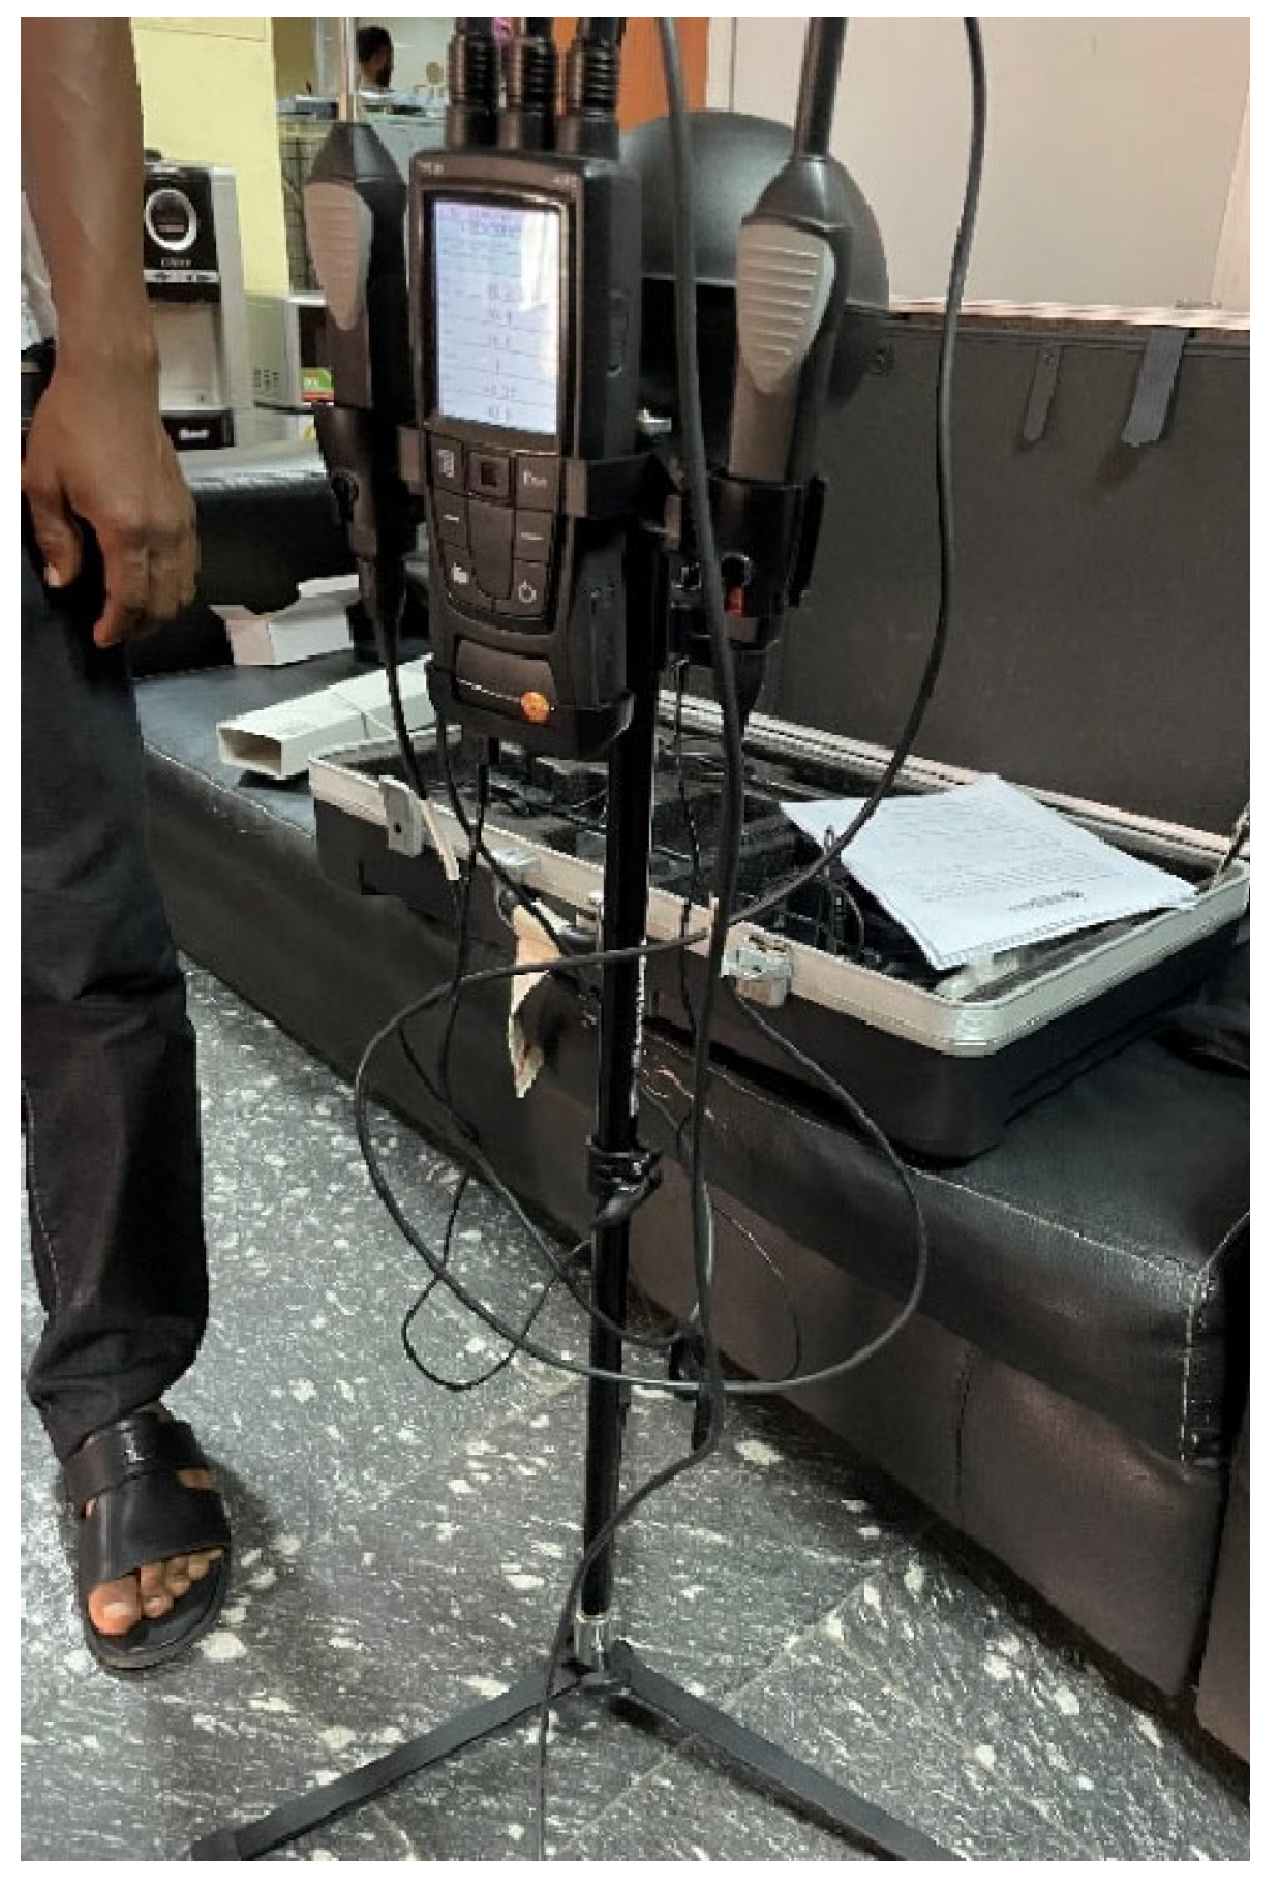
Indoor environmental conditions were measured in the three air-conditioned office buildings during the months of August and September. The measurements were made by using Testo 480 (Figure 4), a versatile instrument manufactured by Testo SE & Co. KGaA, Lenzkirch, Germany, specifically designed and developed to measure human thermal comfort, indoor climate, and air quality [38]. This instrument was equipped with multi-probe connectors and included a globe thermometer, a comfort probe, and an indoor air quality probe [39]. The instrument provided data on key parameters required for PMV calculation: air temperature with an accuracy of ±0.5 °C, mean radiant temperature as Class 1 accurate, relative humidity with an accuracy of ±1.8% RH plus 0.7% of the measured value, and air velocity with an accuracy of ±0.03 m/s plus 4% of the measured value [40]. The measurements, in conjunction with the estimated metabolic rates and clothing insulation derived from the activities and attire of the participants, were used to determine the PMV values.
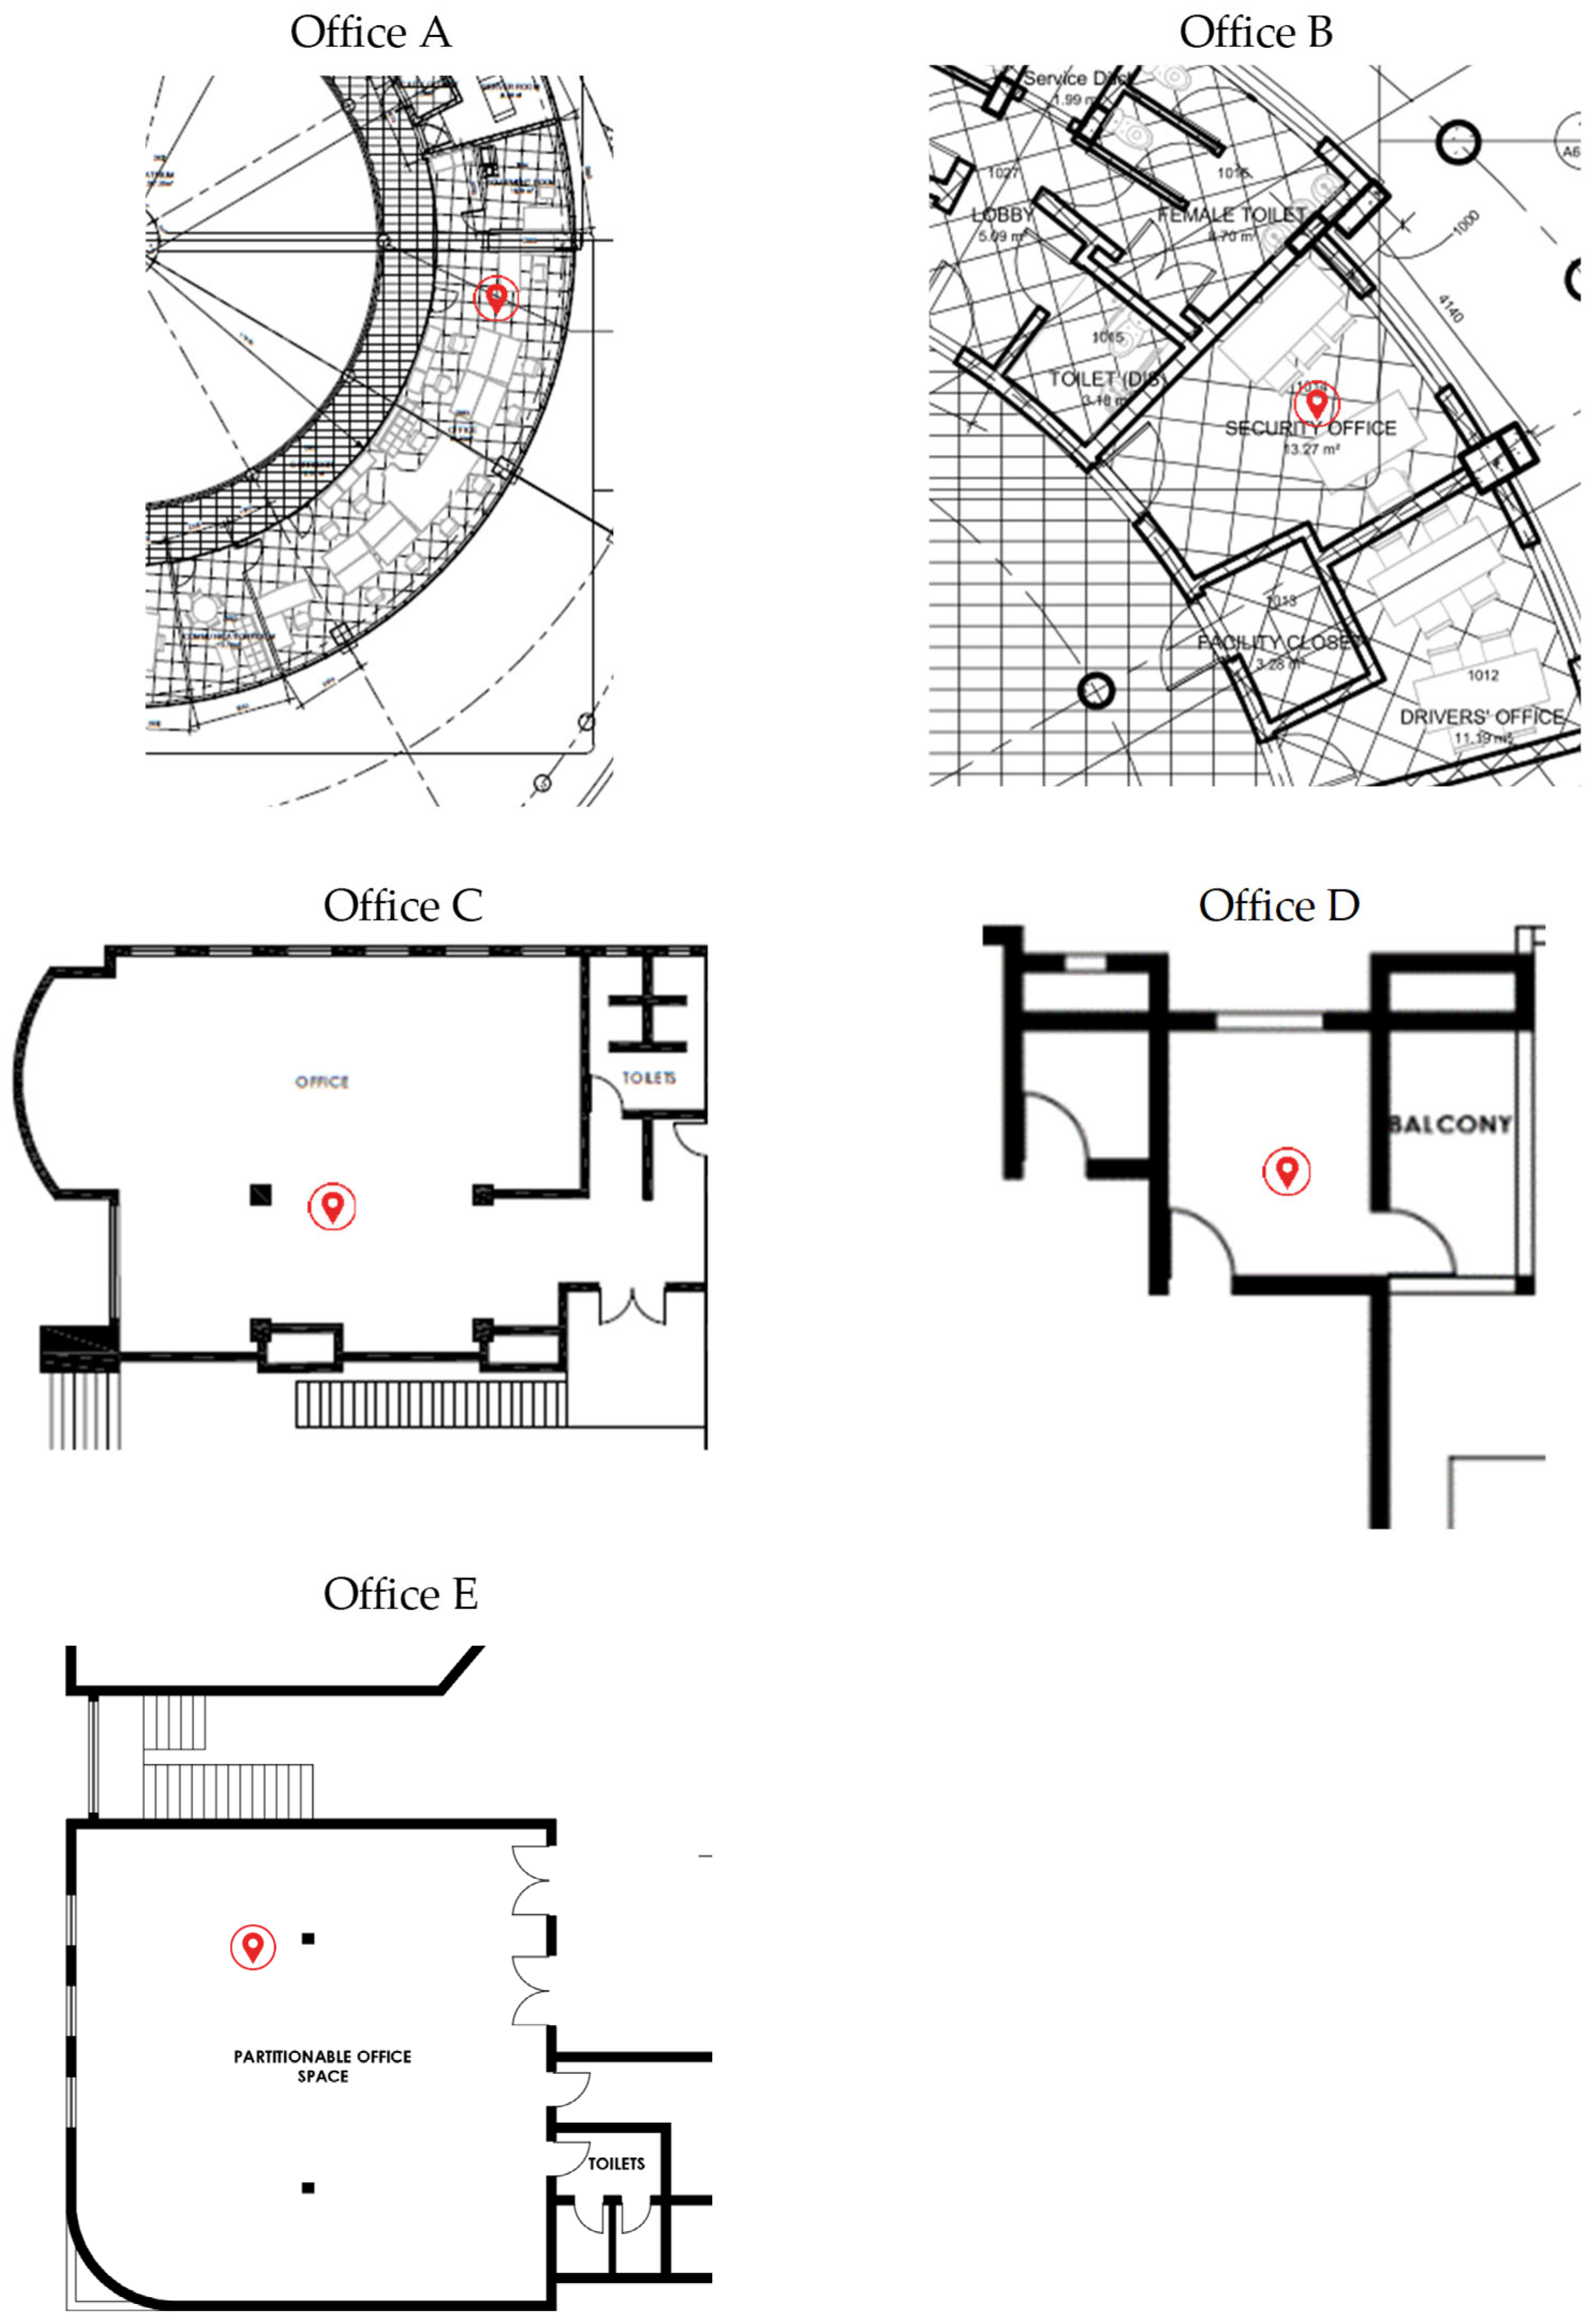
The study included a total of five office space measurements: two in the green building (GB), two in conventional building 1 (CB1), and one in conventional building 2 (CB2). These selected spaces provided a perspective on the thermal performance and occupants’ comfort of the investigated buildings. Table 3 presents a detailed description of the measured office spaces, including office type, occupancy levels, and room sizes. Furthermore, floor plans for each of the five measured office spaces (A–E) are provided in Figure 5, with icons indicating the precise location of the Testo 480 instrument. Measurement points were typically positioned near the centre of the space, away from external walls, windows, and HVAC vents, at a seated head height of approximately 1.1 m. This placement aimed to reflect typical occupant exposure while minimising localised thermal variations. Data were collected from 30 office occupants whose spaces were included in the measurements. Among these, 37.5% of the responses were from the GB, while CB1 and CB2 comprised 28.1% and 34.4%, respectively.

2.4. Subjective Survey

A full-scale survey was carried o ut to understand the occupants’ perceptions regarding thermal comfort. Paper-based questionnaires were distributed among the occupants during working hours, at the same time when the measurements for thermal comfort were being taken. This approach enables subjective thermal responses to be collected simultaneously with objective environmental data, ensuring accurate correlation between occupant perception and physical conditions [41]. These questionnaires were collected immediately after they were completed to ensure timely and relevant feedback. The survey mainly tried to capture the Thermal Sensation Votes (TSV), which are indicative of the subjective thermal experience of the occupants. The ASHRAE 7-point thermal sensation scale was used by respondents to rate their thermal comfort [42]. Ethical approval was secured from ethics committee of De Montfort University, ensuring adherence to ethical standards and the integrity of the research endeavour.

2.5. Respondent Demographics and Work Context

A total of 81 participants took part in the survey across the three buildings: 30 from the GB and 51 from the CBs. The overall response rates were 60% for the GB, 67.5% for CB1, and 80% for CB2. Participation was voluntary and based on invitation, and all respondents were full-time employees working in measured office spaces. In terms of gender distribution, the GB had a predominantly male participant group (86.7%), with females comprising 13.3%. In contrast, the CBs had more female respondents (59.3%) than males (37%). The participants represented a wide age range, with the 31–40 age group dominating the GB (73.3%), while the <30 age group was most represented in CBs (38%), followed by 31–40 (36%). Desk configurations also varied by building. In the GB, 56.7% of participants worked in small, shared offices (2–3 persons), with smaller proportions in larger spaces. Conversely, the CBs had a more distributed layout, with 43.1% working in medium open-plan offices (10–24 people) and 19.6% in large open-plan offices with more than 24 occupants.

3. Results

3.1. Predicted Mean Vote (PMV)

Table 4 summarises the average indoor climate measurements obtained for the selected office buildings, with instruments positioned at sitting level to capture parameters influencing occupant comfort. To visually represent these variations, Figure 6 presents box plots illustrating the variation in air temperature, mean radiant temperature, relative humidity, and air velocity across the GB and CBs. In the GB, the indoor air temperatures ranged between 22.4 °C and 24.8 °C with a mean of 23.4 °C and a standard deviation of 0.60. Indoor air temperatures in the CBs ranged between 23.7 °C and 24.6 °C, averaging 24.4 °C with a standard deviation of 0.23. The mean radiant temperature was calculated with the CBE thermal comfort tool [43]. The calculation includes several input parameters: air velocity, globe temperature, air temperature, globe diameter (150 mm), and globe emissivity (0.95). In the GB, the mean radiant temperature varied between 24.1 °C and 25.6 °C, with an average of 24.8 °C; on the other hand, in CBs, it ranged from 25.5 °C to 25.8 °C, with an average of 25.7 °C.
In the GB, relative humidity ranged from 41.3 to 44.1% with an average of 42.4% and a standard deviation of 0.70. In contrast, CBs showed a much wider range in relative humidity, between 28.1% and 59.7%, with an average of 39% and a standard deviation of 7.90. Air velocity was in the range of 0.01 to 0.07 m/s in GB and between 0.00 and 0.03 m/s in CBs, with both types showing a mean air velocity of 0.01 m/s.
The measured parameters, coupled with estimated metabolic rates and clothing insulation based on participants’ subjective responses (shown in Table 5 and Figure 7), were used to calculate the PMV using the CBE thermal comfort tool [43]. Clothing and activity data were obtained from the survey, where respondents reported their typical attire and activity level during work hours. These were matched to ASHRAE 55 [44] standard categories to determine clo and met values. The PMV results, illustrated in Figure 8, indicate an almost neutral thermal sensation of 0.28 in GB, corresponding to a Predicted Percentage of Dissatisfied (PPD) of 7%. In the case of CBs, the PMV indicated a slightly warm sensation (0.50), and the PPD was 11.33%.

3.2. Thermal Sensation Votes (TSVs)

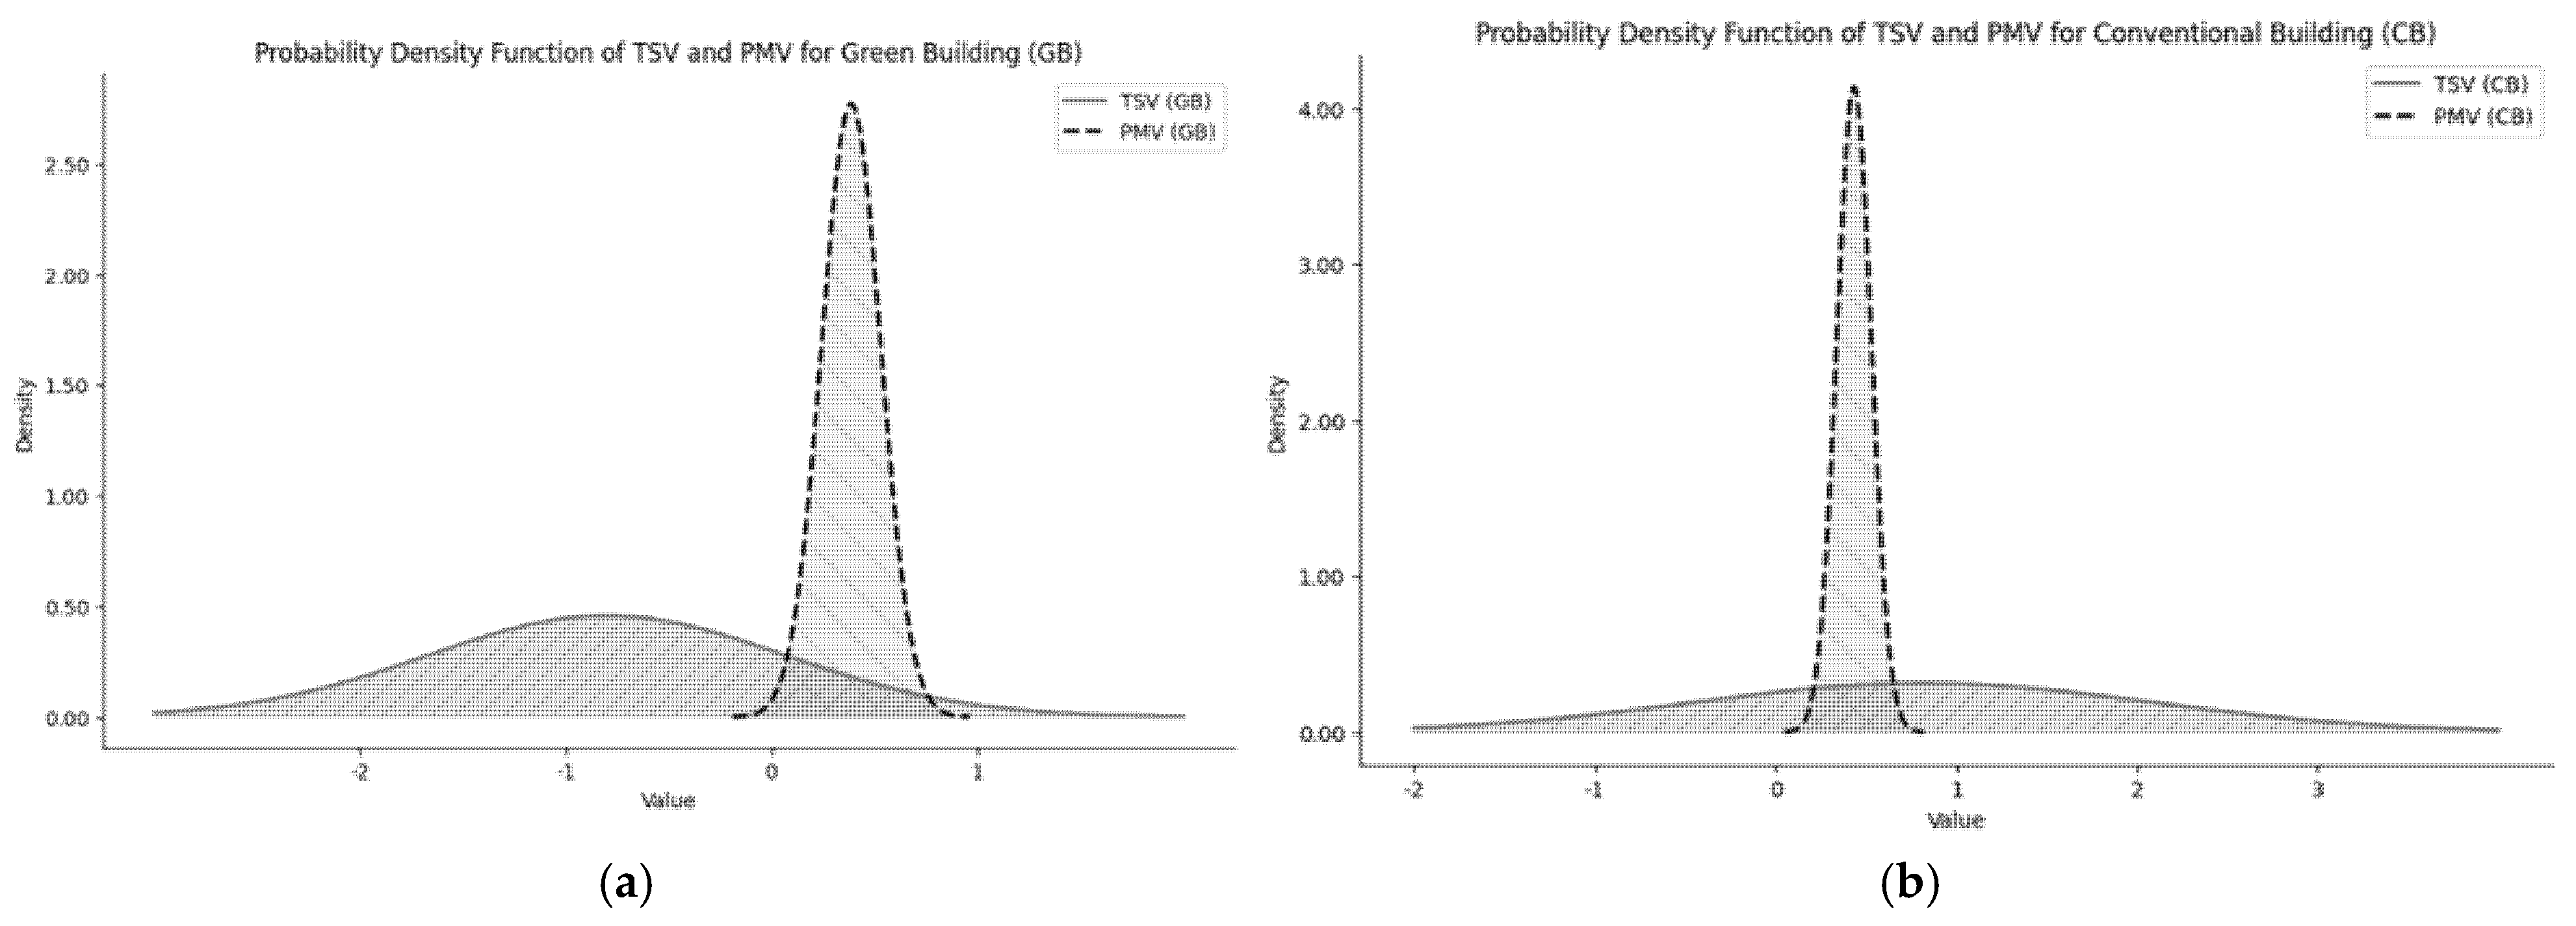
Thermal Sensation Votes (TSVs) were recorded based on the ASHRAE thermal comfort scale [45]. The results from the study revealed varied thermal perception among respondents in the GB and those in CBs. The TSV in the GB ranged from −2 to 1, with an average of −1.07. This indicates that, overall, participants in GBs experienced a slightly cool sensation, suggesting that on average, they perceived the indoor environment as leaning toward cooler conditions. A standard deviation of 0.82 reflects some variability in individual thermal responses. Conversely, the TSV values in CBs ranged from −2 to 3, with a mean of 0.56, which indicates a relatively neutral to warm overall sensation. This suggests that, on average, participants in CBs felt the indoor environment was slightly warmer than those in GBs. The standard deviation of 1.31 is higher than that of GBs, indicating greater variability in thermal sensations among participants in CBs, as illustrated in Figure 9, which shows the distribution of TSV in GB and CBs. The values are also presented in Table 6.

3.3. Comparison Between PMV and TSV

As shown in Figure 10, the mean PMV for GB was 0.28, indicating a neutral thermal sensation, as it falls within the acceptable comfort range (±0.5) defined by ANSI/ASHRAE Standard 55-2017 [46]. However, the TSV was reported at −1.1, suggesting that occupants perceived the environment as slightly cool. On the other hand, in CBs, the average PMV was 0.50, which, while marginally slightly warm, remains within the neutral range. This aligns closely with the TSV of 0.56, confirming that occupants generally experienced a slightly warm indoor environment. This highlights a discrepancy between PMV and TSV in GBs, where PMV suggests neutral conditions while occupants reported feeling slightly cool, whereas CBs showed a consistent alignment between both PMV and TSV, indicating a tendency toward slightly warm conditions.
While Figure 9 and Figure 10 illustrate the thermal sensation trends across the buildings, it is worth noting that some spaces had a limited number of survey respondents, particularly in CB1 and the GB. These small samples may influence the variability of responses.

3.4. Neutral Temperature

The neutral temperature (Tn) for both GB and CBs was calculated to assess the potential for energy savings by aligning cooling setpoints with occupant-reported thermal comfort. This calculation was performed using Griffiths’ method, which is commonly employed in thermal comfort studies to assess occupants’ comfort temperature or thermal neutrality [47]. This approach is particularly useful when regression methods become less reliable, especially in situations with narrow temperature ranges or limited data points [48,49,50,51]. According to Griffiths’ method, the neutral temperature is calculated based on the deviation of the actual thermal sensation from the neutral point, as expressed by the following equation:
T n   =   T op +   0 T S V G
where
  • Tn is the neutral temperature,
  • Top is the indoor operative temperature,
  • TSV is the Thermal Sensation Vote,
  • G is Griffiths’ constant (or regression coefficient).
Griffiths’ constant (G) is typically 0.5 °C, implying that a 2 °C change in indoor temperature corresponds to a one-unit shift on the thermal sensation scale, assuming all other factors remain constant [52]. This value is widely adopted in field studies [53,54,55,56] and originates from studies like ASHRAE RP884 and SCATs data [50].
Operative temperature combines the effect of room air temperature, mean radiant temperature, and air speed [57]. Given that air movement within the offices was minimal (<0.1 m/s), the operative temperature (Top) was calculated as the average of air temperature (Ta) and mean radiant temperature (Tr), following the approach outlined by Aghniaey et al. [57] and Nicol & Humphreys [58], as shown in the following equation:
T op   =   T a + T r 2
As presented in Table 7, in the GB, where the mean TSV value of −1.1 indicates a slightly cool thermal sensation, the neutral temperature was calculated to be 26.5 °C, which is 2.2 °C higher than the indoor operative temperature of 24.3 °C. This suggests a gap between the perceived and actual comfort levels. On the other hand, in CBs, where the mean TSV of 0.56 indicates a warmth sensation, the neutral temperature was calculated to be 24.6 °C, slightly lower than the operative temperature of 25.0 °C. This minor discrepancy indicates that the thermal comfort in CBs is more aligned with the indoor conditions, indicating that occupants typically perceive indoor temperatures as close to their comfort level.
The comparison between the two building types highlights the difference in thermal preferences, with both GB and CBs exhibiting some disparity between occupants’ comfort expectations and the actual indoor climate. However, this discrepancy is more pronounced in the GB, suggesting potential overcooling due to an air-conditioning strategy that does not fully align with occupant comfort needs. Such inefficiencies could contribute to unnecessary energy consumption in the GB.

4. Discussion

4.1. Discrepancy Between PMV and TSV

The comparison between PMV and TSV shows a large difference between the predicted and perceived thermal comfort. In the GB context, the PMV, based on measured environmental factors, was close to a neutral sensation (0.28), which is in line with the comfort standards of ANSI/ASHRAE Standard 55-2017 [46]. On the other hand, the TSV reported by occupants indicated a slightly cool sensation, as reflected in its mean value of −1.1. In the CBs, the average PMV was 0.50, suggesting a slightly warm thermal sensation, which aligns closely with the reported mean TSV of 0.56. A possible explanation for the overcooling in the GB could be its centrally controlled cooling system, which limits occupants’ ability to adjust temperatures to their preference. In contrast, the CBs, where occupants had individual control over their split AC units, showed a closer alignment between predicted and perceived thermal comfort.
This discrepancy between PMV and TSV in the GB underlines the inadequacy of using PMV alone as a thermal comfort predictor. The difference may be due to factors like individual differences in comfort perception and personal preferences. The PMV model falls short of accounting for the localised variations and unique personal experiences that can influence comfort in a real-world context. This aligns with previous studies showing limitations of the PMV model in hot climates [59,60,61]. Moreover, it can be argued that operating buildings using a set-point that is universally accepted is probably not possible, as the neutral temperature may vary due to several influencing factors within a specific climate and context [62]. Similarly to the present study, Lakhiar et al. [18] which examined thermal comfort in a sustainable office building in Malaysia, found that while objective environmental data met conventional thermal comfort criteria, occupants reported feeling colder than predicted by PMV. Additionally, the findings of this study are consistent with those of Esfandiari et al. [23] in Malaysia and Nkini et al. [15] in Tanzania, who also reported that occupants of green office buildings often experienced overcooling. This reinforces the idea that green buildings do not always provide optimal thermal comfort and, in some cases, may lead to excessive cooling due to rigid temperature controls. This observation can be further explained by differences in control strategies between the buildings. In the GB, the cooling system is centrally managed, limiting occupants’ ability to make real-time temperature adjustments based on personal comfort needs. This likely contributed to the lower TSV (−1.1) despite PMV indicating neutral conditions (0.28). In contrast, occupants in the CBs, who had individual control over their split-unit air conditioners, reported sensations that more closely aligned with measured conditions, PMV (0.50) and TSV (0.56). This suggests that thermal control autonomy plays a crucial role in aligning perceived and predicted comfort.
Analysis of neutral temperatures supports these findings. In the GB, the calculated neutral temperature was 26.5 °C, which is 2.2 °C higher than the measured operative temperature (24.3 °C). This discrepancy suggests that the actual indoor conditions were cooler than what occupants perceived as thermally neutral. In contrast, in CBs, the mean TSV of 0.56 led to a calculated neutral temperature of 24.6 °C, which is only slightly lower than the operative temperature (25.0 °C). This analysis further supports the notion that in GBs, thermal conditions deviate more significantly from occupant comfort preferences compared to CBs. The greater discrepancy in GBs suggests that the air-conditioning strategy may not fully account for occupant comfort preferences, potentially leading to excessive cooling and increased energy consumption.
These findings are consistent with previous thermal comfort studies in hot climates. The 26.5 °C neutral temperature observed in the GB aligns closely with the comfort range of 26.2–26.5 °C identified by Hema et al. [63] in mixed-mode office buildings in Burkina Faso and falls within the broader 23.8–27.5 °C range reported by Hwang and Cheng [64] for air-conditioned offices in Taiwan. While Al-Akhzami et al. [65] reported a comfort range of 22.8 ± 1.2 °C in Omani office buildings, Abass et al. [66] identified a comfort range of 23–26 °C in Malaysian offices. The 24.6 °C observed in the CBs in this study corresponds more closely with the mid-range of these comfort ranges.

4.2. Potential for Energy Saving

The results highlight a significant opportunity for energy savings in the green building by adjusting cooling setpoints to better align with occupant comfort. The calculated neutral temperature (26.5 °C) suggests that the current cooling strategy may lead to unnecessary energy consumption due to overcooling. Increasing the cooling setpoint by 2.2 °C could simultaneously improve thermal satisfaction and operational efficiency. Based on existing literature, such as Alrebei [66], each 1 °C increase in cooling setpoint can result in approximately 8% reduction in cooling energy demand. Applying this rate, raising the setpoint from 24.3 °C to 26.5 °C could lead to estimated energy savings of 17.6%.
Similar findings were reported by Elnaklah [48], who demonstrated that using occupant-derived neutral temperatures instead of predicted values can significantly reduce cooling loads. In office buildings located in Amman and Doha, annual energy demand was reduced by 20% and 13%, respectively, when cooling setpoints were raised based on TSV. These savings were attributed primarily to reduced cooling loads. Applying a similar strategy in the context of Abuja could enhance both comfort and energy efficiency.
These findings are particularly important in the context of Nigeria’s energy issues, which are characterised by dependence on grid power and generators and have thus created a need to manage energy sustainably. Green buildings can improve their energy efficiency without giving up high standards of thermal comfort by optimising cooling setpoints in accordance with the preference of the occupants. This forms part of the broader aim of green building initiatives that seek balance between energy efficiency and comfort of occupants.

5. Conclusions

This study investigated the satisfaction of occupants regarding indoor thermal conditions in both green and conventional office structures located in Abuja, Nigeria, through the implementation of post-occupancy evaluation (POE). The results provide significant insights into the relationship between occupants’ thermal comfort and energy efficiency, particularly in hot climates. The discrepancies between predicted (PMV) and actual (TSV) occupant experiences demonstrate the need for a more advanced approach to indoor environmental management, particularly in the GB. While PMV predicted neutrality, occupant feedback indicated a preference for a warmer environment, underscoring the limitations of the PMV model in capturing human comfort and preferences.
Moreover, the study revealed a significant potential for energy savings by re-evaluating cooling setpoints based on occupant-reported comfort. The calculated neutral temperature was 2.2 °C higher than the operative temperature, indicating that the current cooling strategy may result in excessive cooling and unnecessary energy consumption. Adjusting cooling setpoints to better align with actual comfort preferences could reduce energy demand while maintaining occupant satisfaction.
This paper highlights the importance of including subjective feedback from occupants in building performance evaluations, which is critical for achieving both energy efficiency and occupant satisfaction. By this integration, building operators and designers can improve energy efficiency while creating environments that are increasingly comfortable and productive.

Limitations and Recommendations

Several limitations were encountered in this research, which may impact how its findings are interpreted. In Abuja, there are two green-certified office buildings; however, only one agreed to participate in this study, citing security concerns, an action that limited the ability to generalise findings on green buildings in the context. Access to indoor spaces was also restricted, with measurements and surveys conducted in only one or two offices per building. While the selected spaces reflected typical use, the limited coverage reduced the diversity of thermal conditions and occupant experiences captured. Additionally, the study was also limited to a specific period (August and September), excluding any possible seasonal variations that may influence thermal comfort and energy efficiency. Furthermore, potential response biases may have influenced the findings. For example, respondents in the green building were subject to centrally controlled HVAC settings, which may have influenced their thermal perception, particularly compared to CB occupants who could adjust their air-conditioning independently. In addition, the respondent profile differed across buildings in terms of gender, age, and workspace layout, all of which may influence thermal sensation and comfort reporting. Given these limitations, this study offers the following recommendations for future research works.
  • Include a wider range of green-certified office buildings to increase the representativeness of green building performance across Abuja and similar tropical contexts.
  • Longitudinal studies in investigating seasonal changes in thermal comfort and energy efficiency, hence serving a more holistic understanding of occupants’ preferences.
  • Integrate adaptive and subjective models of thermal comfort to increase the correlation between predicted and actual occupant comfort, thus improving user satisfaction in building management.
  • Investigate how adjusting the building systems based on the occupant feedback and TSV-aligned setpoints can further optimise energy savings and comfort.

Author Contributions

A.H.M. was responsible for data collection and analysis, writing the original draft, and designing the study. A.T. contributed through review, editing, and supervision, while S.H.K. was equally involved in review, editing, and supervision. All authors have read and agreed to the published version of the manuscript.

Funding

No external or commercial funding was received.

Institutional Review Board Statement

Not applicable.

Informed Consent Statement

This study was approved by the Research Ethics Committee at De Montfort University, Leicester, United Kingdom (Reference No: 518689). All ethical standards were upheld throughout the study. Informed consent was obtained in writing from all participants prior to their involvement in the study.

Data Availability Statement

The datasets generated and analysed during the current study are available from the corresponding author on request. Due to the nature of the data, they are not publicly available to protect participant confidentiality.

Acknowledgments

The authors extend their gratitude to the Architecture Research Institute at the Leicester School of Architecture for providing the instruments used to carry out the measurements.

Conflicts of Interest

The authors declared no potential conflicts of interest with respect to the research, authorship, and/or publication of this article.

References

  1. Mukhtar, A.; Yusoff, M.; Ng, K. The potential influence of building optimization and passive design strategies on natural ventilation systems in underground buildings: The state of the art. Tunn. Undergr. Space Technol. 2019, 92, 103065. [Google Scholar] [CrossRef]
  2. Rafique, M.M.; Rehman, S. Renewable and Sustainable Air Conditioning. Sustainable Air Conditioning Systems; InTech: London, UK, 2018. [Google Scholar] [CrossRef]
  3. Kamath, S.; Soman, B.; Raj, A.; Kamath, S.; Kamath, R.; Kamath, L. Green Buildings: Sustainable Construction Principles. Int. J. Civ. Eng. Technol. 2019, 10, 1882–1892. [Google Scholar]
  4. Menadue, V.; Soebarto, V.; Williamson, T. The effect of internal environmental quality on occupant satisfaction in commercial office buildings. HVAC&R Res. 2013, 19, 1051–1062. [Google Scholar] [CrossRef]
  5. Harčárová, K.; Vilčeková, S. Indoor environmental quality in green certified office buildings. IOP Conf. Ser. Mater. Sci. Eng. 2022, 1252, 012054. [Google Scholar] [CrossRef]
  6. Altomonte, S.; Schiavon, S. Occupant satisfaction in LEED and non-LEED certified buildings. Build. Environ. 2013, 68, 66–76. [Google Scholar] [CrossRef]
  7. Wei, W.; Ramalho, O.; Mandin, C. Indoor air quality requirements in green building certifications. Build. Environ. 2015, 92, 10–19. [Google Scholar] [CrossRef]
  8. Licina, D.; Wargocki, P.; Pyke, C.; Altomonte, S. The future of IEQ in green building certifications. Build. Cities 2021, 2, 907–927. [Google Scholar] [CrossRef]
  9. Olagboye, S. Promoting Green Building Practices in Nigeria’s Construction Industry. Stats Metrics 2023. Available online: https://www.statsmetrics.ng/article/promoting-green-building-practices-in-nigeria-s-construction-industry (accessed on 21 October 2024).
  10. IFC Green Buildings Market Intelligence Nigeria Country Profile. n.d. Available online: https://edgebuildings.com/wp-content/uploads/2022/04/Nigeria-Green-Building-Market-Intelligence-EXPORT.pdf (accessed on 25 July 2025).
  11. Kim, H.G.; Kim, S.S. Occupants’ awareness of and satisfaction with green building technologies in a certified office building. Sustainability 2020, 12, 2109. [Google Scholar] [CrossRef]
  12. Lee, Y.S.; Kim, S.-K. Indoor Environmental Quality in LEED-Certified Buildings in the U.S. J. Asian Arch. Build. Eng. 2008, 7, 293–300. [Google Scholar] [CrossRef]
  13. Liang, H.-H.; Chen, C.-P.; Hwang, R.-L.; Shih, W.-M.; Lo, S.-C.; Liao, H.-Y. Satisfaction of occupants toward indoor environment quality of certified green office buildings in Taiwan. Build. Environ. 2014, 72, 232–242. [Google Scholar] [CrossRef]
  14. Mao, Y.; Zhu, K.; Zheng, Z.; Fang, Z. Evaluation of the thermal comfort in different commercial buildings in Guangzhou. Indoor Built Environ. 2024, 33, 391–413. [Google Scholar] [CrossRef]
  15. Nkini, S.; Nuyts, E.; Kassenga, G.; Swai, O.; Verbeeck, G. Evaluation of occupants’ satisfaction in green and non-green office buildings in Dar es Salaam-Tanzania. Build. Environ. 2022, 219, 109169. [Google Scholar] [CrossRef]
  16. Gou, Z.; Lau, S.S.-Y.; Chen, F. Subjective and Objective Evaluation of the Thermal Environment in a Three-Star Green Office Building in China. Indoor Built Environ. 2012, 21, 412–422. [Google Scholar] [CrossRef]
  17. Gou, Z.; Lau, S.S.Y. Post-occupancy evaluation of the thermal environment in a green building. Facilities 2013, 31, 357–371. [Google Scholar] [CrossRef]
  18. Lakhiar, M.T.; Sanmargaraja, S.; Olanrewaju, A.; Lim, C.H.; Ponniah, V.; Mathalamuthu, A.D. Evaluating and comparing objective and subjective thermal comfort in a malaysian green office building: A case study. Case Stud. Therm. Eng. 2024, 60, 104614. [Google Scholar] [CrossRef]
  19. Elnaklah, R.; Walker, I.; Natarajan, S. Moving to a green building: Indoor environment quality, thermal comfort and health. Build. Environ. 2021, 191, 107592. [Google Scholar] [CrossRef]
  20. Elnaklah, R.; Fosas, D.; Natarajan, S. Indoor environment quality and work performance in “green” office buildings in the Middle East. Build. Simul. 2020, 13, 1043–1062. [Google Scholar] [CrossRef]
  21. Paul, W.L.; Taylor, P.A. A comparison of occupant comfort and satisfaction between a green building and a conventional building. Build. Environ. 2008, 43, 1858–1870. [Google Scholar] [CrossRef]
  22. Altomonte, S.; Schiavon, S.; Kent, M.G.; Brager, G. Indoor environmental quality and occupant satisfaction in green-certified buildings. Build. Res. Inf. 2019, 47, 255–274. [Google Scholar] [CrossRef]
  23. Esfandiari, M.; Zaid, S.M.; Ismail, M.A.; Hafezi, M.R.; Asadi, I.; Mohammadi, S.; Vaisi, S.; Aflaki, A. Occupants’ satisfaction toward indoor environment quality of platinum green-certified office buildings in tropical climate. Energies 2021, 14, 2264. [Google Scholar] [CrossRef]
  24. Adebamowo, M.A.; Sangowawa, T.B.; Godwin, J. Low Energy Design of Buildings in the Tropics; The Case of Lagos, Nigeria. Int. J. Eng. Sci. (IJES) 2013, 2, 1–8. [Google Scholar]
  25. Jimoh, A.O.; Demenongu-Demshakwa, J. Establishing Indoor Comfort Temperature (Neutral Temperature) in Naturally Ventilated (NV) Office Buildings in Jos, Nigeria. J. Energy Technol. Policy 2020, 10, 39–50. [Google Scholar] [CrossRef]
  26. Jimoh, A.O.; Umar, A. Establishing Indoor Thermal Comfort Range for Office Buildings in Jos Nigeria Using the Adaptive Psychrometric Chart. Int. J. Energy Environ. Sci. 2021, 6, 151. [Google Scholar] [CrossRef]
  27. Musa, H.; Adamu, M.B.; Usman, A.J.; Abbas, S.E. Occupant’s Thermal Perception in Mixed-mode Office Buildings of the Tropical Climate. Adv. J. Sci. Technol. Eng. 2024, 4, 67–79. [Google Scholar] [CrossRef]
  28. Efeoma, M.O. The Influence of Clothing on Adaptive Thermal Comfort: A Study of the Thermal Comfort of Office Workers in Hot Humid Conditions in Enugu, Nigeria. Ph.D. Thesis, The University of Edinburgh, Edinburgh, Scotland, 2016. [Google Scholar]
  29. Kim, J.; de Dear, R.; Cândido, C.; Zhang, H.; Arens, E. Gender differences in office occupant perception of indoor environmental quality (IEQ). Build. Environ. 2013, 70, 245–256. [Google Scholar] [CrossRef]
  30. Meir, I.A.; Garb, Y.; Jiao, D.; Cicelsky, A. Post-occupancy evaluation: An inevitable step toward sustainability. Adv. Build. Energy Res. 2009, 3, 189–219. [Google Scholar] [CrossRef]
  31. Monfared, I.G.; Sharples, S. Occupants’ perceptions and expectations of a green office building: A longitudinal case study. Arch. Sci. Rev. 2011, 54, 344–355. [Google Scholar] [CrossRef]
  32. Esfandiari, M.; Zaid, S.M.; Ismail, M.A.; Aflaki, A. Influence of indoor environmental quality on work productivity in green office buildings: A review. Chem. Eng. Trans. 2017, 56, 385–390. [Google Scholar] [CrossRef]
  33. Thapa, S.; Bansal, A.K.; Panda, G.K. Thermal comfort in naturally ventilated office buildings in cold and cloudy climate of Darjeeling, India—An adaptive approach. Energy Build. 2018, 160, 44–60. [Google Scholar] [CrossRef]
  34. Carlucci, S.; Bai, L.; de Dear, R.; Yang, L. Review of adaptive thermal comfort models in built environmental regulatory documents. Build. Environ. 2018, 137, 73–89. [Google Scholar] [CrossRef]
  35. World Climate Guide. Abuja Climate Guide, Nigeria. Available online: http://www.worldclimateguide.co.uk/guides/nigeria/abuja/?units=metric&style=symbols (accessed on 26 September 2024).
  36. Abubakar, I.R. Abuja city profile. Cities 2014, 41, 81–91. [Google Scholar] [CrossRef]
  37. Adaji, M.U.; Adekunle, T.O.; Watkins, R.; Adler, G. Indoor comfort and adaptation in low-income and middle-income residential buildings in a Nigerian city during a dry season. Build. Environ. 2019, 162, 106276. [Google Scholar] [CrossRef]
  38. Cakó, B.; Zoltán, E.S.; Girán, J.; Medvegy, G.; Miklós, M.E.; Nyers, Á.; Grozdics, A.T.; Kisander, Z.; Bagdán, V.; Borsos, Á. An efficient method to compute thermal parameters of the comfort map using a decreased number of measurements. Energies 2021, 14, 5632. [Google Scholar] [CrossRef]
  39. Ali, T.M. Thermal Comfort Study on a Renovated Residential Apartment in Tjärna Ängar, Borlänge. Master’s Thesis, Dalarna University, Falun, Sweden, 2020. [Google Scholar]
  40. Oyinlola, M.; Beizaee, A.; Onyenokporo, N.; Takyie, E.G.; Adekeye, O.F. Thermal comfort perception of occupants in an upcycled bottle house in Abuja, Nigeria. In Proceedings of the 2nd International Conference on Construction, Energy, Environment & Sustainability, Funchal, Portugal, 27–30 June 2023. [Google Scholar]
  41. Dębska, L.; Krakowiak, J.; Kapjor, A. Modern methods of thermal comfort measurements. Struct. Environ. 2021, 12, 161–165. [Google Scholar] [CrossRef]
  42. ASHRAE. Thermal Environmental Conditions for Human Occupancy; ASHRAE Inc.: Atlanta, Georgia, 2010. [Google Scholar]
  43. Hoyt, T.; Schiavon, S.; Piccioli, A.; Cheung, T.; Moon, D.; Steinfeld, K. CBE Thermal Comfort Tool; Centre for the Built Environment, University of California: Berkeley, CA, USA, 2013. [Google Scholar]
  44. ASHRAE ANSI/ASHRAE Standard 55-2017; Thermal Environmental Conditions for Human Occupancy. ASHRAE Inc.: Atlanta, Georgia, 2017.
  45. ASHRAE. Thermal Environmental Conditions for Human Occupancy. ASHRAE Inc.: Atlanta, Georgia, 2004. [Google Scholar]
  46. ASHRAE. ASHRAE ANSI/ASHRAE Addendum d to ANSI/ASHRAE Standard 55-2017; ASHRAE Inc.: Atlanta, Georgia, 2020. [Google Scholar]
  47. Griffiths, I.D. Thermal Comfort Studies in Buildings with Passive Solar Features, Field Studies; Report to the Commission of the European Community; Commission of the European Communities: UK, 1990. [Google Scholar]
  48. Elnaklah, R. Impact of Indoor Environmental Quality on Occupant Satisfaction, Perceived Health, and Work Performance in “Green” Office Buildings in the Middle East. Ph.D. Thesis, University of Bath, Bath, UK, 2021. [Google Scholar]
  49. Humphreys, M.A.; Nicol, F.J. Outdoor Temperature and Indoor Thermal Comfort: Raising the Precision of the Relationship for the 1998 ASHRAE Database of Field Studies; ASHRAE Inc.: Atlanta, Georgia, 2003. [Google Scholar]
  50. Humphreys, M.; Rijal, H.; Nicol, J. Updating the adaptive relation between climate and comfort indoors; new insights and an extended database. Build. Environ. 2013, 63, 40–55. [Google Scholar] [CrossRef]
  51. Nicol, F.; Humphreys, M.A.; Michael, A.; Roaf, S. Adaptive Thermal Comfort: Principles and Practice; Routledge: London, UK, 2012. [Google Scholar]
  52. Ryu, J.; Kim, J.; Hong, W.; de Dear, R. Defining the thermal sensitivity (Griffiths constant) of building occupants in the Korean residential context. Energy Build. 2020, 208, 109648. [Google Scholar] [CrossRef]
  53. Rupp, R.F.; de Dear, R.; Ghisi, E. Field study of mixed-mode office buildings in Southern Brazil using an adaptive thermal comfort framework. Energy Build. 2018, 158, 1475–1486. [Google Scholar] [CrossRef]
  54. Singh, M.K.; Ooka, R.; Rijal, H.B.; Takasu, M. Adaptive thermal comfort in the offices of North-East India in autumn season. Build. Environ. 2017, 124, 14–30. [Google Scholar] [CrossRef]
  55. Wang, Z.; Yu, H.; Jiao, Y.; Wei, Q.; Chu, X. A field study of thermal sensation and neutrality in free-running aged-care homes in Shanghai. Energy Build. 2018, 158, 1523–1532. [Google Scholar] [CrossRef]
  56. Singh, M.K.; Kumar, S.; Ooka, R.; Rijal, H.B.; Gupta, G.; Kumar, A. Status of thermal comfort in naturally ventilated classrooms during the summer season in the composite climate of India. Build. Environ. 2018, 128, 287–304. [Google Scholar] [CrossRef]
  57. Aghniaey, S.; Lawrence, T.M.; Sharpton, T.N.; Douglass, S.P.; Oliver, T.; Sutter, M. Thermal comfort evaluation in campus classrooms during room temperature adjustment corresponding to demand response. Build. Environ. 2019, 148, 488–497. [Google Scholar] [CrossRef]
  58. Nicol, F.; Humphreys, M. Derivation of the adaptive equations for thermal comfort in free-running buildings in European standard EN15251. Build. Environ. 2010, 45, 11–17. [Google Scholar] [CrossRef]
  59. Kiki, G.; Kouchadé, C.; Houngan, A.; Zannou-Tchoko, S.J.; André, P. Evaluation of thermal comfort in an office building in the humid tropical climate of Benin. Build. Environ. 2020, 185, 107277. [Google Scholar] [CrossRef]
  60. Kleber, M.; Wagner, A. Investigation of indoor thermal comfort in warm-humid conditions at a German climate test facility. Build. Environ. 2018, 128, 216–224. [Google Scholar] [CrossRef]
  61. Alnuaimi, A.; Natarajan, S. Extreme cold discomfort in extreme hot climates, a study of building overcooling in office buildings in qatar. J. Eng. Res. 2021, 18, 101–113. [Google Scholar] [CrossRef]
  62. Khattak, S.H.; Wright, A.; Natarajan, S. Flexible Future Comfort. Routledge Handbook of Resilient Thermal Comfort, 1st ed.; Routledge: London, UK, 2022. [Google Scholar]
  63. Hema, C.; Ouédraogo, A.L.S.-N.; Bationo, G.B.; Kabore, M.; Nshimiyimana, P.; Messan, A. A field study on thermal acceptability and energy consumption of mixed-mode offices building located in the hot-dry climate of Burkina Faso. Sci. Technol. Built Environ. 2024, 30, 184–193. [Google Scholar] [CrossRef]
  64. Al-Akhzami, F.; Al-Khatri, H.; Al-Saadi, S.; Alalouch, C. An assessment of the thermal conditions and users’ thermal adaptability in air-conditioned offices in a hot climate region. In Comfort at the Extremes 2023: The Book of Proceedings; CEPT University Press: Ahmedabad, India, 2024. [Google Scholar] [CrossRef]
  65. Abass, F.; Ismail, L.H.; Wahab, I.A.; Mabrouk, W.A.; Kabrein, H. Indoor thermal comfort assessment in office buildings in hot-humid climate. IOP Conf. Ser. Mater. Sci. Eng. 2021, 1144, 012029. [Google Scholar] [CrossRef]
  66. Alrebei, O.F.; Obeidat, B.; Al-Radaideh, T.; Le Page, L.M.; Hewlett, S.; Al Assaf, A.H.; Amhamed, A.I. Quantifying CO2 Emissions and Energy Production from Power Plants to Run HVAC Systems in ASHRAE-Based Buildings. Energies 2022, 15, 8813. [Google Scholar] [CrossRef]
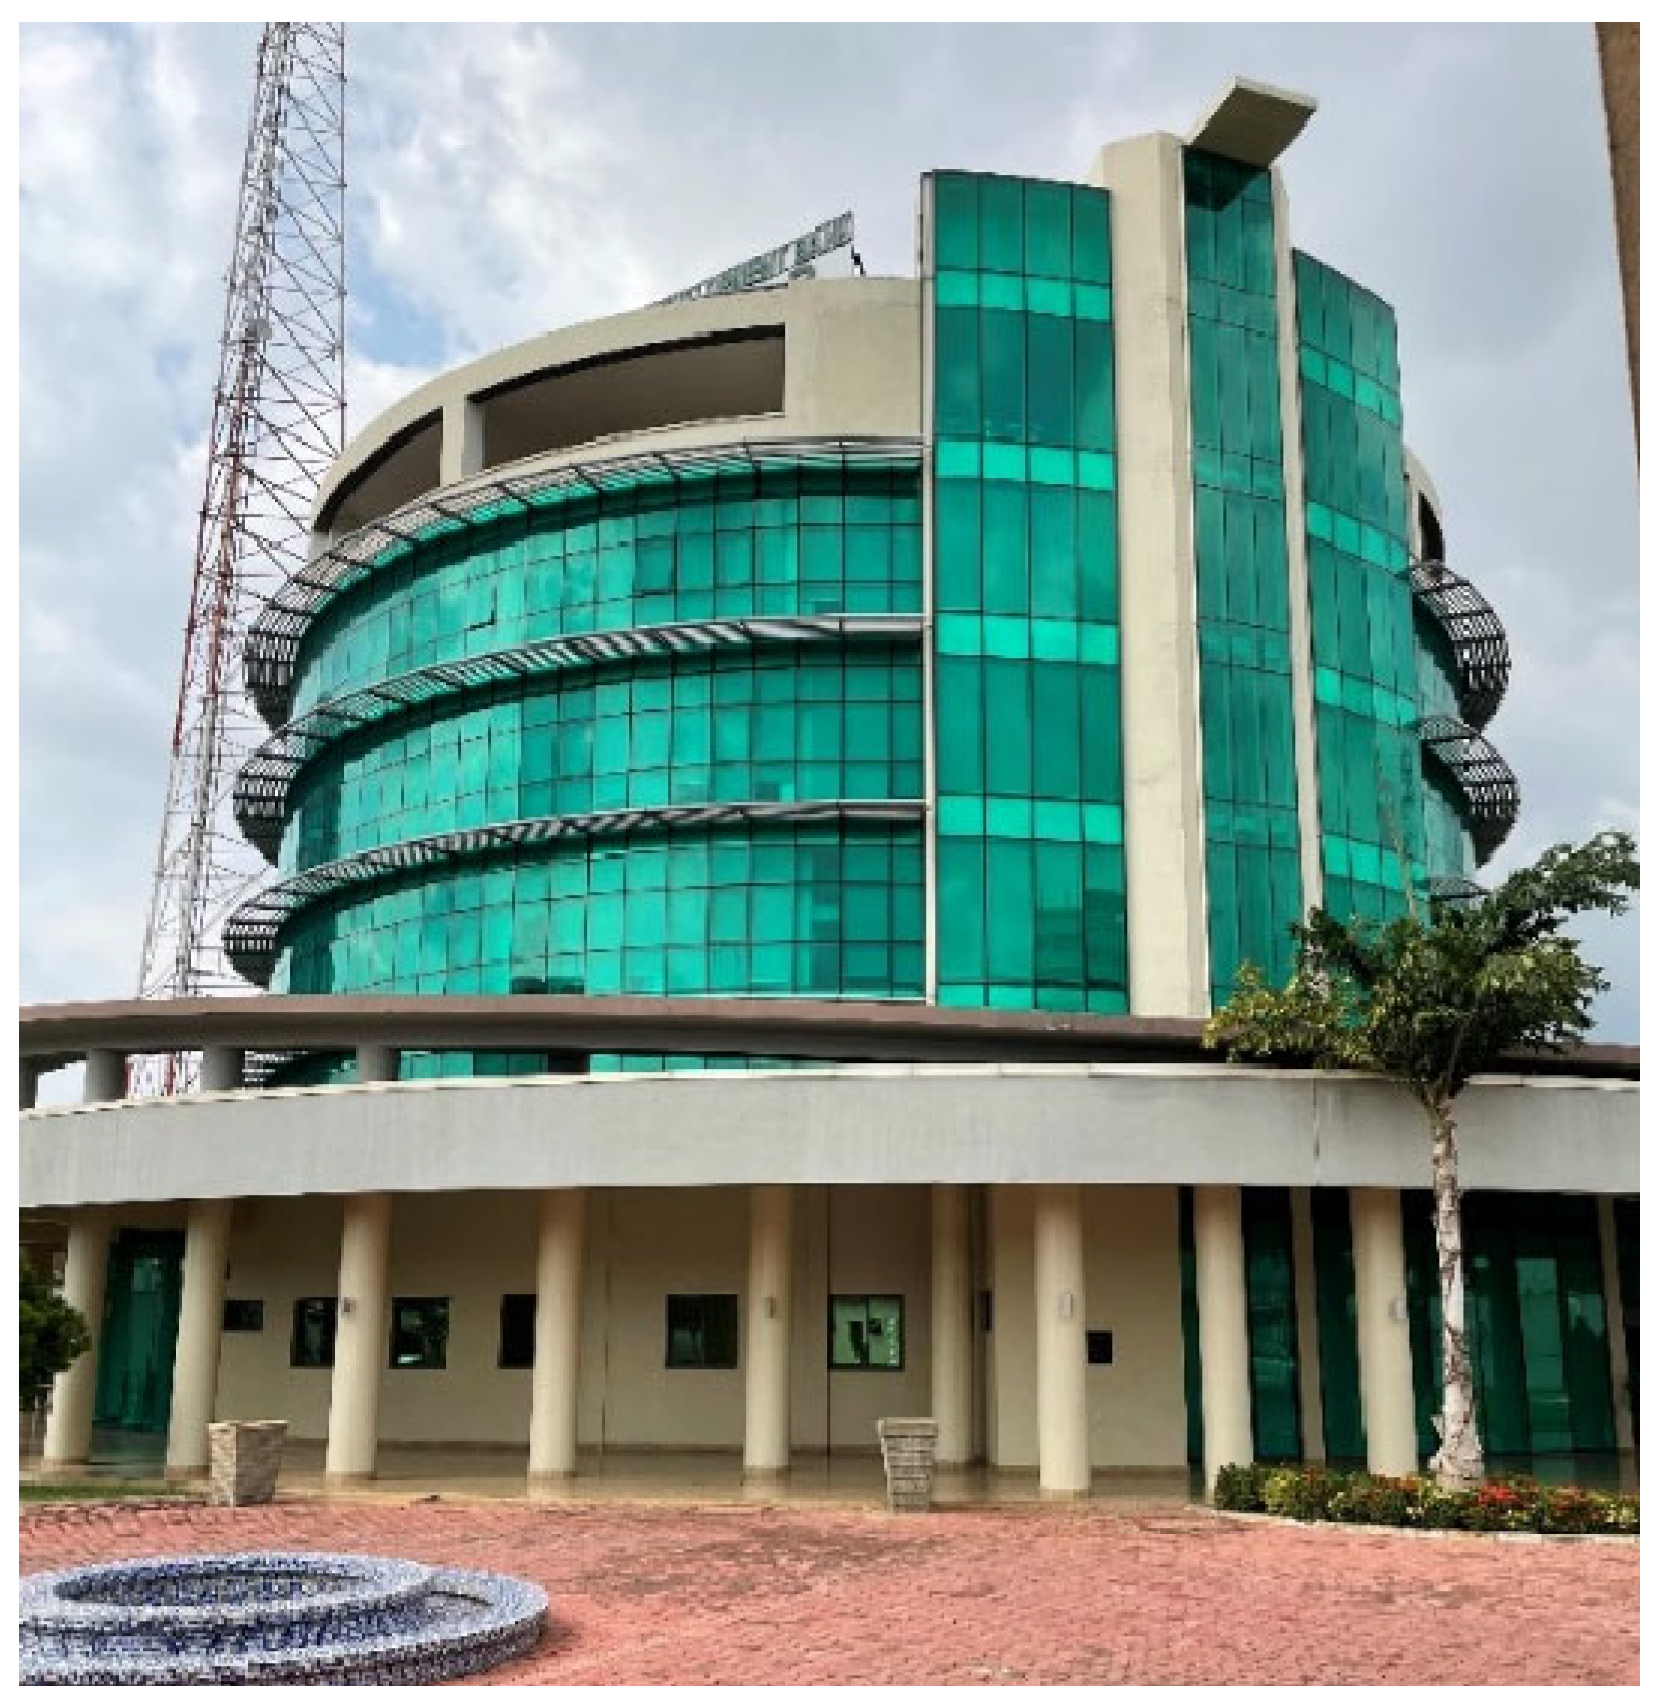
Figure 1. Green building (GB)—African Development Bank headquarters (photograph taken by the authors).
Sustainability 17 07078 g001
Figure 2. Conventional building 1 (CB1)—Yobe Investment House (photograph taken by the authors).
Sustainability 17 07078 g002
Figure 3. Conventional building 1 (CB2)—Murjanatu House (photograph taken by the authors).
Sustainability 17 07078 g003
Figure 4. The measurement instrument used in the study (photograph taken by the authors).
Sustainability 17 07078 g004
Figure 5. Floor plans of the five measured office spaces (AE), indicating the location of the Testo 480 thermal comfort measurement instrument in each space.
Sustainability 17 07078 g005
Figure 6. Box plots illustrating the variation in (a) air temperature, (b) mean radiant temperature, (c) relative humidity, and (d) air velocity across the GB and CBs.
Sustainability 17 07078 g006aSustainability 17 07078 g006b
Figure 7. Box plots illustrating the distribution of occupants’ clothing insulation and metabolic rates in GB and CBs.
Sustainability 17 07078 g007
Figure 8. Box plots illustrating the distribution of PMV and PPD values in GB and CBs.
Sustainability 17 07078 g008
Figure 9. Probability density function of TSV for GB and CBs.
Sustainability 17 07078 g009
Figure 10. A box plot showing comparison between PMV and TSV in GB and CBs.
Sustainability 17 07078 g010
Table 1. Summary of research on occupant satisfaction with thermal comfort in green office buildings.
AuthorContextClimateConclusion
Liang et al. [13]TaiwanHot humidPeople working in green buildings were more satisfied with the thermal condition than those working in conventional buildings.
Elnaklah, Walker and Natarajan [19]JordanHot dryMoving from a conventional office building to a green-certified building resulted in a significant increase in occupants’ thermal comfort.
Altomonte and Schiavon [6]North AmericaN/AOccupants of LEED-certified office buildings have equal satisfaction with IEQ as occupants of non-LEED-certified buildings.
Gou & Lau [17]ChinaSubtropicalOccupants of green office building experience discomfort, caused by low temperatures in both summer and winter.
Lee and Kim [12]United StatesContinentalOccupant satisfaction with thermal conditions was greater in LEED-certified office buildings.
Elnaklah, Fosas and Natarajan [20]Middle EastHot dryThermal comfort is more in green office buildings than in conventional office buildings.
Menadue, Soebarto and Williamson [4]Adelaide, AustraliaMediterraneanGreen buildings offer slightly greater satisfaction in terms of thermal comfort.
Harčárová and Vilčeková [5]Bratislava, SlovakiaContinentalAdequate thermal comfort can be anticipated in LEED-certified office buildings.
Paul and Taylor [21]Albury-Wodonga, AustraliaHumid continentalNo difference in comfort perception between occupants of a green office building and those in non-green office buildings.
Nkini et al. [15]Dar es Salaam, TanzaniaHot humidOccupants of green buildings reported dissatisfaction with temperature control, which they cited to be a result of overly cold air conditioning.
Altomonte et al. [22]N/AN/AThe green rating points and IEQ score of green-certified office buildings does not guarantee occupants’ satisfaction with the indoor environment.
Esfandiari et al. [23]MalaysiaHot humidAlthough occupants reported overall satisfaction, overcooling was reported as a source of dissatisfaction.
Lakhiar et al. [18]MalaysiaHot humidThere are discrepancies between thermal comfort predicted by PMV model and occupants’ actual comfort levels.
Gou et al. [16]ChinaSubtropicalDespite green certification, a significant proportion of green office building occupants complained about discomfort associated with thermal conditions.
Mao et al. [14]Guangzhou, ChinaSubtropicalGreen buildings provided better thermal comfort compared to non-green buildings.
Table 2. Buildings’ description.
FeatureGBCB1CB2
Total floor area (m2)4500620012,062
Number of floors586
Ventilation systemAir-conditionedAir-conditionedAir-conditioned
Cooling and heatingVariable refrigerant flow system (VRF)Wall split ACWall split AC
Lighting fixturesLED lights with PIR sensorsFluorescentFluorescent
Window operationOperableOperableOperable
Temperature controlCentrally controlledOperableOperable
Lighting controlPIR sensorsOperableOperable
Energy supplyGrid + Diesel generator + SolarGrid + Diesel generatorGrid + Diesel generator
Construction detailsWallsSandcrete block wallSandcrete block wallSandcrete block wall
Ground floorConcrete floorConcrete floorConcrete floor
Intermediate floorsConcrete slabConcrete slabConcrete slab
RoofConcrete roofConcrete roofAluminium roof
GlazingDouble glazingSingle glazingSingle glazing
Table 3. Description of measured office spaces.
A B C D E
Building GBGBCB1CB1CB2
Office type Open planShared officeOpen planShared officeOpen plan
Occupancy 15321218
Size (m2) 86.3313.2710214.5100
Table 4. Measured indoor thermal conditions.
GB CBs
Air temperature Mean 23.4 24.4
(°C) STD0.60.23
Min.22.423.7
Max.24.824.6
Mean radiant temperature (°C) Mean 24.8 25.7
STD0.380.08
Min.24.125.5
Max.25.625.8
Relative Humidity (%) Mean 42.4 39
STD0.77.9
Min.41.328.1
Max.44.159.7
Air velocity (m/s) Mean 0.01 0.01
STD0.0150.007
Min.0.010
Max.0.070.03
Predicted Mean Vote (PMV) Mean 0.28 0.5
STD0.110.26
Min.0.060.03
Max.0.51.06
Predicted Percentage of Dissatisfied (PPD) (%) Mean 7 11.33
STD1.256
Min.55
Max.1029
Table 5. Participants’ clothing and metabolic rates based on self-reported clothing and activity levels, estimated following ASHRAE Standard 55 guidelines.
GB CB
Clothing insulation Mean 0.63 0.72
STD0.020.17
Min.0.620.5
Max.0.71.19
Metabolic rates Mean 1.56 1.4
STD0.20.22
Min.1.21.2
Max.22
Table 6. Participants’ thermal sensation votes.
GB CB
Thermal sensation votes (TSV) Mean −1.07 0.56
STD0.821.31
Min.−2.00−2.00
Max.13
Table 7. Neutral temperatures based on Griffiths’ method.
Building TypeTSV (Mean)Top (Mean)Tn
Green building (GB)−1.124.3 °C26.5 °C
Conventional buildings (CBs)0.5625.0 °C24.6 °C
Disclaimer/Publisher’s Note: The statements, opinions and data contained in all publications are solely those of the individual author(s) and contributor(s) and not of MDPI and/or the editor(s). MDPI and/or the editor(s) disclaim responsibility for any injury to people or property resulting from any ideas, methods, instructions or products referred to in the content.