Article

Safety Equipment Planning Through Experimental Analysis of Hydrogen Leakage and Ventilation in Enclosed Spaces

Department of Environment Research, Korea Institute of Civil Engineering and Building Technology, 283 Goyang-daero, Ilsanseo-gu, Goyang-si 10223, Gyeonggi-do, Republic of Korea
*
Author to whom correspondence should be addressed.
Sustainability 2025, 17(15), 7070; https://doi.org/10.3390/su17157070
Submission received: 27 May 2025 / Revised: 2 July 2025 / Accepted: 31 July 2025 / Published: 4 August 2025

Abstract

In South Korea, securing ground space for installing hydrogen refueling stations in urban areas is challenging due to limited ground space and high-density development. Safety concerns for hydrogen systems in enclosed urban environments also require careful consideration. To address this issue, this study explored a method of undergrounding hydrogen infrastructure as a solution for urban hydrogen charging stations. This study examined the characteristics of hydrogen diffusion and concentration reduction under leakage conditions within a confined hydrogen infrastructure, focusing on key safety systems, including emergency shut-off valves (ESVs) and ventilation fans. We discovered that the ESV reduced hydrogen concentration by over 80%. Installing two or more ventilation fans arranged horizontally improves airflow and enhances ventilation efficiency. Moreover, increasing the number of fans reduces stagnant zones within the space, effectively lowering the average hydrogen concentration.

1. Introduction

The indiscriminate use of fossil fuels has gradually increased the Earth’s average temperature, bringing global warming to the forefront as a critical environmental issue [1,2]. In response, 195 countries reached an agreement at the 2015 Paris Climate Conference under the United Nations Framework Convention on Climate Change to progressively reduce greenhouse gas emissions [3,4]. To achieve this goal, many nations have declared carbon neutrality and identified hydrogen as a key solution for decarbonization [5,6,7]. Hydrogen, which constitutes approximately 75% of the universe by mass and is the lightest element on Earth, can be produced through the electrolysis of water [8,9]. Hydrogen combustion produces no pollutants, with water as the only by-product, making it a promising eco-friendly alternative to fossil fuels, such as coal and oil [10].
Globally, countries are transitioning toward hydrogen economies to enhance energy self-sufficiency. According to McKinsey & Company (2022) [11], realizing a hydrogen economy can reduce annual greenhouse gas emissions by 6 billion tons, create a new market worth $2.5 trillion, and generate 30 million new jobs. To facilitate this transition, the expansion of hydrogen infrastructure is essential [12,13]. Various countries have announced hydrogen roadmaps and infrastructure development plans [14,15]. Europe’s “Hydrogen Roadmap Europe (2019)” focuses on technology development, pipeline construction, gas blending, and hydrogen refueling stations. Japan’s “Basic Hydrogen Strategy (2023)” sets the goal of building 1000 hydrogen stations by the year 2050. China’s “Hydrogen Energy Industry Development Plan (2022)” promotes the development of onsite refueling stations and pipeline blending. The U.S. “Road Map to a US Hydrogen Economy (2020)” emphasizes large-scale storage and pipelines, and the more recent “National Zero-Emission Freight Corridor Strategy (2024)” outlines plans for a nationwide network of hydrogen refueling stations for medium- and heavy-duty trucks [16].
In South Korea, the “Hydrogen Economy Roadmap (2019)” aims to build hydrogen infrastructure by promoting hydrogen vehicles and refueling stations. The national target is to install over 1200 stations across major cities and highways by 2040 [3]. However, unlike other countries, South Korea faces unique challenges in constructing hydrogen refueling stations owing to its high-density urban development and limited aboveground space. The reuse of existing gas stations for hydrogen refueling is limited by site conditions and facility constraints [17,18]. As a solution, recent studies have explored the installation of underground infrastructure, such as equipment buildings for hydrogen refueling stations. This approach reduces the required surface area and increases public acceptance by addressing safety concerns. However, when planning underground hydrogen infrastructure, it is essential to assess the safety issues associated with hydrogen leakage in confined spaces, an aspect that differs significantly from traditional above-ground stations.
According to the Design Institute for Physical Property Data of the American Institute of Chemical Engineers and the Material Safety Data Sheet provided by the Korean Occupational Safety and Health Agency, hydrogen is considered to pose a lower overall risk compared to city gas [19,20]. As a very light gas, hydrogen disperses rapidly upon leakage, making it difficult to sustain the three combustion elements—leakage, gas cloud formation, and ignition source—in open-air environments [21,22]. However, owing to its wide flammability and explosive limits, hydrogen poses a significant explosion hazard in confined spaces [23]. Therefore, safe handling of hydrogen in enclosed environments requires more rigorous consideration than in open environments. Previous studies [24,25,26] have utilized simulation-based analyses to investigate hydrogen leakage characteristics and the effects of ventilation location and configuration in enclosed spaces. Genovese, Blekhman & Fragiacomo (2024) [27] emphasized that sophisticated hydrogen leak detection technologies and emergency shutoff mechanisms play a critical role in minimizing the likelihood of ignition and explosion in hydrogen refueling stations. Various standards provide design and operational guidelines to ensure the safety of hydrogen handling facilities. Three key safety systems are commonly identified for preventing hydrogen leakage: emergency shutoff valves (ESV), hydrogen detection systems, and ventilation systems (Table 1).
To prevent accidents caused by hydrogen leakage, it is essential to evaluate the effectiveness of such safety systems to ensure hydrogen safety in enclosed environments. In previous studies, the analysis of hydrogen diffusion and concentration reduction focused primarily on the effect of ventilation fans among various safety equipment. In addition, for safety reasons, helium was often used rather than hydrogen as the leak gas in hydrogen diffusion experiments in closed spaces. However, in this study, we aimed to experimentally analyze the hydrogen concentration reduction characteristics according to various safety equipment conditions, such as the operation of the ESV, the number of ventilation fans, the type of ventilation fans, and the placement of ventilation fans, through an actual hydrogen leak. Through this analysis, the effectiveness of the safety systems in an enclosed hydrogen-handling facility was assessed, and additional safety planning considerations were proposed.

2. Experimental Setup and Method

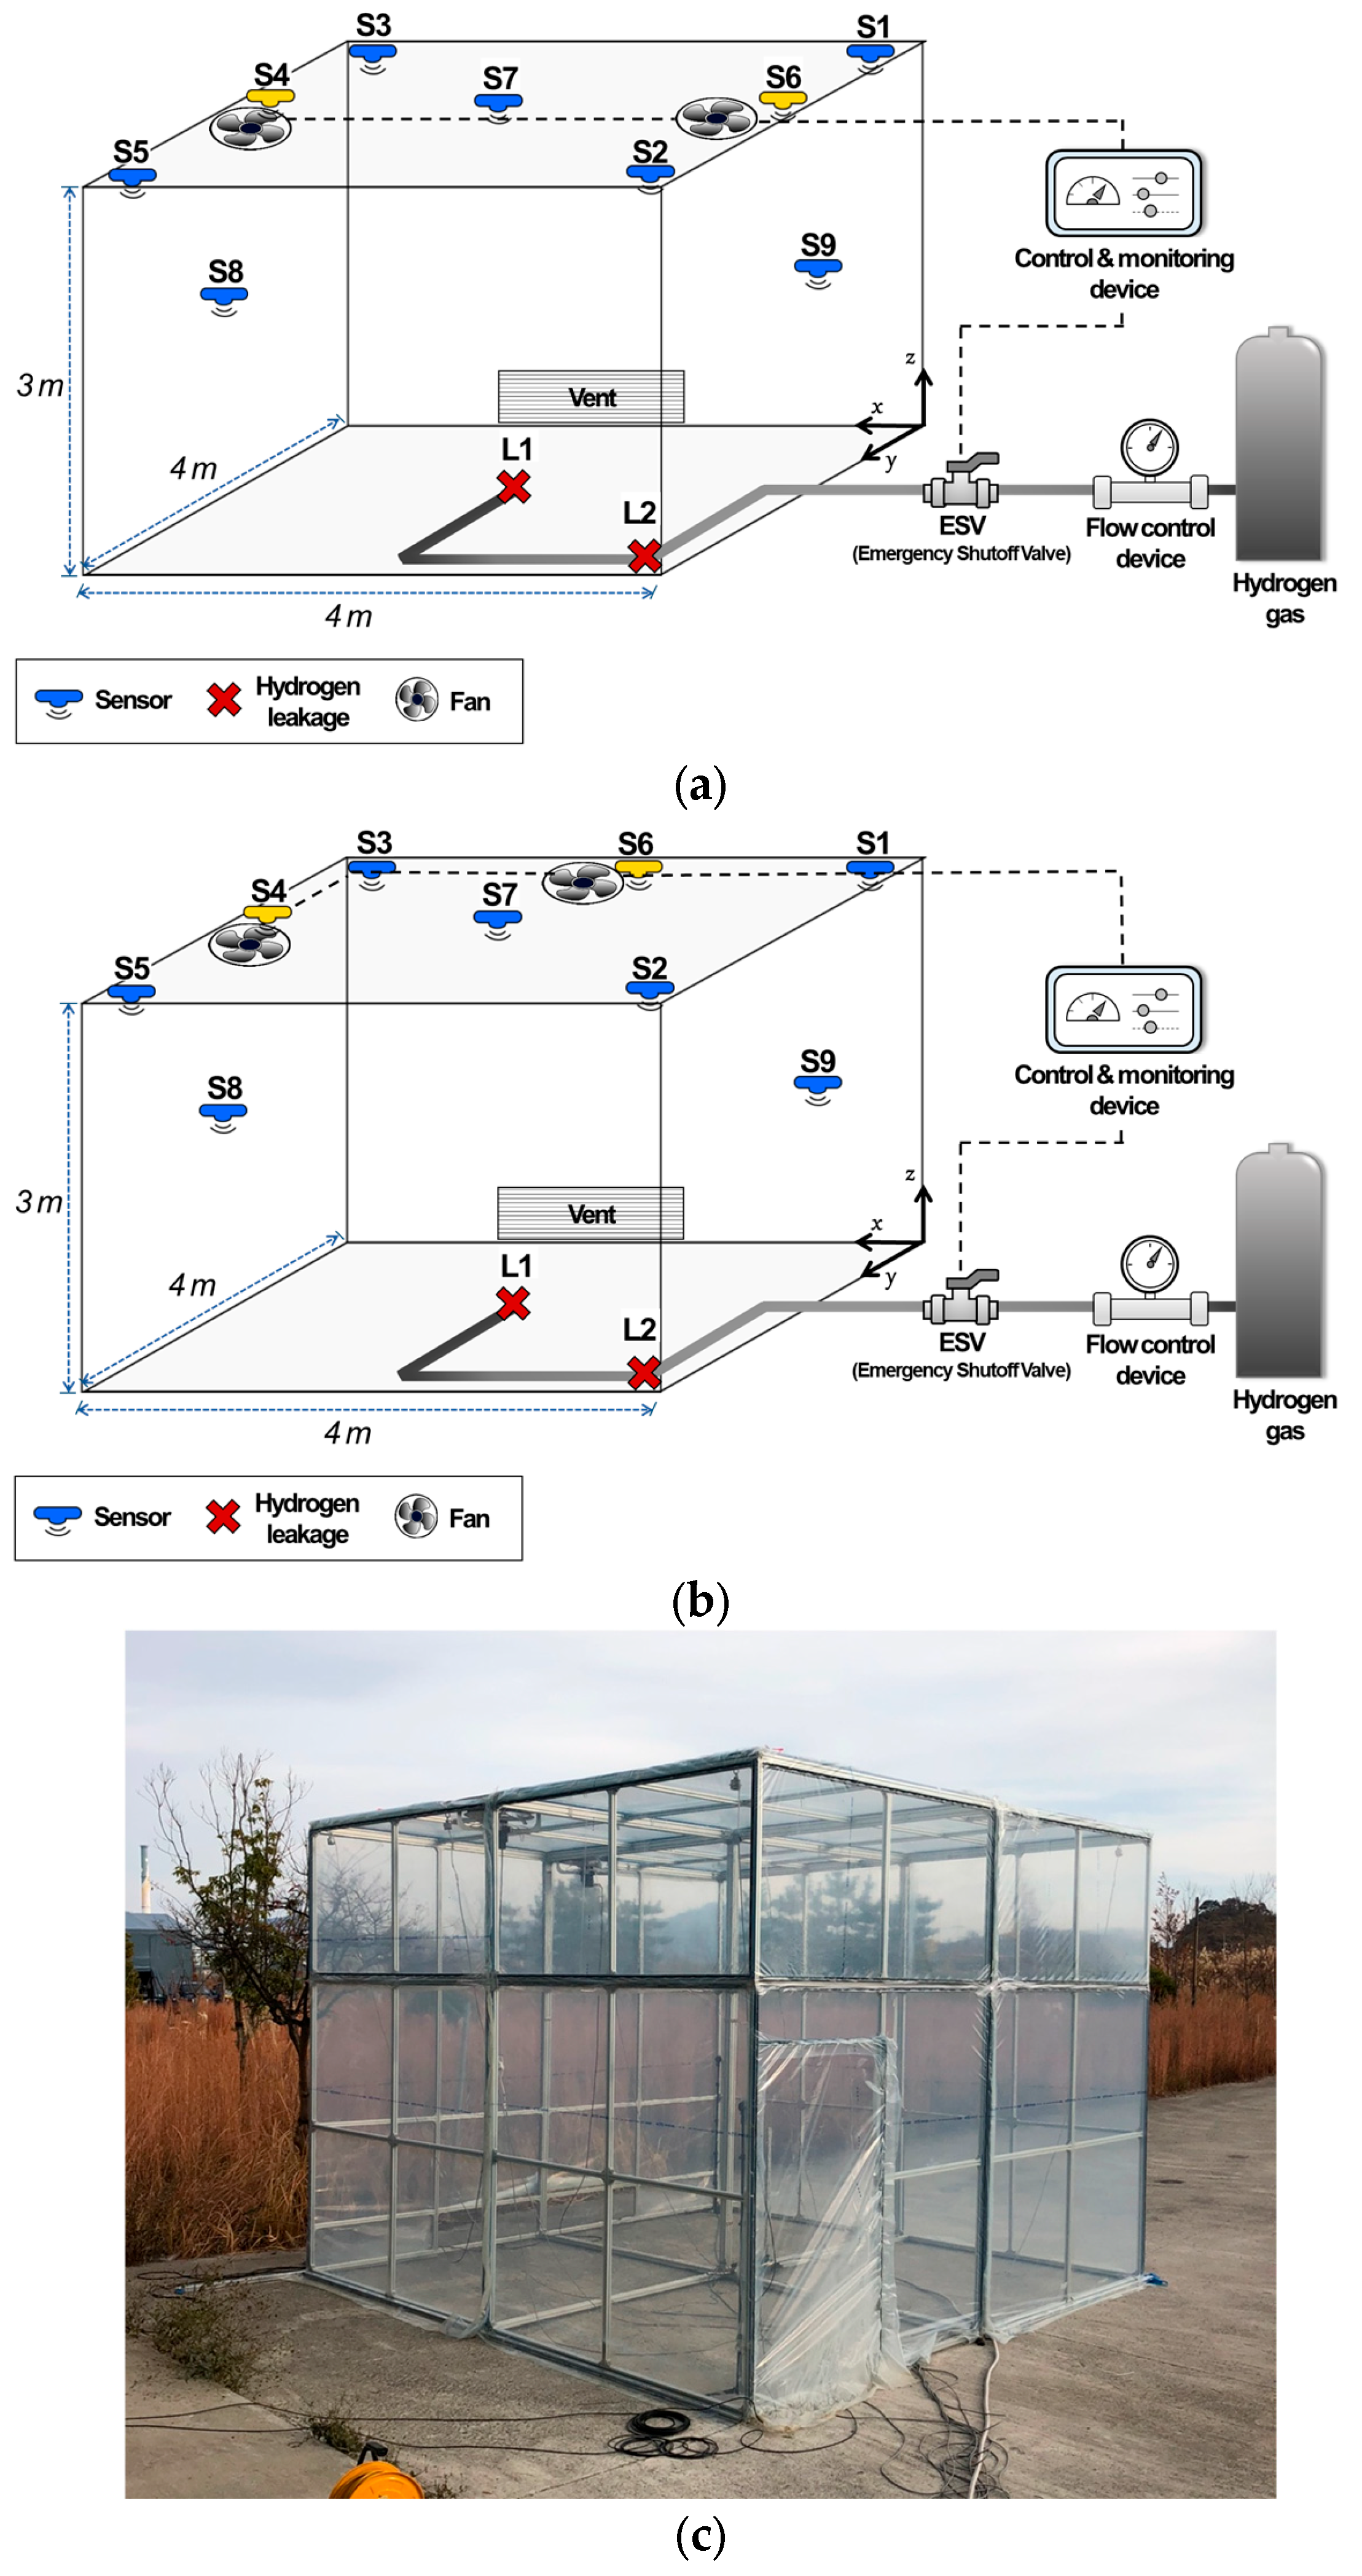
2.1. Experimental Setup

The experimental apparatus for hydrogen leakage testing was constructed with dimensions of 4 × 4 m and an internal height of 3 m. The design was based on practical reference dimensions drawn from previous studies on dedicated fuel cell rooms and hydrogen storage facilities [33,34], rather than being scaled from a specific facility. The size was selected independently, considering the space required to accommodate multiple pieces of equipment and to ensure sufficient clearance within the enclosure. The frame was constructed using aluminum profiles, and the enclosure was covered with a 0.15-inch-thick vinyl film. High-purity hydrogen gas (H2 99.99%) was used as the leakage medium in the experiment. Based on the assumed leak diameters of the key components in hydrogen supply systems, 1/8-inch stainless steel (STS 304) tubing was selected to simulate leakage pipelines, and hydrogen was supplied via an external mass flow controller.
According to the Korean Gas Safety (KGS) code [35], the flow rate condition selected in this experiment can be estimated using the following equation under subsonic flow conditions.
W = C d A l e a k P c o n γ M H 2 Z R T ( 2 γ 1 ) ( γ + 1 ) / ( γ 1 )
  • W: mass flow rate of leaking hydrogen [kg/s]
  • Cd: discharge coefficient
  • Aleak: cross-sectional area of leak nozzle [m2]
  • Pcon: internal pressure of hydrogen container [Pa]
  • γ : polytropic index of adiabatic expansion
  • M H 2 : molar mass of hydrogen [kg/kmol]
  • Z: compressibility factor
  • R: gas constant [8314 J/kmol K]
  • T: temperature [K]
where W, Aleak, Pcon, Z, R, and T represent the mass flow rate of leaking hydrogen, the cross-sectional area of the leak, the internal pressure of the container, the compressibility factor, the gas constant, and the gas temperature in Kelvin, respectively.
The discharge coefficient, Cd accounts for the flow characteristics through the orifice. For a sharp-edged nozzle, the Cd typically ranges from 0.5 to 0.75, whereas for a rounded orifice, it ranges from 0.95 to 0.99. In this study, the Cd was assumed to be 0.99 to represent a conservative scenario. The value of γ for hydrogen was taken as 1.41 at room temperature. This study considered the thermophysical properties of hydrogen at 20 °C and 1 atm to calculate the leakage flow rate. Since the container pressure used in the experiment was higher than the critical pressure, the choked flow condition applied. Under this condition, the mass flow rate becomes constant and is not affected by the downstream pressure.
To determine the leakage area, a 1/8-inch pipe diameter was selected. This is because most hydrogen leaks occur at flanges, valves, and seals, which are usually connected to small-diameter piping. Previous studies have estimated leakage scenarios as 1–10% of the pipe diameter, so this study assumed a 10% leak to represent a possible severe case. The supply pressure was set to 7 bar, considering the practical limits of the laboratory setup.
Based on these results, the leakage flow rate was rounded and selected as 300 LPM.
The safety equipment used in this study was selected based on major international safety standards, which included ESV, hydrogen detection sensors, and ventilation fans. These devices were integrated into a monitoring system for real-time control. Nine hydrogen sensors capable of detecting concentrations in the range of 0–100 vol% were installed inside the apparatus. Reflecting the findings of prior studies [36,37] on hydrogen dispersion behavior, the sensors were positioned to exclude the lower region, with seven sensors placed in the upper section and two in the middle section. A 0.52 m2 ventilation opening was installed at the bottom of the apparatus, and two explosion-proof ventilation fans (390 × 390 mm) with variable speed control were mounted on the ceiling (each unit provided a variable airflow rate of 18.7–47.5 m3/min). Two fan placements were used to examine changes in hydrogen diffusion characteristics: horizontal and diagonal layouts.

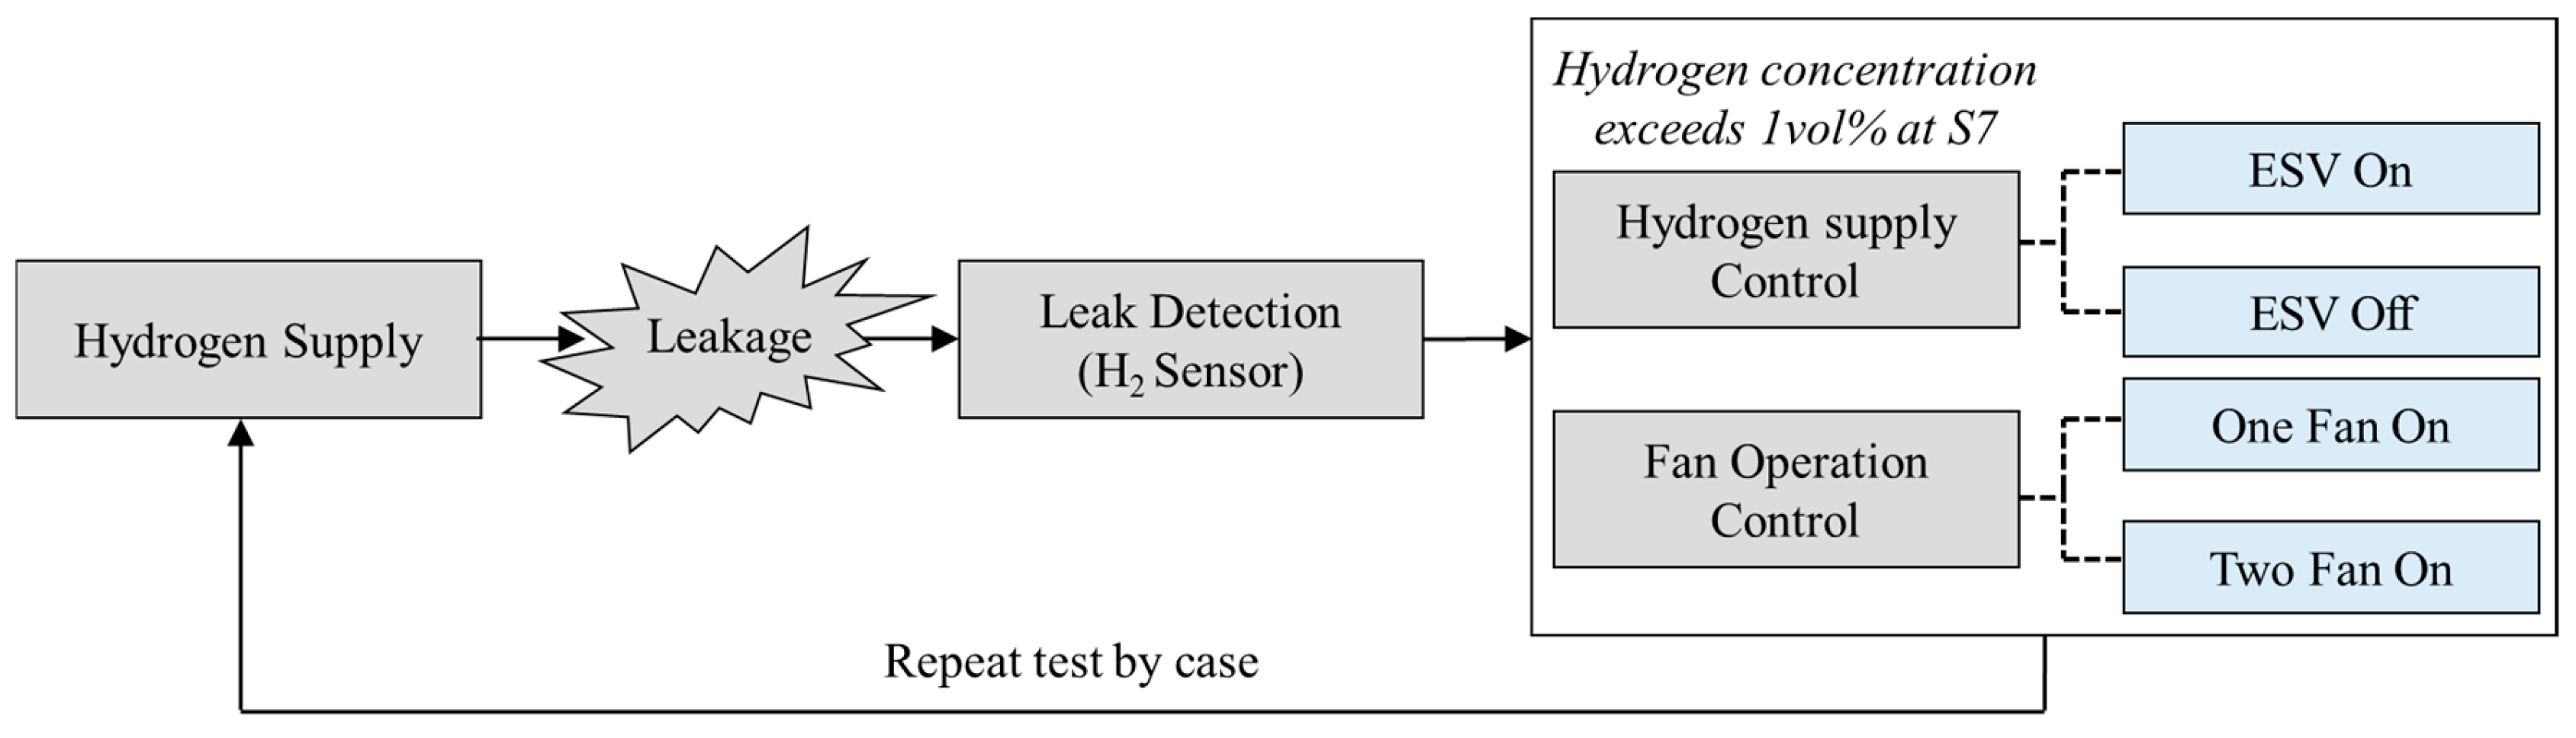
2.2. Experimental Method

The default leakage point was set at the geometric center of the enclosure. However, according to the accident analyses of hydrogen refueling stations by Sakamoto [38] and Kim [39], most hydrogen leaks occurred at the flanges or valves due to inadequate sealing (Table 2). Therefore, an additional leakage scenario was considered from the side. As shown in Figure 1, hydrogen was released at two different locations. These locations correspond to the center point (L1) and the side wall (L2). According to current safety regulations for hydrogen-handling environments, ventilation fans are required to be installed at the highest point within the enclosed space. However, no specific guidance is provided regarding the placement configuration. Therefore, in this study, two ceiling-mounted fan placement types (horizontal and diagonal) were applied to investigate the effects of layout on the performance of the safety equipment.
The experiment was conducted following the procedure illustrated in Figure 2. And the installed sensor positions and leakage locations are as shown in Table 3. The ESV and ventilation fans were programmed to activate when the S7 sensor, located at the center of the test chamber, detected a hydrogen concentration of 1 vol%. The primary variables selected for the experimental cases included ESV activation, operation of ventilation fans, the number of fans, fan placement, and the leak location. These variables were selected to analyze the hydrogen diffusion effects of key safety equipment as outlined in the standard presented in Table 1. They represent major design variables that can be considered from a safety planning perspective in enclosed spaces. The cases in this study were constructed to include elements that can be practically applied to future safety design planning, thereby maximizing representativeness within limited resources, as shown in Table 4.

3. Analysis of Experimental Results

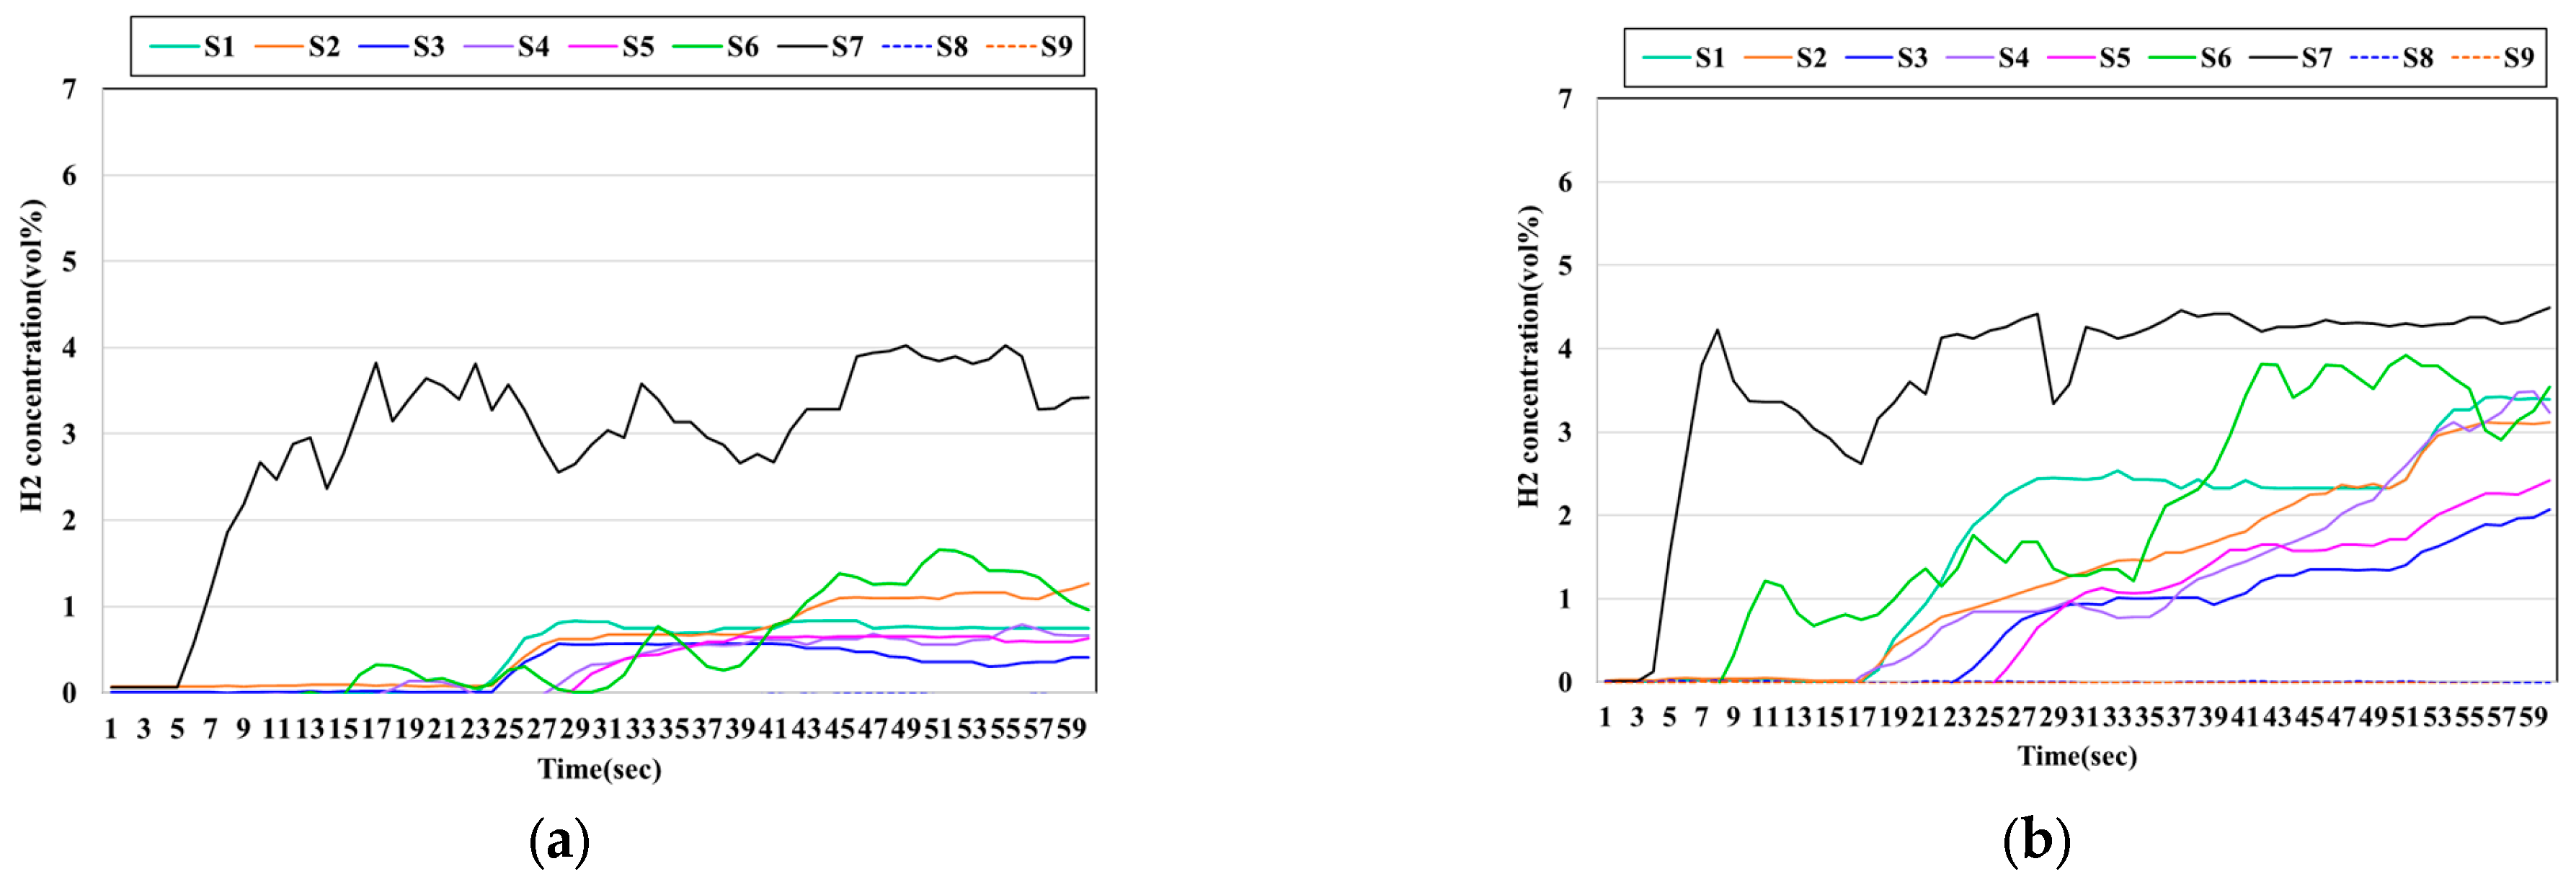
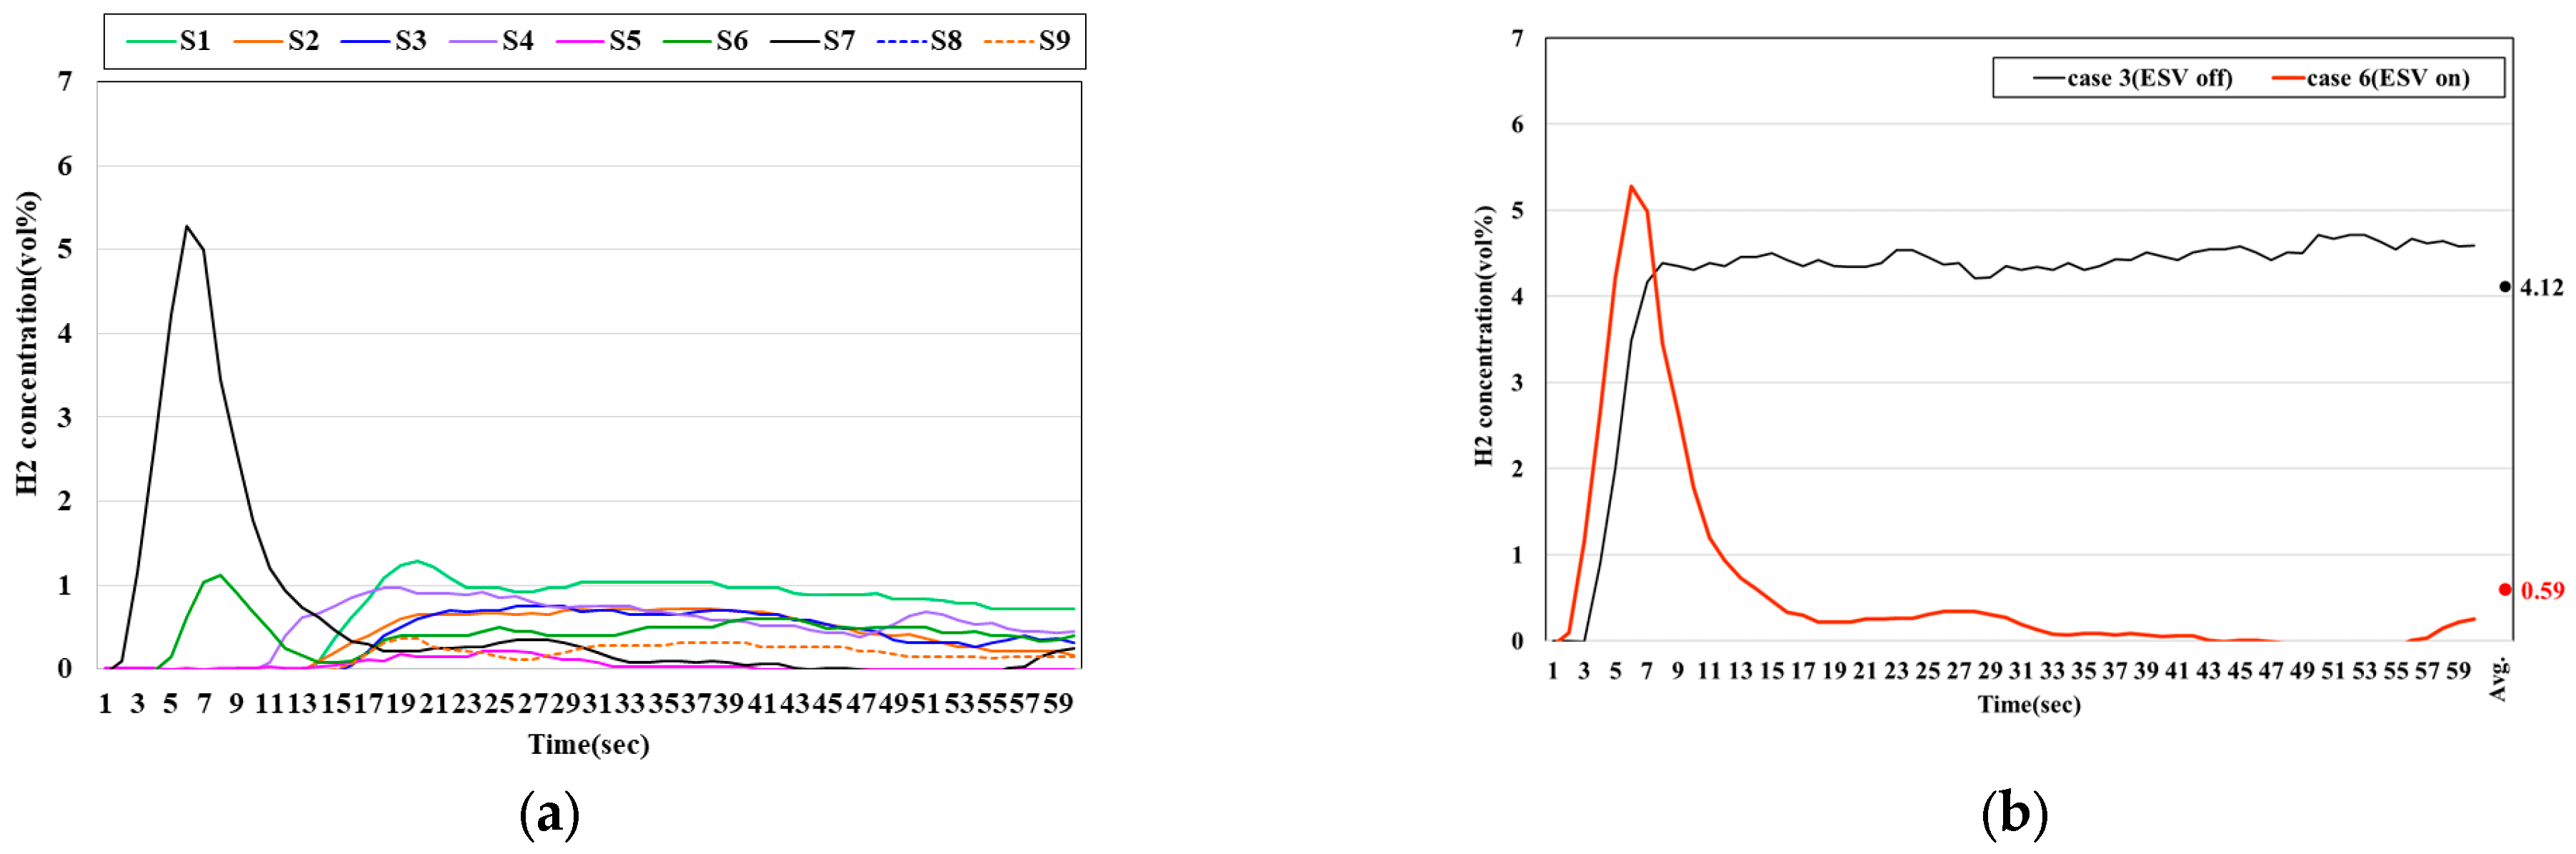
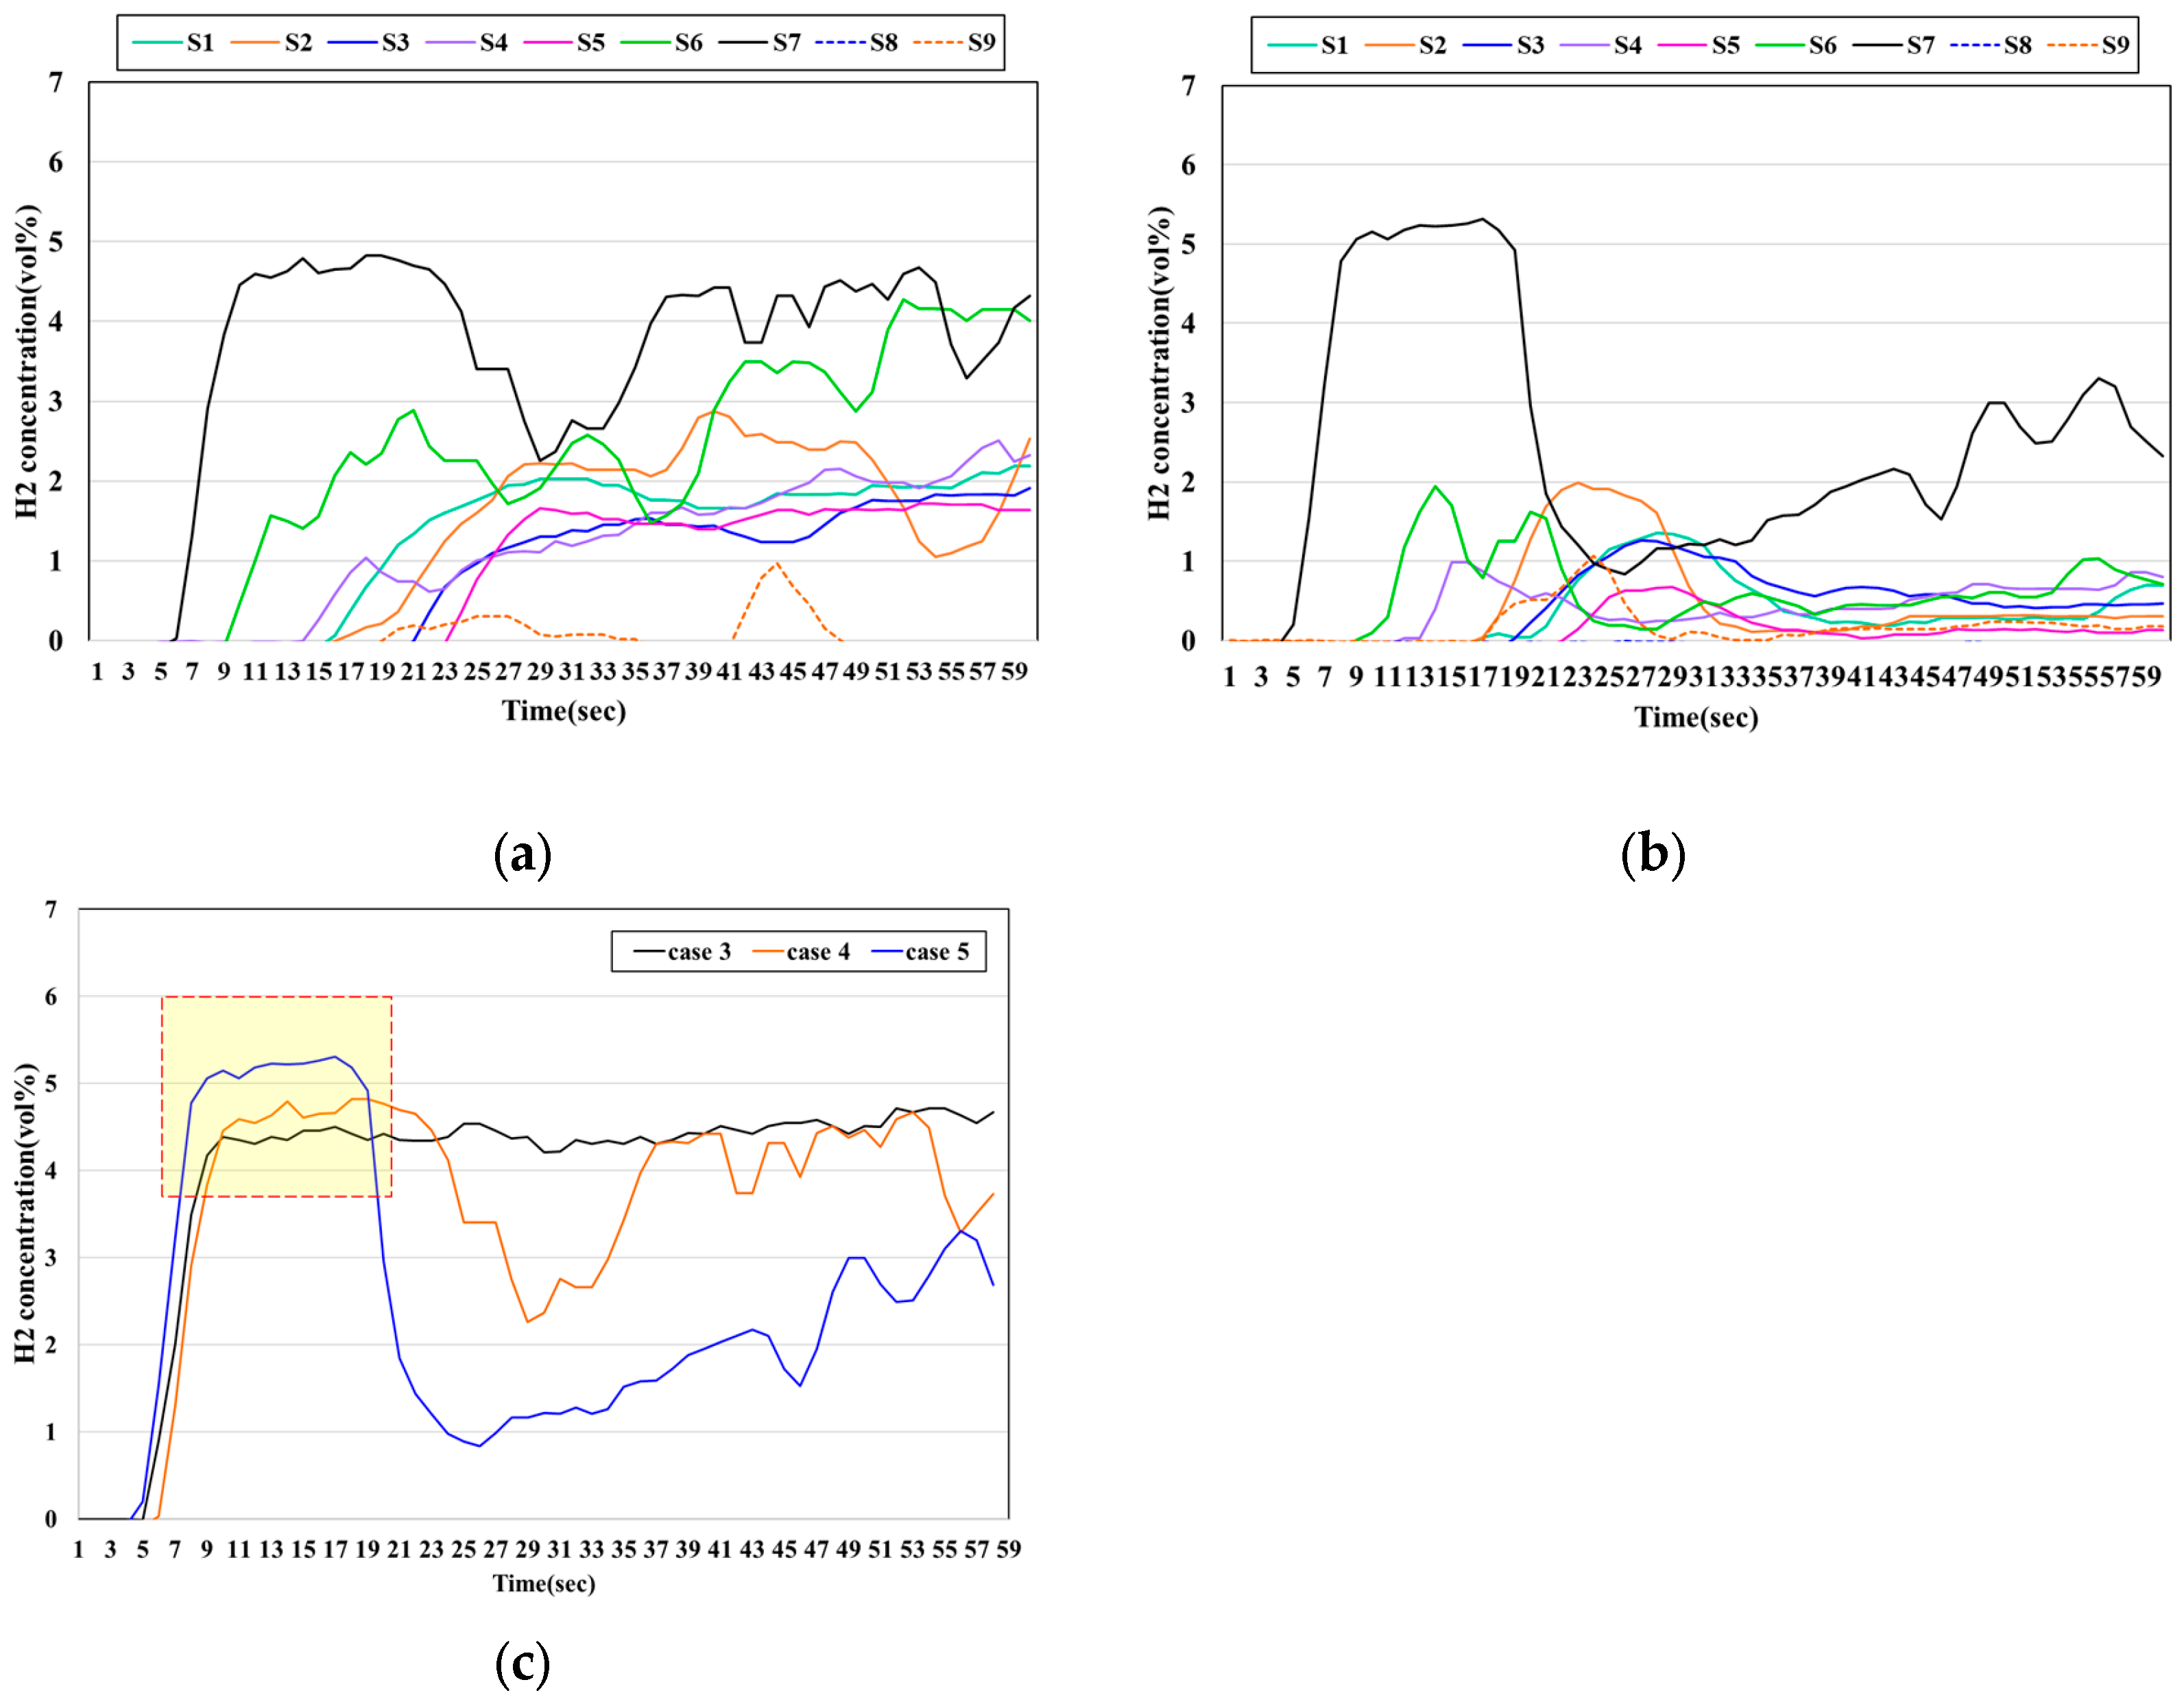
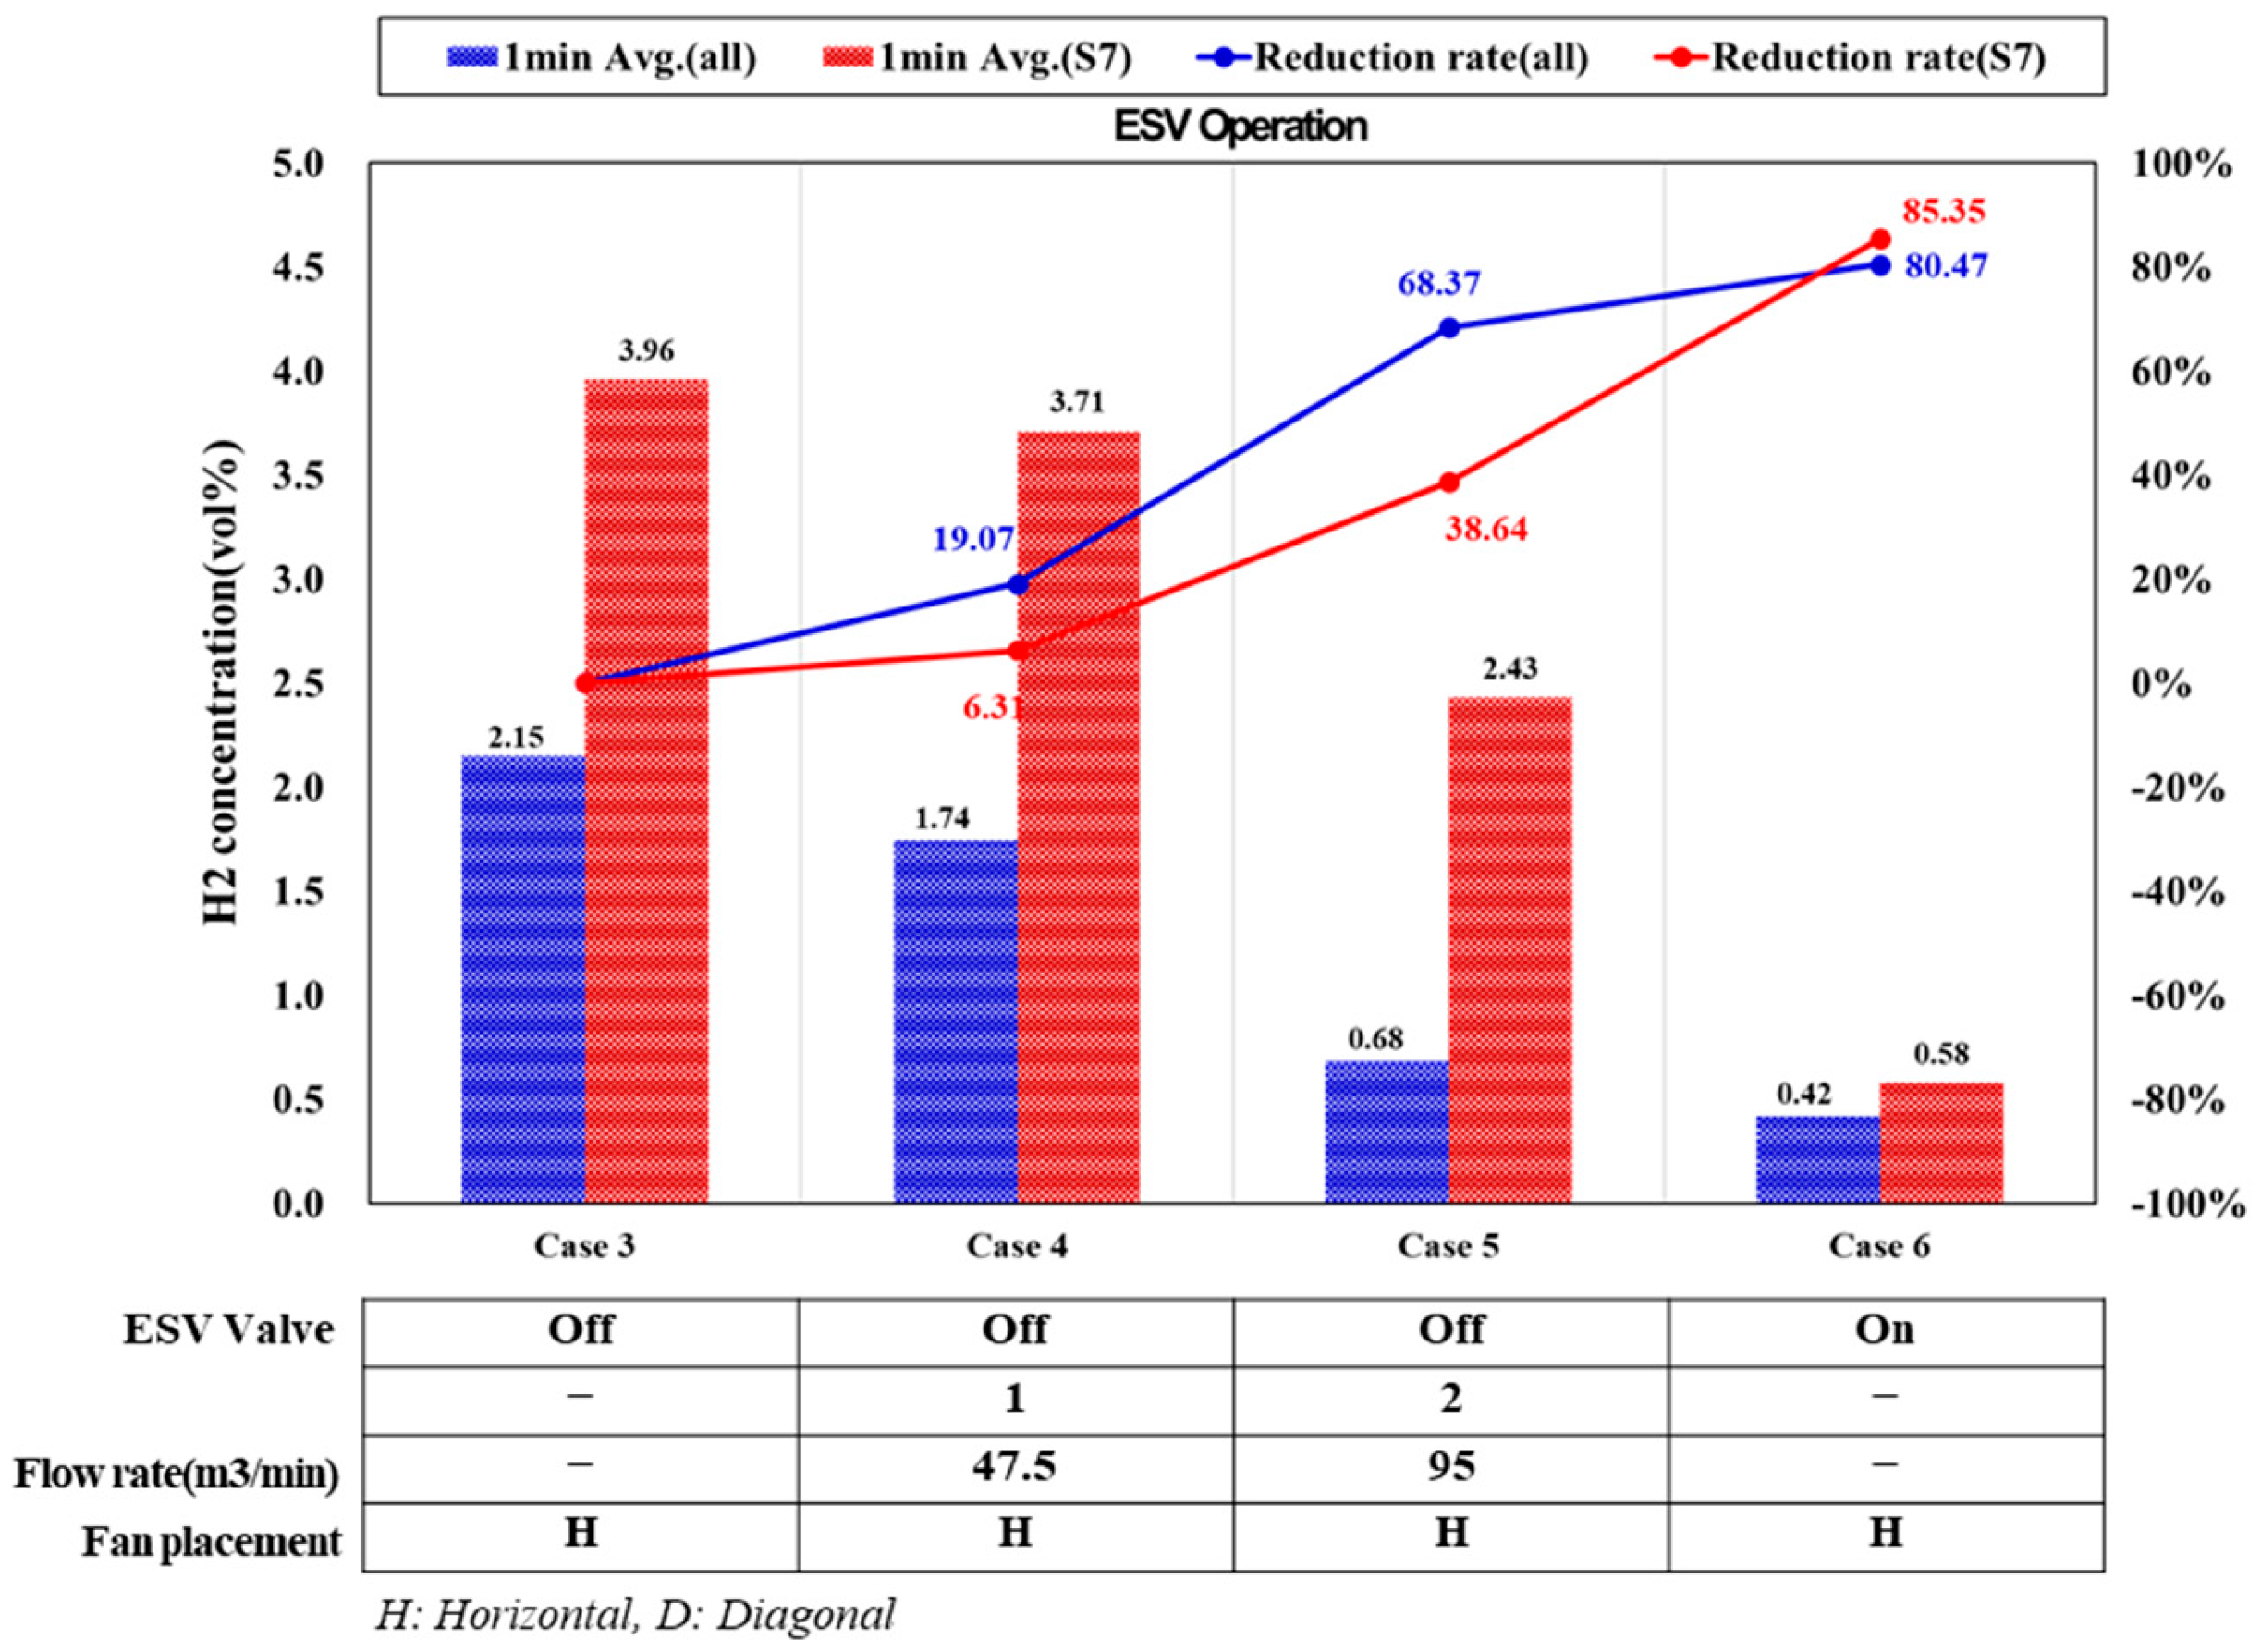
3.1. Evaluation of Indoor Characteristics According to ESV Operation

According to international standards, such as ISO 19880-1 and NFPA 2, the ESV must be installed in indoor hydrogen handling facilities as a safety measure against potential explosions. In this study, indoor hydrogen behavior was evaluated with and without shut-off valve activation. In the absence of ESV operation, internal hydrogen concentration gradually increased over time (Figure 3a–c). In particular, sensor S7, which was vertically aligned with the leakage point, exhibited a rapid increase in concentration compared to the other sensors. In Case 3, in which the leakage flow rate was the highest, the hydrogen concentrations measured by the upper-level sensors, such as S6 and S4, exceeded the lower flammability limit (LFL) of 4 vol% as the leak continued. In particular, sensors S6 and S4 showed some fluctuations in the measured hydrogen concentrations. This appears to be due to the structure of the experimental setup, where the areas near the ventilation fans are not completely sealed. As a result, the leaked hydrogen likely dispersed toward the fan region, causing variability in the sensor readings. Figure 3d illustrates that S7 reached 1 vol% within 7 s in Case 1 and within 5 s in Cases 2 and 3. At 300 LPM, the average hydrogen concentration over one minute reached 4.12 vol%, exceeding LFL. Even at 200 LPM, the concentration exceeded safety thresholds under certain conditions.
Figure 4 illustrates the degree of reduction in indoor hydrogen concentration when the leakage rate was at its highest (300 LPM) and the ESV was activated. As previously mentioned, the ESV was designed to be activated when the hydrogen concentration reached 1 vol% at sensor S7, which was located at the center of the room. A significant decrease in the hydrogen concentration was observed across all sensors following ESV activation (Figure 4a). In particular, at S7, the average hydrogen concentration was 0.59 vol% at one minute after activation, which represents an 85.35% reduction compared to the scenario without ESV (Figure 4b, Table 5). These results demonstrate the critical role of ESVs as safe devices in hydrogen-handling facilities. However, in cases of high leakage flow rates, hydrogen concentration in the vertical area above the leakage point may still exceed the lower explosive limit for several seconds, even after the ESV is activated. This indicates that additional safety equipment, such as ventilation fans, is essential.
Additionally, changes in indoor hydrogen concentration were analyzed when only ventilation fans were operated without ESV activation. Operating a single fan without an ESV resulted in volatile airflow patterns across all the upper-level sensors (Figure 5a). This is likely due to insufficient ventilation capacity relative to the leakage rate, preventing effective hydrogen removal. In contrast, hydrogen concentration was reduced when the two fans were operated, although some fluctuations remained, and full stabilization was not achieved. Notably, sensor S7 exhibits a distinct pattern during fan operation. As shown in Figure 5c, S7 exhibits slightly different characteristics due to the operation of the ventilation fan. It can be observed that the greater the airflow rate during fan operation, the higher the hydrogen concentration during the initial stage of the leakage. This is likely because the sudden increase in airflow-induced buoyant effects caused a higher concentration of hydrogen to be detected at S7, which was located directly above the leakage point. In previous studies, the use of ventilation fans has been primarily explored as a key safety equipment for reducing hydrogen concentration during leakage in enclosed spaces. However, this study suggests the importance of the ESV operation through experimental results. Without ESV activation, and as hydrogen leakage continues, the internal flow can become complex, particularly when the ventilation capacity is insufficient. This study shows that the use of an ESV is highly effective in reducing the concentration of hydrogen leaks in enclosed spaces.

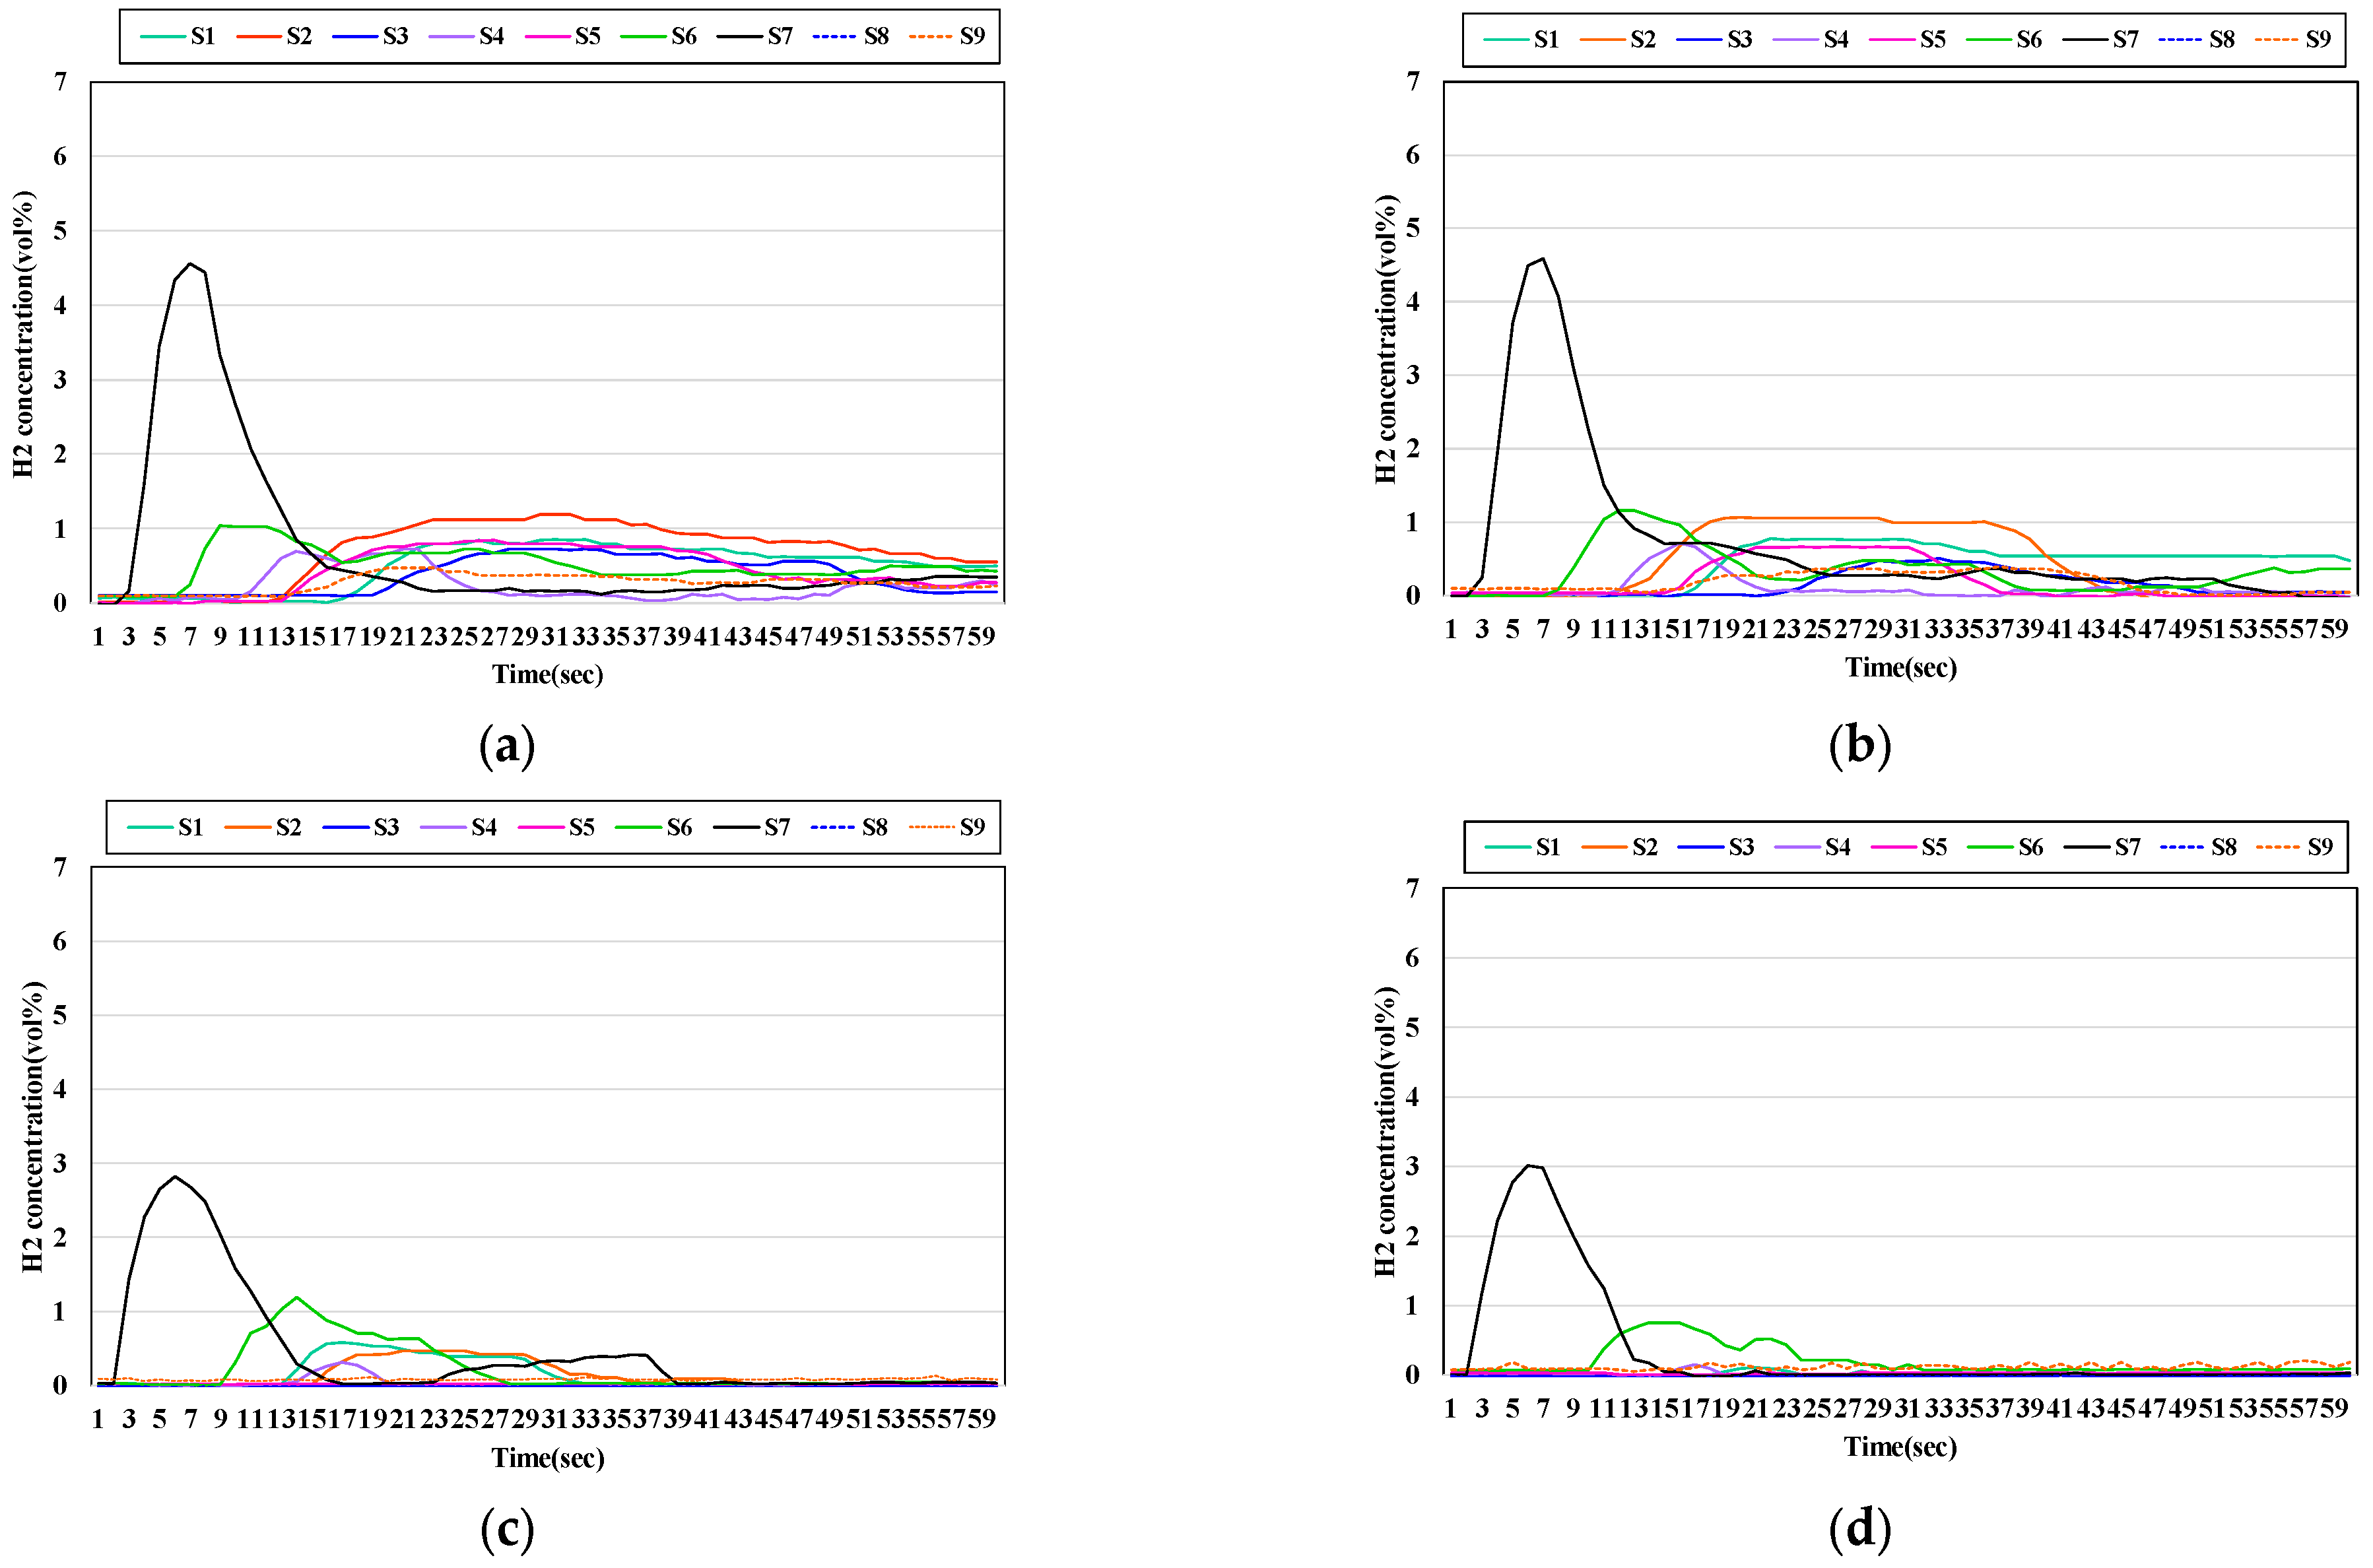
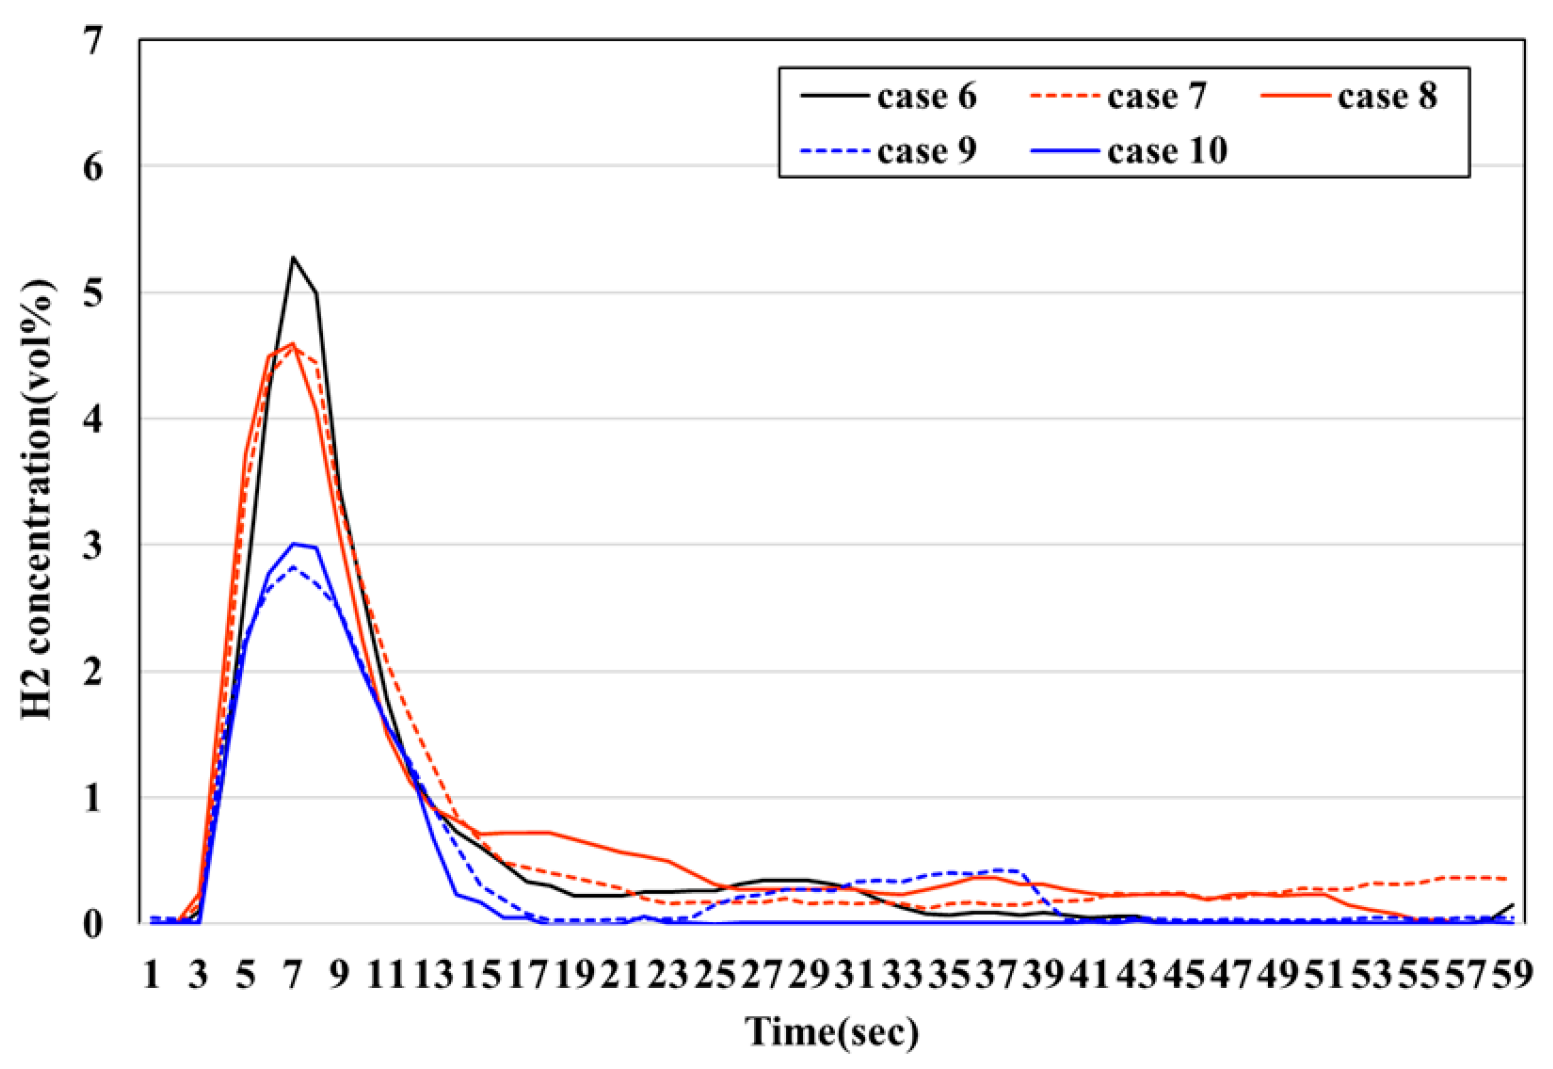
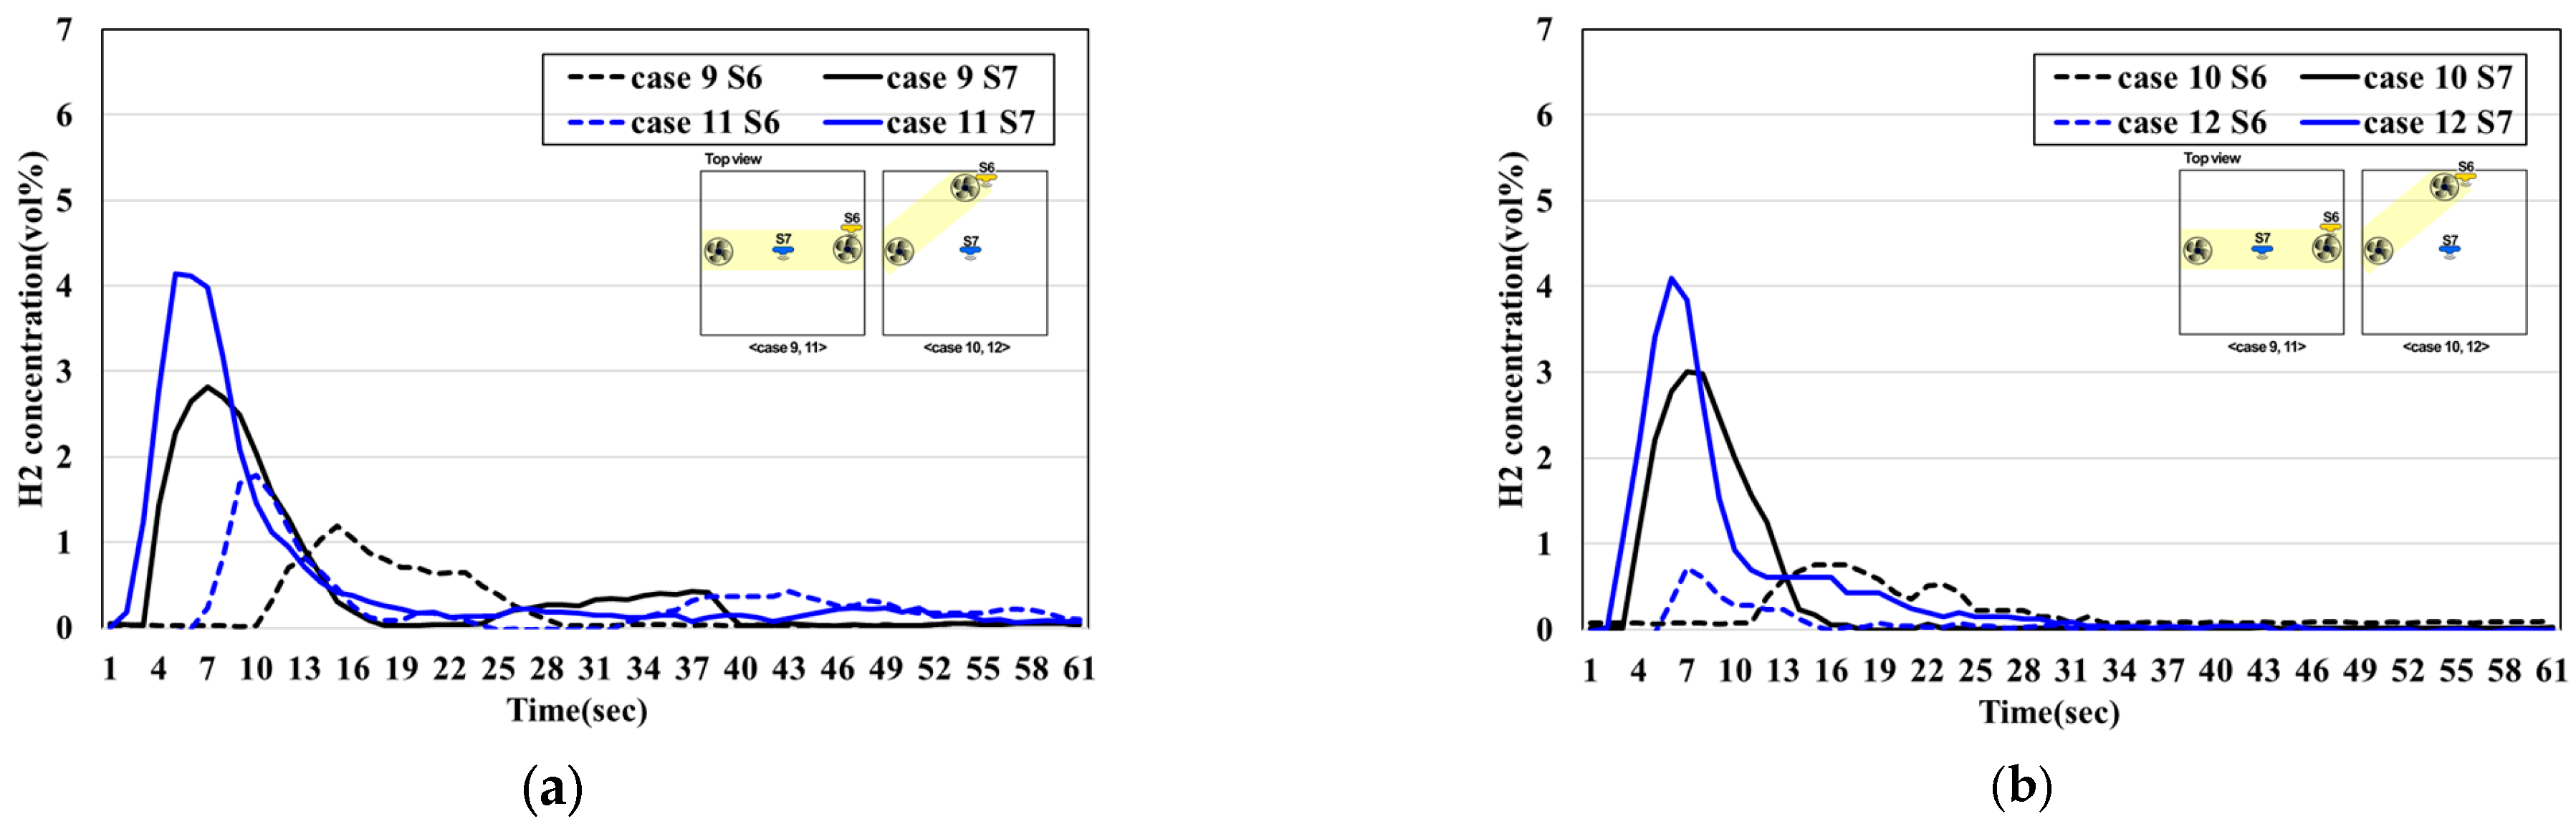
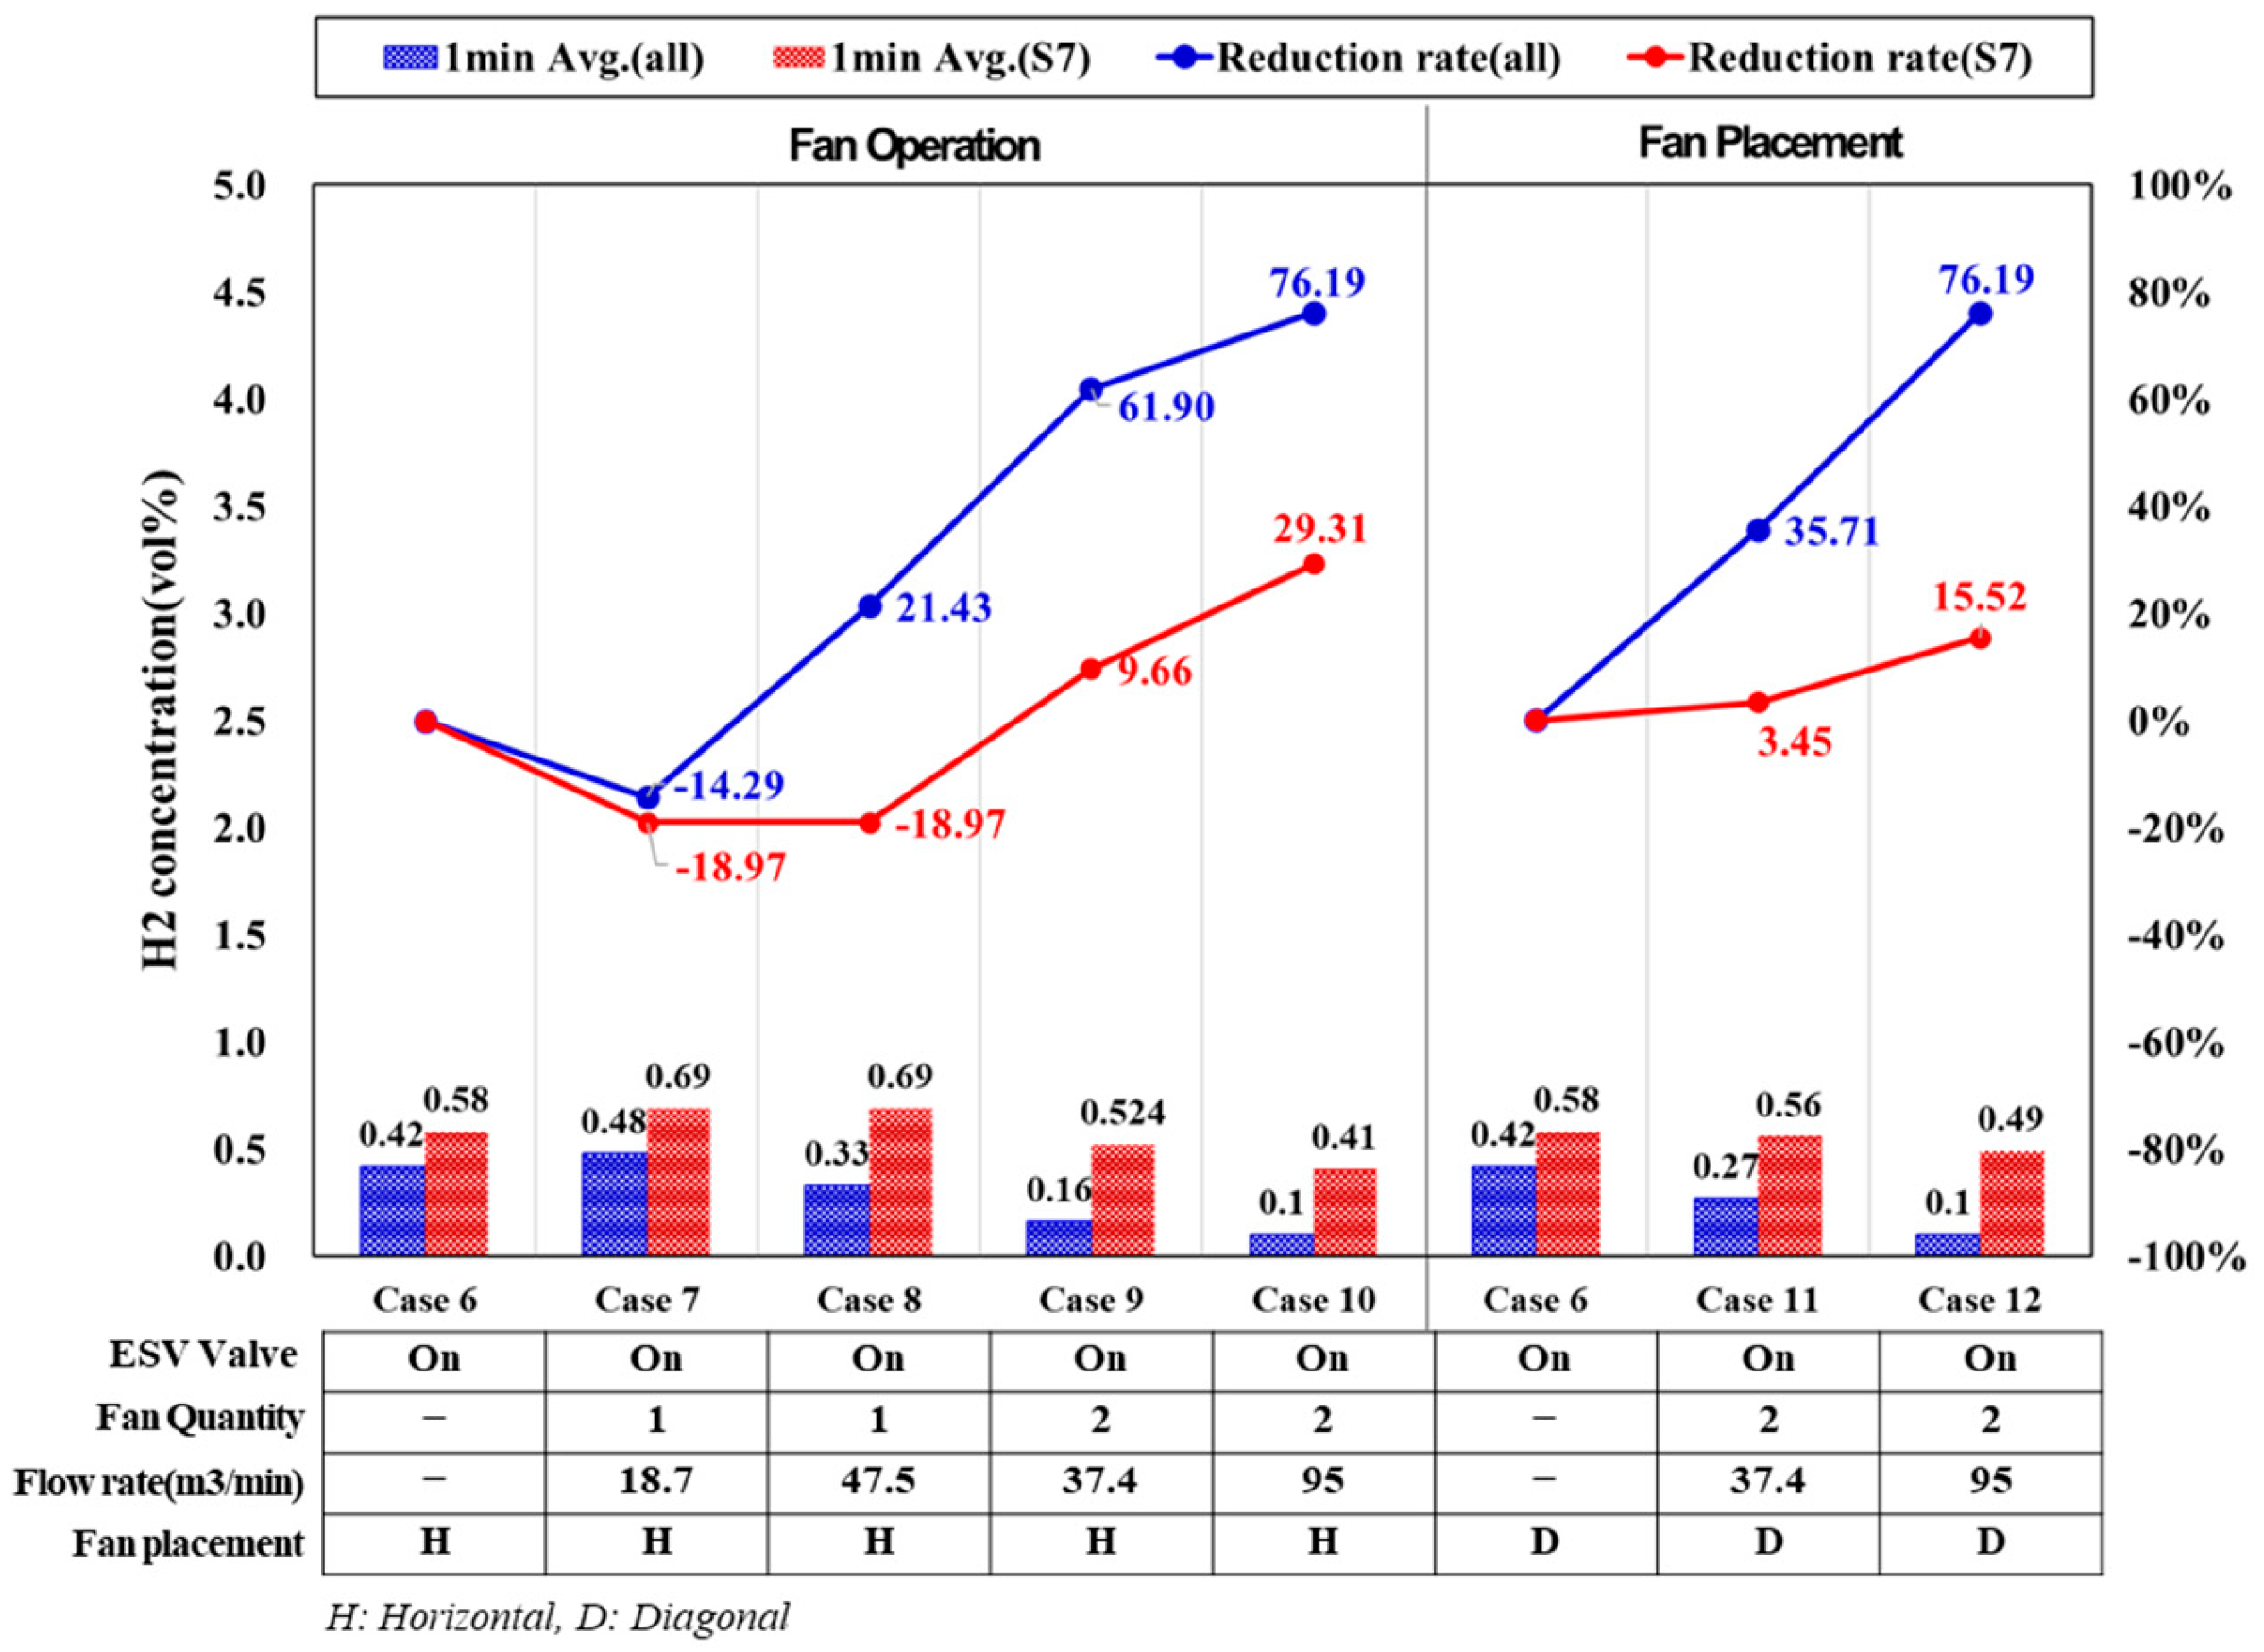
3.2. Evaluation of Indoor Characteristics According to Ventilation Fan Operation

Based on previous experimental results, it was confirmed that activation of the internal ESV is essential. Subsequently, the effect of ventilation fan operation on the indoor hydrogen characteristics was evaluated. The analysis focused on the highest leakage rate of 300 LPM. Figure 6 presents a comparative analysis of the hydrogen concentration trends based on the number of fans and their minimum and maximum flow rates. Even after ventilation, the hydrogen concentration at S7 remained higher than that at the other sensors, whereas the sensors located in the middle section (S8 and S9) detected almost no hydrogen (Figure 6). To assess the average indoor hydrogen concentration per case, the 1 min average concentrations were calculated using the upper sensors (S1 to S7), excluding S8 and S9 because of their negligible readings. The results showed that the average concentrations were 0.51% for Case 7, 0.34% for Case 8, 0.16% for Case 9, and 0.1% for Case 10, indicating a clear decrease as the ventilation capacity increases.
Figure 7 shows the hydrogen concentration changes in the S7 sensor without the ventilation fan operation. When two fans were used, the ventilation improved, and the hydrogen concentration decreased more rapidly.
These results are consistent with those reported in previous studies. Matsuura (2009) [40] mentioned that the ventilation performance at the top of the hydrogen leakage point might decrease because of the floor vent. Hajji (2022) [41] and Hou et al. (2023) [42] analyzed the hydrogen diffusion through CFD, revealing that when hydrogen leaks from the center of the space, it leaks vertically in the highest amount, and then separates and rotates as it moves laterally. In this study, the hydrogen concentration at sensor S7 was found to remain high despite ventilation. This is believed to be due to the formation of a partial stagnation zone around S7, which is located vertically above the leak point, caused by the spatial characteristics of the experimental apparatus.
Therefore, based on these findings, the presence of an upper stagnation region and the hydrogen diffusion characteristics under ventilation were empirically confirmed, consistent with the simulation results reported in previous studies.
This suggests that the ventilation at the top of the leakage point may require a certain amount of time to reach a safe level.
As shown in Figure 7, although the airflow varied depending on the number of fans, the patterns were similar. Hwang’s CFD simulations revealed that the decrease in hydrogen concentration is not linear with increasing airflow and that the concentration change becomes minimal beyond a certain airflow threshold [43]. Our experiment exhibited results similar to Hwang’s findings, suggesting that in Cases 7 and 9, where the airflow already provided a certain level of ventilation, there was minimal change in hydrogen concentration, even at maximum airflow.
In Table 6, the mean hydrogen concentration and standard deviation were quantitatively analyzed according to the capacity of the ventilation fans. The results showed a tendency for the standard deviation of hydrogen concentration to decrease as the number of ventilation fans increased. This can be attributed to the reduction in peak concentration values, as also observed in Figure 7, with a greater number of fans enhancing overall diffusion uniformity. Additionally, in Case 6, although no ventilation fans were operated, the average hydrogen concentration was measured to be slightly lower than in some fan-operating cases. However, the maximum peak concentration in Case 6 was higher than that observed in other conditions. This result is interpreted as being due to relatively effective natural ventilation through the vent installed in the experimental apparatus during the Case 6 trial.
Therefore, to further reduce the hydrogen concentration in the space, increasing the number of fans may be more effective than increasing the airflow of the installed fans. Additionally, Lee & Cho (2022) [44] found that increasing the exhaust vent area without changing the airflow did not significantly decrease the hydrogen concentration; however, the location of the intake/exhaust vents and their velocity had a greater impact on flow dynamics. Consequently, the number of ventilation fans and the ventilation layout must be carefully considered in planning the ventilation of hydrogen-handling facilities.
The analysis focused on the key sensors S7 and S6. When the fan arrangement was diagonal, the internal hydrogen concentration pattern was similar to that of the horizontal arrangement. However, the maximum hydrogen concentration in the S7 sensor was 4.14 vol% for the diagonal arrangement and 2.82 vol% for the horizontal arrangement (Figure 8a). In Figure 8b, the diagonal arrangement showed 4.10 vol%, whereas the horizontal arrangement showed 3.01 vol%, indicating that the horizontal arrangement resulted in lower hydrogen concentrations. Particularly around the stagnant zone near S7, the hydrogen concentration was significantly lower, suggesting that the horizontal fan arrangement was more efficient for ventilation.
Figure 9 and Figure 10 show the average hydrogen concentration and reduction rate under different safety equipment conditions. Notably, as shown in Figure 9, when only the ESV was activated, the overall hydrogen concentration was reduced by 80.47%, and in the S7 sensor, which showed the highest hydrogen concentration, the reduction reached 85.35%. Additionally, as shown in Figure 10, when the ESV was activated and only one ventilation fan was operating, the reduction rate was between 14.29% and 21.43%, indicating a lower reduction rate and even an increase in hydrogen concentration. However, when the two ventilation fans were in operation, the hydrogen concentration significantly reduced, with a maximum reduction of 76.19%. Furthermore, the reduction rate at S7 was 29.31% for the horizontal fan arrangement and 15.52% for the diagonal arrangement, indicating that the horizontal fan layout was more effective in reducing the overall hydrogen concentration.

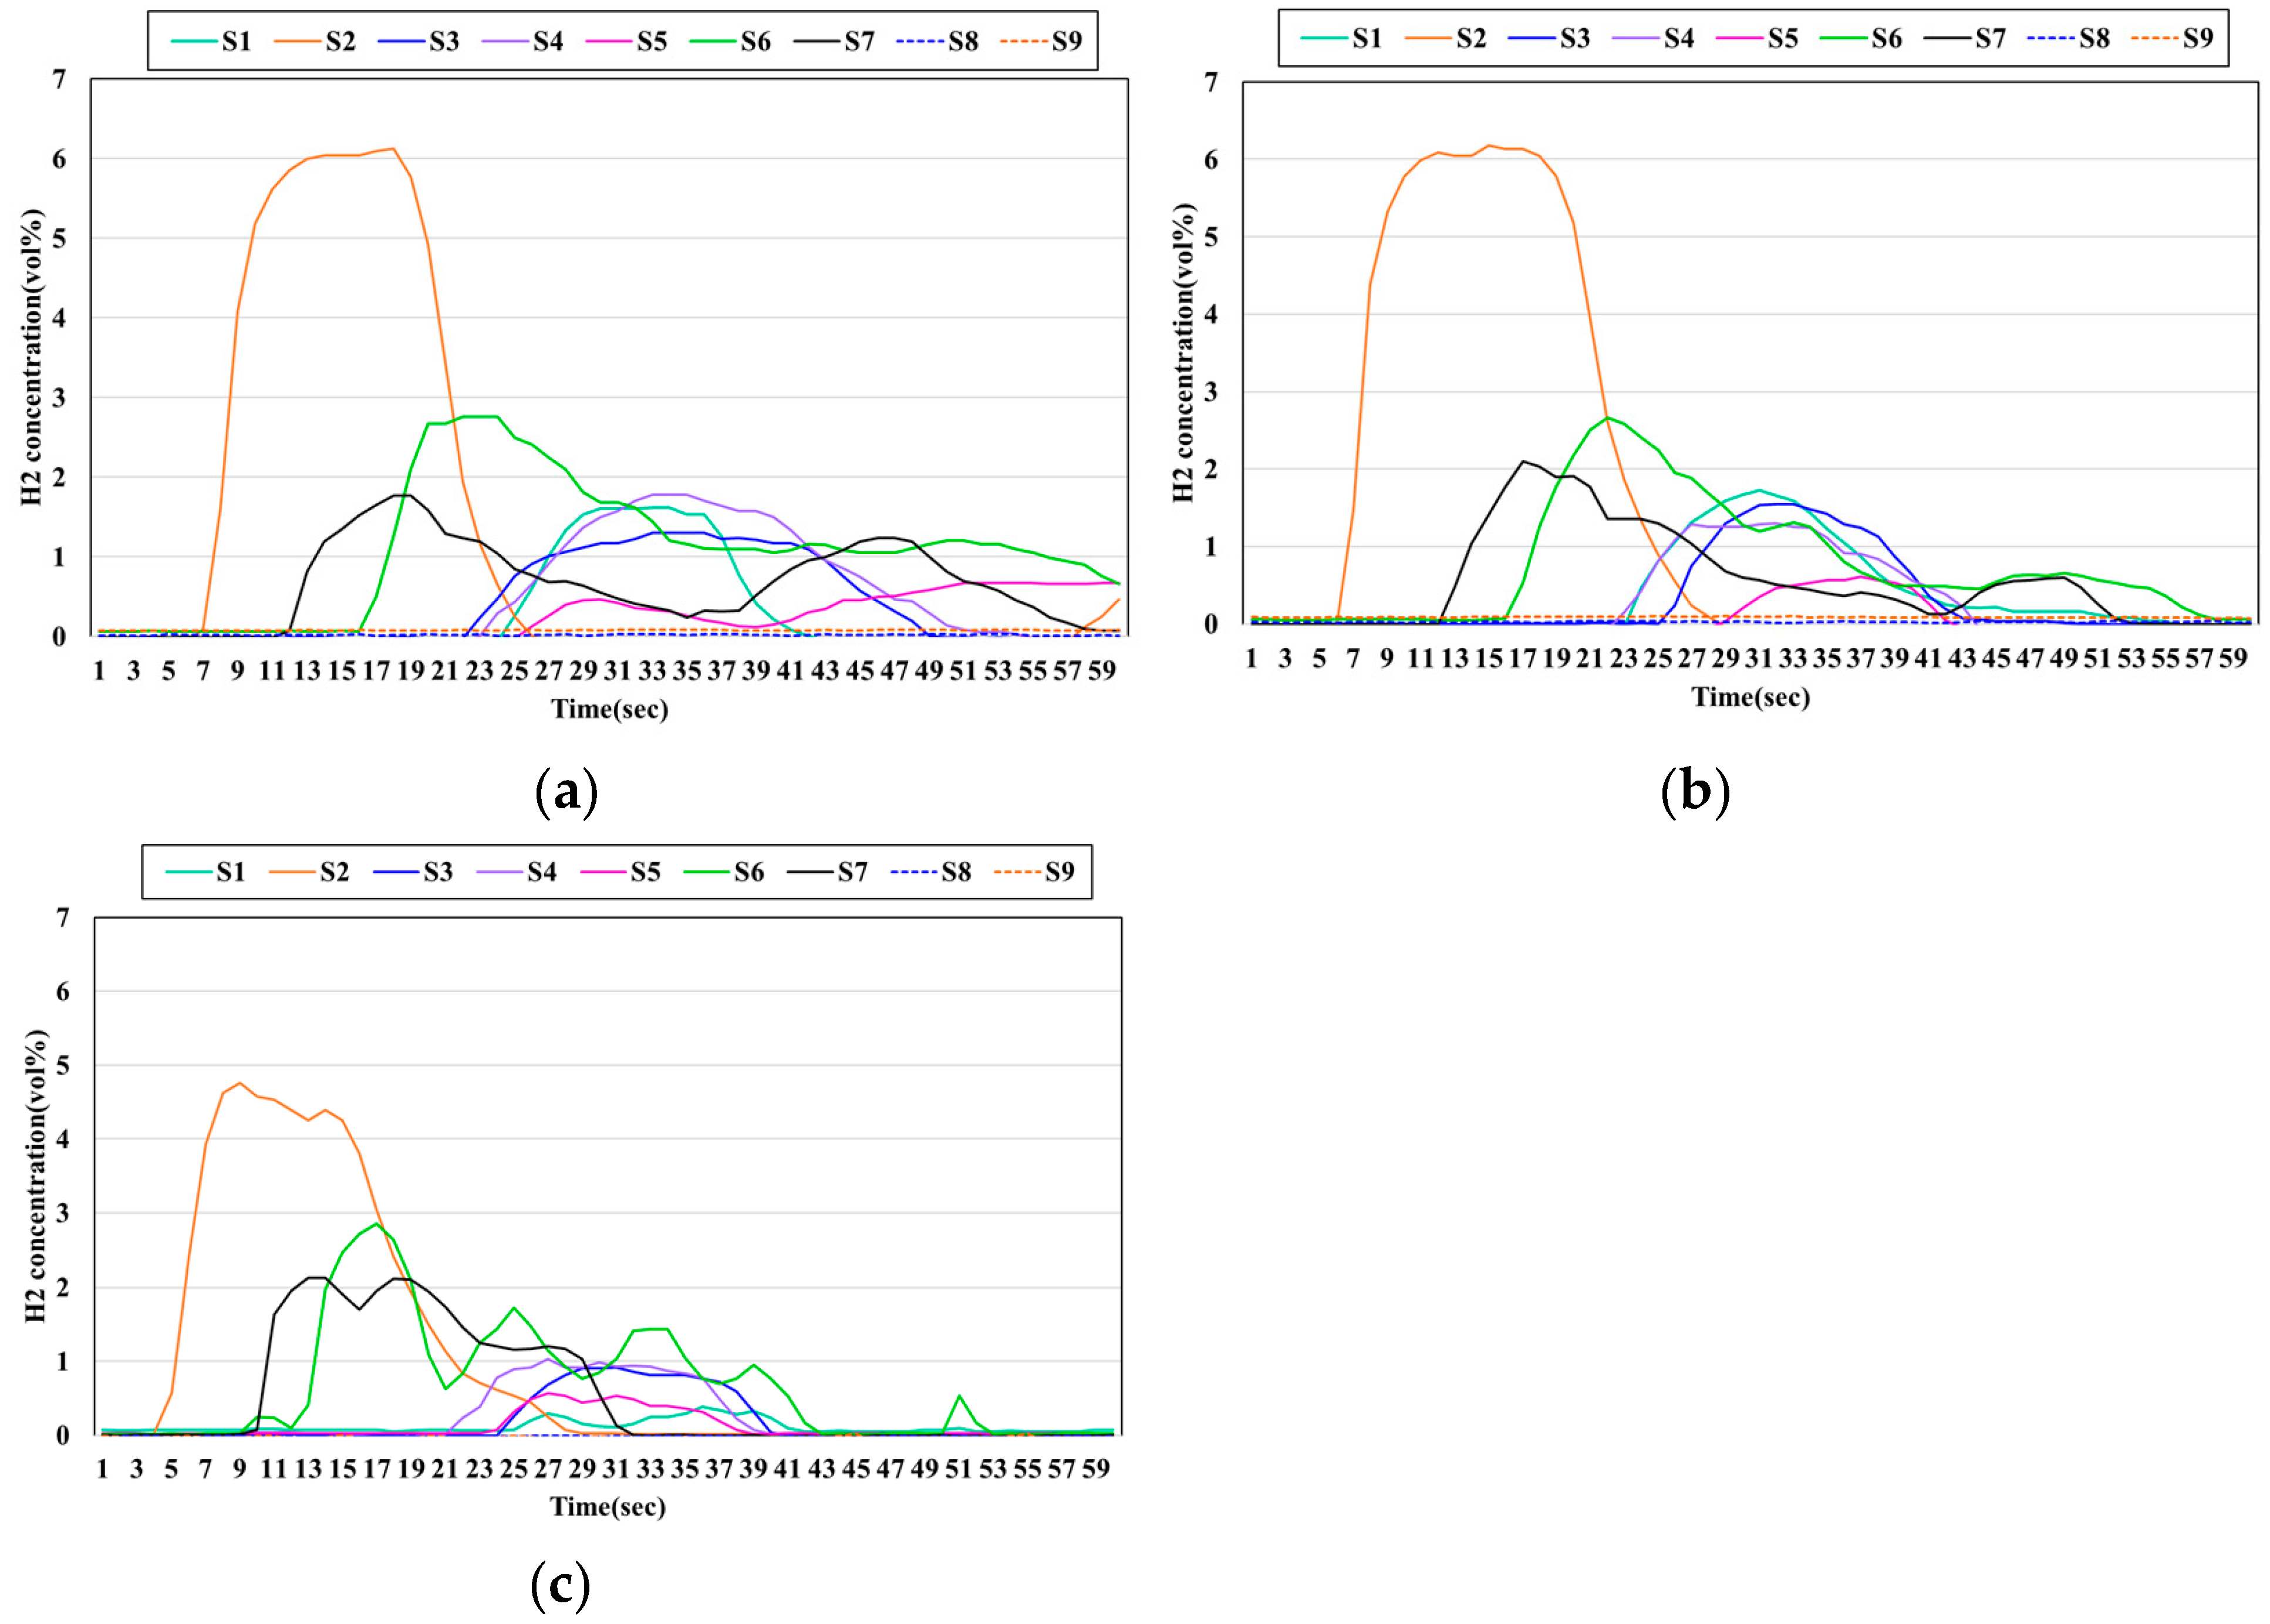
3.3. Evaluation of Indoor Characteristics Based on Hydrogen Leak Location Change

The hydrogen leak location was changed to L2 in the experimental setup (Figure 1) to examine the differences in hydrogen diffusion within the indoor environment. When the hydrogen leak occurred at the side rather than at the center, the sensor located on the straight line from the leak point, S2, was the first to exceed 1 vol%, showing the highest hydrogen concentration, similar to the central leak case (Figure 11). This indicates that when hydrogen leakage occurred indoors, the sensor located in the upper part of the straight line from the leak point detected hydrogen the fastest. In this experiment, the ESV and fans were activated when the hydrogen concentration at S7 exceeded 1 vol%. Consequently, in the case of a side leak (L2), the leak continued for 10–13 s before exceeding the threshold at S7, which caused the hydrogen concentration in the room to remain higher than that in the central leak (L1) case. Except for S2, the sensors located at the center (S7) and near the ventilation fan (S6) showed higher concentrations than the other sensors. In the case of S6, the hydrogen concentration increased owing to the airflow movement during ventilation. Lee and Cho (2022) [44] CFD analysis also showed that a thin hydrogen layer was formed near the exhaust, suggesting that as the amount of hydrogen leakage increased, detecting the hydrogen concentration near the ventilation fan became important. Additionally, in the case of S7, although hydrogen leakage occurred on the sides, some hydrogen remained stagnant.

4. Conclusions

This study analyzed the diffusion and reduction characteristics of hydrogen concentration and the concentration reduction rates under various conditions of key safety equipment, such as emergency shutoff valves (ESVs) and ventilation fans, in the event of hydrogen leaks in hydrogen-handling facilities. The results of this analysis, which provide direction and guidelines for safety equipment planning in hydrogen handling facilities, are as follows:
  • Hydrogen sensors should be installed in the upper central part of the room and at the upper sections of the joints where leaks are likely to occur.
  • Among the safety equipment for hydrogen handling facilities, an ESV alone can control over 80% of the initial internal hydrogen concentration, making it the most crucial equipment in safety equipment planning.
  • When planning the placement of internal ventilation fans, at least two fans should be installed, and a horizontal arrangement is more effective in reducing hydrogen concentration.
  • For effective ventilation, increasing the number of ventilation fans, rather than simply increasing the ventilation flow rate, is more effective in reducing zones of hydrogen stagnation and lowering the average hydrogen concentration.
  • Both the shut-off valve and the ventilation fans must be activated in the event of hydrogen leakage. However, if the shut-off valve fails to operate owing to an error, relying on the ventilation fans alone has limitations in reducing the internal hydrogen levels. Therefore, precautions must be taken to prevent shut-off valve malfunctions, and additional safety measures must be considered.
The findings of this study are expected to contribute to the development of safety equipment plans and standards for enclosed hydrogen handling facilities. Additionally, future research should focus on establishing an optimal ventilation plan by limiting hydrogen leak locations based on various indoor layout scenarios and developing safety equipment plans for the initial leak response.
To enhance the applicability of these findings, future experiments will also incorporate more realistic spatial configurations, including structural obstructions and variable environmental conditions such as temperature and pressure. These expanded scenarios will allow for a more comprehensive assessment of hydrogen dispersion behavior and safety equipment performance under diverse operational environments.

Author Contributions

H.-L.J.: Data curation, methodology, and writing; H.-S.S.: supervision; H.-C.S.: conceptualization; I.-J.H.: funding acquisition and project administration. All authors have read and agreed to the published version of the manuscript.

Funding

Research for this paper was carried out under the KICT Research Program (Project No. 20250242-001, Development of Technology to Secure Safety and Acceptability for Infrastructure in Hydrogen City) funded by the Ministry of Science and ICT.

Institutional Review Board Statement

Not applicable.

Informed Consent Statement

Not applicable.

Data Availability Statement

The datasets presented in this article are not readily available because the data are part of an ongoing study. Requests to access the datasets should be directed to the corresponding author [ijhwang@kict.re.kr].

Conflicts of Interest

The authors declare no conflicts of interest. The funder had no role in the design of the study; in the collection, analyses, or interpretation of data; in the writing of the manuscript; or in the decision to publish the results.

Abbreviations

The following abbreviations are used in this manuscript:
ESVEmergency shut-off valves
COP212015 Paris Climate Conference
UNFCCCUnited Nations Framework Convention on Climate Change
DIPPRDesign Institute for Physical Property
MSDSMaterial Safety Data Sheet
LFLLower flammability limit

References

  1. Li, Q.; Li, Q.; Wang, F.; Xu, N.; Wang, Y.; Bai, B. Settling behavior and mechanism analysis of kaolinite as a fracture proppant of hydrocarbon reservoirs in CO2 fracturing fluid. Colloids Surf. A Physicochem. Eng. Asp. 2025, 724, 137463. [Google Scholar] [CrossRef]
  2. Li, Q.; Han, Y.; Liu, X.; Wang, Y.; Zhang, Y. Hydrate as a By-Product in CO2 Leakage during the Long-Term Sub-Seabed Sequestration and Its Role in Preventing Further Leakage. Environ. Sci. Pollut. Res. 2022, 29, 77737–77754. [Google Scholar] [CrossRef] [PubMed]
  3. Falkner, R. The Paris Agreement and the new logic of international climate politics. Int. Aff. 2016, 92, 1107–1125. [Google Scholar] [CrossRef]
  4. UNFCCC. The Paris Agreement; United Nations: New York, NY, USA, 2016. [Google Scholar]
  5. Ball, M.; Wietschel, M. The future of hydrogen–opportunities and challenges. Int. J. Hydrogen Energy 2009, 34, 615–627. [Google Scholar] [CrossRef]
  6. Evro, S.; Oni, B.A.; Tomomewo, O.S. Carbon neutrality and hydrogen energy systems. Int. J. Hydrogen Energy 2024, 78, 1449–1467. [Google Scholar] [CrossRef]
  7. Solomon, B.D.; Banerjee, A. A global survey of hydrogen energy research, development and policy. Energy Policy 2006, 34, 781–792. [Google Scholar] [CrossRef]
  8. Cleaves, H.J. Hydrogen. In Encyclopedia of Astrobiology; Gargaud, M., Ed.; Springer: Berlin/Heidelberg, Germany, 2023; pp. 1374–1375. [Google Scholar] [CrossRef]
  9. Ren, J.T.; Chen, L.; Wang, H.Y.; Tian, W.W.; Yuan, Z.Y. Water electrolysis for hydrogen production: From hybrid systems to self-powered/catalyzed devices. Energy Environ. Sci. 2024, 17, 49–113. [Google Scholar] [CrossRef]
  10. Nowotny, J.; Veziroglu, T.N. Impact of hydrogen on the environment. Int. J. Hydrogen Energy 2011, 36, 13218–13224. [Google Scholar] [CrossRef]
  11. Mckinsey Company. Hydrogen Insights. 2022. Available online: https://hydrogencouncil.com/wp-content/uploads/2022/09/Hydrogen-Insights-2022-2.pdf (accessed on 5 February 2025).
  12. Ball, M.; Weeda, M. The hydrogen economy–vision or reality? Int. J. Hydrogen Energy 2015, 40, 7903–7919. [Google Scholar] [CrossRef]
  13. Hugo, A.; Rutter, P.; Pistikopoulos, S.; Amorelli, A.; Zoia, G. Hydrogen infrastructure strategic planning using multi-objective optimization. Int. J. Hydrogen Energy 2005, 30, 1523–1534. [Google Scholar] [CrossRef]
  14. IEA. Global Hydrogen Review 2023. 2023. Available online: https://iea.blob.core.windows.net/assets/ecdfc3bb-d212-4a4c-9ff7-6ce5b1e19cef/GlobalHydrogenReview2023.pdf (accessed on 9 February 2025).
  15. Korea Energy Economics Institute (KEEI). Overseas Case Studies on Hydrogen Supply to Revitalize the Hydrogen Economy. 2020. Available online: https://www.keei.re.kr/pdfOpen.es?bid=0001&list_no=82008&seq=1 (accessed on 5 February 2025).
  16. US Department of Energy (DOE). National Zero-Emission Freight Corridor Strategy. 2024. Available online: https://driveelectric.gov/files/zef-corridor-strategy.pdf (accessed on 5 February 2025).
  17. Kim, H.; Eom, M.; Kim, B.I. Development of strategic hydrogen refueling station deployment plan for Korea. Int. J. Hydrogen Energy 2020, 45, 19900–19911. [Google Scholar] [CrossRef]
  18. Stangarone, T. South Korean efforts to transition to a hydrogen economy. Clean Technol. Environ. Policy 2021, 23, 509–516. [Google Scholar] [CrossRef] [PubMed]
  19. Available online: https://www.aiche.org/dippr (accessed on 24 January 2025).
  20. Available online: https://msds.kosha.or.kr/MSDSInfo/ (accessed on 24 January 2025).
  21. Najjar, Y.S.H. Hydrogen safety: The road toward green technology. Int. J. Hydrogen Energy 2013, 38, 10716–10728. [Google Scholar] [CrossRef]
  22. Veziroğlu, T.N.; Şahi, S. 21st century’s energy: Hydrogen energy system. Energy Convers. Manag. 2008, 49, 1820–1831. [Google Scholar] [CrossRef]
  23. Xiao, H.; Duan, Q.; Sun, J. Premixed flame propagation in hydrogen explosions. Renew. Sustain. Energy Rev. 2018, 81, 1988–2001. [Google Scholar] [CrossRef]
  24. Ryu, B.R.; Duong, P.A.; Kim, J.B.; Choi, S.Y.; Shin, J.W.; Jung, J.; Kang, H. The effect of ventilation on the hazards of hydrogen release in enclosed areas of hydrogen-fueled ship. J. Mar. Sci. Eng. 2023, 11, 1639. [Google Scholar] [CrossRef]
  25. Patel, P.; Baalisampang, T.; Arzaghi, E.; Garaniya, V.; Abbassi, R.; Salehi, F. Computational analysis of the hydrogen dispersion in semi-confined spaces. Process Saf. Environ. Prot. 2023, 176, 475–488. [Google Scholar] [CrossRef]
  26. Zhang, X.; Wang, Q.; Hou, X.; Li, Y.; Miao, Y.; Li, K.; Zhang, L. Effect of the position and the area of the vent on the hydrogen dispersion in a naturally ventilated cubiod space with one vent on the side wall. Int. J. Hydrogen Energy 2022, 47, 9071–9081. [Google Scholar] [CrossRef]
  27. Genovese, M.; Blekhman, D.; Fragiacomo, P. An exploration of safety measures in hydrogen refueling stations: Delving into hydrogen equipment and technical performance. Hydrogen 2024, 5, 102–122. [Google Scholar] [CrossRef]
  28. ISO 19880-1:2020; Gaseous Hydrogen—Fuelling Stations—Part 1: General Requirements. ISO: Geneva, Switzerland, 2020.
  29. NFPA 2; Hydrogen Technologies Code. National Fire Protection Association: Boston, MA, USA, 2023.
  30. NFPA 853; Standard for the Installation of Stationary Fuel Cell Power Systems. National Fire Protection Association: Boston, MA, USA, 2025.
  31. KGS FU671; Facility/Technical/Inspection Code for Use of Hydrogen Gases. KGS: Eumseong-gun, Republic of Korea, 2021.
  32. KOSHA GUIDE P-30-2021; Technical Guidelines on Safety of Hydrogen Charging Stations. KOSHA: Ulsan, Republic of Korea, 2021.
  33. Ji, H.W.; Lee, H.; Hwang, I.; Jang, H. Safe ventilation methods against leaks in hydrogen fuel cell rooms in homes. Energies 2022, 15, 5434. [Google Scholar] [CrossRef]
  34. Tanaka, T.; Azuma, T.; Evans, J.A.; Cronin, P.M.; Johnson, D.M.; Cleaver, R.P. Experimental study on hydrogen explosions in a full-scale hydrogen filling station model. Int. J. Hydrogen Energy 2007, 32, 2162–2170. [Google Scholar] [CrossRef]
  35. KSG GC101; High-Pressure Gas Safety Control Standards. KSG: Eumseong-gun, Republic of Korea, 2018. Available online: https://cyber.kgs.or.kr/kgscode.codeSearch.view.ex.do?onEngYn=F&pblcRlmCd=&pblcMdclCd=&pblcCd=GC101_220830&stDayY=2008&stDayM=01&etDayY=2025&etDayM=08 (accessed on 24 January 2025).
  36. Swain, M.R.; Filoso, P.; Grilliot, E.S.; Swain, M.N. Hydrogen leakage into simple geometric enclosures. Int. J. Hydrogen Energy 2003, 28, 229–248. [Google Scholar] [CrossRef]
  37. Vudumu, S.K.; Koylu, U.O. Detailed simulations of the transient hydrogen mixing, leakage and flammability in air in simple geometries. Int. J. Hydrogen Energy 2009, 34, 2824–2833. [Google Scholar] [CrossRef]
  38. Sakamoto, J.; Sato, R.; Nakayama, J.; Kasai, N.; Shibutani, T.; Miyake, A. Leakage-type-based analysis of accidents involving hydrogen fueling stations in Japan and USA. Int. J. Hydrogen Energy 2016, 41, 21564–21570. [Google Scholar] [CrossRef]
  39. Kim, H.L.; Kang, S.K.; Huh, Y.S. Accidents Analysis of Domestic and Overseas Refueling Stations and Assessment of Dangerous Distance by Gas leak. J. Energy Eng. 2017, 26, 7–13. [Google Scholar]
  40. Matsuura, K. Effects of the geometrical configuration of a ventilation system on leaking hydrogen dispersion and accumulation. Int. J. Hydrogen Energy 2009, 34, 9869–9878. [Google Scholar] [CrossRef]
  41. Hajji, Y.; Bouteraa, M.; Bournot, P.; Bououdina, M. Assessment of an accidental hydrogen leak from a vehicle tank in a confined space. Int. J. Hydrogen Energy 2022, 47, 28710–28720. [Google Scholar] [CrossRef]
  42. Hou, X.; Lan, H.; Zhao, Z.; Li, J.; Hu, C.; Li, Y. Effect of obstacle location on hydrogen dispersion in a hydrogen fuel cell bus with natural and mechanical ventilation. Process Saf. Environ. Prot. 2023, 171, 995–1008. [Google Scholar] [CrossRef]
  43. Hwang, D.J.; Kil, B.L.; Park, S.K.; Kim, M.H. Numerical study on the location of exhaust outlet for effective ventilation in the event of hydrogen gas leakage in a hydrogen tank storeroom. J. Korean Soc. Mar. Eng. 2017, 41, 619–625. [Google Scholar] [CrossRef]
  44. Lee, C.Y.; Cho, D.H. Numerical study on the effect of area changes in air inlets and vent ports on the ventilation of leaking hydrogen. J. Korean Soc. Mar. Environ. Saf. 2022, 28, 385–393. [Google Scholar] [CrossRef]
Figure 1. Overview of the experimental setup (a) Configuration #1 (horizontal layout) (b) Configuration #2 (diagonal layout) (c) Experimental setup. (S1–S7: Hydrogen detecting sensor, L1 and L2: Hydrogen leakage point. and S4 and S6 were located near the ventilation fan and were adjusted according to the configuration for hydrogen concentration monitoring).
Sustainability 17 07070 g001
Figure 2. Experimental procedure.
Sustainability 17 07070 g002
Figure 3. Evaluation of indoor Hydrogen concentration by flow rate without ESV operation (a) Case 1 (b) Case 2 (c) Case 3 (d) Hydrogen concentration at S7 by flow rate without ESV operation.
Sustainability 17 07070 g003aSustainability 17 07070 g003b
Figure 4. Comparison of indoor Hydrogen concentrations with and without ESV operation (a) Case 6 (b) Hydrogen concentration at S7 with ESV operation.
Sustainability 17 07070 g004
Figure 5. Evaluation of indoor Hydrogen concentration with fan operation without ESV operation (a) Case 4 (b) Case 5 (c) Comparison by Case (based on S7).
Sustainability 17 07070 g005
Figure 6. Evaluation of indoor Hydrogen concentration with fan operation (a) Case 7 (b) Case 8 (c) Case 9 (d) Case 10.
Sustainability 17 07070 g006
Figure 7. Variation in Hydrogen concentration with fan ventilation capacity (Sensor S7).
Sustainability 17 07070 g007
Figure 8. Hydrogen concentration changes by fan placement (S6: Sensor for monitoring changed fan position) (a) 37.4 m3/min (b) 95 m3/min.
Sustainability 17 07070 g008
Figure 9. Average Hydrogen concentration and reduction rate according to ESV operation.
Sustainability 17 07070 g009
Figure 10. Average Hydrogen concentration and reduction rate according to fan operation and placement.
Sustainability 17 07070 g010
Figure 11. Internal characteristics by case under side leakage scenario (a) Case 13 (b) Case 14 (c) Case 15.
Sustainability 17 07070 g011
Table 1. Standards for key safety equipment in hydrogen handling facility.
Emergency Shutoff Valve (ESV) Hydrogen DetectionVentilation
ISO 19880-1 [28]MandatoryMandatory (when hydrogen concentration exceeds 1%)
-
Natural or mechanical ventilation required
-
Installation of ceiling ventilation
NFPA 2 [29]MandatoryMandatory (when hydrogen concentration exceeds 1%)
-
Natural or mechanical ventilation required
-
Mechanical ventilation: minimum 0.306 m3/min per 1 m2 of floor area
NFPA 853 [30]MandatoryMandatory (when hydrogen concentration exceeds 1%)
-
Natural or mechanical ventilation required
-
Mechanical ventilation: minimum 0.5 m3/min per 1 m2 of floor area
KGS FU671 [31]MandatoryMandatory (when hydrogen concentration exceeds 1%)
-
Natural or mechanical ventilation required
-
Ventilation openings in at least two directions within 0.3 m of ceiling or upper wall
-
Mechanical ventilation: minimum 0.5 m3/min per 1 m2 of floor area
KOSHA GUIDE P-30-2021 [32]MandatoryMandatory (when hydrogen concentration exceeds 1%)
-
Natural or mechanical ventilation required
-
At least two ventilation openings with sufficient area
Table 2. Types of hydrogen leakage accidents by country.
Leakage TypesAccident Cases by CountryCauses of Leakage
KoreaJapanU.S.
Damage to Equipment and Piping134Design error
Flange, Valve, and Seal Issues1 (33%)14 (74%)6 (46%)Improper Sealing
Human Error and External Influences123Human Error
Sum of accident cases31913
Table 3. Sensor and Leakage Locations.
Sensor and Leakage LocationsInstallation Location (1)
X-AxisY-AxisZ-Axis
#1#2#1#2#1#2
S12 m2 m2 m2 m3 m3 m
S22 m2 m−2 m−2 m3 m3 m
S3−2 m−2 m2 m−2 m3 m3 m
S4−2 m−2 m−2 m−2 m3 m3 m
S5−2 m−2 m−2 m−2 m3 m3 m
S62 m002 m3 m3 m
S700003 m3 m
S8−2 m−2 m001.5 m1.5 m
S92 m2 m001.5 m1.5 m
L100000.1 m0.1 m
L22 m2 m−2 m−2 m0.1 m0.1 m
(1) Sensor and leak positions were set in Cartesian coordinates, with (0, 0, 0) at the floor center. #1 Figure 1a horizontal layout, #2 Figure 1b diagonal layout.
Table 4. Experimental case and conditions.
CaseLPM (Leak Flow Rate)Leak LocationESV
On/Off
Fan Operation
On/OffQuantity (Units)Flow Rate (m3/min)Fan Placement
Case 1100L1OffOff---
Case 2200OffOff---
Case 3300OffOff---
Case 4OffOn147.5-
Case 5OffOn295Horizontal
Case 6OnOff---
Case 7OnOn118.7-
Case 8OnOn147.5-
Case 9OnOn237.4Horizontal
Case 10OnOn295
Case 11OnOn237.4Diagonal
Case 12OnOn295
Case 13L2OnOff- -
Case 14OnOn147.5-
Case 15OnOn295Horizontal
Table 5. Mean hydrogen concentration and standard deviation according to ESV operation.
CaseCase 3Case 6
Mean hydrogen concentration ± Standard deviation4.12 ± 1.110.59 ± 1.20
Table 6. Mean Hydrogen concentration and standard deviation according to fan ventilation capacity.
CaseCase 6Case 7Case 8Case 9Case 10
Mean hydrogen concentration ± Standard deviation0.59 ± 1.200.70 ± 1.130.70 ± 1.100.45 ± 0.770.35 ± 0.81
Disclaimer/Publisher’s Note: The statements, opinions and data contained in all publications are solely those of the individual author(s) and contributor(s) and not of MDPI and/or the editor(s). MDPI and/or the editor(s) disclaim responsibility for any injury to people or property resulting from any ideas, methods, instructions or products referred to in the content.

