Article

Inundation Modeling and Bottleneck Identification of Pipe–River Systems in a Highly Urbanized Area

1
Eco-Environment and Resource Efficiency Research Laboratory, School of Environment and Energy, Peking University Shenzhen Graduate School, Shenzhen 518055, China
2
Power China Eco-Environmental Group Co., Ltd., Shenzhen 518101, China
*
Authors to whom correspondence should be addressed.
Sustainability 2025, 17(15), 7065; https://doi.org/10.3390/su17157065
Submission received: 6 June 2025 / Revised: 1 August 2025 / Accepted: 1 August 2025 / Published: 4 August 2025
(This article belongs to the Section Sustainable Water Management)

Abstract

The compound effects of extreme climate change and intensive urban development have led to more frequent urban inundation, highlighting the urgent need for the fine-scale evaluation of stormwater drainage system performance in high-density urban built-up areas. A typical basin, located in Shenzhen, was selected, and a pipe–river coupled SWMM was developed and calibrated via a genetic algorithm to simulate the storm drainage system. Design storm scenario analyses revealed that regional inundation occurred in the central area of the basin and the enclosed culvert sections of the midstream river, even under a 0.5-year recurrence period, while the downstream open river channels maintained a substantial drainage capacity under a 200-year rainfall event. To systematically identify bottleneck zones, two novel metrics, namely, the node cumulative inundation volume and the conduit cumulative inundation length, were proposed to quantify the local inundation severity and spatial interactions across the drainage network. Two critical bottleneck zones were selected, and strategic improvement via the cross-sectional expansion of pipes and river culverts significantly enhanced the drainage efficiency. This study provides a practical case study and transferable technical framework for integrating hydraulic modeling, spatial analytics, and targeted infrastructure upgrades to enhance the resilience of drainage systems in high-density urban environments, offering an actionable framework for sustainable urban stormwater drainage system management.

1. Introduction

The intertwined challenges of global climate change and rapid urbanization have emerged as significant threats to urban water security [1]. Climate change leads to more frequent and intense rainfall events [2], and the proportion of impermeable underlay surfaces gradually increases during urbanization, which accelerates the runoff process [3]. These two factors synergistically increase the risk of urban flooding and threaten infrastructure functionality and public safety [4]. The flooding issue is especially acute in high-density built-up areas [5] due to the massive impervious surface, coupled with the insufficient drainage capacity. Consequently, flood control in high-density urban built-up areas has garnered significant attention.
The urban stormwater drainage system serves as a cornerstone of flood control engineering infrastructure, playing a pivotal role in mitigating the impacts of excessive rainfall and preventing inundation [6]. Accurately assessing the drainage performance of stormwater drainage systems in high-density built-up areas has thus become an imperative engineering challenge within the realm of urban water security. To address this challenge, a variety of hydrological and hydrodynamic models, including the Storm Water Management Model (SWMM), MIKE Urban, and InfoWorks ICM, have been widely employed to assess the effectiveness of drainage systems [7,8,9]. Among these, the SWMM distinguishes itself through its high computational efficiency and proven reliability in drainage system simulations [9,10]. By incorporating fundamental hydrological principles, including the water balance and Manning equations, the SWMM can accurately describe the rainfall–runoff processes, especially the one-dimensional hydrodynamic process, including pipe and river network convergences [11]. Therefore, the SWMM provides a robust framework for evaluating and optimizing the infrastructure performance under diverse hydrological scenarios, which results in its wide application in urban drainage system design [12], combined sewer overflow control [13], low-impact development [14], and stormwater management [15].
Previous studies on drainage system simulations in high-density urban built-up areas exhibited the following limitations. On the one hand, the underlying surfaces (the various physical cover layers on the Earth’s surface that directly interact with the atmosphere or precipitation) of urban regions exhibit significant spatial heterogeneity. Conventional simulation methodologies often adopt excessive simplifications of the stormwater drainage systems and underlying surfaces, which might lead to inaccuracies in simulating the runoff generation and flow dynamics [16,17]. To accurately characterize the spatial heterogeneity of the hydrological characteristics across underlying surfaces, the finer subdivision of urban drainage sub-catchments is required, and concurrently, optimization algorithms such as genetic algorithms and particle swarm optimization can be employed to address the challenges in quantifying model parameters [18,19]. On the other hand, the coupling of urban rivers with stormwater pipe networks was often overlooked in previous studies [20,21,22]. The hydraulic connectivity of rivers and stormwater pipe networks plays a critical role in maintaining the overall drainage capacity during intense rainfall events [23]. Meanwhile, the backwater effect occurs when the water level of a river boundary exceeds that of the drainage outlets, which might impede the normal discharge of stormwater from pipe networks [23]. Hence, a coupled consideration of river and pipe network hydraulics is essential for evaluating the urban drainage system performance. Multiple modeling methods for river–pipe coupling analysis have been established: the integrated SWMM-TUFLOW model [24], SWMM-TELEMAC-2D model [25], etc., [21,26,27,28,29]. In high-density built-up areas, the artificially modified rivers, generally with narrow widths and regular cross-sections, can be reasonably simplified as conduits during hydraulic simulation [30,31]. Therefore, the implementation of a coupled hydrodynamic simulation of rivers and pipes can be directly achieved via the SWMM to eliminate the complexity of multi-model coupling and enable the simultaneous calibration of parameters for pipes and a simplified river.
Sustainable stormwater management is centered on intergenerational equity, emphasizing meeting current urban flood control needs while avoiding overconsumption of resources (e.g., funds, land) that would compromise the development space for future generations [32,33]. Precise identification of bottleneck zones in urban drainage systems enables targeted pipe network and drainage infrastructure improvements under resource and economic constraints, while systematically mitigating urban flood risks, extending the service life of existing facilities, and ultimately, strengthening the climate resilience and sustainability of drainage systems [34]. Tang et al. [35] defined the full-flow pipes during the rainfall process as the bottlenecks and enlarged the diameter of the full-flow pipes to improve the drainage capacity. However, stormwater pipes were typically designed based on full-flow conditions, which means that the stormwater pipes within the full-flow state were acceptable if no continuous water accumulation occurred. Liao et al. [36] and Wei et al. [37] regarded the pipes connected to overflow nodes with the longest overflow time as the bottleneck zones. In these cases, only the overflow conditions of the individual nodes in isolation were considered [22,38,39], where the maximum inundation depth or volume of single nodes was primarily selected for the bottleneck identification [40,41]. Although point-based metrics could identify localized flooding hotspots, they were insufficient to delineate the spatial extent of critical inundation zones. Urban flooding exhibits an inherent spatial interdependence, where a blockage or capacity deficit at a single node would propagate upstream via backwater effects and trigger cascading inundation across adjacent nodes, forming contiguous flooded zones. Hence, more robust indicators are needed to identify the most vulnerable regions (as opposed to isolated points) requiring priority intervention.
To address the above issues, this study selected a typical area in Shenzhen, a highly urbanized metropolis in China, to conduct a fine-scale evaluation of its stormwater drainage system and identify the bottleneck zones via spatial analysis methods. The primary objectives of this study were to (1) construct a pipe–river coupled SWMM, with the consideration of the spatial heterogeneity of rainfall and the underlying surface, and calibrate the model parameters with a sensitivity analysis and genetic algorithm; (2) systematically evaluate the drainage performance of the typical area under different designed storm recurrence periods and explore the backwater effect with the calibrated model; and (3) quantitatively identify the bottleneck zones of the stormwater drainage system via two novel indicators and propose targeted and practical suggestions for the improvement of the bottlenecks. This study’s results will establish a robust methodological framework for stormwater drainage system evaluation and bottleneck zone identification, providing a methodological basis for sustainable urban stormwater upgrades in high-density urban built-up areas.

2. Data and Methods

2.1. Overview of Study Area

The Mugu River Basin, with a total area of 6.38 km2, is in Pinghu Street, Longgang District, which is a typical urbanized region of Shenzhen City in China, with a high building density. The namesake Mugu River, the basin’s principal watercourse, derives its flow primarily from direct precipitation, supplemented by the effluent discharged from a downstream wastewater treatment plant. As illustrated in Figure 1, there are two critical water recharge points at the upstream and mid-downstream of the Mugu River, with average daily recharge volumes of 10,000 and 15,000 m3, respectively. The drainage system within the basin has been fundamentally separated into distinct channels for stormwater and sewage.

2.2. Data Collection

This study’s required data encompassed multi-source geospatial and hydrological information critical for urban drainage modeling, specifically (1) geometric and hydraulic parameters of the stormwater drainage pipe networks (e.g., the diameters, lengths, and slopes of pipes and the elevations and coordinates of manholes); (2) hydrological and morphological characteristics of the Mugu River (e.g., channel cross-sections and lengths); (3) a 7.5 m resolution digital elevation model (DEM) to characterize the surface topography; (4) high-resolution remote sensing imagery (1.0 m pixel size) for land-use classification; (5) short-term precipitation (from Apr. to Aug. 2024) recorded by three rain-gauge stations adjacent to the basin, which provided 5.0 min interval rainfall intensity data; and (6) liquid-level measurements within about 1.0 min intervals, as recorded by ultrasonic devices or radar detectors installed at key drainage nodes to validate the model outputs. Detailed metadata for each dataset, including the acquisition methods and spatial/temporal resolutions, are systematically summarized in Table S1.

2.3. SWMM Construction

Drainage system simplification: To balance the model complexity and computational efficiency, the stormwater drainage system was suitably simplified. The branch pipes with diameters less than 300 mm were omitted and the pipes with lengths less than 5.0 m were combined with an adjacent pipe. Concurrently, the Mugu River was discretized into 39 consecutive irregular segments (see Figures S1 and S2 for the representative cross-sectional geometries). Eventually, 2015 conduits (which contained stormwater pipe networks and rivers) and 2050 nodes were obtained (Figure S3).
Sub-catchment partitioning: The initial boundaries of the sub-catchment were generated through the Thiessen polygon method based on the node locations. Then, the boundaries were further manually refined by integrating the high-resolution building profile and DEM-derived topographic gradients to align with the actual flow pathways and eliminate hydrologically implausible polygons. The final sub-catchments, with catchment areas that ranged from 0.026 to 6.6 ha, were yielded (Figure S3).
Model integration: The geospatial attributes of conduits, nodes, and sub-catchments were extracted from the geodatabase into structured data, which was further converted into SWMM-compatible input files using custom Python scripts. The SWMM construction process is summarized in Figure S4.
Initial conditions: To simulate the realistic base flow of the Mugu River, constant inflow rates were set at two critical recharge nodes (WR1 and WR2) (Figure 1), with assigned inflow rates of 0.1157 and 0.1736 m3/s, respectively. A hot-start initialization protocol was employed, wherein a 24 h pre-simulation run was conducted to ensure the river flow reached hydraulic equilibrium prior to the dynamic rainfall event simulations.
Input conditions: Real-time rainfall data, derived from three rain gauge stations (RG-7, RG-13, and RG-29) adjacent to the Mugu River Basin, were integrated (Figure S5) to characterize the precipitation’s spatial heterogeneity. The sub-catchment rainfall assignments followed a nearest-distance principle, whereby each sub-catchment’s precipitation was given by the closest rain gauge station.

2.4. SWMM Parameter Calibration and Verification

Parameter sensitivity analysis: The Morris screening method was employed to conduct a sensitivity analysis of the SWMM parameters. Eleven uncertain hydrological and hydraulic parameters in the SWMM framework (Table 1) were selected, with the initial value ranges derived from the peer-reviewed literature and regional best practices. The sensitivity (S) of each parameter was characterized by calculating the impacts of different parameter variations on the maximum and average flow rates at the downstream outlet of the Mugu River during the rainfall event observed on 12 May 2024 (R20240512). The formulas for computing the sensitivity indicator are as follows:
S k ( i ) =   y p 1 , p 2 , , p k + , , p n y p 1 , p 2 , , p k , , p n ,
S k = i = 0 m S k ( i ) m
where p k is the initial value of the k-th SWMM parameter; denotes the variation in the parameter; y() refers to the maximum or average flow rate; S k ( i ) represents the influence value with a single variation in p k ; and S k means the sensitivity indicator of p k , which could be obtained by calculating the average of S k ( i ) under various parameter variations.
Model parameter calibration: Ten historical rainfall events, with a dry time of more than 24 h to ensure the negligible influence of previous rainfall, and the corresponding monitoring liquid-level sequences were recorded. The characteristics of the rainfall events are given in Table S2.
A genetic algorithm (GA), a metaheuristic optimization technique widely used in hydrological modeling for its global search capabilities [42,43], was employed for the parameter calibration. The calibration workflow integrated the observed liquid-level data with the model simulation results through a fitness function designed to minimize the discrepancies between the measured and predicted hydraulic responses (Figure S6). The fitness metric, which was modified from the Nash–Sutcliffe efficiency (NSE) coefficient [44], was defined as:
f i t n e s s =   m a x ( 0.1 ,   i = 0 k j = 0 m ( 1 t = 1 T ( D o b s , t , j , i D p r e d , t , j , i ) 2 t = 1 T ( D o b s , t , j , i D ¯ o b s , j , i ) 2 ) ) ,
where k is the number of rainfall events; m denotes the number of monitoring nodes; T is the total time steps per event; D o b s , t , j , i and D p r e d , t , j , i represent the observed and simulated liquid levels (m) at time t for node j during event i; and D ¯ o b s , j , i means the event-specific mean observed liquid level (m). The threshold value of 0.1 prevents negative fitness scores, ensuring numerical stability in the optimization process.
The calibration pipeline was automated using Python 3.8, with the SWMM simulations executed via the PySWMM package [45] to enable data exchange between the GA and the SWMM. The key parameters of the GA were set as follows: the number of iterations (M), 200; the mutation probability (Pm), 0.05; the population size (POPsize), 200; and the crossover probability (Pc), 0.7. The technical specifications of the implementation were documented in the project repository (URL: https://github.com/CHENJie666666/SWMM_Parameters_Calibration/tree/master (accessed on 28 June 2025)).
Model verification: The calibrated SWMM’s performance was evaluated by comparing the simulated liquid levels against the observed data from two additional rainfall events (Table S2). Three metrics were employed for the quantitative model evaluation: RMSE, NSE, and peak error. These indicators collectively provided a comprehensive assessment of the model’s accuracy in capturing the magnitude and temporal dynamics of the liquid-level fluctuations. The mathematical formulations for these metrics are as follows:
R M S E = 1 m t = 1 m ( y p r e d , t y r e a l , t ) 2 ,
N S E = 1 t = 1 m ( y p r e d , t y r e a l , t ) 2 t = 1 m ( y r e a l , t y ¯ r e a l ) 2
P e a k E r r o r = y r e a l , m a x y p r e d , m a x y r e a l , m a x × 100 %
where m represents the number of monitoring points; yreal,t and ypred,t denote the observed and simulated manhole liquid levels (m) at time step t, respectively; y ¯ r e a l is the mean value of the observed liquid levels across all the monitoring points; and yreal,max and ypred,max signify the maximum observed and simulated liquid levels, respectively.

2.5. Design Rainfall

The rainfall was designed using the storm intensity formula specific to Shenzhen City (Equation (7)). To characterize the temporal distribution of rainfall, the Chicago rainfall pattern distribution was applied (Equation (8)):
i = A ( 1 + C l g P ) ( t + B ) n = 8.701 ( 1 + 0.594 l g P ) ( t + 11.13 ) 0.555
i t = A ( 1 + C l g P ) ( t p t r 1 n + B ) ( t p t r + B ) 1 + n         w h e r e   0 < t < t p A ( 1 + C l g P ) ( t t p 1 r 1 n + B ) ( t t p 1 r + B ) 1 + n         w h e r e   t p < t < t d
where it represents the rainstorm intensity at time t (mm/min); P is the rainstorm recurrence period in years (a); tp denotes the time when the rainfall peak occurs (min); td is the total rainfall duration (min); and r represents the rainfall peak position coefficient. In this study, the rainfall peak position coefficient r was set to 0.35. The rainfall duration was set to 2 h following previous studies [20] to simulate the frequent short-duration heavy rains that occurred in Shenzhen [40,46], and the simulation duration was extended to 6 h. The details of the design rainfall events are shown in Figure S7.

2.6. Bottleneck Zone Identification

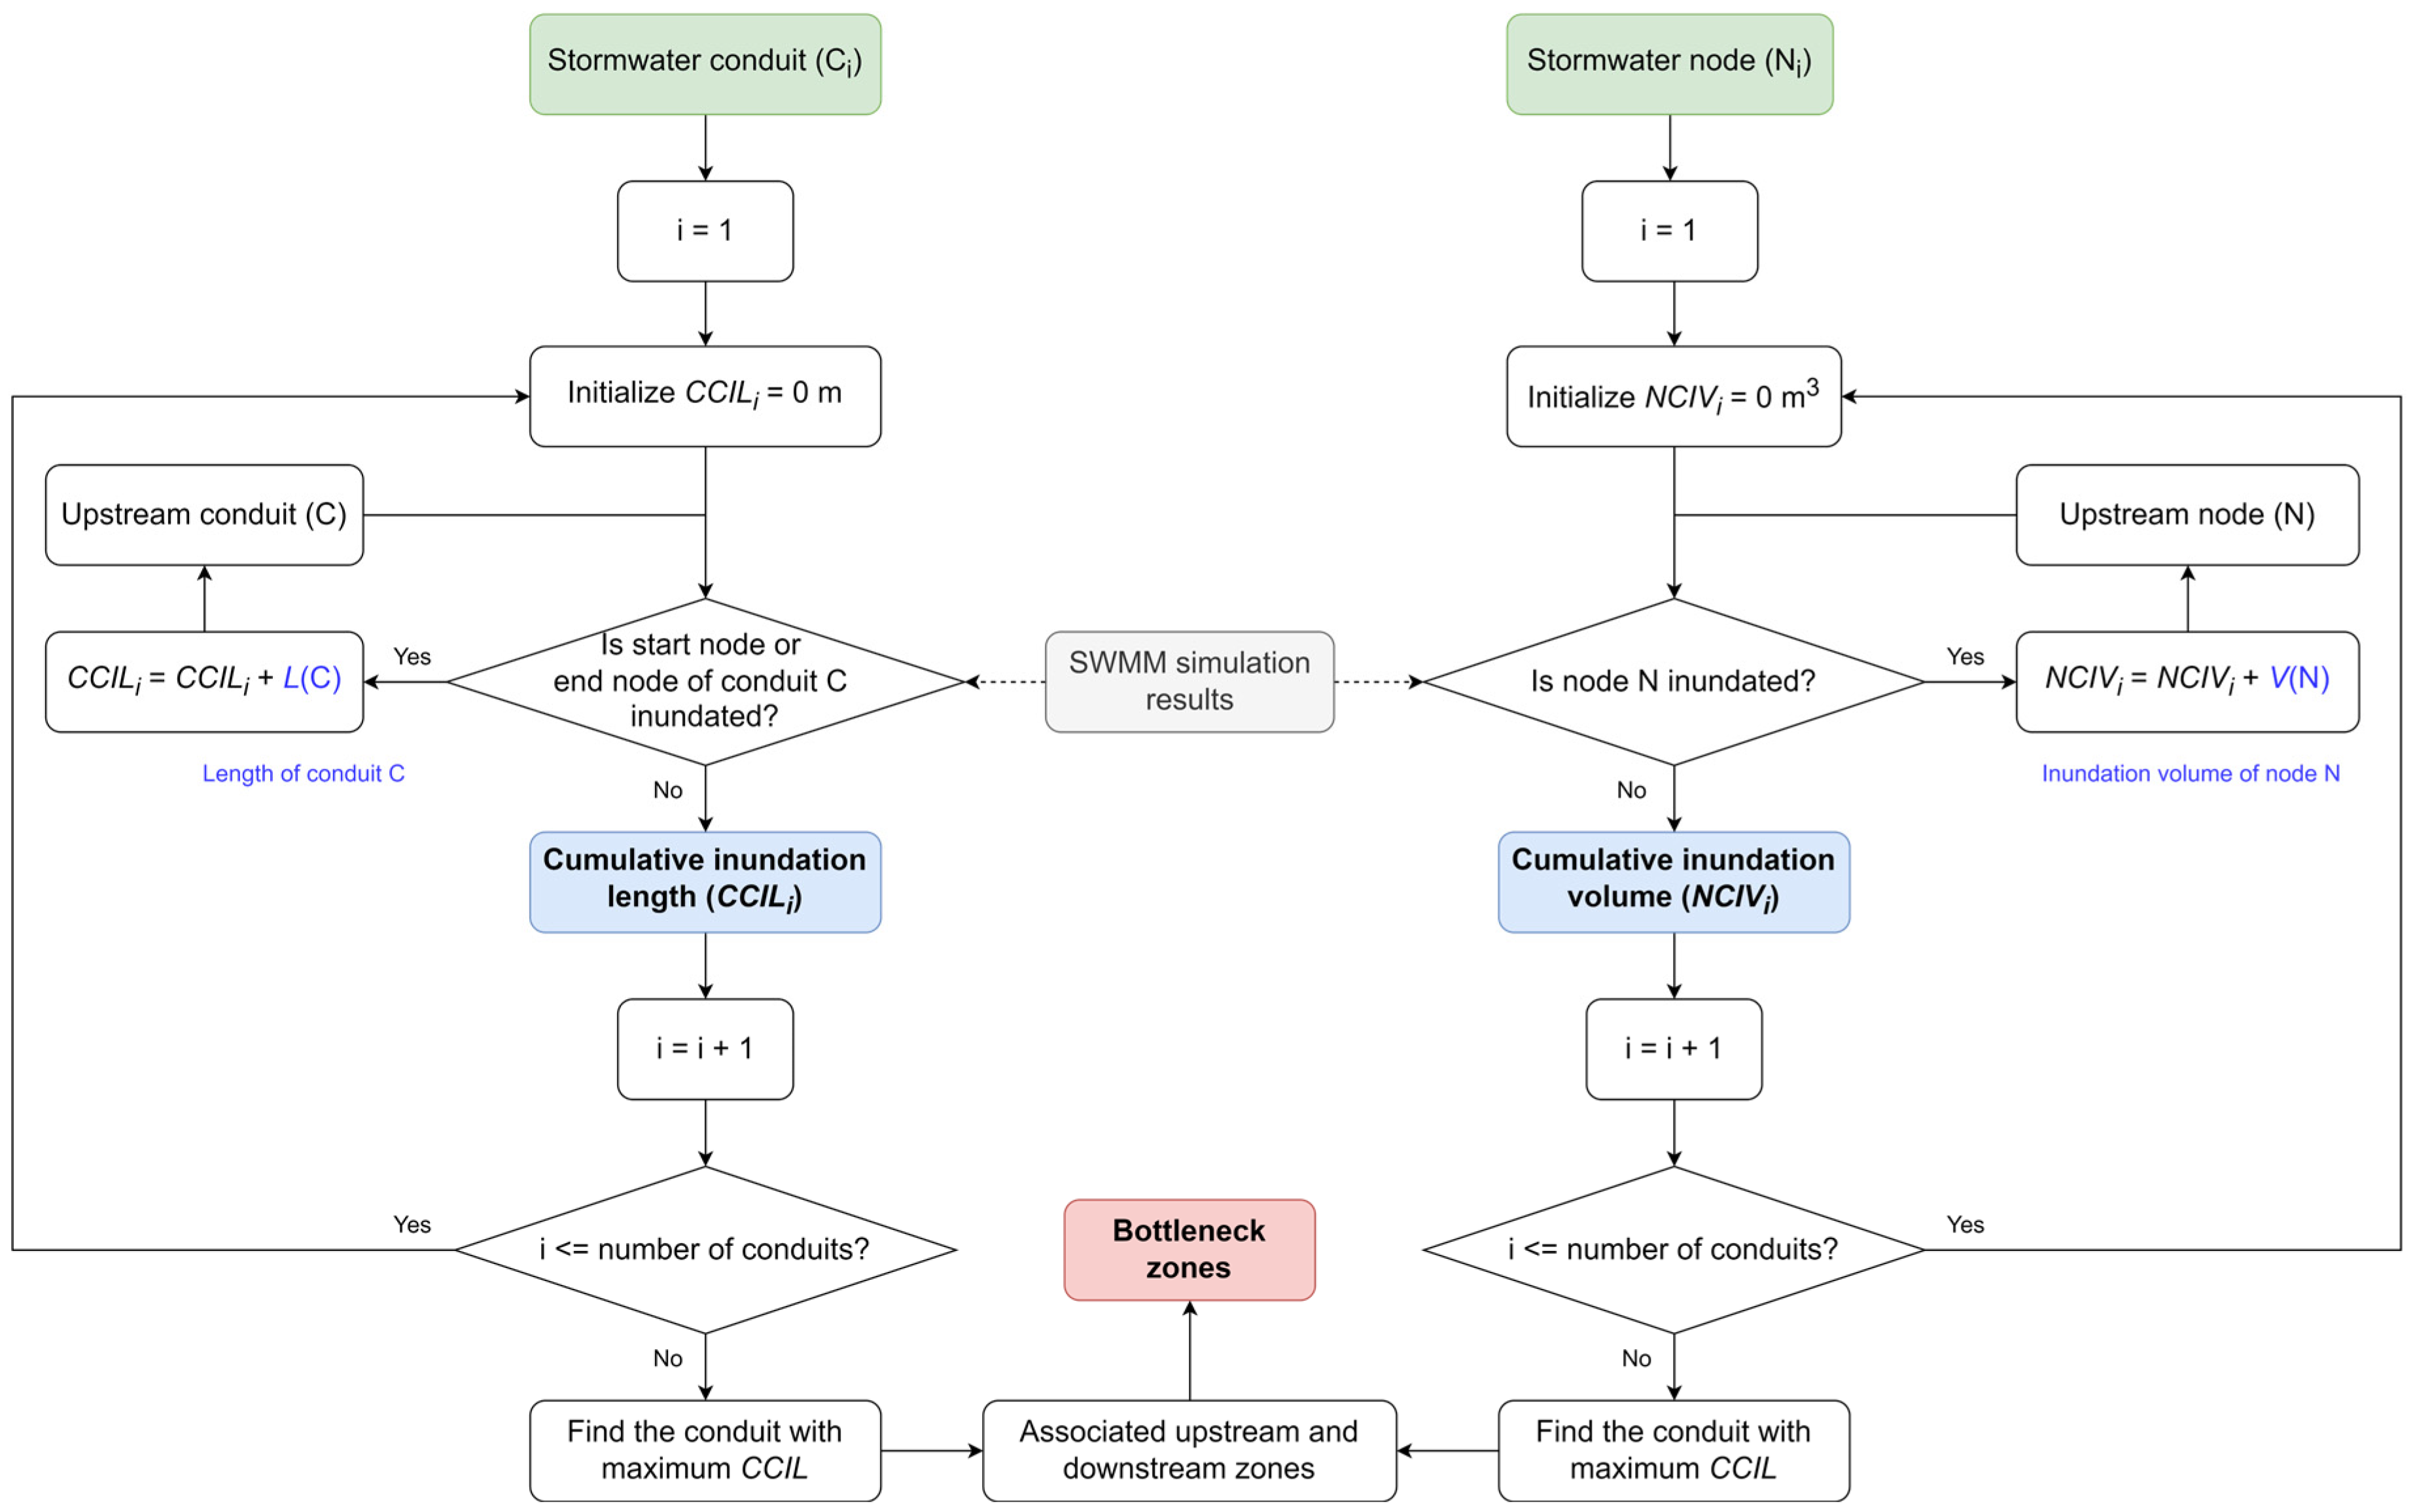
In this study, two indicators were selected to quantitatively characterize the water accumulation severity in the drainage system: node cumulative inundation volume (NCIV) and conduit cumulative inundation length (CCIL). Specifically, the node cumulative inundation volume was defined as the sum of the inundation volume at a given node and all its continuous upstream inundated nodes, and the conduit cumulative inundation length was defined as the total length of the given conduit and all its continuous upstream inundated conduits. It is important to note that the inundated conduits referred to the conduits with water accumulation at the upstream node. The detailed calculation procedures for both indicators are illustrated in Figure 2. These metrics incorporated the intensity of water accumulation at individual nodes and the spatial interactions between inundated nodes across the network. Furthermore, the nodes/conduits with the maximum values of these indicators and their associated upstream and downstream areas were subsequently designated as the primary bottleneck zones of the drainage system, which reflected their critical role in systemic hydraulic inefficiency.

3. Results

3.1. Morris Sensitivity Analysis and Parameter Calibration Using GA

The results of the sensitivity analysis via the Morris screening method are presented in Figure S8. Among all the parameters, N-Imperv exhibited a substantially higher sensitivity, where it exerted a significant influence on the simulation results of the maximum flow rate. Additionally, the Manning roughness coefficient of the pipes and rivers also had a notable impact on the maximum flow rate. In terms of the average flow rate simulation, the Manning roughness coefficients demonstrated considerable sensitivity. These findings were highly consistent with the study by Zhong et al. [47], where the Manning roughness coefficients significantly affected the maximum and average flow rates, while N-Imperv had a more pronounced impact on the maximum flow rate rather than the average flow rate. Notably, the maximum and average flow rates were critical to the accuracy of the drainage system simulations. Hence, these two parameters (N-Imperv and Manning roughness coefficients) were regarded as two of the most important parameters that affected the model accuracy.
The genetic algorithm was implemented to automate the SWMM parameter calibration and obtain more precise parameter values relative to previous studies [14,19,48]. Figure S9 shows that the GA evolutionary dynamics demonstrated a characteristic trajectory of adaptive improvement through successive generations. Within the first ten epochs, the average population fitness exhibited a rapid ascent from 2.6 to 6.8, which reflected the algorithm’s effective exploration of the solution space during the early evolutionary stages [49]. The steep increase could be attributed to the strong selective pressure and high genetic diversity present in the initial population, which facilitated rapid convergence toward promising solution regions. Subsequently, after the initial growth phase, the average fitness entered a period of moderate fluctuation, where it oscillated gently around 7.0. Concurrently, the maximum fitness metric continued its gradual progression, climbing from an initial plateau of 7.0 to a peak of 8.0 after 100 iteration epochs. The sustained increase in the upper fitness bound indicated that although the population had achieved a high level of convergence, the GA retained sufficient exploratory capacity to continue optimizing the solution landscape, and thus, avoided premature convergence to suboptimal solutions. The best-performing individual from the final generation was selected as the parameter set for the SWMM. Table 1 presents the detailed values of these optimized parameters.

3.2. SWMM Verification

In this study, two typical rainfall events (R20240512 and R20240520) were employed to validate the SWMM, with a particular focus on assessing the simulation accuracy of the liquid-level dynamic process at the nodes (MP1–MP4), as defined in Figure 1. Through model calculations, the simulated liquid-level sequences of node MP4 were obtained and compared with the monitoring data (Figure 3).
The quantitative accuracy assessment results indicate that the RMSEs between the simulated liquid-level values and the monitored values were 0.0139 and 0.1253 at point MP4 during the R20240512 and R20240520 events, respectively. The relatively low error level demonstrates that the model could maintain a stable simulation performance under different rainfall scenarios. The NSE, a crucial indicator for measuring the consistency between simulation results and measured data, reached 0.876 and 0.826 for the two rainfall events, respectively, which further validates the high consistency between the model simulation results and the actual drainage processes. Notably, the model demonstrated excellent capabilities in terms of capturing the peak response of the drainage system, with peak errors of 2.7% and 6.6% for the two rainfall events. Additionally, across other monitoring points during the R20240512 and R20240520 events, the NSE, RMSE, and peak error percentages ranged from 0.52 to 0.80, 0.0171 to 0.3649, and −13.2% to 7.6%, respectively (Figure S10). It should be noted that the simulation performances at points MP1 and MP2 were not evaluated for the R20240512 event, as no rainfall input was recorded at these locations. Considering all the accuracy indicators comprehensively, the SWMM exhibited good applicability and reliability when simulating the stormwater drainage system of the Mugu River Basin.

3.3. Evaluation of the Drainage System Performance in the Mugu River Basin

3.3.1. The Drainage Performance of the Stormwater Pipe Network

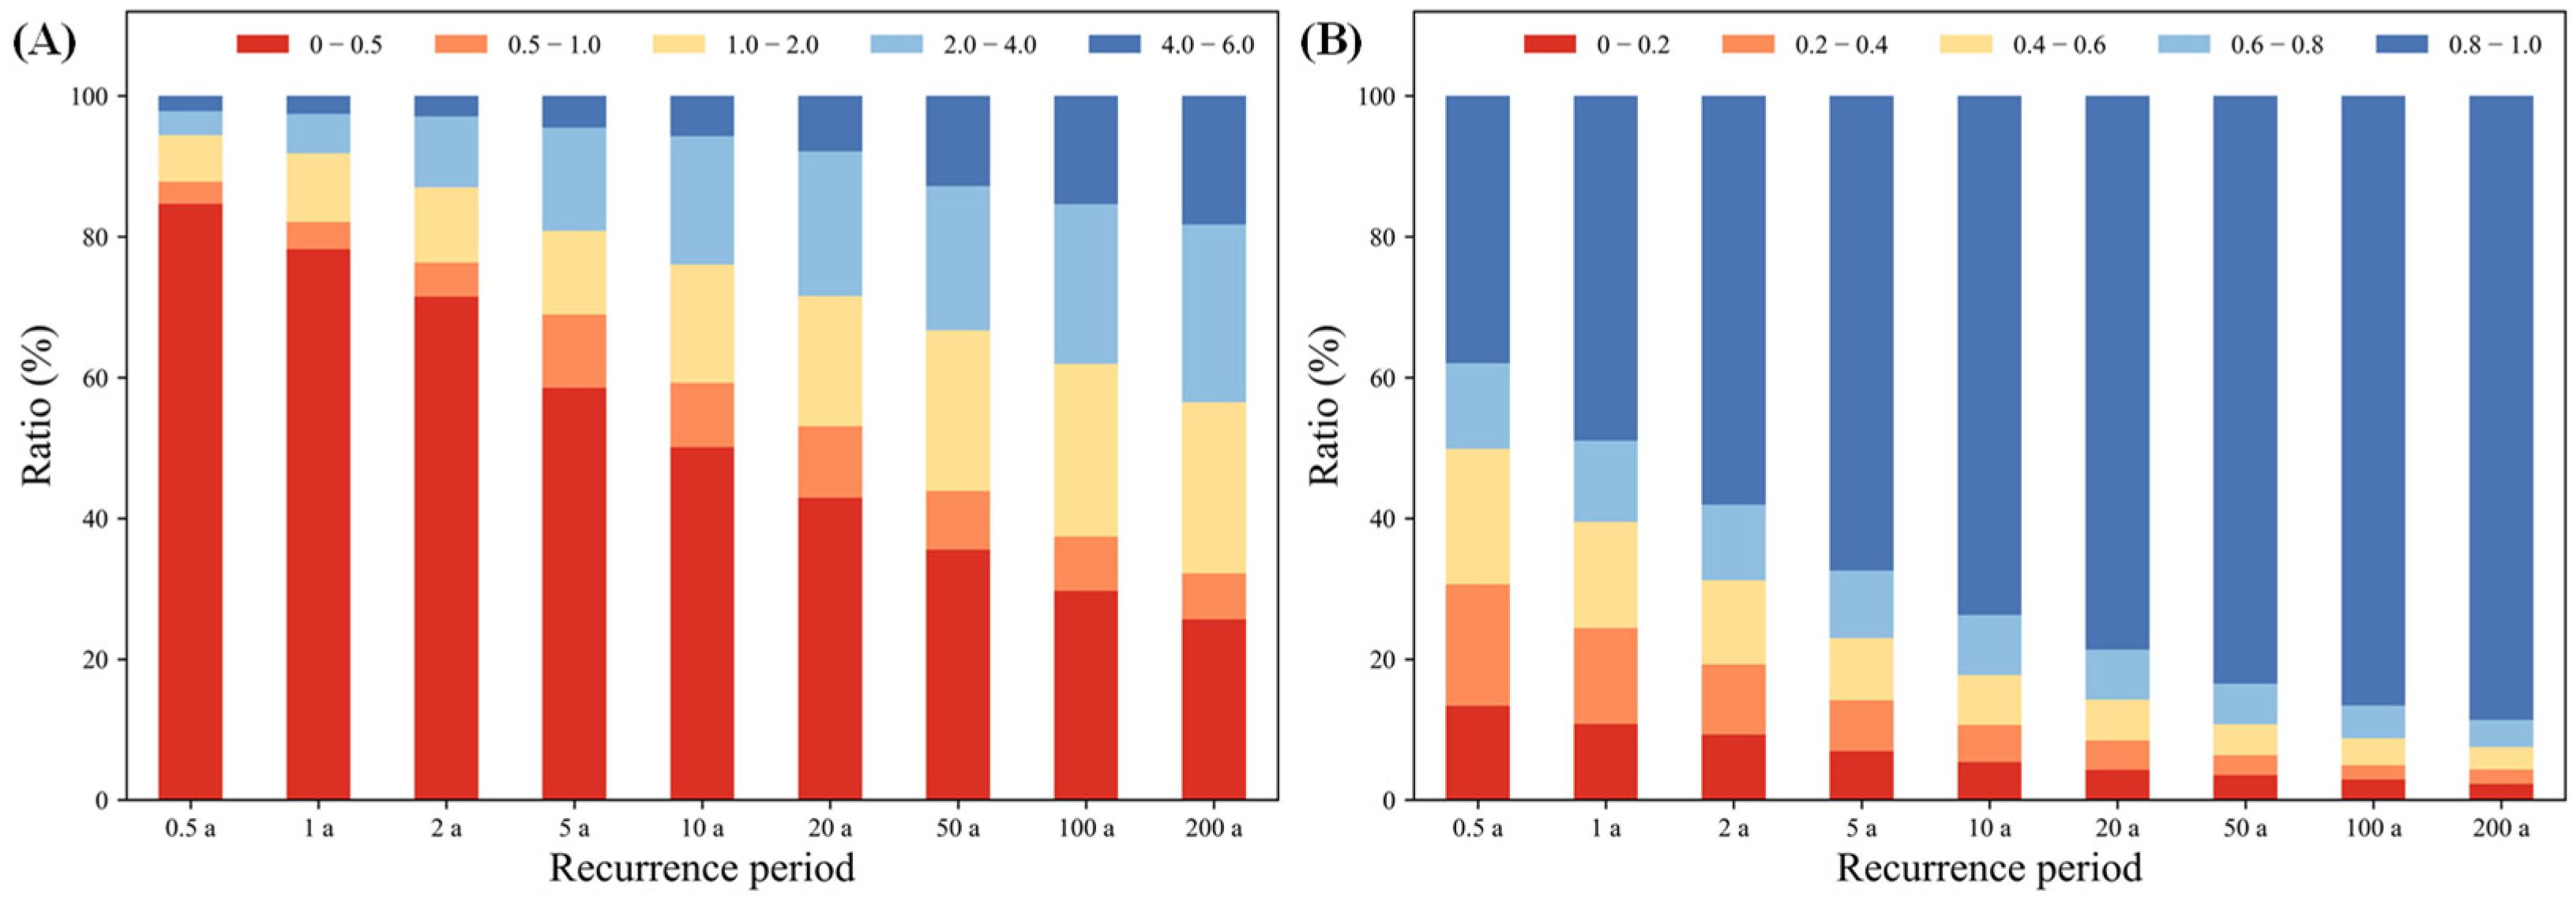
To systematically assess the hydraulic performance of the urban drainage system under varying pluvial flood risks, the validated SWMM was employed to simulate the hydrological responses under distinct design rainfall scenarios. These scenarios were designed with a consistent 120 min rainfall duration but distinct recurrence periods: 0.5, 1, 2, 5, 10, 20, 50, 100, and 200 years, respectively. Two critical metrics were extracted from the simulation results, including the inundation duration of the nodes and the maximum flow-depth-to-diameter ratio of the conduits. The inundation duration reflects the surface flooding persistence and the flow-depth-to-diameter ratio serves as an indicator of the conduit loading, with values approaching 1.0 signifying near-full or surcharged flow conditions.
As illustrated in Figure 4A, the percentage of nodes that experienced inundation that exceeded 30 min exhibited a pronounced increase with the escalating recurrence period. Under the 0.5-year recurrence period, approximately 15.3% of nodes were flooded for over half an hour, indicating localized drainage inefficiencies. The proportion of flooded nodes (logging over half an hour) was elevated to 49.8% under the 10-year recurrence period and rapidly increased to 74.4% under the 200-year recurrence period. The conduit performance metrics (Figure 4B) showed the same trend, where the fraction of conduits operated at near-full capacity (flow-depth-to-diameter ratio ≥ 0.8) escalated from 37.9% under the 0.5-year recurrence period to 88.6% under the 200-year recurrence period. The rise in the inundated node proportion and conduit surcharge ratio across scenarios underscored the vulnerability of the stormwater pipe network to intensifying rainfall.
The distributions of the inundated nodes and overloaded conduits are drawn in Figures S11 and S12, respectively. It was obvious that the inundated nodes were mainly concentrated in the center area of the Mugu River Basin under the 0.5-year recurrence period and the conduits connected to these nodes were basically overloaded. With the elevation in the recurrence period, the inundated nodes gradually spread to adjacent areas, highlighting a transition from isolated bottlenecks to widespread hydraulic overload.

3.3.2. The Drainage Performance of the Mugu River Channels

As a vital hydraulic corridor for stormwater conveyance, river channels play an indispensable role in urban flood mitigation infrastructure. As shown in Figure 1, the upper and middle reaches of the Mugu River are primarily composed of underground culvert structures traversing the urban area, while its mid-lower reaches consist mainly of open river channels. To systematically evaluate the drainage capacity of the Mugu River, a detailed analysis of the channel water levels was conducted under varying rainfall recurrence periods (0.5–200 years).
Figure S13 depicts the progressive hydraulic response of the Mugu River to escalating storm severities across the recurrence periods. Under the 0.5-year recurrence period, enclosed culvert sections in the midstream immediately exhibited full-flow conditions, indicating that these conduit segments operated at their hydraulic design limits even under moderate rainfall. As the recurrence period increased to 5, 50, and 200 years, the hydraulic surcharge progressively propagated upstream, reflecting a systematic capacity deficit in the culverted reaches. Moreover, the enclosed culvert sections in the southern tributary of the Mugu River were overloaded during storms that exceeded 10-year recurrence periods. In contrast, the open river channels in the mid-downstream of the Mugu River demonstrated robust hydraulic performance across all the scenarios. Even under the 200-year rainfall event, over 40% of the drainage capacity was retained in these open river channels.

3.4. Identification and Improvement of the Bottleneck Zones of the Drainage System

3.4.1. Bottleneck Zone Identification

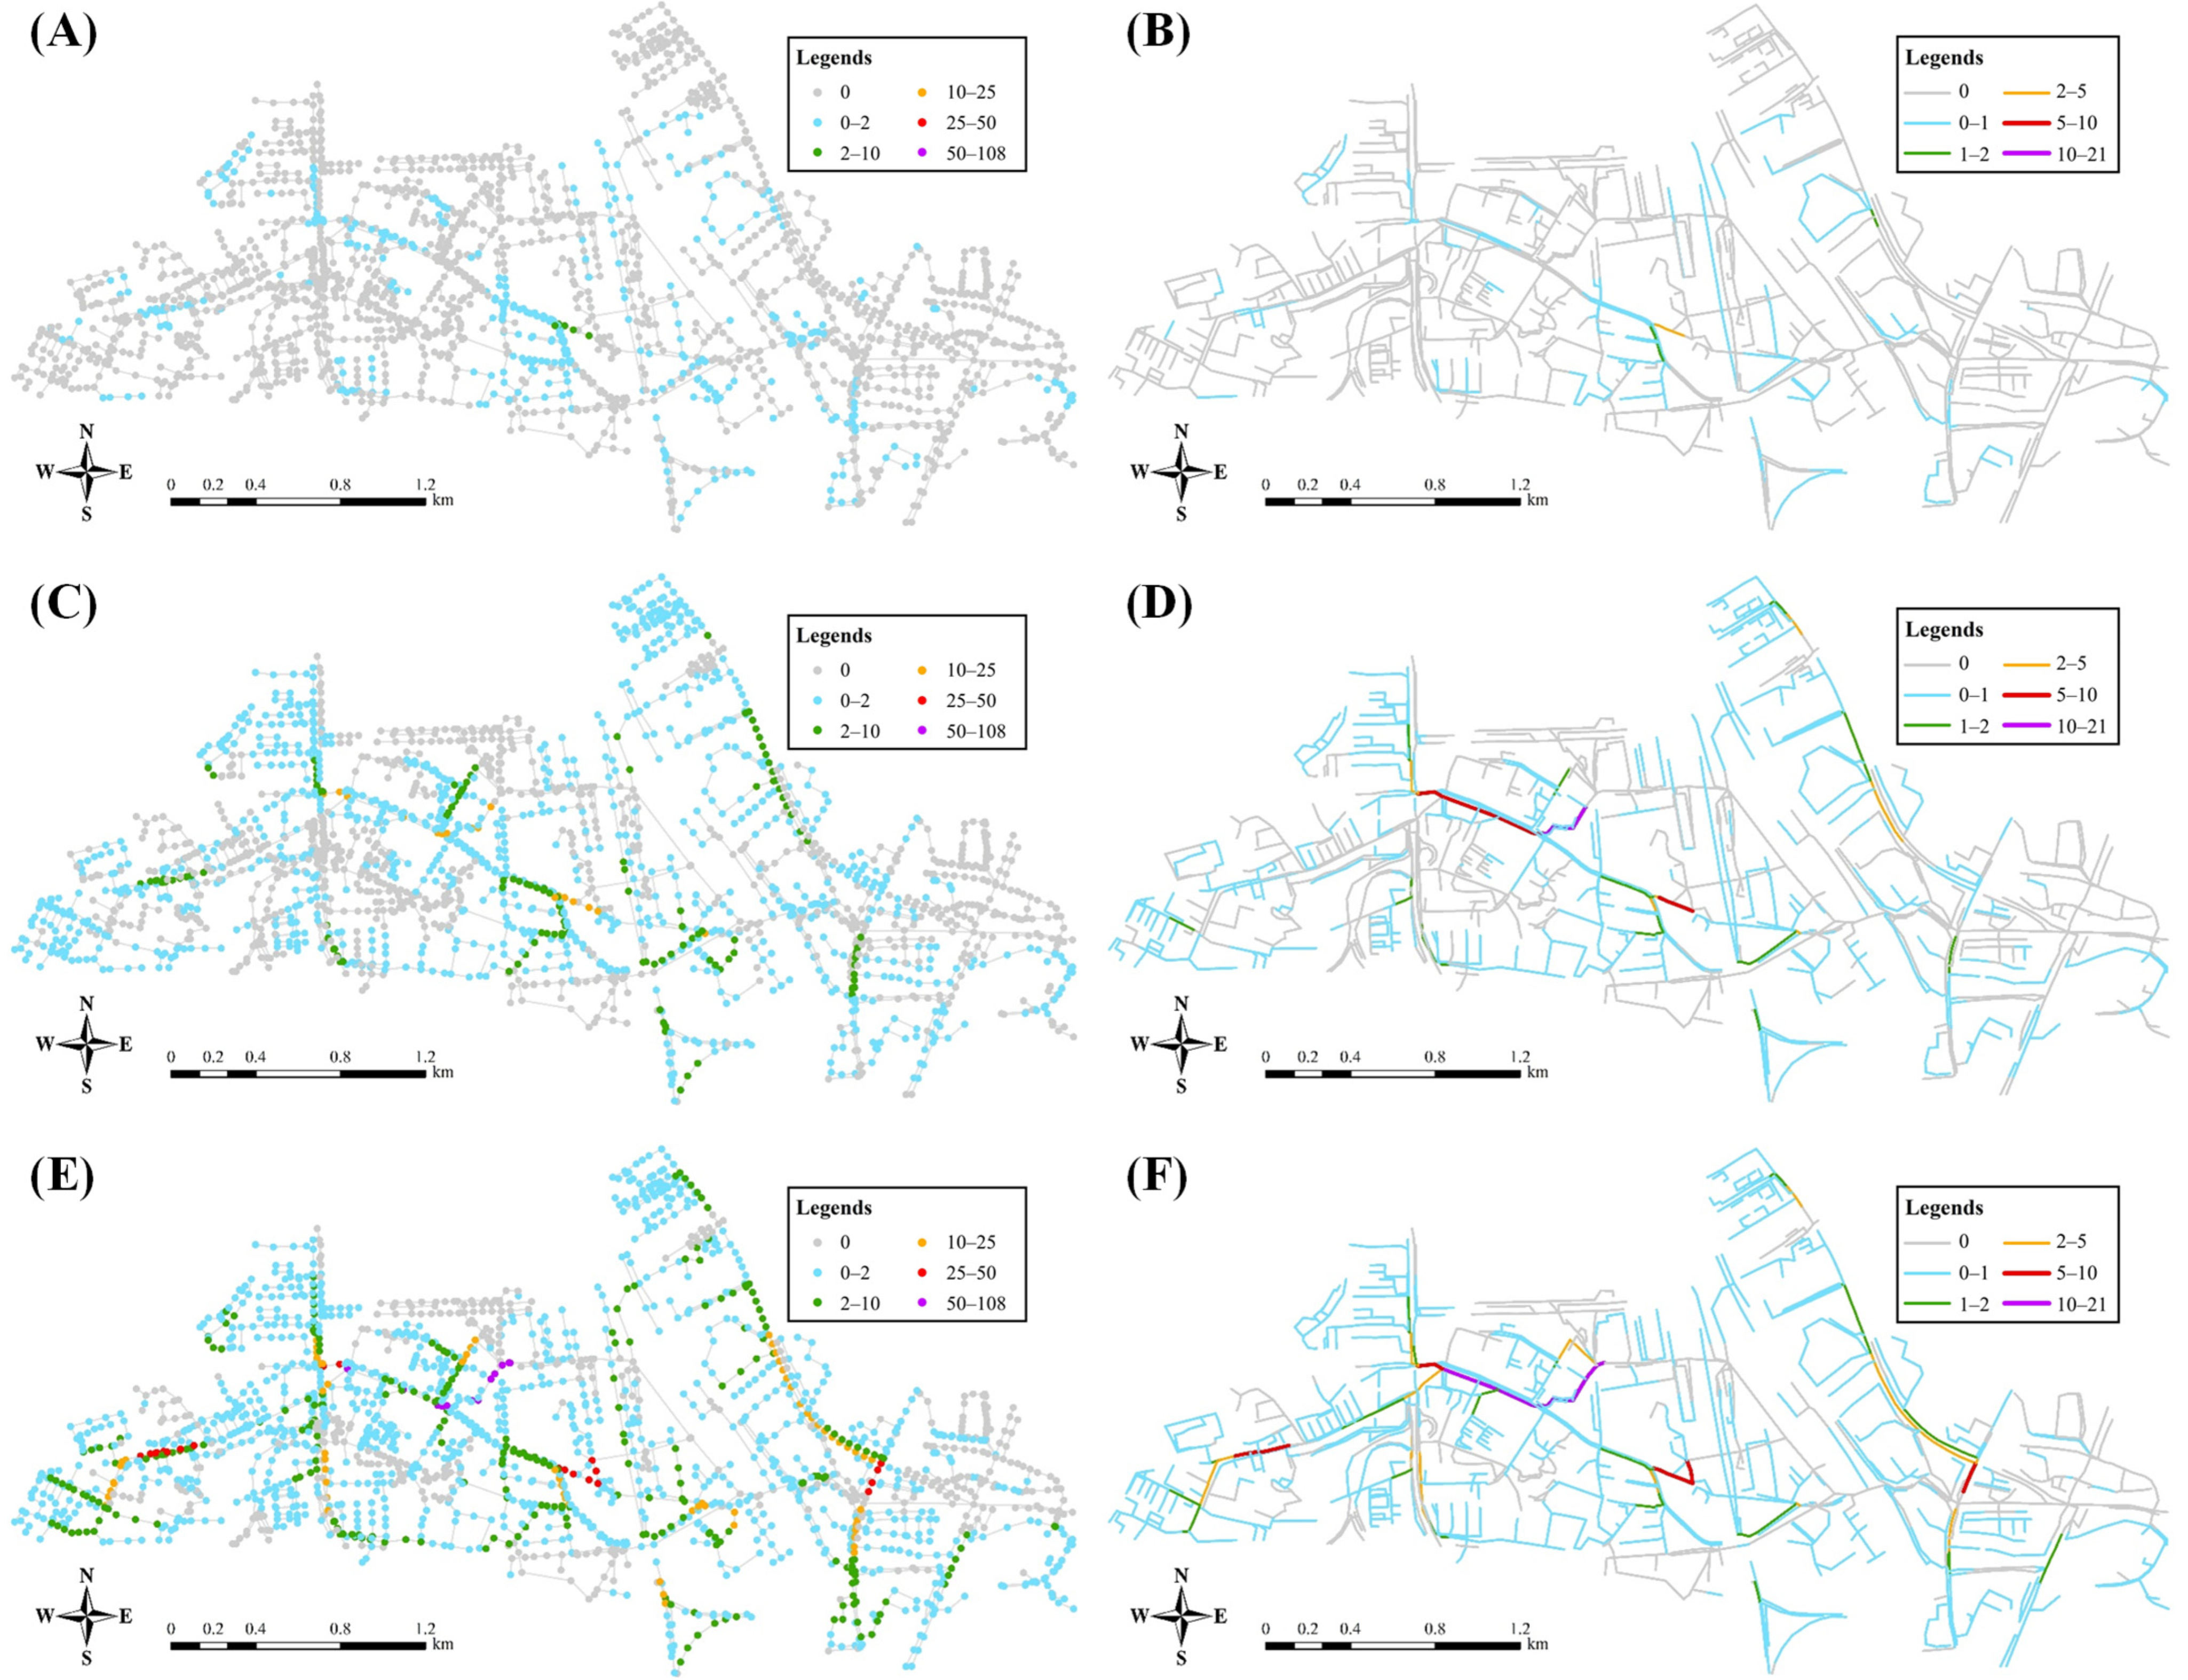
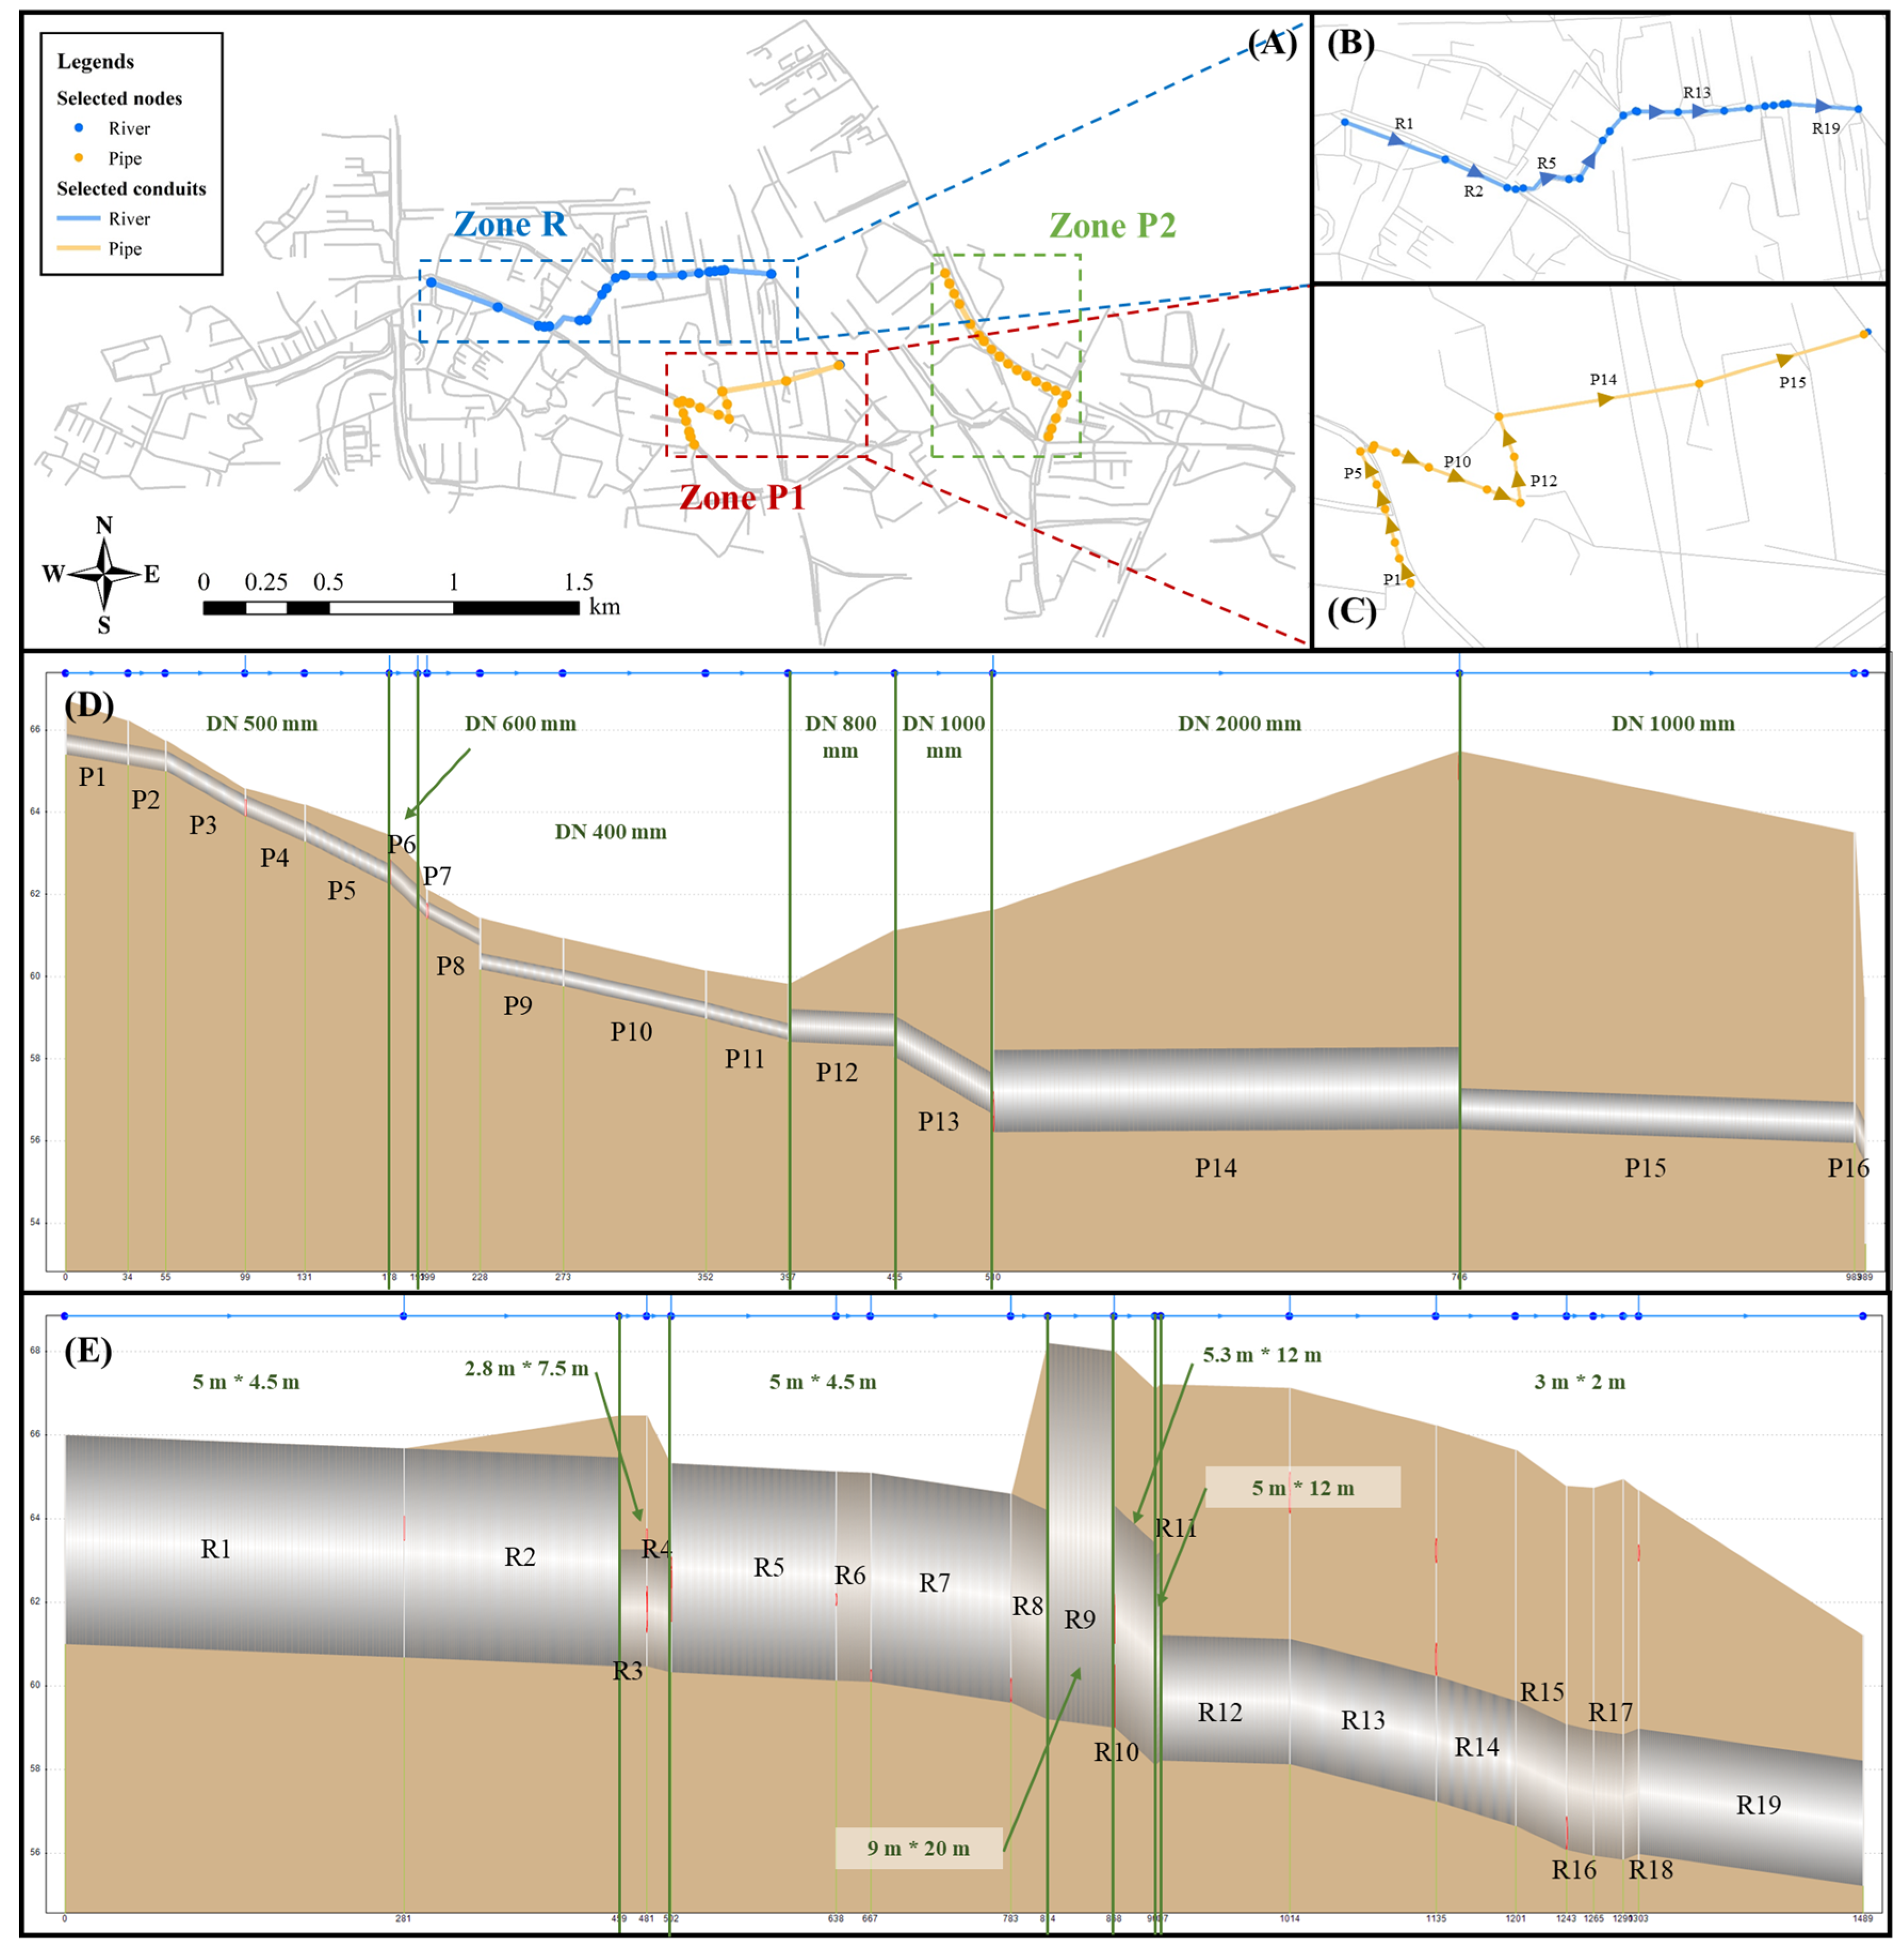
Two indicators, namely, the NCIV and CCIL, were selected to quantitatively identify the bottleneck zones of the Mugu River Basin, as Section 2.6 describes. Figure 5 shows that under the 0.5-year rainfall recurrence period, the nodes in zone P1 (framed in Figure 6A with red lines) exhibited a relatively large NCIV of approximately 4.65 × 10³ m3, and the CCIL of the corresponding conduits reached almost 3.2 km, which indicates a dense distribution of water accumulation areas and severe inundation in zone P1. As the recurrence period escalated to 10 years, zone P1 retained the highest NCIV (16.6 × 10³ m3) and CCIL (over 5.1 km). Concurrently, zone P2 (framed in Figure 6A with green lines) experienced extensive continuous inundation, where the NCIV and CCIL reached 9.5 × 10³ m3 and 6.7 km, respectively. Notably, the river in zone R (framed in Figure 6A with blue lines) underwent severe inundation during the 10-year rainfall event, where the NCIV surged to 23.1 × 10³ m3 and the CCIL escalated to 10.5 km. The water accumulation in the river channel was further intensified under the 200-year scenario, where the NCIV and CCIL increased to 108 × 103 m3 and 20.8 km, respectively. Based on the ranking results of the two indicators, zones P1 and P2 were identified as the primary bottleneck zones for the pipe network in the Mugu River Basin, and zone R was designated as the critical bottleneck zone for the Mugu River. After the identification of the bottleneck zones of the Mugu River Basin, two zones (P1 and R) were selected to further improve the overall hydraulic performance of the drainage system.

3.4.2. Zone P1 Improvement

To comprehensively understand the reason for the drainage issues in zone P1, a detailed hydraulic profile analysis of 16 target conduits was conducted. As illustrated in Figure 6D, the upstream conduits P1–P5 and P6 were designed with diameters of 500 and 600 mm, respectively, while the downstream segments, specifically conduits P7–P11, had a slightly smaller diameter of only 400 mm. Furthermore, conduits P15 and P16 were designed with a diameter of 1000 mm, which was also smaller than that of the upstream conduit P14. This reduction in diameter would create a bottleneck effect and lead to the inundation of upstream conduits. Note that no adverse slope conditions, such as reverse slopes, were detected in the selected conduits and their downstream conduits; thus, topographic constraints could be ruled out as a primary cause of the flooding issues. Hence, the reduced capacities of conduits P7–P11 and P15–P16 were the most likely factor that restricted the stormwater conveyance and ultimately led to the upstream inundation in the target area. To address the identified capacity shortfalls and mitigate the flooding problems, two incremental improvement strategies were proposed and verified using the SWMM.
Strategy A: This strategy focused on alleviating the downstream bottleneck by increasing the cross-sectional area of the downstream conduits. Specifically, the diameters of conduits P7–P11 and P15–P16 were adjusted to 800 and 2000 mm, respectively.
Strategy B: This strategy involved sequential diameter upgrades for whole conduit network segments. The upstream segments (conduits P1–P5) were increased to 600 mm and the midstream segments, namely, conduits P7–P11 and P12–P13, were upgraded to 900 and 1200 mm, respectively. Eventually, the downstream segments (conduits P15–P16) were also enlarged to 2000 mm. This approach not only addressed the immediate bottleneck but also improved the overall hydraulic efficiency of the drainage network to ensure a more stable and efficient stormwater conveyance process.
The corresponding adjusted hydraulic profiles for both strategies are presented in Figure S14. To evaluate the effectiveness of these improvement strategies, a performance comparison of the node flooding durations between the original and optimized systems was conducted under different design storm scenarios. After the implementation of Strategy A, significant improvements were observed in the target area. Figure S15 shows that the average inundation durations of the selected nodes (highlighted in Figure 6C) dropped to less than 38.9 min after the adjustment under a 0.5-year recurrence period, which represented a substantial reduction of 57.7% compared with the baseline flooding durations of about 92.0 min. Even under more intense storm scenarios (a 5-year rainfall event), the improved system maintained inundation durations of less than 80 min, whereas the unadjusted system experienced inundation durations of about 120 min, which indicated that enlarging the diameters of conduits P7–P11 and P15–P16 was effective at alleviating the upstream bottleneck and improving the system’s resilience to storm events. With more extensive conduit diameter increases, Strategy B achieved even greater flood mitigation. For the 0.5- and 5-year rainfall events, the average inundation durations of the selected nodes were reduced to about 26 and 62 min, respectively. This superior performance could be attributed to the systematic upgrades along the entire flow path, which optimized the hydraulic gradient and enhanced the overall stormwater conveyance capacity.
At the system scale, under the 0.5-year rainfall recurrence period, Strategy A achieved 21.6 and 11.4% reductions in the average node inundation duration and node inundation volume (Table S3). Strategy B demonstrated more pronounced amelioration effects, with 26.5 and 14.7% decreases in the above two node outcomes compared with the control scenario (unimproved conditions). Notably, as the rainfall recurrence period increased, the amelioration effects of both strategies gradually attenuated (Table S3), signifying that the drainage capacity of the pipe network approached its hydraulic threshold under more severe storm events.

3.4.3. Zone R Improvement

As illustrated in previous sections, the enclosed culvert sections in the midstream of the Mugu River (zone R) represented a critical hydraulic bottleneck. The hydraulic profile in Figure 6E shows that the cross-sectional dimensions of conduits R12–R19 (3.0 × 2.0 m) were significantly smaller than those of the upstream conduits R1–R11, implying the inadequate hydraulic design of the culvert sections. To address this issue, two geometric improvement strategies were formulated, defined as Strategies C and D. The widths of conduits R12–R19 were expanded from 3.0 to 4.0 m in Strategy C, with the original height unchanged and the heights of conduits R12–R19 further elevated to 5.0 m in Strategy D. The corresponding hydraulic profiles of selected river conduits are displayed in Figure S16.
Hydrodynamic simulations were conducted to evaluate the conduit overload across various rainfall recurrence periods (0.5–200 years, Figure S17). The benchmark results (unimproved conditions) reveal that conduits R12–R18 exhibited severe overloading, even under the 0.5-year rainfall event, while the hydraulic overload of the targeted conduits happened with the 2-year and over 200-year recurrence periods after improvement with Strategies C and D, respectively. Under the unoptimized situation, the upstream nodes experienced inundation for more than one hour when the 10-year rainfall event occurred, which was eliminated after the improvement. Furthermore, the inundation of storm pipes that discharged into the river, particularly along the mid-upper reaches, was significantly mitigated (Figure S18). These results confirm that the undersized design of the midstream culverts was a primary driver of the drainage insufficiency in the Mugu River Basin and that hydraulic upgrades through culvert widening (Strategy C) or cross-sectional expansion (Strategy D) could significantly enhance the flood control capacity of the Mugu River.
At the system scale, under the 0.5-year rainfall recurrence period, Strategy C achieved reductions of 21.5% and 10.4% in the average node inundation duration and node inundation volume, respectively (Table S3). Furthermore, these two metrics retained reduction ratios that exceeded 15%, even when the recurrence period increased to 200 years, indicating significant and sustained improvements to the entire drainage system under Strategy C. Building upon Strategy C, Strategy D demonstrated relatively limited incremental improvements, suggesting that Strategy C fundamentally addressed the bottleneck issues in the river culverts.

4. Discussion

4.1. The Importance of Coupled Pipe–River Simulation

With the increase in the recurrence period, the Mugu River’s water level rose progressively. Taking the outlet of the Mugu River as an example, the maximum water level reached 0.99 m under the 0.5-year recurrence period, which was elevated to 1.34 and 1.56 m under the 10- and 200-year recurrence periods, respectively (Figure S19). Considering that the backwater effect of urban rivers was often overlooked in previous studies [20,21,22], the influence of the elevated river water level on the drainage performance of storm pipe networks was further investigated by analyzing the status of storm pipes that discharged into the Mugu River.
Among the 77 storm pipes that discharged into the river, 16 pipes experienced submersion, with an average inundation duration of approximately 101.9 min under the 0.5-year recurrence period. The number of submerged pipes gradually increased to 37 and 50 under the 5- and 50-year recurrence periods, respectively, and the average inundation durations of these submerged pipes were increased to 149.8 and 190.1 min, respectively (Figure S20). Figure S21 shows that prolonged inundation of the storm pipes occurred along the midstream and downstream of the Mugu River when the recurrence period exceeded 10 years, which could be attributed to the deeper burial depths of these pipes than those of the unoccupied pipes (Figure S22). Furthermore, the insufficient drainage capacity of enclosed culvert sections, as previously discussed, also contributed to the inundation of the outlets along the midstream of the Mugu River.
To further characterize the hydraulic coupling between the storm pipe network and the river channels, the results of the hydraulic simulation of the stormwater network alone (Figure S3B) were subsequently compared with those of the coupled simulation that incorporated the pipe network and river channels. Figure S23 shows that on the northern side of the middle river reaches, only a few nodes and pipes exhibited water accumulation or overload under the 1-year recurrence period scenario, regardless of the role of the Mugu River. This was significantly different from the result in the coupled simulation situation, which further highlighted the backwater effect of river water levels on the storm pipe network.

4.2. The Advantages of Two Metrics in Bottleneck Zone Identification

Unlike previous studies that relied on the single-node inundation volume or duration to identify bottlenecks [22,38,39], the two proposed indicators (NCIV and CCIL values) explicitly captured the spatial interdependencies between the inundation nodes. By integrating the topological relationship across the drainage network, these metrics enabled the identification of zones with the widest impact scope and highest severity, rather than isolating individual nodes/conduits. By identifying the bottleneck areas in the urban drainage system, the main problems that existed in the drainage system could be efficiently located, and improvement measures for the drainage system can be proposed to reduce the flood risks and extend the service life of the existing infrastructure.
To verify the accuracy of the two indicators, this paper further identified the bottleneck zones in the Mugu River Basin under actual rainfall scenarios. The NCIV and CCIL during the 12 actual rainfall events were calculated (Figures S24 and S25), and the results were compared with those from the design rainfall scenarios. As noted, obvious discrepancies were observed between the results of the actual rainfall events and the design rainfall scenarios, which were primarily attributed to the spatial heterogeneity of the actual rainfall. Specifically, the temporal–spatial distribution of the rainfall intensity across the basin was uneven, which differed from the uniform design rainfall pattern. However, the critical consistency of key bottleneck zones was identified under several actual rainfall events: zone P1 remained severely inundated under rainfall events R20240524, R20240614, R20240618, and R20240630, and zone P2 exhibited extensive inundation during events R20240520 and R20240616. These findings aligned closely with the bottleneck identification results from the design rainfall scenarios, which further validated the reliability of the NCIV and CCIL in capturing persistent problematic zones.

4.3. Sustainable Technical Framework for Drainage System Improvement

Enhancing the robustness of gray infrastructure: The proposed framework enhances the reliability of urban gray infrastructure in terms of flood control through coupled modeling, fine-scale evaluation, bottleneck identification, and targeted retrofits. By identifying critical bottlenecks, it reduces the system stress from localized severe inundation, effectively mitigating stormwater impacts on drainage networks and supporting long-term stable system operation.
Emphasis on engineering economy: The two proposed bottleneck identification indicators (NCIV and CCIL) enable precise targeting of critical retrofitting areas, which avoids unnecessary renovation, reduces the wasting of construction materials and land resources, and directs limited investments toward high-impact zones prone to inundation. Such resource optimization aligns with the principle of efficient resource utilization in sustainable management.
Facilitating risk-sharing mechanisms: Through model-based evaluation and scenario testing of optimization strategies, the framework helps delineate the boundaries between “drainage network design thresholds” and “residual risks”. For instance, under Strategy A, an estimated investment of approximately CNY 2.1 million reduces the inundation duration in zone A from over 4 h to less than 4 h under 1-year rainfall events; Strategy B, with an estimated investment of about CNY 2.7 million, further shortens this duration to under 2 h (Tables S4 and S5). Such cost-effectiveness comparisons allow decision-makers to make a trade-off between economic constraints and desired flood control standards. Additionally, such quantification supports the equitable distribution of residual risks between the current generation and subsequent generations.
Supporting long-term resilience: The proposed technical framework aligns with contemporary societal development trajectories and enables “adaptive management” as future economic capacity improves and flood control requirements evolve. This flexibility is consistent with the core principle of “long-term resilience” in sustainable development [50]. Future iterations could incorporate the impacts of extreme climate change, low-impact development (LID) measures, and other variables, supporting dynamically optimized retrofitting strategies to sustain long-term stormwater management goals.

4.4. Limitations and Future Works

The handling of rainfall spatial–temporal heterogeneity: It should be noted that the differences in the maximum rainfall intensity and total precipitation (Table S2) between the monitoring results of the three nearest rain gauge stations were highly significant. In this study, the SWMM simulated the rainfall’s spatial heterogeneity based on the nearest-distance principle, which may introduce certain errors into the simulation results. A more in-depth investigation into the temporal and spatial variation patterns of rainfall should be considered to provide more accurate rainfall inputs for the model in future studies.
The source of calibration data: Note that only the liquid level was measured and employed for the SWMM calibration, as this approach entailed a lower cost and more stable performance compared with measuring the flow velocity or flow rate. This might introduce potential inaccuracies in depicting the pipe flow dynamics within the SWMM, although its feasibility has been validated in previous studies [18,19]. In future research, we aim to incorporate more hydraulic monitoring data (e.g., flow velocity and flow rate) to enhance the model’s robustness.
Simplifications of model: The model assumed no conduit blockages or damage while these factors can reduce the effective conduit capacity or alter flow paths in practice, potentially introducing discrepancies between simulated and actual drainage performance.
Limited evaluation of extreme rainfall events: The above SWMM primarily utilized data from short-duration heavy rainfall or lower-intensity rainfall events during its calibration and validation processes. In the context of intense climate change, the abilities of the above SWMM to simulate more extreme heavy or long-duration rainfall scenarios still require further validation.
Limited application of multi-objective optimization in strategy evaluation: The current assessment of bottleneck zone improvement strategies mainly focuses on hydraulic performance enhancements, while the economic indicators (e.g., retrofit costs) were not yet incorporated. In future studies, multi-objective optimization approaches integrating economic indicators with hydraulic performance metrics should be employed to comprehensively optimize drainage system retrofit strategies, further enhancing their practical applicability.
Lack of validation of NCIV/CCIL indicators with actual monitoring data or alternative model frameworks: The NCIV/CCIL indicators proposed herein were derived from SWMM simulations, with their validity yet to be verified against independent monitoring data from actual rainfall events. Due to constraints in terms of the available observational data (e.g., limited node water level records for historical storms), direct validation of these metrics against field-measured values was not feasible. In future works, high-resolution observational data from actual rainfall events should be collected and the NCIV/CCIL values calculated from field observations should be compared with the SWMM simulation results. Furthermore, comparative simulations using 1–2D coupled hydrological models (e.g., InfoWorks ICM) will be conducted to verify the consistency of the NCIV/CCIL indicators. This will strengthen the credibility of the proposed metrics for practical applications.

5. Conclusions

(1) A 1D pipe–river coupled model, calibrated via a genetic algorithm, was developed to systematically evaluate the drainage performance in a typical high-density urban area of Shenzhen to provide technical support for a refined analysis of complex urban drainage systems.
(2) Two metrics, namely, the node cumulative inundation volume and conduit cumulative inundation length, were proposed to quantitatively identify bottleneck zones across the entire drainage system, which overcame the limitations of traditional single-point assessments.
(3) Targeted infrastructure adjustments significantly enhanced the overall drainage capacity under varied storm scenarios, offering a practical basis for engineering optimization.
(4) This study provided an efficient methodological framework for stormwater drainage system assessment and renovation in high-density built-up areas, offering actionable pathways for sustainable urban stormwater drainage system management.

Supplementary Materials

The following supporting information can be downloaded from https://www.mdpi.com/article/10.3390/su17157065/s1: Figure S1. The distribution of irregular river conduits; Figure S2. The cross-sectional geometries of irregular river conduits; Figure S3. SWMM of the Mugu River Basin coupling storm pipe network and river channels or considering the storm pipe network alone; Figure S4. The pipeline of the SWMM construction; Figure S5. Distribution of rain gauge stations in Longgang District; Figure S6. Process of parameter calibration via the genetic algorithm; Figure S7. Designed rainfall events at different recurrence periods; Figure S8. The sensitivity of the variation in the SWMM parameters for the maximum and average flow rates; Figure S9. The variations in the maximum and average fitness during the genetic algorithm calculations; Figure S10. The monitored rainfall and simulated/monitored liquid level at the MP1, MP2, and MP3 points during the R20240512 and R20240520 events; Figure S11. The inundation durations of nodes under the distinct recurrence periods; Figure S12. The flow-depth-to-diameter ratios of conduits under the distinct recurrence periods; Figure S13. The flow-depth-to-diameter ratios of river conduits under distinct recurrence periods; Figure S14. Improved hydraulic profiles of target conduits in zone P1 for Strategies A and B; Figure S15. The inundation durations of selected nodes and the maximum flow-depth-to-diameter ratio of selected conduits without improvement or after improvement by Strategies A and B under the distinct recurrence periods; Figure S16. Improved hydraulic profiles of target river conduits in zone R for Strategies C and D; Figure S17. The inundation durations of selected nodes (river) and the maximum flow-depth-to-diameter ratio of selected conduits (river) without improvement or after improvement by Strategies C and D under the distinct recurrence periods; Figure S18. The inundation durations of storm pipes that discharged into the Mugu River under the distinct recurrence periods after improvement via Strategy C; Figure S19. The variation in the flow depth at the Mugu River outlet under distinct recurrence periods; Figure S20. The variation in the inundation number and average inundation duration of conduits along the river under distinct recurrence periods; Figure S21. The inundation durations of storm pipes that discharged into the Mugu River under distinct recurrence periods; Figure S22. The buried depth of storm pipe outlets that discharged into the Mugu River; Figure S23. The inundation durations of nodes and the flow-depth-to-diameter ratio of conduits under a 1-year rainfall event; Figure S24. Spatial distributions of the NCIV (×103 m3) under the distinct actual rainfall events; Figure S25. Spatial distributions of the CCIL (km) under the distinct actual rainfall events; Table S1. Detailed information about the required data; Table S2. Information about twelve rainfall events; Table S3. Summary of the average node inundation durations and node inundation volumes under distinct recurrence periods; Table S4. Cost table of the unit length pipe network under different pipe diameters and buried depths [51]; Table S5. Estimated costs for Strategies A and B.

Author Contributions

Conceptualization, J.C. and F.S.; methodology, J.C., H.F. and H.Q.; software, J.C.; validation, J.C., F.S. and Y.Y.; formal analysis, J.C.; investigation, F.S.; writing—original draft preparation, J.C.; writing—review and editing, H.Q.; visualization, J.C.; funding acquisition, H.W. and Y.P. All authors have read and agreed to the published version of the manuscript.

Funding

This research was funded by the PowerChina Core Technology Research Project (No. DJ-HXGG-2022-09), Key Technology Research and Development Program of Power Construction Corporation of China (No. DJ-ZDXM-2024-54), Shenzhen Science and Technology Program (No. KCXFZ20240903092407009, KCXFZ20230731100904010), and Innovation Team Project for General Universities in Guangdong Province, China (No. 2023KCXTD050).

Data Availability Statement

Data is unavailable due to privacy or ethical restrictions.

Conflicts of Interest

Authors J.C., F.S., H.F., Y.Y., H.W. and Y.P. were employed by the company Power China Eco-Environmental Group Co., Ltd. These authors declared to avoid conflicts of interest with the company.

Abbreviations

The following abbreviations are used in this manuscript:
CCILConduit cumulative inundation length
GAGenetic algorithm
NSENash–Sutcliffe efficiency
NCIVNode cumulative inundation volume
RMSERoot mean square error
SWMMStorm water management model

References

  1. Bongaarts, J. IPCC, 2023: Climate Change 2023: Synthesis Report. Popul. Dev. Rev. 2024, 50, 577–580. [Google Scholar] [CrossRef]
  2. Zhuang, Q.; Liu, S.; Zhou, Z. Spatial Heterogeneity Analysis of Short-Duration Extreme Rainfall Events in Megacities in China. Water 2020, 12, 3364. [Google Scholar] [CrossRef]
  3. Xu, T.; Yang, Z.; Gao, X.; Zhou, J. A Study on the Evolution of Urban Underlying Surfaces and Extreme Rainfall in the Pearl River Delta. Water 2024, 16, 267. [Google Scholar] [CrossRef]
  4. Xu, K.; Zhuang, Y.; Bin, L.; Wang, C.; Tian, F. Impact Assessment of Climate Change on Compound Flooding in a Coastal City. J. Hydrol. 2023, 617, 129166. [Google Scholar] [CrossRef]
  5. Jiang, C.; Li, J.; Gao, J.; Lv, P.; Zhang, Y. Quantitative Calculation of Stormwater Regulation Capacity and Collaborative Configuration of Sponge Facilities in Urban High-Density Built-Up Areas. Environ. Sci. Pollut. Res. 2023, 30, 13571–13581. [Google Scholar] [CrossRef] [PubMed]
  6. Zhou, Q. A Review of Sustainable Urban Drainage Systems Considering the Climate Change and Urbanization Impacts. Water 2014, 6, 976–992. [Google Scholar] [CrossRef]
  7. Huang, G.R.; Wang, X.; Huang, W. Simulation of Rainstorm Water Logging in Urban Area Based on InfoWorks ICM Model. Water Resour. Power 2017, 35, 66–70. [Google Scholar] [CrossRef]
  8. To, T.N.; Vu, H.C.; Le, H. The Impacts of Urbanization on Urban Flooding in Danang City, Vietnam. In CIGOS 2019, Innovation for Sustainable Infrastructure, Proceedings of the 5th International Conference on Geotechnics, Civil Engineering Works and Structures; Ha-Minh, C., Dao, D.V., Benboudjema, F., Derrible, S., Huynh, D.V.K., Tang, A.M., Eds.; Springer: Singapore, 2020; pp. 1057–1062. [Google Scholar]
  9. Zoppou, C. Review of Urban Storm Water Models. Environ. Model. Softw. 2001, 16, 195–231. [Google Scholar] [CrossRef]
  10. Marsalek, J.; Dick, T.M.; Wisner, P.E.; Clarke, W.G. Comparative Evaluation of Three Urban Runoff Models. JAWRA J. Am. Water Resour. Assoc. 1975, 11, 306–328. [Google Scholar] [CrossRef]
  11. Chen, X.Y.; Zhang, N.; Wu, F.F. Storm Water Management Model (SWMM): Principles, Parameters and Applications. China Water Wastewater 2013, 29, 4–7. [Google Scholar] [CrossRef]
  12. Palaka, R.; Sri Charana Reddy, P.; Viharika, G.; Pravalika, G. Design of Urban Storm Water Drainage System Using GIS and SWMM Software. In IOP Conference Series: Materials Science and Engineering; IOP Publishing: Bristol, UK, 2021; Volume 1197, p. 012014. [Google Scholar] [CrossRef]
  13. El Ghazouli, K.; El Khatabi, J.; Soulhi, A.; Shahrour, I. Model Predictive Control Based on Artificial Intelligence and EPA-SWMM Model to Reduce CSOs Impacts in Sewer Systems. Water Sci. Technol. 2021, 85, 398–408. [Google Scholar] [CrossRef]
  14. Eskandaripour, M.; Golmohammadi, M.H.; Soltaninia, S. Optimization of Low-Impact Development Facilities in Urban Areas Using Slime Mould Algorithm. Sustain. Cities Soc. 2023, 93, 104508. [Google Scholar] [CrossRef]
  15. Rabori, A.M.; Ghazavi, R. Urban Flood Estimation and Evaluation of the Performance of an Urban Drainage System in a Semi-Arid Urban Area Using SWMM. Water Environ. Res. 2018, 90, 2075–2082. [Google Scholar] [CrossRef]
  16. Chen, X.; Davitt-Liu, I.; Erickson, A.J.; Feng, X. Integrating the Spatial Configurations of Green and Gray Infrastructure in Urban Stormwater Networks. Water Resour. Res. 2023, 59, e2023WR034796. [Google Scholar] [CrossRef]
  17. Liu, Y.; Zhang, X.; Liu, J.; Wang, Y.; Jia, H.; Tao, S. A Flood Resilience Assessment Method of Green-Grey-Blue Coupled Urban Drainage System Considering Backwater Effects. Ecol. Indic. 2025, 170, 113032. [Google Scholar] [CrossRef]
  18. Wang, T.; Zhang, L.; Zhai, J.; Wang, L.; Zhao, Y.; Liu, K. Automatic Calibration of SWMM Parameters Based on Multi-Objective Optimisation Model. J. Hydroinform. 2024, 26, 683–706. [Google Scholar] [CrossRef]
  19. Liu, K.; Li, J.; Gao, J.; Chi, X.; Jiang, C. Study on SWMM Calibration and Optimizing the Layout of LID Based on Intellgent Algorithm: A Case in Campus. Water Resour. Manag. 2025. [Google Scholar] [CrossRef]
  20. Zhang, X.; Kang, A.; Lei, X.; Wang, H. Urban Drainage Efficiency Evaluation and Flood Simulation Using Integrated SWMM and Terrain Structural Analysis. Sci. Total Environ. 2024, 957, 177442. [Google Scholar] [CrossRef]
  21. Yang, W.; Zheng, C.; Jiang, X.; Wang, H.; Lian, J.; Hu, D.; Zheng, A. Study on Urban Flood Simulation Based on a Novel Model of SWTM Coupling D8 Flow Direction and Backflow Effect. J. Hydrol. 2023, 621, 129608. [Google Scholar] [CrossRef]
  22. Akter, A.; Datta, A.; Shaharia, M. Evaluation of Urban Drainage Capacity Using Different Satellite Image Sources and SWMM. Urban Water J. 2024, 21, 1095–1108. [Google Scholar] [CrossRef]
  23. Li, P.; Zhou, Y.; Zhen, Y.; Jin, Q.; Meng, X. Analysis of the Influence of River Boundary Water Level on the Drainage Capacity of Pipe Network—A Case Study of Jiangnan Area in Yiwu City. In Hydraulic Structure and Hydrodynamics; Wang, W., Wang, C., Lu, Y., Eds.; Springer Nature: Singapore, 2025; pp. 425–440. ISBN 978-981-97-7251-3. [Google Scholar]
  24. Bertram, D.; Roberts, M.; Haynes, H. Linking Urban Drainage to Surface Water Management Models. In Environmental Hydraulics: Theoretical, Experimental and Computational Solutions; Lopez Jimenez, P., Fuertes Miquel, V., Iglesias Rey, P., Lopez Patino, G., Martinez Solano, F., Palau Salvador, G., Eds.; Routledge: London, UK, 2010; pp. 237–240. [Google Scholar]
  25. Cheng, S.; Yang, M.; Li, C.; Xu, H.; Chen, C.; Shu, D.; Jiang, Y.; Gui, Y.; Dong, N. An Improved Coupled Hydrologic-Hydrodynamic Model for Urban Flood Simulations under Varied Scenarios. Water Resour. Manag. 2024, 38, 5523–5539. [Google Scholar] [CrossRef]
  26. Wu, P.; Wang, T.; Wang, Z.; Song, C.; Chen, X. Impact of Drainage Network Structure on Urban Inundation within a Coupled Hydrodynamic Model. Water 2025, 17, 990. [Google Scholar] [CrossRef]
  27. Luan, G.; Hou, J.; Wang, T.; Li, D.; Zhou, Q.; Liu, L.; Duan, C. A 1D-2D Dynamic Bidirectional Coupling Model for High-Resolution Simulation of Urban Water Environments Based on GPU Acceleration Techniques. J. Clean. Prod. 2023, 428, 139494. [Google Scholar] [CrossRef]
  28. Chen, W.; Wu, H.; Kimball, J.S.; Alfieri, L.; Nanding, N.; Li, X.; Jiang, L.; Wu, W.; Tao, Y.; Zhao, S.; et al. A Coupled River Basin-Urban Hydrological Model (DRIVE-Urban) for Real-Time Urban Flood Modeling. Water Resour. Res. 2022, 58, e2021WR031709. [Google Scholar] [CrossRef]
  29. Khatooni, K.; Hooshyaripor, F.; MalekMohammadi, B.; Noori, R. A New Approach for Urban Flood Risk Assessment Using Coupled SWMM–HEC-RAS-2D Model. J. Environ. Manag. 2025, 374, 123849. [Google Scholar] [CrossRef] [PubMed]
  30. Feng, W.; Wang, C.; Lei, X.; Wang, H. A Simplified Modeling Approach for Optimization of Urban River Systems. J. Hydrol. 2023, 623, 129689. [Google Scholar] [CrossRef]
  31. Wang, H.; Lei, X.; Wang, C.; Liao, W.; Kang, A.; Huang, H.; Ding, X.; Chen, Y.; Zhang, X. A Coordinated Drainage and Regulation Model of Urban Water Systems in China: A Case Study in Fuzhou City. River 2023, 2, 5–20. [Google Scholar] [CrossRef]
  32. Venn, A. 24—Social Justice and Climate Change. In Managing Global Warming; Letcher, T.M., Ed.; Academic Press: Cambridge, MA, USA, 2019; pp. 711–728. ISBN 978-0-12-814104-5. [Google Scholar]
  33. Spijkers, O. Intergenerational Equity and the Sustainable Development Goals. Sustainability 2018, 10, 3836. [Google Scholar] [CrossRef]
  34. Rentachintala, L.R.N.P.; Reddy, M.G.M.; Mohapatra, P.K. Urban Stormwater Management for Sustainable and Resilient Measures and Practices: A Review. Water Sci. Technol. 2022, 85, 1120–1140. [Google Scholar] [CrossRef]
  35. Tang, L.L.; Hu, J.C.; Liu, Z.; Yang, Z.G.; Li, Q.Q. Bottleneck Analysis and Reform Evaluation of Urban Underground Drainage Pipe Network Based on SWMM. China Water Wastewater 2018, 34, 112–117. [Google Scholar] [CrossRef]
  36. Liao, W.L.; Zhou, X.W.; Wang, C.H.; Wang, Z.L. Simulation and Application on Storm Flood in Dongguan City Based on SWMM. In Proceedings of the 2014 International Conference on Mechatronics, Electronic, Industrial and Control Engineering, Shenyang, China, 29–31 August 2014. [Google Scholar]
  37. Wei, Z.Q.; Huang, Y.J.; Lin, L.N.; Lu, L.J.; Huang, X.F. Application of InfoWorks ICM in Problem Diagnosis and Reconstruction of Drainage Pipe Network for Urban Build-up Area. China Water Wastewater 2017, 33, 115–119. [Google Scholar] [CrossRef]
  38. Osheen; Kansal, M.L.; Bisht, D.S. Evaluation of an Urban Drainage System Using Functional and Structural Resilience Approach. Urban Water J. 2023, 20, 1794–1812. [Google Scholar] [CrossRef]
  39. Zuo, C.; Yin, B.; Tan, F.; Ma, Z.; Gong, S.; Qi, X. Runoff Simulation and Waterlogging Analysis of Rainstorm Scenarios with Different Return Periods on Campus: A Case Study at China University of Geosciences. Appl. Sci. 2025, 15, 691. [Google Scholar] [CrossRef]
  40. Liu, Y.; Zhao, W.; Wei, Y.; Sebastian, F.S.M.; Wang, M. Urban Waterlogging Control: A Novel Method to Urban Drainage Pipes Reconstruction, Systematic and Automated. J. Clean. Prod. 2023, 418, 137950. [Google Scholar] [CrossRef]
  41. Ahmad, S.; Jia, H.; Ashraf, A.; Yin, D.; Chen, Z.; Ahmed, R.; Israr, M. A Novel GIS-SWMM-ABM Approach for Flood Risk Assessment in Data-Scarce Urban Drainage Systems. Water 2024, 16, 1464. [Google Scholar] [CrossRef]
  42. Katoch, S.; Chauhan, S.S.; Kumar, V. A Review on Genetic Algorithm: Past, Present, and Future. Multimed. Tools Appl. 2021, 80, 8091–8126. [Google Scholar] [CrossRef]
  43. Kumar, S.; Kaushal, D.R.; Gosain, A.K. Evaluation of Evolutionary Algorithms for the Optimization of Storm Water Drainage Network for an Urbanized Area. Acta Geophys. 2019, 67, 149–165. [Google Scholar] [CrossRef]
  44. Lamontagne, J.R.; Barber, C.A.; Vogel, R.M. Improved Estimators of Model Performance Efficiency for Skewed Hydrologic Data. Water Resour. Res. 2020, 56, e2020WR027101. [Google Scholar] [CrossRef]
  45. McDonnell, B.; Ratliff, K.; Tryby, M.; Wu, J.; Mullapudi, A. PySWMM: The Python Interface to Stormwater Management Model (SWMM). J. Open Source Softw. 2020, 5, 2292. [Google Scholar] [CrossRef]
  46. Liu, Y.Y.; Li, L.; Liu, Y.S.; Chan, P.W.; Zhang, W.-H. Dynamic Spatial-Temporal Precipitation Distribution Models for Short-Duration Rainstorms in Shenzhen, China Based on Machine Learning. Atmos. Res. 2020, 237, 104861. [Google Scholar] [CrossRef]
  47. Zhong, B.; Wang, Z.; Yang, H.; Xu, H.; Gao, M.; Liang, Q. Parameter Optimization of SWMM Model Using Integrated Morris and GLUE Methods. Water 2022, 15, 149. [Google Scholar] [CrossRef]
  48. Kim, S.W.; Kwon, S.H.; Jung, D. Development of a Multi-Objective Automatic Parameter-Calibration Framework for Urban Drainage Systems. Sustainability 2022, 14, 8350. [Google Scholar] [CrossRef]
  49. McCall, J. Genetic Algorithms for Modelling and Optimization. J. Comput. Appl. Math. 2005, 184, 205–222. [Google Scholar] [CrossRef]
  50. Assarkhaniki, Z.; Sabri, S.; Rajabifard, A.; Kahalimoghadam, M. Advancing sustainable development goals: Embedding resilience assessment. Sustain. Sci. 2023, 18, 2405–2421. [Google Scholar] [CrossRef]
  51. Research Institute of Standards and Norms Ministry of Housing and Urban-Rural Development. Investment Estimation Index for Municipal Engineering; China Planning Press: Beijing, China, 2007; Volume 4, ISBN 978-7-80242-076-2. [Google Scholar]
Figure 1. Study area.
Sustainability 17 07065 g001
Figure 2. Detailed procedures for bottleneck zone identification.
Sustainability 17 07065 g002
Figure 3. The monitored rainfall and simulated/monitored liquid level at the MP4 point during the (A) R20240512 and (B) R20240520 events.
Sustainability 17 07065 g003
Figure 4. The ratios of the (A) inundation duration of manhole nodes and (B) flow depth to diameter of stormwater conduits under distinct recurrence periods.
Sustainability 17 07065 g004
Figure 5. Spatial distributions of the (A,C,E) NCIV (×103 m3) and (B,D,F) CCIL (km): (A,B) 0.5-year, (C,D) 10-year, and (E,F) 200-year.
Sustainability 17 07065 g005
Figure 6. (AC) Bottleneck zones (including zones R (B), P1 (C), and P2) of the Mugu River Basin; and (D,E) hydraulic profiles of target conduits in zones P1 (D) and R (E).
Sustainability 17 07065 g006
Table 1. The value ranges and calibration results of 11 uncertain SWMM parameters.
No.ParametersValue RangesInput ValuesCalibration
Results
1Manning roughness coefficient of impervious area (N-Imperv)0.011~0.0330.0210.03
2Manning roughness coefficient of permeable area (N-Perv)0.05~0.80.450.66
3Depression storage depth of impervious area (S-Imperv)/mm0.2~1050.2
4Depression storage depth of permeable area (S-Perv)/mm2~1057.4
5Percentage of impermeable area without depression storage (PctZero)/%5~854575
6Maximum infiltration rate (MaxRate)/(mm/h)25~805579
7Minimum infiltration rate (MinRate)/(mm/h)0~1059.5
8Decay rate constant (Decay)/(1/h)2~742.75
9Drainage time (Drytime)/d1~741
10Manning roughness coefficient of conduits (manningN_pipe)0.011~0.0250.0170.016
11Manning roughness coefficient of river (manningN_river)0.011~0.0250.0170.024
Disclaimer/Publisher’s Note: The statements, opinions and data contained in all publications are solely those of the individual author(s) and contributor(s) and not of MDPI and/or the editor(s). MDPI and/or the editor(s) disclaim responsibility for any injury to people or property resulting from any ideas, methods, instructions or products referred to in the content.