1. Introduction
Given the increasingly apparent conflict between economic growth and environmental conservation, the promotion of sustainable development has become a critical global priority [
1]. In pursuit of advancing sustainable development more effectively, the concept of sustainable production and consumption (SPC) has been incorporated as one of the 17 Sustainable Development Goals (SDGs) by the United Nations [
2,
3,
4]. SPC is recognized as a proactive initiative aimed at enhancing the economic and environmental sustainability of a product throughout its lifecycle [
5]. The implementation pathways for this initiative include cleaner production [
6,
7,
8], circular economy [
9,
10,
11], responsible consumption [
12,
13,
14], and waste management [
15,
16,
17].
In particular, the rapid growth of the sharing economy in recent years has been recognized as a promising avenue for advancing SPC [
18,
19,
20]. The separation of use rights from ownership can enhance resource utilization efficiency and reduce the societal demand for production [
21,
22,
23], thereby contributing to sustainable production and consumption [
24,
25,
26]. For instance, shared accommodation platforms enable users to rent unoccupied houses and rooms, which not only satisfy consumers’ diverse accommodation requirements but also provide property owners with supplementary income sources, thus diminishing the necessity for new construction and material production [
27,
28,
29,
30]. Furthermore, car-sharing services have demonstrated the potential to improve vehicle utilization and reduce overall vehicle ownership, consequently mitigating the adverse environmental impacts of automobiles [
31,
32,
33].
Driven by the sharing economy, the trend towards integration between manufacturing and services has become increasingly evident [
34,
35,
36]. Automotive manufacturers, such as Mercedes-Benz, Toyota, and Tesla, have implemented diversified car-sharing initiatives, providing personalized and environmentally friendly products and services [
37,
38]. Similarly, traditional bicycle manufacturers such as Yongan Hang have begun to engage in bike-sharing services with a product service system strategy to promote sustainable production and consumption through continuous technological innovation and product optimization, and upgrading [
39]. Concurrently, bike sharing platform operators, such as Meituan and Hellobike, have forged partnerships with manufacturing enterprises to actively build a comprehensive product life cycle management system [
40,
41]. This integration of manufacturing and service practices, catalyzed by the sharing economy, provides favorable conditions for promoting sustainable production and consumption. It facilitates the rapid transfer of personalized and diversified consumer needs to the production end, thereby improving the efficiency of resource allocation in production, consumption, and circulation processes. It can also enhance product quality and resource utilization by providing full lifecycle management to achieve sustainable production and consumption.
The majority of existing research on sustainable production and consumption within the sharing economy context provides qualitative descriptions and discussions of relevant policies and business practices, lacking quantitative analysis of the effectiveness of SPC practices. Although the environmental and economic impacts of sharing economy practices have been widely estimated, most of these studies are based on cross-sectional data analysis, which cannot effectively elucidate the reasons for and trends in the development and changes of phenomena [
42,
43,
44]. Notably, from a business operations perspective, the pursuit of profit and the achievement of environmental sustainability are often conflicting objectives. How to attain a mutually beneficial outcome of economic and environmental benefits remains a challenge in SPC practice [
45,
46]. Therefore, dynamically examining the environmental and economic impacts of SPC transformation is crucial to better understand and drive SPC practices.
Furthermore, existing research on SPC practices in the sharing economy is predominantly analyzed from the perspective of sharing economy platform operators. For instance, car-sharing and bike-sharing operators can enhance environmental and economic performance by optimizing fleet size, vehicle deployment, and pricing strategies to increase the daily turnover, distance traveled, and operational lifespan of vehicles [
47,
48,
49]. However, SPC transformation involves multiple stakeholders such as the government, manufacturers, sharing economy platform operators, and users. The collaborative efforts of stakeholders may facilitate sustainable development of the sharing economy more effectively [
50]. Currently, there is a dearth of discussion on the synergistic relationship between multiple stakeholders in the process of promoting SPC. Specifically, the roles and functions of the participants in the SPC practice process and the form of cooperation mechanism that stakeholders should adopt to achieve effective SPC practices remain unclear.
Given these deficiencies, this study utilizes Beijing dockless bike sharing (DBS) promotion as an example to examine how the sharing economy business practice advances sustainable production and consumption. It aims to address the following research questions:
(1) Analyze how governments, operators, users, and other stakeholders collaborate to effectively promote SPC practices from a systemic perspective.
(2) Dynamically evaluate the environmental and economic impact of DBS in facilitating the SPC transformation process.
(3) Investigate how to achieve a win-win situation of platform profitability and environmental benefits in the SPC practice process.
This study contributes to a more comprehensive understanding of the role and potential of the sharing economy in promoting sustainable production and consumption. Additionally, it offers valuable insights for achieving a win-win situation of platform profitability and environmental benefits in SPC practice.
2. Materials and Methods
The materials and data utilized in this study were gathered using a multi-source approach.
(1) Field Research. Semi-structured interviews were conducted with DBS operators (Meituan, Hellobike, Mobike) and bicycle manufacturers (Yongjiu, Phoenix) to acquire operational data and life cycle inventory data for shared bikes, including service price, maintenance costs, procurement costs, vehicle lifespan, vehicle weight, materials, and energy consumption.
(2) Policy Documents. Statistics on bike-sharing operations in Beijing, government policies, and urban-level transportation travel data were obtained from official portals such as the Beijing Transport Institute, Beijing Transportation Commission, and Beijing Municipal Government Bulletins.
(3) Public Information and Industry Reports. Data from the China Academy of Information and Communications Technology (CAICT) and China Bicycle Association (CIRCN) were employed for material composition, procurement costs, and recycling rates. Peer-reviewed studies supplemented the life-cycle inventory data.
Cross-validation was performed to mitigate bias. Enterprise data (e.g., operational data) was cross-verified with municipal reports (e.g., the Beijing Transport Annual Report). For uncertainty quantification, Monte Carlo simulations were employed to account for data variability.
2.1. SPC Practices of DBS in Beijing
DBS emerged in Beijing at the end of 2016 and subsequently underwent rapid expansion over the subsequent two years. However, unregulated market growth has resulted in a range of adverse consequences, including oversupply, inefficient resource utilization, irregular operational practices, and increased strain on urban governance systems [
51,
52,
53]. Since 2019, authorities have introduced a series of regulatory policies to standardize the operation and development of the entire DBS market [
54,
55,
56]. The government, enterprises, public, and other stakeholders have collaborated to actively promote the SPC practices of DBS, as illustrated in
Table 1.
DBS operators collaborate with bicycle manufacturers and resource recycling agencies to actively establish a closed-loop management system for the entire lifecycle of shared bikes. They implement the 3R principles (Reduce, Reuse, Recycle) across all stages of the product, including design, manufacturing, operation, and disposal. Furthermore, diverse technologies have been employed to enhance the operational efficiency of DBS systems, increase resource utilization, reduce operating costs, and improve corporate profitability [
57,
58,
59].
The government implemented comprehensive supervision and management of vehicles, operations, and services, regulating both enterprise operational practices and user behavior [
60]. In recent years, the government of Beijing has implemented a series of policies aimed at promoting development, standardizing operational and service behaviors, ensuring the security of user funds and information, and fostering a conducive environment for development [
61,
62]. For instance, in response to the widespread issue of oversupply during the early stages of the bike-sharing market, the government assessed supply scale based on factors such as travel needs, urban space capacity, and the transportation supply structure. This assessment facilitated the determination of the appropriate range for the total number of shared bikes supplied in the market, thereby mitigating resource waste associated with oversupply. Furthermore, the supply scale was dynamically adjusted according to the market status of the peak and off-seasons. The peak season operates from April to November each year, with the total number of bikes in the central area not exceeding 800,000 [
63,
64]. The off-peak season spans December to March of the following year, during which the total number of bikes in the central urban area was limited to 600,000 [
63,
64].
The public assumes a dual role as both participant and supervisor in the governance of the DBS market, which is essential for promoting the sustainable development of DBS. Through the implementation of a series of reward and punishment mechanisms, the public can be incentivized to actively engage in market governance, thereby establishing a social governance system characterized by governmental oversight, corporate collaboration, and multi-stakeholder participation. Moreover, diverse incentive measures have been instituted to encourage public involvement in the operation and management of the platform, enhancing its operational efficiency and resource utilization, while concurrently reducing operational costs.
Through the implementation of SPC practices, the mass of the shared bikes decreased from a mean of approximately 20 kg to approximately 17 kg [
65,
66]. The average procurement cost per shared bike reduced from approximately 1350 RMB (Chinese Yuan) to approximately 800 RMB [
65,
66]. The daily turnover rate (DTR) per shared bike increased by a factor of nearly three [
63]. The operational lifespan of the shared bike has extended from approximately three to four years. The recycling rate of components and materials from decommissioned vehicles has increased from approximately 30% in the initial stages of development to approximately 90% in the current phase [
67,
68].
2.2. LCA Method and Environmental Impact Assessment
The impact assessment of DBS on GHG emissions in this study adhered to the standardized Life Cycle Assessment (LCA) framework and procedure provided by ISO [
69,
70]. The LCA modeling for DBS in this study was mainly based on software SimaPro 9.0 and database Ecoinvent 3.6. The environmental impact indicator “Global warming” was selected, and the corresponding impact scores (i.e., GHG emissions intensity [GEI]) were calculated by using the ReCiPe 2016 midpoint method [
71]. As for uncertainty analysis, key distribution parameters for statistical results, such as mean value (MV) and confidence interval (CI), were obtained through 10,000 Monte Carlo simulations.
Figure 1 presents the system boundary of LCA modeling for DBS.
The early version of the DBS bike weighed approximately 20 kg, with its composition including approximately 8.95 kg of aluminum, 6.69 kg of steel, 1.95 kg of plastic, 1.22 kg of rubber, and 1.19 kg dedicated to the smart lock, which encompasses batteries and electronic components. In comparison, the current version of the DBS bike has an average mass of approximately 17 kg, comprising approximately 7.86 kg of aluminum, 5.65 kg of steel, 1.67 kg of plastic, 0.98 kg of rubber, and 0.84 kg allocated to the smart lock [
65,
66]. The detailed inventory data are listed in
Table A1. The primary operational data of the DBS market in Beijing are listed in
Table 2 and
Supplementary Materials.
The passenger-kilometer (i.e., pkm) was utilized as the functional unit in this study, and the measurement unit for the GHG emission intensity (GEI) of travel modes can be expressed as g CO
2-eq/pkm, as shown in Equation (1).
where
GEI (g CO
2-eq/pkm) is the GHG emission intensity,
LCGE (g CO
2-eq) is the lifecycle GHG emissions of a vehicle, and
LCPKM (pkm) is the lifecycle passenger-kilometers.
where
DTR (trips/day) is the daily turnover rate,
(km/trip) is the average distance per DBS trip, and
Lifespan (years) is the operational lifespan of the vehicle.
2.3. Bottom-Up Approach
Annual GHG emissions from the daily travel of urban residents in Beijing can be estimated based on the “bottom-up” approach (Equation (3)) [
75,
76,
77].
where
i denotes travel mode,
(trips/day) is the daily trip volume for mode
i (
Figure 2),
(km/trip) is the average distance per trip for mode
i (see
Figure 3), and
(g CO
2-eq/pkm) is the GHG emission intensity of mode
i (see
Figure 4).
Considering that the large-scale implementation of bike-sharing systems may reduce private bicycle ownership to some extent, the corresponding environmental impacts originally caused by private bicycles can be mitigated, which can further enhance the sustainability of bike sharing. Therefore, in this study, we analyze not only the environmental benefits brought about by the change in transportation structure but also the environmental benefits resulting from the reduction in private bicycle ownership from a long-term perspective.
refers to the annual GHG emissions resulting from the decrease in private bicycle ownership. RPOB refers to the reduction in the number of privately owned bicycle (POB) within the city, refers to the GHG emissions per private bicycle throughout its entire lifecycle, refers to the operational lifespan of POB.
The operational lifespan of POB was approximately 4–6 years in Beijing, with an average of five years. The extensive promotion of dockless bike-sharing (DBS) in Beijing resulted in a daily reduction of approximately 1.85 million trips made by private bicycles in 2023, compared to 2016. Given that the DTR of private bicycles in Beijing is approximately 0.9 to 1.5, it can be estimated that the total number of private bicycles decreased by approximately 1.2–2.0 million (1.6 million on average) [
63,
68,
73,
76]. The
was set as 156 kg CO
2-eq [
78,
79].
Therefore, the GHG emission reduction benefit (EB) per kilometer of DBS travel from the short- and long-term perspectives can be calculated using Equations (5) and (6).
where
EB (g CO
2-eq/km) is the emission reduction benefit per km,
AGHGI (g CO
2-eq/year) is the annual GHG reduction, and
Annual Mileage (km/year) is the total yearly distance traveled by DBS bikes.
2.4. Economic Benefit Analysis
This study also analyzed the economic benefits of DBS at different developmental stages from a life cycle perspective. The net present value (NPV) and return on investment (ROI) were selected to evaluate the economic impact of shared bikes. For analytical purposes, all economic indicators were calculated based on the average cost and benefits allocated to each shared bike. This analysis considers only income from DBS services and excludes other business income. The
NPV can be calculated using Equation (7).
where
DTR (trips/day) is the daily turnover rate,
P (RMB/trip) is the fee per trip,
AC (RMB/year) is the average annual cost per bike,
r = 25% is the income tax rate (constant),
n (years) is the operational lifespan,
i = 5% is the discount rate (constant),
PC (RMB) is the procurement cost, and
RV (RMB) is the residual value.
where
MS denotes the market scale (i.e., fleet size) of the DBS.
The ROI can be calculated based on the
NPV and life cycle cost of each DBS bike, as shown in Equation (9).
Furthermore, according to Equation (6), the threshold of the
DTR for DBS to achieve positive economic benefits can also be calculated. Specifically, this refers to the
DTR value when the
NPV equals zero. The parameters used for economic analysis are presented in
Table 3.
Moreover, this study considers the economic value of the GHG emission reduction benefits. Specifically, based on the international carbon price (i.e., 0.462 RMB/kg CO
2-eq) [
80,
81], the GHG emission reduction benefits of DBS were quantified in monetary terms.
3. Results
3.1. Environment Benefit
3.1.1. GEI Values of DBS Under Different Stages
SPC practices can significantly improve the environmental performance of DBS. As shown in
Figure 5, the average GEI of DBS on global warming during the early stage was approximately 174.23 (95% CI = 147.42–206.93) g CO
2-eq/pkm, whereas the average GEI value at the current stage was approximately 48.75 (95% CI = 43.16–55.60) g CO
2-eq/pkm, representing a reduction of approximately 72.02%.
3.1.2. GHG Emissions from Urban Residents’ Daily Travel in Beijing Under Different Stages
Large-scale DBS promotion has increased urban residents’ enthusiasm for cycling in Beijing. Regarding daily travel volume, the share of cycling increased from 10.88% in 2016 to 13.41% in 2018 and to 15.05% in 2023 (see
Figure 2). The changes in the daily traffic structure resulting from DBS promotion are shown in
Figure 6. In comparison to 2016, the daily passenger-kilometers of bicycle travel increased by 0.62 million (5.04%) in 2018 and 1.34 million (10.90%) in 2023. The large-scale promotion of bike sharing can effectively address the “first and last kilometer” challenge in urban transportation, which constitutes the primary obstacle for urban residents in utilizing public transportation for travel. The DBS promotion has led to an increase in the proportion of public transit trips, with a rise of 9.25 million passenger-kilometers per day. Overall, DBS has facilitated the green transformation of urban transportation. Compared to 2016, the daily passenger-kilometers of car travel decreased by 3.31 million (2.58%) in 2018 and 4.72 million (3.68%) in 2023.
The GHG emissions from the daily travel of urban residents in Beijing are presented in
Figure 7. In comparison to 2016, the annual GHG emissions in 2018 and 2023 decreased by 0.22% (0.028 million tons of CO
2-eq) and 1.71% (0.224 million tons of CO
2-eq), respectively. The annual GHG emissions per capita in 2018 and 2023 decreased by 1.31 kg CO
2-eq and 10.32 kg CO
2-eq, respectively, compared with 2016. The GHG emission reduction effect of DBS in 2023 was greater than that in 2018. According to Equation (3), the primary factor contributing to this discrepancy was the alteration in the GEI value of DBS (accounting for 84.5%), followed by modification of the travel structure (accounting for 15.5%). The GEI value of DBS in 2023 was approximately 28% of that in 2018 (see
Figure 5), which significantly enhanced the sustainability performance of DBS.
3.1.3. The GHG Emission Reduction Benefits of DBS
Figure 8 presents the GHG emission reduction benefits of DBS at different stages. The average EB value at the early stage was approximately −35.81 (95% CI: −62.62–−3.11) g CO
2-eq/pkm, indicating that each kilometer of DBS travel reduced GHG emissions by approximately 35.81 g CO
2-eq. This emission reduction benefit is derived solely from daily transportation trips by urban residents. As for the current stage, the GHG emission reduction benefits from the daily transportation trips were approximately −124.40 (95% CI: −129.99–−117.55) g CO
2-eq/pkm. Furthermore, in the long term, large-scale DBS promotion can yield environmental benefits by reducing private bicycle ownership.
Table 4 illustrates the GHG emission reductions resulting from a decrease in private bicycle ownership within the city. Therefore, from a long-term perspective, the average EB value at the current stage was approximately −150.60 (95% CI: −164.79–−136.18) g CO
2-eq/pkm, signifying that each kilometer of DBS travel reduced the GHG emissions by approximately 150.60 g CO
2-eq. Among these factors, the reduction attributable to changes in private bicycle ownership was approximately −26.21 (95% CI: −34.79–−18.63) g CO
2-eq/pkm, accounting for 17.4% of the total reduction.
Moreover, the long-term cumulative impact of decreased greenhouse gas (GHG) emissions due to a reduction in private bicycle ownership requires further examination. Assuming the current level of private bicycle ownership remains unchanged, it is anticipated that there will be a cumulative reduction of 2.35 million tons of CO2-eq (95% CI: 1.7 million to 3.15 million tons) over a 5-year period, and a cumulative reduction of 4.7 million tons of CO2-eq (95% CI: 3.4 million to 6.3 million tons) over a 10-year period.
3.2. Economic Benefit
The NPV and ROI of the shared bikes at different stages are shown in
Figure 9. The economic performance of the shared bikes at the early stage was superior to that of shared bikes at the current stage. The NPV was −2425.37 (95% CI = −2642.89–−2217.56) RMB at the early stage and −183.73 (95% CI = −496.10–128.30) RMB at the current stage, respectively. The ROI was −79.32% (95% CI = −82.83–−75.38%) at the early stage and −3.83% (95% CI = −10.35–2.68%) at the current stage. During the initial phase of DBS market development, operators adopted low-price strategies to attract users and establish a market presence. Notably, the DTR of the shared bikes was only 1.1. These factors contributed to substantial economic losses for DBS operators.
Despite the implementation of SPC policies and business practices resulting in notable enhancements in DBS economic performance, operators remain unprofitable. The monetization of the GHG reduction benefits per DBS trip is illustrated in
Figure 10. Considering the monetization of GHG emission reduction benefits, the NPV and ROI of the shared bikes were 181.40 (95% CI = −154.09–−522.93) RMB and 3.67% (95% CI = −3.15–10.56%), respectively (see
Figure 11). Taking into account the monetization of the benefits of GHG emission reduction, DBS may yield positive economic returns.
4. Discussion
Bike-sharing systems have proliferated globally as a sustainable urban mobility solution; however, comprehensive assessments of their net environmental impacts remain complex. Primary environmental benefits arise from increased non-motorized travel and the substitution of automobile trips. While Beijing’s SPC practices demonstrate significant climate benefits, cross-regional comparisons reveal both consistency and nuance.
In China, Shanghai’s dockless bike-sharing system reduces GHG emissions by 185.48 g CO
2-eq per commuting trip [
82]. Shenzhen documented daily CO
2 savings of 114.42 tons, with shared bikes reducing emissions by 96 g CO
2-eq/km; 57% of the emission reductions occurred within 500 m of subway stations [
83]. Hangzhou’s publicly subsidized station-based system prioritizes public transit integration, achieving higher vehicle utilization but lower spatial coverage than Beijing’s dockless model [
84,
85].
In North America, New York City’s bike sharing averted 13,370 tons of oil equivalent and 30,070 tons of GHG emissions through automobile displacement from 2014 to 2017 [
86]. Washington D.C.’s Capital Bikeshare program saved approximately 0.07 kg CO
2-eq per bike daily [
87], while Sacramento’s e-bike-sharing reduced automobile travel by 0.79 miles per trip [
88].
European outcomes exhibit greater heterogeneity. In Trani, Italy, bike sharing substituted 31% of daily car trips, reducing emissions by 21% [
89]. Amsterdam’s shared bikes and e-scooters increased non-motorized trips by 5%, yet only 32% replaced private vehicles, yielding a modest 1.27% CO
2 reduction [
90]. Conversely, e-scooter sharing in Stockholm, Gothenburg, and Malmö displaced walking and public transit in 85–87% of trips, increasing emissions by 21–35 g CO
2-eq per trip [
91]. Tallinn’s modality analysis revealed infrastructure deficiencies, with car dominance prevalent in suburbs lacking cycling networks [
92]. Automobile substitution rates for bike-sharing remain low in several large European cities: below 20% in Barcelona, Dublin, and Paris, and under 10% in London and Lyon [
93,
94]. In contrast to large-scale Chinese initiatives that capitalize on network effects, smaller-scale bike-sharing programs in European cities may have limited potential for reducing emissions.
Another consideration is the reduced private bicycle ownership. The Sevilla bike-sharing project demonstrated a negative substitution effect, with approximately 4.5% of users abandoning private bicycles [
95]; however, the environmental benefits of this reduction remain unquantified in the extant literature. Overall, bike-sharing sustainability is not inherent but is contingent upon locally calibrated policies, user behavior, urban spatial environments, fleet scale, and operational efficiency.
4.1. How to Improve Profitability of DBS Operators and the Environmental Benefits
The large-scale implementation of DBS has the potential to yield substantial GHG emission reduction benefits through SPC practice. However, from an operational perspective, DBS has not yet achieved a desirable profit performance. Under the condition of maintaining the GHG emission reduction benefits of DBS (i.e., the daily DBS travel volume of Beijing DBS remains stable at approximately 300 million trips per day), enhancing the DTR of DBS bikes can improve the profitability of DBS. However, an increase in DTR may also result in higher operational and maintenance costs. According to [
96], the average annual cost per shared bike under different DTR was calculated as
. AC
0 refers to the current annual cost per shared bike (i.e., DTR = 3.3).
μ refers to the elasticity coefficient, which indicates the degree of fluctuation in AC caused by changes in the DTR [
96]. The various cost function curves are presented in
Figure A1.
Under the current travel mode structure, the GHG emission reduction benefits increase with an increase in the DTR (see
Figure A2). However, the relationship between TP and DTR may exhibit an inverted U-shaped curve. As illustrated in
Figure 12, if the μ value is below 0.2, increasing the DTR can significantly improve DBS profitability. When the μ value is between 0.2 and 0.3, the maximum profit can be approximately obtained at a DTR of 4–5, whereas when the μ value exceeds 0.3, increasing DTR may not improve the profitability of DBS. Achieving a balance between scale and efficiency is crucial to improving profitability. Operators need to seek an operational strategy to maximize profits according to the actual cost function curve.
Increasing prices may enhance DBS profitability (see
Figure A3). However, price increases can precipitate a series of complex chain reactions. This may prompt consumers to reassess the cost-effectiveness of DBS, potentially resulting in a negative impact on DBS usage. Operators need to thoroughly consider the elasticity of DBS travel volume with respect to price changes and the sensitivity of GHG emission reduction benefits to changes in DBS usage to develop optimal pricing strategies. DBS operators should implement effective measures to address the challenge of rising prices and achieve sustainable profitability through refined operations and diversified revenue models while maintaining service quality. Enterprises can attract and retain users by enhancing the user experience and increasing incentive programs, such as providing more efficient methods of accessing shared bikes, optimizing vehicle distribution, and improving vehicle quality. Concurrently, enterprises can expand the usage scenarios for shared bikes and offer users diversified urban lifestyle and transportation services to broaden their revenue streams.
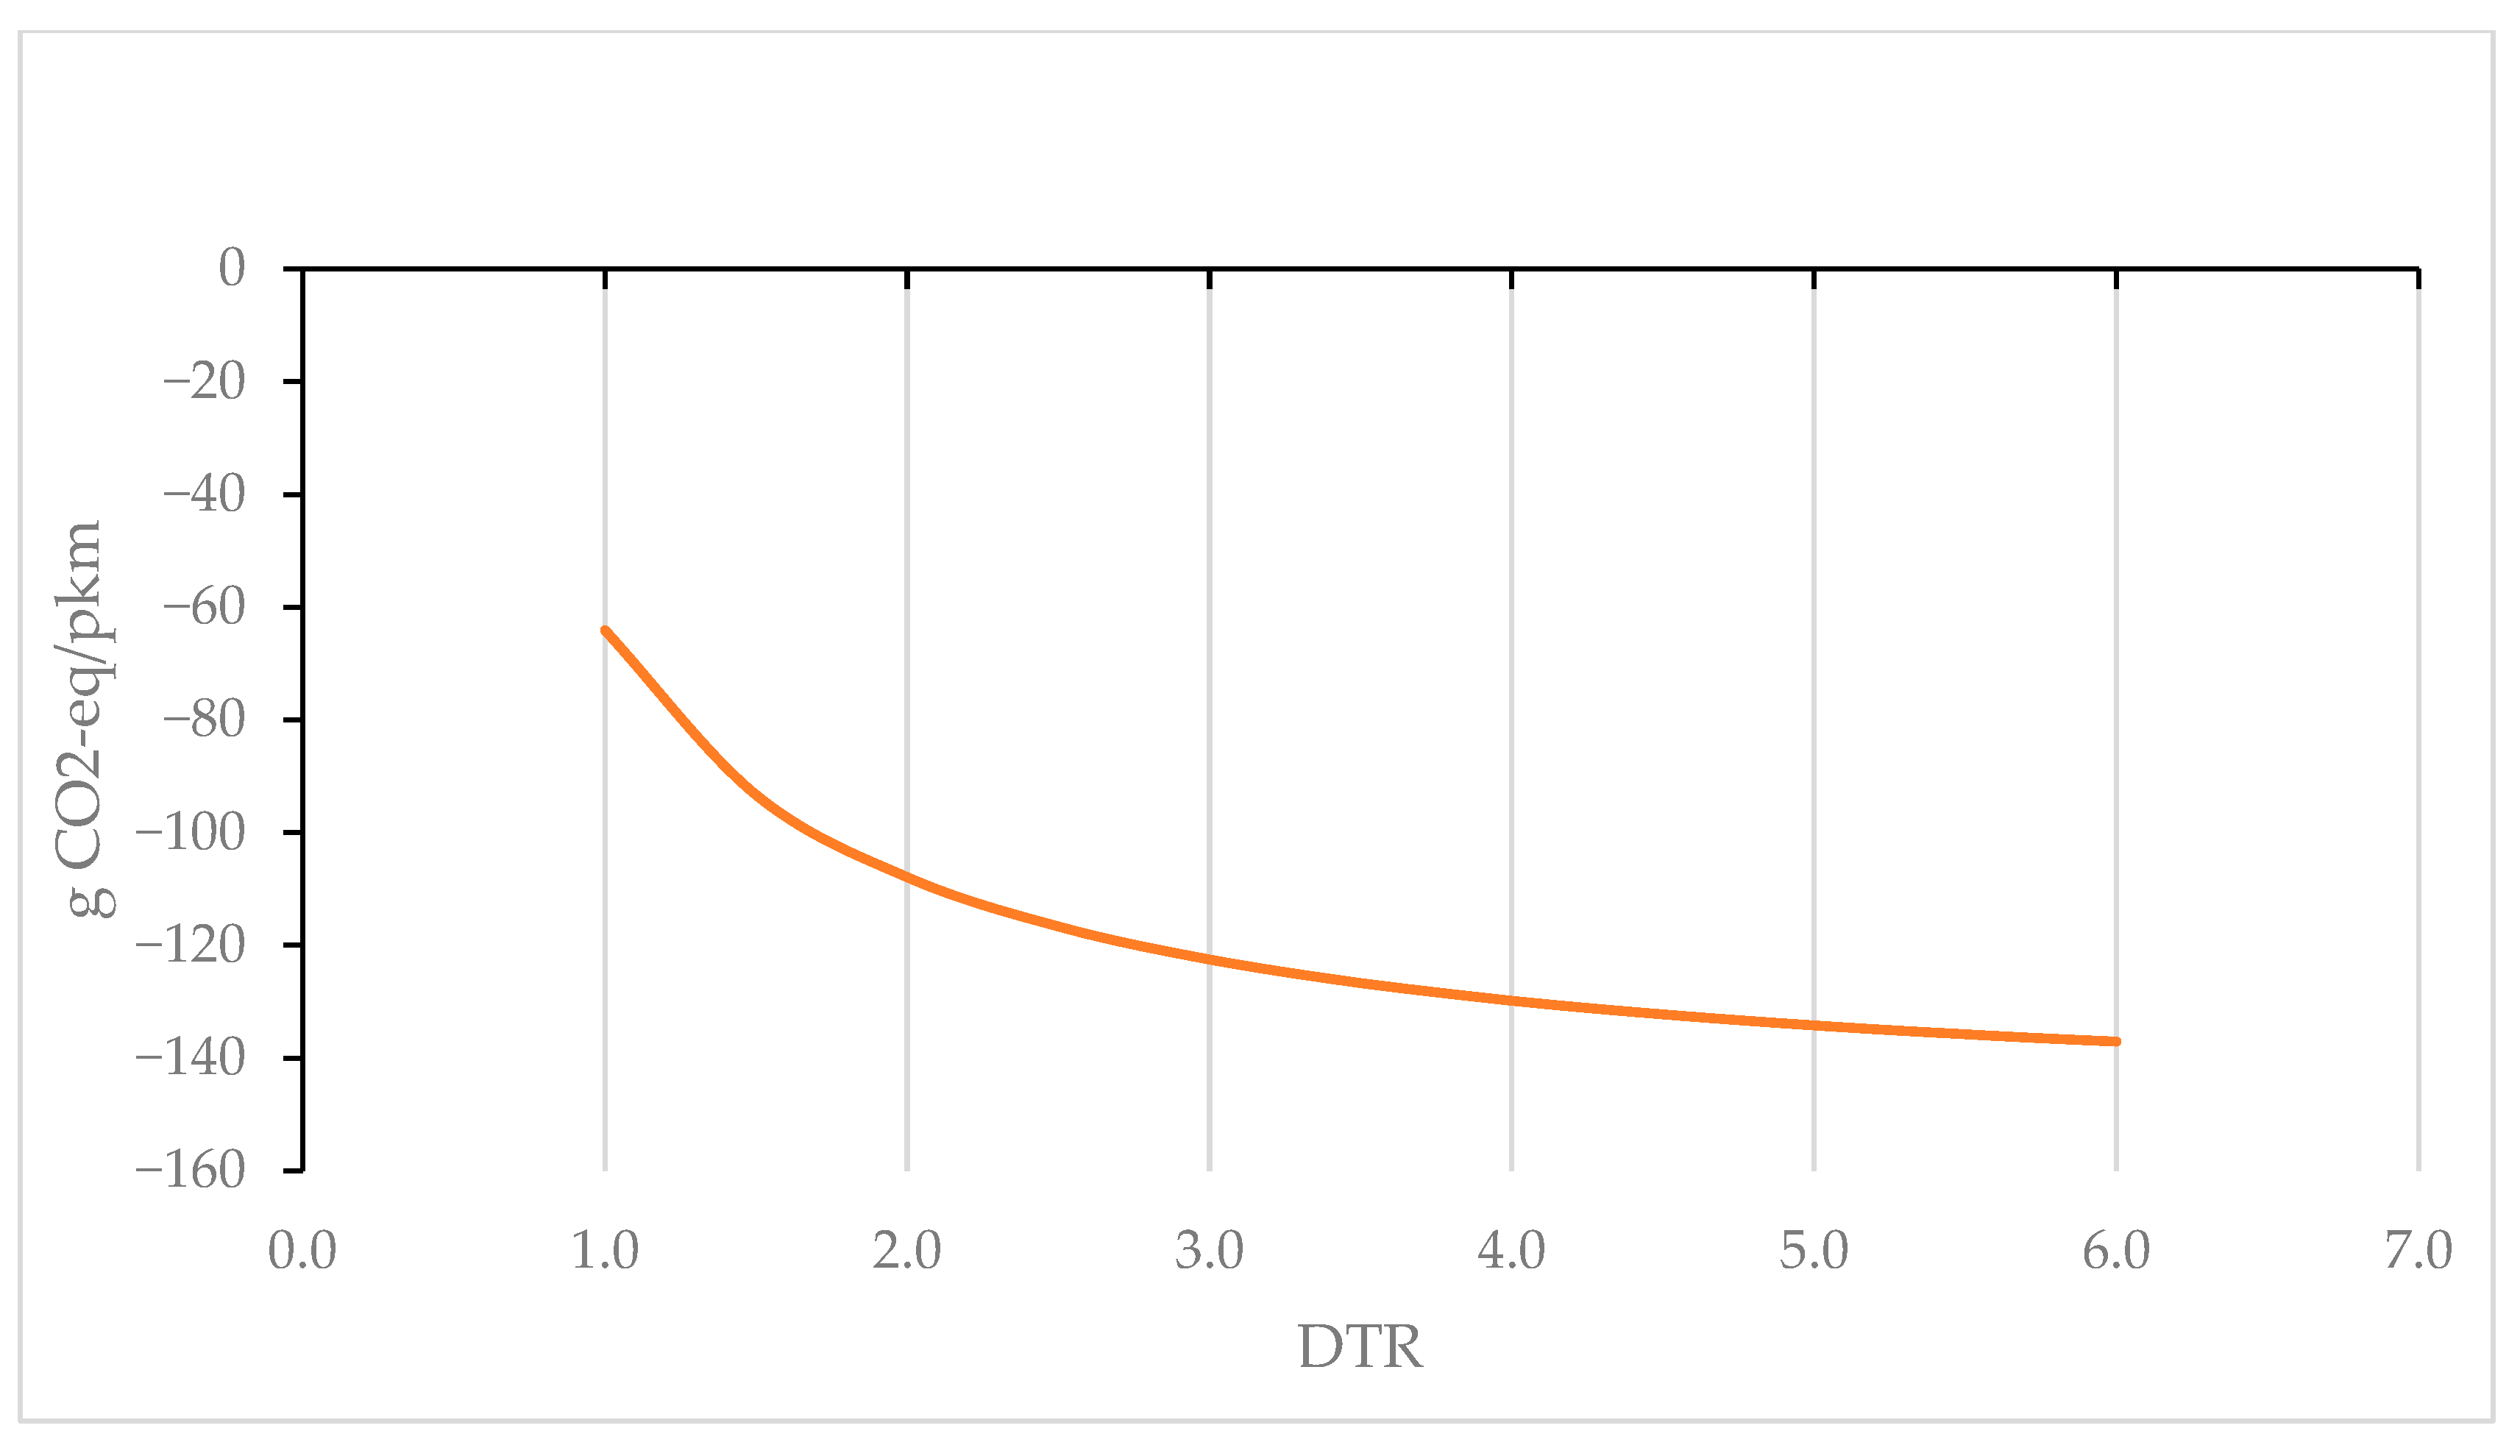
The SPC practice significantly enhanced the GHG emission reduction benefits of DBS, wherein the change in the GEI value of DBS and the change in travel structure contributed to 84.5% and 15.5%, respectively. According to Equations (1)–(3), under the current travel structure, the GHG emission reduction benefits of DBS increase when the GEI value decreases. As demonstrated in
Figure A4, the GEI values of DBS decrease with an increase in the DTR. However, when the DTR exceeded 4, the sensitivity gradually diminished. Given that the current DTR is approximately 3.3, the efficacy of improving environmental benefits by increasing the DTR progressively declines. Consequently, future efforts should focus on increasing the proportion of green travel to obtain greater emission reduction benefits from DBS.
4.2. The Conflict Between Pursuing Profits and Emphasizing Environmental Benefits
In the context of DBS promotion, operators prioritize profitability, whereas policymakers focus on environmental benefits. Consequently, the SPC practice of DBS encounters a contradiction between the pursuit of profits and the enhancement of environmental benefits. The theory of extended producer responsibility posits that the production of high-quality products is advantageous to the environment [
97,
98,
99]. However, the strategic decisions of sharing economy enterprises (i.e., providing low- or high-quality products) are influenced by factors such as market positioning, competition strategy, cost-effectiveness, and policy regulations [
100,
101,
102]. Yang simulated the conflict between bike-sharing businesses and government regulation through game theory and system dynamics models, revealing that the strategies of DBS operators are sensitive to additional operation and maintenance costs for providing low-quality shared bikes and the costs of positive regulation [
103]. Liu indicated that under the three-year scrapping policy, operators tend to utilize low-quality bicycles and cannot fully realize the environmental advantages of shared bikes when maximizing profits [
96]. Therefore, achieving a balance between economic and environmental objectives remains a significant challenge for SPC practices.
Cooperation between manufacturers and sharing economy platforms promotes both economic and environmental sustainability. In addition to providing shared products, manufacturers can participate in the sharing economy by establishing or joining a sharing platform or by engaging in commercial cooperation with third-party platforms. However, strategic choices are influenced by multiple complex factors such as product attributes, production costs, transaction costs in the shared market, consumer demand characteristics, inconvenience costs, pricing strategies, and market competition [
46]. Xiao and Cao indicated that manufacturers tend to participate in the sharing service business only when consumers have a high demand for shared products or when the cost of a self-built service operation platform is low [
104]. Tian analyzed the economic and environmental impacts after the manufacturer entered the car-sharing market. They found that manufacturers entering the sharing market can not only bring economic benefits to businesses and consumers, but also environmental benefits to the entire society [
105]. However, this is only applicable in certain situations, specifically when both the shared transaction costs and the manufacturer’s marginal costs are at a moderate level.
The government can implement measures to promote the healthy and sustainable development of the DBS market, such as providing DBS operators with economic subsidies based on environmental benefits and formulating preferential policies and incentives to facilitate deep integration among DBS operators, manufacturers, recycling agencies, and consumers to enhance sustainable production and consumption practices across the bicycle industry chain. Manufacturers and DBS operators should cultivate a sense of community responsibility and address sustainability issues to achieve positive outcomes. The transportation sector can incorporate DBS into comprehensive urban transportation planning to provide more extensive supporting infrastructure and favorable conditions for DBS. For instance, Beijing is actively developing an intelligent Mobility as a Service (MaaS) platform, which integrates multiple modes of transportation (e.g., bus, subway, and bike sharing) to provide convenient and diverse travel services for the public. Additionally, diverse incentives and environmental awareness initiatives to encourage public participation in bike sharing should be developed to enhance the environmental benefits and economic performance of DBS.
4.3. The Collaborative Network Framework of the Interactions Among Key Stakeholders in SPC Practice
Based on the SPC practices of DBS, a collaborative network framework was developed to characterize the interactions of key stakeholders in this study, as illustrated in
Figure 13. The interactions between stakeholders can be categorized into four distinct groups based on the functionality of SPC practices. From the perspective of the bicycle industry chain (Circle A), the interaction between DBS platforms and manufacturers can facilitate the integration of manufacturing and services. Furthermore, the sustainable design and manufacturing of products and product lifecycle management can be effectively promoted through the participation and cooperation of recycling agencies. From the perspective of regulating market operations and management (Circle B), the government, platform operators, and the public, with the support of technology service providers, can collectively promote healthy and sustainable development of the DBS market through a series of policies and incentive mechanisms. These include providing more comprehensive support facilities and conducive conditions for DBS, establishing and improving regulatory and credit systems to govern the operation of the DBS platform and user behavior, and implementing a series of incentive mechanisms to encourage users to participate in market governance. Furthermore, with the support of technology service providers, government and environmental organizations (or social welfare organizations) can promote the concept of green consumption by jointly establishing a social propaganda system and encouraging public participation in green consumption behavior (e.g., utilizing DBS services) through a series of guidance policies and incentives to promote sustainable consumption (Circle C). Additionally, the DBS platform can enhance operational efficiency and service quality by collaborating with business partners and technology service providers to promote the utilization of DBS services (Circle D). Concurrently, a series of incentive measures can be implemented to encourage DBS users to participate in the operation and management of DBS to promote sustainable production and consumption.
4.4. Implications
This study has several theoretical and managerial implications. Firstly, while existing research has extensively discussed the impact of the sharing economy from different perspectives [
106,
107,
108], there is a paucity of systematic research on how it promotes sustainable production and consumption, which is a crucial aspect of the sustainable development goals. Existing research on SPC practices in the sharing economy is predominantly analyzed from the perspective of sharing economy platform operators [
109,
110,
111]. However, effective SPC practice is not an independent behavior of the enterprise itself but rather a collaborative system behavior with the participation of multiple stakeholders, including the government, operators, manufacturers, consumers, recycling agencies, and business partners (e.g., technology service providers). This study systematically summarizes and analyzes the SPC practices of DBS in Beijing, with the objective of presenting a panoramic view of how it promotes sustainable production and consumption. It not only elucidates the roles, functions, and collaboration mechanisms of the various participants in the SPC practice process, but also quantitatively analyzes the environmental benefits and operators’ profitability. By enhancing stakeholder comprehension of SPC practices, this study serves as a valuable reference for formulating and adopting more effective strategies and measures to promote SPC.
Furthermore, for DBS, previous environmental and economic analyses were predominantly based on questionnaire surveys and scenario designs, and the results were constrained by a series of hypothetical conditions [
112,
113,
114], lacking empirical analysis of the actual urban traffic structure and travel behavior data and the operational characteristics and business data of DBS. Moreover, these studies are primarily based on cross-sectional data and cannot dynamically observe the changes and impacts of SPC practices. Notably, from a long-term perspective, the large-scale promotion of DBS could potentially reduce the total number of private bicycles within the city. However, the existing studies have not considered the environmental benefits of reducing bicycle ownership. This study employed a longitudinal design to dynamically examine the economic and environmental performance of DBS. It not only analyzed the short-term environmental benefits brought about by the change in traffic structure but also quantified the long-term environmental benefits resulting from the reduction in private bicycle ownership, which provides new insights into the environmental impact of bike sharing.
The research findings indicate that SPC practice can significantly enhance both the environmental benefits of DBS and the profitability of operators. However, DBS platforms still operate at a financial loss, which significantly affects their sustainable and healthy development. This study has discussed and analyzed potential strategies to improve the profitability of DBS operators, which may serve as a scientific basis for managerial decision-making. Nevertheless, achieving a win-win situation for economic and environmental benefits remains a challenge for operators. Increasing the utilization of DBS bikes and optimizing operational management efficiency are crucial for promoting sustainable production and consumption. Operators need to seek an operational strategy that maximizes profits in accordance with the actual cost function curve. Taking into account the economic value of environmental benefits, the government can provide policy support and financial subsidies to encourage operators to continuously increase investment in technological innovation and optimize operational management efficiency. Additionally, the government should assume a more proactive role in SPC practices to enhance the environmental and economic benefits of the sharing economy. It should implement a series of policies and incentive measures to promote interaction and cooperation among SPC stakeholders.
5. Conclusions
Using Beijing’s DBS promotion as an example, this study investigates how the sharing economy advances SPC. It also conducts an economic and environmental analysis of SPC practices from a life cycle perspective. The findings indicate that effective SPC practices can be achieved through the collaborative efforts of multiple stakeholders, including the government, operators, manufacturers, consumers, recycling agencies, and other business partners, supported by regulatory systems and advanced technologies. SPC practices significantly improved the environmental and economic performance. The GHG emission reduction benefit of DBS increased from approximately 35.81 g CO2-eq/pkm in the early stage to 124.40 g CO2-eq/pkm in the current stage, in which the change of GEI value of DBS and the change of urban residents’ travel structure contributed 84.5% and 15.5% respectively. From a long-term perspective, considering the changes in private bicycle ownership, these GHG emission reduction benefits could reach approximately 150.60 g CO2-eq/pkm. In addition, the NPV of each DBS bike was −2425.37 (95% CI = −2642.89–−2217.56) RMB in the early stage and −183.73 (95% CI = −496.10–128.30) RMB in the current stage, respectively. The ROI of the shared bikes was −79.32% (95% CI = −82.83–−75.38%) in the early stage and −3.83% (95% CI = −10.35–2.68%) in the current stage. Considering the monetization of the benefits of GHG emission reduction, the profit rate is still low. The NPV and ROI of the shared bikes were 181.40 (95% CI = −154.09–−522.93) RMB and 3.67% (95% CI = −3.15–10.56%), respectively.
Increasing vehicle utilization (i.e., DTR) and service prices (i.e., P) can enhance DBS profitability. Operators must seek an operational strategy to maximize profits according to the actual cost function curve. Bike sharing demonstrates significant potential for promoting sustainable production and consumption. The government should collaborate with operators and explore effective management models to assist operators in optimizing the integration of manufacturing and service operations.
This study makes three significant contributions. First, it presents an innovative stakeholder collaboration framework that outlines the collective efforts of governments, operators, manufacturers, and consumers to promote sustainable product consumption (SPC) through regulatory systems and technological integration. Second, it dynamically quantifies the environmental-economic trade-offs in sharing economy SPC practices, with particular emphasis on quantifying the previously overlooked impact of reduced private bicycle ownership. Finally, it addresses the optimization of operational strategies, demonstrating how adjustments in fleet utilization can maximize profit while maintaining emission reductions, thereby facilitating mutually beneficial outcomes for policymakers and businesses.
However, this study had some limitations that warrant further investigation. First, it only discussed and analyzed the practices and contributions of dockless bike sharing in promoting SPC. Future research should expand to various forms of sharing economy policies and business practices to explore comprehensively and systematically how the sharing economy promotes sustainable production and consumption. Second, owing to the lack of available data, this study only carried out a simplified economic analysis of the operators’ bike-sharing service business without including advertising revenue and other business cooperation revenue. Moreover, in terms of economic analysis, only the economic performance of operators was considered, without analyzing the perspectives of society and individual users. All of these need to be further supplemented and improved based on more enterprise operational data in the future.
Author Contributions
Conceptualization, Y.W. and S.S.; methodology, S.S. and D.Y.; software, S.S.; validation, Q.W. and S.S.; formal analysis, Y.W. and S.S.; investigation, Q.W.; resources, Y.W. and Q.W.; data curation, Y.W. and S.S.; writing—original draft preparation, Y.W.; writing—review and editing, S.S. and D.Y.; visualization, Q.W.; supervision, S.S.; project administration, D.Y.; funding acquisition, S.S. and D.Y. All authors have read and agreed to the published version of the manuscript.
Funding
This research was funded by Social Science Foundation of Beijing Municipal Education Commission (General Program) (grant number SM202210017001), Beijing Social Science Foundation (Youth Project) (grant number 24JJC027), Project of Hebei University of Economics and Business (grant number 2021YB10), Fundamental Research Funds for the Central Universities of China (grant number 00007745 and FRF-BR-23-08B). The APC was funded by 00007745.
Institutional Review Board Statement
Not applicable.
Informed Consent Statement
Not applicable.
Data Availability Statement
All data generated or analyzed during this study are included in this published article.
Conflicts of Interest
The authors declare no conflicts of interest.
Appendix A
Table A1.
The inventory data for LCA of DBS bike.
Table A1.
The inventory data for LCA of DBS bike.
| Process | Material & Energy | Value | Unit |
|---|
| | | Early version | Current Version | |
| Manufacturing | Aluminum, section bar extrusion | 6.675 | 4.088 | kg |
| Aluminum, welding, arc | 1.328 | 0.813 | m |
| Aluminum sheet, powder coat | 0.620 | 0.379 | m2 |
| Electronic equipment | 0.420 | 0.300 | kg |
| Steel, chromium steel 18/8 | 2.814 | 1.724 | kg |
| Battery | 0.420 | 0.280 | kg |
| Steel, wire drawing | 0.599 | 0.367 | kg |
| Chromium steel | 0.282 | 0.173 | kg |
| Steel, low-alloyed | 8.673 | 5.312 | kg |
| Aluminum wrought alloy | 13.125 | 8.039 | kg |
| Printed circuit board | 0.350 | 0.260 | kg |
| Polyethylene, high density, granulate | 3.268 | 2.098 | kg |
| Polyurethane, flexible foam | 0.053 | 0.032 | kg |
| Synthetic rubber | 0.996 | 0.610 | kg |
| Injection molding | 3.470 | 2.125 | kg |
| Heat | 17.876 | 13.762 | MJ |
| Electricity, medium voltage | 9.126 | 6.781 | kWh |
| Photovoltaic panel | 0.025 | 0.020 | m2 |
| Tap water | 0.985 | 0.735 | kg |
| Use stage | Aluminum alloy, AlMg3 | 0.668 | 0.409 | kg |
| Transport | 180.675 | 406.519 | km |
| Steel, low-alloyed | 0.404 | 0.247 | kg |
| Polyurethane, flexible foam | 0.053 | 0.032 | kg |
| Chromium steel | 0.404 | 0.247 | kg |
| Tap water | 0.092 | 0.072 | kg |
| Aluminum, section bar extrusion | 0.668 | 0.409 | kg |
| Synthetic rubber | 2.991 | 1.832 | kg |
| Injection molding | 1.733 | 1.061 | kg |
| Polyethylene, high density, granulate | 1.733 | 1.061 | kg |
| End of life | Transport | 5.286 | 4.313 | km |
| Waste electric and electronic equipment | 0.738 | 0.540 | kg |
| Waste plastic | 3.497 | 2.141 | kg |
| Used battery | 0.420 | 0.280 | kg |
| Waste rubber | 0.896 | 0.549 | kg |
Figure A1.
AC of DBS under different DTR.
Figure A1.
AC of DBS under different DTR.
Figure A2.
The EB value of DBS under different DTR.
Figure A2.
The EB value of DBS under different DTR.
Figure A3.
NPV and ROI at different price increase rates.
Figure A3.
NPV and ROI at different price increase rates.
Figure A4.
GEI of the current version of DBS bike under different DTR.
Figure A4.
GEI of the current version of DBS bike under different DTR.
References
- Mahmood, T.; Mubarik, M.S. Balancing Innovation and Exploitation in the Fourth Industrial Revolution: Role of Intellectual Capital and Technology Absorptive Capacity. Technol. Forecast. Soc. Chang. 2020, 160, 120248. [Google Scholar] [CrossRef]
- Durani, F.; Anwar, A.; Sharif, A.; Hamid, A.; Ali, S.; Syed, Q.R. Exploring the Link between Inflation, Tourism, Trade, Foreign Direct Investment, and Renewable Energy Consumption: Evidence from Novel Wavelet Quantile Correlation Approach. Clean Technol. Environ. Policy 2024. [Google Scholar] [CrossRef]
- Sharma, S.; Pappu, A.; Asolekar, S.R. Sustainable Recycling of Paddy Straw through Development of Short-Fiber-Reinforced Composites: Exploring Gainful Utilization of Agricultural Waste. Clean Technol. Environ. Policy 2024, 26, 109–127. [Google Scholar] [CrossRef]
- Iñigo Martínez, M.E.; Díaz, G.F.; Machado, D.; Garolera De Nucci, P.; Paz, D.; Arena, P. Life Cycle Assessment of Energy Saving and Circular Economy Strategies: Contributions to the Environmental Footprint Lemon and by-Product Production in Argentina. Clean Technol. Environ. Policy 2024, 26, 2033–2057. [Google Scholar] [CrossRef]
- Nishitani, K.; Kokubu, K. Can Firms Enhance Economic Performance by Contributing to Sustainable Consumption and Production? Analyzing the Patterns of Influence of Environmental Performance in Japanese Manufacturing Firms. Sustain. Prod. Consum. 2020, 21, 156–169. [Google Scholar] [CrossRef]
- Le, T.T.; Ferraris, A.; Dhar, B.K. The Contribution of Circular Economy Practices on the Resilience of Production Systems: Eco-Innovation and Cleaner Production’s Mediation Role for Sustainable Development. J. Clean. Prod. 2023, 424, 138806. [Google Scholar] [CrossRef]
- Mina, G.; Bonadonna, A.; Peira, G.; Beltramo, R. How to Improve the Attractiveness of E-Bikes for Consumers: Insights from a Systematic Review. J. Clean. Prod. 2024, 442, 140957. [Google Scholar] [CrossRef]
- Cheng, L.; Peng, P.; Huang, P.; Zhang, M.; Meng, X.; Lu, W. Leveraging Evolutionary Game Theory for Cleaner Production: Strategic Insights for Sustainable Energy Markets, Electric Vehicles, and Carbon Trading. J. Clean. Prod. 2025, 512, 145682. [Google Scholar] [CrossRef]
- Hegab, H.; Shaban, I.; Jamil, M.; Khanna, N. Toward Sustainable Future: Strategies, Indicators, and Challenges for Implementing Sustainable Production Systems. Sustain. Mater. Technol. 2023, 36, e00617. [Google Scholar] [CrossRef]
- Tseng, M.L.; Chiu, A.S.F.; Liu, G.; Jantaralolica, T. Circular Economy Enables Sustainable Consumption and Production in Multi-Level Supply Chain System. Resour. Conserv. Recycl. 2020, 154, 104601. [Google Scholar] [CrossRef]
- Halter, F.; Wietschel, L.; Thorenz, A.; Tuma, A. Techno-Sustainable Analysis of Circular Economy-Indicators for Corporate Supply Chains. J. Clean. Prod. 2025, 503, 145078. [Google Scholar] [CrossRef]
- Mishra, R.; Singh, R.K.; Subramanian, N. Exploring the Relationship between Environmental Collaboration and Business Performance with Mediating Effect of Responsible Consumption and Production. Bus. Strategy Environ. 2023, 32, 2136–2154. [Google Scholar] [CrossRef]
- De Felice, F.; Rehman, M.; Petrillo, A.; Ortiz Barrios, M.A.; Baffo, I. Integrating IoT and Circular Economy in Textile Supply Chains: A Closed-Loop Model for Sustainable Production Using Recycled PET and Spent Coffee Grounds. J. Clean. Prod. 2025, 501, 145277. [Google Scholar] [CrossRef]
- Gunawan, J.; Permatasari, P.; Tilt, C. Sustainable Development Goal Disclosures: Do They Support Responsible Consumption and Production? J. Clean. Prod. 2020, 246, 118989. [Google Scholar] [CrossRef]
- Solis, M.; Tonini, D.; Scheutz, C.; Napolano, L.; Biganzoli, F.; Huygens, D. Contribution of Waste Management to a Sustainable Textile Sector. Waste Manag. 2024, 189, 389–400. [Google Scholar] [CrossRef] [PubMed]
- Hassan, S.A.; Abbas, M.; Mujahid, W.; Ahmed, W.; Ahmad, S.; Maan, A.A.; Shehzad, A.; Bhat, Z.F.; Aadil, R.M. Utilization of Cereal-Based Husks to Achieve Sustainable Development Goals: Treatment of Wastewater, Biofuels, and Biodegradable Packaging. Trends Food Sci. Technol. 2023, 140, 104166. [Google Scholar] [CrossRef]
- Valenzuela-Fernández, L.; Escobar-Farfán, M. Zero-Waste Management and Sustainable Consumption: A Comprehensive Bibliometric Mapping Analysis. Sustainability 2022, 14, 16269. [Google Scholar] [CrossRef]
- De las Heras, A.; Relinque-Medina, F.; Zamora-Polo, F.; Luque-Sendra, A. Analysis of the Evolution of the Sharing Economy towards Sustainability. Trends Transform. Concept. J. Clean. Prod. 2021, 291, 125227. [Google Scholar] [CrossRef]
- Mont, O.; Curtis, S.K.; Voytenko Palgan, Y. Organisational Response Strategies to COVID-19 in the Sharing Economy. Sustain. Prod. Consum. 2021, 28, 52–70. [Google Scholar] [CrossRef]
- Razeghian, M.; Weber, T.A. Strategic Durability with Sharing Markets. Sustain. Prod. Consum. 2019, 19, 79–96. [Google Scholar] [CrossRef]
- Jiménez Encarnación, D.; Metheney, E.A.; Thuvander, L.; Kalmykova, Y.; Rosado, L. Revealing Patterns in Household Product Consumption and Sharing: An Approach to Support Urban Governance towards a Sustainable Sharing Economy. Sustain. Prod. Consum. 2024, 45, 244–264. [Google Scholar] [CrossRef]
- Netter, S.; Pedersen, E.R.G.; Lüdeke-Freund, F. Sharing Economy Revisited: Towards a New Framework for Understanding Sharing Models. J. Clean. Prod. 2019, 221, 224–233. [Google Scholar] [CrossRef]
- Gupta, D.P.; Chauhan, P.S. Mapping Intellectual Structure and Sustainability Claims of Sharing Economy Research—A Literature Review. Sustain. Prod. Consum. 2021, 25, 347–362. [Google Scholar] [CrossRef]
- Boar, A.; Bastida, R.; Marimon, F. A Systematic Literature Review. Relationships between the Sharing Economy, Sustainability and Sustainable Development Goals. Sustainability 2020, 12, 6744. [Google Scholar] [CrossRef]
- Chang, C.L.; Fang, M. Impact of a Sharing Economy and Green Energy on Achieving Sustainable Economic Development: Evidence from a Novel NARDL Model. J. Innov. Knowl. 2023, 8, 100297. [Google Scholar] [CrossRef]
- Niu, S.; Xi, Y.; Li, Y. Sustainable Supply Chain Operations Driven by ‘Remanufacturing + Product Sharing’: Operation Mode Selection and Decision Optimisation. Int. J. Prod. Res. 2024, 62, 6573–6597. [Google Scholar] [CrossRef]
- Dogru, T.; Mody, M.; Suess, C.; Line, N.; Bonn, M. Airbnb 2.0: Is It a Sharing Economy Platform or a Lodging Corporation? Tour Manag. 2020, 78, 104049. [Google Scholar] [CrossRef]
- Jiménez, J.L.; Ortuño, A.; Pérez-Rodríguez, J.V. How Does AirBnb Affect Local Spanish Tourism Markets? Empir. Econ. 2022, 62, 2515–2545. [Google Scholar] [CrossRef]
- Li, H.; Srinivasan, K. Competitive Dynamics in the Sharing Economy: An Analysis in the Context of Airbnb and Hotels. Mark. Sci. 2019, 38, 365–391. [Google Scholar] [CrossRef]
- Wang, J.; Wang, C. Analysis of Airbnb’s Green User Emotional Characteristics: How Do Human, Geographical, Housing, and Environmental Factors Influence Green Consumption? Front. Environ. Sci. 2022, 10, 993677. [Google Scholar] [CrossRef]
- Gao, Y.; Chen, J. The Risk Reduction and Sustainable Development of Shared Transportation: The Chinese Online Car-Hailing Policy Evaluation in the Digitalization Era. Sustainability 2019, 11, 2596. [Google Scholar] [CrossRef]
- Li, M.; Zeng, Z.; Wang, Y. An Innovative Car Sharing Technological Paradigm towards Sustainable Mobility. J. Clean. Prod. 2021, 288, 125626. [Google Scholar] [CrossRef]
- Qian, L.; Pang, Z.; Soopramanien, D. Influences of Car Sharing and Car License Plate Lottery Policy on Consumer Preference and Accessibility in Urban Mobility System: A Stated Choice Experiment in Beijing. J. Clean. Prod. 2022, 362, 132505. [Google Scholar] [CrossRef]
- Zhang, Y.; Huang, M.; Tian, L.; Jin, D.; Cai, G. Build or Join a Sharing Platform? The Choice of Manufacturer’s Sharing Mode. Int. J. Prod. Econ. 2021, 231, 107811. [Google Scholar] [CrossRef]
- Ye, F.; Ni, D.; Li, K.W. Competition between Manufacturers and Sharing Economy Platforms: An Owner Base and Sharing Utility Perspective. Int. J. Prod. Econ. 2021, 234, 108022. [Google Scholar] [CrossRef]
- Guan, H.; Geng, X.; Gurnani, H. Peer-to-Peer Sharing Platforms with Quality Differentiation: Manufacturer’s Strategic Decision under Sharing Economy. Prod. Oper. Manag. 2023, 32, 485–500. [Google Scholar] [CrossRef]
- Li, Y.; Bai, X.; Xue, K. Business Modes in the Sharing Economy: How Does the OEM Cooperate with Third-Party Sharing Platforms? Int. J. Prod. Econ. 2020, 221, 107467. [Google Scholar] [CrossRef]
- Pérez-Moure, H.; Lampón, J.F.; Velando-Rodriguez, M.E.; Rodríguez-Comesaña, L. Revolutionizing the Road: How Sustainable, Autonomous, and Connected Vehicles Are Changing Digital Mobility Business Models. Eur. Res. Manag. Bus. Econ. 2023, 29, 100230. [Google Scholar] [CrossRef]
- He, W.; Hao, X. Competition and Welfare Effects of Introducing New Products into the New Energy Vehicle Market: Empirical Evidence from Tesla’s Entry into the Chinese Market. Transp. Res. Part A Policy Pract. 2023, 174, 103730. [Google Scholar] [CrossRef]
- Mao, G.; Hou, T.; Liu, X.; Zuo, J.; Kiyawa, A.H.I.; Shi, P.; Sandhu, S. How Can Bicycle-Sharing Have a Sustainable Future? A Research Based on Life Cycle Assessment. J. Clean. Prod. 2021, 282, 125081. [Google Scholar] [CrossRef]
- Ferrari, G.; Tan, Y.; Diana, P.; Palazzo, M. The Platformisation of Cycling—The Development of Bicycle-Sharing Systems in China: Innovation, Urban and Social Regeneration and Sustainability. Sustainability 2024, 16, 5011. [Google Scholar] [CrossRef]
- Leung, X.Y.; Xue, L.; Wen, H. Framing the Sharing Economy: Toward a Sustainable Ecosystem. Tour Manag. 2019, 71, 44–53. [Google Scholar] [CrossRef]
- Cheng, B.; Li, J.; Su, H.; Lu, K.; Chen, H.; Huang, J. Life Cycle Assessment of Greenhouse Gas Emission Reduction through Bike-Sharing for Sustainable Cities. Sustain. Energy Technol. Assess. 2022, 53, 102789. [Google Scholar] [CrossRef]
- Zhu, J.; Lin, N.; Zhu, H.; Liu, X. Role of Sharing Economy in Energy Transition and Sustainable Economic Development in China. J. Innov. Knowl. 2023, 8, 100314. [Google Scholar] [CrossRef]
- Ding, L.; Feng, J.; Liao, X.; Yang, L. The Emergence of a Sharing Market: Pricing, Supply, and Consumption. Int. J. Electron. Commer. 2022, 26, 149–173. [Google Scholar] [CrossRef]
- Liu, Z.; Xiao, Y.; Feng, J. Manufacturer’s Sharing Servitization Transformation and Product Pricing Strategy. Sustainability 2021, 13, 1503. [Google Scholar] [CrossRef]
- Tao, J.; Zhou, Z. Evaluation of Potential Contribution of Dockless Bike-Sharing Service to Sustainable and Efficient Urban Mobility in China. Sustain. Prod. Consum. 2021, 27, 921–932. [Google Scholar] [CrossRef]
- Liu, L.; Sun, L.; Chen, Y.; Ma, X. Optimizing Fleet Size and Scheduling of Feeder Transit Services Considering the Influence of Bike-Sharing Systems. J. Clean. Prod. 2019, 236, 117550. [Google Scholar] [CrossRef]
- Dong, Z.; Fan, Z.P.; Wang, N. An Analysis of Pricing Strategy for Bike-Sharing Services: The Role of the Inconvenience Cost. Transp. Res. E Logist. Transp. Rev. 2023, 175, 103146. [Google Scholar] [CrossRef]
- Cui, L.; Yang, K.; Lei, Z.; Lim, M.K.; Hou, Y. Exploring Stakeholder Collaboration Based on the Sustainability Factors Affecting the Sharing Economy. Sustain. Prod. Consum. 2022, 30, 218–232. [Google Scholar] [CrossRef]
- Zhao, D.; Ong, G.P.; Wang, W.; Hu, X.J. Effect of Built Environment on Shared Bicycle Reallocation: A Case Study on Nanjing, China. Transp. Res. Part A Policy Pract. 2019, 128, 73–88. [Google Scholar] [CrossRef]
- Chen, R. “Bike Litter” and Obligations of the Platform Operators: Lessons from China’s Dockless Sharing Bikes. Comput. Law. Secur. Rev. 2019, 35, 105317. [Google Scholar] [CrossRef]
- Zhou, Z.; Li, H.; Zhang, A. Does Bike Sharing Increase House Prices? Evidence from Micro-Level Data and the Impact of COVID-19. J. Real. Estate Financ. Econ. 2024, 69, 621–650. [Google Scholar] [CrossRef]
- Sun, Q.; Chen, H.; Long, R.; Yang, J. Who Will Pay for the “Bicycle Cemetery”? Evolutionary Game Analysis of Recycling Abandoned Shared Bicycles under Dynamic Reward and Punishment. Eur. J. Oper. Res. 2023, 305, 917–929. [Google Scholar] [CrossRef]
- Laa, B.; Emberger, G. Bike Sharing: Regulatory Options for Conflicting Interests—Case Study Vienna. Transp. Policy 2020, 98, 148–157. [Google Scholar] [CrossRef]
- Wang, R.; Wang, S.; Deng, G. Government Regulation Strategy for the Maintenance of Bike Sharing. Kybernetes 2024, 53, 1814–1832. [Google Scholar] [CrossRef]
- Guo, T.; Yang, J.; He, L.; Tang, K. Emerging Technologies and Methods in Shared Mobility Systems Layout Optimization of Campus Bike-Sharing Parking Spots. J. Adv. Transp. 2020. [Google Scholar] [CrossRef]
- Jamšek, S.; Culiberg, B. Introducing a Three-Tier Sustainability Framework to Examine Bike-Sharing System Use: An Extension of the Technology Acceptance Model. Int. J. Consum. Stud. 2020, 44, 140–150. [Google Scholar] [CrossRef]
- Gao, S.; Li, Y.; Guo, H. Understanding the Adoption of Bike Sharing Systems: By Combining Technology Diffusion Theories and Perceived Risk. J. Hosp. Tour. Technol. 2019, 10, 494–508. [Google Scholar] [CrossRef]
- Ministry of Transport of the People’s Republic of China. Beijing’s Bicycle Sharing Market Regulatory Policies; Ministry of Transport of the People’s Republic of China: Beijing, China, 2022.
- Cao, Y.; Shen, D. Contribution of Shared Bikes to Carbon Dioxide Emission Reduction and the Economy in Beijing. Sustain. Cities Soc. 2019, 51, 101749. [Google Scholar] [CrossRef]
- Tan, X.; Zhu, X.; Li, Q.; Li, L.; Chen, J. Tidal Phenomenon of the Dockless Bike-Sharing System and Its Causes: The Case of Beijing. Int. J. Sustain. Transp. 2022, 16, 287–300. [Google Scholar] [CrossRef]
- Beijing Transport Institute. Beijing Transport Annual Report 2023; Beijing Transport Institute: Beijng, China, 2024. [Google Scholar]
- Beijing Municipal Commission of Transportation Public. Announcement on the Operation, Management and Supervision of the Internet Rental Bicycle Industry in 2022; Beijing Municipal Commission of Transportation Public: Beijng, China, 2023.
- CAICT. China Bike-Sharing Industry Development Report 2019; CAICT: Beijng, China, 2019. [Google Scholar]
- CIRCN. China Bicycle Manufacturing Market Research and Development Trend Analysis Report; CIRCN: New York, NY, USA, 2024. [Google Scholar]
- Sun, S.; Wang, Z.; Wang, W. Dockless or Docked: Which Bike-Sharing Mode Is More Environmentally Friendly for the City? Current Evidence from China’s Major Cities. Cities 2024, 147, 104816. [Google Scholar] [CrossRef]
- Sun, S. How Does the Collaborative Economy Advance Better Product Lifetimes? A Case Study of Free-Floating Bike Sharing. Sustainability 2021, 13, 1434. [Google Scholar] [CrossRef]
- ISO 14044; Environmental Management Life Cycle Assessment-Requirements and Guidelines. International Organization for Standardization: Geneva, Switzerland, 2006.
- ISO 14040; Environmental Management-Life Cycle Assessment. Principles and Framework; International Organization for Standardization: Geneva, Switzerland, 2006.
- Huijbregts, M.A.J.; Steinmann, Z.J.N.; Elshout, P.M.F.; Stam, G.; Verones, F.; Vieira, M.; Zijp, M.; Hollander, A.; van Zelm, R. ReCiPe2016: A Harmonised Life Cycle Impact Assessment Method at Midpoint and Endpoint Level. Int. J. Life Cycle Assess. 2017, 22, 138–147. [Google Scholar] [CrossRef]
- Sun, S.; Ertz, M. Can Shared Micromobility Programs Reduce Greenhouse Gas Emissions: Evidence from Urban Transportation Big Data. Sustain. Cities Soc. 2022, 85, 104045. [Google Scholar] [CrossRef]
- Beijing Transport Institute. Beijing Transport Annual Report 2018; Beijing Transport Institute: Beijing, China, 2019. [Google Scholar]
- Beijing Municipal Commission of Transportation Public Announcement on the Operation, Management and Supervision of the Internet Rental Bicycle Industry in 2023; Beijing Municipal Commission of Transportation Public: Beijing, China, 2024.
- Intergovernmental Panel on Climate Change. Guidelines for National Greenhouse Gas Inventories. Prepared by the National Greenhouse. Gas Inventories Programme; Institute for Global Environmental Strategies: Tokyo, Japan, 2006. [Google Scholar]
- Sun, S.; Ertz, M. Environmental Impact of Mutualized Mobility: Evidence from a Life Cycle Perspective. Sci. Total Environ. 2021, 772, 145014. [Google Scholar] [CrossRef]
- Sun, S.; Wang, Z.; Wang, W. Can Free-Floating Electric Bike Sharing Promote More Sustainable Urban Mobility? Evidence from a Life Cycle Environmental Impact Assessment. J. Clean. Prod. 2023, 415, 137862. [Google Scholar] [CrossRef]
- Wernet, G.; Bauer, C.; Steubing, B.; Reinhard, J.; Moreno-Ruiz, E.; Weidema, B. The Ecoinvent Database Version 3 (Part I): Overview and Methodology. Int. J. Life Cycle Assess. 2016, 21, 1218–1230. [Google Scholar] [CrossRef]
- Sun, S.; Ertz, M. Contribution of Bike-Sharing to Urban Resource Conservation: The Case of Free-Floating Bike-Sharing. J. Clean. Prod. 2021, 280, 124416. [Google Scholar] [CrossRef]
- Langshaw, L.; Ainalis, D.; Acha, S.; Shah, N.; Stettler, M.E.J. Environmental and Economic Analysis of Liquefied Natural Gas (LNG) for Heavy Goods Vehicles in the UK: A Well-to-Wheel and Total Cost of Ownership Evaluation. Energy Policy 2020, 137, 111161. [Google Scholar] [CrossRef]
- Zhang, C.; Yan, X.; Nie, J. Economic Analysis of Whole-County PV Projects in China Considering Environmental Benefits. Sustain. Prod. Consum. 2023, 40, 516–531. [Google Scholar] [CrossRef]
- Diao, M.; Song, K.; Shi, S.; Zhu, Y.; Liu, B. The Environmental Benefits of Dockless Bike Sharing Systems for Commuting Trips. Transp. Res. D Transp. Environ. 2023, 124, 103959. [Google Scholar] [CrossRef]
- Lv, G.; Zheng, S.; Chen, H. Spatiotemporal Assessment of Carbon Emission Reduction by Shared Bikes in Shenzhen, China. Sustain. Cities Soc. 2024, 100, 105011. [Google Scholar] [CrossRef]
- Zhang, X.; Chen, Y.; Zhong, Y. Spatial and Temporal Characteristic Analysis of Imbalance Usage in the Hangzhou Public Bicycle System. ISPRS Int. J. Geoinf. 2021, 10, 637. [Google Scholar] [CrossRef]
- Chen, M.; Sun, Y.; Waygood, E.O.D.; Wang, D.; Liu, D. Will They Ride Them Back? User Behavior on Public Bikesharing Schemes: Case Study of Hangzhou, China. Int. J. Sustain. Transp. 2023, 17, 615–625. [Google Scholar] [CrossRef]
- Chen, Y.; Zhang, Y.; Coffman, D.; Mi, Z. An Environmental Benefit Analysis of Bike Sharing in New York City. Cities 2022, 121, 103475. [Google Scholar] [CrossRef]
- Chen, Y.; Zeng, D.; Deveci, M.; Coffman, D. Life Cycle Analysis of Bike Sharing Systems: A Case Study of Washington D.C. Environ. Impact Assess. Rev. 2024, 106, 107455. [Google Scholar] [CrossRef]
- Fukushige, T.; Fitch, D.T.; Handy, S. Estimating Vehicle-Miles Traveled Reduced from Dock-Less E-Bike-Share: Evidence from Sacramento, California. Transp. Res. D Transp. Environ. 2023, 117, 103671. [Google Scholar] [CrossRef]
- Comi, A.; Polimeni, A. Assessing Potential Sustainability Benefits of Micromobility: A New Data Driven Approach. Eur. Transp. Res. Rev. 2024, 16, 19. [Google Scholar] [CrossRef]
- Xanthopoulos, S.; van der Tuin, M.; Sharif Azadeh, S.; Correia, G.H.d.A.; van Oort, N.; Snelder, M. Optimization of the Location and Capacity of Shared Multimodal Mobility Hubs to Maximize Travel Utility in Urban Areas. Transp. Res. Part A Policy Pract. 2024, 179, 103934. [Google Scholar] [CrossRef]
- Gao, K.; Jia, R.; Liao, Y.; Liu, Y.; Najafi, A.; Attard, M. Big-Data-Driven Approach and Scalable Analysis on Environmental Sustainability of Shared Micromobility from Trip to City Level Analysis. Sustain. Cities Soc. 2024, 115, 105803. [Google Scholar] [CrossRef]
- Silm, S.; Tominga, A.; Saidla, K.; Poom, A.; Tammaru, T. Socio-Economic and Residential Differences in Urban Modality Styles Based on a Long-Term Smartphone Experiment. J. Transp. Geogr. 2024, 115, 103810. [Google Scholar] [CrossRef]
- Teixeira, J.F.; Silva, C.; Moura e Sá, F. Empirical Evidence on the Impacts of Bikesharing: A Literature Review. Transp. Rev. 2021, 41, 329–351. [Google Scholar] [CrossRef]
- Fan, Z.; Harper, C.D. Congestion and Environmental Impacts of Short Car Trip Replacement with Micromobility Modes. Transp. Res. D Transp. Environ. 2022, 103, 103173. [Google Scholar] [CrossRef]
- Castillo-Manzano, J.I.; Castro-Nuño, M.; López-Valpuesta, L. Analyzing the Transition from a Public Bicycle System to Bicycle Ownership: A Complex Relationship. Transp. Res. D Transp. Environ. 2015, 38, 15–26. [Google Scholar] [CrossRef]
- Liu, B.; Chen, Y.; Yang, H.; Peng, B.; Luo, K. Optimal Service Life Analysis of Shared Bicycles under ‘Three-Year Mandatory Scrapping’ Policy. Sustain. Prod. Consum. 2022, 30, 518–526. [Google Scholar] [CrossRef]
- Liu, L.; Liu, Z.; Yang, Y.; Shi, B.; Liu, X. Evolutionary Game Analysis of Abandoned-Bike-Sharing Recycling: Impact of Recycling Subsidy Policy. Sustainability 2023, 15, 8834. [Google Scholar] [CrossRef]
- Rong, K.; Li, B.; Peng, W.; Zhou, D.; Shi, X. Sharing Economy Platforms: Creating Shared Value at a Business Ecosystem Level. Technol. Forecast. Soc. Chang. 2021, 169, 120804. [Google Scholar] [CrossRef]
- Chambers, P. O Bike in Melbourne: A Plea for More Scepticism about Disruption and Capital, Based on What We Can Know about One Dockless Bike Scheme. Transp. Res. Part A Policy Pract. 2020, 140, 72–80. [Google Scholar] [CrossRef]
- Venkateswaran, V.; S Kumar, D.; Gupta, D. ‘To Trust or Not’: Impact of Camouflage Strategies on Trust in the Sharing Economy. J. Bus. Res. 2021, 136, 110–126. [Google Scholar] [CrossRef]
- Gu, W.; Li, M.; Wang, C.; Shang, J.; Wei, L. Strategic Sourcing Selection for Bike-Sharing Rebalancing: An Evolutionary Game Approach. Transp. Res. E Logist. Transp. Rev. 2021, 156, 102522. [Google Scholar] [CrossRef]
- Schneckenberg, D.; Roth, S.; Velamuri, V.K. Deparadoxification and Value Focus in Sharing Ventures: Concealing Paradoxes in Strategic Decision-Making. J. Bus. Res. 2023, 162, 113883. [Google Scholar] [CrossRef]
- Yang, H.; Hu, Y.; Qiao, H.; Wang, S.; Jiang, F. Conflicts between Business and Government in Bike Sharing System. Int. J. Confl. Manag. 2020, 31, 463–487. [Google Scholar] [CrossRef]
- Xiao, W.; Cao, Y. The Manufacturer’s Strategic Involvement in Product Sharing. Comput. Ind. Eng. 2023, 180, 109253. [Google Scholar] [CrossRef]
- Tian, L.; Jiang, B.; Xu, Y. Manufacturer’s Entry in the Product-Sharing Market. Manuf. Serv. Oper. Manag. 2021, 23, 553–568. [Google Scholar] [CrossRef]
- Wang, K.; Qian, X.; Fitch, D.T.; Lee, Y.; Malik, J.; Circella, G. What Travel Modes Do Shared E-Scooters Displace? A Review of Recent Research Findings. Transp. Rev. 2023, 43, 5–31. [Google Scholar] [CrossRef]
- Sun, Z.; Wang, Y.; Zhou, H.; Jiao, J.; Overstreet, R.E. Travel Behaviours, User Characteristics, and Social-Economic Impacts of Shared Transportation: A Comprehensive Review. Int. J. Logist. Res. Appl. 2021, 24, 51–78. [Google Scholar] [CrossRef]
- Guo, Y.; Yang, L.; Chen, Y. Bike Share Usage and the Built Environment: A Review. Front. Public Health 2022, 10, 848169. [Google Scholar] [CrossRef]
- Zhang, F.; Liu, W. An Economic Analysis of Integrating Bike Sharing Service with Metro Systems. Transp. Res. D Transp. Environ. 2021, 99, 103008. [Google Scholar] [CrossRef]
- Choi, S.J.; Jiao, J.; Lee, H.K.; Farahi, A. Combatting the Mismatch: Modeling Bike-Sharing Rental and Return Machine Learning Classification Forecast in Seoul, South Korea. J. Transp. Geogr. 2023, 109, 103587. [Google Scholar] [CrossRef]
- Bahadori, M.S.; Gonçalves, A.B.; Moura, F. A Systematic Review of Station Location Techniques for Bicycle-Sharing Systems Planning and Operation. ISPRS Int. J. Geo-Inf. 2021, 10, 554. [Google Scholar] [CrossRef]
- Chen, X. Predicting College Students’ Bike-Sharing Intentions Based on the Theory of Planned Behavior. Front. Psychol. 2022, 13, 836983. [Google Scholar] [CrossRef]
- Bourne, J.E.; Cooper, A.R.; Kelly, P.; Kinnear, F.J.; England, C.; Leary, S.; Page, A. The Impact of E-Cycling on Travel Behaviour: A Scoping Review. J. Transp. Health 2020, 19, 100910. [Google Scholar] [CrossRef] [PubMed]
- Eren, E.; Uz, V.E. A Review on Bike-Sharing: The Factors Affecting Bike-Sharing Demand. Sustain. Cities Soc. 2020, 54, 101882. [Google Scholar] [CrossRef]
| Disclaimer/Publisher’s Note: The statements, opinions and data contained in all publications are solely those of the individual author(s) and contributor(s) and not of MDPI and/or the editor(s). MDPI and/or the editor(s) disclaim responsibility for any injury to people or property resulting from any ideas, methods, instructions or products referred to in the content. |
© 2025 by the authors. Licensee MDPI, Basel, Switzerland. This article is an open access article distributed under the terms and conditions of the Creative Commons Attribution (CC BY) license (https://creativecommons.org/licenses/by/4.0/).


