Article

Study on the Temporal and Spatial Evolution of Market Integration and Influencing Factors in the Yellow River Basin

by
Chao Teng
1,2,
Xumin Jiao
1,2,
Zhenxing Jin
1,2 and
Chengxin Wang
1,2,3,*
1
College of Geography and Environment, Shandong Normal University, Jinan 250358, China
2
Collaborative Innovation Center of Human-Nature and Green Development, Universities of Shandong, Jinan 250358, China
3
Key Research Institute of Yellow River Civilization and Sustainable Development & Yellow River Civilization by Provincial and Ministerial Co-Construction of Collaborative Innovation Center, Henan University, Kaifeng 475001, China
*
Author to whom correspondence should be addressed.
Sustainability 2025, 17(15), 6920; https://doi.org/10.3390/su17156920
Submission received: 21 June 2025 / Revised: 19 July 2025 / Accepted: 26 July 2025 / Published: 30 July 2025

Abstract

Enhancing market integration levels is crucial for advancing sustainable regional collaborative development and achieving ecological protection and high-quality development goals within the Yellow River Basin, fostering a balance between economic efficiency, social equity, and environmental resilience. This study analyzed the retail price data of goods from prefecture-level cities in the Yellow River Basin from 2010 to 2022, employing the relative price method to measure the market integration index. Additionally, it examined the temporal and spatial evolution patterns and driving factors using the Dagum Gini coefficient and panel regression models. The results indicate the following. (1) The market integration index of the Yellow River Basin shows a fluctuating upward trend, with an average annual growth rate of 9.8%. The spatial pattern generally reflects a situation where the east is relatively high and the west is relatively low, as well as the south being higher than the north. (2) Regional disparities are gradually diminishing, with the overall Gini coefficient decreasing from 0.153 to 0.104. However, internal differences within the downstream and midstream areas have become prominent, and contribution rate analysis reveals that super-variable density has replaced between-group disparities as the primary source. (3) Upgrading the industrial structure and enhancing the level of economic development are the core driving forces, while financial support and digital infrastructure significantly accelerate the integration process. Conversely, the level of openness exhibits a phase-specific negative impact. We propose policy emphasizing the need to strengthen development in the upper reach of the Yellow River Basin, further improve interregional collaborative innovation mechanisms, and enhance cross-regional coordination among multicenter network nodes.

1. Introduction

The Yellow River Basin is a crucial ecological barrier and strategic region in China [1], supporting 30% of the national population and contributing approximately 25% of the GDP. It is a principal grain-producing area and a region abundant in energy resources. However, the basin has long faced challenges such as unbalanced development and hindered factor mobility, which constrain high-quality development. In 2019, ecological protection and high-quality development of the yellow river basin was elevated to a national strategy. The “Outline of the plan for ecological protection and high-quality development of the Yellow River Basin,” promulgated on 8 October 2021, clearly states: “Strengthen the construction of market integration in the Yellow River Basin, promote the market-oriented reform of factors such as land and energy, improve the mechanism for forming factor prices, and enhance resource allocation efficiency.” Furthermore, the “Opinion on accelerating the construction of a national unified market,” issued on 10 April 2022, emphasizes: “Building a national unified market is a foundational support and intrinsic requirement for establishing a new development pattern.” Therefore, advancing market integration in the Yellow River Basin is essential not only for sustainable regional coordination but also critical for implementing national strategies oriented toward long-term ecological and economic sustainability.
From the perspective of market integration evolution, Balassa (1961) first systematized integration stages in customs union theory, emphasizing the progressive transition from trade liberalization to complete economic integration [2]. North (1990) identified institutional synergy as the core mechanism for reducing transaction costs [3]. With the emergence of new economic geography, Krugman (1990) developed the center–periphery model [4], revealing how infrastructure and economies of scale spatially interact to shape market integration, thereby establishing theoretical foundations for empirical research. The essence of market integration lies in eliminating institutional barriers to promote interregional flows of goods and factors, ultimately achieving optimal resource allocation through dynamic processes. As integration strategies advance, scholarly research on market integration has expanded significantly. A literature review reveals three primary research foci. The first is measuring market integration levels. Standard approaches include the production-based [5], price-based [6,7], and trade flow methods [8], with emerging techniques gaining application [9,10,11]. While the production-based method gauges segmentation through regional industrial isomorphism—computationally simple, yet limited by broad industrial classifications, potentially overestimating segmentation—the trade flow approach evaluates barriers through interregional trade volumes, but suffers from data discontinuity, obscuring annual fluctuations. Conversely, the price-based method reflects segmentation via interregional price differentials, offering methodological advantages that establish it as the academic mainstream. Research subjects range from nationwide analyses [12] to specific regions like the Yangtze River Delta (most extensively studied) [13,14], Beijing–Tianjin–Hebei urban agglomeration [15], and Chengdu–Chongqing region [16]. Second, empirical studies on market integration determinants examine how economic development, geographic distance, industrial structure, infrastructure, financial systems, and institutional environments influence integration through transaction cost reduction, scale economies, or incentive restructuring [17,18,19,20]. Third, research on integration effects bifurcates into studies evaluating integration levels per se [21] and those assessing integration policies [22]. While early work emphasized economic growth impacts [15], recent scholarly focus has progressively extended to dimensions such as environmental ecology [23], social equity [24], and common prosperity [25].
Despite extensive research and increasingly diverse methodologies, significant gaps persist in market integration studies focusing specifically on the strategically vital Yellow River Basin. The existing literature exhibits pronounced selective focus, predominantly analyzing economically advanced regions with mature market mechanisms and established integration practices, such as the Yangtze River Delta, Pearl River Delta, Yangtze Economic Belt, and Beijing–Tianjin–Hebei region. The theoretical frameworks and their underlying assumptions, including efficient factor allocation, mature market institutions, and lower administrative barriers, encounter challenges when applied to regions characterized by distinctive economic structures, pronounced institutional transformation, and marked developmental imbalances [26]. This analytical bias results in theories inadequately capturing China’s regional development diversity and complexity. Furthermore, effective analytical frameworks and governance pathways remain underdeveloped for emerging phenomena, notably the siphon effect and digital divide, which may impede integration or exacerbate internal disparities amid regional development gaps and uneven digitalization [27]. Such limitations constrain targeted implementation of coordinated development strategies in unique regions like the Yellow River Basin. Consequently, understanding its distinctive integration dynamics, barriers, and pathways holds direct and significant implications for evidence-based policy formulation.
Addressing identified research gaps, this study centered analysis on market integration within the Yellow River Basin. Its core contributions are: (1) novelty of focus—systematically examining the entire Basin rather than developed regional clusters, revealing distinctive integration patterns; (2) theoretical advancement—integrating administrative boundary effects, resource endowment constraints, and their interactions into classical integration theory, thereby constructing a basin-aligned framework; and (3) methodological innovation—leveraging 2010–2022 retail price indices for 16 commodity categories across prefecture-level units, refining the relative price method through geographically weighted distances. Coupled with Dagum Gini coefficient decomposition, we quantify spatiotemporal evolution and regional disparity sources of market integration. Furthermore, a basin-specific panel econometric model examines unique mechanisms whereby industrial structure, economic development, and foreign trade openness affect integration. This approach enables objective assessment of current conditions and determinants while offering theoretical and empirical foundations for mitigating market segmentation, advancing sustainable development, and implementing coordinated development strategies.

2. Research Methods and Data Sources
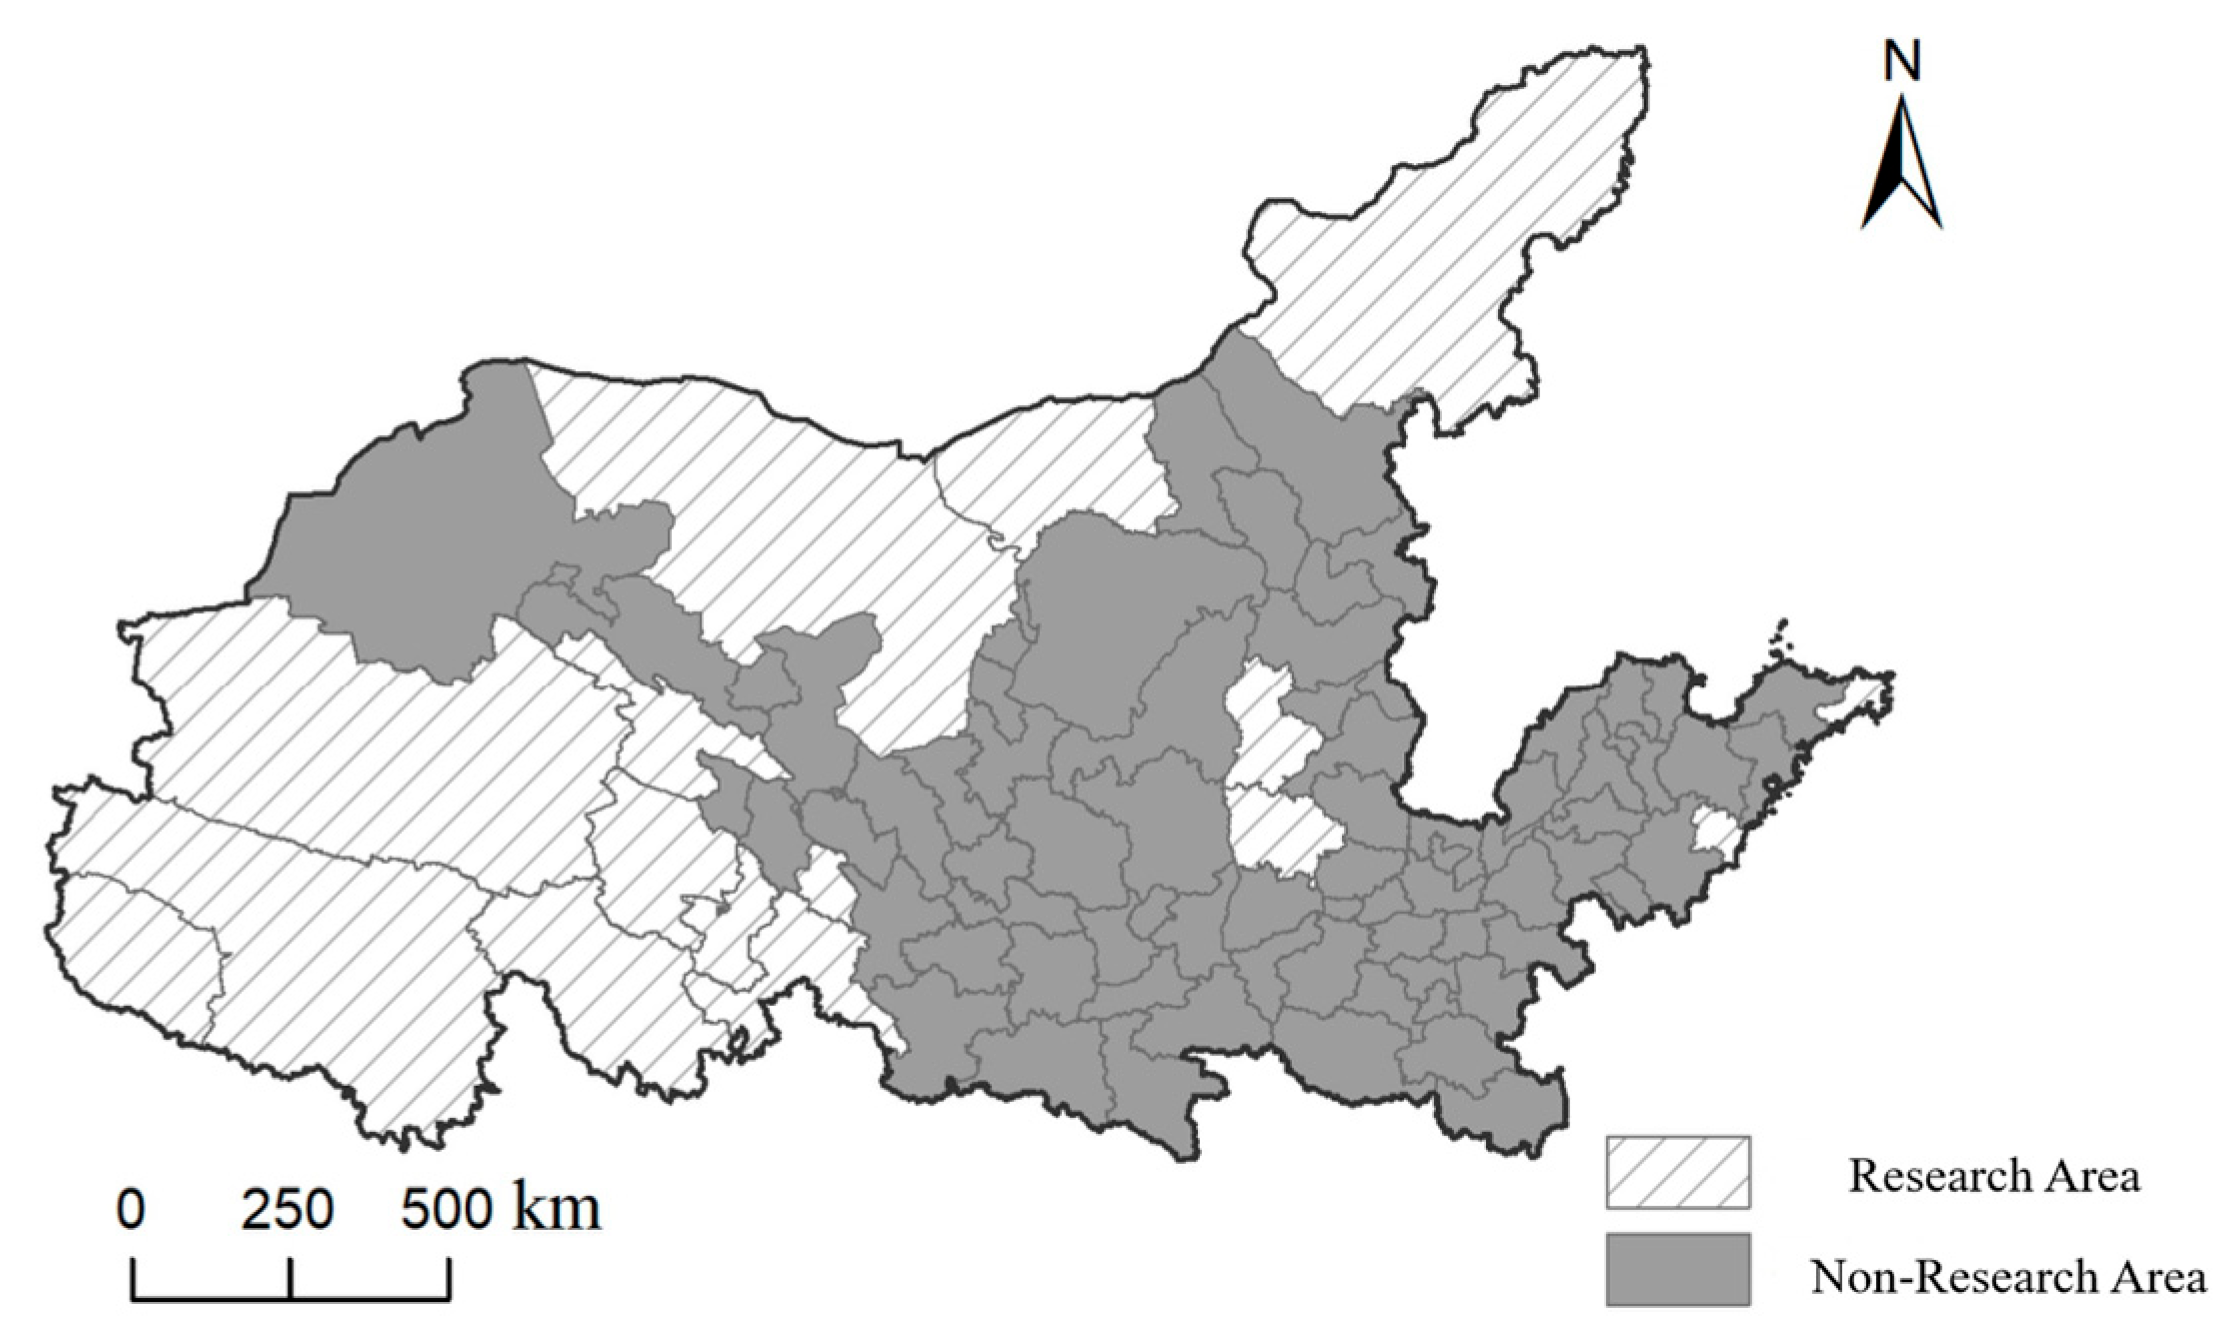
2.1. Study Area

According to the “Guiding opinions of the state council on promoting the development of the Yangtze River economic belt based on the golden waterway,” Sichuan Province has been fully integrated into the Yangtze River Economic Belt. However, the Yellow River flows through only 165 km within Sichuan, resulting in a low degree of connectivity with local economic activities. Historically, the four eastern banners of Inner Mongolia have maintained closer economic and social ties with the northeast region and have been included in the spatial framework of the Northeast Region Revitalization Plan. Therefore, the definition of the Yellow River Basin in this paper includes the other eight provinces and autonomous regions while excluding Sichuan Province and the four eastern banners of Inner Mongolia. Additionally, to ensure data availability and uniformity, the autonomous prefectures and leagues within Qinghai Province, Gansu Province, and Inner Mongolia, as well as the cities of Linfen, Lvliang, Weihai, and Rizhao—which lack long-term data—were omitted from the study. After these adjustments, a total of 76 research units were obtained. Moreover, natural boundary points were used as the basis for delineating the upper, middle, and lower reaches of the Yellow River Basin [28], as shown in Figure 1.

2.2. Methodology

2.2.1. Pricing Method

Under contemporary market economy conditions, commodity prices function as direct indicators of economic information. Narrow fluctuations in regional relative prices signal robust resource and factor mobility, corresponding to elevated market integration. Conversely, wider price dispersion indicates diminished integration. Recent scholarship confirms commodity price data comprehensively capture integration levels across both product and factor markets [29], while key commodity prices reflect regional economic stability and equilibrium [30]. Consequently, commodity prices provide an empirically valid metric for gauging regional market integration.
Given limited access to actual cross-regional commodity price data, this study adopted Mao Qilin et al.’s methodology [31], implementing logarithmic transformation of relative price indices. We subsequently assessed convergence in original price series through differential sequence convergence analysis. Following standardized relative price index protocols, we constructed a market integration index using interregional consumer goods price differentials. The calculation process employed a three-dimensional panel data structure (i.e., time, space, and commodity categories: t, m, k). The time span analyzed ranged from 2010 to 2022, while the spatial scope included cities at the prefectural level and above in the Yellow River Basin (excluding autonomous prefectures and leagues). The commodity categories consisted of 16 types, including grains, beverages and tobacco, clothing and footwear, daily necessities, fuel, traditional and Western medicines, healthcare products, books, magazines, electronic publications, textiles, and others. The specific calculation methods are outlined as follows.
Calculate the absolute values of the relative prices and determine the first differences after taking the logarithm of the price index to obtain the relative prices:
Δ Q i j t k = ln p i t k p j t k ln p i t 1 k p j t 1 k = ln p i t k p i t 1 k ln p j t k p j t 1 k
To eliminate the heterogeneity of the goods, it is necessary to center the product prices. For a specific category of goods (k), the average relative price is computed for the combinations of cities within the research area. This average is then subtracted from each value to obtain the relative price fluctuations used to calculate the variance:
q i j k = ε i j k ε - i j k = Δ Q ij k Δ Q - t k
Using this method, the relative price fluctuations between region (i) and region (j) for 16 types of goods were calculated. Subsequently, the variance in city combinations is computed, and the relative price variance is combined by city to obtain the market segmentation index for that city in comparison to other cities nationwide:
V a r q i = i j V ar q ij N
Using prefecture-level cities as the analytical scale, adjacency matrices exhibit significant limitations by considering only geographically contiguous cities, thereby failing to capture interactions between non-adjacent units. To construct panel data reflecting temporal variations in market segmentation across cities, city-pair groupings must be defined according to varying market scopes. Each city’s market segmentation index is computed as a weighted average, where weights (w) represent the inverse distances to other cities normalized by the sum of all inverse distances for that city. Subsequently, the market integration index is derived as the reciprocal of the segmentation index, quantifying regional price convergence. To prevent disproportionately small regression coefficients, the segmentation index is scaled by a factor of 100, yielding:
I n t e g i = 1 V a r q i × w i × 100

2.2.2. Dagum Gini Coefficient

This study used the Dagum Gini coefficient and its decomposition method to assess the differences in the level of market integration development in the Yellow River Basin and their sources. The formula is as follows:
G = j = 1 k h = 1 k i = 1 n j r = 1 n h y i j y h r 2 n 2 μ
In the formula, G represents the overall difference in the level of market integration within the Yellow River Basin; k = 3 indicates the three major regions—upper, middle, and lower reaches; yji and yhr denote the levels of market integration in specific prefecture-level cities within regions j and h, respectively; μ is the average level of market integration across all prefecture-level cities; and Gjj represents the Gini coefficient for region j. The Dagum Gini coefficient is an enhanced version of the traditional Gini coefficient, which can be decomposed into the within-group coefficient, between-group coefficient, and super-variable density coefficient, expressed as Dagum = Gw + Gb + Gt. The within-group coefficient Gw reflects the disparities in levels within each region, the between-group coefficient Gb reflects the disparities between regions, and the super-variable density coefficient Gt captures the phenomenon of overlap among regions, illustrating the relative disparity situation. The Dagum Gini coefficient overcomes the limitations of other methods used to measure regional disparities that cannot address issues arising from overlapping data, thereby providing a better identification of the sources of regional disparities [32].

2.2.3. Panel Model

The panel model is based on data composed of various samples (individual items) across time series (time items), integrating sample information to study the effect of the independent variable (X) on the dependent variable (Y). It is typically divided into three categories: mixed models, fixed-effect models, and random-effect models.
  • Mixed Models
The characteristic of mixed models is that the regression coefficients are the same regardless of the individual or cross section.
y i t = α + x i t + μ i t
2.
Fixed-Effect Model
The fixed-effect model can be divided into three categories:
-
Individual fixed-effect model:
y i t = λ i + k = 2 K β k x k i t + μ i t
-
Time fixed-effect model:
y i t = γ t + k = 2 K β k x k i t + μ i t
-
Two-way fixed-effect model:
y i t = λ i + γ t + k = 2 K β k x k i t + μ i t
3.
Random-Effect Model
The random-effect model treats the original (fixed) regression coefficients as random variables. The most intuitive use of random effects is to extend fixed effects to random effects. It is important to note that in this context, random effects are a conceptual population representing information from a distribution, whereas for fixed effects, the inferences we make are limited to those specific fixed (unknown) parameters.

2.3. Data Sources

Data for this study were sourced from municipal statistical yearbooks, bulletins, and the National Bureau of Statistics’ China City Statistical Yearbook and China Price Yearbook. Missing commodity price indices were handled using three approaches: (1) city-level gaps supplemented by corresponding provincial retail price indices; (2) short-term temporal gaps addressed through linear interpolation; and (3) exclusion of cities with chronic data deficiencies to ensure reliability. Crucially, the first two imputation methods apply only to short-term, non-trend-altering gaps. Robustness was verified using StataMP 16.0 by recalculating the market integration index after excluding all cities with substituted data. The results demonstrated closely aligned spatiotemporal evolution patterns and regional integration characteristics with full-sample findings, confirming conclusion stability.

3. Results

3.1. Measurement and Spatiotemporal Evolution Characteristics of Market Integration in the Yellow River Basin
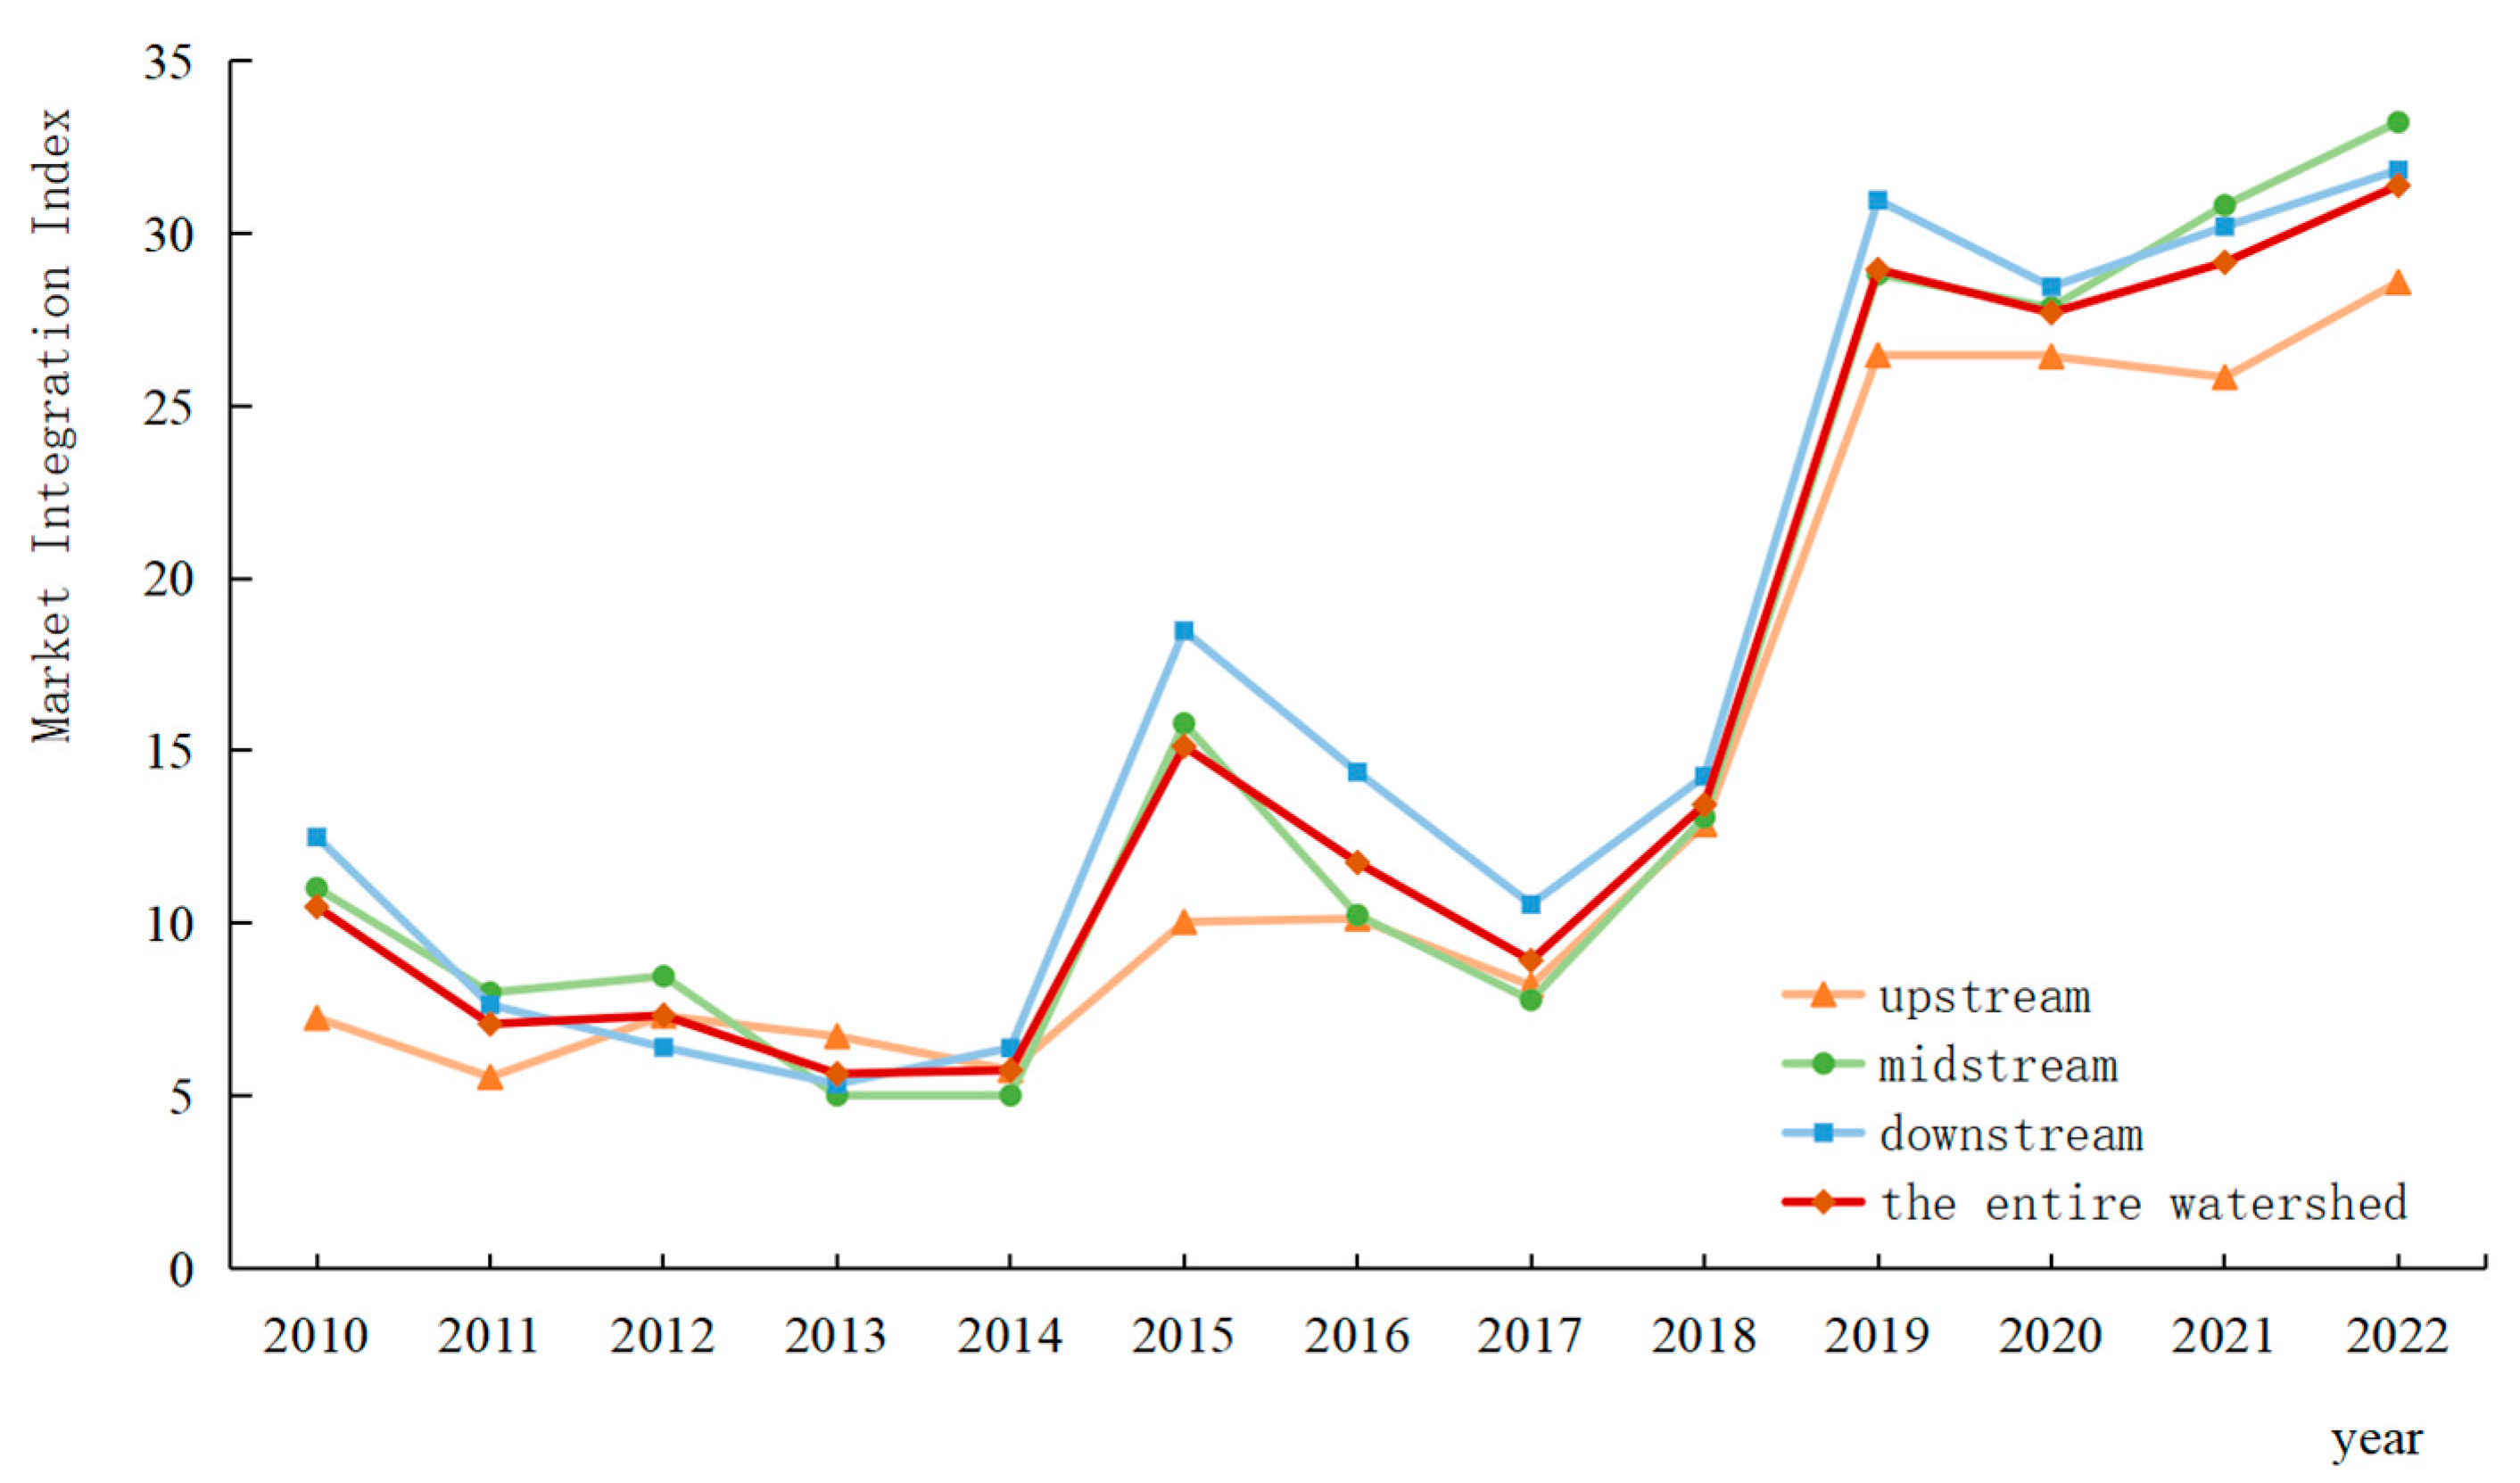
3.1.1. Basin Scale

Based on the computed market integration indices, we derived time-series data for the entire Yellow River Basin and its upper, middle, and lower reaches spanning 2010–2022. As shown in Figure 2, the basin’s market integration index demonstrates an oscillatory upward trajectory during this period, rising from 10.4838 in 2010 to 31.3803 in 2022—representing a 9.8% average annual growth rate. This progression indicates steadily advancing market integration throughout the study period. Regionally, the degree of market integration in the upper, middle, and lower reaches of the Yellow River Basin has paralleled the overall integration of the basin: the differences in the market integration processes among these reaches are relatively small, with the lower reaches demonstrating a higher degree of integration. The disparity between the upstream and downstream regions diminished from 10.1 in 2010 to 5.9 in 2022, reflecting the effectiveness of ecological protection and green development policies in facilitating the integration of marginal areas into the core market network. After 2015, the average annual growth rate of the provinces of the middle reaches increased by 12 percentage points compared to the earlier period, driven by policies that accelerated the circulation of factors through the construction of interprovincial industrial parks and logistics hubs. Catalyzed by the dual-circulation strategy and the 2020 national Yellow River strategy, downstream technological spillovers and midstream–upstream resource integration have elevated intersectional correlation coefficients from 0.65 to 0.89. This signifies the emergence of a comprehensive market integration network, now advancing into a multicenter integration phase characterized by midstream hub dominance and deepened upstream–downstream linkages.

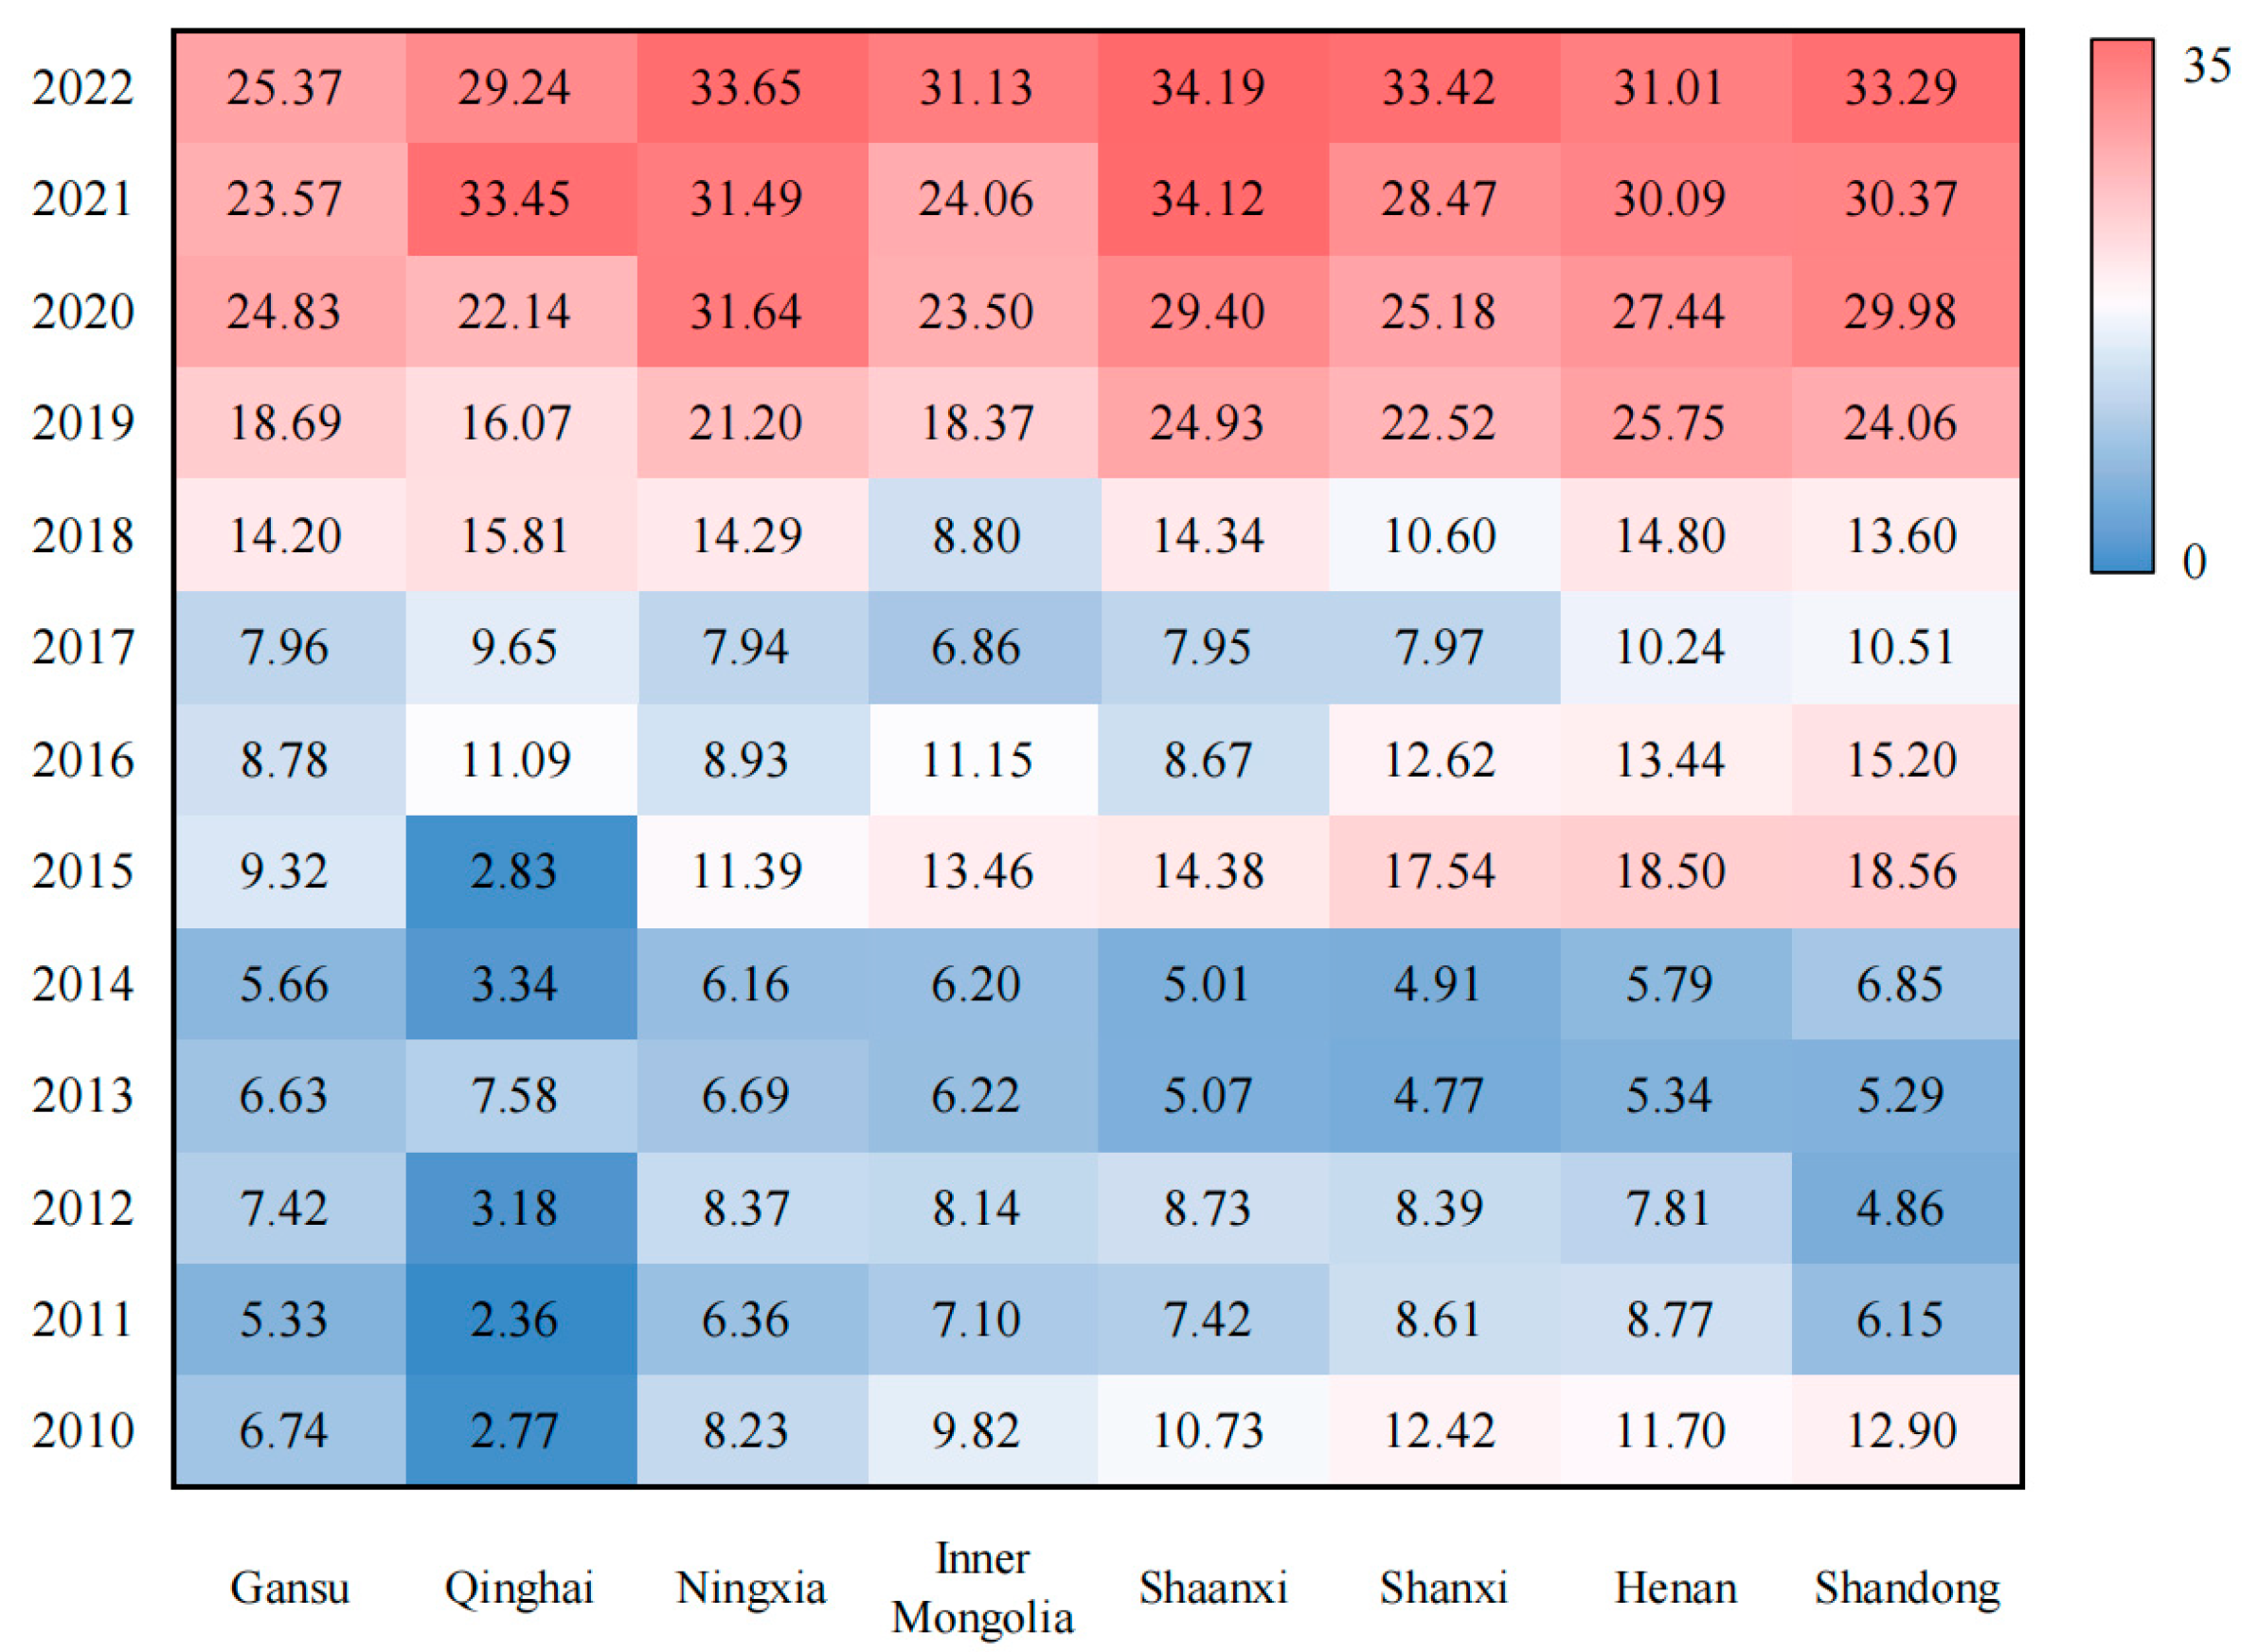
3.1.2. Provincial Scale

As shown in Figure 3, the ranking of market integration development levels among provinces, from highest to lowest, is as follows: Shandong, Henan, Shaanxi, Ningxia, Shanxi, Inner Mongolia, Qinghai, and Gansu. Analysis of the temporal and spatial evolution of provincial market integration in the Yellow River Basin revealed significant phase differentiation and convergence characteristics of the integration index among provinces and different segments of the Yellow River from 2010 to 2022, with regional collaborative effects gradually strengthening. From a temporal perspective, the period from 2010 to 2015 is characterized as a market segmentation phase, during which the downstream provinces leveraged their locational advantages and policy benefits to develop first, while the upstream provinces of Gansu and Qinghai remained at relatively low levels. The growth rate in the middle reaches was less than 3%, and the interregional integration index disparity reached 16.3, indicating limited movement of market factors and a low level of integration. The period from 2016 to 2020 marked a phase of accelerated integration, during which the middle and upper reaches achieved breakthroughs through infrastructure connectivity and industrial transfer. The integration index of Shaanxi surged from 8.7 in 2016 to 29.4 in 2020, with an average annual growth rate of 27.6%. Inner Mongolia increased from 11.1 to 23.5, with an average annual growth rate of 16.8%. The growth rates for provinces in the middle reaches, such as Ningxia and Shanxi, exceeded 15%, while the growth rates of the downstream provinces of Shandong and Henan slowed to an average of 6% to 8%, resulting in a reduction in regional thermal disparity to 10.6. The overall market integration index for the Yellow River rose from 11.2 to 26.8, with the contribution of the middle reaches increasing from 32% to 45%, reflecting the diffusion of market factors toward the upper and middle reaches and enhanced regional synergy.
The period from 2021 to 2022 represents an efficient integration phase. In 2019, the ecological protection and high-quality development of the Yellow River Basin were elevated to national strategy. The “Outline of the plan for ecological protection and high-quality development of the Yellow River Basin,” issued on 8 October 2021, and the “Opinions on accelerating the construction of a national unified market,” released on 10 April 2022, provided impetus for the downstream regions to regain growth momentum driven by innovation. The middle reaches continued to strengthen through the extension of industrial chains, while the upstream provinces of Qinghai and Gansu achieved catch-up growth through ecological economies, with the regional thermal disparity further narrowing to 9.6. In terms of spatial patterns, the downstream regions maintained a high base, but exhibited volatile growth rates, the middle reaches gradually became the core growth hub for integration, and the upstream regions continued to close the gap, forming a gradient coordination model of downstream leading, middle reaches supporting, and upstream supplementing.

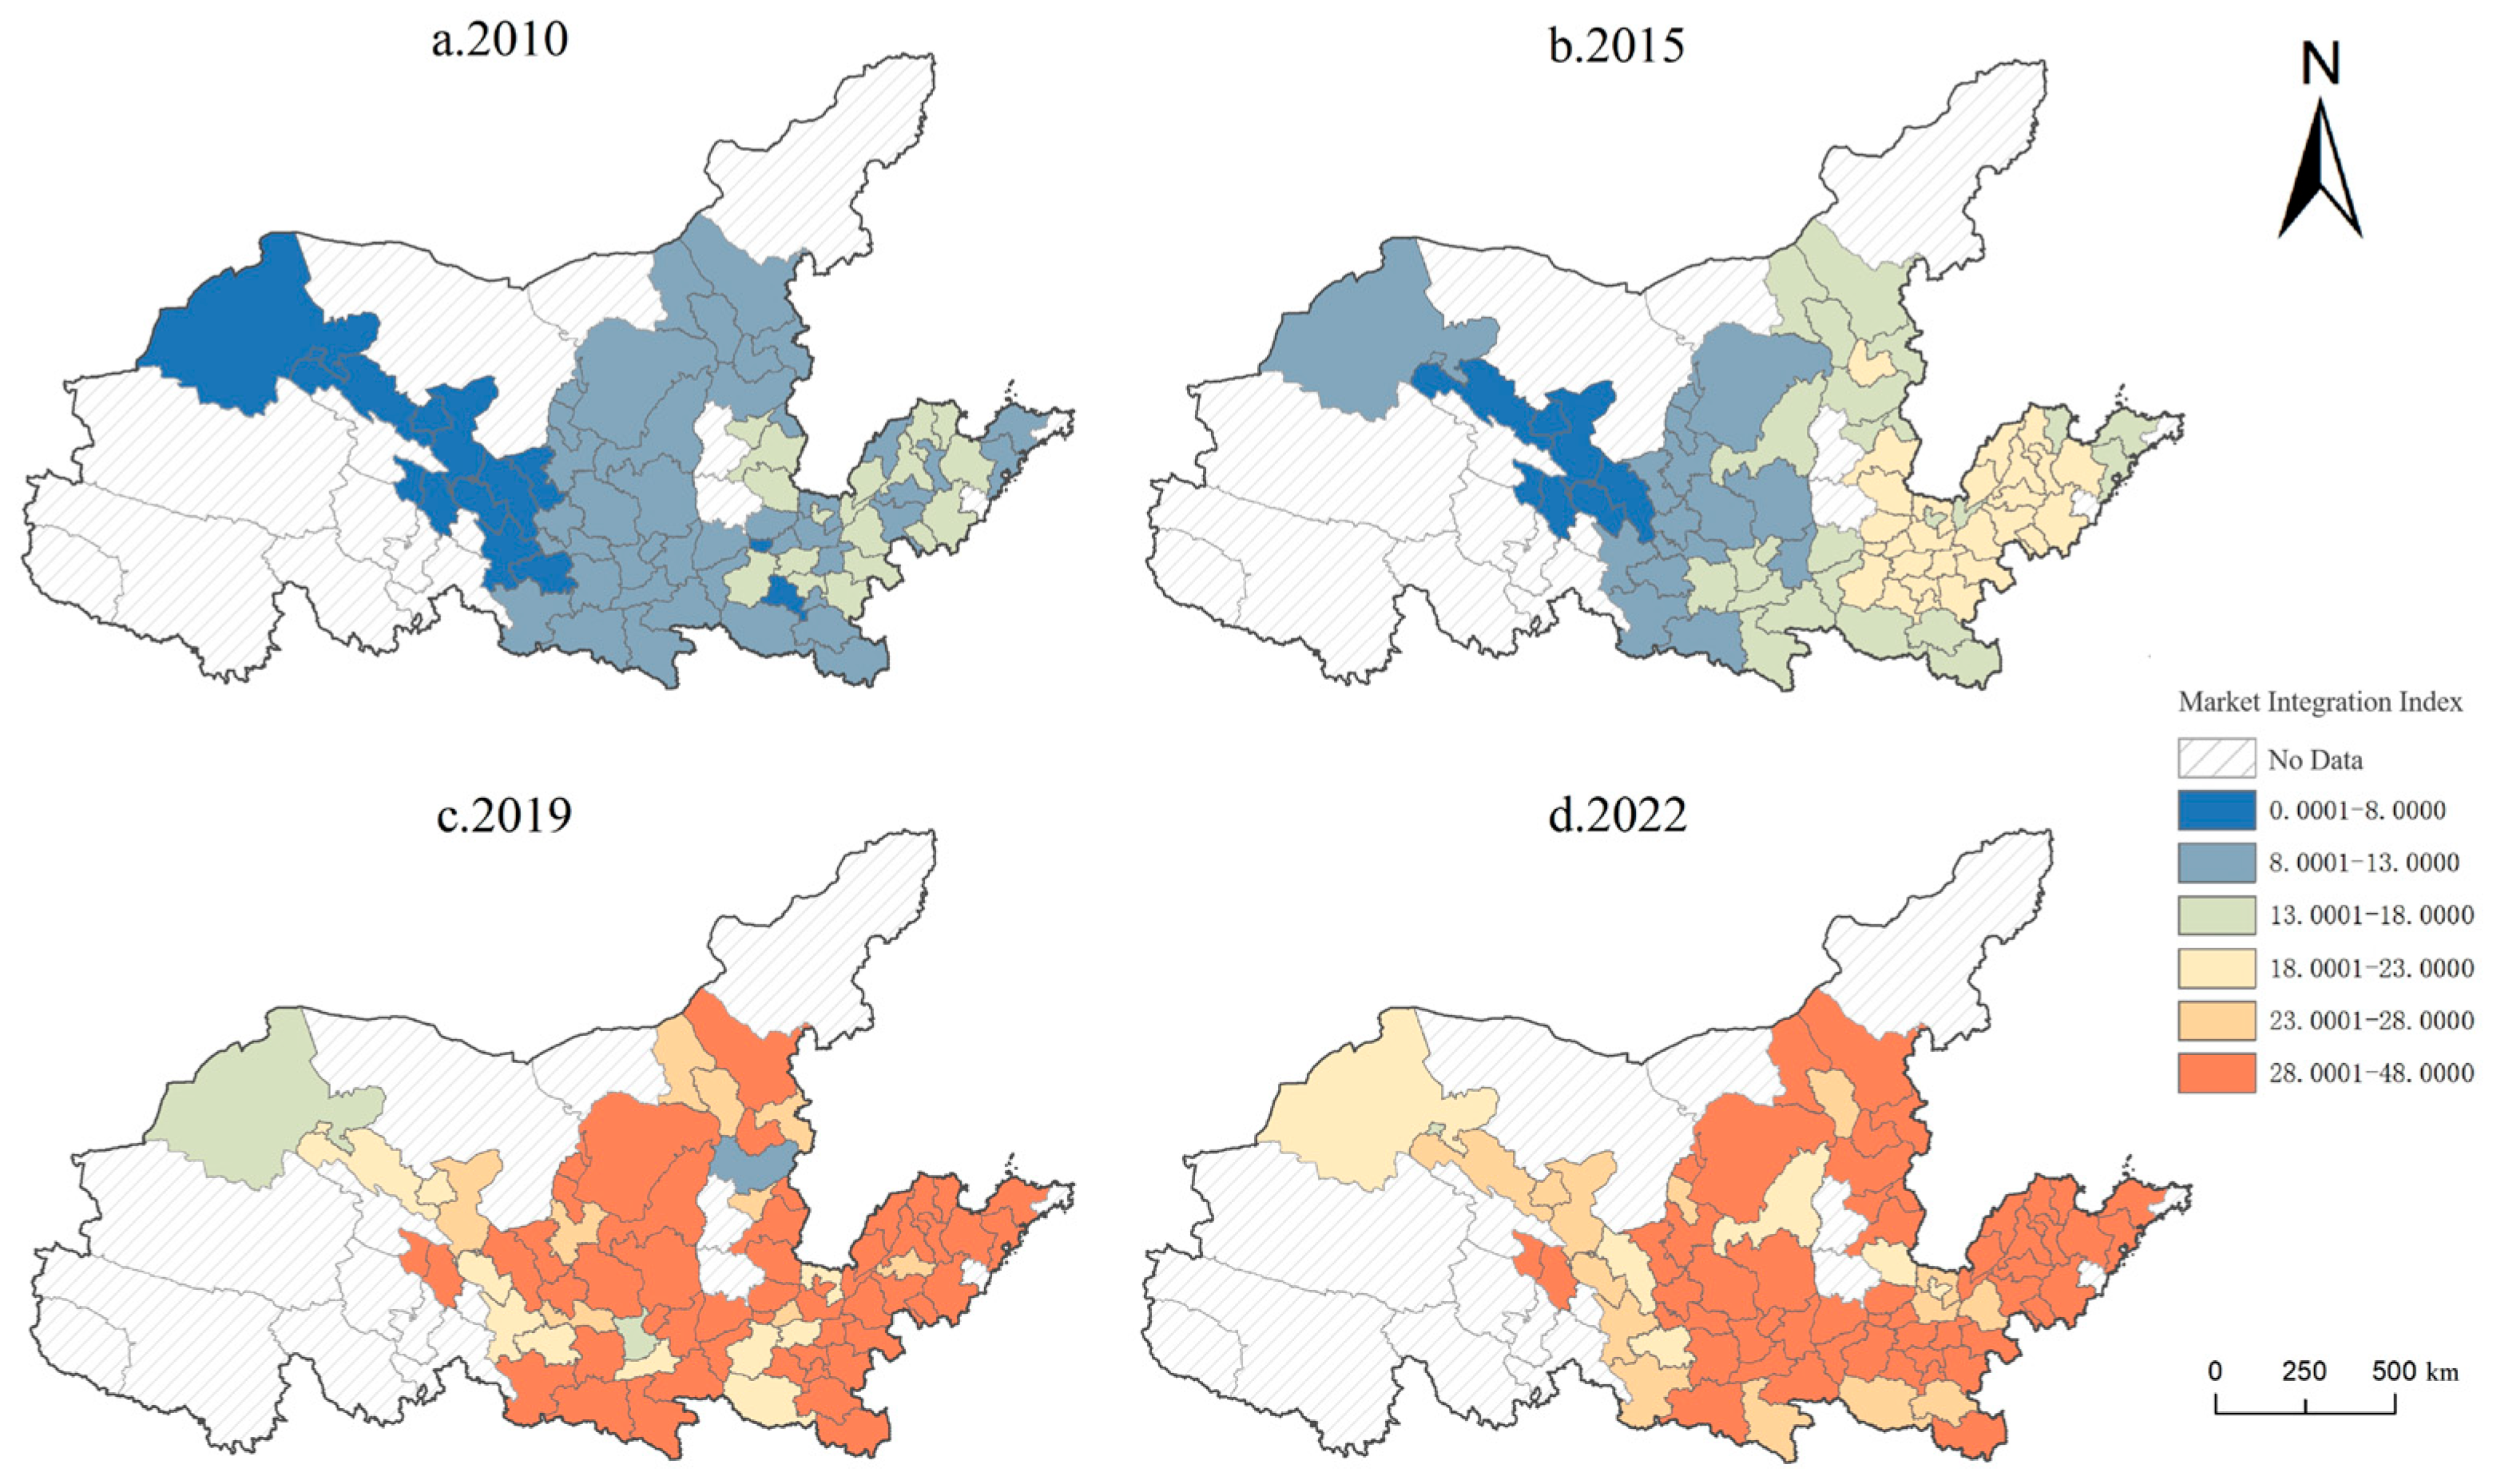
3.1.3. Prefectural Scale

As shown in Figure 4, this study selected the years 2010, 2015, 2019, and 2022 as time points to explore the spatial evolution of market integration at the prefecture level in the Yellow River Basin. Overall, significant differences exist in market integration levels among prefecture-level cities in the Yellow River Basin, exhibiting a spatial distribution pattern of “higher in the east, lower in the west; higher in the south, lower in the north”.
From a temporal perspective, the market integration index for prefecture-level cities in the Yellow River Basin was generally low from 2010 to 2015, with an average of 9.5 across the entire basin. The spatial distribution was highly concentrated in capital cities. Cities such as Zhengzhou (13.16) and Xi’an (11.78), due to their administrative resources and transportation advantages, emerged as monopolar cores, with indices significantly higher than the basin average. The price correlation coefficient with surrounding cities reached 0.68, reflecting an initial agglomeration effect. In contrast, peripheral cities such as Yinchuan (8.38) and Xining (2.41) lagged in infrastructure, with indices falling over 30% below the average, indicating weak regional synergy. From 2015 to 2019, the average market integration index for the entire basin rose to 15.3, but the standard deviation increased from 4.2 to 6.7, highlighting significant regional disparities. With the deepening of the “Western development” initiative, resource-based cities experienced rapid growth in their indices. For instance, Yulin reached 13.89 and Ordos reached 12.36, marking increases of 38% and 42% compared to 2010. Central cities like Zhengzhou (19.28) and Jinan (10.82) leveraged industrial upgrades and the expansion of transportation networks to maintain relatively high market integration indices, with growth rates of 46.3% and 37.5%, respectively. Due to geographical constraints, Haidong recorded only a 25% increase, resulting in it having the lowest value. Overall, this phase exhibits characteristics of rapid integration growth, but also exacerbates regional imbalances. From 2019 to 2022, the region entered a policy regulation phase. Following the implementation of the national strategy for “Ecological protection and high-quality development of the Yellow River Basin” in 2019, the level of market integration in the basin rose from 24.1 in 2019 to 30.2 in 2022, with an average annual growth rate of 7.8%, although this growth rate was significantly slower than in the previous phase. The implementation of the Yellow River national strategy can narrow regional price gaps through price interventions, industrial transformations, and transportation connectivity, thereby facilitating the formation of a multicenter structure.
This study, in conjunction with Figure 4, categorizes the Yellow River Basin into three regions based on provincial boundaries: the western region includes Qinghai, Ningxia, and Gansu; the central region encompasses Shanxi, Shaanxi, and Inner Mongolia; and the eastern region comprises Shandong and Henan. From a spatial evolution perspective, a typical “high east, low west” gradient pattern was observed in 2010. The eastern region exhibited the highest level of market integration with a mean of 11.82, with downstream cities Binzhou in Shandong (13.39) and Hebi in Henan (14.06) forming the core area. The western region had a mean of only 6.91, which is less than 60% of the eastern region’s mean, with upstream cities such as Jinchang in Gansu (2.44) and Xining in Qinghai (2.41) showing significant lag. The standard deviation for the eastern region reached 2.87, the highest among the three regions, indicating uneven internal development. By 2015, the spatial gradient pattern had further strengthened. The mean of the eastern region rose to 16.02, increasing the absolute difference to 6.90 compared to the western region (9.12). However, the central region exhibited signs of catching up, with a mean increase to 12.71: emerging growth points included Jincheng in Shanxi (18.94) and Weinan in Shaanxi (12.76). The western region’s standard deviation increased to 3.06, suggesting that internal differences were beginning to widen. Following the implementation of the national strategy in 2019, the pattern underwent significant restructuring. The central region formed a high-density collaborative network, with 15 cities surpassing the threshold of 30. The continuous high-value area extended from Jinzhong in Shanxi (30.89) to Yan’an in Shaanxi (34.64), yielding a regional mean of 27.83, which approached the eastern region’s mean of 30.15. The eastern region demonstrated differentiated integration, with the standard deviation rising to a peak of 5.24. The cities of Zibo (32.85) and Heze (33.94) in Shandong significantly contributed to the western region, achieving a mean of 25.64. By 2022, the pattern evolved into one where the central and eastern regions were high, while the western region remained relatively lower. The central region surpassed the eastern region for the first time, with a mean of 32.94 compared to the eastern mean of 32.67. Although the mean of the western region increased to 28.97, its standard deviation soared to 6.12, ranking it first among the three regions and highlighting the issue of regional imbalance within the western area.

3.2. Regional Differences in Market Integration of the Yellow River Basin

3.2.1. Overall Spatial Differences

Spanning eastern, central, and western China across eight provincial-level units, the Yellow River Basin exhibits significant interprovincial disparities in economic development, historical foundations, and geographical positioning. These differentials inherently generate commodity circulation barriers, complicating market integration and directly shaping regional differentiation patterns. As shown in Figure 5, during 2010–2022, the basin’s overall market integration Gini coefficient demonstrated an oscillatory decline, decreasing from 0.153 in 2010 to 0.104 in 2022 at an average annual rate of 3.3%, signaling improved integration. However, this evolution exhibited phased fluctuations: the Gini coefficient rebounded to 0.153 in 2015 before declining cumulatively by 26.9% to 0.098 during 2016–2020. Post-2020, it increased consecutively for two years (cumulative + 6.1%) to 0.104. This reversal indicates resurgent regional fragmentation pressures, demanding policy vigilance against integration reversal risks.

3.2.2. Intraregional and Interregional Differences

The evolution of disparities across the upper, middle, and lower reaches of the Yellow River Basin revealed significant reductions in the upper reaches, as shown in Table 1, where the Gini coefficient fell from 0.188 in 2010 to 0.108 in 2022, marking a 42.6% decline, reflecting effective market integration and enhanced internal coordination. In contrast, disparities in the lower reaches trended upward, rising from 0.062 in 2010 to 0.077 in 2022, representing an increase of 24.2%, suggesting intensifying market competition and emergent resource distribution imbalances. In the middle reaches, disparities similarly widened, increasing from 0.088 in 2010 to 0.107 in 2022, which equates to a 21.6% rise, indicating severe integration challenges including urban development asymmetries and inadequate coordination mechanisms. From an interregional perspective, the gap between the upper and lower reaches narrowed significantly, with the intergroup Gini coefficient plummeting from 0.275 in 2010 to 0.104 in 2022, a reduction of 62.2%, evidencing weakened factor flow barriers and strengthened cross-regional synergy. Upper-middle reach gaps similarly narrowed from 0.224 to 0.127—a decline of 43.3%, confirming improved market linkages.
The evolution of disparities between the lower and middle reaches is more complex, peaking at 0.173 in 2016 before declining to 0.097 in 2022. The peak in 2016 (0.173) was considerably higher than the levels observed in 2010 (0.095) and 2022 (0.097), indicating a clear period of significant coordination difficulties. Although some improvement has been noted in later years, the foundation for integration between the lower and middle reaches remains weaker compared to that between the upper and other regions. The primary driving force behind market integration in the Yellow River Basin stems from internal optimization in the upper regions and enhanced cross-regional synergistic effects. However, local conflicts between the lower and middle reaches may pose critical challenges to future deepening of market integration. Therefore, immediate attention is required to optimize the resource allocation mechanisms in the middle reaches and to adjust the competitive structure in the lower reaches.

3.2.3. Sources of Differences and Their Contributions

The Dagum Gini coefficient decomposition contribution rates, as illustrated in Figure 6, indicate a structural transformation in the sources of overall disparities within the market integration of the Yellow River Basin. In 2010, the contribution rate of interregional disparities (Gb) was 69.93%, making it the predominant source of overall disparities in market integration. This finding suggests that the segmentation of the basin’s market primarily stems from barriers among the upper, middle, and lower reaches. The contribution rate of super-variable density (Gt) was notably low, at 9.27%, indicating that market integration levels among cities in the region are relatively homogeneous, with few cities significantly exceeding or lagging behind the regional average. By 2022, the contribution rate of interregional disparities (Gb) had decreased significantly, cumulatively falling by 39.79 percentage points to 30.14%. This change quantitatively confirms the significant weakening of barriers to interregional factor flow, particularly between the upper and lower reaches. In contrast, the contribution rate of Gt experienced a substantial increase, rising by 29.48 percentage points to 38.75%, peaking at 51.17% in 2020. Notably, in 2018, the contribution rate of Gt first exceeded that of Gb, becoming the primary source of disparities. This reversal in the dominance of contribution rates quantifies the transition of regional development from polarization to depolarization.

3.3. Analysis of Influencing Factors

3.3.1. Selection of Driving Factor Variables

The level of market integration in the Yellow River Basin is influenced by several factors, including economic development levels, financial development levels, and industrial structure. The specific indicators are detailed in Table 2. First, industrial structure is a key driver of commodity market integration. As industrial structures transform and upgrade, the interconnections and complementarities among various industries significantly affect the flow and allocation of production factors and commodities across a broader spectrum. The Yellow River Basin’s dense concentration of resource-based cities necessitates strategic industrial transformation to overcome the “resource curse” and catalyze cross-regional factor mobility. The level of industrial upgrading is indicated by the ratio of value added in the tertiary sector to that in the secondary sector [33]. Second, economic development is a fundamental factor determining the degree of market integration. As the economy grows, the market scale expands continuously and the division of labor becomes more refined. Pronounced economic gradients across the Yellow River Basin constitute the fundamental driver of market segmentation. The frequency and scale of commodity exchange are also influenced by economic growth, with per capita GDP serving as an indicator of economic development levels [16]. Additionally, the level of openness is an external factor affecting commodity market integration. Openness fosters the development of international trade and investment, introducing external competition and advanced technologies. The level of openness is represented by the ratio of actual foreign capital utilized in the current year to GDP [20]. Furthermore, the degree of financial development is a critical supporting factor for market integration. The development level of financial markets directly influences the flow of funds and the efficiency of resource allocation within the commodity market, with the ratio of year-end financial institution loans and deposits to GDP serving as an indicator of financial development levels [34]. Finally, the internet penetration rate is an emerging factor influencing market integration. The rapid advancement of the internet has significantly reduced the costs of obtaining and transmitting information, and its development serves as a fundamental support for the growth of the digital economy. The internet penetration rate is measured by the number of internet users per 10,000 people relative to the resident population [35]. Data in this section were compiled from publicly accessible municipal statistical yearbooks.

3.3.2. Analysis of Panel Model Results

We constructed a panel model using industrial structure upgrading, economic development level, level of openness, degree of financial development, and internet penetration rate as explanatory variables, with the market integration index as the dependent variable. In practical applications, there may be a certain degree of correlation among many independent variables. If not controlled, this can lead to multicollinearity issues, affecting the stability of coefficient estimates and the reliability of hypothesis testing in regression models. To address this, a variance inflation factor (VIF) collinearity test was conducted on the relevant explanatory variables, all of which showed VIF values below 10, indicating no multicollinearity issues.
Through model testing (Table 3), the F-test rejected the pooled OLS model and supported either the fixed-effect (FE) or random-effect (RE) model. The BP test indicated the presence of individual effects, and the Hausman test strongly rejected the null hypothesis of random effects (p < 0.01). Consequently, the fixed-effect (FE) model represented the most appropriate specification. Subsequent analyses employed this FE framework, with robustness assessed via alternative measurement approaches for core variables, confirming result stability.
Since the fixed effects (FE) model was selected in prior tests, the analysis here focuses solely on the estimation results of this model, as shown in Table 4.
Industrial structure upgrading exerts a significant positive driving effect on market integration. Cities with a high proportion of high-tech industries exhibit a markedly higher market integration index. For example, in Jinan, high-tech industries account for 48%, while traditional industry-dominant areas, such as Lvliang, have a reliance on coal exceeding 60%, resulting in lower integration levels. Industrial structure upgrading reduces interregional transaction costs by optimizing resource allocation efficiency, enhancing interindustry synergies, and improving the level of specialized division of labor [36]. The R&D–manufacturing collaboration between Xi’an and Luoyang effectively supports this viewpoint.
The level of economic development has a significant positive impact on the market integration index. Growth in total economic output expands the demand for goods and services, prompting enterprises to transcend administrative boundaries to access larger markets, thereby forming cross-regional division of labor networks. Experiences from the Yangtze River Delta and Pearl River Delta indicate that when per capita GDP surpasses a certain threshold, the market segmentation index declines significantly [37]. Economically developed regions are more likely to establish unified market rules and regulatory systems, fostering institutional convergence in surrounding areas through the demonstration effect. Additionally, economic development is accompanied by improvements in infrastructure such as transportation and logistics, which reduce factor mobility costs and accelerate the cross-regional allocation of labor, capital, and technology.
The level of openness to the outside world presents a significant negative driving effect on market integration in the Yellow River Basin. This finding contradicts conventional expectations. Existing research indicates that the impact of openness on market integration indices is complex, exhibiting both positive promotion effects and potentially negative influences under specific conditions [38]. Moreover, openness may sometimes hinder the reduction of internal economic disparities [39,40]. In less developed regions, openness manifests more as a one-way flow of resources and markets rather than bilateral interaction, potentially exacerbating market segmentation to some extent. The underlying reasons require further exploration in light of the unique context of the Yellow River Basin.
The level of financial development has a significant positive impact on the market integration index in the Yellow River Basin. Regions, with higher levels of financial development typically exhibiting higher market integration indices, whereas those with lower financial development progress more slowly in market integration [41]. Financial systems enhance capital allocation efficiency, lower interregional financing barriers, and promote cross-regional investment and industrial chain integration. An increase in the level of financial development indicates more mature and robust financial markets that provide investors with diverse investment channels and risk management tools, helping to reduce the costs and risks of capital mobility, diminishing local governments’ incentives to implement protectionism due to economic fluctuations, and thus reducing market segmentation.
Internet penetration has a significant positive impact on the market integration index. The proliferation of the internet accelerates the cross-regional transparency of commodity prices, supply-and-demand information, and policy rules, undermining the informational basis for traditional market segmentation. By reducing trade costs between regions, it lowers market segmentation [42]. Additionally, the expansion of e-commerce platforms and digital logistics networks significantly reduces transaction costs [43], enabling small and medium-sized enterprises to bypass geographical limitations and participate in broader division of labor. The rise in e-commerce and cross-border e-commerce breaks the geographical barriers of traditional trade, allowing goods and services to be exchanged across national and regional boundaries. This economic connection between regions not only helps optimize resource allocation and sharing but also promotes the dissemination and diffusion of technology and knowledge.

4. Discussion

This study systematically reveals the temporal and spatial evolution patterns, regional disparity characteristics, and core driving factors of market integration in the Yellow River Basin from 2010 to 2022. Unlike developed regional clusters such as the Yangtze River Delta, the Yellow River Basin serves as a national ecological barrier, a resource-rich area, and a key zone with significant developmental gradients. Its market integration process exhibits distinctive uniqueness profoundly influenced by national strategies and open policies. This section focuses on four drivers.

4.1. The Unique Path of Market Integration in the Yellow River Basin

The unique path of market integration in the Yellow River Basin presents a trajectory characterized by fluctuating ascent, spatial reorganization, and midstream emergence. First, the basin’s special location, development level, and the dual effects of ecological vulnerability and protective policies form its fundamental context. Development in the upper reaches is constrained by ecological sensitivity and lagging infrastructure, resulting in low market integration and significant disparities with downstream areas. However, as the “Ecological protection and high-quality development in the Yellow River Basin” strategy rose to national prominence, its implementation reduced integration barriers and transaction costs for marginal areas, driving accelerated catch-up growth in the upper reaches. Second, the transformation of resource-dependent economies profoundly influences regional patterns. With a significant concentration of resource-based cities in the midstream, these areas achieved leapfrog growth in market integration through interconnected infrastructure and industrial transfer, becoming new core growth poles. Third, the pronounced east–west development gradient underpins spatial evolution, shifting market integration from an initial “east high, west low” pattern toward a more balanced “central-eastern high, western catch-up” trend. This path—where ecological constraints drive integration, resource transformation enables leapfrog growth, and gradient disparities spur catch-up—distinguishes the Yellow River Basin from regions with mature market mechanisms.

4.2. Effectiveness of National Strategy Policies

As a crucial area for national ecological security and high-quality development, the market integration process in the Yellow River Basin is characterized by endogenous-driven dominance and exogenous collaborative deepening. Given significant disparities in resource endowments and developmental gradients, top-level design and strong intervention from national strategies constitute core exogenous forces reshaping the spatiotemporal patterns and driving mechanisms of market integration. The observed significant decline in the interregional Gini coefficient and the leap in super-variable density contribution rates reflect national strategies’ powerful role in breaking down interprovincial and intersectional barriers. Under national strategic guidance, major infrastructure projects—such as the comprehensive transportation network in the Yellow River’s “bending” zone and national computing power hub nodes—have substantially reduced geographic constraints on commodity circulation. This enables upstream and midstream regions (e.g., Shaanxi and Ningxia) to integrate more efficiently into downstream core market networks. Simultaneously, the strategy’s emphasis on industrial structure upgrading and technological innovation has fostered the cultivation, clustering, and cross-regional flow of high-value-added industrial factors, significantly enhancing interregional industrial linkages. This forms the core policy context explaining why industrial structure upgrading exerts a significant positive effect in this study. The national strategy innovatively establishes a differentiated and coordinated development path among upstream, midstream, and downstream regions, guiding resource allocation optimization according to functional positioning: downstream focuses on innovation-driven growth and high-end leadership; midstream emphasizes transforming traditional industries and nurturing emerging sectors; and upstream prioritizes ecological protection and specialized economy collaboration. This orientation effectively facilitates depolarization in market integration’s spatial pattern, preliminarily fostering a new multicenter collaborative development framework.
Despite the national strategy’s significant effectiveness, deepening market integration in the Yellow River Basin faces profound policy coordination challenges requiring innovative solutions [44]. The primary tension lies between rigid ecological protection constraints and maximizing market allocation efficiency. Strict ecological redlines in the upper reaches and the high-pressure environmental transformation of midstream resource-based cities inevitably restrict short-term cross-regional factor flows and the free layout of high-emission, high-energy-consuming industries. Resolving this requires constructing a basin-wide collaborative green market system, for instance, establishing a basin-coverage carbon emissions trading market, implementing energy use rights trading, and exploring ecological value accounting with market-based compensation mechanisms. This transforms ecological constraints into inherent market integration incentives rather than obstacles. Furthermore, a delicate balance is needed between national unified rules and the basin’s differentiated development reality. While establishing a unified national market demands high institutional rule consistency, significant developmental and functional differences exist among upstream, midstream, and downstream regions. Policies must thus be nuanced: allowing regions to explore differentiated development policies and factor allocation models aligned with their functional positioning, while maintaining a unified institutional baseline to preserve comparative advantages. Future market integration deepening in the basin must not only stimulate endogenous momentum but also urgently leverage national strategic frameworks, with institutional innovation the key breakthrough for addressing these policy coordination challenges [45].

4.3. The “Stage-Specific Negative Effects” of Opening Up

This study reveals a critical finding: openness exerts a significant negative impact on market integration in the Yellow River Basin. Interpreting this “paradox” requires contextualization within the basin’s unique conditions. Leveraging geographic position and first-mover advantages, downstream regions have attracted substantial foreign investment and export-oriented industries, inducing one-way concentration of production factors toward coastal nodes. Existing studies indicate that coastal geographic advantages and openness levels are key factors explaining post-reform income disparities between coastal and interior regions [46]. Consequently, this concentration fails to effectively radiate economic benefits to adjacent midstream and upstream areas, potentially exacerbating inland resource depletion, weakening interregional industrial linkages and economic interactions, and intensifying short-term market segmentation within the basin.
Additionally, incompatibility between international rules and domestic market regulations persists, generating institutional friction that temporarily raises transaction costs and uncertainties for cross-regional trade, thereby creating new implicit barriers. When underdeveloped regions pursue external openness, excessive reliance on resource-based foreign investment or primary product exports not only increases vulnerability to international price volatility but may also entrench low-end lock-in pathways [47], inhibiting local high-value-added industry development and deeper internal market connections. This leads to a temporary divergence from integration objectives, underscoring the necessity for complementary internal coordination mechanisms and industrial upgrading policies to mitigate openness’s negative externalities in the basin.

4.4. Future Research Prospects

This study lays a solid foundation for understanding market integration in the Yellow River Basin. Future research should deepen exploration in three key areas.
First, multidimensional measurement of market integration. Current research relies on the commodity retail price index, primarily reflecting goods market integration. Future studies should incorporate factor market data, such as labor mobility barriers, cross-regional capital allocation efficiency, and technology transfer obstacles, to develop a comprehensive evaluation framework encompassing goods, labor, capital, and technology markets. This will provide a more holistic assessment of basin-wide integration. Second, microlevel behavioral analysis. Utilizing enterprise, merchant, or consumer microdata to examine differential responses to integration policies, infrastructure improvements, and open policies can reveal micro-dynamics and integration resistances. Research should also investigate heterogeneous integration pathways across city types. Third, comparative institutional analysis. Systematic comparisons between the Yellow River Basin and major national strategic regions such as the Yangtze River Economic Belt and the Guangdong–Hong Kong–Macau Greater Bay Area. This research aims to explore the commonalities and specific characteristics of driving mechanisms, evolution patterns, challenges faced, and policy demands for market integration under diverse natural geographic conditions, development stages, dominant industries, and policy focuses. Such efforts will contribute to the formulation of more universally applicable theories of market integration while considering regional adaptability.

5. Conclusions

This study analyzed the spatiotemporal evolution of market integration in the Yellow River Basin using retail price indices for 16 commodity categories across prefecture-level cities and above. Employing pricing methods, Dagum Gini coefficients, and panel regression models, it further examined market integration determinants. The key findings are as follows.
(1)
Phased progression and spatial reorganization characterize evolution. Temporally, the basin’s market integration index rose steadily from 10.48 (2010) to 31.38 (2022), averaging 9.8% annual growth, indicating continuous improvement. Spatially, the western region’s average value (6.91) was less than 60% of the eastern region’s in 2010. By 2022, central and eastern regions had reached near parity, with the west attaining 89% of the east’s level. The spatial pattern thus shifted from “high east, low west” to a balanced “high central east, west catching up.” Future policies should consolidate this trend through sustainable infrastructure investment (e.g., renewable energy corridors, digital green logistics) and ecosystem service valuation in public fiscal transfers, ensuring growth decoupled from resource depletion.
(2)
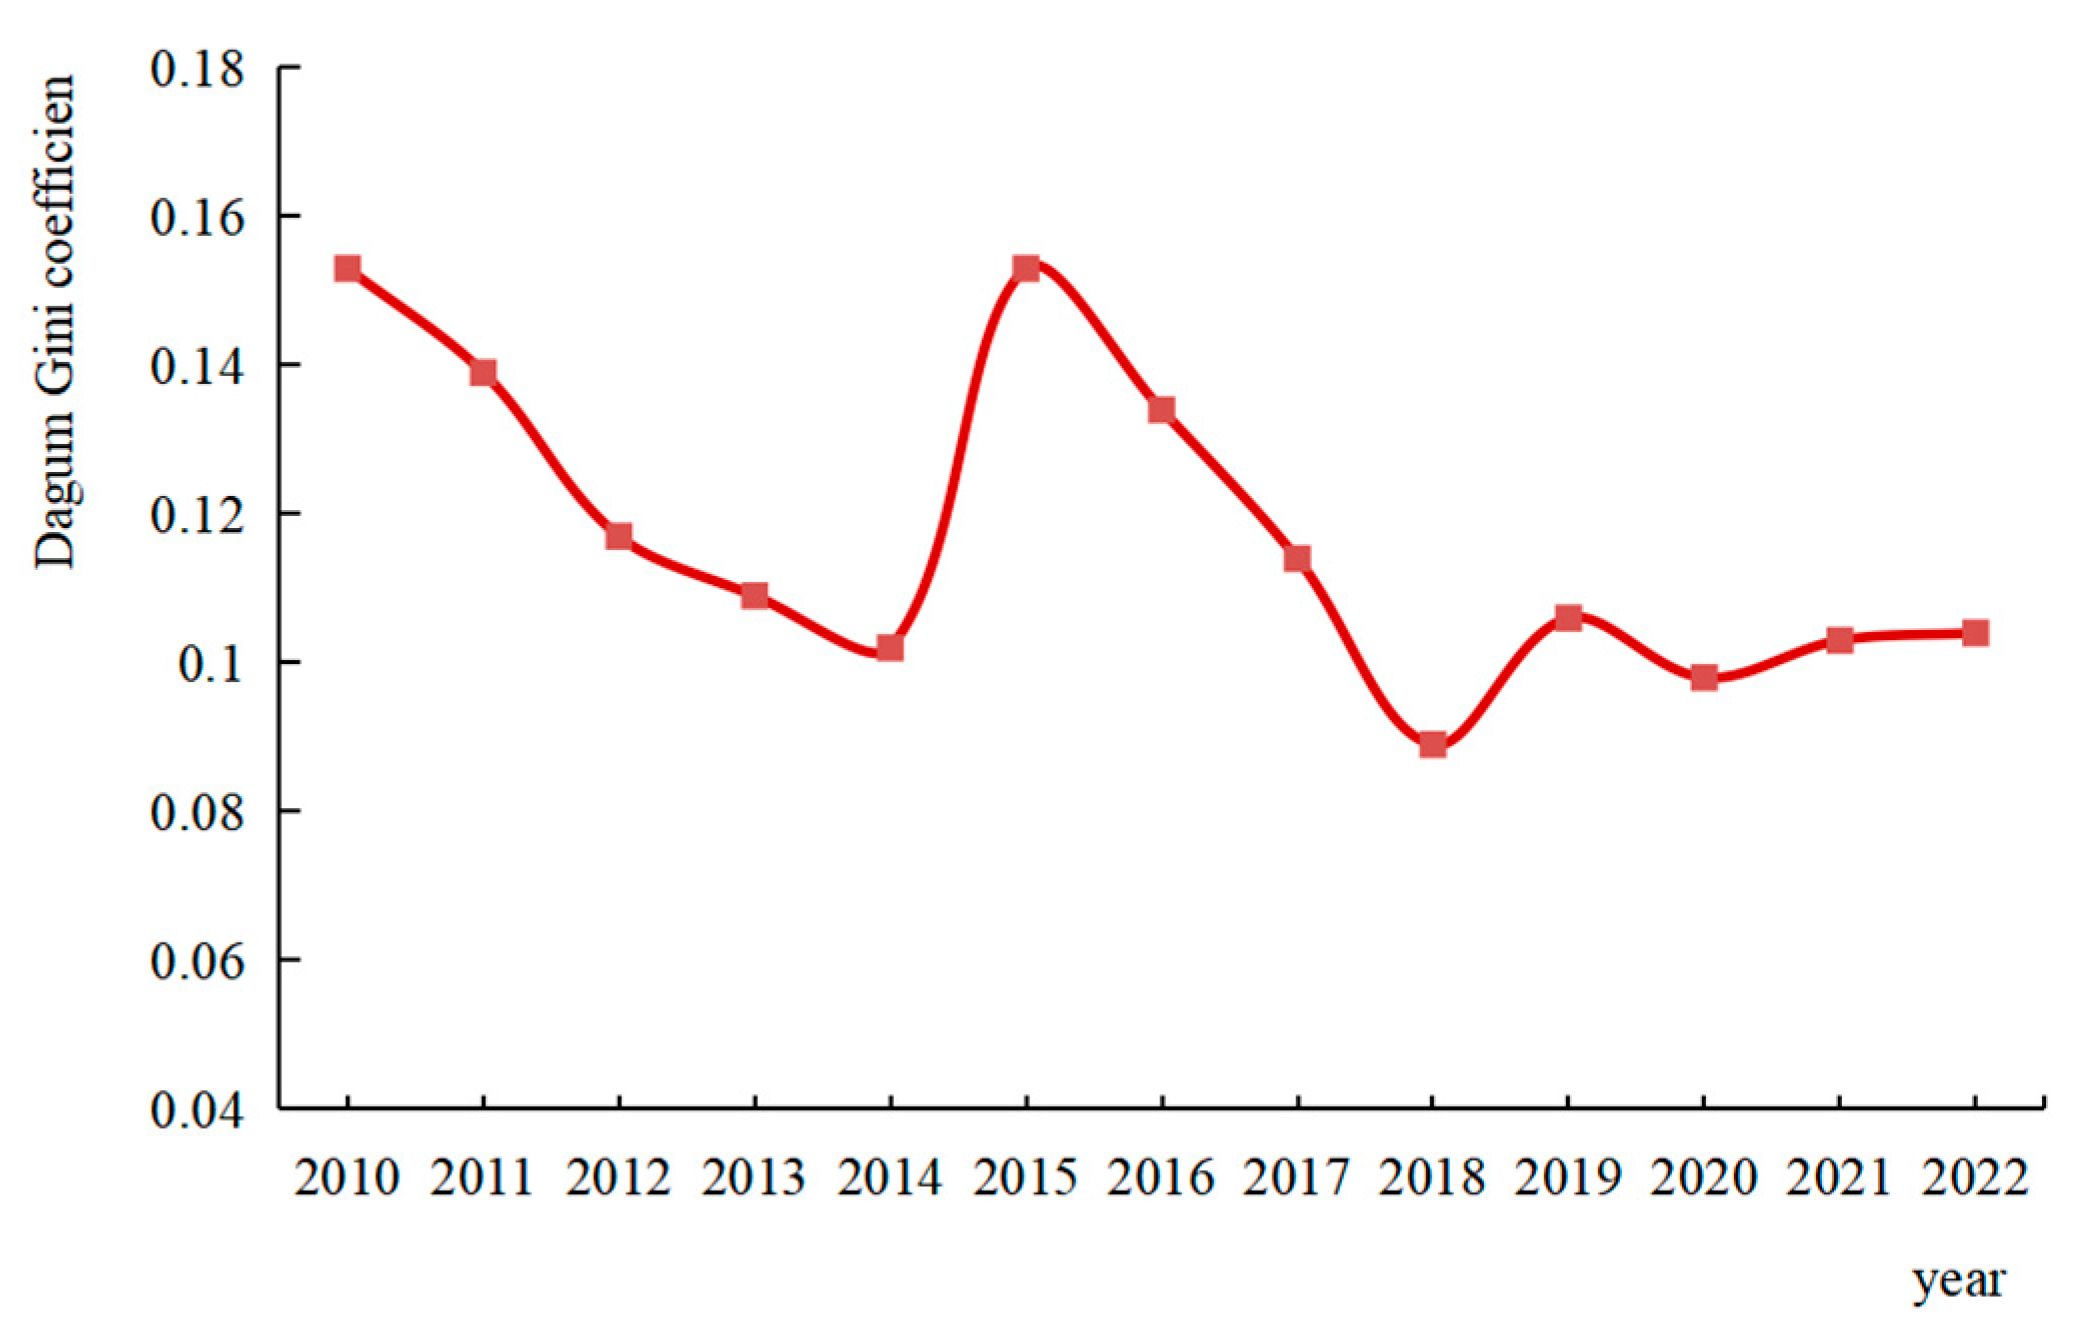
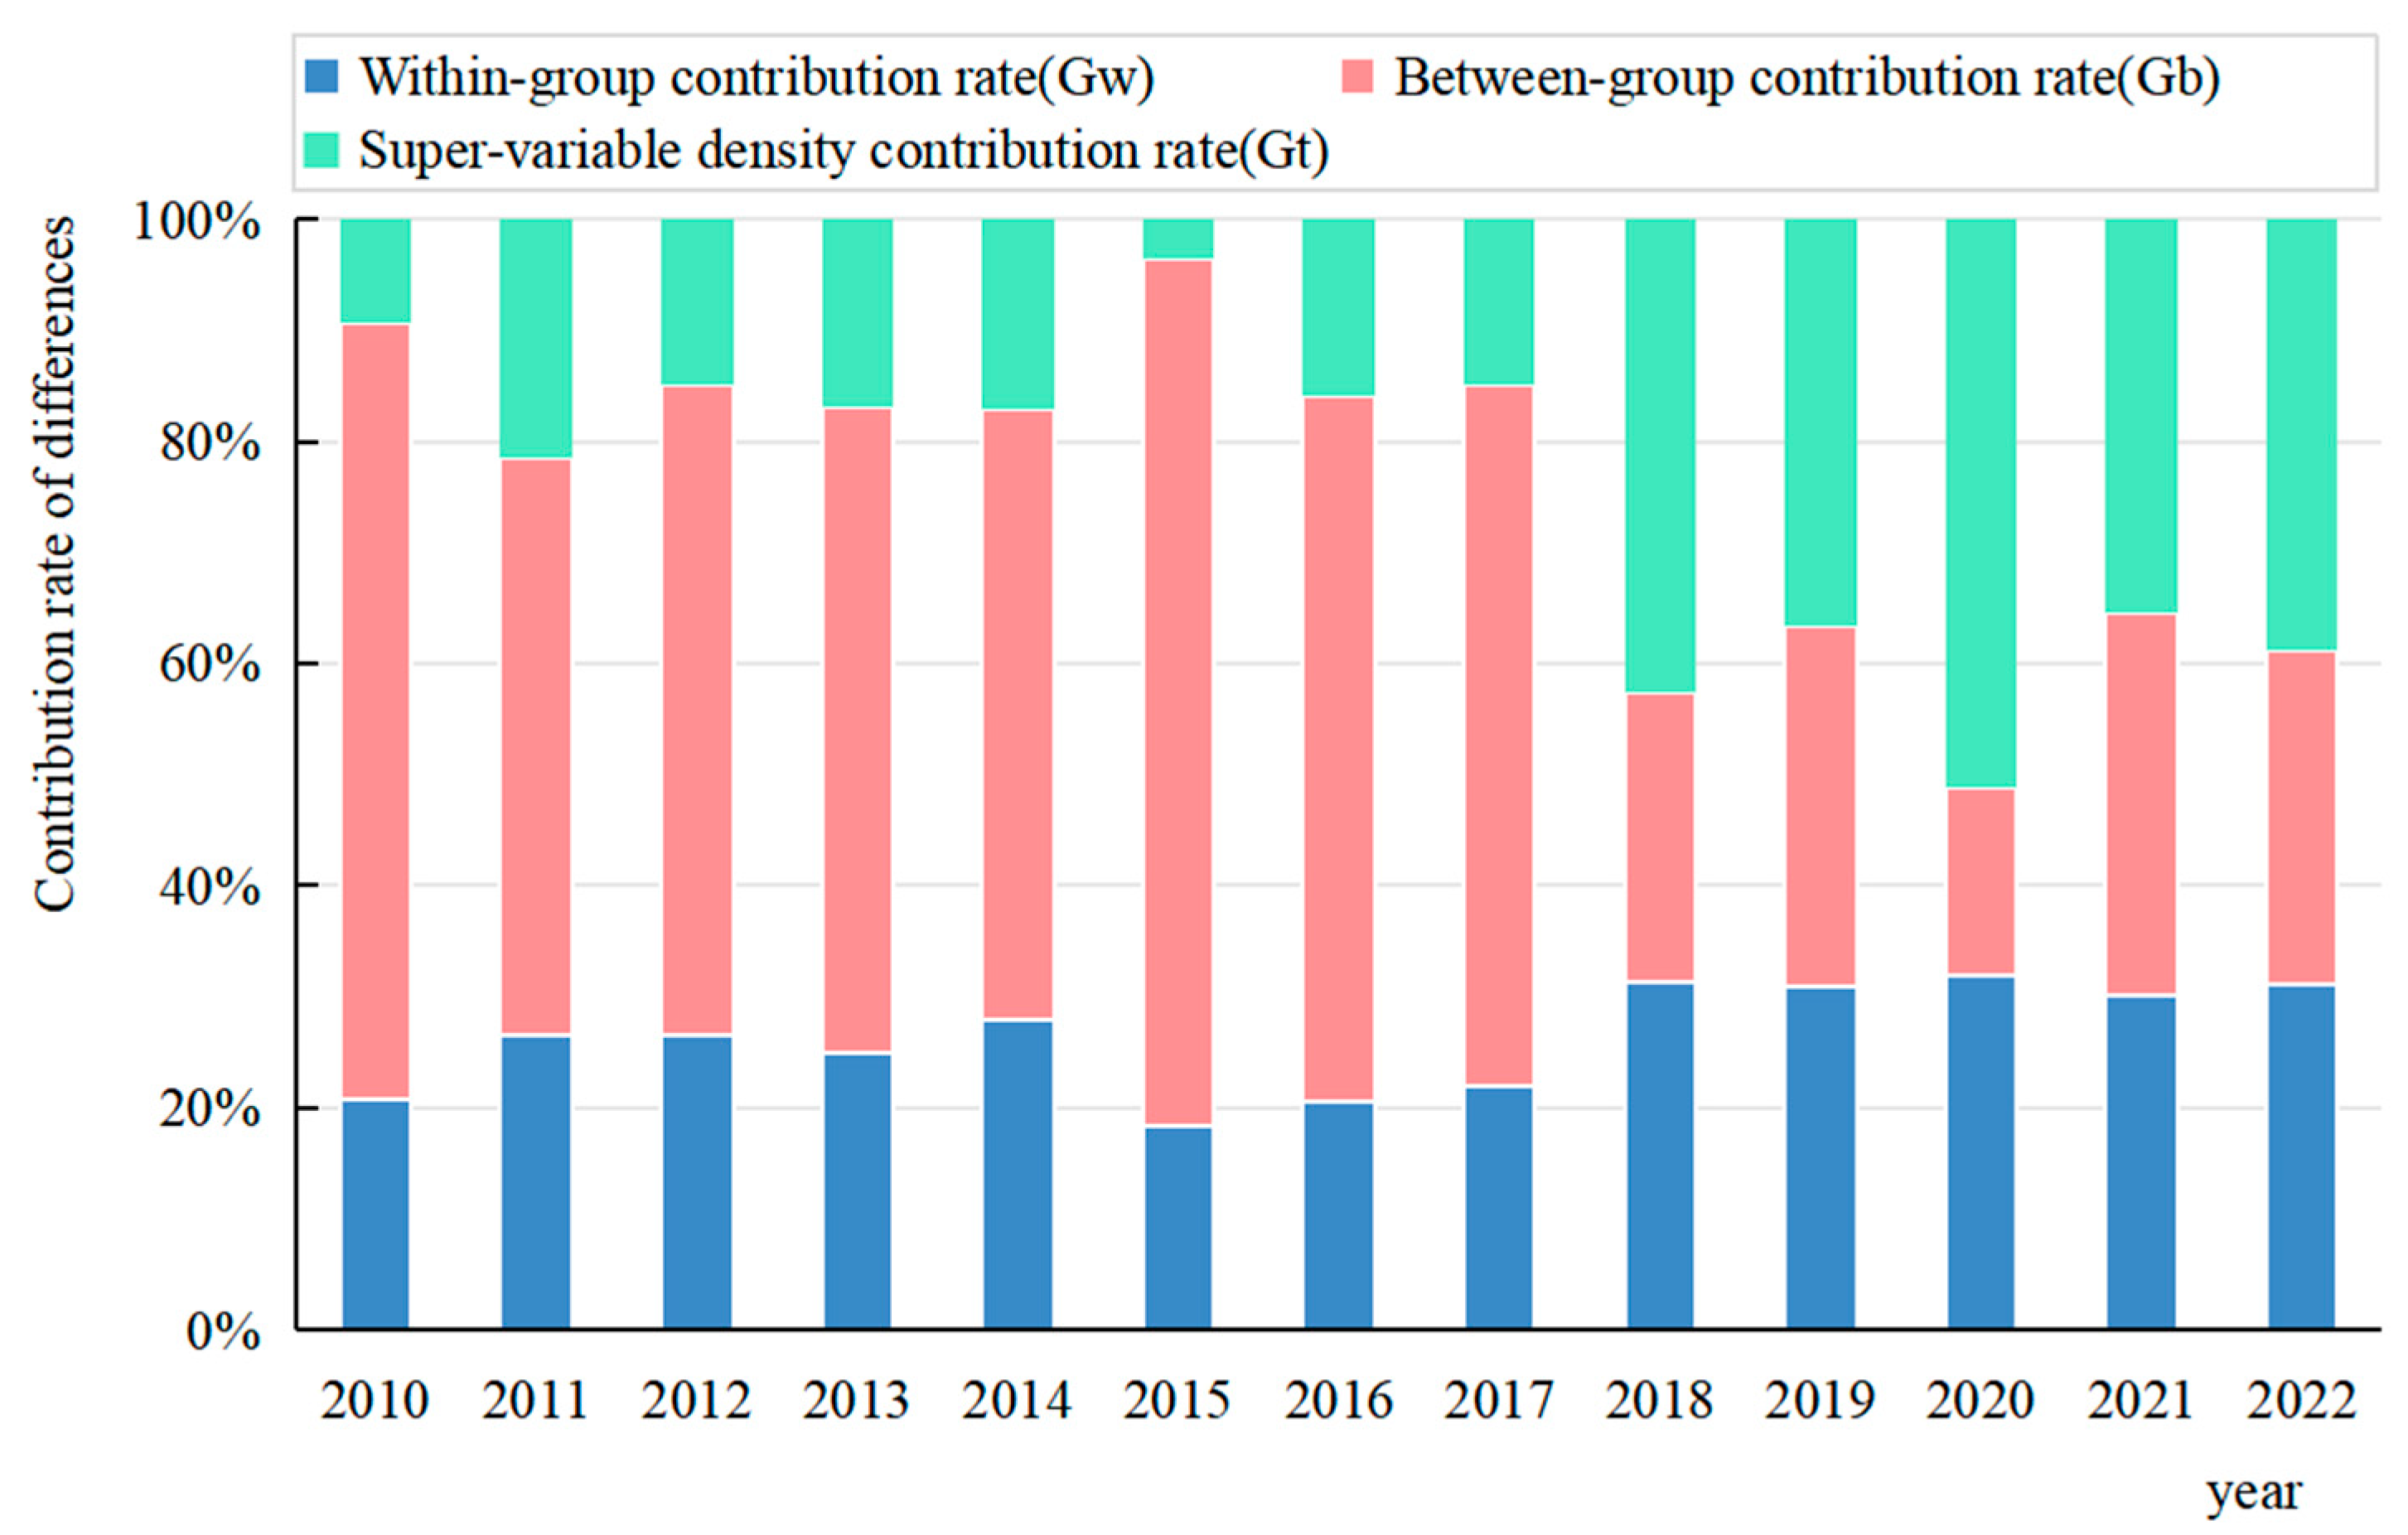
Narrowing disparities with emerging structural contradictions. Regional disparities in market integration decreased significantly: the overall Gini coefficient declined from 0.153 (2010) to 0.104 (2022)—a 32.0% reduction. However, intraregional differentiation intensified as downstream Gini index values rose from 0.062 to 0.077 and midstream from 0.088 to 0.107. Concurrently, super-variable density contribution surged from 9.3% to 38.8%, becoming the primary source of variation and signaling accelerated multicenter network formation. While narrowing overall disparities benefit regional coordination, emerging multicenter complexity necessitates targeted policies: cultivate secondary centers to alleviate core-city siphoning pressure, enhance subregional collaboration, optimize resource allocation, and strengthen cross-regional infrastructure/institutional coordination among network nodes.
(3)
Multifactor synergy drives market integration. Industrial structure upgrading and economic development are core drivers. Financial development and internet penetration exert significant positive effects, while foreign openness shows stage-specific negative effects. The positive effects confirm high-quality development as fundamental to integration, with financial systems reducing transaction costs and digital infrastructure lowering information barriers. The openness paradox must be contextualized within the basin’s significant resource endowment disparities and distinct developmental gradients.

Author Contributions

Conceptualization, C.T. and C.W.; Methodology, C.T. and X.J.; Software, C.T. and Z.J.; Validation, Z.J.; Writing—original draft, C.T. and C.W.; Writing—review & editing, X.J.; Supervision, C.W.; Funding acquisition, C.W. All authors have read and agreed to the published version of the manuscript.

Funding

This research was funded by the Major Project of Key Research Bases for Humanities and Social Sciences Funded by the Ministry of Education of China (Grant No. 22JJD790015), the National Natural Science Foundation of China Youth Science Foundation Project (Grant No. 42201182).

Institutional Review Board Statement

Not applicable.

Informed Consent Statement

Not applicable.

Data Availability Statement

The original contributions presented in this study are included in the article. Further inquiries can be directed to the corresponding author.

Conflicts of Interest

The authors declare no conflicts of interest.

References

  1. Yao, C.; Ke, Z.; Xiao, C. Ecological protection and high-quality development of the Yellow River Basin. Reg. Econ. Rev. 2020, 1, 8–22. [Google Scholar]
  2. Havens, R.; Balassa, B. The Theory of Economic Integration. J. Political Econ. 1961, 29, 47. [Google Scholar] [CrossRef]
  3. North, D. Institutions, Institutional Change and Economic Performance; Cambridge University Press: Cambridge, UK, 1990. [Google Scholar]
  4. Krugman, P. Increasing Returns and Economic Geography. NBER Work. Pap. 1990, 99, 483–499. [Google Scholar]
  5. Bai, C.; Du, Y.; Tao, Z.; Tong, S. Local protectionism and industrial concentration in China: Overall trend and important factors. Econ. Res. J. 2004, 4, 29–40. [Google Scholar]
  6. Parsley, D.; Wei, S. Convergence to the law of one price without trade barriers or currency fluctuations. Q. J. Econ. 1996, 111, 1211–1236. [Google Scholar] [CrossRef]
  7. Qi, G.; Min, C.; Ming, L. China’s Domestic Commodity Market Toward Segmentation or Consolidation: An Analysis Based on the Relative Price Approach. J. World Econ. 2006, 12, 20–30. [Google Scholar]
  8. Naughton, B. How Much Can Regional Integration Do to Unify China’s Markets? In Proceedings of the Conference for Research on Economic Development and Policy, Stanford, CA, USA, 18–21 November 1999. [Google Scholar]
  9. Zi, L.; Ru, Y.; Gui, T. Intra-national Trade Costs, International Trade Costs and the Promotion of the Domestic Circulation of China. Chin. Ind. Econ. 2022, 2, 62–79. [Google Scholar]
  10. Li, Y.; Guo, G. The evolution of ecology and environmental response to the regional economic integration and the influence factors in Jilin province. Geogr. Sci. 2014, 34, 464–471. [Google Scholar]
  11. Chun, T.; Yue, R. Measurement of Urban and Rural Integration Level in Chinese Province Based on Intuitionistic Fuzzy Method. Econ. Geogr. 2016, 36, 52–59. [Google Scholar]
  12. Jian, S.; Yu, S.; Li, C. The Process of Market Integration in China: Trends, Effects and Suggestions. Soc. Sci. J. 2021, 3, 57–170. [Google Scholar]
  13. Xin, H.; Shan, C.; Teng, L. Price Differences, Market Segmentation and Border Effects: Empirical Evidence from 15 Cities in the Yangtze River Delta. Econ. Res. J. 2014, 49, 18–32. [Google Scholar]
  14. Yong, Q.; Hang, Y. Market Integration, Spatial Spillover and Regional Export Quality Upgrading—Based on the Experience Analysis of Market Integration in the Yangtze River Delta. J. Int. Trade 2021, 10, 1–16. [Google Scholar]
  15. Xiao, L. Research on the Measurement of Beijing-Tianjin-Hebei Regional Market Integration. Price Theory Pract. 2020, 4, 76–79. [Google Scholar]
  16. Yuan, L.; Li, C.; Yuan, Z. Measurement and Influencing Factors of Labor Market Integration in the Chengdu-Chongqing Economic Circle. China Soft Sci. 2023, 10, 88–97. [Google Scholar]
  17. Jian, W. Spatial-temporal patterns and influencing factors of market segmentation in China. Sci. Geogr. Sin. 2018, 38, 1988–1997. [Google Scholar]
  18. Dong, L.; Xin, F.; Xin, Z. Regional Development Strategies, Market Segmentation and Economic Growth—An Empirical Analysis Based on the Relative Price Index Approach. Financ. Trade Econ. 2014, 8, 115–126. [Google Scholar]
  19. Santamaría, M.; Ventura, J.; Yeilbayraktar, U. Borders within Europe. Political Econ. Dev. Domest. Dev. Strateg. J. 2020. [Google Scholar] [CrossRef]
  20. Bing, L.; Jun, Z. The Analysis on the Influencing Factors of Regional Market Segmentation and Its Spatial Neighbor Effects: Based on the Panel Data of China’s Provinces in 1989–2014. Econ. Geogr. 2018, 38, 36–45. [Google Scholar]
  21. Wei, X.; Tian, J. Has the Market Integration Improved the Urban Economic Efficiency of the Yangtze River Delta Urban Agglomeration? A Study from the Perspective of “Local-Neighborhood” Effect and It’s Transmission Mechanism. East China Econ. Manag. 2022, 36, 35–43. [Google Scholar]
  22. Xi, C.; Fang, Y. Policy Effect Evaluation of Government-Led Regional Integration Strategy from a Coordinated Development Perspective: Evidence from Residents’ Income in 9 Provinces of the Pan-Pearl River Delta. Guizhou Soc. Sci. 2020, 5, 125–133. [Google Scholar]
  23. Jun, M.; Pei, H. Impacts of Market Integration on Ecological Efficiency Under the Dual Carbon Target in the Yangtze River Delta. Resour. Environ. Yangtze Basin 2025, 34, 937–949. [Google Scholar]
  24. Hong, Z.; Yue, X.; Gao, Y.; Jian, L. Research on the Welfare Effects of Building a Unified National Market. J. Manag. World 2025, 41, 15–40. [Google Scholar]
  25. Meng, Q.; Xiu, L.; Xiao, N. Regional Central City Scale, Market Integration and Coordinated Development of Urban-rural Areas. Financ. Trade Econ. 2025, 46, 159–176. [Google Scholar]
  26. Lan, L. Logical Framework and Theoretical Explanation of China’s Regional Coordinated Development Strategy. Econ. Perspect. 2020, 10, 19–35. [Google Scholar]
  27. Xiao, R.; Guan, L.; Rui, W. Development of Digital Economy, Marketization of Factors and the Changes in Regional Gaps. China Bus. Mark. 2022, 36, 55–70. [Google Scholar]
  28. Zhou, X.; Hao, H.; Ye, X.; Qin, Y.; Ma, X. A spatial-temporal analysis of regional economic inequality in Yellow River Valley. Hum. Geogr. 2016, 31, 119–125. [Google Scholar]
  29. Man, J.; Shan, X. Jing-Jin-Ji Regional Market Segmentation and Integration Over Time and Space. Nankai J. (Philos. Lit. Soc. Sci. Ed.) 2015, 1, 97–109. [Google Scholar]
  30. Bing, L. On The Trend of Regional Market Integration: Measurement and Analysis on Chinese Commodity Market Segmentation Based on City Data. Econ. Theory Bus. Manag. 2020, 40, 13. [Google Scholar]
  31. Mao, Q.; Sheng, B. Economic Opening, Regional Market Integration and Total Factor Productivity. China Econ. Q. 2012, 11, 181–210. [Google Scholar]
  32. Jia, W.; Lian, F.; Bo, L. Regional Differences, Dynamic Evolution and Convergence of Market-based Allocation Efficiency of Data Factors. Stat. Decis. 2023, 39, 143–148. [Google Scholar]
  33. Lu, Z.; Guo, L.; Xiao, L. Spatial differentiation and driving factors of urban economic resilience from the perspective of industrial structure upgrading. Geogr. Sci. 2024, 44, 577–1586. [Google Scholar]
  34. Hao, W.; Wei, W. Pattern Evolution and Spatial Spillover Effect of Urban Resilience in the Yangtze River Delta. Geogr. Geo-Inf. Sci. 2024, 40, 57–66. [Google Scholar]
  35. Xiao, W. Can digital inclusive finance promote the Internet business model? Empirical evidence from Chinese listed firms. Theory Pract. Financ. Econ. 2025, 46, 19–26. [Google Scholar]
  36. Hui, Z.; Han, Z.; Ren, J. Does Smart City Construction Promote New Urbanization and Market Integration: Can We Have Both? Trop. Geogr. 2023, 43, 681–694. [Google Scholar]
  37. Xue, L.; Yu, Z.; Bo, S. Does regional integration promote the efficiency of economic growth? an empirical analysis of the Yangtze River Economic Belt. China Population. Resour. Environ. 2017, 27, 10–19. [Google Scholar]
  38. Ling, W.; Ran, W. Impact of Market Integration on FDI in Guangdong-Hong Kong-Macao Greater Bay Area: Analysis based on fixed effect and heterogeneity test. Sci. Technol. Ind. 2021, 21, 58–65. [Google Scholar]
  39. Shu, Z.; Xin, W.; Geng, J. The relationship between regional structural imbalance of China’s foreign trade and regional income disparity. Financ. Trade Econ. 2009, 5, 85–90. [Google Scholar]
  40. Li, L.; Jing, L.; Yang, L. Dose Foreign Direct Investment Promotes the Coordinated Development of Regional Economy in the Yangtze River Economic Belt: A Spatial Convergence Analysis. Inq. Into Econ. Issues 2020, 3, 123–134. [Google Scholar]
  41. Bin, W.; Hai, H.; Zhi, Z. The impact of digital financial development on the integration of our markets and the mechanisms at play. J. Commer. Econ. 2023, 11, 107–111. [Google Scholar]
  42. Xia, Z.; Yong, X. Digital Distribution, Unified National Market and Dual Circulation of Domestic and International Markets. J. Bus. Econ. 2024, 3, 18–32. [Google Scholar]
  43. Miao, M. Research on the Impact of Agricultural Product Circulation Digitalization on China’s Market Integration: Empirical test based on panel threshold model. J. Commer. Econ. 2025, 9, 108–111. [Google Scholar]
  44. Feng, J. Coordinated Promotion Strategy of Ecological Protection and High-quality Development in the Yellow River Basin. Reform 2019, 11, 33–39. [Google Scholar]
  45. Jin, Z.; Chao, T.; Jiao, X.; Miao, Y.; Cheng, W. The Integrated Development and Regional Disparities of Urban Agglomerations in the Yellow River Basin, China. Sustainability 2024, 16, 10353. [Google Scholar] [CrossRef]
  46. Kanbur, R.; Zhang, X. Fifty Years of Regional Inequality in China: A Journey Through Central Planning, Reform and Openness. Rev. Dev. Econ. 2005, 9, 87–106. [Google Scholar] [CrossRef]
  47. Miao, C.; Hu, Z.; Geng, F.; Miao, J. Characteristics of Economic Evolution and the Influencing Factors of Resource-Dependent Cities in China: The role of Path Dependence, Vulnerability and Path Creation. Geogr. Res. 2018, 37, 1268–1281. [Google Scholar]
Figure 1. Map of the study area.
Sustainability 17 06920 g001
Figure 2. Temporal evolution of market integration level in the Yellow River Basin.
Sustainability 17 06920 g002
Figure 3. Spatiotemporal heat map of provincial-level market integration in the Yellow River Basin.
Sustainability 17 06920 g003
Figure 4. Spatiotemporal evolution of market integration of prefecture-level cities in the Yellow River Basin.
Sustainability 17 06920 g004
Figure 5. Dagum Gini decomposition of market integration levels in the Yellow River Basin.
Sustainability 17 06920 g005
Figure 6. Sources of differences and contribution rates in market integration in the Yellow River Basin.
Sustainability 17 06920 g006
Table 1. Dagum Gini coefficient.
YearWithin-Group Gini CoefficientBetween-Group Gini Coefficient
UpstreamDownstreamMidstreamUpstream and DownstreamUpstream and MidstreamDownstream and Midstream
20100.1880.0620.0880.2750.2240.095
20110.160.120.0710.1890.1980.101
20120.10.1460.0420.1440.0860.153
20130.0440.0660.1370.1140.1510.107
20140.0770.050.1420.0750.1230.136
20150.1790.0390.0950.2960.2320.092
20160.0680.0420.1510.1750.1250.173
20170.0920.0280.130.1290.1130.154
20180.1120.0410.1130.0840.1140.083
20190.1180.0710.1150.1150.1250.097
20200.1120.0650.1110.0970.1160.091
20210.1390.0690.0890.1230.1330.081
20220.1080.0770.1070.1040.1270.097
Table 2. Factors influencing market integration in the Yellow River Basin.
Influencing FactorsIndicator Explanation
Advanced Industrial StructureValue added of the tertiary sector/value added of the secondary sector
Economic Development LevelGDP per capita
Level of OpennessActual utilization of foreign investment/GDP
Degree of Financial DevelopmentYear-end balance of loans and deposits of financial institutions/GDP
Internet Penetration RateNumber of internet users per 10,000 people/resident population
Table 3. Test results of the regression model of market integration in the Yellow River Basin.
Test TypeTest ValueTest Conclusion
FF(71,787) = 6.486, p = 0.000Model 1 (FE)
BPχ2(1) = 54.242, p = 0.000Model 2 (RE)
Hausmanχ2(4) = 724.876, p = 0.000Model 3 (FE)
Table 4. Calculated results of panel regression model for the Yellow River Basin (FE model).
ItemCoeff.Std. Err.tp95% CI
Intercept−0.6090.06−10.0960.000 ***−0.728~−0.491
Advanced Industrial Structure0.9060.1058.6550.000 ***0.701~1.112
Economic Development Level1.2390.11410.8880.000 ***1.016~1.462
Level of Openness−0.4890.148−3.3120.001 ***−0.779~−0.200
Degree of Financial Development0.4890.1423.4520.001 ***0.211~0.767
Internet Penetration Rate0.8430.1655.1040.000 ***0.520~1.167
R2 = −0.231, R2 (within) = 0.499; *** p < 0.01, ** p < 0.05, * p < 0.1.
Disclaimer/Publisher’s Note: The statements, opinions and data contained in all publications are solely those of the individual author(s) and contributor(s) and not of MDPI and/or the editor(s). MDPI and/or the editor(s) disclaim responsibility for any injury to people or property resulting from any ideas, methods, instructions or products referred to in the content.

