Article

Assessing Critical Risk Factors to Sustainable Housing in Urban Areas: Based on the NK-SNA Model

1
College of Management and Economics, Tianjin University, Tianjin 300072, China
2
National Industry-Education Platform for Energy Storage, Tianjin University, 135 Yaguan Road, Tianjin 300350, China
3
School of Management, Zhejiang University of Technology, Hangzhou 310018, China
*
Author to whom correspondence should be addressed.
Sustainability 2025, 17(15), 6918; https://doi.org/10.3390/su17156918
Submission received: 2 July 2025 / Revised: 19 July 2025 / Accepted: 29 July 2025 / Published: 30 July 2025

Abstract

Housing sustainability is a cornerstone element of sustainable economic and social development. This is particularly true for China, where high-rise residential buildings are the primary form of housing. In recent years, China has experienced frequent housing-related accidents, resulting in a significant loss of life and property damage. This study aims to identify the key factors influencing housing sustainability and provide a basis for the prevention and control of housing-related safety risks. This study has developed a housing sustainability evaluation indicator system comprising three primary indicators and 16 secondary indicators. This system is based on an analysis of the causes of over 500 typical housing accidents that occurred in China over the past 10 years, employing research methods such as literature reviews and expert consultations, and drawing on the analytical frameworks of risk management theory and system safety theory. Subsequently, the NK-SNA model, which significantly outperforms traditional models in terms of adaptive learning and optimization, as well as the explicit modeling of complex nonlinear relationships, was used to identify the key risk factors affecting housing sustainability. The empirical results indicate that the risk coupling value is correlated with the number of risk coupling factors; the greater the number of risk coupling factors, the larger the coupling value. Human misconduct is prone to forming two-factor risk coupling with housing, and the physical risk factors are prone to coupling with other factors. The environmental factors easily trigger ‘physical–environmental’ two-factor risk coupling. The key factors influencing housing sustainability are poor supervision, building facilities, the main structure, the housing height, foundation settlement, and natural disasters. On this basis, recommendations are made to make full use of modern information technologies such as the Internet of Things, big data, and artificial intelligence to strengthen the supervision of housing safety and avoid multi-factor coupling, and to improve upon early warnings of natural disasters and the design of emergency response programs to control the coupling between physical and environmental factors.

1. Introduction

Housing sustainability is an important component of urban public safety and resident well-being. In recent years, China has experienced a series of housing collapse incidents, resulting in a significant loss of life and property damage. For example, on 12 July 2021, an annex building of a beverage management service company in Suzhou, Jiangsu Province, collapsed during renovation due to the unauthorized removal of load-bearing walls, resulting in 17 deaths, 5 injuries, and direct economic losses of approximately CNY 26.15 million (https://baijiahao.baidu.com/s?id=1772439741851050488&wfr=spider&for=pc, accessed on 26 July 2023); on 29 April 2022, a particularly severe collapse of a self-built residential building occurred in Jinping Community, Changsha City, Hunan Province, resulting in 54 deaths, 9 injuries, and direct economic losses of CNY 90.7786 million (https://baike.baidu.com/tashuo/browse/content?id=cf48fae3db2887c0630f3034, accessed on 18 July 2025).
Electrical aging and other factors leading to residential fires are another significant form of residential accidents. According to the latest data released by the National Emergency Rescue Administration of China, from January to October 2024, a total of 770,000 fires were reported nationwide, resulting in 1,559 deaths. Among these, 154,000 fires occurred in self-built houses, resulting in 646 deaths, accounting for nearly half of the total number of deaths (https://mp.weixin.qq.com/s/FGW6YIxyQpATlCMqpc3urg, accessed on 9 November 2024). On 25 September 2024, the National Fire Rescue Administration (NFRA) held a press conference, pointing out that fires in high-rise buildings in China have been on the rise in recent years. In the first eight months of 2024, a total of 36,000 fires were reported, already exceeding the total number for the entire year of 2023. The frequent occurrence of residential fires not only poses a threat to property, owners, and residents but also causes significant losses to national and social property.
Collapses and fires during the occupancy phase of buildings are occurring with increasing frequency. However, scholars and practitioners have traditionally focused primarily on safety and sustainability issues during the design and construction phases, with relatively little attention paid to the occupancy phase. The limited existing research in this area has primarily focused on scattered qualitative analyses of factors affecting safety during building use, such as structural aging, foundation settlement, inadequate maintenance, the removal of load-bearing walls, liquefied petroleum gas cylinder explosions, natural disasters like typhoons and heavy rains, illegal renovations, and design or construction defects (see the literature review below for details). Housing accidents are characterized by suddenness, unpredictability, the potential to trigger secondary disasters, and the difficulty of rescue operations, often resulting in severe consequences. Based on the aforementioned practical and theoretical background, this study aims to systematically analyze the factors influencing safety risks during the housing use phase, with a focus on identifying key risk factors and examining the intrinsic interdependencies among these risk factors.

2. Review of Relevant Research

2.1. Factors Affecting Housing Sustainability

By combing through the literature, it was found that housing sustainability mainly derives from three aspects: design or construction defects, improper use or maintenance, and the impact of adjacent construction.
The quality of housing mainly depends on the quality of design and construction [1]. In practice, there is a lack of understanding among some designers of design codes and methods and correct calculation models, a lack of experience in judging the correctness of the results of structural electrical calculations, and a lack of full consideration of the surrounding environment of the location during housing design. This leads to significant defects in the structural design of the building itself, affecting the actual service life of the house [2]. Deficient construction quality inevitably leads to a reduction in the strength and stability of the house, shortening the service life. The current quality problems in housing construction projects mainly stem from the lack of construction supervision, and some construction enterprises are driven by economic interests to use raw materials of substandard quality or cut corners by other means [3,4]. Some developers put forward unreasonable construction schedule requirements, and construction enterprises have reduced necessary inspection and supervision in order to catch up with construction schedules, which has left a hidden quality problem [5]. In the construction process, the existence of illegal subcontracting and dependence seriously disrupts the order of the construction market and threatens the quality and safety of projects [6].
The improper use of housing refers to the modification of the original design, such as arbitrarily increasing the floor load and increasing the number of walls and floors. This can result in serious overloading, which may lead to cracking, tilting, collapsing, and other major accidents in serious cases [7,8]. In addition, the process of housing renovation often involves randomly chiseling and punching holes of walls, the unauthorized dismantling and alteration of the main body of the house structure, and other intense renovation behavior, which seriously affects the normal service life of the house [9,10]. The performance of building materials gradually deteriorates with the age of the house through processes such as the charring and cracking of concrete, the fatigue and rusting of steel reinforcement, and the weathering and rotting of brick and wood structures [11]. Housing safety can be guaranteed under normal maintenance conditions and within the design service life. However, if maintenance, including the repair of cracks, waterproof and moisture-proof treatment, and termite control, is not timely, the rate of decay of the mechanical properties of the materials will accelerate, and the service life of the house will be greatly shortened [12,13].
Many large and medium-sized cities are building subways and tunnels in order to alleviate traffic pressure, and these municipal projects are often close to existing buildings, which can easily lead to the uneven settlement and cracking of the existing houses, potentially leading to dangerous housing conditions [14,15]. Currently, the number of urban high-rise buildings is increasing, including large-scale urban deep foundation pit projects. Such projects are close to existing buildings, and the deformation of the surrounding soil caused by the excavation of foundation pit projects has an adverse effect on these existing neighboring buildings, such as uneven settlement and superstructure cracking [16,17]. Building peripherals such as glass curtain walls, large billboards, and hanging brackets may also pose safety hazards, especially in coastal areas, which are susceptible to windstorms such as typhoons, tropical cyclones, and tornadoes due to geographic conditions and topographic features. Although wind-resistant calculations and designs are usually available for high-rise buildings, accidents associated with the above peripheral constructions and equipment still occur from time to time [18].

2.2. Risk Factor Analysis Methods

Currently, the commonly used risk factor analysis methods include the barrier model and fault tree [19], Bayesian network model [20], fuzzy comprehensive evaluation model [21], NK model [22], social network analysis [23], SHEL model [24], etc. Barrier models are suitable for linear, static systems. If risk factors involve complex interactions (e.g., dynamic coupling of organizational, human factors), barrier models have difficulty capturing non-physical correlations [25]. Fault trees and Bayesian networks rely on explicit causal chains or probabilistic parameters and are suitable for the quantitative analysis of known risk pathways [26]. Fuzzy integrated evaluation is suitable for quantifying subjective indicators (e.g., expert scoring to assess risk levels), but it finds it difficult to deal with dynamic network relationships [27]. While the SHEL model focuses on HMI risks, it is a static framework and cannot model cross-level interactions [28]. Therefore, based on the characteristics of the safety risks of housing use, none of these approaches are very applicable.
The NK model can simulate systems of different complexity by adjusting the parameters N (number of components) and K (degree of interdependence between components) and is suitable for a variety of scenarios. The model is based on actual accident date, making its analysis more objective [29]. Currently, the NK model is widely used in biology, economics, management, engineering, and other fields. For example, Zhou and Liu (2024) analyzed the coupling between the risk factors of petrochemical storage tank accidents based on the NK model, calculated the risk coupling degree for various coupling modes, and derived the coupling relationships of the risk factors and the law of the coupling effect [30]. Zhao et al. (2023) calculated the probability and coupling values of 148 subway operation accidents that occurred with various coupling modes from 1969 to 2017 using the NK model [31]. Qiao et al. (2017) utilized the NK model to measure the degree of risk coupling of 375 major coal mine gas accidents that occurred from 2000 to 2014, and the results of the study showed that management factors and human factors were most involved in the risk coupling process of these accidents, resulting in higher risks [32]. Housing use safety risk has certain similarities with the above accident risks, so it is feasible to use the NK model to analyze the degree of coupling of risk factors in housing use accidents.
The social network analysis model (SNA) is especially advantageous for revealing the relationship structure, identifying key nodes, supporting dynamic analysis, etc. In particular, SNA can identify key nodes with high influence by analyzing the centrality indexes in the network. SNA modeling is a quantitative method used to study the structure of social relationships that has been increasingly applied in social sciences, business and economy, public management, and policy in recent years. The breadth and depth of its application is still expanding and is especially driven by big data and artificial intelligence technology, showing strong potential for development. For example, Wan and Lou (2021) constructed a financial core complex social relationship network model for bank retail customers to visualize and analyze the complex social relationships of risky customers [33]. Ding and Zhou (2021) quantified the structural features of a village social network model through SNA and derived the spatial distribution of public life demand in village houses via combination with a GIS [34].
In addition, some scholars have already combined the NK model with the SNA model, such as Wu et al. (2025), who analyzed the risk factors of high-rise residential fire accidents based on the NK model and SNA [35]. Shen et al. (2024) analyzed the safety risk factors of logistics and warehousing based on the NK and SNA models [36]. Qian et al. (2024) studied the coupling of risk factors of hydrogen energy storage and a transportation system based on a complex social network and the NK model [37], and Shao et al. (2023) analyzed the coupling of risk factors of the combustion and explosion of new energy vehicles based on the NK model and SNA [38]. These research results provided ideas and methods for this study.

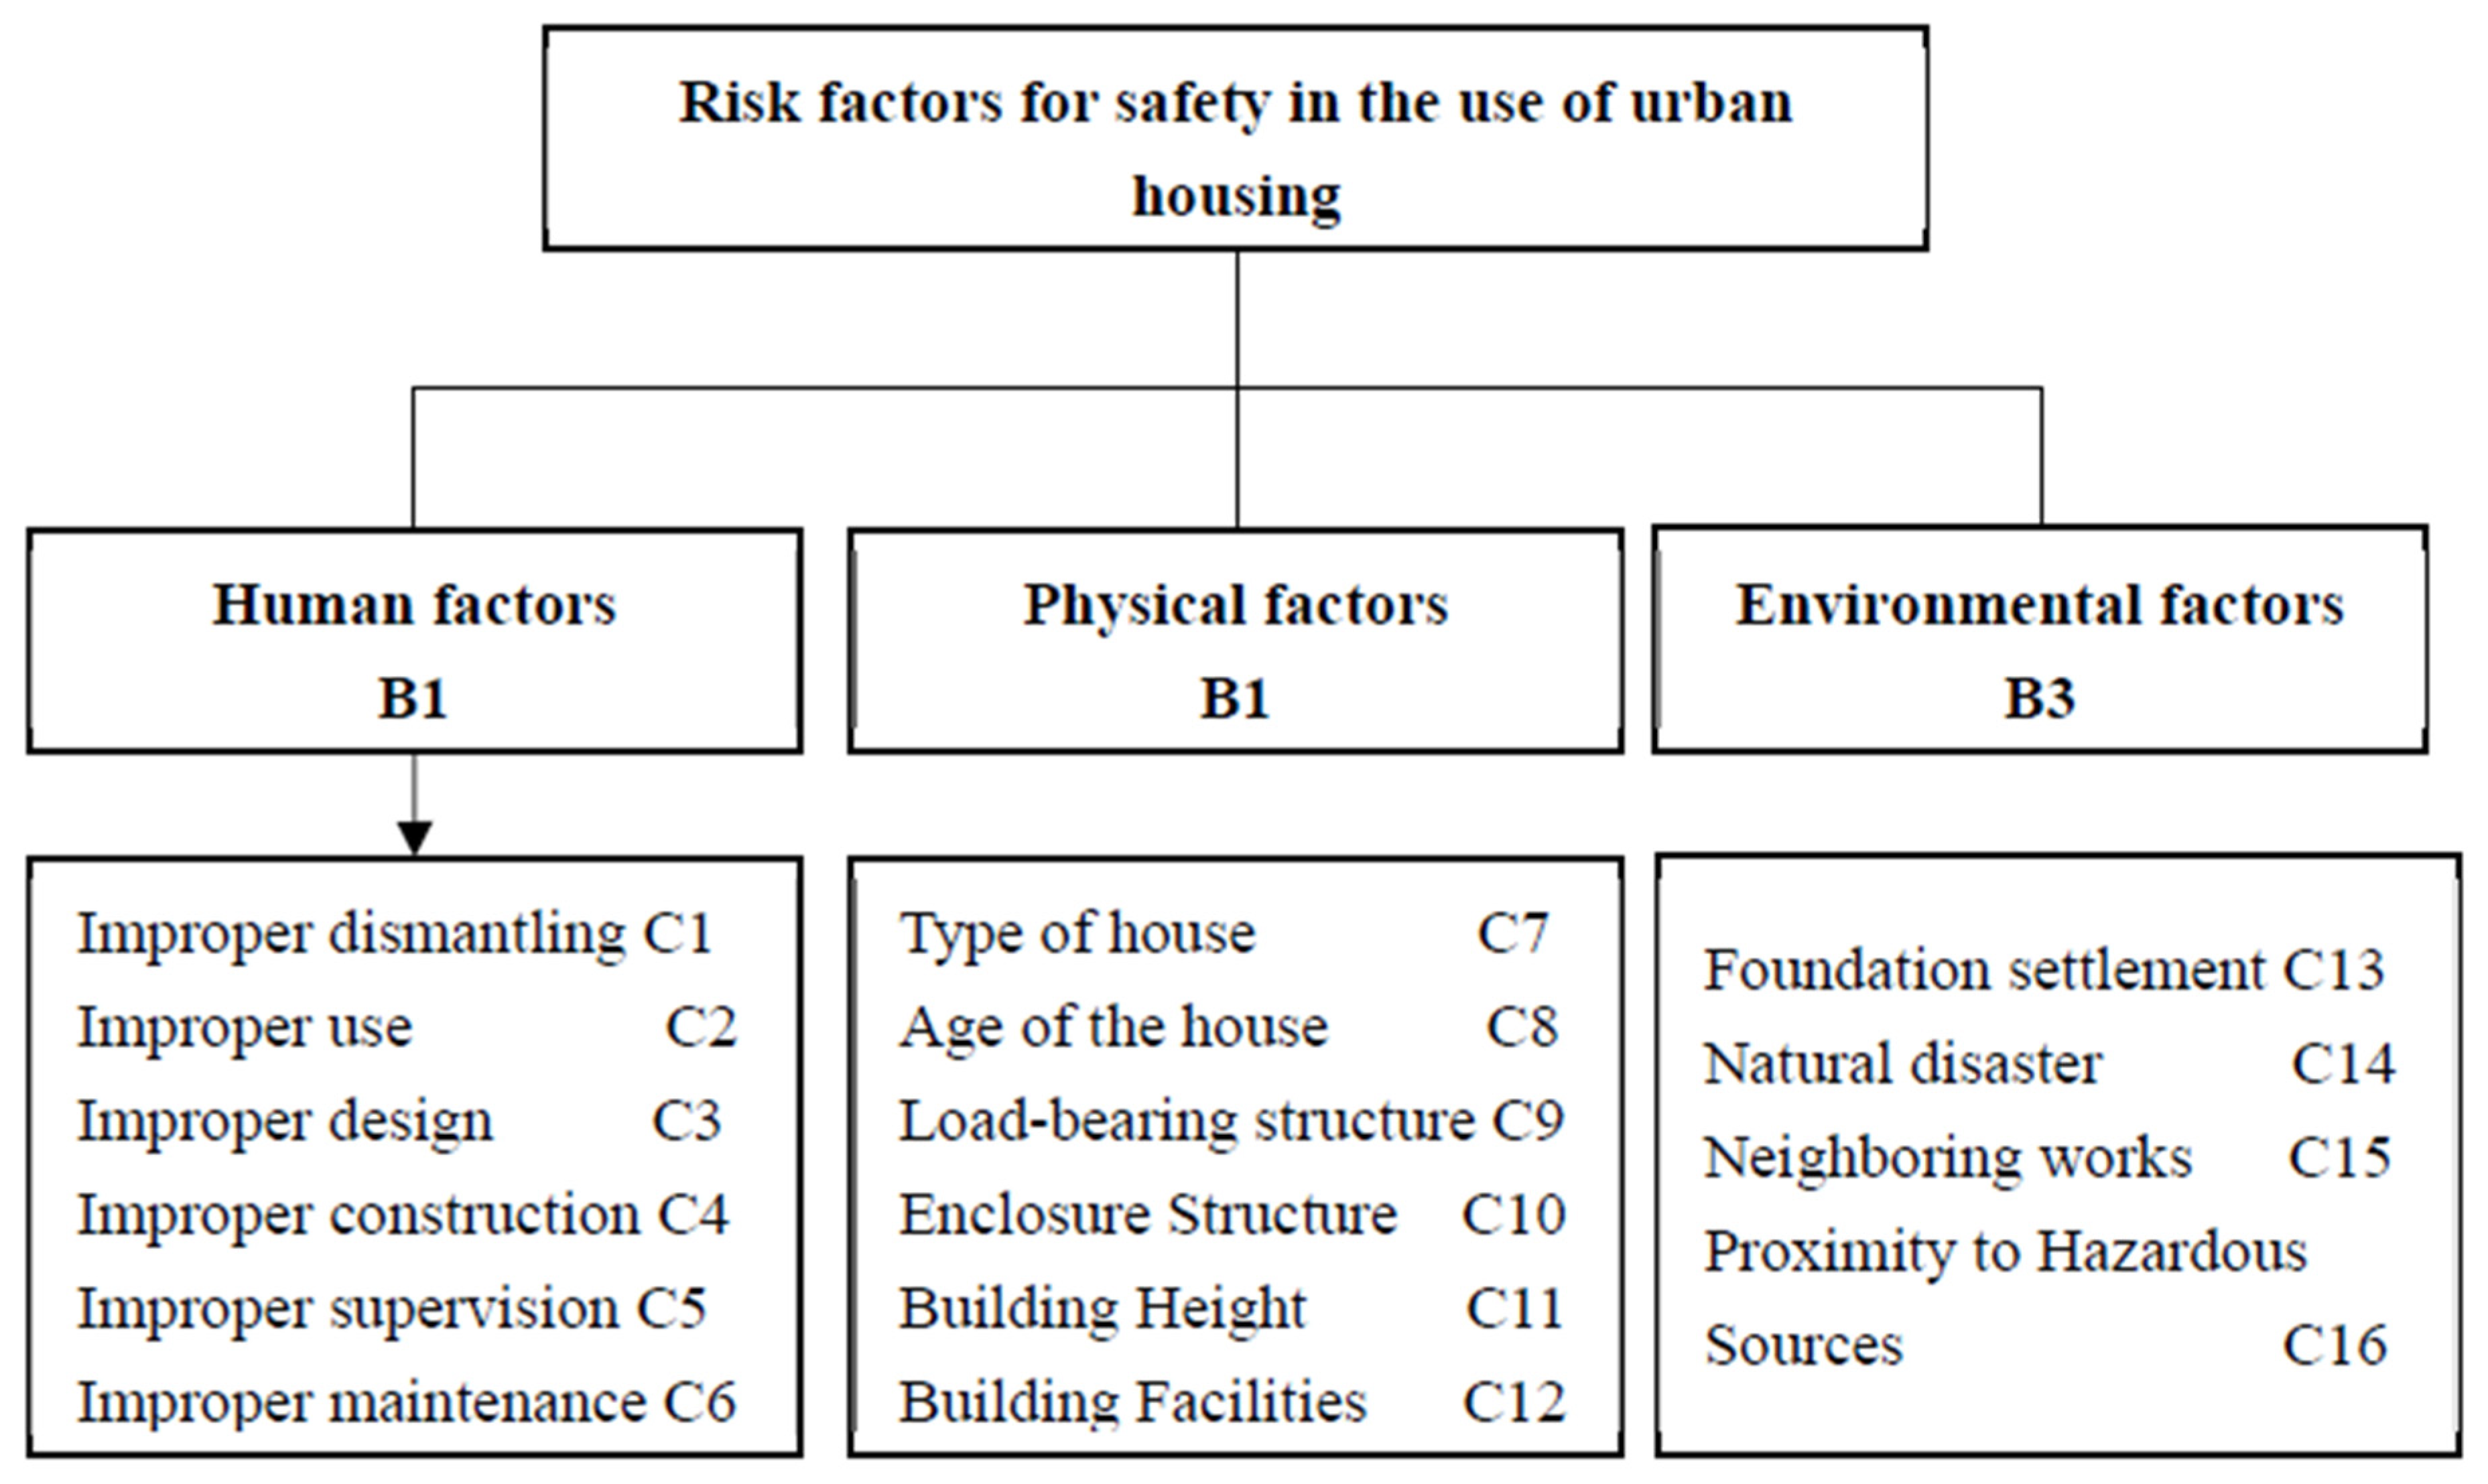
3. Evaluation System of Risk Factors for Urban Housing Sustainability

In this study, the causes of more than 500 housing accidents in the past 10 years were analyzed based on the risk management theory, system safety theory analysis framework, and a combination with the above literature review, expert consultation, field survey, and resident interviews. The factors affecting the sustainability of urban housing use were divided into three major first-level indexes, namely, human, physical, and environmental factors. Human factors include six second-level indexes such as illegal demolition and alteration and inadequate supervision, while environmental factors include four second-level indexes, such as foundation settlement and natural disasters. The human factors include six secondary indicators, such as illegal demolition and alteration and ineffective supervision; the physical factors include six secondary indicators, such as the nature, structure, and age of houses; and the environmental factors include four secondary indicators, such as foundation settlement and natural disasters, as shown in Figure 1.

3.1. Human Factors Affecting Housing Sustainability

The human factor involves mainly housing owners and users; government administrators; and design, construction, and property management personnel. Risks to the owner or user of the house mainly originate from illegal demolition and modification, improper use, and so on. Illegal demolition refers to the unauthorized demolition or alteration of the building structure by the owner or user of the house, thus changing the original stress state of the house. Improper use refers to the owner or user changing the use of the house, storing dangerous goods, or overloading the house. Illegal demolition and improper use may damage the original anti-seismic design, load-bearing structure, and fire service installations, resulting in the tilting, cracking, or even collapsing of the house and hindering escape and rescue in case of fire.
The risk point of government staff mainly derives from ineffective supervision. Due to the hidden nature of the safety problems associated with housing use, the relevant government departments may not be able to recognize safety issues in a timely manner and may lack manpower and material resources in government supervision, leading to lagging or ineffective supervision measures. The poor quality and safety of housing caused by irrational design or improper construction are also important risk points in housing use safety. In addition, property management personnel do not effectively supervise unauthorized construction, renovation, and decoration, and the inspection and maintenance of potential risk points such as lifts, gas, and charging facilities are not timely, which may also easily lead to the occurrence of accidents.

3.2. Physical Factors Affecting Housing Sustainability

The physical factors include the type, structure, age, height, facilities, and equipment of the house [39]. Houses of different types have different management systems, risk factors, and functional uses. The load-bearing structure of a building refers to the components that constitute the main load-bearing system of the building, including walls, beams, slabs, columns, and so on. These components are connected and supported by each other to form the skeleton of the building, bearing and transferring various loads to ensure the stability and safety of the building. The enclosure structure is an important combination of components that separates the indoor and outdoor environments in a building, and its main function is to provide safety and protection, heat preservation and insulation, moisture and waterproofing, sound insulation, and noise reduction. Falling object accidents are often related to the enclosure structure.
The main reason for the strong correlation between the age and safety of the house is that the building materials, such as steel reinforcement and concrete, deteriorate over time, leading to a decrease in structural strength. In addition, long-term use and natural factors (e.g., earthquakes and wind erosion) may lead to the deformation of the housing structure, affecting stability. The safety of the housing envelope is also an important factor in ensuring the safety of the housing, and problems such as cracking, collapse, and fires in external wall surfaces and curtain walls occur from time to time. High-rise housing buildings are huge, densely populated, and have many sources of danger, so it is very difficult for residents to escape in the event of a fire or earthquake. High-rise housing in the event of a fire produces the ‘chimney effect’, which refers to the vertical spread of smoke through the stairwells, pipe wells, glass curtain wall gaps, and other parts of building beyond a fire truck ladder’s maximum spray height of about 16 floors, making rescue more difficult. Housing facilities mainly include the water supply, power supply, heating, gas, and firefighting facilities. The pressure level, service life, state of use, and maintenance of housing facilities all have an impact on the safety of housing.

3.3. Environmental Factors Affecting Housing Sustainability

Environmental factors mainly include foundation settlement, natural disasters, the impact of neighboring works, proximity to hazards, and so on [40,41]. Foundation settlement is the vertical displacement of a building’s foundation under load. When foundation settlement occurs, especially uneven settlement, the house may tilt, crack, or even collapse. The impact of natural disasters on houses varies according to the type and intensity of the disaster, e.g., earthquakes may lead to wall cracking, foundation displacement, and in severe cases house collapse and may also lead to secondary disasters such as fires.
Neighboring works usually refers to engineering construction activities in the vicinity of an existing house. Neighboring works may damage houses due to changes in additional stress. In house excavation, for example, slope treatment may not be appropriate and it may result in foundation slip. Nearby hazards mainly include high-voltage power lines, substations, locations prone to fire or explosion, and sources of environmental pollution. Buildings close to high-voltage power lines and substations may be affected by electromagnetic radiation, potentially threatening the health of residents. In addition, fire-prone buildings like chemical factories and fireworks sales outlets may not only jeopardize the safety of residents in the event of a fire or explosion but may also cause serious damage to the surrounding environment. Buildings close to pollution sources such as factories and sewage treatment plants, on the other hand, may suffer from the effects of harmful gases, odors, and sewage.

4. Risk Evaluation Model for Urban Housing Sustainability

4.1. Fundamentals of the NK and SNA Models

The NK model is a mathematical model used to study complex, evolutionary biology and organization theory. In the NK model, N refers to the total number of elements in the system; if a system has N elements, each element has n states, then the system has a variety of states. K refers to the number of interdependent relationships between the elements. The minimum value of k is 0, and the maximum value is N − 1. If k is 0, it means that the elements in the system are independent of each other and do not affect each other; if k is not 0, it means that the elements in the system, in addition to being affected by their own elements, are affected by other elements in the system. The degree of coupling between the elements in the system is expressed by T. The larger T is, the more often these elements are coupled in a certain way, and the greater the risk of accidents. In the coupled NK model of urban housing use safety risk, the formula for calculating the interaction information by simultaneously considering the coupling of human, physical, and environmental factors is as follows:
T a , b , c = h = 0 H i = 0 I j = 0 J P h i j × log 2 P h i j P h × P i × P j
where T a , b , c denotes the coupling value of a in the state of h, b in the state of i, and c in the state of j. a, b, and c represent the three kinds of risk factors, where a represents the human factor, h is the state of the human factor, h = 0, 1, 2, ⋯, H, and H is the number of types of human factors; b represents the physical factor, i is the state of the physical factor, i = 0, 1, 2, ⋯, I, and I is the number of types of physical factors; and c represents the environmental factor, j is the state of the environmental factor, j = 0, 1, 2, ⋯, J, and J is the number of types of environmental factors. P hij denotes the probability that the coupling of three risk factors occurs when a is in state h, b is in state i, and c is in state j.
SNA is a model that can be used to study the relationship between different individuals and between individuals and groups, focusing on network relationships and network structure. The social structure is seen as a network formed by nodes existing as ‘points’ and links existing as ‘lines’. Centrality analysis is common in the analysis of complex social networks and mainly includes the analysis of proximity centrality and mediation centrality. Proximity centrality refers to the degree of proximity between a node and other nodes in the network; the greater the proximity centrality of a node, the closer the point is to other points, which can reveal the critical degree of transmission of risk factors in the entire network [35]. In housing risk analysis, the higher the closeness centrality of a risk factor, the closer its relationship with other risk factors, revealing the critical extent of its transmission within the entire network. The closeness centrality can be considered as the inverse of the sum of the shortest paths of the node to all other nodes in the network. For a complex network with n nodes, the closeness centrality of node i is calculated as follows:
C c ( i ) = j = 1 n d ( i , j ) 1   i     j
where d (i, j) denotes the network distance from node i to node j. The formula emphasizes the inverse of the sum of the paths between a node and other nodes, thus measuring the proximity of the node in the network. Thus, a higher proximity centrality implies that the nodes have a closer proximity in the network and may play a more critical role in information transfer.
Mediated centrality is concerned with the rate of a node acting as a bridge between other nodes; if a node is often used as part of the shortest path between two nodes, then this node has a high mediated centrality. The importance of a node is determined by the number of shortest paths of the node, which determines the ability of a node in the risk network to control the entire system network and is calculated as follows:
C B ( i ) = j n k n b j k ( i ) = j n k n g j k ( i ) g j k        j     k     i ,   j   <   k
where b jk ( i ) indicates the probability that intermediate point i is located on the shortcut between points j and k, which reflects the control ability of point i for connecting points j and k; g j k ( i ) indicates the number of shortcuts that exist between points j and k via point i; and g jk indicates the total number of shortcuts that exist between points j and k. The calculation takes into account the presence of the node in all the shortest paths and emphasizes the node’s ability to control the flow of information. For example, in terms of housing safety risks, the risk of house collapse caused by natural disasters is often related to inadequate supervision or defects in the houses themselves, and defects in the houses themselves may also be related to inadequate supervision. Therefore, inadequate supervision is the most critical risk factor in the shortest path.

4.2. NK and SNA Fusion Modeling Approach

The NK and SNA models are two different analytical frameworks for the study of complex systems and social networks, respectively. The NK model uses case data to reflect the likelihood of accidents occurring with different combinations of risk factors to help understand the interactions and adaptations in a complex system, but it is less interpretable, making it difficult to identify the key factors that should be focused on in risk management. In contrast, the SNA model focuses on analyzing relationships and structures in social networks and identifies key factors by examining the relationships between risk factors. However, relying on network analysis alone may lead to a biased understanding of key risk factors as different factors and their combinations have varying degrees of influence on risk events. Combining the two models allows for a more comprehensive analysis of social network dynamics in complex systems.
The analysis steps for combining the two models are as follows (see Figure 2). First, the NK model is used to evaluate the likelihood of different risk factors coupling, leading to the occurrence of housing safety risk events. Second, the SNA model is used to analyze the accessibility of different risk factors to other factors so as to determine the potential form of coupling of risk factors, and the risk coupling values of different factors are determined corresponding to the results of the analysis of the NK model. At the same time, social network centrality analysis is used to obtain the key risk factor (node) ranking. Finally, the network centrality is corrected using the risk factor coupling values to obtain the final key risk factors [42].

5. Empirical Estimation

5.1. Results of NK Model Calculations

We collected more than 600 typical housing safety incidents from the Internet for the period 2014–2024. And after excluding cases with unknown causes or those that did not cause any loss of life or property, there were 452 valid accident reports left. The causes of the accidents were analyzed in depth one by one; 0 was used to indicate that the unfavorable factors did not occur and 1 was used to indicate that the unfavorable factors occurred. On this basis, the number of occurrences of single-factor and multi-factor coupling were counted according to the specific factors of the causes of the accidents, and the corresponding probabilities were calculated, i.e., the human, physical, and environmental factors. The number and probability of the occurrence of ‘human–physical’, ‘human–environment’, ‘physical–environment’, and ‘human–physical environment’ interactions were determined (see Table 1 for specific results). From the statistical results, it can be seen that human factors have the highest probability of occurrence in single-factor coupling, ‘human–physical’ has the highest probability of occurrence in two-factor coupling, and the probability of occurrence in multi-factor coupling is relatively small.
According to Equation (1), we can calculate the risk coupling value T under the effect of two-factor and multi-factor coupling, and the following calculation and analysis is based on T 21 ( a , b ) as an example (see Table 2 for specific results).
T 21 ( a , b ) = h = 0 H i = 0 I P h i log 2 P h i P h × P i = P 0 , 0 L og 2 P 0 , 0 P 0 × P 0 + + P 0 , 1 L o g 2 P 0 , 1 P 0 × P 1 + P 1 , 0 L o g 2 P 1 , 0 P 1 × P 0 + P 1 , 1 L o g 2 P 1 , 1 P 1 × P 1 = 0.2478 × L og 2 0.2478 0.3244 + 0.3119 × L o g 2 0.3119 0.2353 + 0.3319 × L o g 2 0.3319 0.2552 + 0.1084 × L o g 2 0.1084 0.1851 = 0.0963 + 1.3258 + 0.1258 0.0836 = 0.0727
From Table 2, it can be seen that the order of risk coupling value is T 31 ( a , b , c ) > T 23 ( b , c ) > T 21 ( a , b ) > T 22 ( a , c ) . From this, the following conclusions can be drawn. Firstly, the risk factor coupling value is related to the number of risk coupling factors; the larger the number of risk coupling factors, the larger the coupling value. The three-factor coupling value is significantly higher than the two-factor coupling value, so the key to controlling the occurrence of risk events is to avoid multi-factor coupling. Secondly, in two-factor coupling, the physical–environmental factor coupling value is higher than that in other two-factor coupling modes, which indicates a higher likelihood of accidents. From a practical perspective, severe natural disasters (such as heavy rain, snowstorms, typhoons, and earthquakes) coupled with defects in the physical conditions of the house itself can easily lead to sudden accidents with serious consequences. Therefore, in housing safety risk management, special attention should be paid to early warnings of natural disasters and the design of emergency programs to control the coupling between physical and environmental factors. Thirdly, although the human–physical factors appear more often in the probability statistics, the coupling between the two factors is minor, indicating that the probability of the risk occurring in the coupling between the two is small, and the high frequency mainly lies in the high natural frequency of the appearance of the two factors themselves. Finally, in the risk coupling, the risk coupling values of T21 (a, b) and T23 (b, c) are larger, and their common feature is that they all contain the physical factor, indicating that this risk factor easily couples with other factors and poses the greatest threat to the safety of housing use.

5.2. Results of SNA Model Calculations

5.2.1. Constructing the Adjacency Matrix

A risk adjacency matrix is a matrix tool that represents the direct relationship between risk factors and is used to describe the direct influence relationship between risk factors in a system. The risk factor adjacency matrix A = a i j 16 × 16 was constructed by summarizing the cause and process analysis of collected cases of housing accidents in the past 10 years, in combination with expert consultation. We consulted 15 housing use safety managers, engineers, and academics on the intrinsic relationships of risk factors using multiple rounds of Delphi expert consultation. These included housing safety regulators from governmental housing safety authorities, engineering practitioners from architectural design institutes, day-to-day managers from large property management companies, and researchers in housing safety from universities. A risk factor adjacency matrix is a matrix that represents the adjacency relationship between vertices that consists of the values ‘0’ and ‘1’. If there is an interaction relationship between two vertices, then a i j is ‘1’; otherwise, it is ‘0’ (see Table 3 for specific results).
The Ucinet 6.0 software enables the interactions between urban housing risk factors to be analyzed effectively. In addition, the interactions of these risk factors were visualized using the Net Draw plug-in. Figure 3 clearly demonstrates the interactions between the risk factors; the influence relationship is represented by straight lines with arrows pointing to the influenced factors, and the whole network has 16 nodes and 104 straight lines. The overall network density of 0.433 calculated using Ucinet 6.0 software indicates that there is a strong connection between the risk factors.

5.2.2. Risk Factor Centrality Analysis

Table 4 shows the proximity centrality of the housing use safety risk factors in the network, which includes both in- and out-degrees since the network is a directed network. A high in-degree indicates that the risk factor can be induced by more risk factors in the system. As can be seen in Table 4, the top five proximity centrality degrees are poor supervision, poor design, demolition and alteration violations, poor construction, and housing facilities. Four of the five risk factors with a high in-degree belong to human factors, which shows that human factors are the most important triggers of accidents in the risk factor network. A high out-degree indicates that the factor induces more other risk factors in the system, and the top five are improper design, the main structure, poor supervision, housing facilities, and foundation settlement. The risk factors with a high out-degree include human, physical, and environmental factors. According to the ranking of the out-degree, the first step to preventing accidents in the use of housing is to understand and improve the rationality of the design and the quality of the construction of the main structure. The second step is to strengthen the government supervision, prevent the occurrence of illegal and unauthorized acts, and at the same time reinforce the maintenance and supervision of the housing facilities and equipment and pay special attention to the occurrence of the problem of foundation subsidence and changes in the foundation.
Mediated centrality is an important metric in network analysis, used to measure the importance of a node (or edge) as an ‘intermediary’ or ‘bridge’ within an entire network. Its core meaning lies in assessing a node’s ability to control the flow of information, resources, or influence, i.e., how much information transmission must pass through that node. In-degree and out-degree are measures of the number of directly connected neighbors of a node, where in-degree refers to the number of edges pointing to the node, and out-degree refers to the number of edges pointing from the node to the outside. In-degree and out-degree measure ‘who is most active’ or ‘who has the greatest direct influence’; betweenness centrality measures ‘who is an indispensable intermediary’. As can be seen from Table 4, the top five factors in terms of mediator centrality are poor supervision, improper design, illegal demolition, housing facilities, and foundation settlement. By effectively avoiding these risk factors, the risk network can be cut off, thus reducing the formation of systemic risk. Wu Qian et al. (2025) [35] analyzed the key nodes in the risk network and found that the top ranked out-degree were the root causes that induced accidents. Shao Zhiguo and Zhang Jingxuan et al. (2023) and Li Qiong and Pang Min et al. (2024) concluded that the out-degree in the node proximity centrality degree best represents the node’s ability to induce systemic risk [38,43]. Therefore, the out-degree of node proximity centrality was also taken as the basis for determining the key risk factors in this study.

5.2.3. Risk Reachability Analysis

Reachability analysis is the study of indirect influence relationships between risk factors based on an adjacency matrix, i.e., whether one risk can influence another risk through a series of intermediate risks. Reachability can be measured by calculating the number of links that need to be passed between any two nodes. This analysis helps to capture the likelihood of various risk factors triggering the emergence of other factors (such as secondary risks, chain reactions, or associated risk events). In Figure 3, the reachability of the risk network and the way risk factors propagate on the directed network are demonstrated in detail, and the potential forms of risk coupling that lead to accidents in the use of housing are revealed. Inadequate government regulation, for example, may lead to improper demolition or design and construction, increasing the risk of safe housing use, which is further amplified when encountering unfavorable environmental factors such as natural disasters. According to Figure 3, the accessibility of the 16 secondary risk factors can be mapped to the three primary risks, and the specific results are shown in Table 5. From Table 5, it can be observed that ineffective regulation may lead to the risk coupling of three factors, namely, human–physical–environmental occurrence. Human misbehavior is prone to two-factor risk coupling with the house itself, and environmental factors are prone to two-factor risk coupling with the physical–environment coupling.

5.3. Adjustment of Model Results

The NK model demonstrates strong objectivity by analyzing actual accident data, but it is limited to the analysis of first-level risk factors. The SNA model, on the other hand, relies more on empirical judgment and is more subjective, which may lead to a lack of accuracy in the identification of key risk factors. Therefore, we needed to consider the advantages and disadvantages of both of them and adjust the model. We referred to the research methods of Li et al. [43] and Zhou et al. [44], and the results of the risk factor reachability analysis in Table 5. The risk coupling value in Table 2 was regarded as a correction coefficient to correct the risk node proximity centrality of the out-degree, and the calculation results are shown in Table 6.
As can be seen from Table 6, the out-degree ranking of proximity centrality changed relatively significantly after the adjustment, and the risk factors with higher rankings are mainly improper supervision, building facilities, load-bearing structure, building height, foundation settlement, and natural disasters. This is consistent with the results before adjustment, indicating that the key risk factors obtained after eliminating subjective influence based on actual case data are consistent with the results of social network analysis. However, after the adjustment, improper supervision ranked first, while improper design ranked relatively low. In addition, improper dismantling did not rank very high either before or after the correction, which indicates that in practice, the safety risk in the use of housing is to a large extent caused by improper supervision.

6. Conclusions and Discussion

The identification of housing use safety risk factors is the premise of risk early warning, and only when the potential risk factors are identified can monitoring indicators (e.g., setting thresholds and establishing models) be designed for these factors and early warning subsequently achieved. This study first analyzes the current situation of housing use accidents in China, and the characteristics and causes of typical accidents are discussed in depth. The evaluation system of housing use safety risk factors was constructed on this basis, in combination with the expert consultation method from three perspectives: human, physical, and environmental. Second, the coupling relationships between various types of risk factors of housing use safety were verified from both qualitative and quantitative perspectives by using the combined method of the NK model and SNA, and the key risk factors affecting housing use safety were identified. Finally, based on the SNA network centrality out-degree value and the NK risk coupling value, the network centrality out-degree was corrected to obtain the ranking results of key risk factors.
The main findings of this study include the following. First, the safety of housing use is affected by human, physical, and environmental factors. The probability of the occurrence of human factors is the highest in single-factor coupling, while that of ‘human–object’ interactions is the highest in two-factor coupling and that of multi-factor coupling is relatively small. The risk factor coupling value is related to the number of risk coupling factors, and the larger the number of risk coupling factors, the larger the coupling value. The three-factor coupling value is significantly higher than the two-factor coupling value, so the key to controlling the occurrence of risk events is to avoid multi-factor coupling. Second, there is a strong correlation between the risk-influencing factors of housing use safety. The neighborhood matrix of risk factors of housing accidents was constructed based on the collected cases of housing accidents in the past 10 years and expert consultation, and the overall network density was calculated to be 0.433 by using Ucinet 6.0 software, which indicates that there is a strong connection between the risk factors. Third, government regulation has an important influence on housing use safety risk. The out-degree of risk node proximity centrality was corrected based on the results of risk factor accessibility and risk coupling value calculation, and the results show that the key risk factors obtained after eliminating the subjective influence based on the actual case data are consistent with the results of the social network analysis. However, the corrected government regulation is ranked first, which indicates that the government’s regulation of housing misuse is the most important factor influencing the safety of housing use.
Based on the conclusions of this study, we propose targeted recommendations from the perspectives of government agencies, developers, property company, and residents, respectively. Firstly, from the perspective of the government, the effectiveness of government regulation has the greatest impact on the safety of housing use. On the one hand, it is recommended that the government establishes a sound system of government laws and regulations and management systems for the safe management of housing use. For example, a system of physical examination of housing should be implemented as soon as possible, a sound housing information file management system should be established to regularly collect and update important information affecting the safety of housing use, and national regulations on the safe use of housing should be introduced as soon as possible. Moreover, drawing on Vitale’s theory of regulation by incentives [45], it is suggested that the government should guide market players to develop and build high-quality housing through economic incentives (e.g., tax incentives, subsidies, etc.) rather than mandatory administrative orders.
Secondly, the quality of the housing itself has an important impact on the safety of housing use. The real estate developers are the final decision makers in housing design programs, construction quality supervisors, as well as those with the most responsibility regarding housing safety. Developers should, on the one hand, build high-quality housing to reduce the risk of housing issues, and on the other hand, they should strengthen knowledge of housing safety and maintenance in the process of housing delivery, so that residents understand the serious consequences of improper demolition and improper use, as well as the necessary measures for the maintenance of housing.
Thirdly, the property company is responsible for the daily maintenance of housing, and proper maintenance is essential to ensure the safety of housing. At the same time, property companies are also the direct supervisors of residents’ illegal demolition and violent renovation behaviors. Property companies should make full use of modern information technology such as the Internet of Things, big data, artificial intelligence, etc., to conduct 24 h comprehensive testing and monitoring of urban housing, especially dilapidated housing. The timely stopping and reporting of improper demolition and modification, improper use, and other violations are necessary, as well as the timely elimination of potential safety hazards in housing.
Fourthly, human factors have an important impact on housing use safety, whether it is single-factor coupling or multi-factor coupling. For residents, they are often both the creators and the victims of housing use safety accidents. Residents’ illegal demolition and violent renovation of houses have a certain relationship with their lack of specialized knowledge of housing safety, which should be strengthened in their daily life. They should consciously abide by the laws governing the use of housing and report violations in a timely manner.
Finally, safety risks during the housing use phase are an important challenge facing China in the future, but currently, scholars have not paid much attention to this issue. This paper is an exploratory study on housing safety risks. Although we have made considerable efforts in data collection and research methods, there are still many shortcomings. For example, the case materials are insufficient, the data volume is inadequate, and the indicator system needs further discussion. These are also important directions for our future research.

Author Contributions

Conceptualization, H.Z.; methodology, H.Z.; software, G.S.; validation, G.S.; formal analysis, G.S.; investigation, G.S.; writing—original draft preparation, H.Z.; writing—review and editing, H.Z.; visualization, G.S. All authors have read and agreed to the published version of the manuscript.

Funding

This research received no external funding.

Institutional Review Board Statement

Not applicable.

Informed Consent Statement

Not applicable.

Data Availability Statement

The data presented in this study are available on request from the corresponding author.

Conflicts of Interest

The authors declare no conflicts of interest.

References

  1. Adabre, M.A.; Chan, A.P.; Edwards, D.J.; Adinyira, E. Assessing critical risk factors (CRFs) to sustainable housing: The perspective of a sub-Saharan African country. J. Build. Eng. 2021, 41, 102385. [Google Scholar] [CrossRef]
  2. Stone, K.E.; Eastman, E.M.; Gielen, A.C.; Squires, B.; Hicks, G.; Kaplin, D.; Serwint, J.R. Home safety in inner cities: Prevalence and feasibility of home safety-product use in inner-city housing. Pediatrics 2007, 120, e346–e353. [Google Scholar] [CrossRef]
  3. Chen, X. Trial analysis of the improvement method of the effect of real estate market regulation. Real Estate Guide 2019, 20, 23. [Google Scholar]
  4. Li, Z.Y. Exploration of housing construction engineering construction quality inspection. Decor. World 2020, 4, 62. [Google Scholar]
  5. Qiao, X. How to do a good job in construction technology and site construction management of housing construction project. Build. Mater. Dev. Orientat. 2020, 18, 271. [Google Scholar]
  6. Peng, C. Research on legal regulation of illegal subcontracting and illegal subcontracting in construction project. Law Soc. 2020, 7, 38–39. [Google Scholar]
  7. Zhang, Y. On the rational choice of methods for testing in the house structure safety testing and appraisal of old buildings. Constr. Build. Mater. Decor. 2019, 155, 157. [Google Scholar]
  8. Zhou, Y. Typical case analysis and rationalization suggestions for old housing safety inspection. Eng. Qual. 2021, 30, 28–31. [Google Scholar]
  9. Lin, H. On the generation of quality and safety hazards of housing renovation and transformation and the prevention and control measures. Guangdong Sci. Technol. 2012, 21, 240–247. [Google Scholar]
  10. Jia, J.K. An Introduction to Housing Safety Management. Constr. Build. Mater. Decor. 2015, 22, 30. [Google Scholar]
  11. Deng, T.H. Detection of concrete carbonation in building structures and related discussions. Manag. Obs. 2011, 15, 165–166. [Google Scholar]
  12. Heikkilä, J. Moisture damage in Finnish wooden houses. J. Build. Apprais. 2005, 1, 331–343. [Google Scholar] [CrossRef]
  13. Lv, H. Construction technology of concrete cracks in housing buildings. Urban Constr. Theory Res. 2013, 7, 1–5. [Google Scholar]
  14. Chen, X. Impact of underground tunnel construction on existing buildings and reinforcement measures. Metall. Ser. 2021, 6, 126–127. [Google Scholar]
  15. Jiang, S. Study on the impact of metro construction on neighboring existing buildings. Chin. Sci. Technol. J. Database Eng. Technol. 2021, 2, 2. [Google Scholar]
  16. Mao, X. Numerical analysis and optimization study on the impact of large-scale deep foundation pit construction on surrounding buildings in urban central area. Build. Constr. 2019, 41, 3. [Google Scholar]
  17. Ji, X.J.; Lu, X.Y. Numerical simulation study on the impact of deep foundation pit construction on adjacent buildings in urban centers. China New Technol. New Prod. 2022, 23, 99–102. [Google Scholar]
  18. Huang, Q.; Yao, D. Research on glass curtain wall inspection system based on drone and image recognition technology. Guangdong Civ. Eng. Constr. 2022, 29, 9–12+28. [Google Scholar]
  19. Wang, X.; Duan, Q. Construction of oil and gas pipeline risk system in China based on barrier model and fault tree. Saf. Environ. Eng. 2018, 25, 76–82. [Google Scholar] [CrossRef]
  20. Hao, Y.; Qin, Y.M.; Mao, M.Q.; Zhao, Y.N.; Liu, Y.; Yang, Y. Analysis of factors influencing cognitive decline in community-dwelling older adults based on Bayesian network modelling. J. Nurs. 2024, 31, 12–18. [Google Scholar]
  21. Jiang, L. Non-financial Factor Analysis Model of Loan Risk Based on Fuzzy Comprehensive Judgement. Stat. Inf. Forum 2003, 18, 18–19+26. [Google Scholar]
  22. Su, W.; Niu, X. Coupled analysis of heavy freight traffic safety risks based on NK model. Munic. Technol. 2022, 40, 201–205. [Google Scholar]
  23. Huang, G.; Zhang, G. Green supply chain risk of assembly building based on SNA. J. Civ. Eng. Manag. 2020, 37, 41–49. [Google Scholar]
  24. Zhao, Y.; Wan, J. Air traffic control operation risk evaluation based on set-pair analysis. J. Saf. Environ. 2018, 18, 871–875. [Google Scholar]
  25. Hollande, E. Barriers and Accident Prevention; Routledge: London, UK, 2016. [Google Scholar]
  26. Weber, P.; Medina-Oliva, G.; Simon, C.; Iung, B. Risk Analysis with Bayesian Networks; CRC Press: Boca Raton, FL, USA, 2012. [Google Scholar]
  27. Zadeh, L.A. Fuzzy sets. Inf. Control 1965, 8, 338–353. [Google Scholar] [CrossRef]
  28. Edwards, E. SHEL Model for Aviation Safety. ICAO J. 1972, 27, 12–15. [Google Scholar]
  29. Kauffman, S.A.; Levin, S. Towards a general theory of adaptive walks on rugged landscapes. J. Theor. Biol. 1987, 128, 11–45. [Google Scholar] [CrossRef]
  30. Zhou, J.; Liu, Z. Analysis of petrochemical storage tank accident risk coupling based on N-K model. Saf. Health Environ. 2024, 24, 6–10. [Google Scholar]
  31. Zhao, J.; Liu, L.; Wang, F.; Mao, N. Research on the coupling of subway operation safety risk based on N-K model. J. Civ. Eng. Manag. 2023, 40, 31–36. [Google Scholar]
  32. Qiao, W.; Li, X.; Liu, Q. Analysis of coupled causative factors of risk of major gas accidents in coal mines under N-K model. Sci. Technol. Manag. Res. 2017, 2, 5. [Google Scholar]
  33. Wan, P.; Lou, F. Research on SNA model in bank retail credit risk control. Tech. Econ. Manag. Res. 2021, 9, 69–74. [Google Scholar]
  34. Ding, J.H.; Zhou, L. Study on Micro-Renewal of Tourism-based Rural Public Space Based on Social Network Model—Taking Suzhou Mingyuewan Village as an example. Mod. Urban Res. 2021, 12, 48–55. [Google Scholar]
  35. Wu, Q.; Yang, J.; Xu, S. Analysis and control of risk factors for fire accidents in high-rise residential buildings based on N-K and SNA. J. Disaster Prev. Mitig. Eng. 2025, 45, 128–136+178. [Google Scholar]
  36. Shen, J.; Wang, L.P.; Xiao, W.H.; Tang, R. Analysis of safety risk factors in logistics warehousing based on N-K and SNA models. Safety 2024, 45, 35–41. [Google Scholar]
  37. Qian, J.Q.; Zhang, F.Q.; Liu, B.X. Risk factor coupling analysis of hydrogen energy storage and transport system with complex social network and N-K model. Chem. Mach. 2024, 51, 626–633. [Google Scholar]
  38. Shao, Z.; Zhang, J.; Wang, W. Coupled analysis of new energy vehicle explosion risk factors based on NK model and SNA. J. Saf. Environ. 2023, 23, 363–371. [Google Scholar]
  39. Cu, S.B. Talking about the type of housing structure and the harm of illegal transformation. Urban Constr. Theory Res. 2016, 13, 10. [Google Scholar]
  40. Chen, B.P. Research on construction technology of uneven settlement of building foundation. Constr. Build. Mater. Decor. 2022, 22, 71–73. [Google Scholar]
  41. Healey, S.; Lloyd, S.; Gray, J.; Opdyke, A. Does safer housing save lives? An analysis of typhoon mortality and dwellings in the Philippines. Int. J. Disaster Risk Reduct. 2023, 84, 103433. [Google Scholar] [CrossRef]
  42. Zhang, Z.; Gao, Z. Coupled analysis of operational risk factors of ramp control system based on DEMATEL/N-K. J. Saf. Environ. 2024, 24, 873–882. [Google Scholar]
  43. Li, Q.; Pang, M.; Zhong, H.; Wang, H.; Zhang, Y.C. A study on the coupling of explosion risk factors in chemical enterprises by integrating N-K model social network. J. Saf. Environ. 2024, 24, 4581–4590. [Google Scholar]
  44. Zhou, H.B.; Yang, Q.; Yang, Z.G. Analysis and control of tower crane safety risk factors based on complex network and N-K model. J. Saf. Environ. 2020, 20, 816–823. [Google Scholar]
  45. Vitale, T. Regulation by incentives, regulation of the incentives in urban policies. Transnatl. Corp. Rev. 2010, 2, 35–45. [Google Scholar] [CrossRef]
Figure 1. Indicator system of safety risk factors for urban housing sustainability.
Sustainability 17 06918 g001
Figure 2. Ideas and steps of NK and SNA fusion modeling.
Sustainability 17 06918 g002
Figure 3. Network topology of safety risk factors for housing use.
Sustainability 17 06918 g003
Table 1. Frequency and probability of occurrence of different factor coupling patterns in housing use safety incidents.
Type of CouplingCoupling FactorNumber of OccurrencesProbability SignProbability Value
Single-factor couplingHuman factors141 P 100 0.3119
Physical factors119 P 010 0.2633
Environmental factors112 P 001 0.2478
Two-factor couplingHuman–physical47 P 110 0.1040
Human–environment9 P 101 0.0199
Physical–environment22 P 011 0.0487
Multi-factor couplingHuman–physical–environment2 P 111 0.0044
Table 2. Coupling values for different risk factor coupling models.
FactorT-Value
Human–physical T 21 ( a , b ) 0.0727
Human–environment T 22 ( a , c ) 0.0630
Physical–environment T 23 ( b , c ) 0.0980
Human–physical–environment T 31 ( a , b , c ) 0.6477
Table 3. Adjacency matrix of influencing relationships of safety risk factors in housing use.
C1C2C3C4C5C6C7C8C9C10C11C12C13C14C15C16
C10111101100000000
C21010100000000000
C31101100011011001
C41010100011000000
C51111010000010011
C61000100101010000
C71100010000010000
C81111110000011000
C91111111000011000
C100011110010100000
C110010110011011010
C121111110000000101
C131111000010100110
C140011110000011011
C150000100001011100
C160000100010101000
Table 4. Standardized centrality of risk factor nodes for safety.
Risk FactorsProximity CentralityIntermediation Centrality/%
In-Degree/%Out-Degree/%
Improper supervision88.23568.18223.271
Improper design78.94771.42919.801
Improper dismantling75.00057.69217.842
Improper construction71.42957.6925.144
Building Facilities71.42968.18215.831
Improper use68.18251.7241.194
Improper maintenance68.18260.00010.740
Foundation settlement62.50068.18215.012
Load-bearing structure60.00071.42912.008
Enclosure Structure60.00060.0007.702
Proximity to hazards57.69255.5566.136
Neighboring works55.55655.5563.001
Type of house50.00050.0000.726
Age of the house50.00068.1823.471
Building Height50.00068.1824.658
Natural disasters48.38765.2173.461
Table 5. Reachability analysis of risk factor nodes.
Risk FactorsHuman Factors Physical Factors Environmental Factors Potential Forms of Coupling
Improper dismantling 1 Human–Physical
Improper use 1 Human–Physical
Improper design11 Human–Physical
Improper construction11 Human–Physical
Improper supervision111Human–Physical–Environmental
Improper maintenance 1 Human–Physical
Type of house1 Physical
Age of the house11 Human–Physical
Load-bearing structure 11Physical–Environmental
Enclosure Structure11 Human–Physical
Building height 11Physical–Environment
Building facilities111Human–Physical–Environmental
Foundation settlement 1 Physical–Environment
Natural disasters 11Physical–Environment
Neighboring works 11Physical–Environment
Proximity to hazards 1 Physical–Environment
Table 6. The out-degree of proximity centrality and its adjustment value.
Risk FactorsThe Out-Degree Before AdjustmentThe Out-Degree After Adjustment
Improper design71.4295.193
Load-bearing structure71.4297.000
Improper supervision68.18244.161
Age of the house68.1824.957
Building Height68.1826.682
Building Facilities68.18244.161
Foundation settlement68.1826.682
Natural disasters65.2176.391
Improper maintenance60.0004.362
Enclosure Structure60.0004.362
Improper dismantling57.6924.194
Improper construction57.6924.194
Neighboring works55.5565.444
Proximity to hazards55.5565.444
Improper use51.7243.259
Type of house50.0000.000
Disclaimer/Publisher’s Note: The statements, opinions and data contained in all publications are solely those of the individual author(s) and contributor(s) and not of MDPI and/or the editor(s). MDPI and/or the editor(s) disclaim responsibility for any injury to people or property resulting from any ideas, methods, instructions or products referred to in the content.

