Article

Adsorption Behavior of Tetracycline by Polyethylene Microplastics in Groundwater Environment

1
Institute of Hydrogeology and Environmental Geology, Chinese Academy of Geological Sciences, Shijiazhuang 050061, China
2
Chinese Academy of Geological Sciences, Beijing 100037, China
3
Key Laboratory of Groundwater Contamination and Remediation, China Geological Survey (CGS) & Hebei Province, Shijiazhuang 050061, China
4
CCCC-AECOM Eco-Environmental Co., Ltd., Beijing 100101, China
*
Author to whom correspondence should be addressed.
Sustainability 2025, 17(15), 6908; https://doi.org/10.3390/su17156908
Submission received: 11 June 2025 / Revised: 9 July 2025 / Accepted: 15 July 2025 / Published: 30 July 2025

Abstract

Previous studies have mostly focused on the adsorption behavior of microplastics for antibiotics in soil or aqueous environments. This study explores the adsorption characteristics of microplastics for antibiotics under groundwater environmental conditions and the influence of typical influencing factors of the groundwater environment (pH, pollutant concentration, aquifer media, dissolved organic matter, and ionic strength) on the adsorption process. Polyethylene (PE) and tetracycline (TC) were selected as typical microplastics and antibiotics in the experiment. The study results showed that the adsorption of TC by PE reached equilibrium at 48 h, and the adsorption kinetics fitted pseudo-second-order kinetics models well. The adsorption isotherm was consistent with the Langmuir model. The adsorption capacity of PE for TC was highest under neutral conditions and positively correlated with the initial concentration of TC. The aquifer media exhibited limited effects on the adsorption process. Fulvic acid (FA) significantly suppressed TC adsorption onto PE, attributable to competitive adsorption mechanisms. TC adsorption on PE initially increased then declined with Ca2+ concentration due to Ca2+ bridging and competition. This research elucidates the adsorption mechanisms of PE towards TC, providing theoretical basis and reference for assessing the environmental risk of microplastics and antibiotics in groundwater.

1. Introduction

Antibiotics are natural, synthetic, or semi-synthetic compounds possessing antibacterial and bactericidal properties and have been extensively used in the medical and livestock industries [1,2]). Currently, antibiotics have been widely detected in various environments, including natural water, drinking water, bay, sediments, and soils [3,4,5]. Common antibiotics include sulfonamides (SAs), tetracyclines (TCs), quinolones (QNs), and macrolides (MLs) [2,6], among which TC is extensively applied due to its low cost and broad-spectrum effectiveness. The characteristic of the low biological absorption of TC results in its direct discharge or release through metabolic processes into soil and even groundwater environments, thus posing risks to ecological environments and human health.
Plastic is an essential material in modern society for both daily life and industrial production, with its demand continuously rising alongside socio-economic development. Massive amounts of plastic have been discarded or landfilled, entering the natural environment, where they gradually degrade into small fragments under natural processes. Plastic particles smaller than 5 mm in diameter are classified as microplastics (MPs) [7,8]. In addition to being detected in freshwater, marine, lakes, atmosphere, soils, and various vertebrate and invertebrate organisms [9,10,11], MPs have also been increasingly identified in groundwater and drinking water. The study by Panno et al. [12] indicates that the maximum MP concentration of groundwater from eight springs and two shallow wells in a karst aquifer in Illinois, USA, is as high as 15.2 n/L. The groundwater from a landfill site in a coastal city in Thailand was investigated by Wisitthammasri et al. [13], and the results show that MP concentrations ranged from 18 to 94 n/L. Due to their small particle size, large specific surface area, and high biological and chemical inertness, MPs can adsorb onto the cell membranes of organisms, thereby posing significant threats [10].
Besides their inherent biological toxicity, MPs can serve as carriers of various pollutants by adsorbing and accumulating them. The study by Frias et al. [14] detected persistent organic pollutants such as polychlorinated biphenyls (PCBs), polycyclic aromatic hydrocarbons (PAHs), and dichlorodiphenyltrichloroethane (DDT) on polypropylene (PP), polyethylene (PE), and polystyrene (PS) MP particles collected from the Portuguese coast. XRF analysis was conducted on nearly one thousand MP samples collected from beaches in southwestern England by Massos and Turner [15] and found that the detection rates for Cd and Pb were 6.9% and 7.5%, with maximum concentrations of 3390 μg/g and 5330 μg/g, respectively. Studies on interactions between MPs and antibiotics have primarily focused on the adsorption mechanisms, with less attention given to environmental factors. The limited research available has concentrated mainly on soil and water environments (surface water, wastewater) [16,17,18], while studies on interactions between these two types of pollutants under specific groundwater environmental conditions have not been conducted. Groundwater environments are significantly different from soil and surface water in terms of aquifer media, pH, dissolved organic matter (DOM), and other characteristics, which may cause different impacts on the adsorption of antibiotics by MPs.
In this paper, polyethylene (PE) and tetracycline (TC) were selected as typical microplastics and antibiotic pollutants to study the adsorption behavior of TC by PE in a simulated groundwater environment. The main research contents include the following: (1) PE materials before and after TC adsorption were characterized to determine the changes in surface morphology, chemical elements and functional groups; (2) kinetic and isothermal adsorption experiments were carried out to explore the adsorption characteristics of TC onto PE; (3) environmental factors such as pH, pollutant concentrations, particle size of aquifer media, DOM and ionic strength are investigated to elucidate the influencing mechanisms. This study will further clarify the environmental behavior of microplastics and antibiotics in groundwater, which has important significance for scientific and reasonable evaluation of the ecological and environmental risks of microplastics and antibiotics.

2. Materials and Methods

2.1. Materials and Chemicals

PE (0.05~0.5 mm) was purchased from Suzhou Chengxinzhe Plasticizing Co., Ltd. (Suzhou, China). The materials were sieved through a 120-mesh screen to acquire PE particles with a size range of 0.075~0.125 mm. Before use, the PE particles were washed with absolute ethanol and deionized water to remove possible impurities, then dried in a cool, ventilated location, and stored in a sealed container for subsequent experiments. TC hydrochloride (biotechnology grade, stored at 2 °C) and fulvic acid (FA, 95%) were purchased from Shanghai Macklin Biochemical Co., Ltd. (Shanghai, China). Anhydrous calcium chloride, sodium hydroxide, hydrochloric acid, ethanol, and other reagents were of analytical grade and were purchased from Tianjin Kermel Chemical Reagent Co., Ltd. (Tianjin, China). The water used in the experiments was deionized water.

2.2. Experimental Methods

2.2.1. Adsorption Kinetics Experiments

A 0.01 mol/L CaCl2 solution was prepared as the background solution and subsequently used to prepare a TC solution with a concentration of 10 mg/L. 0.25 g PE samples were weighed and placed into a series of 40 mL brown glass bottles, and then 25 mL of 10 mg/L TC solutions were added. The bottles were sealed with lids equipped with polytetrafluoroethylene (PTFE) liners and shaken in a thermostatic oscillator at 25 °C and 150 rpm. Samples were periodically withdrawn, filtered through 0.22 μm microporous membranes, and analyzed using an ultraviolet-visible (UV-Vis) spectrophotometer (Shimadzu UV 2550, Tokyo, Japan) at a wavelength of 353 nm to determine TC concentration in the filtrate. One group of blank and two groups of parallel experiments were carried out for quality control.

2.2.2. Isotherm Adsorption Experiments

A series of TC solutions with concentrations ranging from 0 to 100 mg/L was prepared using 0.01 mol/L CaCl2 as the background solution. Then, 0.25 g PE samples were accurately weighed and placed into a series of 40 mL amber glass bottles, and 25 mL TC solutions of varying concentrations were added to each bottle. After sealing tightly, the bottles were placed in a thermostatic oscillator at 25 °C and shaken continuously at 150 rpm for 48 h until adsorption equilibrium was achieved. The solutions were then filtered through 0.22 μm microporous membranes, and the concentrations of TC in the filtrates were measured to analyze adsorption isotherm characteristics. One group of blank and two groups of parallel experiments were carried out for quality control.

2.2.3. Study on Influencing Factors of Groundwater Environment

To explore the effects of groundwater environmental conditions on the adsorption of TC onto PE, the influences of solution pH, initial TC concentration, aquifer media particle size, and DOM on the adsorption process were studied using the control variable methods. Experimental variables were set as follows: (1) solutions of 0.1 mol/L HCl and NaOH were prepared to adjust the reaction solution pH to ranges of 5.0, 6.0, 7.0, and 8.0, respectively; (2) TC solutions with varying initial concentrations of 1, 5, and 10 mg/L were prepared; (3) quartz sand with different particle sizes of 0.1~0.25 mm, 0.25~0.5 mm, 1~2 mm were added to the reaction systems to simulate aquifer media of fine, medium and coarse sand, respectively; (4) FA was added to the reaction solutions in varying amounts to achieve concentrations of 0.5, 1, and 5 mg/L; (5) CaCl2 solutions with concentrations of 0.005, 0.01, 0.05, and 0.1 mol/L were employed as background electrolytes to simulate different ionic strength in groundwater. Apart from these single-variable reaction conditions, other experimental steps were conducted following the adsorption kinetics experiment described above.

2.3. Analytical Methods

The morphology, particle size, and surface structure of PE were observed using scanning electron microscopy (SEM, Hitachi SU5000, Tokyo, Japan). An appropriate amount of sample was placed onto black adhesive tape and gold-coated before imaging. The SEM acceleration voltage was set within 5~30 kV, and the probe current ranged from 1 pA to 100 nA. The specific surface area of PE was measured using a surface area analyzer (BET, Quantachrome Autosorb iQ, Boynton Beach, FL, USA). Approximately 0.2 g of sample was placed into a spherical sample tube, using liquid nitrogen as the adsorption medium, with a degassing temperature set at 90 °C and a degassing time of 12 h. Fourier transform infrared spectroscopy (FTIR, Shimadzu IRTracer100, KYoto, Japan) was employed to identify changes in surface functional groups of PEs before and after TC adsorption. FTIR spectra were recorded over the range of 500~4000 cm−1 at a resolution of 4 cm−1. X-ray photoelectron spectroscopy (XPS, Thermo Fisher Scientific ESCALAB 250Xi, Boston, MA, USA) was used to characterize the surface chemical state and elemental composition of PE before and after TC adsorption, utilizing a monochromatic Al Kα source (E = 1487.20 eV) with an operating voltage of 14,960 V and current of 0.0108 A. The surface potential values of PE were measured by a zeta potential analyzer (Anton Paar surpass3, Graz, Austria), with a 1 mM potassium chloride solution as the test liquid and a pH test range of 3~10. The relative molecular weight of PE was determined by gel permeation chromatography (GPC, Agilent-1260 Infinity, Memphis, TN, USA), and the mobile phase was selected as high-temperature 1,2,4-trichlorobenzene (TCB, 150 °C).

2.4. Adsorption Models

The adsorption amount of TC was calculated using Equation (1) [19]:
  Q t = V ( C 0 C t ) / m
where Qt (mg/g) represents the adsorption capacity of TC onto PE at time t (h); C0 and Ct (mg/L) are the initial TC concentration and TC concentration at time t (h), respectively; m (g) is the mass of PE; and V (L) is the volume of the contaminated solution.
The adsorption kinetics data were fitted by classical pseudo-first-order kinetics, pseudo-second-order kinetics, and the Weber–Morris intraparticle diffusion model, as shown in Equations (2)–(4) [20]:
l n Q e Q t = l n Q e k 1 t
t / Q t = 1 / k 2 Q e 2 + t / Q e
Q t = K i t 1 / 2 + C i
where Qt and Qe (mg/g) are the adsorption capacities at time t and at equilibrium, respectively; k1 (h−1) is the pseudo first-order kinetic rate constant; k2 (g·mg−1·h−1) is the pseudo second-order kinetic rate constant; Ki (mg/(g·min0.5)) is the Weber–Morris intraparticle diffusion rate constant; and Ci is a constant related to the thickness of the boundary layer.
Henry, Langmuir, and Freundlich models were selected to fit the adsorption isotherm data, represented by Equations (5)–(7) [21]:
Q e = k H C e  
  C e / Q e = 1 / Q m a x k L + C e / Q m a x
l n Q e = l n k F + ( l n C e ) / n
where Ce (mg/L) is the equilibrium concentration of TC; Qmax (mg/g) is the maximum adsorption capacity of TC onto PE; kH (L/g) is the linear partition coefficient of the pollutant between the solid phase and the liquid phase; kL (L/mg) is the Langmuir adsorption equilibrium constant; kF ((mg/g)·(mg/L)−n) is the Freundlich adsorption equilibrium constant, associated with the affinity of the adsorbent for the adsorbate; n is the Freundlich constant representing adsorption intensity.

3. Results and Discussion

3.1. Characterization of PE

The microscopic morphology of PE was characterized by SEM, and the results are shown in Figure 1. SEM images indicate that the PE microplastics used in this experiment were irregularly shaped particles with an average particle size ranging from 0.1 to 0.2 mm. The particle surfaces were relatively smooth, with numerous wrinkles and a small number of pores observed. The surface is largely smooth with flaky undulations. EDS analysis (Figure 1d) shows that the surface elements of PE were primarily carbon (C) and a minor amount of oxygen (O), indicating the presence of slight impurities on the PE surface. The BET analysis revealed that the specific surface area of the PE used in this study was 1.268 m2/g, which was associated with wrinkles and pores present on the surface of the MPs [22,23]. The differences in specific surface areas of MPs across studies may be closely related to their manufacturing processes and intended applications, as the physicochemical properties of MPs significantly influence their adsorption behaviors toward pollutants and their environmental fate [17]. The zeta potential of PE microplastics under a series of pH conditions is shown in Figure 2. The pHz of the PE used in this study was 6.22. The different charges carried on the surface of PE at different pH values may affect its adsorption behavior for antibiotics through electrostatic effects. The results of the molecular weight of plastics were the average values obtained by the statistical method, instead of a unique definite value, which only has statistical significance. The specific test results of PE are shown in Table 1.
FTIR spectroscopy was employed to analyze the properties of TC and PE before and after TC adsorption, and the results are shown in Figure 3. As seen in the figure, characteristic vibrational peaks corresponding to methylene (-CH2-) groups are present at 719 cm−1 (in-plane rocking vibration), 1470 cm−1 (bending vibration), and 2850 and 2920 cm−1 (symmetric and asymmetric stretching vibrations, respectively) [24]. No characteristic peaks associated with ester functional group (-COOR) stretching vibrations or ketone functional group (C=O) stretching vibrations at 1636 cm−1 and 1719 cm−1 were detected, further indicating that the PE material used in this study was relatively pure and exhibited minimal surface oxidation. In the FTIR spectrum of TC, characteristic peaks were presented at 3430, 3100, and 1374 cm−1, corresponding to the stretching vibrations of -OH, the stretching vibration of N-H, and the characteristic C-N-C amide vibration [25], respectively. These peaks also appeared in the FTIR spectrum of PE after TC adsorption. The findings confirm the adsorption of TC onto the PE surface. Moreover, the original PE characteristic peaks neither disappeared nor shifted, and no new functional groups formed after adsorption, demonstrating that no covalent bonds were formed during the adsorption process. Hence, the adsorption mechanism is primarily physical, governed mainly by intermolecular van der Waals interactions and micropore filling mechanisms.
XPS analysis of PE before and after TC adsorption was further conducted. The survey scan (Figure 4a) identified C and O as predominant surface elements in pristine PE, with O potentially originating from manufacturing additives, while post-adsorption spectra showed additional nitrogen (N) signals from TC molecules. High-resolution analysis of the C1s region (Figure 4b) displayed attenuated C-C/C-H peak intensity (284.8 eV) accompanied by a 0.09 eV positive shift in the C-O binding energy from 285.34 to 285.43 eV, indicative of electronic environment perturbations induced by newly formed C-N interactions. The O1s spectrum (Figure 4c) maintained persistent C-O signatures while manifesting a novel -OH component (530.00 eV) characteristic of TC hydroxyl groups. Notably, the N1s spectrum (Figure 4d) exclusively presented a single peak at 398.8 eV corresponding to TC’s C-N, with no observable attenuation of native PE functional groups nor generation of additional chemical bonds, collectively substantiating that the adsorption of TC onto PE occurs through physical adsorption mechanisms.

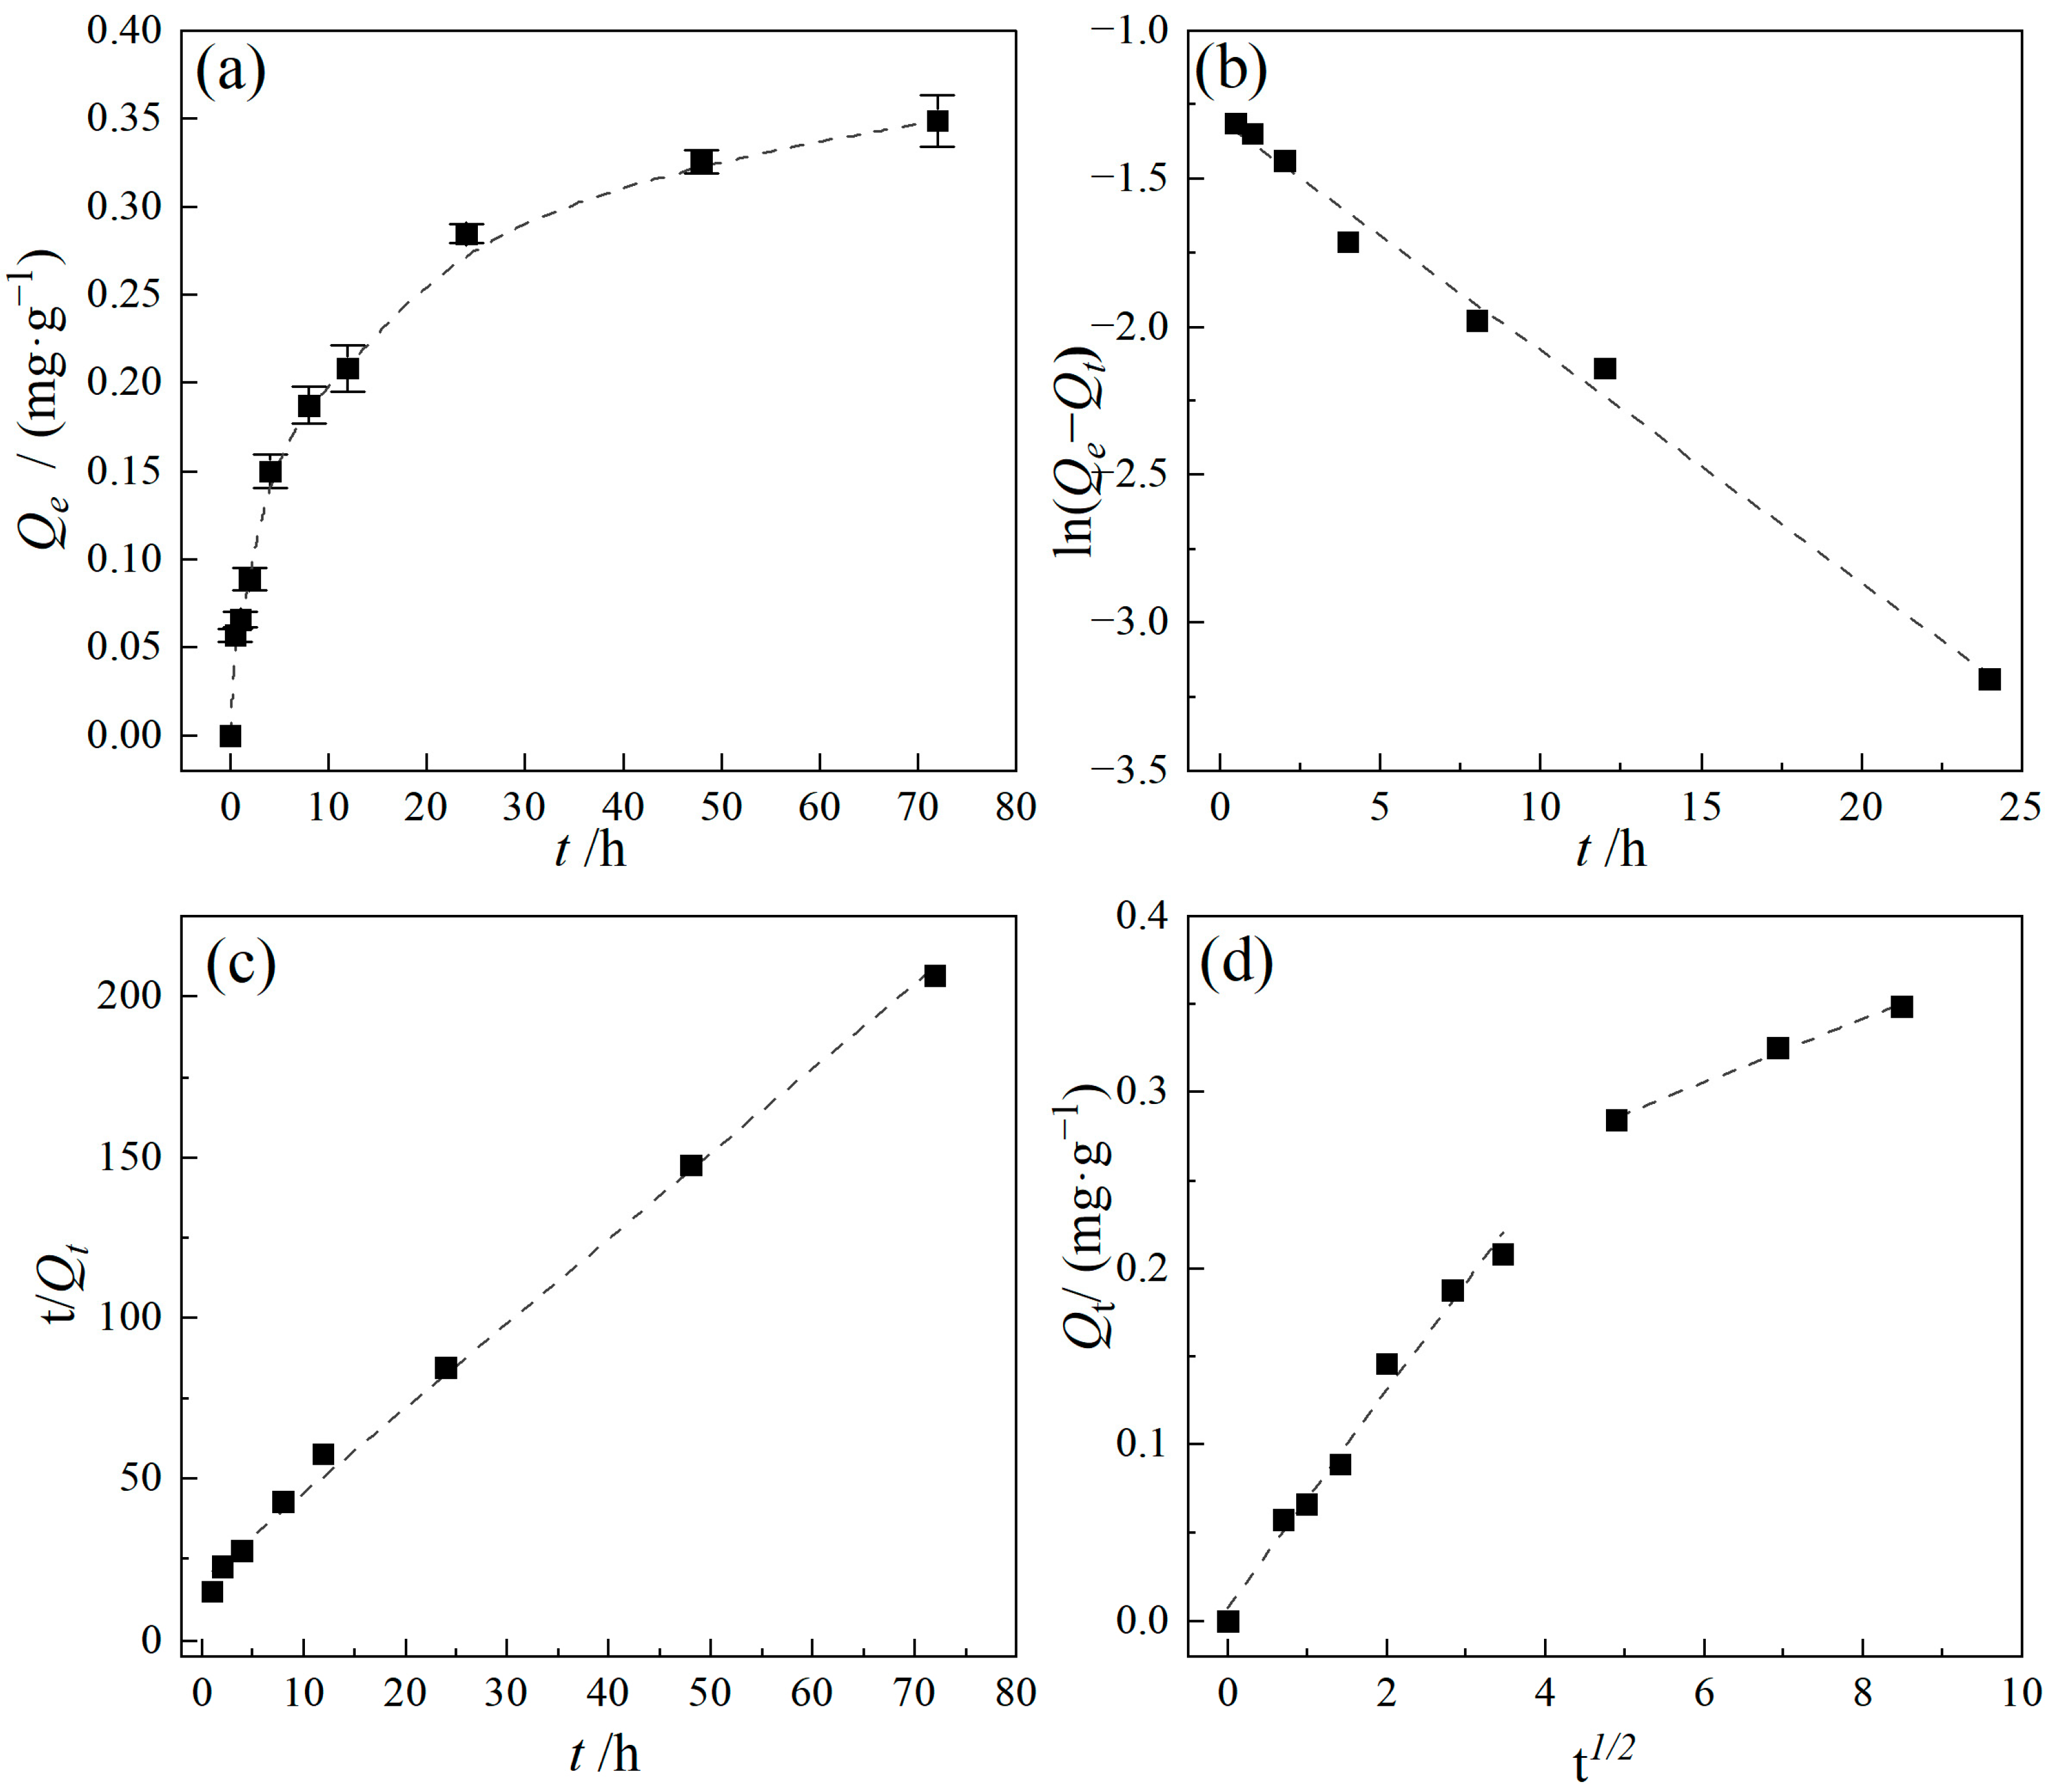
3.2. Adsorption Kinetics Analysis

The kinetic results for the adsorption of TC by PE are illustrated in Figure 5. The adsorption capacity of TC increased with increasing adsorption time. The entire adsorption process consisted of two distinct stages: an initial rapid adsorption stage followed by a slower adsorption stage. Specifically, at the early stage of adsorption, the adsorption rate was relatively rapid and gradually decreased as the adsorption proceeded, ultimately reaching equilibrium after approximately 48 h, with an equilibrium adsorption capacity of 0.326 mg/g. Similar phenomena were also observed in the studies on the adsorption of TC by PP, PVC, and PS microplastics, which found that the adsorption equilibrium of TC on various types of MPs was achieved within 24 to 48 h [26,27]. The adsorption kinetic data were fitted using pseudo-first-order and pseudo-second-order kinetic models, and the results are shown in Figure 5b,c and Table 2. The results indicate that the pseudo-second-order kinetic model provided a better fit to the experimental data. Due to the limited adsorption sites on the PE surface, the entire adsorption process consists of multiple adsorption stages, which are influenced by multiple mechanisms working together, and the rate-limiting step involves the migration, diffusion, or rearrangement of the adsorbate.
The solute adsorption process generally includes four steps: mass transfer, film diffusion, intraparticle diffusion, and adsorption [28]. This study mainly focused on film diffusion and intraparticle diffusion as the primary processes to explore the rate-limiting step for TC adsorption by PE. The Weber–Morris intraparticle diffusion model was applied to analyze the adsorption process, and the results are presented in Figure 5d and Table 2; the adsorption of TC by PE primarily involves two stages. The initial stage corresponds to film diffusion, characterized by a rapid adsorption rate during which TC is quickly transferred from the aqueous phase and adsorbed onto the external adsorption sites of the PE surface through film diffusion. At this stage, hydrophobic interactions and electrostatic interactions are the dominant mechanisms. As adsorption continues, the process transitions to the second stage, related to intraparticle diffusion, where the adsorption rate decreases significantly, and internal diffusion becomes the dominant mechanism as TC adsorbs onto the internal surfaces of the PE particles. Eventually, a dynamic equilibrium of adsorption/desorption is established on the PE surface. Furthermore, linear fitting of the experimental data revealed that none of the fitting lines passed through the origin, indicating a non-zero Ci value (boundary layer thickness). This demonstrates that the adsorption of TC by PE is not controlled solely by surface diffusion; instead, it is simultaneously influenced by both surface diffusion and intraparticle diffusion mechanisms [29]. In summary, the overall adsorption process of TC by PE involves the synergistic interaction of film diffusion, intraparticle diffusion, and adsorption/desorption dynamic equilibrium, with intraparticle diffusion serving as the primary rate-controlling mechanism.

3.3. Adsorption Isotherm Analysis

The adsorption isotherm data were fitted using the Langmuir, Freundlich, and Henry models, and the results are shown in Figure 6 and Table 3. According to Table 3, the coefficient of determination (R2) obtained from the Langmuir model fitting was closer to 1 compared to those from the Freundlich and Henry models, suggesting that the Langmuir model better described the adsorption of TC onto PE. This indicates that the adsorption of TC by PE primarily follows a monolayer saturated adsorption process. The Freundlich constant n was larger than 1, suggesting heterogeneous distribution of adsorption sites and indicating that the adsorption of TC by PE was nonlinear and is affected by the concentration of TC [4,30]. The adsorption behavior of antibiotics onto MPs is influenced by multiple factors. Due to the hydrophobic properties of MPs, hydrophobic interactions are considered a key mechanism for the adsorption of hydrophobic pollutants [31]. In addition, surface pores on MPs can influence pollutant adsorption through micropore filling. In this study, the fitting results of the Henry model were poor, further confirming the surface heterogeneity of PE. It is possible that there are different types of adsorption sites on the PE surface. Certain areas are suitable for single-layer adsorption (in accordance with the Langmuir model), while areas with uneven surfaces or many pores support multi-layer adsorption (in accordance with the Freundlich model). As a result, although the overall adsorption trend is close to the single-layer saturation process, there is still some non-ideal adsorption. Overall, the adsorption of TC onto PE was a nonlinear adsorption process dominated by monolayer homogeneous adsorption. The adsorption process mainly exhibits physical adsorption. Besides hydrophobic interaction, mechanisms such as electrostatic interactions and micropore filling mechanisms also play significant roles in the adsorption process [32].

3.4. Influencing Factors Analysis

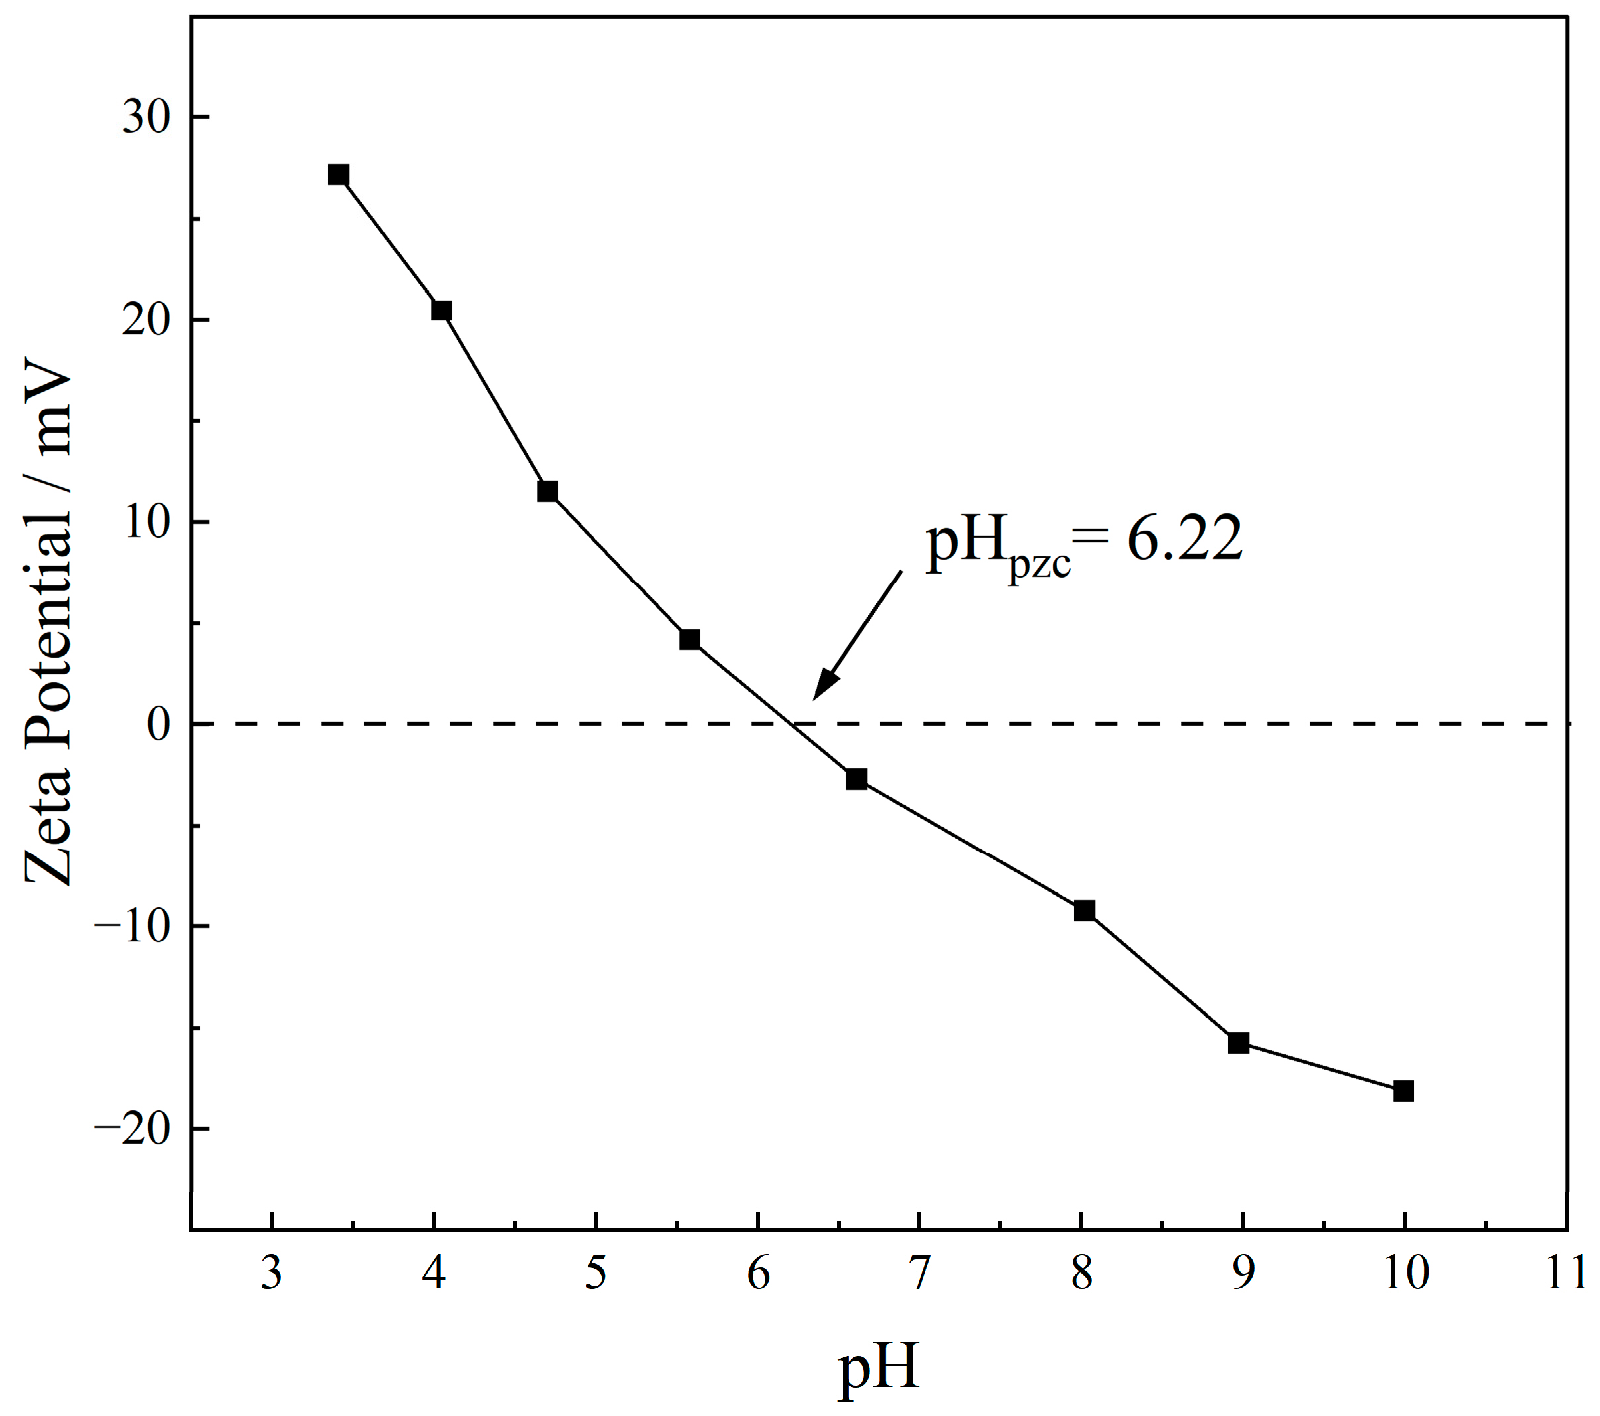
3.4.1. Effect of pH Conditions

As a critical environmental parameter, pH plays an essential role in the adsorption process primarily by altering the charge status on the MP surfaces and the chemical speciation of organic pollutants. The pH of the environmental medium directly influences the surface charge (zeta potential, pHz) of MPs, while the pollutant’s pKa value determines its ionization state under specific pH conditions. If the environmental pH exceeds the pollutant’s pKa, pollutant molecules tend to dissociate into ionic forms, thus altering their electrostatic interactions with the MP surfaces. Consequently, electrostatic attraction promotes adsorption when the charges of MP surfaces and ionized organic pollutants are opposite, whereas electrostatic repulsion inhibits adsorption when their charges are similar [33].
The pH of groundwater typically ranges from 5.0 to 9.0 [34,35,36,37,38]. Therefore, the initial solution pH was adjusted to 5.0, 6.0, 7.0, and 8.0, respectively, to investigate the impact of different groundwater pH conditions on the adsorption of TC by PE. The adsorption of TC by PE at different pH is presented in Figure 7. As the pH of the reaction system changed from weakly acidic to neutral conditions, the adsorption capacity of PE for TC increased with pH values. Specifically, the equilibrium adsorption capacities of TC at pH values of 5.0, 6.0, and 7.0 were 0.185, 0.243, and 0.310 mg/g, respectively. And at pH values of 6.0, the adsorption rate (k2) is the highest (Table 4). Under neutral to weakly alkaline conditions, when the pH increased from 7.0 to 8.0, the equilibrium adsorption capacity of TC by PE decreased to 0.279 mg/g. The pKa values of TC are pKa1 = 3.3, pKa2 = 7.7, and pKa3 = 9.79 [39]. Meanwhile, the pHz of the PE used in this study was 6.22 (Figure 2), which was determined by zeta potential measurement. When the solution pH was 5.0 and 6.0, TC existed predominantly as cations (TC+) and a small amount of Zwitterions (H2TC±), and the PE surface carried a positive charge; hence, electrostatic repulsion between TC and PE resulted in a low adsorption capacity. At pH 7.0, the PE surface became negatively charged while TC existed primarily as zwitterions (H2TC±), resulting in electrostatic attraction between them. Additionally, the competition of protons (H+) for adsorption sites on the PE surface decreases, making electrostatic and hydrophobic interactions significant throughout the adsorption process. Consequently, PE exhibited the maximum adsorption capacity for TC at this pH. As pH further increased, TC mainly existed in anionic form (TC, TC2−), while the PE surface also bears negative charges, causing electrostatic repulsion and thus reducing adsorption capacity.

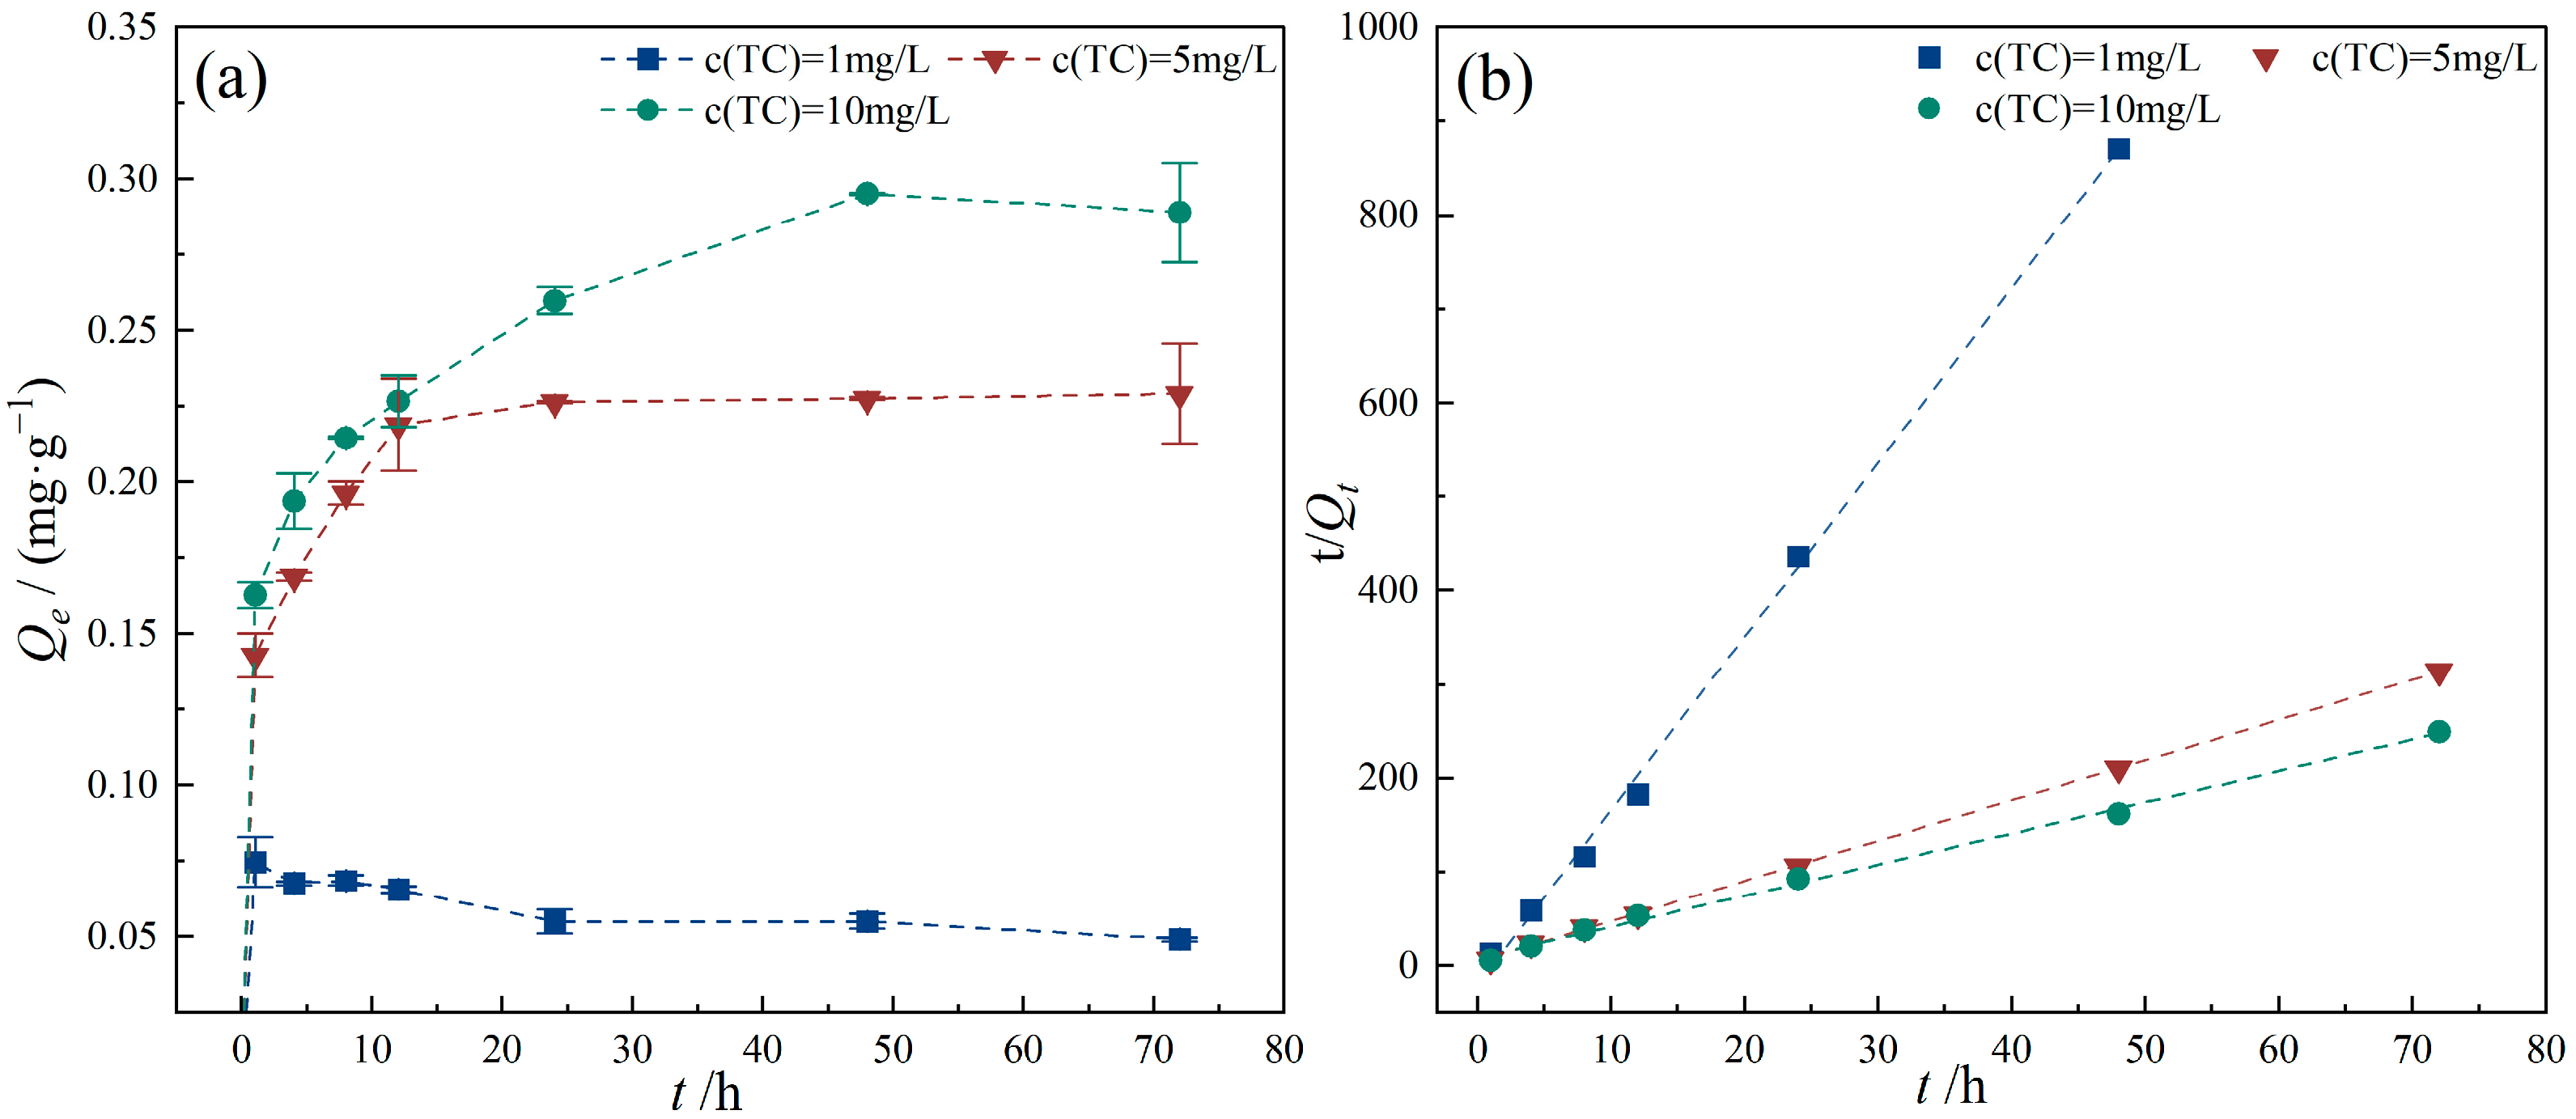
3.4.2. Effect of TC Concentrations

Pollutant concentration is an important environmental index of groundwater pollution, one of the crucial factors influencing the adsorption process. The adsorption of TC by PE at different initial TC concentrations is presented in Figure 8. The results indicate that the adsorption capacity reached its maximum value of 0.075 mg/g after 1 h when the initial TC concentration was 1 mg/L, after which it slightly decreased and remained relatively stable. This is because smaller pollutant concentrations correspond to smaller internal diffusion mass transfer driving forces. As the initial TC concentration increased, the equilibrium adsorption capacity gradually increased, reaching 0.228 mg/g and 0.289 mg/g at initial TC concentrations of 5 and 10 mg/L, respectively. According to Fick’s law, solute molecules migrating from the liquid phase to the solid surface must overcome mass transfer resistance. Therefore, as the concentration of TC molecules in the solution increases, the driving force facilitating molecular migration from the aqueous phase to the PE surface is enhanced, thereby increasing the adsorption capacity of PE to some extent [40]. Additionally, as illustrated in Figure 8b, adsorption of TC by PE at various initial TC concentrations followed the pseudo-second-order kinetic model. However, as the initial concentration of TC increased, the adsorption rate (k2) decreased (Table 4). This is related to the complex interaction between adsorbate and adsorbent. The increase in TC concentration in the system increases the probability of intermolecular collision, and thus the combination time of TC with the active sites on PE surface increases. Therefore, the adsorption rate decreases with the increase in the initial TC concentration [41].

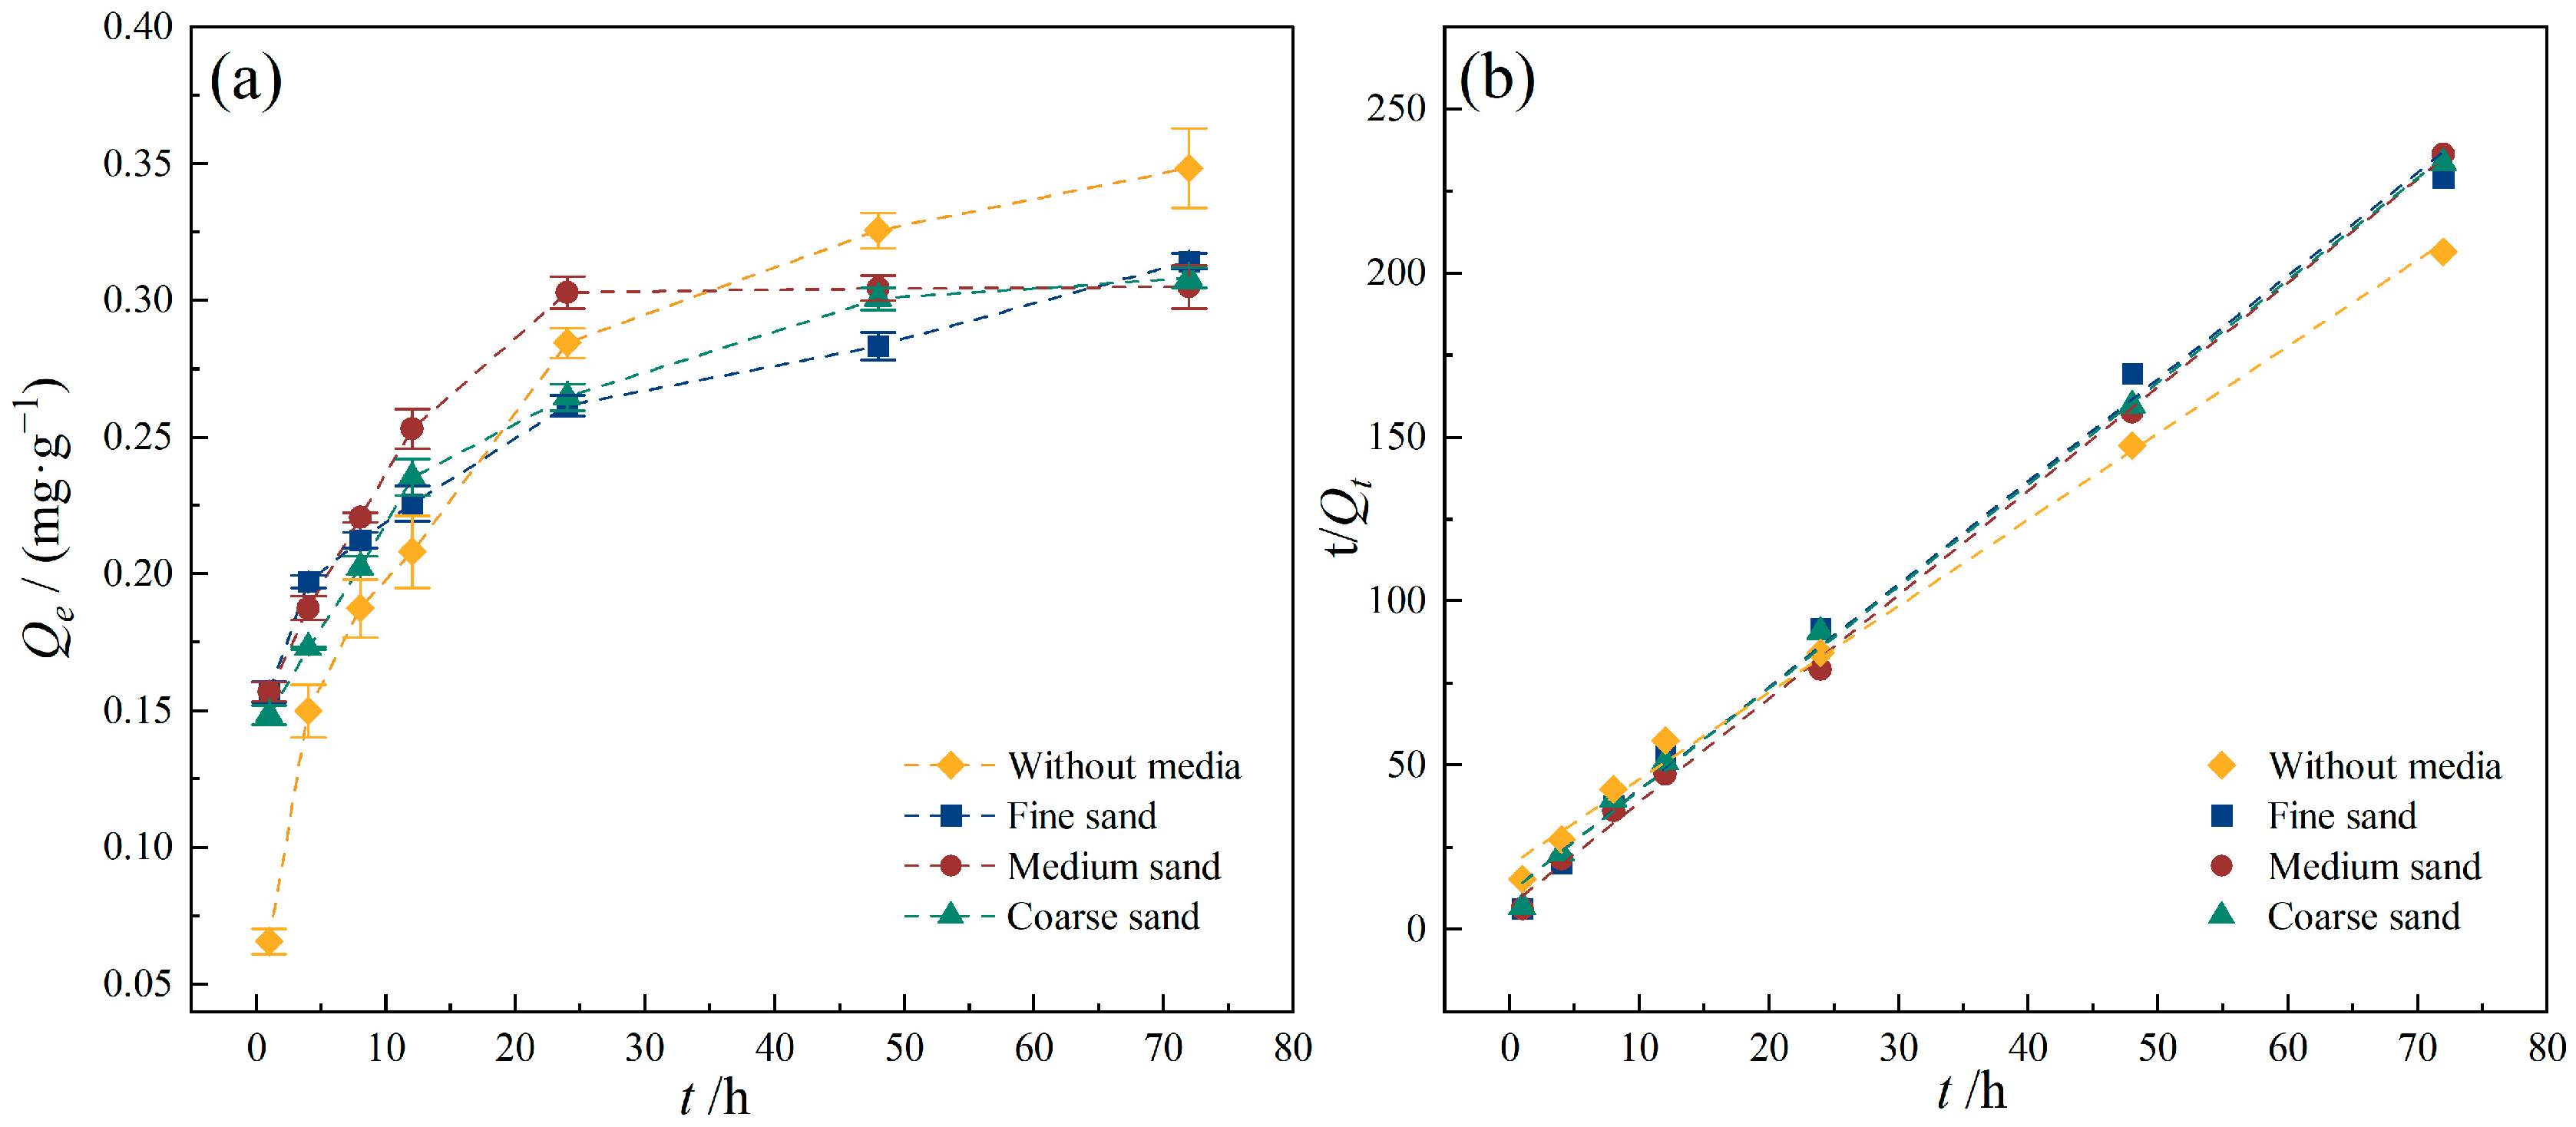
3.4.3. Effect of Media Particle Size

Aquifer media in groundwater typically contain micropores and fractures, which can adsorb and store various organic contaminants, and thereby slow their migration in groundwater. However, stored pollutants may be released back into groundwater, becoming secondary contamination sources and leading to concentration rebounds after remediation. Furthermore, interactions between organic molecules and aquifer media include cation exchange, electrostatic interactions, and surface complexation during transport processes, which all influence the mobility of organic contaminants in subsurface environments [42].
The effect of aquifer media particle size on the adsorption of TC by PE was studied, and the results are shown in Figure 9. In the presence of coarse and medium sand, adsorption reached equilibrium within 48 h, while the adsorption capacity of TC by PE under fine sand continued increasing beyond 48 h. After 72 h, the adsorption capacities under coarse, medium, and fine sand conditions were 0.314 mg/g, 0.305 mg/g, and 0.308 mg/g, respectively. In the system without any aquifer medium added, the equilibrium adsorption capacity of TC was similar to that observed in the presence of sand media, indicating that different particle sizes of aquifer media had little influence on TC adsorption by PE. Previous studies demonstrate that quartz sand can interact electrostatically with H2TC± for its surface negative charges, and the carboxyl groups in TC molecules can also form hydroxyl complexes with quartz sand surfaces [43], which both lead to competitive adsorption between sand and PE during the adsorption of TC. Generally, smaller particle sizes correspond to larger specific surface areas, leading to stronger adsorption capacities toward contaminants and thus greater competitive adsorption effects. However, MPs exhibited significantly stronger adsorption for antibiotics than quartz sand, and thus the influence of different media particle sizes is negligible. From the kinetic fitting results, the pseudo-second-order kinetic model adequately described the adsorption behavior under all three media conditions. Similar values of adsorption rates (Table 4) indicate again that the media particle sizes had little influence on the adsorption process of TC by PE.

3.4.4. Effect of DOM

DOM is an essential component in natural aquatic environments. DOM can interact with organic and inorganic pollutants, significantly influencing their migration, transformation processes, bioavailability, and toxicity [44]. Studies have shown that the DOM concentration in natural waters generally does not exceed 10 mg/L, with even lower levels found in groundwater. In this experiment, FA concentrations ranging from 0.5 to 5 mg/L were used to investigate their effect on TC adsorption. The results presented in Figure 10 indicate that at lower FA concentrations (0.5 and 1 mg/L), the influence on TC adsorption by PE was similar. However, as the DOM concentration increased to 5 mg/L, the adsorption capacity of PE for TC significantly decreased, dropping from 0.315 mg/g to 0.217 mg/g. Similar findings were reported by Atugoda et al. [45], who studied CIP adsorption behavior by PE. DOM can inhibit antibiotic adsorption by MPs because the affinity of antibiotics for DOM was higher than that for MPs. FA contains abundant functional groups such as carbonyl and phenolic hydroxyl groups. The increase in FA concentration may promote hydrogen bonding and carboxyl complexation between FA and TC, resulting in competitive adsorption between FA and PE, thereby reducing TC adsorption onto PE. The adsorption data at different FA concentrations were fitted by the pseudo-second-order kinetic model. The adsorption rate increased with the increase in FA concentration (Table 4), indicating that the time for TC to reach adsorption equilibrium is increased significantly with the enhancement of FA inhibition, and thus the adsorption rate decreased accordingly.

3.4.5. Effect of Ionic Strength

Anions and cations are ubiquitous in aquifer environments. CaCl2 is a common chemical constituent in groundwater, with a wide range of concentration levels. It plays a crucial role in the transformation and transport processes of contaminants [46]. Correspondingly, the adsorption of TC by PE in groundwater environments is also influenced by ionic strength. CaCl2 solutions with concentrations of 0.005 mol/L, 0.01 mol/L, 0.05 mol/L, and 0.1 mol/L were employed as background electrolytes in the experiment to investigate the effect of ionic strength on the adsorption of TC by PE. As shown in Figure 11, under different CaCl2 concentrations, the adsorption of TC by PE reached equilibrium after 48 h, and the equilibrium adsorption capacities were 0.2262, 0.2579, 0.2901, and 0.2171 mg/g, respectively. The pseudo-second-order kinetic model was followed in the adsorption process. As the concentration of CaCl2 increased from 0.005 mol/L to 0.05 mol/L, the adsorption capacity of TC by PE gradually increased. However, when the concentration of CaCl2 further increased to 0.1 mol/L, the adsorption capacity of TC by PE decreased. This phenomenon is likely attributed to the bridging effect of Ca2+, which facilitates the formation of ternary complexes between Ca2+, the functional groups on the PE surface, and TC molecules, thereby enhancing the adsorption of TC by PE. Furthermore, increasing the ionic concentration within an appropriate range compresses the electrical double layer at the PE surface, thereby enhancing electrostatic interactions between PE and TC and further promoting the adsorption process [47]. However, as the ionic strength increases further, TC adsorption by PE is significantly suppressed. This inhibition arises from competitive adsorption, where elevated concentrations of Ca2+ preferentially occupy the cation exchange sites on the PE surface, thereby inhibiting the adsorption of TC onto PE [48]. In previous studies, it has been observed that due to competitive adsorption, the adsorption of organic compounds on microplastics continuously decreases with increasing ionic strength, particularly in the presence of monovalent cations such as Na+ and K+ [45,46]. Therefore, the influence of ionic strength on the adsorption of organic compounds by microplastics is also closely related to the type of ions, as well as the properties of microplastics and pollutants. The results of this study indicate that the adsorption of TC by PE is primarily driven by hydrophobic interactions, with electrostatic interactions serving as a secondary adsorption mechanism.

3.5. Adsorption Mechanism

The interaction mechanisms between microplastics and antibiotics are of great significance for predicting the environmental fate of antibiotics. Therefore, the exploration of adsorption mechanisms provides supportive evidence for determining the potential interactions between microplastics and antibiotics.
The mechanisms of TC adsorption by TC were well analyzed and explained by FTIR and XPS results. The most significant spectral changes observed after adsorption included the appearance of characteristic TC peaks at 3430, 3100, and 1374 cm−1, while no new peaks emerged in the PE spectra. This spectral evidence indicates that the PE structure remained intact and suggests the absence of chemical adsorption. The XPS analysis obtained consistent results with FTIR, both of which showed no signs of chemical adsorption. These findings collectively demonstrate that the TC-PE interaction occurs predominantly through physical adsorption mechanisms.
The kinetic and isothermal adsorption models were employed to analyze the entire adsorption process from the perspectives of diffusion and partitioning mechanisms. The fitting results revealed that the adsorption of TC by PE was characterized as a nonlinear single-layer adsorption on a heterogeneous surface. TC molecules diffused into the pores on the surface of PE and are adsorbed via hydrophobic interactions and micropore filling mechanisms. Van der Waals interactions and electrostatic interactions also contributed partially during the adsorption process (Figure 12). Physical adsorption, as opposed to chemical adsorption, is a relatively weak process that possesses a certain degree of reversibility and is more susceptible to competitive adsorption effects. Therefore, the presence of FA or higher concentrations of cations in the groundwater environment can induce competitive adsorption, leading to a decrease in the adsorption capacity of TC by PE.
Generally, the chemical and physical properties of the adsorbent and adsorbate are influenced by the environmental factors, thereby affecting the adsorption process. The existence forms of TC under different pH values greatly influence its adsorption behavior. Under acidic and alkaline conditions, the adsorption capacity shows varying degrees of decline due to the influence of electrostatic interactions [47]. Under neutral to weakly alkaline conditions in groundwater, hydrophobic and electrostatic interactions are the primary forces governing the adsorption of TC by PE. The adsorption process of ionizable organic pollutants such as TC is mainly controlled by hydrophobic and electrostatic interactions [45]. Under the experimental pH conditions, the compression of the electrical double layer on the PE surface by Ca2+ and the “bridging” effect enhanced the adsorption of TC by PE. However, as the concentration of Ca2+ in the solution increased, the competition between TC and Ca2+ became stronger, gradually inhibiting the adsorption process (Figure 11). In the presence of FA, TC exhibits a high affinity for it, leading to competitive adsorption between PE and FA for TC. Numerous studies have investigated the adsorption mechanisms between TC and FA and confirmed the existence of surface complexation and hydrophobic interactions between TC and FA [47]. In actual groundwater environments, contaminants typically exist in the form of mixtures. Other pollutants, including inorganic contaminants (such as Cl and NO32−) and heavy metal pollutants (such as Cr and Cu), may influence the adsorption behavior of TC on microplastics in groundwater. Moreover, microbial communities may also affect the adsorption process of TC by altering the surface properties of microplastics [49].

4. Conclusions

The adsorption equilibrium of TC by PE was reached at 48 h with an equilibrium adsorption capacity of 0.326 mg/g. The adsorption kinetics fitted pseudo-second-order kinetics models well. The adsorption process was controlled by three concurrent mechanisms: film diffusion, intraparticle diffusion, and adsorption–desorption equilibrium, among which intraparticle diffusion was the primary rate-controlling step. The adsorption isotherms of TC by PE were well fitted to the Langmuir model with a maximum adsorption capacity of 0.339 mg/g, indicating that the adsorption of TC by PE was a nonlinear adsorption process dominated by monolayer homogeneous adsorption. In addition to hydrophobic interactions, electrostatic interactions, micropore filling mechanisms, and van der Waals interactions also play important roles in the adsorption process. As the pH is elevated from weakly acidic to neutral conditions, the adsorption of TC by PE is promoted, with a maximum observed at pH 7. Subsequently, the adsorption capacity is reduced under neutral to weakly alkaline conditions. The adsorption capacity of TC by PE increased with the increase in the initial concentration of TC. When the concentration of TC increased from 1 mg/L to 10 mg/L, the equilibrium adsorption amount of TC by PE increased by approximately 4.6 times. Owing to the limited adsorption capacity of the aquifer media for TC, the impact of varying particle sizes of the media on the adsorption of TC by PE was negligible and could be ignored. FA and PE exhibited competitive adsorption for TC, and as the concentration of FA increased, its inhibitory effect on the adsorption of TC by PE intensified, leading to a reduction in adsorption capacity of TC. As the ionic strength increased from 0.005 to 0.05 mol/L, the adsorption capacity of TC by PE increased due to the bridging effect and electrostatic interactions. When the ionic strength further increases to 0.1 mol/L, the competition between Ca2+ and TC for adsorption sites becomes significant, leading to a decrease in the adsorption capacity of TC by PE. Under different environmental conditions, TC adsorption onto PE fitted to the pseudo-second-order kinetics model. The adsorption rate showed an inverse relationship with adsorption capacity, where the larger the adsorption amount, the longer the time required for the adsorption process to reach equilibrium, consequently resulting in lower adsorption rates.

Author Contributions

Conceptualization, J.L. and H.L.; methodology, H.L. and W.Z.; software, X.L. and X.K.; formal analysis, X.K. and M.L.; investigation, J.L. and W.Z.; data curation, J.L., X.L.; writing—original draft preparation, J.L. and H.L.; writing—review and editing, H.L.; supervision, H.L.; funding acquisition, H.L. All authors have read and agreed to the published version of the manuscript.

Funding

This research was funded by Basic Scientific Research Funds of China Geological Survey, grant number SK202318, and National Natural Science Foundation of China, grant number 42430718 and 42307084.

Institutional Review Board Statement

Not applicable.

Informed Consent Statement

Not applicable.

Data Availability Statement

The original data presented in this study are included in the article. Further inquiries can be directed to the corresponding author(s).

Conflicts of Interest

Author Xiongguang Li was employed by the company CCCC-AECOM Eco-Environmental Co. The remaining authors declare that the research was conducted in the absence of any commercial or financial relationships that could be construed as a potential conflict of interest.

References

  1. Álvarez, M.S.; Gómez, L.; Ulloa, R.G.; Deive, F.J.; Sanromán, M.A.; Rodríguez, A. Antibiotics in swine husbandry effluents: Laying the foundations for their efficient removal with a biocompatible ionic liquid. Chem. Eng. J. 2016, 298, 10–16. [Google Scholar] [CrossRef]
  2. Zhang, Y.T.; Wang, M.; Cheng, W.; Huang, C.; Ren, J.H.; Wan, T.; Gao, K. Effects of water environmental factors and antibiotics on bacterial community in urban landscape lakes. Aquat. Toxicol. 2023, 265, 106740. [Google Scholar] [CrossRef] [PubMed]
  3. Fang, L.F.; Chen, C.Y.; Li, S.Y.; Ye, P.P.; Shi, Y.J.; Sharma, G.; Sarkar, B.; Shaheen, S.M.; Lee, S.S.; Xiao, R.; et al. A comprehensive and global evaluation of residual antibiotics in agricultural soils: Accumulation, potential ecological risks, and attenuation strategies. Ecotoxicol. Environ. Saf. 2023, 262, 115175. [Google Scholar] [CrossRef] [PubMed]
  4. Wang, J.; Huang, M.T.; Li, B.L.; Mohamed, H.I.; Song, H.; Li, G.; Yu, Y.; Zhang, H.; Xie, W. Correction to: Distribution characteristics and removal rate of antibiotics and antibiotic resistance genes in different treatment processes of two drinking water plants. Front. Environ. Sci. Eng. 2024, 18, 145. [Google Scholar] [CrossRef]
  5. Yi, C.M.; Shang, J.G.; Shen, Z.H.; Sun, Y.L.; Yang, Y.; Zheng, X.L.; Peng, Z.; Chen, J.; Liu, Y.; Guo, R.; et al. Distribution and risk characteristics of antibiotics in China surface water from 2013 to 2024. Chemosphere Glob. Chang. Sci. 2025, 375, 144197. [Google Scholar] [CrossRef]
  6. Huang, F.Y.; Zhou, D.F.; Yan, B.S.; Wang, B.; Liu, F.; Guan, X.Y.; Qu, S. Global priority antibiotics integrated with their environmental occurrence and the health risks of antibiotic resistance genes. J. Clean. Prod. 2025, 490, 144778. [Google Scholar] [CrossRef]
  7. Aquino, I.d.S.d.; Freire, E.d.A.; Rodrigues, A.M.; Vercillo, O.E.; Silva, M.F.P.d.; Rocha, M.F.S.d.; Amaral, M.C.S.; Amorim, A.K.B. Sustainable Strategy for Microplastic Mitigation: Fe3O4 Acid-Functionalized Magnetic Nanoparticles for Microplastics Removal. Sustainability 2025, 17, 5203. [Google Scholar] [CrossRef]
  8. Horta, M.J.; Seetha, N. Experimental and mathematical investigation of cotransport of clay and microplastics in saturated porous media. Sci. Total Environ. 2024, 954, 176739. [Google Scholar] [CrossRef]
  9. Li, H.; Liu, H.; Lin, Q.; Chen, T.; Peng, R. The Hidden Threat of Microplastics in Desert Environments: Environmental Impact, Challenges, and Response Measures. Sustainability 2025, 17, 1897. [Google Scholar] [CrossRef]
  10. Napper, I.E.; Baroth, A.; Barrett, A.C.; Bhola, S.; Chowdhury, G.; Davies, B.F.R. The distribution and characterisation of microplastics in air, surface water and sediment within a major river system. Sci. Total Environ. 2023, 901, 166640. [Google Scholar] [CrossRef]
  11. Narloch, I.; Gackowska, A.; Wejnerowska, G. Microplastic in the Baltic Sea: A review of distribution processes, sources, analysis methods and regulatory policies. Environ. Pollut. 2022, 315, 120453. [Google Scholar] [CrossRef]
  12. Panno, S.V.; Kelly, W.R.; Scott, J.; Zheng, W.; McNeish, R.E.; Holm, N.; Hoellein, T.J.; Baranski, E.L. Microplastic Contamination in Karst Groundwater Systems. Groundwater 2019, 57, 189–196. [Google Scholar] [CrossRef] [PubMed]
  13. Wisitthammasri, W.; Promduang, P.; Chotpantarat, S. Characterization of microplastics in soil, leachate and groundwater at a municipal landfill in Rayong Province, Thailand. J. Contam. Hydrol. 2024, 267, 104455. [Google Scholar] [CrossRef] [PubMed]
  14. Frias, J.P.G.L.; Sobral, P.; Ferreira, A.M. Organic pollutants in microplastics from two beaches of the Portuguese coast. Mar. Pollut. Bull. 2010, 60, 1988–1992. [Google Scholar] [CrossRef]
  15. Massos, A.; Turner, A. Cadmium, lead and bromine in beached microplastics. Environ. Pollut. 2017, 227, 139–145. [Google Scholar] [CrossRef] [PubMed]
  16. Guo, X.; Wang, J.L. Sorption of antibiotics onto aged microplastics in freshwater and seawater. Mar. Pollut. Bull. 2019, 149, 110511. [Google Scholar] [CrossRef]
  17. Ma, J.; Sheng, G.D.; O’Connor, P. Microplastics combined with tetracycline in soils facilitate the formation of antibiotic resistance in the Enchytraeus crypticus microbiome. Environ. Pollut. 2020, 264, 114689. [Google Scholar] [CrossRef]
  18. Syranidou, E.; Kalogerakis, N. Interactions of microplastics, antibiotics and antibiotic resistant genes within WWTPs. Sci. Total Environ. 2022, 804, 150141. [Google Scholar] [CrossRef]
  19. Yu, F.; Yang, C.F.; Huang, G.Q.; Zhou, T.; Zhao, Y.; Ma, J. Interfacial interaction between diverse microplastics and tetracycline by adsorption in an aqueous solution. Sci. Total Environ. 2020, 721, 137729. [Google Scholar] [CrossRef]
  20. Nguyen, T.; Ho, T.; Chen, C.; Bui, X.; Chen, W.; Dong, C. Influence of UV wavelength variations on tetracycline adsorption by polyethylene microplastics in aquatic environments. Sci. Total Environ. 2025, 959, 178144. [Google Scholar] [CrossRef]
  21. Fan, X.L.; Xie, Y.; Qian, S.W.; Xiang, Y.; Chen, Q.; Yang, Y.Y.; Liu, J.; Zhang, J.; Hou, J. Insights into the characteristics, adsorption and desorption behaviors of microplastics aged with or without fulvic acid. Environ. Sci. Pollut. Res. 2022, 30, 10484–10494. [Google Scholar] [CrossRef] [PubMed]
  22. Zhou, Y.F.; Yang, Y.Y.; Liu, G.H.; He, G.; Liu, W. Adsorption mechanism of cadmium on microplastics and their desorption behavior in sediment and gut environments: The roles of water pH, lead ions, natural organic matter and phenanthrene. Water Res. 2020, 184, 116209. [Google Scholar] [CrossRef] [PubMed]
  23. Zou, J.Y. Study on the Adsorption and Mechanism of Microplastics on Typical Organic Pollutants and Heavy Metal Ions. Ph.D. Thesis, Northeast Normal University, Changchun, China, 2021. [Google Scholar] [CrossRef]
  24. Luo, H.W.; Li, Y.; Zhao, Y.Y.; Xiang, Y.H.; He, D.Q.; Pan, X.L. Effects of accelerated aging on characteristics, leaching, and toxicity of commercial lead chromate pigmented microplastics. Environ. Pollut. 2020, 257, 113475. [Google Scholar] [CrossRef]
  25. Zhong, C.F. Study on the Damage and Mechanism of Several Typical Bonded Solid Lubricating Coatings Under Strong Irradiation Environment. Master’s Thesis, Northwest Minzu University, Lanzhou, China, 2024. [Google Scholar] [CrossRef]
  26. Dou, Y.Y.; Cheng, X.H.; Miao, M.H.; Wang, T.; Hao, T.W.; Zhang, Y.Q.; Li, Y.; Ning, X.; Wang, Q. The impact of chlorination on the tetracycline sorption behavior of microplastics in aqueous solution. Sci. Total Environ. 2022, 849, 157800. [Google Scholar] [CrossRef]
  27. Zahmatkesh, A.M.; Najafpoor, A.; Barikbin, B.; Bonyadi, Z. Adsorption of tetracycline on polyvinyl chloride microplastics in aqueous environments. Sci. Rep. 2023, 13, 17989. [Google Scholar] [CrossRef]
  28. Lin, L.J.; Tang, S.; Wang, X.S.; Sun, X.; Liu, Y. Sorption of tetracycline onto hexabromocyclododecane/polystyrene composite and polystyrene microplastics: Statistical physics models, influencing factors, and interaction mechanisms. Environ. Pollut. 2021, 284, 117164. [Google Scholar] [CrossRef]
  29. Wu, P.F.; Cai, Z.W.; Jin, H.B.; Tang, Y.Y. Adsorption mechanisms of five bisphenol analogues on PVC microplastics. Sci. Total Environ. 2019, 650, 671–678. [Google Scholar] [CrossRef]
  30. Dong, Y.M.; Gao, M.L.; Song, Z.G.; Qiu, W.W. As(III) adsorption onto different-sized polystyrene microplastic particles and its mechanism. Chemosphere 2020, 239, 124792. [Google Scholar] [CrossRef] [PubMed]
  31. Stapleton, M.J.; Ansari, A.J.; Hai, F.I. Antibiotic sorption onto microplastics in water: A critical review of the factors, mechanisms and implications. Water Res. 2023, 233, 119790. [Google Scholar] [CrossRef] [PubMed]
  32. Seidensticker, S.; Grathwohl, P.; Lamprecht, J.; Zarfl, C. A combined experimental and modeling study to evaluate pH-dependent sorption of polar and non-polar compounds to polyethylene and polystyrene microplastics. Environ. Sci. Eur. 2018, 30, 30. [Google Scholar] [CrossRef]
  33. Zhang, J.; Huang, W.Y.; Zhong, F.; Zhang, H.R.; Wei, S.P.; Dong, Y.W.; Chen, S.; Cao, F.; Zou, L.; Xu, J. Investigation of the adsorption pattern and mechanism of enrofloxacin on montmorillonite and activated carbon surfaces: Effect of Cu(II) complexation. Surf. Interfaces 2025, 60, 106012. [Google Scholar] [CrossRef]
  34. Hájek, M.; Jiménez-Alfaro, B.; Hájek, O.; Brancaleoni, L.; Cantonati, M.; Carbognani, M.; Horsák, M. A European map of groundwater pH and calcium. Earth Syst. Sci. Data 2020, 13, 1089–1105. [Google Scholar] [CrossRef]
  35. Hu, Y.H. Efficacy and Mechanism of Activated Persulfate Degradation of Sulfadimethylpyrimidine in Groundwater by Prussian Blue Derivatives. Master’s Thesis, Chinese Research Academy of Environmental Sciences, Beijing, China, 2024. [Google Scholar] [CrossRef]
  36. Saalidong, B.M.; Aram, S.A.; Otu, S.; Lartey, P.O. Examining the dynamics of the relationship between water pH and other water quality parameters in ground and surface water systems. PLoS ONE 2022, 17, e0262117. [Google Scholar] [CrossRef]
  37. Wallace, S.H.; Shaw, S.; Morris, K.; Small, J.S.; Fuller, A.J.; Burke, I.T. Effect of groundwater pH and ionic strength on strontium sorption in aquifer sediments: Implications for 90Sr mobility at contaminated nuclear sites. Appl. Geochem. 2012, 27, 1482–1491. [Google Scholar] [CrossRef]
  38. Zhou, X.; Shen, Y.; Zhang, H.; Song, C.; Li, J.; Liu, Y. Hydrochemistry of the natural low pH groundwater in the coastal aquifers near Beihai. China. J. Ocean Univ. China 2015, 14, 475–483. [Google Scholar] [CrossRef]
  39. Jang, H.M.; Yoo, S.; Choi, Y.K.; Park, S.; Kan, E. Adsorption isotherm, kinetic modeling and mechanism of tetracycline on Pinus taeda -derived activated biochar. Bioresour. Technol. 2018, 259, 24–31. [Google Scholar] [CrossRef] [PubMed]
  40. Ashrafi, M.; Saeed, F. Polyoxometalate supported on a magnetic Fe3O4/MIL-88A rod-like nanocomposite as an adsorbent for the removal of ciprofloxacin, tetracycline and cationic organic dyes from aqueous solutions. RSC Adv. 2023, 13, 6356–6367. [Google Scholar] [CrossRef] [PubMed]
  41. Chen, S.Y.; Guo, X.T.; Pang, J.W. The adsorption kinetics and thermodynamics of tylosin by microplastics. China Environ. Sci. 2018, 38, 1905–1912. [Google Scholar] [CrossRef]
  42. Li, H.; Han, Z.T.; Deng, Q.; Ma, C.X.; Kong, X.K. Assessing the effectiveness of nanoscale zero-valent iron particles produced by green tea for Cr(VI)-contaminated groundwater remediation. J. Groundw. Sci. Eng. 2023, 11, 55–67. [Google Scholar] [CrossRef]
  43. Wei, Q.Q.; Jin, Y.H.; Liu, M.Y.; Chen, J.Y.; Li, D.L.; Qi, Z.C. Effect of inorganic ligands and solution pH on the deposition behavior of tetracycline on quartz sand media. Chem. Res. 2023, 34, 244–252. [Google Scholar] [CrossRef]
  44. Yuan, Q.L.; Li, Z.P.; Li, L.C.; Wang, S.L.; Yao, S.Y. Pharmaceuticals and personal care products transference-transformation in aquifer system. J. Groundwater Sci. Eng. 2020, 8, 358–365. [Google Scholar] [CrossRef]
  45. Atugoda, T.; Wijesekara, H.; Werellagama, D.; Jinadasa, S.; Bolan, N.; Vithanage, M. Adsorptive interaction of antibiotic ciprofloxacin on polyethylene microplastics: Implications for vector transport in water. Environ. Technol. Innov. 2020, 19, 100971. [Google Scholar] [CrossRef]
  46. Zhang, J.H.; Chen, H.B.; He, H.; Cheng, X.Y.; Ma, T.; Hu, J.P.; Zhang, L.M. Adsorption behavior and mechanism of 9-Nitroanthracene on typical microplastics in aqueous solutions. Chemosphere 2020, 245, 125628. [Google Scholar] [CrossRef] [PubMed]
  47. Nguyen, T.B.; Huang, C.P.; Chen, C.W.; Hsieh, S.L.; Tsai, W.P.; Dong, C.D. Adsorption characteristics of tetracycline onto particulate polyethylene in dilute aqueous solutions. Environ. Pollut. 2021, 285, 117398. [Google Scholar] [CrossRef] [PubMed]
  48. Li, J.; Zhang, K.; Zhang, H. Adsorption of antibiotics on microplastics. Environ. Pollut. 2018, 237, 460–467. [Google Scholar] [CrossRef] [PubMed]
  49. Gao, P.; Ju, C.; Tang, Z.; Qin, Y. Enhanced adsorption of tetracycline on polypropylene and polyethylene microplastics after anaerobically microbial-mediated aging process. J. Hazard. Mater. Adv. 2022, 6, 100075. [Google Scholar] [CrossRef]
Figure 1. SEM images of PE. (a) Magnification of 500×; (b) magnification of 1000×; (c) magnification of 2000×. Graphs (d) show the EDS of PE. (The red frame in the figure represents the enlarged area).
Sustainability 17 06908 g001
Figure 2. The zeta potentials of PE particles at different pH.
Sustainability 17 06908 g002
Figure 3. FTIR spectra of TC, PE before and after TC adsorption.
Sustainability 17 06908 g003
Figure 4. XPS spectra before and after TC adsorption by PE. (a) XPS survey scan; (b) the high-resolution XPS spectra of C1s spectra; (c) the high-resolution XPS spectra of O1s spectra; (d) the high-resolution XPS spectra of N1s spectra.
Sustainability 17 06908 g004
Figure 5. Kinetics adsorption model of the TC adsorption by PE. (a) Adsorption capacity as a function of time; (b) pseudo-first-order model; (c) pseudo-second-order model; (d) Weber–Morris intraparticle diffusion model. Experimental conditions: [TC] = 10 mg/L, CPE = 10 g/L, T = 25 °C.
Sustainability 17 06908 g005
Figure 6. Sorption isotherms of TC adsorption onto PE. (a) Langmuir model; (b) Freundlich model; (c) Henry model. Experimental conditions: [TC] = 1–100 mg/L, CPE = 10 g/L, T = 25 °C.
Sustainability 17 06908 g006
Figure 7. Effect of pH conditions on TC adsorption onto PE. (a) TC adsorption capacity of PE with different pH conditions; (b) pseudo-second-order model. Experimental conditions: [TC] = 10 mg/L, CPE = 10 g/L, T = 25 °C.
Sustainability 17 06908 g007
Figure 8. Effect of TC concentrations on TC adsorption onto PE. (a) TC adsorption capacity of PE with different TC concentrations; (b) pseudo-second-order model. Experimental conditions: CPE = 10 g/L, T = 25 °C.
Sustainability 17 06908 g008
Figure 9. Effect of media particle size on TC adsorption onto PE. (a) TC adsorption capacity of PE with different media particle sizes; (b) pseudo-second-order model. Experimental conditions: [TC] = 10 mg/L, CPE = 10 g/L, T = 25 °C.
Sustainability 17 06908 g009
Figure 10. Effect of DOM on TC adsorption onto PE. (a) TC adsorption capacity of PE with different FA concentrations; (b) pseudo-second-order model. Experimental conditions: [TC] = 10 mg/L, CPE = 10 g/L, T = 25 °C.
Sustainability 17 06908 g010
Figure 11. Effect of ionic strength on TC adsorption onto PE. (a) TC adsorption capacity of PE with different ionic strength concentrations; (b) pseudo-second-order model. Experimental conditions: [TC] = 10 mg/L, CPE = 10 g/L, T = 25 °C.
Sustainability 17 06908 g011
Figure 12. The main interaction mechanism between PE and TC.
Sustainability 17 06908 g012
Table 1. Molecular weight of PE.
Weight Average Molecular Weight (Mw)Number Average Molecular Weight (Mn)Peak Molecular Weight (Mp)Z-Average Molecular Weight (Mz)Polydispersity Index (PD)
1.07 × 1053.82 × 1046.97 × 1042.39 × 1052.81
Table 2. Kinetic parameters of TC adsorption onto PE.
ModelsParameterTC
Balance adsorptionQe (mg/g)0.326
Pseudo-first-order modelQe,cal (mg/g)0.272
k1 (h−1)0.078
R20.989
Pseudo-second-order modelQe,cal (mg/g)0.378
k2 (g·mg−1·h−1)0.369
R20.996
Weber–Morris intraparticle diffusion modelK1 (mg/(g·min0.5)0.061
R120.981
K2 (mg/(g·min0.5)0.018
R220.822
Table 3. Isothermal model parameters of TC adsorption onto PE.
LangmuirFreundlichHenry
QmaxkLR2kF1/nR2kHR2
(mg/g) (L/mg) ((mg/g)·(mg/L)−n)(L/g)
0.3390.7460.9990.1360.2530.6810.0020.274
Table 4. Kinetic parameters of TC adsorption onto PE under different environmental conditions.
Influence FactorsParameters
Qe,cal (mg/g)k2 (g·mg−1·h−1)R2
pH5.00.1911.0090.971
6.00.2502.3350.998
7.00.33413160.981
8.00.2951.1950.981
Concentration of TC
(mg/L)
10.05417.0620.998
50.2334.1760.999
100.3011.3010.998
Media Size
(mm)
0.1–0.250.3190.8750.994
0.25–0.50.3161.4040.999
1.0–2.00.3210.8620.997
Concentration of FA
(mg/L)
0.50.3161.2020.974
10.3151.2660.951
50.2172.2630.952
Ionic strength
(mol/L)
0.0050.2301.8380.998
0.010.2661.5030.997
0.050.2963.2420.999
0.10.2222.1840.999
Disclaimer/Publisher’s Note: The statements, opinions and data contained in all publications are solely those of the individual author(s) and contributor(s) and not of MDPI and/or the editor(s). MDPI and/or the editor(s) disclaim responsibility for any injury to people or property resulting from any ideas, methods, instructions or products referred to in the content.

