1. Introduction
With the deep integration of digital technologies with the Sustainable Development Goals proposed by the United Nations, ports, as core nodes of the global supply chain, are undergoing a critical transformation from traditional operational models to intelligent and digital ones [
1]. Their digital transformation has become a key pathway to achieving efficient green operations. With the penetration of technologies such as the Internet of Things (IoT) [
2], big data, and artificial intelligence (AI) [
3], the construction of smart ports has emerged as an important approach to enhancing operational efficiency and optimizing resource allocation. Shanghai WinJoin Information Technology Co., Ltd. (Shanghai, China), is one of China’s largest informatization service providers for ports, and was founded and chaired by Junfeng Wu—an informatization expert at the Ministry of Transport of China and a core member of the Tangshan Port digital platform project. The company has developed the Caofeidian Digital Port and Shipping System, which integrates port logistics data and intelligent vessel scheduling [
4]. This integration not only enhances cargo-handling efficiency, but is also pivotal in the digital transformation of northern Chinese ports, particularly excelling in dimensions of environmental sustainability such as reducing energy consumption and carbon emissions [
5,
6]. This transformation represents a systematic response to the triple Sustainable Development Goals of port economy–environment–society, redefining the port’s role in the green supply chain through technological empowerment [
7]. In the digital process of the Caofeidian Digital Port and Shipping System, the integrated application of big data, cloud computing, the industrial Internet, and other technologies is key to improving throughput. The platform implements data storage and operation support through Alibaba Cloud servers, relies on big data and cloud computing to analyze port and shipping dynamics, and connects with the terminal production management system to achieve real-time communication during the reporting of ships at ports, berthing and departure dynamics, and other information. Combined with electronic signatures, direct bank–enterprise connections, and other tools, offline processes such as ship procedures as well as processing and fee settlement are fully upgraded, saving companies more than 4 h of travel time per ship and more than five personnel for each access terminal. This considerably improves the efficiency of collaborative ship operation and process operation, thereby promoting throughput improvement.
However, despite the increasing number of applications of such technologies, existing research primarily focuses on descriptive case studies of technical implementations [
8] and lacks systematic quantitative evaluations of transformation effects. The actual impact of digital transformation on port cargo and container throughput remains a significant research gap. Previous studies have explored the impact of applying digital systems to improve operational efficiency in fields such as finance and manufacturing. However, there is a lack of in-depth research on large-scale application scenarios, such as ports, and the corresponding explanatory mechanisms [
9]. Methodologically, most studies rely on descriptive statistics or cross-sectional data, but do not evaluate the net effects of policy interventions. The difference-in-differences (DID) method, an effective tool for assessing policy shocks [
10], is rarely applied in the field of port digitization. Practically, the differentiated mechanisms of the impact of digital transformation on the transportation efficiency of different cargo types remain poorly understood. Container and bulk cargo transportation differ fundamentally in terms of operational standardization, equipment dependency, and process complexity, leading to significant disparities in technical pathways [
11].
For many consecutive years, China’s port cargo throughput has ranked first globally, yet there is still a gap in its intelligent processing efficiency compared to more advanced international ports. With the advancement of initiatives such as the coordinated development of the Beijing–Tianjin–Hebei region [
12] and the Belt and Road Initiative, regional port competition has intensified [
13], making digital transformation a key driver of port competitiveness. Tangshan Port’s Caofeidian Digital Port and Shipping System, launched in September 2021, integrates technologies such as the IoT and intelligent scheduling, establishing itself as a benchmark case for digital transformation in northern Chinese ports. Its clear policy implementation timeline and systematic technological applications provide an ideal scenario for constructing DID models, enabling precise evaluation of the net effect of digital transformation policies on port throughput. Additionally, the port’s dual operations in bulk cargo (e.g., coal, ore) and container transportation allow for simultaneous analysis of the differentiated impacts of digital transformation on throughput across different cargo types, thereby avoiding the limitations of research based on ports with a single cargo type.
This study takes the launch of Tangshan Port’s Caofeidian Digital Port and Shipping System as a typical scenario and uses the DID method to construct policy evaluation models. With Tangshan Port as the treatment group and Qinhuangdao Port as the control group, we systematically assess the differentiated impacts of digital transformation on cargo and container throughput. This research is based on monthly panel data from the two ports spanning September 2018 to September 2024. For the first time, we introduce the DID model into the evaluation of the effects of port digital transformation and reveal, through quantitative analysis, its differential impacts on different throughput types and temporal heterogeneities. As such, Tangshan Port serves as an ideal sample for verifying the impacts of digital transformation on port performance indicators, offering a replicable research paradigm for policy evaluation in port digitization within the academic literature.
Our findings indicate that digital transformation has a significant positive impact on port cargo transportation capacity, which is reflected in the improvement in both cargo and container throughput. Moreover, in
Section 5.2, we use Qingdao Port and Rizhao Port, which are comparable to Tangshan Port, as robustness indicators to verify the robustness of the results of cargo and container throughput. Further analysis shows that the long-term effect of digital transformation on port transportation is significantly stronger than the short-term effect, demonstrating the gradual increase in the beneficial effects of technological applications over time.
The theoretical contributions of this article are as follows: We introduce the DID method into the evaluation of the effects of the digital transformation of ports, break through the limitations of traditional descriptive analysis and static efficiency models [
8], and provide new ideas for the evaluation of port policy transportation efficiency. Based on the practices of Caofeidian, the cumulative effects of online processing, data integration, long-term functional iteration, and business volume growth reveal that digitalization has a stronger effect on port throughput in the long term than in the short term, supporting the theory of the dynamic effects of technological applications. The platform’s support for bulk cargo and domestic trade vessel transportation confirms the promoting effect of digitalization on different types of cargo transportation, challenging the traditional concept of “low demand for digitalization in bulk cargo ports”. In Caofeidian and the Beijing–Tianjin–Hebei region, resource integration and efficiency improvements have been achieved, providing practical evidence for the positive regulatory effect of regional economic level on digitalization, thus promoting port throughput, and supporting the theory of the heterogeneity of port digitalization effects in a regional economic context. Taking Tangshan Port as a case study, this paper demonstrates the digital transformation path and effectiveness of bulk cargo ports, supplements empirical cases of the digital transformation of large bulk cargo ports, and provides concrete references for theoretical research on similar ports.
The remainder of this paper is structured as follows.
Section 2 reviews the relevant literature.
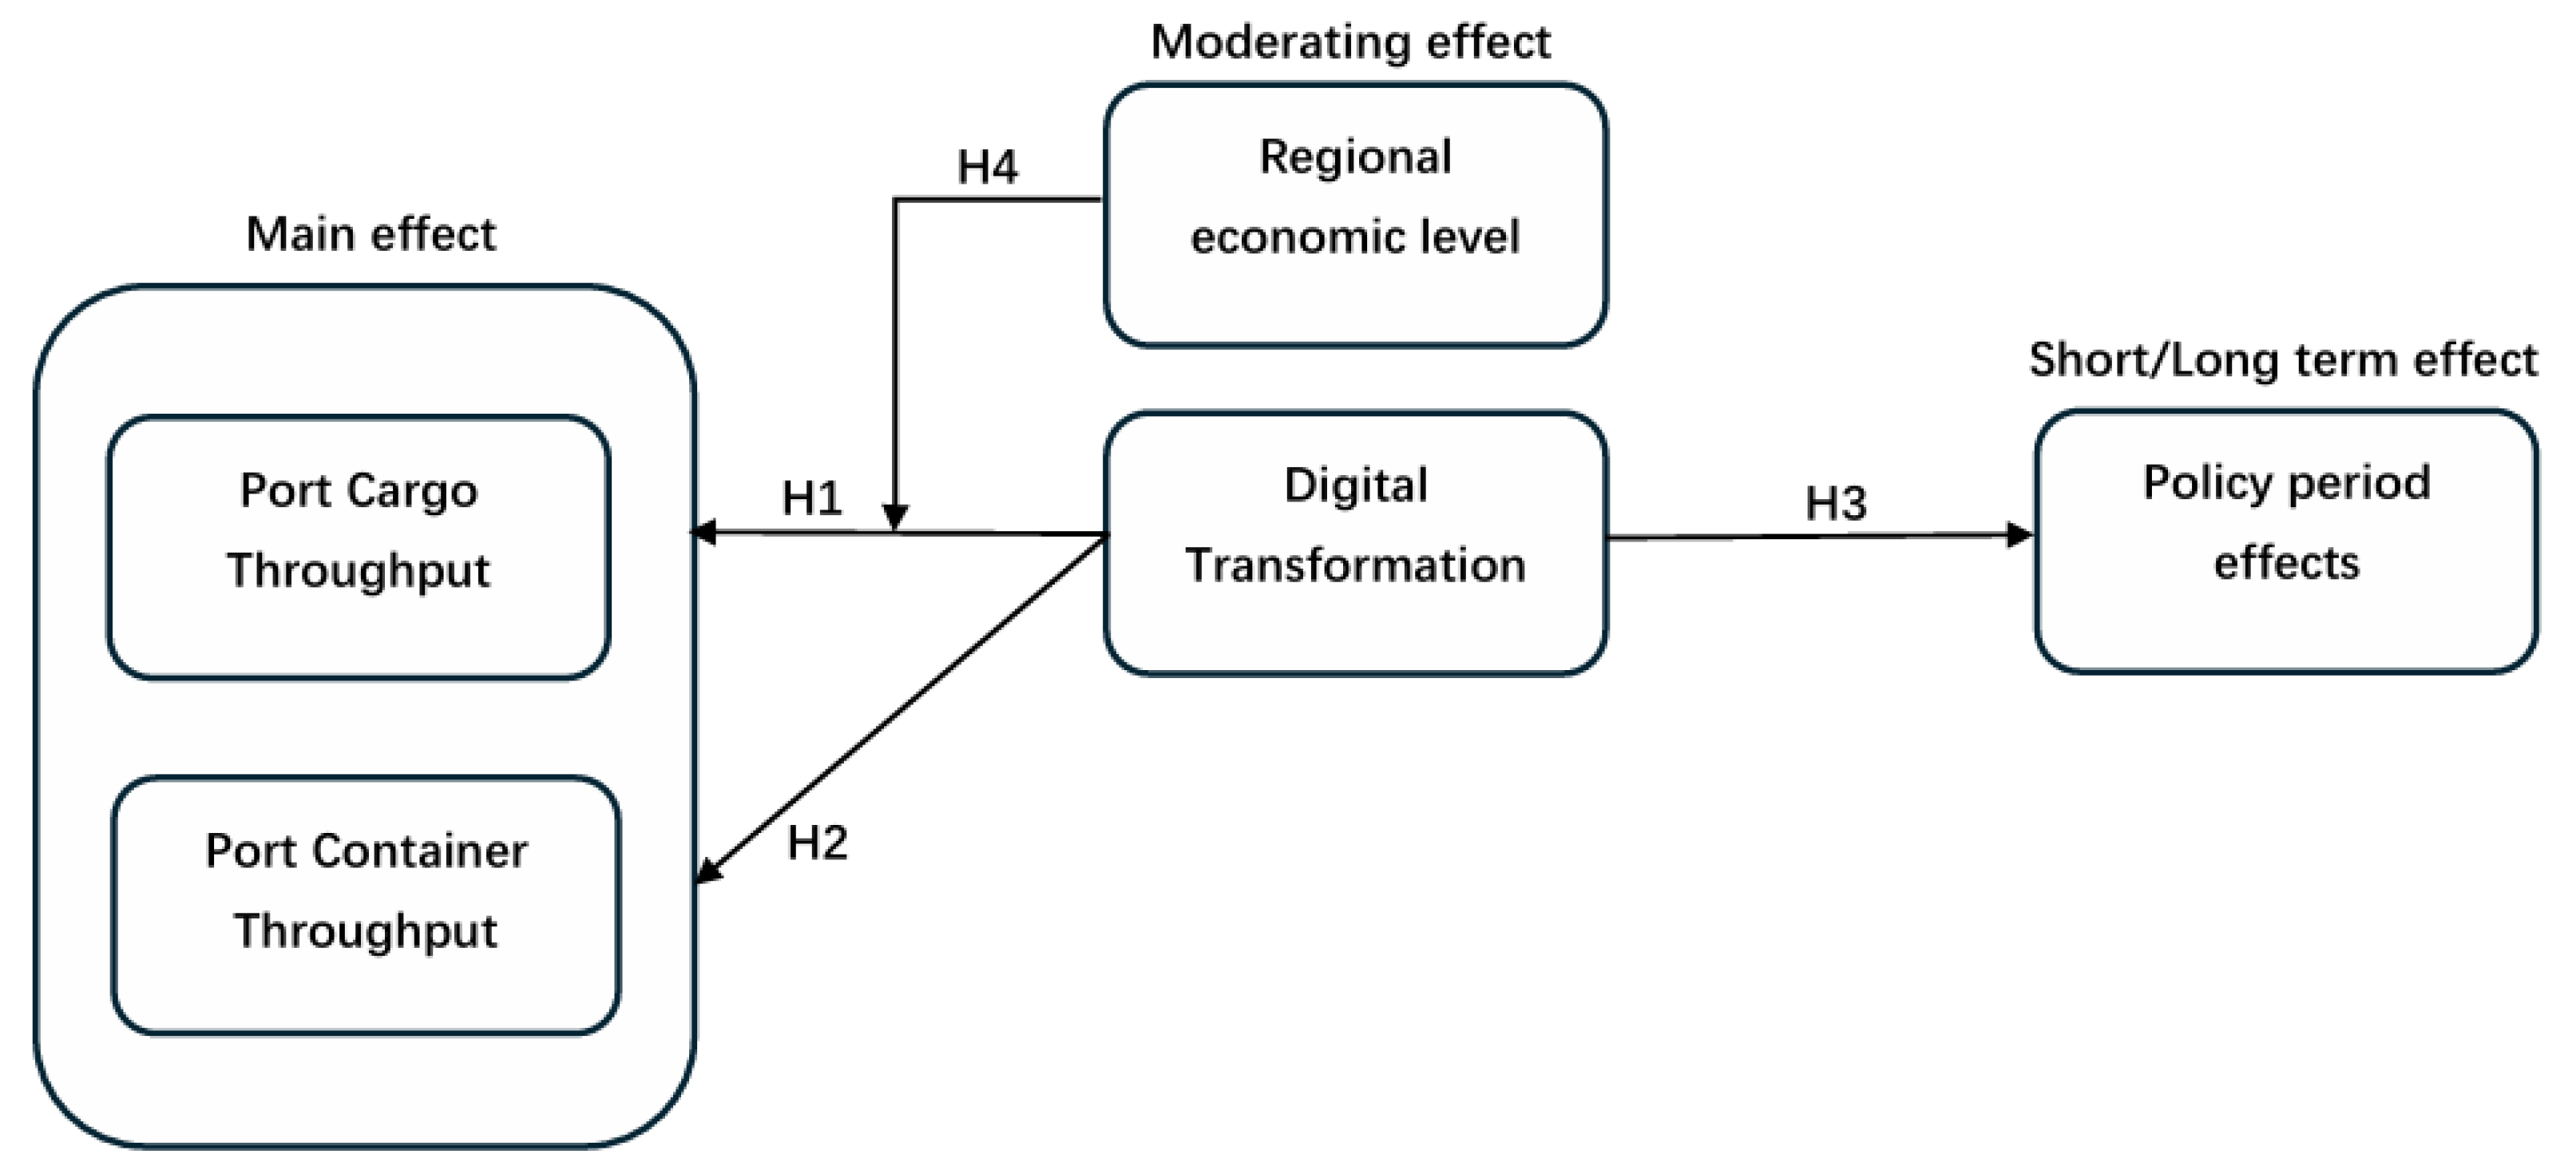
Section 3 formulates hypotheses on how policy implementation and its short/long-term effects influence cargo and container throughput and on the moderating effects of regional economic levels.
Section 4 discusses our study design.
Section 5 presents our empirical results, and
Section 6 discusses our findings and their managerial implications.
3. Theory and Development of Hypothesis
Previous research has explored the impact of port digital transformation on cargo throughput. Building on this, our study investigates the effects of digital transformation on both cargo and container throughput before and after its implementation, distinguishing between short- and long-term impacts.
Figure 1 presents the study’s conceptual framework.
The positive impact of digital transformation on cargo throughput is achieved through efficiency innovation in the dimension of sustainable development. This efficiency improvement is not only reflected in the increased operation speed, but also in the optimization of environmental costs such as energy consumption and carbon emissions, forming a closed loop of “efficiency improvement–sustainability enhancement–throughput growth”.
The deep integration of digital technologies into port operations can significantly enhance their operational efficiency. By establishing a data governance framework, ports can transform the large-scale data generated by interconnected devices into usable information, providing support for real-time monitoring and process optimization [
42]. For instance, when leveraging the low-latency characteristics of 5G networks, loading and unloading equipment can be performed with real-time coordination, reducing single-vessel operation time [
43]. Remote monitoring technologies improve the response efficiency of quay crane operations, directly accelerating cargo handling speed [
44]. The virtual simulation of yard operations using digital twin technology can reduce the carbon emissions of heavy machinery while shortening its handling distance. These technological applications considerably reduce operation times, laying an operational foundation for enhancing the handling capacity of ports [
45]. The synergy between “cost reduction and efficiency improvement” and “green emission reduction” enables ports to meet environmental regulations while reducing their long-term operating costs, providing sustainable operational opportunities for throughput improvement.
Considering the core goal of sustainable development, digital transformation reduces the wasting of scarce resources, such as land and energy, through precise resource allocation, enabling ports to carry more cargo under the same hardware conditions. Digital platforms break down traditional information silos and promote optimized resource allocation. When multi-source data from customs, logistics, and other sectors are integrated on a unified platform, the utilization efficiency of resources, such as berths and warehouses, is enhanced, avoiding idle waste caused by information fragmentation [
27]. At the supply chain level, data sharing mechanisms can connect multiple stakeholders, including ports, cargo owners, and shipping enterprises, thereby reducing cargo detention time and enabling cross-process collaborative operations. This upgrades ports from single-node functions to supply chain hubs, which naturally enables them to handle greater cargo processing demands [
46].
Efficiency improvements and resource optimization jointly strengthen ports’ service competitiveness. On the one hand, intelligent tools facilitate green and low-carbon transformations, attracting more environmentally friendly vessels to call at ports that employ them [
43]. On the other hand, service improvements, such as shortened customs clearance time and increased operational transparency, directly enhance customer satisfaction, forming a positive cycle from efficiency advantages to business inflow. When ports build positive service reputations among regional competition through digitalization and intelligence, cargo owners and shipping companies are more inclined to choose them as hubs, thereby driving growth in their cargo throughput due to increased demand [
27].
In addition, considering the effects of factors such as port size, management mechanisms, trade routes, shipping alliances, and geopolitical risks on port throughput, under the same conditions, the level of port digitization has become a major factor in improving port operational efficiency.
Therefore, we propose the following hypothesis.
Hypothesis 1 (H1). Digital transformation has a positive impact on port cargo throughput.
Digital and intelligent transformation systematically enhances the operational efficiency of port container terminals through multidimensional technological empowerment, thereby exerting a significant positive impact on throughput. In terms of real-time monitoring and decision support, intelligent systems built on high-fidelity simulation technology enable the dynamic tracking of container locations and equipment status. This capability allows for timely identification and the resolution of operational delays, streamlining terminal workflows to achieve higher efficiency [
47]. Intelligent gates, a critical component, optimize vehicle entry and exit processes, significantly reducing waiting times for containers at the gate. This direct improvement in processing capacity per unit time provides immediate momentum for throughput growth [
48].
Dynamic-storage-management technology flexibly adjusts container stacking strategies based on real-time demands, effectively reducing rehandling rates and handling distances. This optimization of yard space use not only minimizes resource waste, but also ensures the rapid loading and unloading of containers, laying a solid foundation for enhancing overall terminal operational efficiency [
49]. Digital and intelligent transformation promotes deep integration across port segments—for example, efficient coordination between intelligent gate systems and yard management systems—leading to more optimized operational procedures and stronger equipment collaboration. This enhancement in overall holistic effectiveness significantly boosts a port’s competitiveness within the maritime transport network, attracting more liner companies to call at the port and fundamentally increasing container business volume [
50]. These technological empowerments interact and synergize to construct a highly efficient port operating system, ultimately exerting a positive impact on container throughput. It is worth mentioning that China’s existing ports have shown slightly excessive demand due to regional competition; for example, Tangshan Port and Qinhuangdao Port, which are geographically close and have overlapping hinterlands, jointly meet the trade needs of the Beijing–Tianjin–Hebei urban agglomeration, so competition between there ports continue to intensify. In the context of the convergence of port fees, geographical location, hinterland connectivity, and shipping alliances, digital transformation has become key to enhancing port competitiveness by optimizing operational processes and improving intelligent scheduling efficiency. Thus, we propose the following hypothesis.
Hypothesis 2 (H2). Digital transformation has a positive impact on port container throughput.
In the following analysis of Hypotheses 3 and 4, we will focus on the analysis of cargo throughput (without considering container throughput).
The stronger long-term than short-term effects of digital transformation on port cargo throughput stem from its nature as a systemic transformation that integrates technology and policy. Policies such as smart port planning require long-term implementation to reshape resource allocation models, with the initial teething costs of technology–management integration dampening their short-term impacts [
51]. Technologies like IoT and big data necessitate long-term deployment to build deep port–supply chain collaboration networks, with their synergies gradually manifesting as infrastructure interconnection and data sharing mechanisms mature [
52]. The application of green technologies and optimization of management models also require long-term practices to balance environmental protection and efficiency, thereby enhancing port attractiveness [
53]. In the short term, their positive effects are hindered by the costs of adapting to the transformation and system debugging. However, in the long term, the cumulative effects of policy efficacy, technological synergy, and model optimization sustainably improve cargo handling capacity and transport volume, leading to significant long-term advantages [
54].
Hypothesis 3 (H3). The long-term effect of digital transformation on port cargo throughput is stronger than the short-term effect.
In economically developed regions (such as the core areas of Beijing–Tianjin–Hebei region and the Yangtze River Delta), high GDP fosters trade volume agglomeration [
55], creating considerable demand for import and export cargo. Digital and intelligent transformation encourages more cargo owners to choose these ports by enhancing customs clearance efficiency and service transparency. For example, relying on the trillion-level GDP hinterland of the Yangtze River Delta, Shanghai Port consolidates its cargo agglomeration advantage through a digital platform that integrates customs and freight forwarder data, forming a virtuous cycle in which demand growth drives cargo concentration [
56].
Local fiscal capacity and corporate profitability in high-GDP regions, such as technical investments supported by hinterland manufacturing and trade enterprises, provide sustained resources for the digital and intelligent transformation of ports [
57]. Take digital twin technology as an example: economically advanced ports can invest over CNY 100 million annually to iterate systems, whereas in less-developed regions, technological upgrade cycles are 2–3 times longer due to funding constraints. This guarantee of technical investment enhances the long-term throughput elasticity of digital transformation by over 40% compared with low-GDP regions, strengthening its promotive effect. Thus, we propose the following hypothesis.
Hypothesis 4 (H4). Regional economic level positively moderates the impact of digital transformation on cargo throughput.
4. Study Design
4.1. Port Selection Criteria
We chose Qinhuangdao Port as the control group for Tangshan Port, mainly based on the following multidimensional homogeneity considerations, in order to minimize external interference factors and meet the core assumptions of the DID models.
During the research period (September 2018 to September 2024), Qinhuangdao Port did not initiate any systematic digital transformation projects, and its port management operations remained traditional. Moreover, it did not introduce digital technologies such as the Internet of Things, big data, and intelligent scheduling to modify its operation process. At the technological application level, the clear distinction between “policy intervention and nonintervention” meant that Tangshan Port met the core requirement of the DID model, which states that the control group should not receive policy intervention.
From the perspectives of administrative affiliation and policy environment, both ports are under the jurisdiction of Hebei Province; belong to the Hebei Port Group Co., Ltd. (Hebei, China); and are under a consistent provincial-level policy framework. Moreover, Hebei Province has implemented a unified supply policy on port planning, industrial support, environmental standards, and other aspects. This homogeneity of administrative attribution can effectively eliminate throughput changes caused by inter-provincial policy differences, ensuring that digital transformation policies represent the core explanatory variable for intergroup differences.
At the level of humanistic and social context, both ports are located along the northeast coast of Hebei Province, belonging to the Bohai Rim Economic Circle and sharing similar labor markets, cultural traditions, and social capital networks. The convergence of this humanistic and social environment can significantly reduce the interference with port operation efficiency caused by differences in labor quality, local cultural conflicts, or different social network structures, making the application of digital technology a key variable for intergroup efficiency differences.
From the perspective of geographical location and economic hinterland, the straight-line distance between the two ports is less than 200 km, and they jointly rely on the core economic hinterland of the Beijing–Tianjin–Hebei urban agglomeration, serving the same regional industrial area and meeting its trade needs. Their geographical proximity and overlapping economic hinterland mean that the two ports face the same macroeconomic fluctuations within the same international trade environment (and logistics network configuration), effectively controlling the systematic impact of regional economic differences on throughput.
In terms of port type and basic conditions, both ports are dominated by traditional bulk cargo. Tangshan Port focuses on coal and ore transportation, while Qinhuangdao Port features coal and oil transportation. During the research period, neither port implemented large-scale port expansion nor strategic transformation, ensuring consistency in the baseline conditions before transformation.
Table 1 presents the key factors that affected the operational performance of Tangshan Port and Qinhuangdao Port from 2018 to 2021 (the average value before the experiment), including both quantitative and qualitative indicators. Both ports belong to Hebei Province and are bulk cargo ports and national energy hubs. Their growth rates in terms of container throughput and GDP are similar, indicating comparability between the two ports.
4.2. Data
The data for this study were obtained from Tangshan Port and Qinhuangdao Port, two major ports under the Hebei Port Group Co., Ltd. (Hebei, China); We collected monthly data from both ports from September 2018 to September 2024, including information on cargo throughput, container throughput, number of berths, and regional GDP. Using the launch of Tangshan Port’s Caofeidian Digital Port and Shipping System in September 2021 as the cutoff point, we defined September 2018–August 2021 as the control period and September 2021–September 2024 as the treatment period. Tangshan Port was designated the treatment group, and Qinhuangdao Port was designated the control group. The treatment variable was constructed accordingly.
We employed the regression sample (the sample obtained after data processing) to conduct a descriptive statistics analysis on the focal variables, including the dependent variables (DVs) (CargoThroughput, ContainerThroughput, LnCargoThroughput, and LnContainerThroughput), primary explanatory variables (TreatPost), and control variables (LnGDP and BerthNum).
Table 2 presents the descriptive statistics for the focal variables. The average cargo throughput was 39.485 million tons, the average container throughput was 148.375 thousand TEUs, 25.3% of the data originated from the treatment period, and the mean number of berths was 105.431.
4.3. Model
Firstly, we use Equation (1) to test the impact of digital transformation on port cargo throughput.
where
denotes the cargo throughput of port i at time t.
is the treatment variable, with its coefficient
serving as the core parameter for indicating the impact of digital transformation on port cargo transportation volume.
represents control variables, including the natural logarithm of GDP (
) and the number of berths (
).
represents the port fixed effects (Port FEs), which control for port-specific characteristic differences.
represents monthly fixed effects (Month FEs), which control for monthly time trend influences, and
is the random error term.
Secondly, we use Equation (2) to test the impact of digital transformation on port container throughput.
where
denotes the container throughput of port i at time t.
Thirdly, we use Equation (3) to test the heterogeneous impacts of digital transformation on port cargo throughput over different time periods.
where
is a short-term group variable, which takes a value of 1 when the port is in the experimental group (Tangshan Port) during the short-term treatment period (September 2021 to August 2022), and 0 otherwise.
is a long-term group variable, which takes a value of 1 when the port is in the experimental group during the long-term treatment period (September 2022 to September 2024), and 0 otherwise, and
is a dummy variable, which takes a value of 0 during the short-term treatment period (September 2021 to August 2022) and 1 during the long-term treatment period (September 2022 to September 2024).
Finally, we use Equation (4) to test the impact of the digital transformation of regional economic level regulation on port cargo throughput.
where
denotes the interaction effect between digital transformation and the regional economic level of port i at time t. The other parameters of Equation (4) are the same as in Equation (1).
5. Empirical Results
5.1. Benchmark Results
Table 3 reports the results of the parallel-trend test using different fictitious intervention dates. When the placebo policy dates were set to September 2020 (first and third columns) and September 2019 (second and fourth columns), the differences in cargo and container throughput between the treatment and control groups remained statistically insignificant. Specifically, for September 2020, the coefficients of the placebo treatment variable (
) were −0.406 for cargo throughput and −0.293 for container throughput (both
p > 0.05); for September 2019, the corresponding coefficients were −1.948 and −21.130 (both
p > 0.05). These results suggest that prior to the actual policy implementation in September 2021, no significant differences existed in throughput trends between Tangshan Port and Qinhuangdao Port, thereby supporting the validity of the subsequent DID models.
Table 4 presents results showing the effect of digital transformation on port cargo throughput. Specifically, in the first column excluding control variables, the coefficient of
is 11.653 (
p < 0.01), indicating that without considering factors such as GDP and the number of berths, the digital transformation policy directly promotes an average increase in cargo throughput of 11.653 million tons. In the second column, representing the benchmark model (controlling for
and
), the coefficient of
is 6.869 (
p < 0.05), verifying that digital transformation significantly augments the port’s cargo volume through mechanisms such as optimizing resource allocation. In the third column, representing the log-transformed model of cargo throughput, the coefficient of
is 0.145 (
p < 0.01), reflecting that digital transformation generates 14.5% elastic growth in cargo throughput, embodying the efficiency enhancement mechanism; this is consistent with our research expectations and supports Hypothesis 1.
Table 5 presents results showing the effect of digital transformation on port container throughput. Specifically, in the first column excluding control variables, the coefficient of
is −10.673 (statistically insignificant), indicating that without accounting for factors like GDP and the number of berths, the estimation of digital transformation’s impact on container throughput may suffer from omitted-variable bias. In the second column, representing the benchmark model (controlling for
and
), the coefficient of
is 102.850 (
p < 0.01), verifying that digital transformation significantly boosts Tangshan Port’s container throughput by an average of 102.85 TEUs through mechanisms such as operational process optimization and intelligent dispatching. In the third column, representing the log-transformed model of container throughput, the coefficient is 0.402 (
p < 0.01), indicating that digital transformation induces approximately 40.2% elastic growth in container throughput. Although the first column indicates an unusual result, likely due to model specification bias, the robust significance in the second and third columns sufficiently validates the positive policy impact on container throughput. These findings underscore the strategic value of digitalization in enhancing container operations, which is aligned with our theoretical expectations and empirical evidence from the DID framework. These findings are consistent with our research expectations and support Hypothesis 2.
With the validation of both Hypotheses 1 and 2, their regression results serve as reciprocal evidence for robustness checks. Specifically, Hypothesis 1 uses cargo throughput as the dependent variable, while Hypothesis 2 uses container throughput. The core explanatory variable in both is , with coefficients that are both positive and statistically significant at conventional levels. The stability of the core interaction term indicates that digital transformation significantly promotes different types of port throughput (bulk cargo and container), thereby avoiding potential conclusion bias from relying on a single dependent variable.
5.2. Robustness Checks
Until this point, Qinhuangdao Port’s cargo and container throughput data have served as the control group. To rule out randomness from using only Qinhuangdao Port, we now employ data on Qingdao Port’s cargo throughput and Rizhao Port’s container throughput, conducting robustness checks with Equations (1) and (2).
We chose Qingdao Port and Rizhao Port as the control groups for robustness checks mainly based on the following multidimensional homogeneity considerations to ensure the validity of the core assumptions of the DID model.
Qingdao Port, Rizhao Port, and Tangshan Port are all located in the Bohai Economic Circle, with a straight-line distance of less than 300 km. Their hinterland covers the Shandong Peninsula urban agglomeration, and their GDP is on the same level as that of the Beijing–Tianjin–Hebei urban agglomeration, which can effectively control the systematic impact of regional economic fluctuations on throughput.
The digital transformation of Qingdao Port preceded that of Tangshan Port and was led by the Shandong Provincial Government, and there was no overlap with the digital port policies of Hebei Province. The implementation of this policy with temporal and spatial isolation can eliminate the interference of policy spillover effects. However, Rizhao Port has not yet initiated the construction of a comprehensive digital system, and its technical status is closer to the benchmark level of Qinhuangdao Port. This is in line with the core assumption of the DID control group that it has not been subjected to policy intervention.
Qingdao Port and Tangshan Port have a high degree of homogeneity in terms of cargo structure, and the proportion of bulk cargo throughput in Qingdao Port is close to that in Tangshan Port. Thus, it is highly matched with the dominant feature of bulk cargo in Tangshan Port. In addition, they also have the same level of cargo throughput.
Both Rizhao Port and Tangshan Port mainly handle bulk cargo and are supplemented by containers. Their container throughput is similar, and the complexity of their container operation processes (such as yard management and ship loading) is comparable to that of Tangshan Port.
Table 6 presents the parallel-trend test results of cargo throughput at different virtual intervention times, showing that when setting up virtual intervention in September 2020, the
coefficient was 0.537 (
p > 0.05), which was not significant. When the virtual intervention was established in September 2019, the coefficient was −1.180 (
p > 0.05), which was not significant. There was no significant difference in the throughput trend between the processing and control groups, which proves that the cargo throughputs of Tangshan Port and Qingdao Port undergo the same changes before the policy implementation, meeting the core assumption of the DID model.
Table 7 shows the parallel-trend test results for container throughput at different placebo intervention times. When the virtual intervention was set in September 2020, the coefficient of
was not significant. Similarly, setting the intervention in September 2019 yielded a coefficient of −22.970 (
p > 0.05), which was also not significant. These results indicate no significant difference in throughput trends between the treatment and control groups before policy implementation, confirming the key DID assumption that container throughput at Tangshan and Rizhao Ports followed parallel trends.
Table 8 presents the results of the robustness test of the impact of digital transformation on cargo throughput. When the control group was replaced by Qingdao Port, the
coefficient was 3.708 (
p < 0.01) in the first column, 3.850 (
p < 0.1) in the second column, and 0.063 (
p < 0.1) in the third column. The results show that digital transformation has a significant positive impact on the cargo throughput and growth rate. These results are consistent with those of the main models, further supporting the findings presented in
Section 5.
Table 9 presents the results of the robustness test on the impact of digital transformation on container throughput. When the control group was replaced with Rizhao Port, the
coefficient was −25.669 (
p > 0.1) in the first column, 110.637 (
p < 0.01) in the second column, and 0.380 (
p < 0.05) in the third column. These results are consistent with those of the main models, further supporting the findings presented in
Section 5.
5.3. Heterogeneity Analysis
Table 10 presents the heterogeneous effects of digital transformation on port throughput, explicitly distinguishing between its short-term and long-term impacts. The estimated coefficient of the short-term treatment variable is 5.388, which is statistically significant at the 1% level (
p < 0.01), suggesting that digital transformation leads to an immediate increase of 5.388 million tons in throughput. In comparison, the coefficient associated with the long-term treatment variable is substantially higher, at 15.420 (
p < 0.01), indicating that in the long term, digital transformation results in an average throughput gain of 15.42 million tons. Notably, this long-term effect is approximately 2.86 times greater than the short-term impact, highlighting the cumulative nature of digitalization benefits. From the perspective of elasticity estimates reported in the second column, the short-term elasticity is 0.108 (
p < 0.01), implying that a 1% increase in digital transformation yields a 0.108% increase in throughput in the short term. In contrast, the long-term elasticity reaches 0.362 (
p < 0.01), representing greater responsiveness and indicating that the long-term gains are approximately 3.35 times those observed in the short term. These findings collectively provide strong evidence that the positive effects of digital transformation are not only statistically significant but also progressively magnified over time. This result is consistent with theoretical expectations regarding the time-lagged returns of technological innovation, particularly in the context of port digitalization, where sustained investment, system integration, and continuous optimization are necessary for such a transformation to yield its full potential. Therefore, the empirical evidence presented here offers robust support for Hypothesis 3.
5.4. Moderating Factors
Table 11 shows the moderating effect of regional economic level on cargo throughput. The core interaction term,
, exhibits significantly positive coefficients in both the first (level specification) and second (logarithmic specification) columns, with estimates of 68.353 (
p < 0.01) and 1.574 (
p < 0.01), respectively. This demonstrates that the promotional effect of digital transformation on port cargo throughput intensifies with higher regional GDP levels, thereby supporting Hypothesis 4.
6. Implications and Conclusions
Taking the launch of the Caofeidian Digital Port and Shipping System in Tangshan Port as a starting point, we empirically analyzed the effects of digital and intelligent transformation on port cargo and container throughput using the DID method. We found that digital and intelligent transformation has a significant positive impact on the scale of port cargo transportation. It not only increases cargo throughput, but also has a more prominent promoting effect on container throughput, and its long-term effect is significantly stronger than its short-term effect. We verified the reliability of these results through parallel-trend tests and robustness tests, indicating that digital and intelligent transformation continuously improves port operational efficiency.
We innovatively introduced the DID models into the evaluation of port digital and intelligent transformation, providing a new approach for policy assessment in the port sector. Aiming to overcome the limitations of traditional methods in evaluating port digitization policies, existing research mainly relies on descriptive case studies [
5] or static efficiency evaluation models (such as DEA/SFA) [
22,
23,
24], which struggle to capture the causal effects of policy interventions. This research is the first to apply DID models to the evaluation of port digital transformation, enabling dynamic identification of the net effect of digital technologies. Moreover, the long-term impact of digital and intelligent transformation on port transportation is stronger than its short-term effect. Most existing studies focus on short-term efficiency improvements [
16,
39], ignoring the cumulative characteristics of technological penetration. This finding enriches our theoretical understanding of the dynamic impacts of technological applications, aligning with the logic of the gradual manifestation of beneficial effects in innovation diffusion theory. Finally, addressing the defect of “single-indicator dependence” in existing studies—where most studies only focus on single-dimensional analyses of container throughput [
16,
29] or bulk cargo-handling efficiency [
8]—this study conducts bivariate robustness tests using both cargo and container throughput. The results confirm that digital transformation has a “differentiated yet consistent” promoting effect on the transportation of different cargo types. This finding challenges the traditional perception that “bulk cargo ports have weaker digitalization needs than container ports” [
18], highlighting the systematic enabling effect of digital technologies on port operation systems and avoiding conclusion biases caused by single indicators.
It should be noted that, due to the confidentiality of corporate data, we are unable to obtain relevant indicator data on the sustainable development of Tangshan Port. However, through on-site interviews and surveys with enterprise personnel, we have learned that the increase in cargo and container throughput after Tangshan Port’s digital transformation primarily stems from improvements in operational efficiency. These improvements include, but are not limited to, real-time monitoring and collaborative scheduling of equipment through IoT technology [
14], optimizing resource allocation driven by big data [
17], precise planning of ship berthing and loading/unloading processes through digital systems [
18], and achieving real-time energy consumption regulation through the application of carbon emission monitoring technology [
19]. These measures enhance process collaboration efficiency, reduce redundant operational steps, minimize equipment idling and downtime, optimize energy usage structure, and decrease ineffective resource consumption. These factors contribute to improving port energy efficiency and thus enhancing sustainability.
The results of this study also provide management insights for enterprises and managers. The digital and intelligent transformation of ports requires long-term planning; therefore, enterprises should continuously build intelligent management systems, promote the integration of technology and business, and improve resource allocation and operational efficiency through intelligence. In addition, different transformation strategies should be developed according to the port functions. For example, in container transportation, berth scheduling and facility coordination should be optimized, and to enhance the regional economy, the service capacity for port-related industries should be improved.
Despite its contributions, our research has some limitations. The sample only includes traditional bulk cargo ports (Tangshan Port and Qinhuangdao Port) with a single port type and regional economic background. Thus, the research results may not be applicable to ports with different regulatory, economic, or technological backgrounds, which limits the generalizability of our conclusions. Specifically, their applicability in container hub ports or international port scenarios still needs further verification. The mechanism of digital technology in improving throughput has not been studied in depth, especially in terms of ecological development dimensions such as management efficiency optimization and the improvement of energy utilization efficiency, which to some extent affects the explanatory power of our analysis. This research did not fully address the potential cost inputs or implementation barriers of digital transformation, or the differences in its acceptance among relevant stakeholders, resulting in a less comprehensive representation of transformation practices. In addition, external factors, such as the institutional environment, industry regulations, market competition patterns, and the demands and feedback of various stakeholders, were not included in the analysis framework, making it difficult to fully evaluate the actual conditions when implementing such a transformation. Meanwhile, due to the relatively limited observation period after intervention and the possibility of diminishing marginal benefits in long-term operation, the conclusion that long-term effects are more significant still needs to be tested in practice over a longer period of time. Finally, due to limitations in data availability, we are unable to further examine the impact of digital transformation on sustainability indicators such as carbon emissions and energy efficiency. Future research should expand upon this study in the following ways. Firstly, the sample coverage should be expanded to include different types of ports, such as container ports and international hub ports, and their differentiated characteristics should be systematically compared. Secondly, it is necessary to strengthen the research on the mechanism of digital transformation, with a focus on analyzing its specific path in ecological dimensions, such as improving management efficiency and energy conservation. In addition, it is necessary to further the exploration of practical issues such as transformation cost accounting, implementation difficulties, and stakeholder attitudes. Moreover, analysis frameworks need to include external factors such as institutional environments and regulatory systems, as well as diverse perspectives. Furthermore, the observation period should be extended to track the evolution of long-term effects and the potential attenuation patterns of benefits, providing more practical theoretical support for the digital transformation of global ports. Finally, real-time energy consumption data and carbon emission inventories should be utilized to quantitatively measure the impact of different digital technologies on carbon emissions and energy efficiency, in order to elucidate the environmental sustainability mechanism of port digital transformation.


