1. Introduction
In the context of global climate change mitigation and energy transition, distributed photovoltaic (PV) generation, as a key component of renewable energy, is undergoing a phase of rapid development. By December 2023, China’s installed capacity of solar power had reached 610 GW, accounting for 20.89% of the total power generation capacity, with a year-on-year growth rate of 55.2%, ranking first among newly added renewable power sources [
1]. However, with the increasing penetration of PVs, new operational characteristics have emerged in the electricity market. During PV output peaks—typically around midday—electricity prices have shown a consistent decline and even dropped into negative territory. This phenomenon is particularly evident in regions with fast-growing PV deployment such as California, Germany, and China. The primary reason lies in the intermittent and synchronous nature of PV generation, which causes electricity supply to far exceed demand during specific periods [
2]. Due to insufficient flexibility resources in existing power systems, surplus renewable electricity cannot be fully absorbed. Studies show that in the German electricity market, the proportion of time during which midday electricity prices fall below baseload prices has increased, severely impacting the economic viability of PV power plants [
3]. These developments clearly underscore the urgent need to optimize photovoltaic (PV) deployment—not only to achieve maximum energy yield, but also to align with economic and market dynamics while ensuring system-level sustainability and resilience.
Conventional PV placement tries to maximize the overall electricity generation. However, the orientation or angle for solar installation can impact the time distribution of solar PV production from the roof. Tilting panels more towards west can delay the peak power production to afternoon when electricity market prices are higher; placement of solar PV on vertical faces could lead to similar effects. However, the conventional methods do not consider the price differential in the electricity market, leading to a lesser return. The planning method incorporating dynamic electricity market pricing has been lacking.
To address these gaps, we developed a high-resolution distributed PV planning model considering street level distributed solar PV placement on both rooftops and facades of buildings. The availability of the roof area was calculated based on submeter-level building information. The placement and optimal angle for rooftops were calculated by the proposed methods, incorporating hourly electricity market price signals. Optimal PV installation methods for building faces were developed based on solar angle, face characteristics and real time electricity market pricing.
Compared to previous studies, our approach introduces the following key innovations: (1) the use of refined spatial input data (standard building prototypes), taking into account the impact of window-to-wall ratio on the availability of building façades; (2) a revenue-maximization strategy based on market pricing; (3) a comprehensive evaluation of the techno-economic potential and optimal placement strategies for both rooftop and façade-integrated PV. This study aims to bridge the gap between PV engineering optimization and sustainable urban energy planning, offering actionable insights for policymakers and urban designers.
2. Literature Review
In the optimization of urban PV systems, accurate solar radiation estimation has evolved into an integrated research framework combining multiple methodologies. Traditional evaluation approaches, such as the isotropic sky model [
4], exhibit errors below 5% in open field conditions; however, in high-density urban environments, prediction deviations can reach 25–30% [
5]. To address this challenge, progress has been made in three key areas: in terms of data acquisition, the UAV-based LiDAR scanning system developed in [
6] achieves submeter precision in 3D modeling of building surfaces; regarding computational methods, ref. [
7] integrated ray-tracing algorithms with GIS platforms, improving the efficiency of shadow simulation for large-scale building clusters by 60%; and for model accuracy, the dynamic shading coefficient method proposed in [
8] reduces radiation prediction error to within 8% for typical urban scenarios.
It is noteworthy that, compared with rooftop PV systems—where standardized evaluation procedures are well-established—the study of shadow effects on façade PV systems remains significantly underdeveloped. For example, ref. [
9] analyzed Manhattan, New York, and found that high-rise buildings could induce annual generation fluctuations of up to 40% for façade PV systems—an impact often underestimated in current planning practices. More critically, most models (e.g., [
10]) still rely on static shading assumptions, failing to capture the dynamic shadow patterns caused by solar movement and seasonal variations in real urban contexts.
In the context of electricity markets, the research paradigm of PV system optimization is undergoing a shift from “generation maximization” to “revenue maximization”. Foundational studies, such as the fixed-tilt angle optimization model in [
11], established a global empirical rule of latitude ±10°. However, with deepening electricity market reforms, empirical research in [
12] based on the California market revealed that conventional optimal tilt schemes could forgo up to 30% of potential revenue under time-of-use (TOU) pricing. This finding has stimulated innovation in three directions: in temporal optimization, ref. [
13] introduced a seasonal tilt strategy to improve economic returns, though its feasibility is limited due to the high capital and maintenance costs of tracking systems; in market-responsive algorithms, ref. [
14] developed a price-generation coupling model that autonomously identifies high-price intervals and optimizes output profiles accordingly; in economic assessment, ref. [
15] constructed a life-cycle cost model that, for the first time, quantified the impact of tilt angle optimization on payback period. Nonetheless, significant limitations remain: most algorithms (e.g., [
16]) assume stable electricity price profiles, while in reality, stochastic market price fluctuations may reduce optimization effectiveness by 15–20% ([
17]). Moreover, some studies (e.g., [
18,
19]) have explored the integration of emerging energy storage resources—such as battery storage and hydrogen storage—into PV systems to enhance their power absorption capacity, optimize operational costs, and improve overall system economics. More importantly, current studies predominantly focus on standalone PV systems and lack integrated optimization frameworks with building energy systems.
Building-integrated photovoltaic (BIPV) research is evolving from single-system analyses to multi-component synergy. A recent global study by Yu et al. (2025) analyzed building-integrated photovoltaic (BIPV) potential across 120 cities worldwide [
20]. The research found that, on average, building facades offer approximately 68.2% of the photovoltaic potential of rooftops [
20]. This insight has led to three extended research avenues: in system performance enhancement, ref. [
21] showed that optimizing panel orientation and accounting for diffuse and reflected irradiance can mitigate self-shading losses, enhancing overall energy output by up to 26–29%; in system configuration optimization, the mixed-integer programming model proposed in [
22] enables simultaneous optimization of capacity ratios and spatial layouts for both PV types; in operational strategies, ref. [
23] proposed a Nash-based compensation mechanism that improves PV self-consumption to 98.83% on typical winter days. However, two key limitations persist in the current research system: at the technical level, most models (e.g., [
24]) overlook urban form effects in simulation, causing performance deviations up to ±28.55% during operation. In addition, ref. [
25] indicates that in areas with constrained grid capacity, even the integration of small-scale PV systems may lead to system instability and the risk of forced PV curtailment; in terms of economic evaluation, most studies still adopt fixed electricity prices, whereas ref. [
26] pointed out that under real-time pricing markets, Stackelberg game-based coordination can reduce subscriber costs by 9.1% and enhance total welfare by 60.0%, outperforming conventional day-ahead strategies. These limitations significantly constrain the economic performance of building PV systems in practical market conditions.
Current research exhibits significant shortcomings in two critical aspects. First, the widespread use of static optimization methods in coordinated planning limits the adaptability to real-time electricity price fluctuations. Second, there is a lack of an integrated methodological framework that combines shading simulation, tilt angle optimization, and coordinated dispatch. To address these gaps, this study proposes to develop a multi-objective optimization algorithm that accounts for electricity price volatility, construct a coordinated rooftop PV planning model, and validate it through case studies. The goal is to provide a novel solution for optimizing PV systems in high-density urban environments.
The results indicate that changing the maximum generation mix of rooftop PV (30° tilt, 180° azimuth) to the maximum revenue mix (15° tilt, 180° azimuth) reduces annual electricity generation by 217 kWh but improves the generation revenue from the electricity market by CNY 22.5. In addition, the kWh revenue from rooftop PV increases with azimuth, with the highest kWh revenue at 240° azimuth. The increase in revenue largely reflects the fact that solar production is re-located to afternoon hours and that the electricity price is relatively higher. The maximum generation mix and the maximum revenue mix of the facade PVs are the same for the south-facing facade (60° tilt angle), and the main influencing factor is the amount of electricity generated. When the tilt angle of the north-facing facade is greater than 20°, it will be the second-largest generator of electricity. The proposed high-resolution model provides a robust framework for assessing the spatial and economic performance of building-integrated PV systems. Beyond its technical value, the model offers practical insights for sustainable urban design, distributed energy policy development, and the planning of resilient and low-carbon urban energy systems.
3. Materials and Methods
This section first establishes a model for calculating the effective solar radiation received by PV panels. Second, a single-panel power generation model is developed, incorporating the effects of meteorological factors such as temperature, wind speed, and solar irradiance. Third, a rooftop PV revenue model is constructed based on electricity market prices. Finally, an integrated building PV planning method is proposed by calculating the optimal tilt angles for the four façades of the building.
3.1. Building Information Model
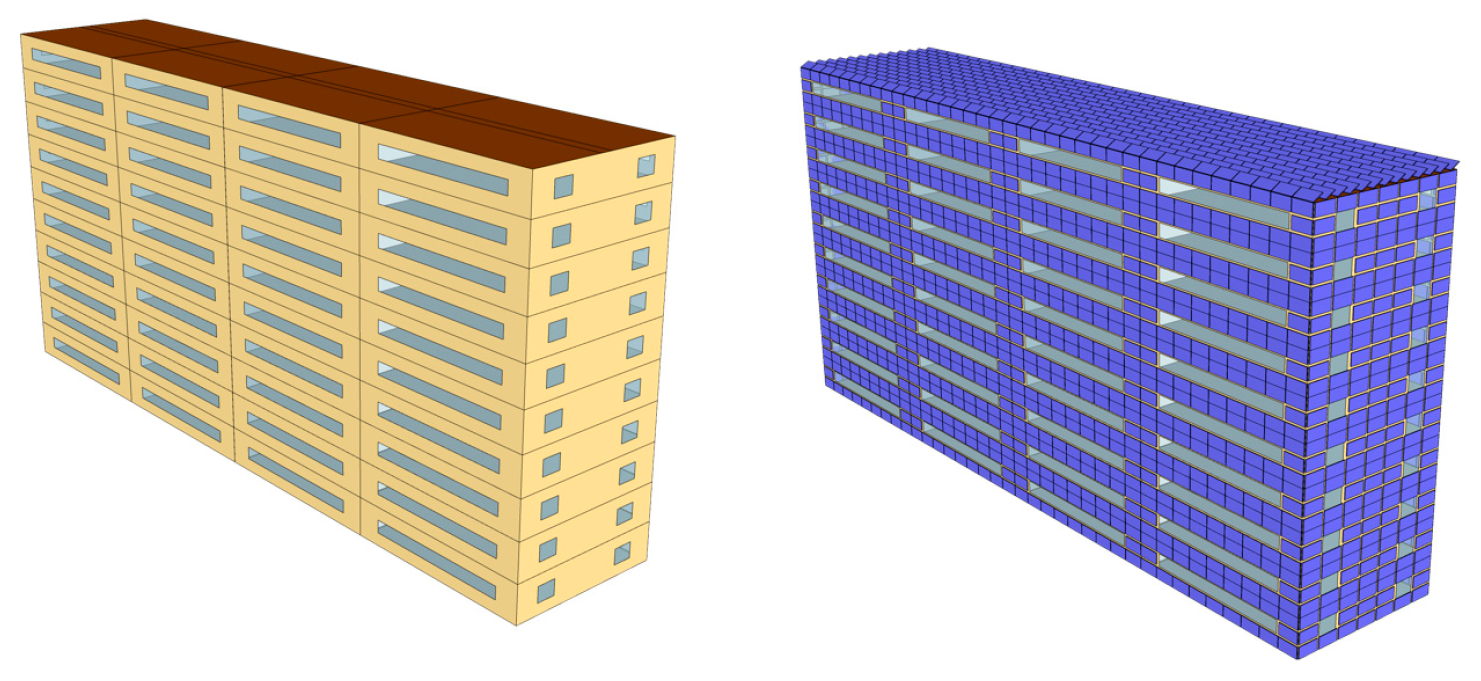
In this study, urban building models are simplified into standard structures with regular cuboid geometry, representing typical commercial office buildings. The dimensions of the building are 58 m (length) × 12 m (width) × 28 m (height). The window-to-wall ratio (WWR) is set at 0.25 for the south and north façades, and 0.1 for the east and west façades. PV modules are assumed to be fixed and fully installed on the rooftop, as well as on the south-, east-, and west-facing walls, as illustrated in
Figure 1. It is assumed that each surface is completely covered with PV panels. It is worth noting that the target buildings in this study are high-rise civil buildings, based on the
Unified Standard for Design of Civil Buildings (GB 50352-2019) [
27].
3.2. Solar Radiation Modeling
Based on the planar radiation calculation method proposed by Jiang et al. [
28], this section computes the effective solar radiation received by building surfaces by combining natural solar radiation data from meteorological sources, the geometric orientation of building planes, and a solar position model. Specifically, the model calculates the tilt and azimuth angles between the building surfaces and the sun to adjust incident solar radiation accordingly.
The solar position model [
29] includes the hour angle (ω), solar declination (
), solar altitude angle (α), solar zenith angle (θₓ), solar azimuth angle (α_solar), and the angle of incidence on an inclined surface (θᵢ). Among these, the solar declination angle δ characterizes the date of the year, representing the latitude of the subsolar point, and directly influences the solar altitude angle. It is calculated as:
where
n denotes the day of the year, with 1 January as day 1 and 31 December as day 365 (or 366 in a leap year).
The solar hour angle ω indicates the position of the sun throughout the day, changing by 15° per hour:
where
is the solar time in hours (ranging from 0 to 24).
The solar altitude angle
and the solar zenith angle θₓ determine the path length of solar radiation through the atmosphere:
where
φ is the local latitude.
The solar zenith angle θz is the complement of the solar altitude angle and can be calculated as:
The solar azimuth angle (
) describes the direction of the sun and is calculated as:
The global solar irradiance consists of direct beam radiation and diffuse horizontal radiation, and can be expressed as:
where
Gdirect(t) is the direct normal irradiance and
Gdiffuse(t) is the diffuse horizontal irradiance. Both depend on extraterrestrial solar radiation, solar altitude, and atmospheric conditions such as cloud cover and turbidity. Related models can be found in [
30].
The incident solar radiation on a PV panel varies with the panel’s tilt angle (β) and azimuth angle (γ). The effective irradiance received by a tilted PV panel is determined by:
where
Gdirect(
t) denotes the direct solar irradiance at time
t (W/m
2), and
Gdiffuse(
t) represents the diffuse solar irradiance at time
t (W/m
2).
θᵢ is the angle of incidence, computed as:
Here,
refers to the azimuth angle of the PV panel, defined as the angle between the panel’s orientation and true south. In solar radiation calculations for building-integrated PVs, both the panel azimuth (γ) and tilt angle (β) are treated as variables [
31].
It is important to note that the subject of this study is a single high-rise office building. The core objective is to explore the revenue differences arising from various PV orientation and tilt configurations under market-based electricity pricing mechanisms, rather than to precisely predict the absolute power generation of each building unit. Under consistent control variables, the proposed model effectively captures the relative economic performance of different installation strategies, ensuring sound comparative validity. Moreover, previous studies have shown that for high-rise buildings, façades typically experience minimal shading from surrounding objects, including vegetation and nearby structures [
32]. Therefore, moderate simplification of shading modeling is unlikely to significantly affect the identification of optimal strategies at the planning level.
3.3. Single PV Panel Power Generation Modeling
In addition to solar radiation, the power generation of PV cells is also affected by their operating temperature, which depends on solar radiation, ambient temperature, and wind speed.
The rated power of PV modules is defined under standard test conditions (STC), which are:
Solar irradiance intensity GSTC = 1000 W/m2;
Cell temperature: TSTC = 25 °C;
Solar spectrum: AM1.5.
Under STC, the theoretical power output of a PV module, denoted as
(kW), is given by:
where
is the module efficiency under STC,
is the area of the PV panel.
In real-world operation, solar radiation and temperature deviate from STC, so corrections are necessary.
PV power output is proportional to the effective solar radiation
Gfinal(t) (W/m
2), which needs to be converted to kW/m
2 (i.e., divided by 1000):
where
Prad(t) is the power output (kW) considering only radiation. If
Gfinal(
t) = 1000 W/m
2, then
Prad(
t) =
PSTC. On cloudy or rainy days,
Gfinal(
t) may drop to 100–300 W/m
2, significantly reducing power output.
PV module efficiency decreases with increasing temperature. The correction formula is:
where
is the temperature coefficient of power,
is the PV cell temperature at time
t, usually higher than the ambient temperature T(t).
Cell temperature is estimated using the nominal operating cell temperature (NOCT) model:
where NOCT is the nominal operating cell temperature provided by the manufacturer.
The AC power output of PV systems can be further calculated as:
where α
inv is the inverter efficiency,
is the system generation efficiency considering losses, and
is the available area coefficient of each building surface.
3.4. The Revenue from Power Generation Considering the Market Price of Electricity
In this study, energy storage is not considered; all generated PV electricity is assumed to be fed into the grid at real-time market prices. Here, the PV revenue equals the multiplication of PV power generation and the real-time market electricity price.
Hourly revenue R(t) (CNY):
where πfeed-in(t) is the feed-in electricity price at time
t (in CNY/kWh, converted from CNY/MWh by dividing by 1000).
Total revenue (CNY) is the sum over 8760 h:
3.5. Building Facade PV Tilt Angle and Power Generation Modeling
First, the impact of architectural shape on PV output and building energy consumption is neglected. Urban buildings are simplified into a standard cuboid with dimensions length × width × height = L × W × H. The normal vectors of each building surface are defined as follows:
The baseline tilt angle of PV panels on facades, defined as the angle between the panel surface and the vertical wall, is calculated as:
where
is the angle between the wall and the ground (for vertical walls,
=
, hence
).
The Perez anisotropic sky model is adopted to calculate incident solar radiation on building facades. The total radiation on a tilted plane consists of three components:
The incidence angle
is calculated from the dot product of the surface normal vector and the solar direction vector:
- (a)
Solar direction vector:
where
is the solar altitude angle at time
t,
is the solar azimuth angle at time
t.- (b)
Diffuse radiation:
where
is the diffuse horizontal irradiance at time t (W/m
2), Σ is the angle between the panel surface and the sky dome (for vertical walls, Σ = 90°).
The feasible installation area ratio for PV panels on building facades is defined as:
where
is the total area of the façade, and
is the structural safety factor, typically ranging from 0.6 to 0.8.
When the unit area revenue from a facade reaches at least 80% of that of the roof, facade PV installation is recommended.
4. Results
This study focused on Wuhan, Hubei Province, China, where the research team is based. The meteorological data was purchased from a commercial technology provider, and the electricity price data was obtained from the provincial power grid company [
33]. The Wuhan meteorological station is located at 30.60° N, 114.05° E, with an elevation of 34.4 m. Wuhan lies in the central plains of China and features a subtropical monsoon climate, characterized by cold winters and hot summers. The annual solar radiation ranges from 1163 to 1393 kWh/m
2/year. Typical meteorological data for a representative year show that temperature varies between −8 °C and 39 °C, and daily solar radiation ranges from 0 to 8 kWh/m
2 throughout the year. It belongs to the CFA type according to the Köppen Climate Classification [
34].
The case study used hourly data from 00:00 on 16 April 2024 to 23:00 on 15 April 2025, covering a total of 8760 h. The dataset included spot market electricity prices, solar radiation, temperature, precipitation, solar altitude angle, and solar azimuth angle for each hour (i.e., Hour 1 corresponds to 00:00 on 16 April 2024, and Hour 8760 corresponds to 23:00 on 15 April 2025).
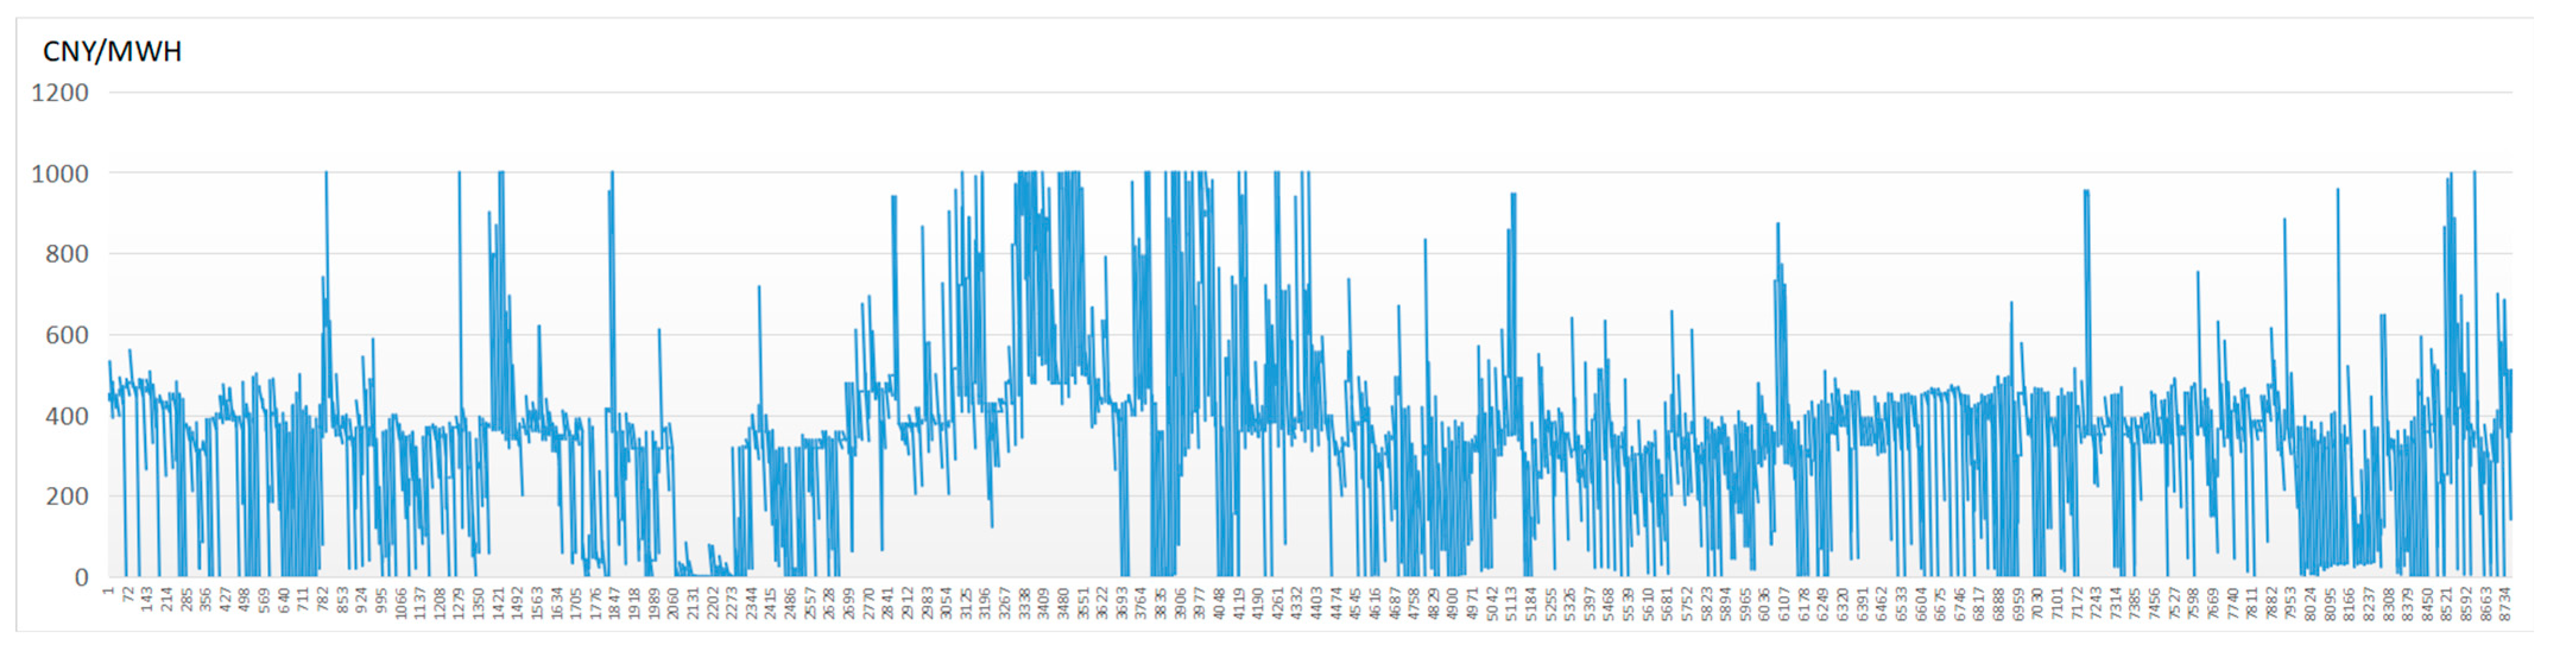
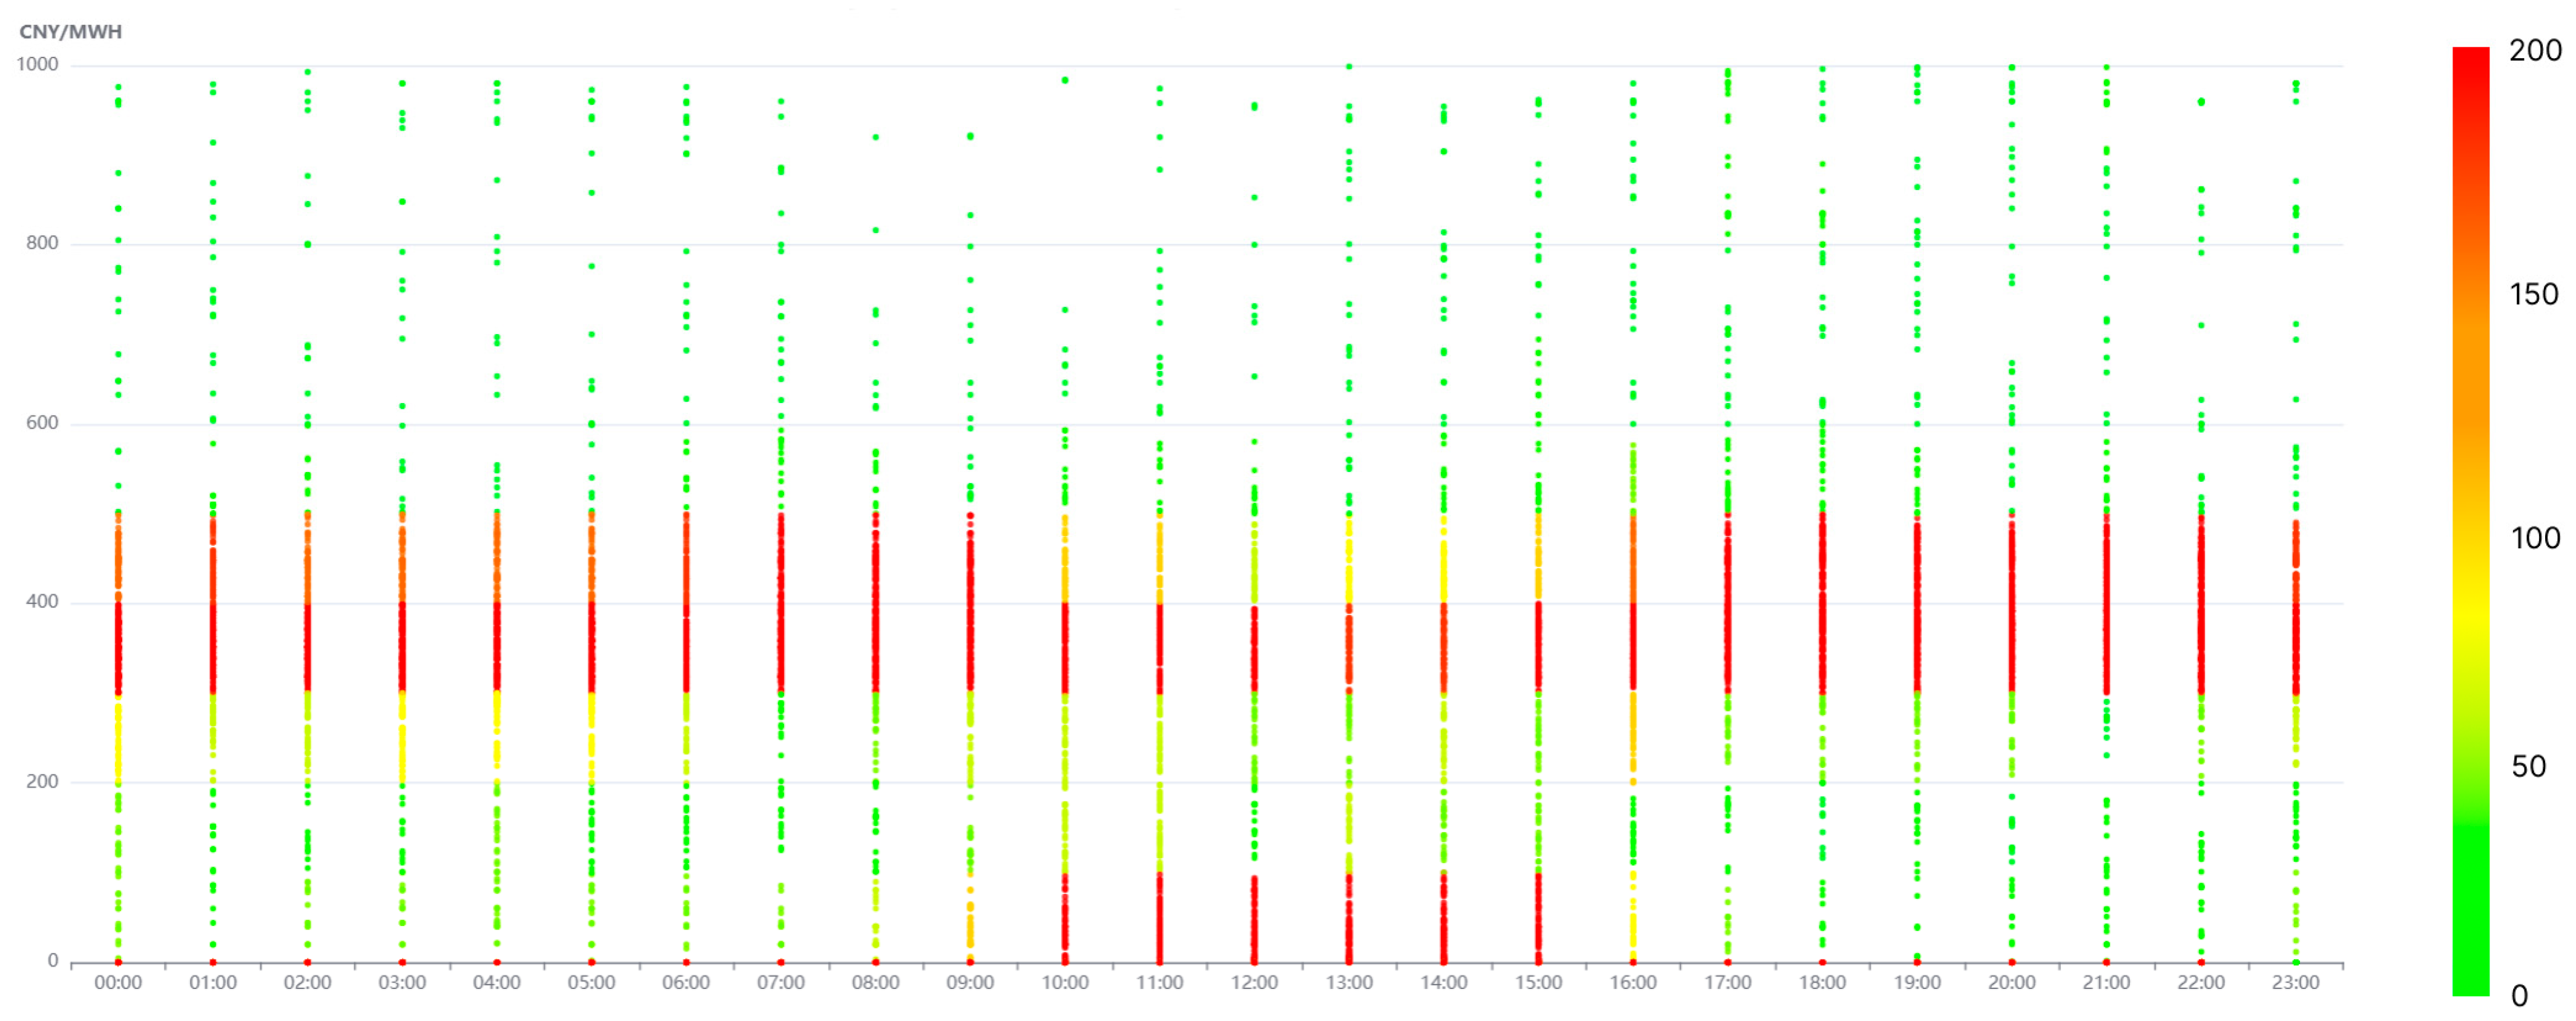
As shown in
Figure 2, spot market electricity prices in Hubei generally range between CNY 300 and 500/MWh, with CNY 1000/MWh set as the regulatory price ceiling, provided by Hubei Provincial Energy Bureau [
35]. By consolidating spot electricity prices from 00:00 to 23:00 for each day of the year, a clear diurnal pattern emerged, as illustrated in
Figure 3. The color gradient from green to red represents the frequency of electricity prices occurring during a given time period. Green indicates that a specific price appeared only once, while red indicates it occurred more than 200 times. The closer the color to red, the more frequently that price level appeared during that time slot.
All monetary values in this study were originally calculated in Chinese yuan (CNY). For international readers, we provide USD equivalents using the annual average exchange rate of CNY/USD 7.1884 for the year 2024, as published by the People’s Bank of China (PBC) [
36]. The exchange rate reflects the period during which the data was collected.
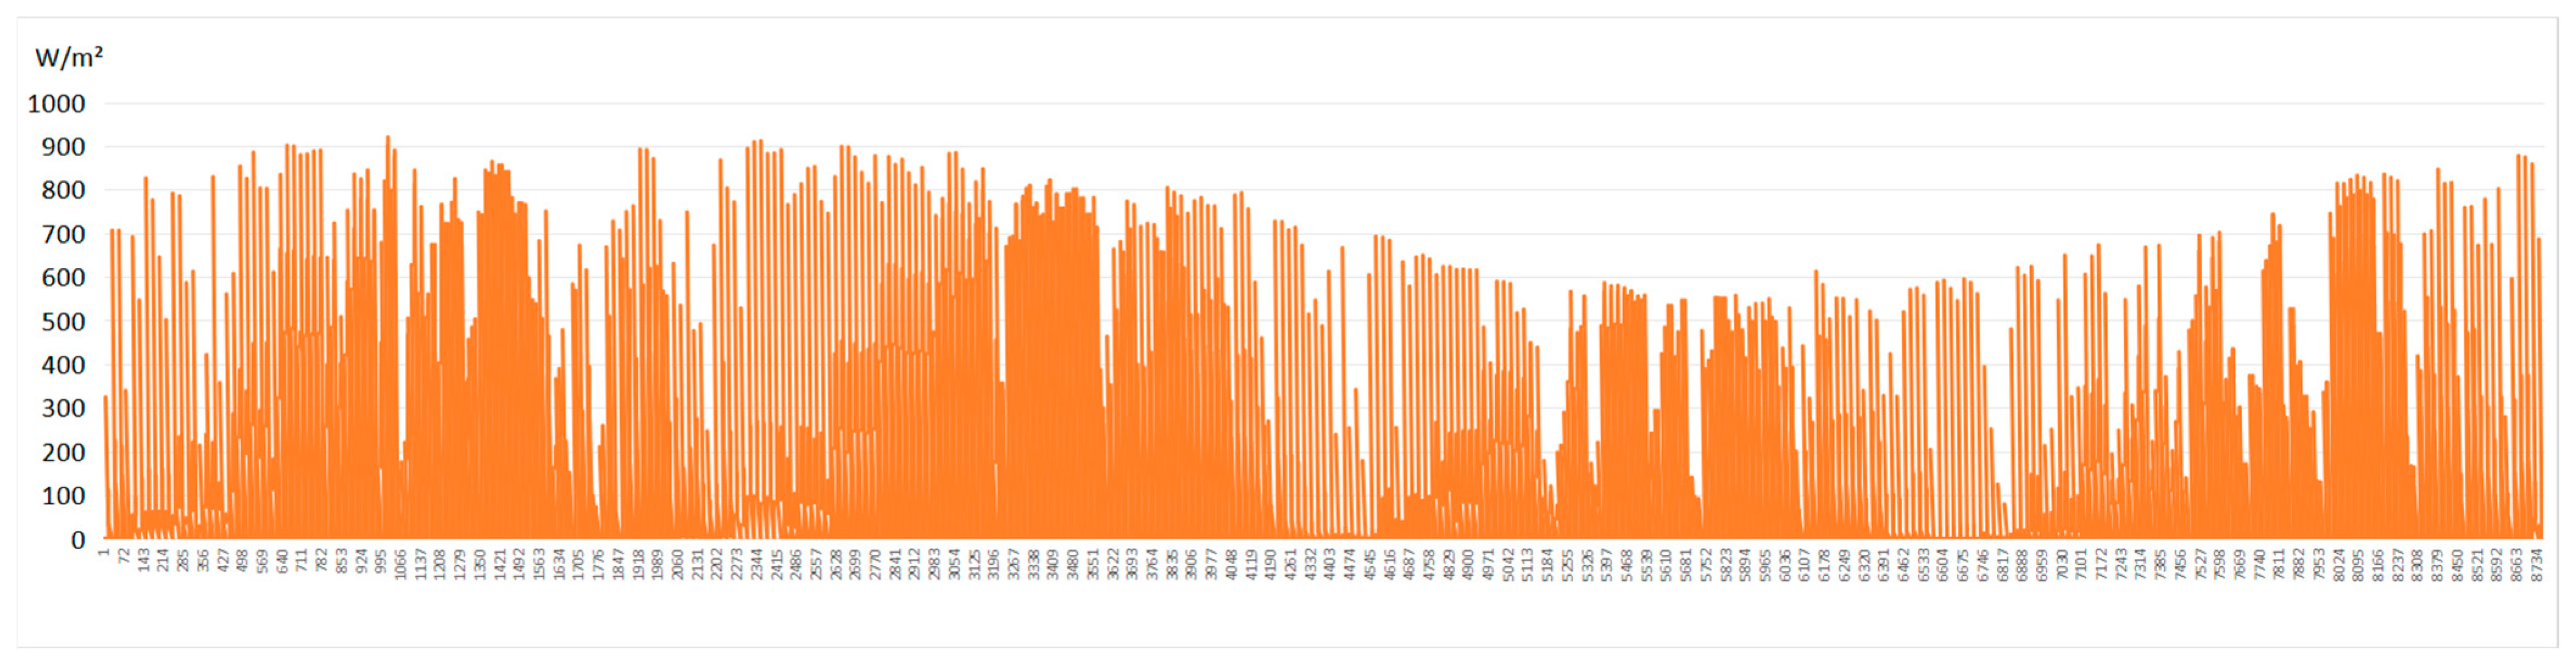
As illustrated in
Figure 4, the solar radiation data consists of the total sum of direct, diffuse, and reflected radiation components. Solar irradiance is significantly higher in the summer and lower during winter months, which aligns with seasonal solar energy availability.
This study employed a discretization approach to define combinations of azimuth and tilt angles for building-integrated PV systems. Due to its practicality and computational efficiency, this method has been widely adopted in experimental and engineering design contexts for building PV applications (e.g., [
37,
38]). Although continuous optimization can theoretically identify globally optimal solutions, it often results in impractical configurations or excessive computational burdens. Therefore, to balance accuracy, applicability, and model tractability, this study defined a representative set of discrete angle combinations, using the theoretical optimum—tilt angle equal to the site latitude and azimuth angle oriented due south—as the baseline reference [
39], with the goal of informing engineering practice in PV deployment.
4.1. Power Generation and Revenue from Rooftop PV Systems Analysis
This study focused on evaluating total power generation and revenue under different combinations of tilt angles and orientations for rooftop PV panels. A theoretical full-range search using 5-degree intervals for tilt and 10-degree intervals for orientation would result in 684 combinations, leading to excessive computational load and low efficiency.
To address this, a more efficient combination filtering strategy was adopted. Based on Wuhan’s geographic latitude (approximately 30°) and the characteristics of PV systems, three representative tilt angles were selected: 30°, as the standard close to the local latitude; 15°, to improve power output in summer; and 45°, to enhance winter performance and promote rainwater self-cleaning. In terms of orientation, the reference direction was set as due south (180°), and additional combinations with 30° and 60° deviations toward both the east and west were included to capture generation patterns that better aligned with the time-of-use electricity price peaks in the morning and evening. This optimization approach ultimately yielded 15 typical tilt-orientation combinations, which significantly reduced the complexity of computation while ensuring that the key solution space for maximizing both energy output and economic returns was adequately covered. The method is consistent with PV engineering best practices and is responsive to market-based electricity pricing dynamics (
Table 1).
The technical specifications of the PV panels used in the simulation refer to the Canadian Solar CS5P-220M model, with a rated power of 220 W, dimensions of 1.602 m by 1.061 m, and a conversion efficiency of 16.7%. The temperature coefficient was set at −0.38%/°C, typical for crystalline silicon modules, and the nominal operating cell temperature (NOCT) was assumed to be 45 °C. The installed capacity of the building-integrated PV systems evaluated in this study was determined based on the surface area of the respective building planes. Specifically, the total installed capacity of the rooftop PV system was calculated as 90 kWp. Based on these parameters, Python 3.9 was employed to calculate the total power output and revenue over 8760 hourly intervals for each of the 15 tilt-orientation combinations.
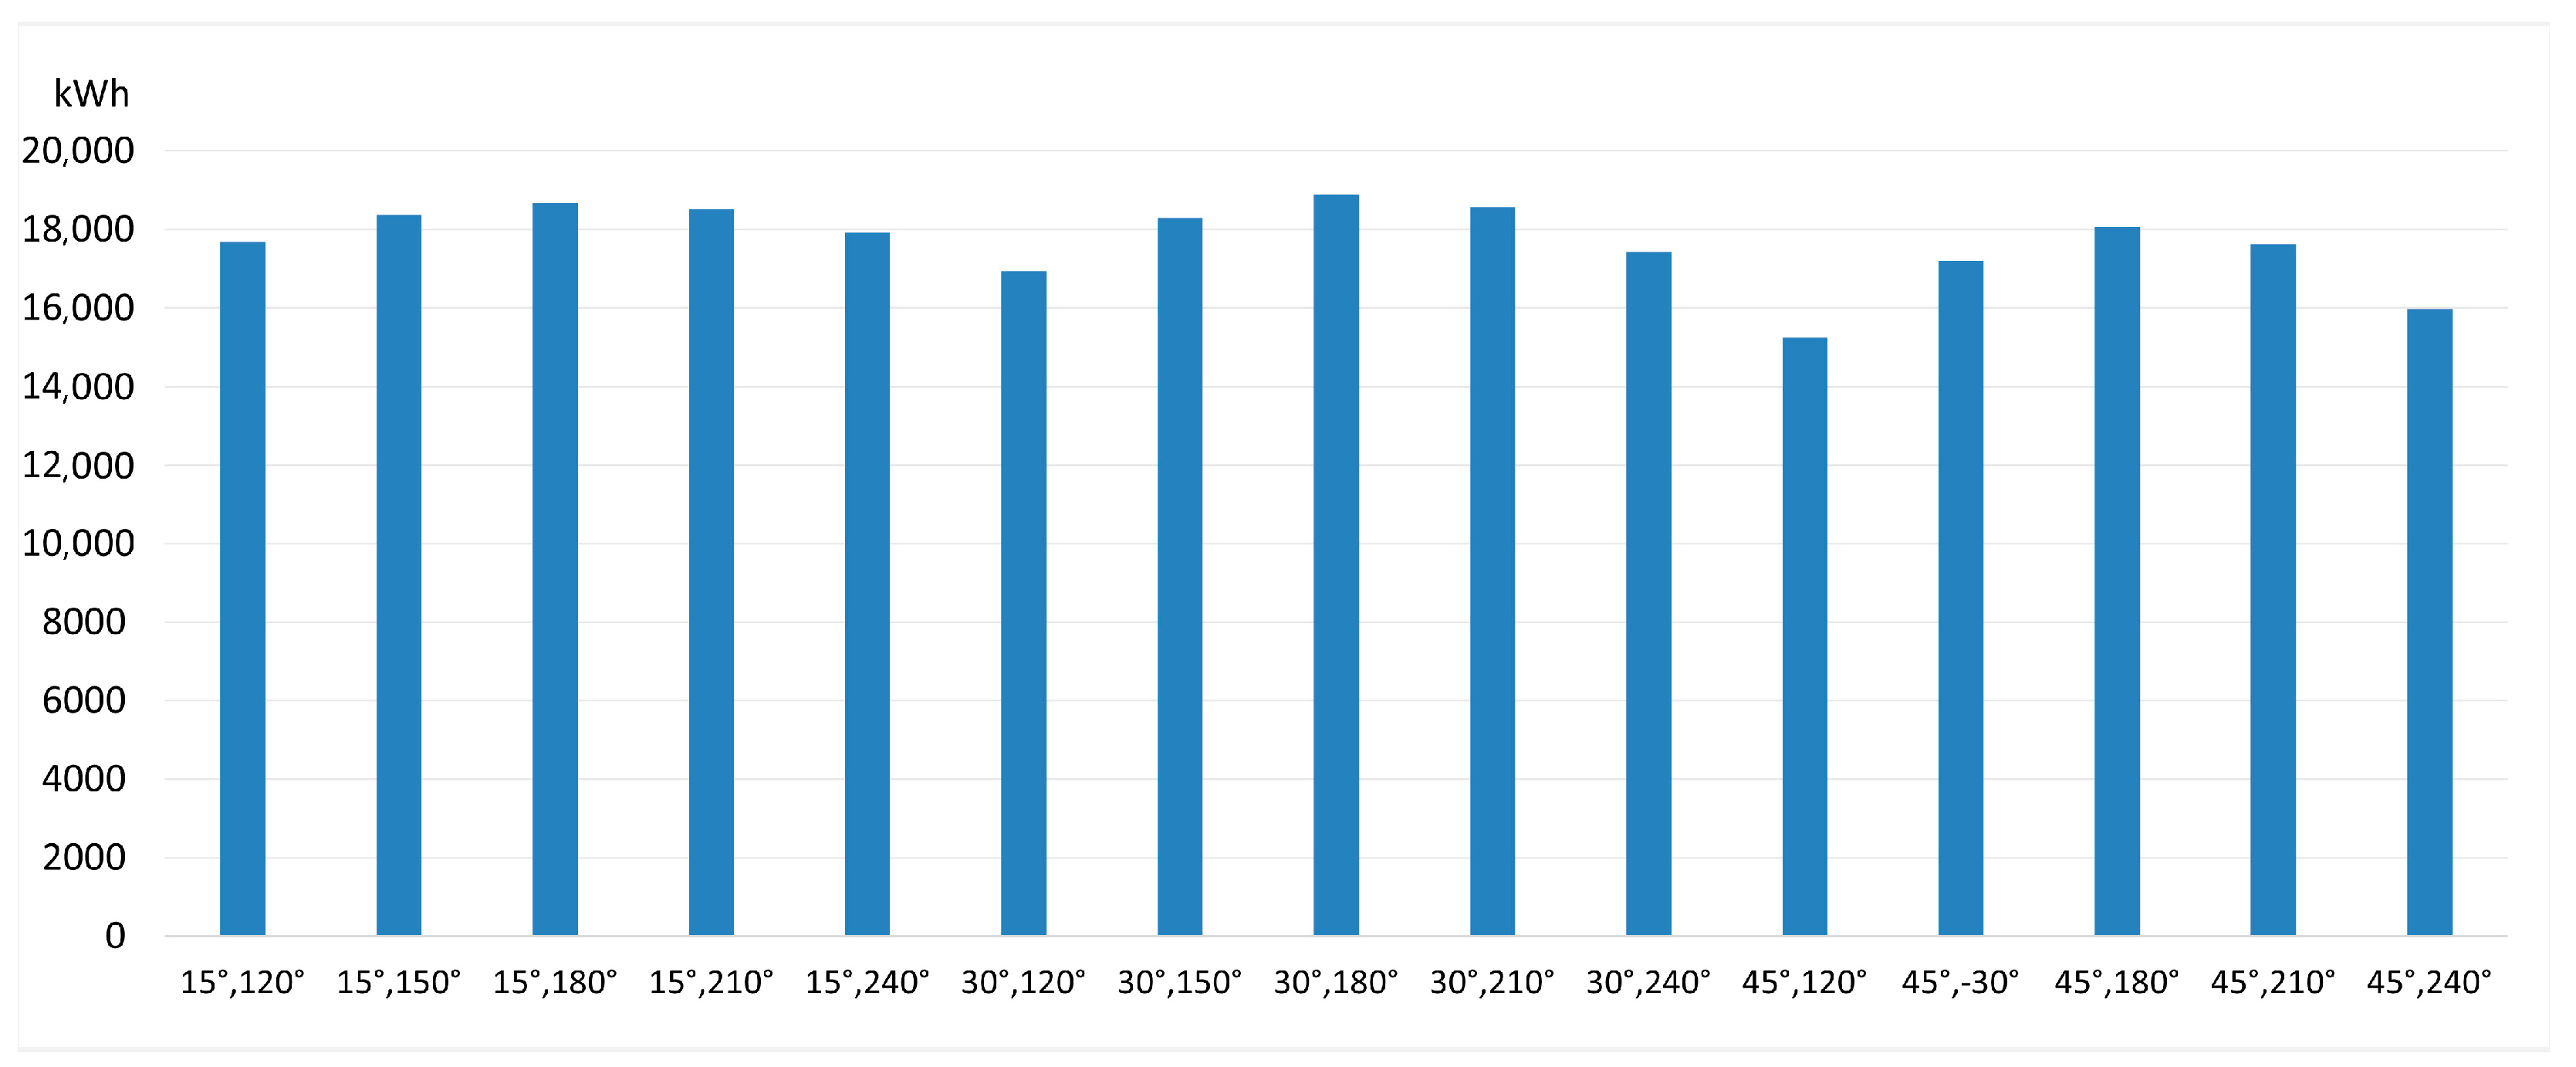
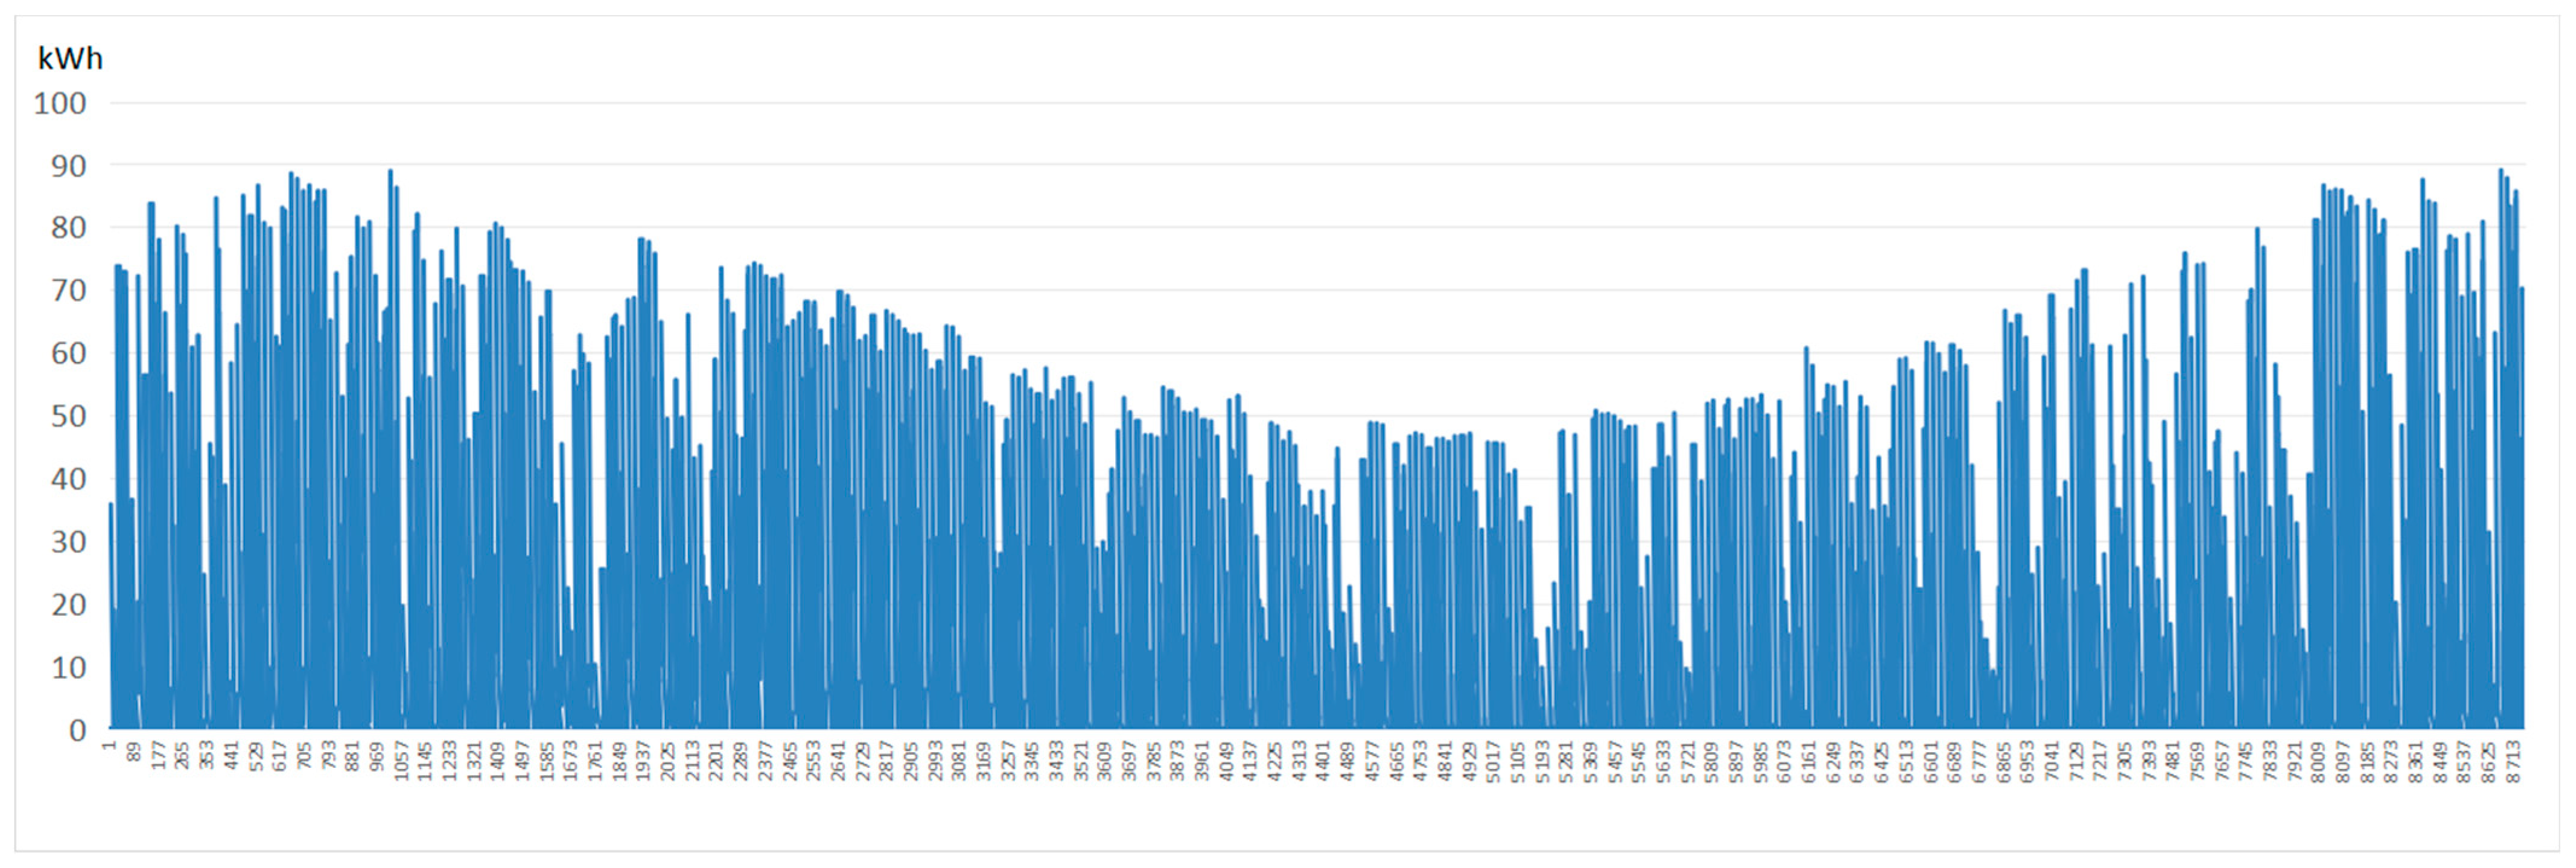
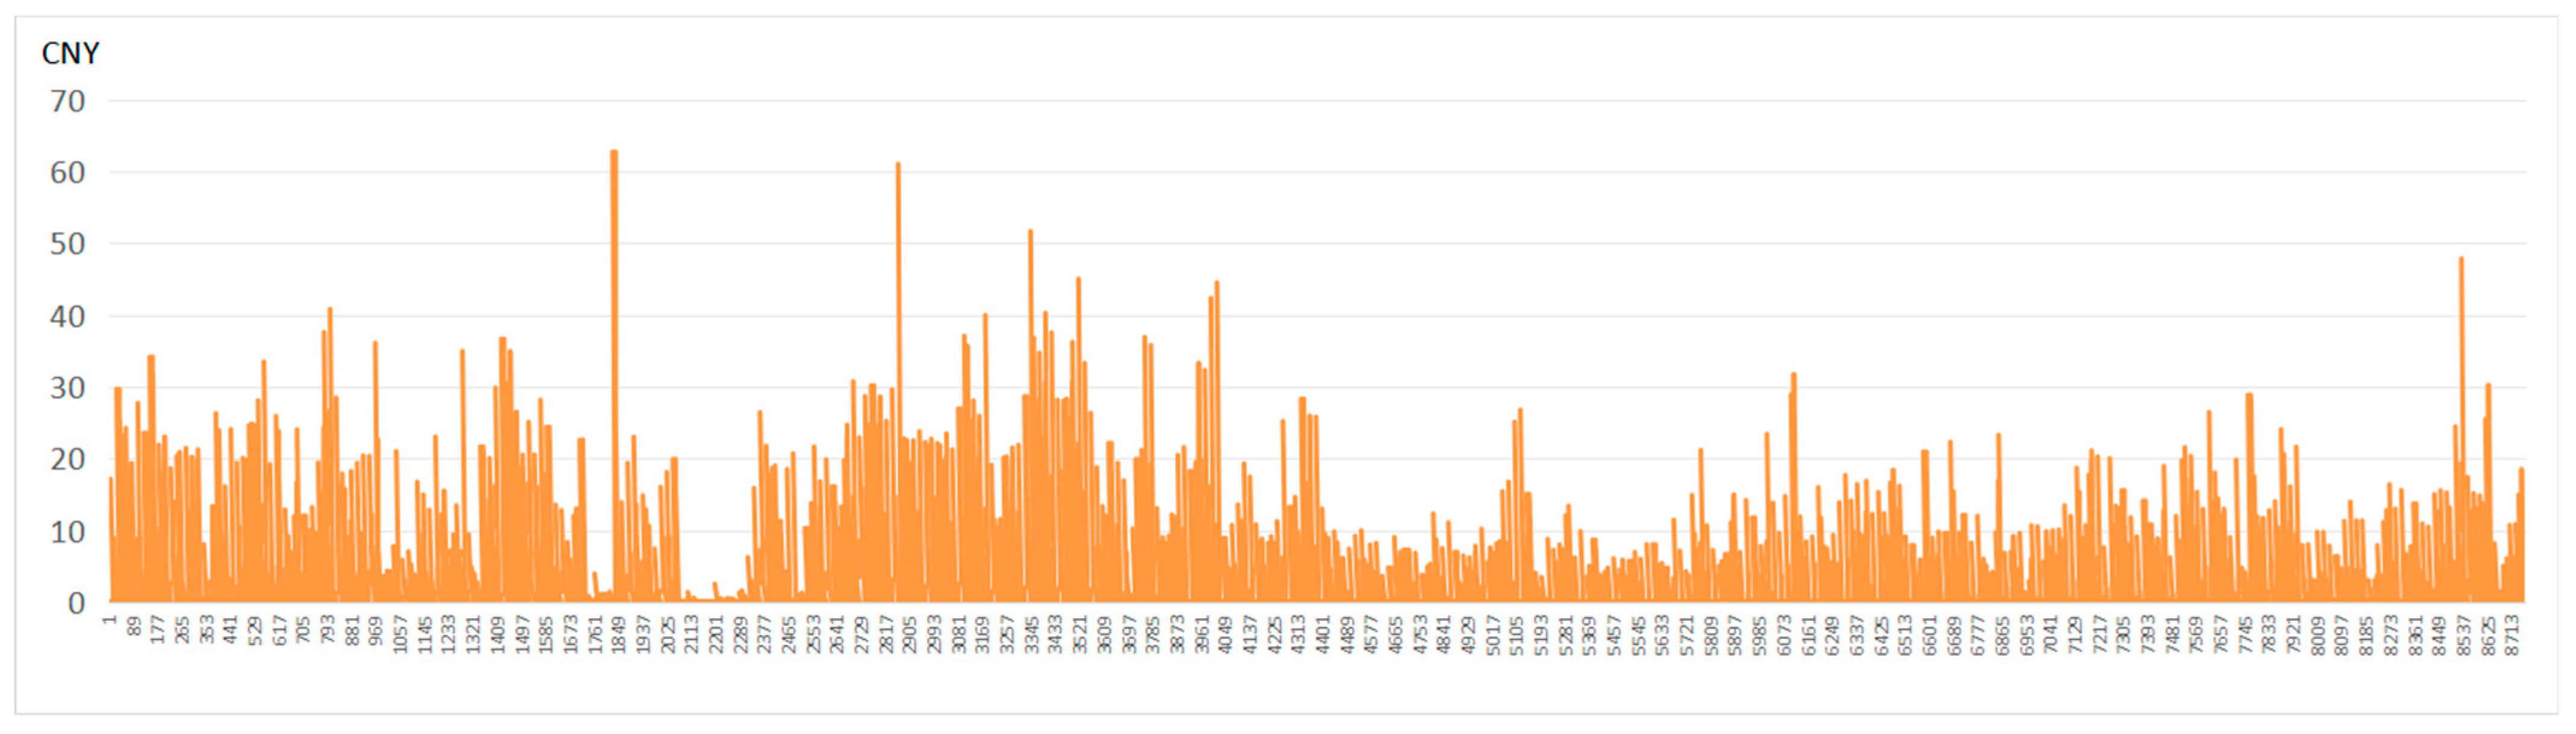
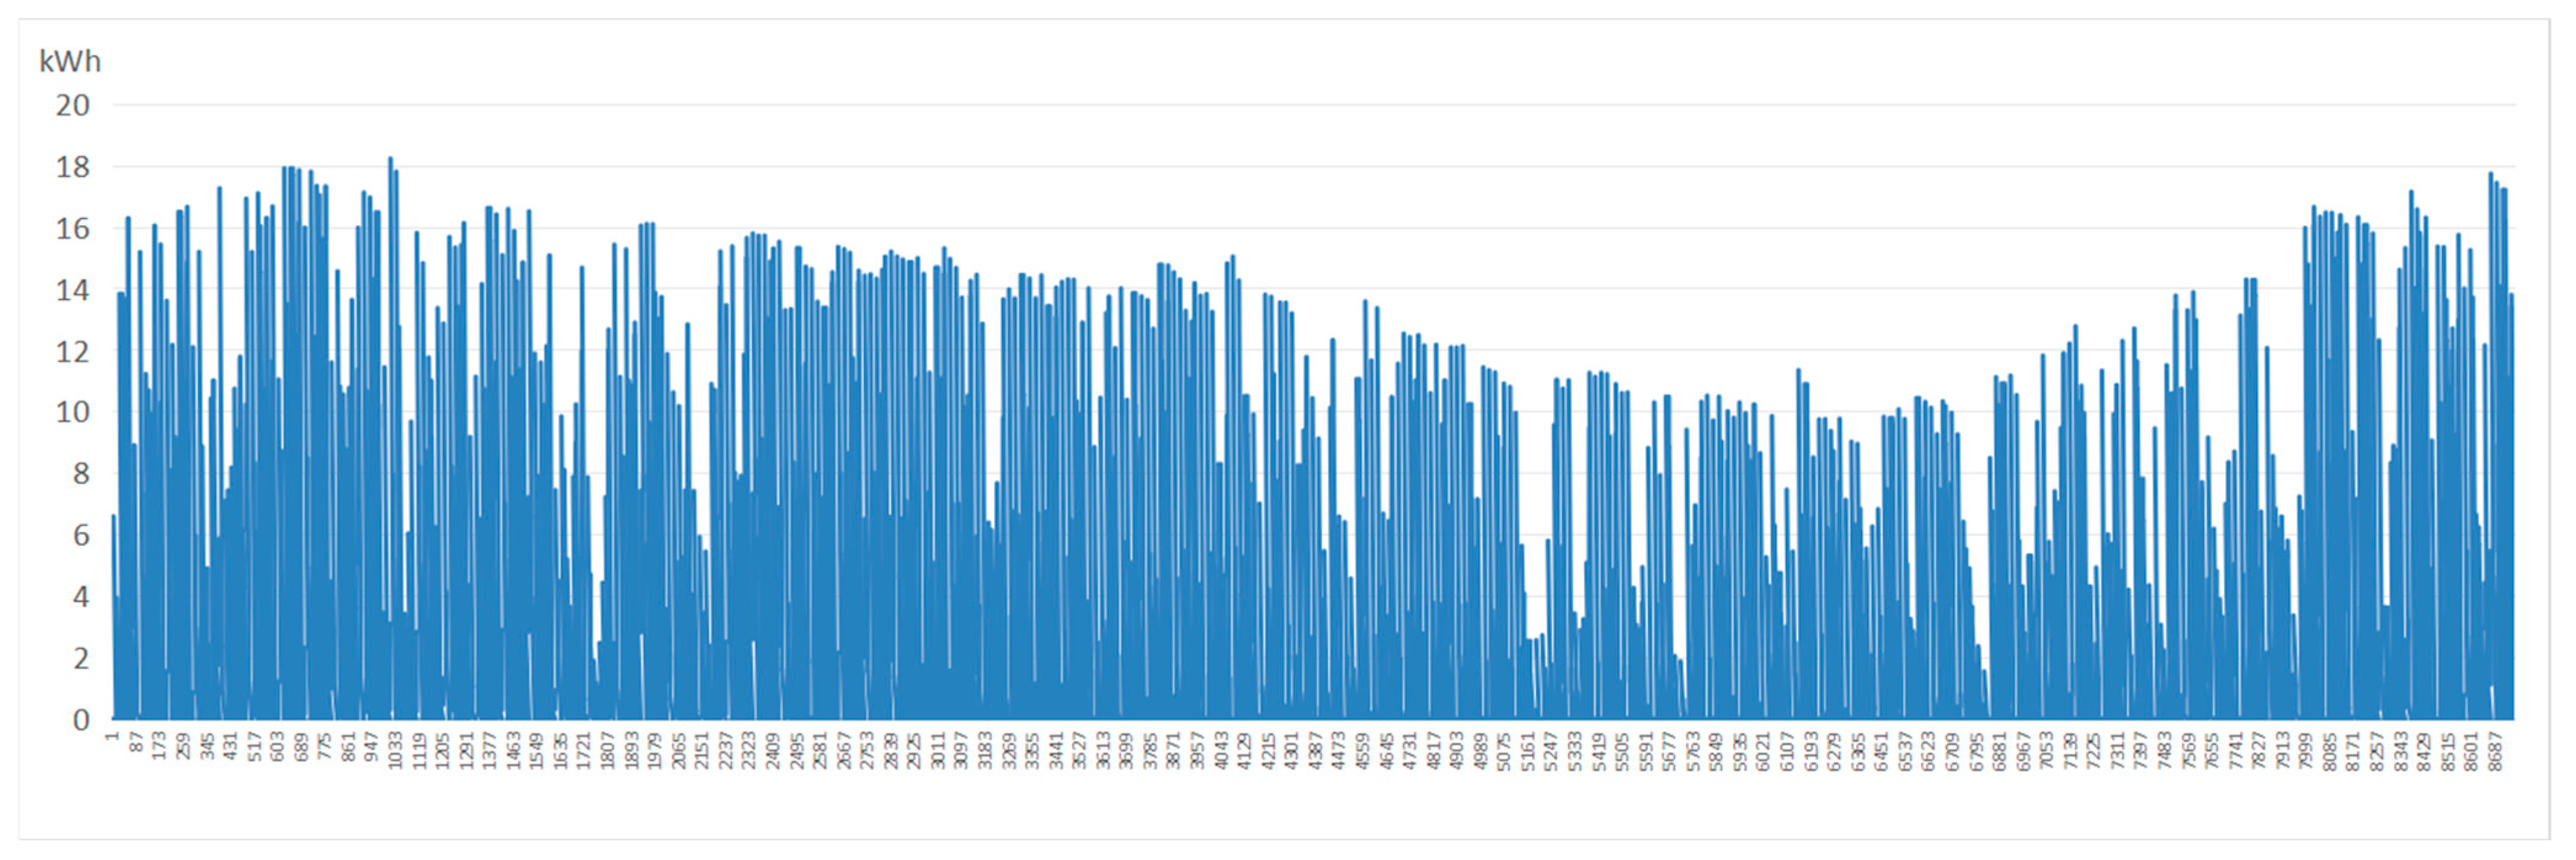
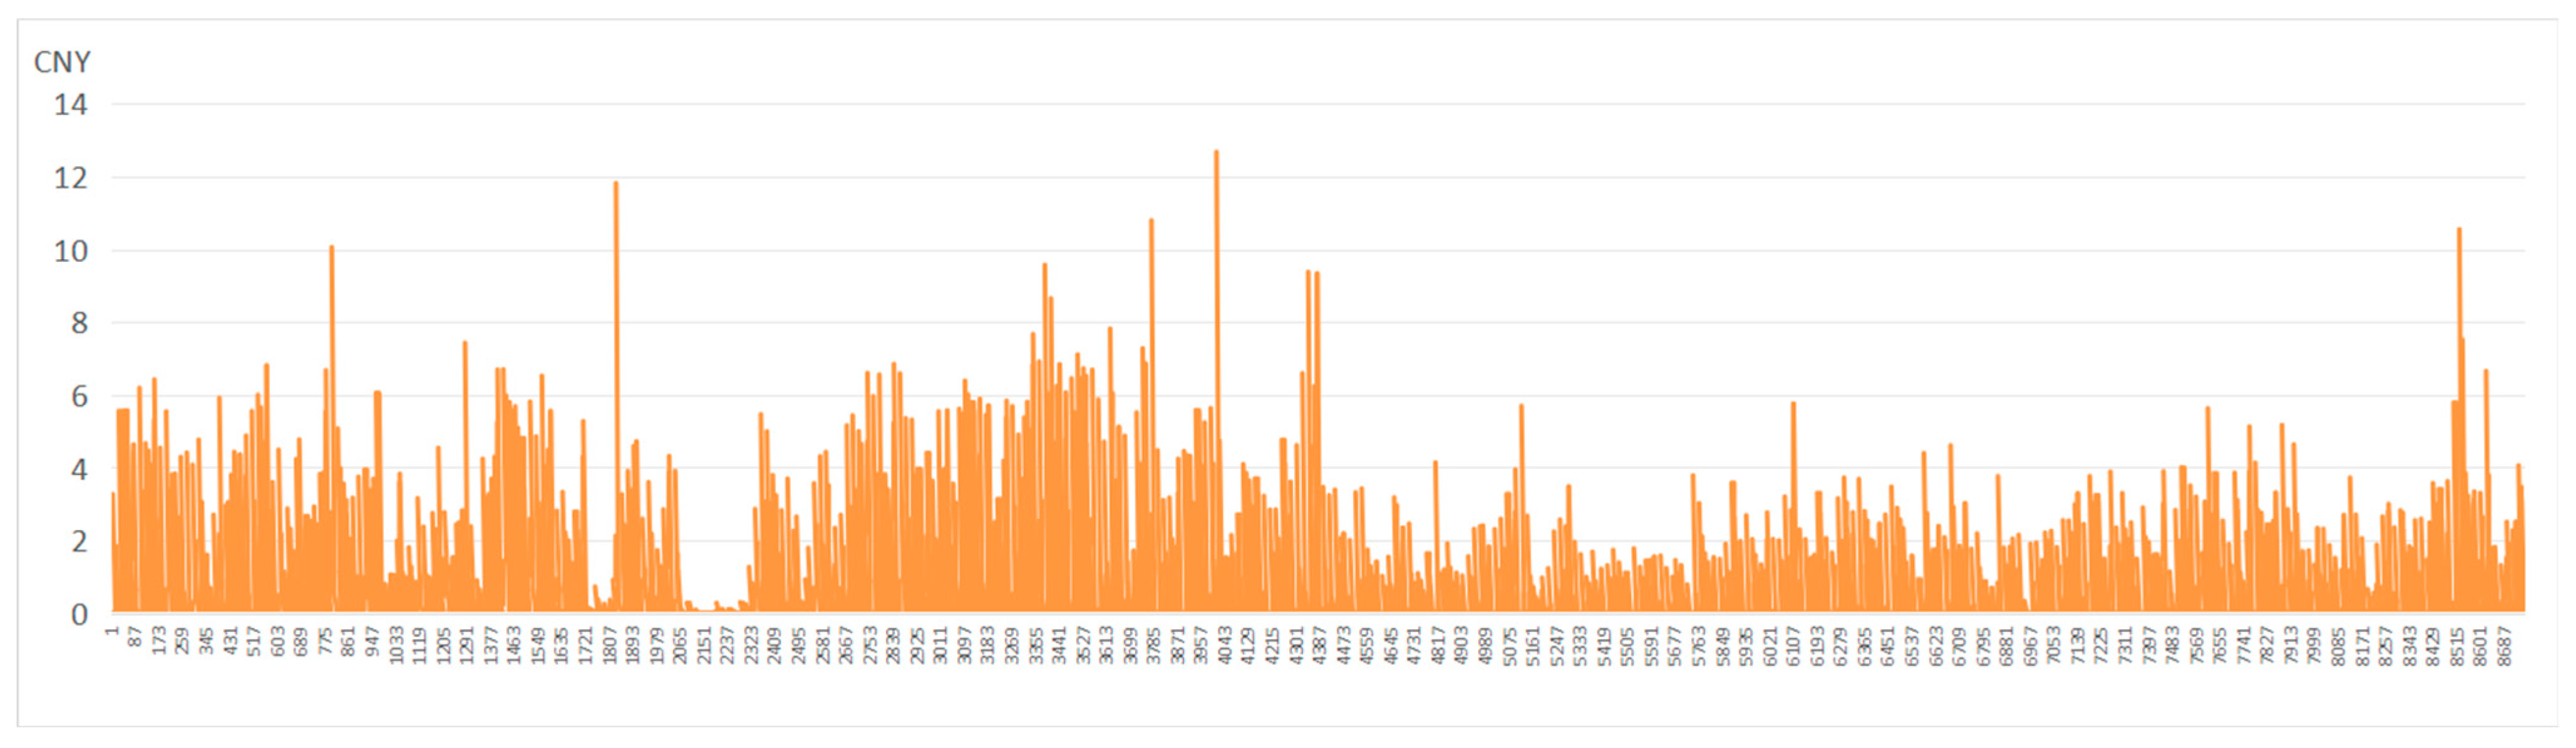
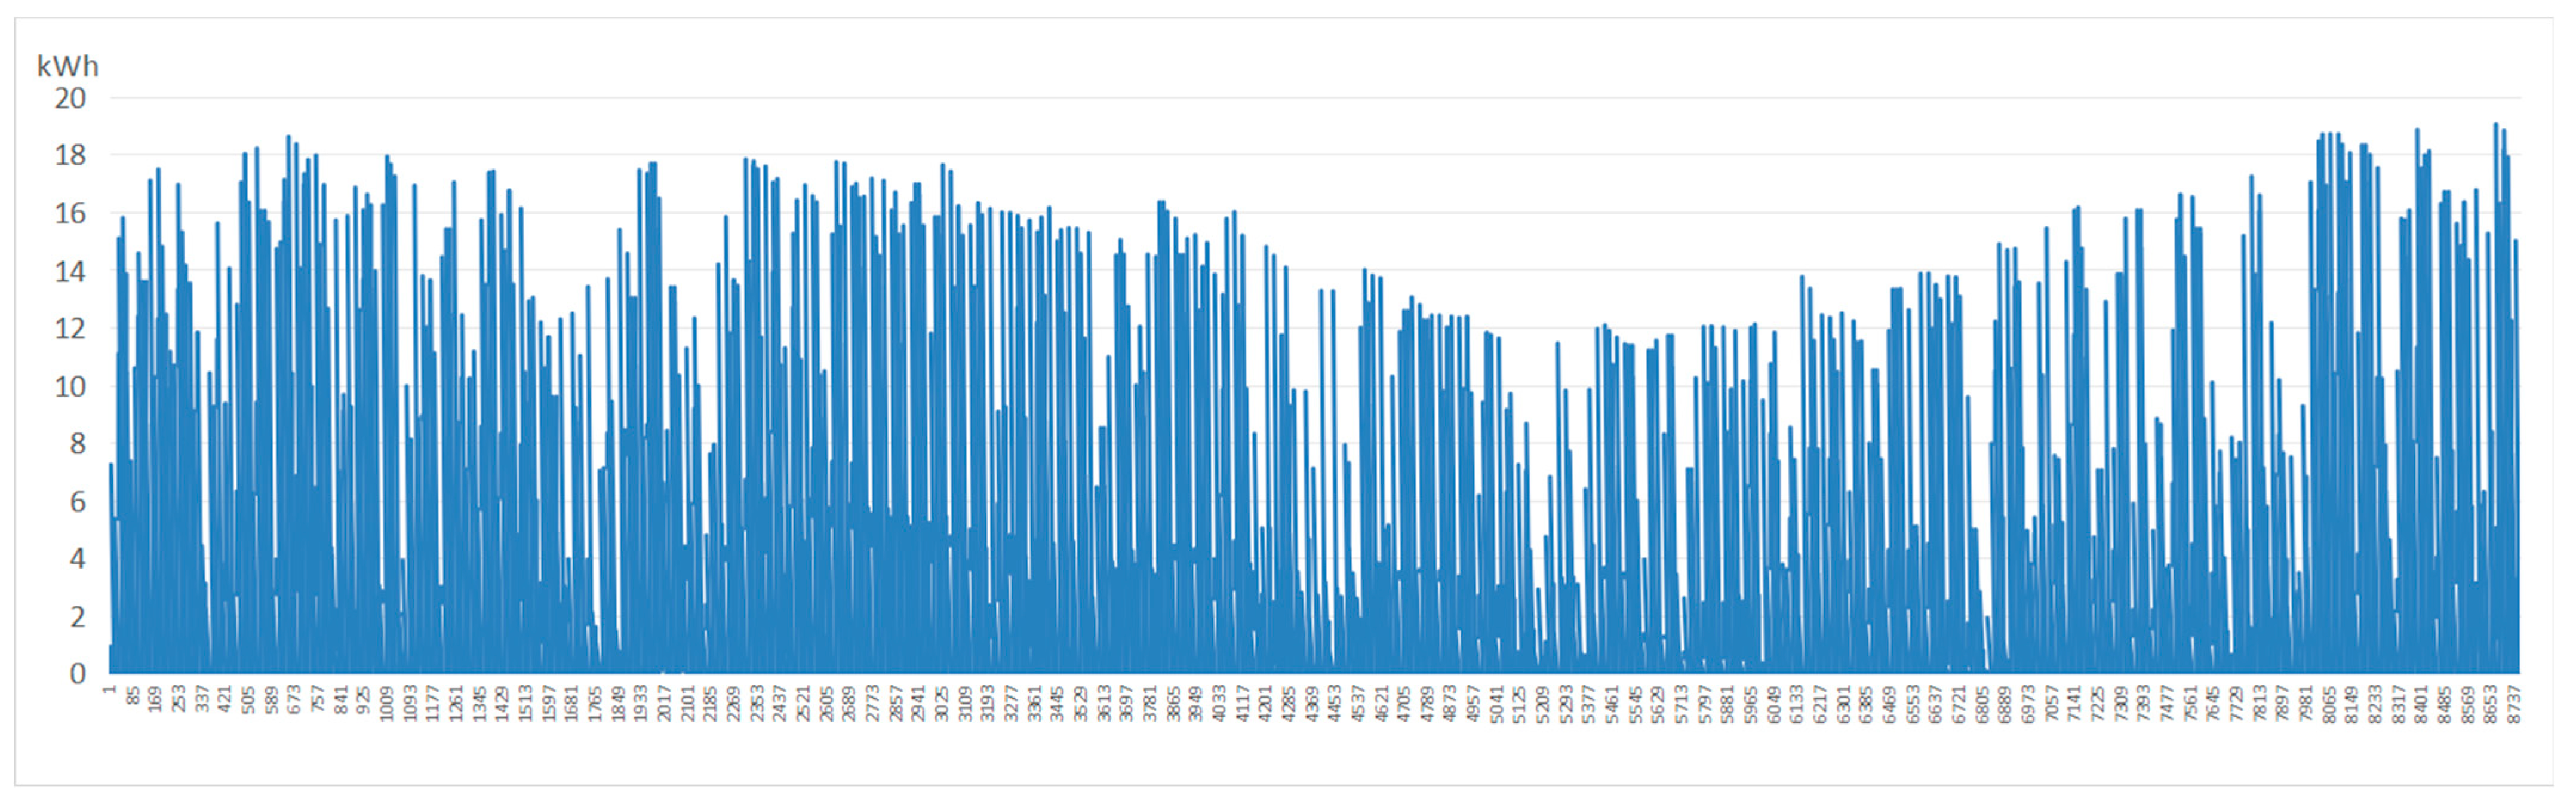
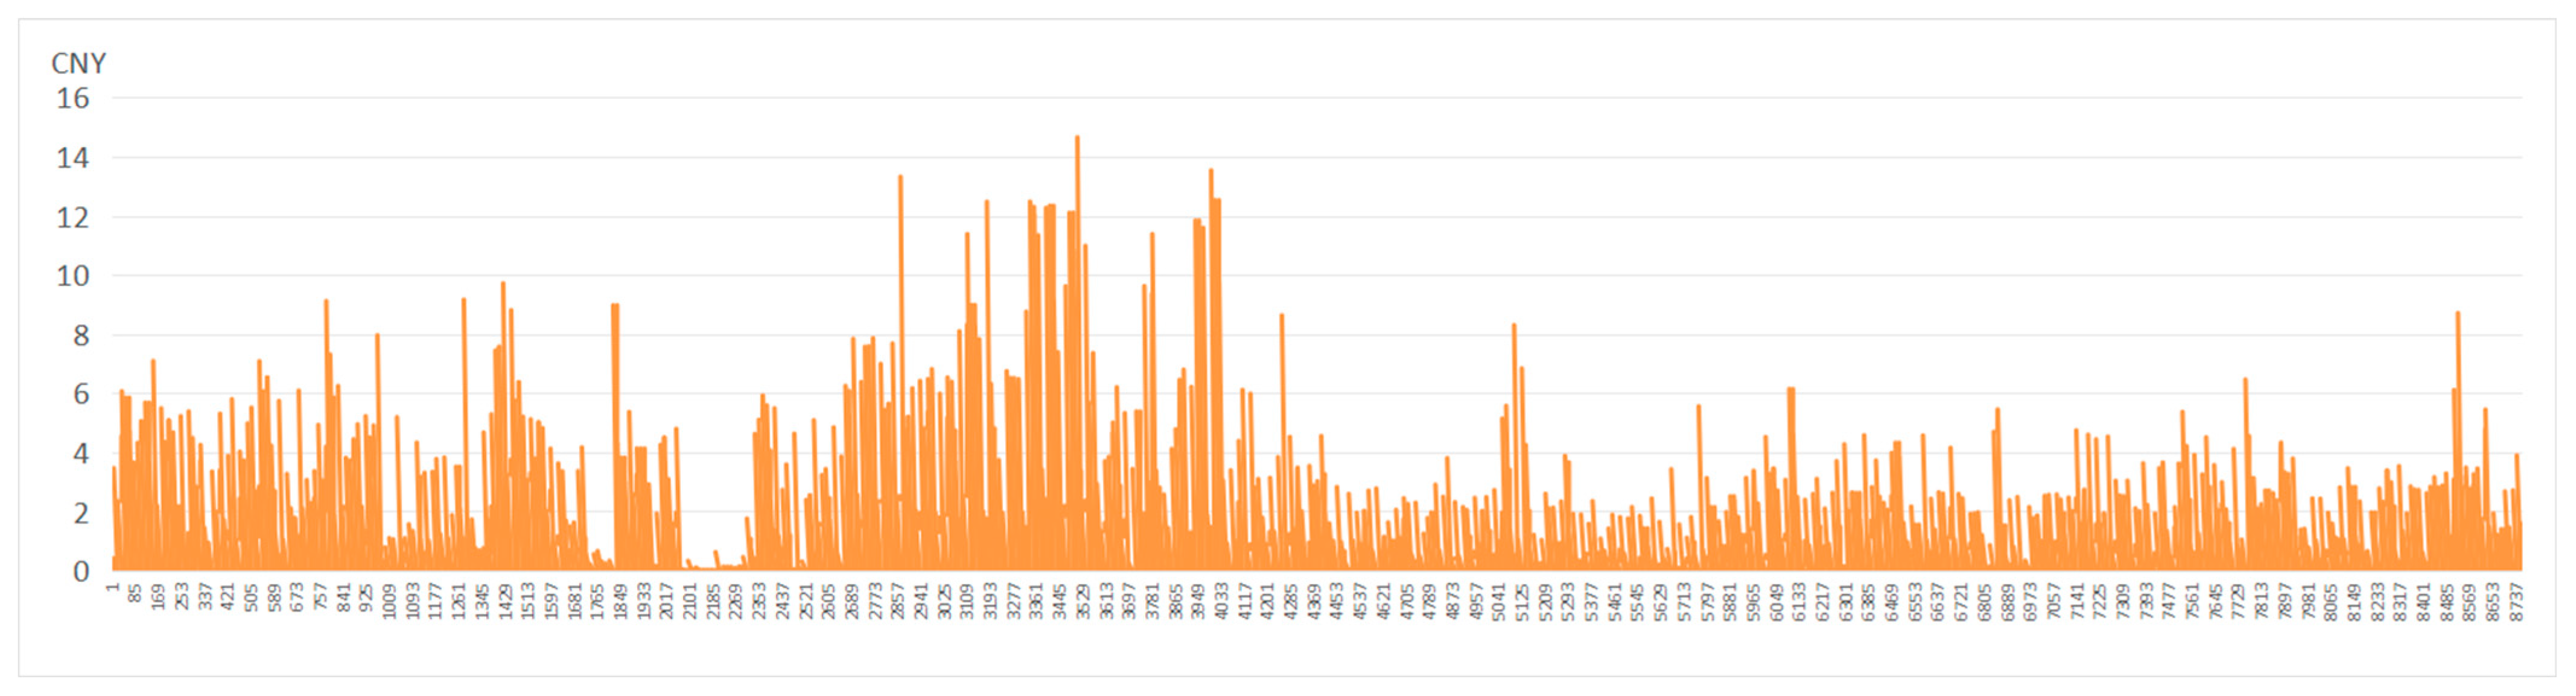
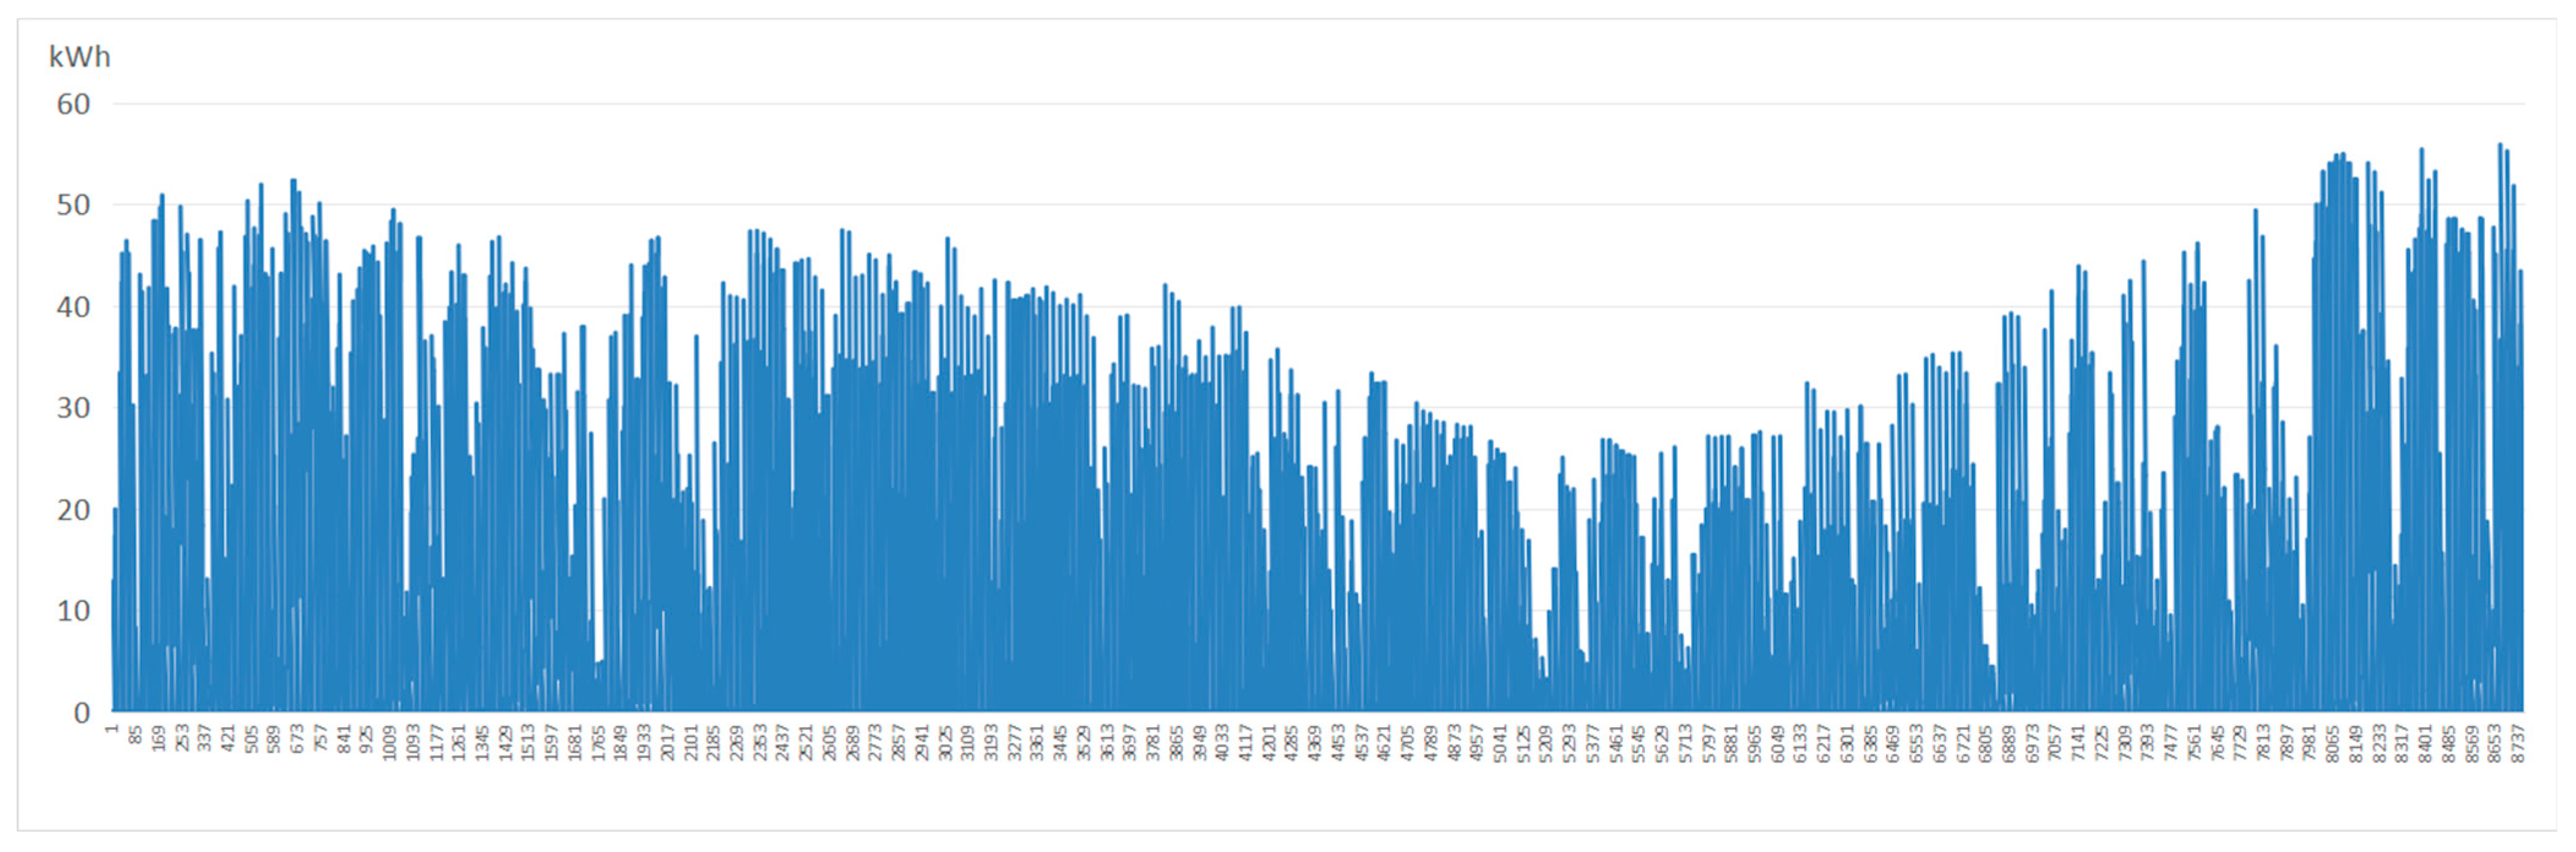
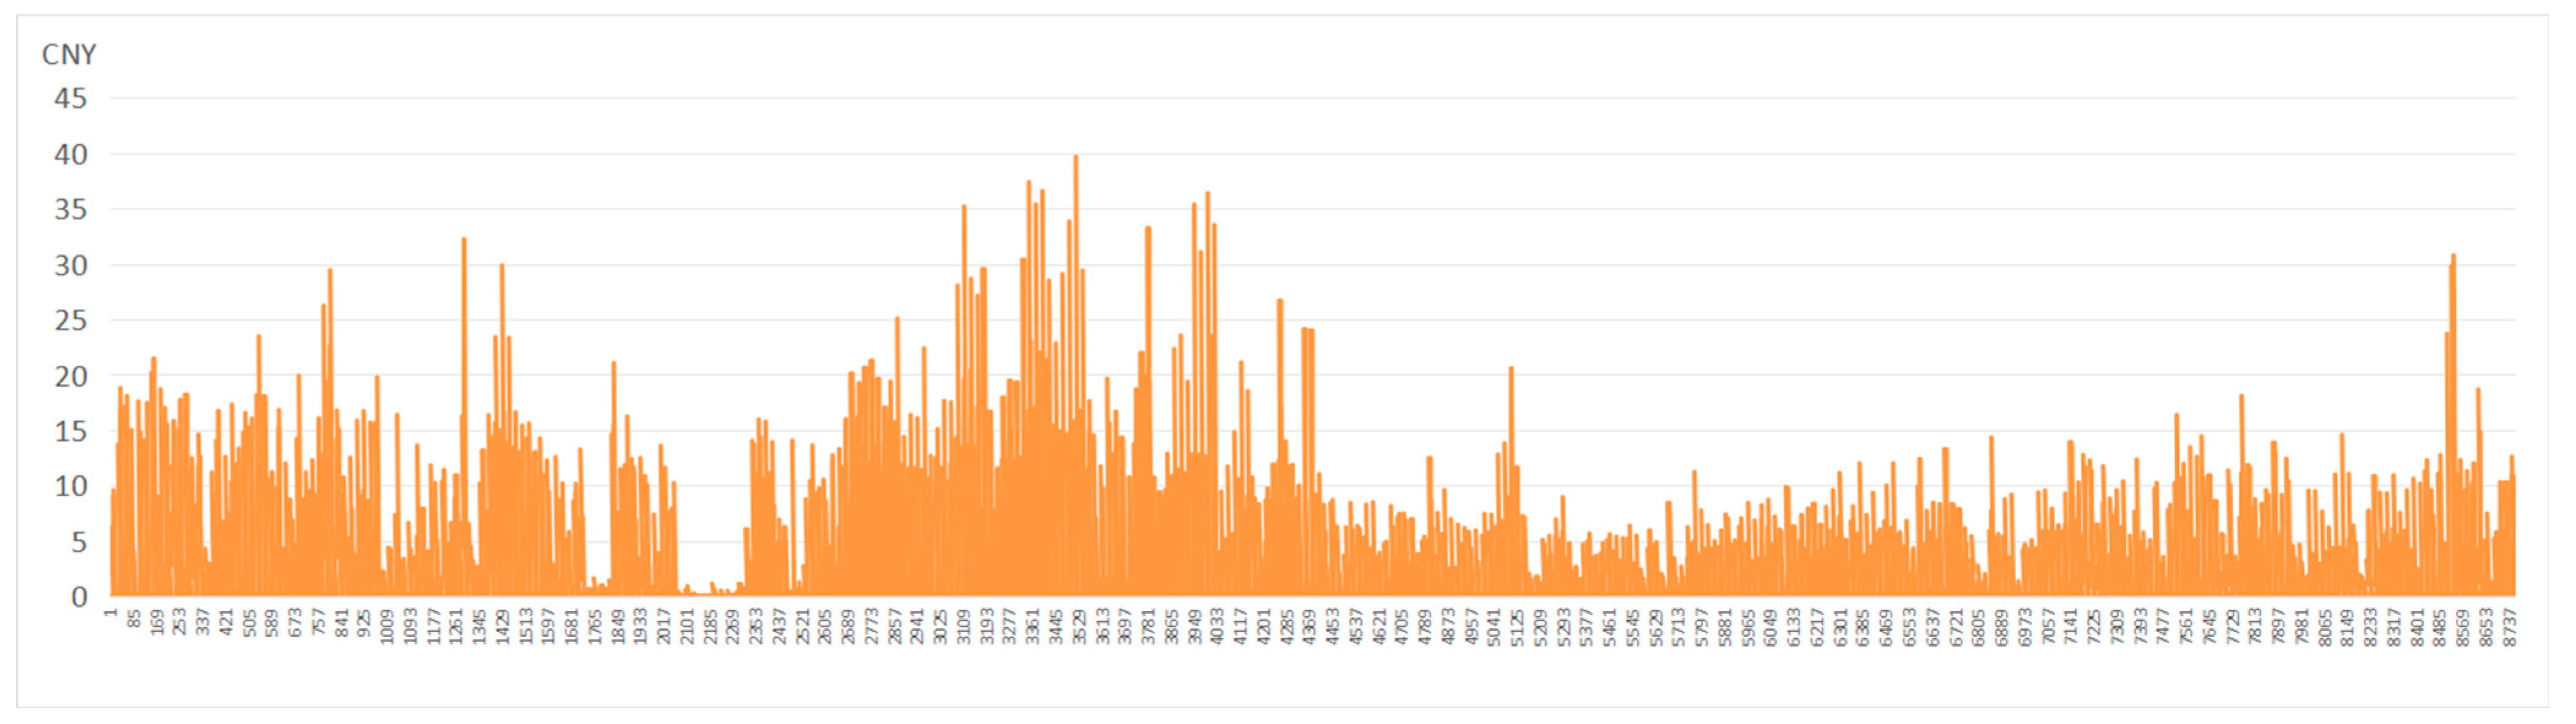
The results show that the roof PV configuration with a tilt angle of 30° and an orientation of due south yielded the highest annual electricity generation (approximately 18,893 kWh), and the annual income was CNY 4669.7, as illustrated in
Figure 5. As shown in
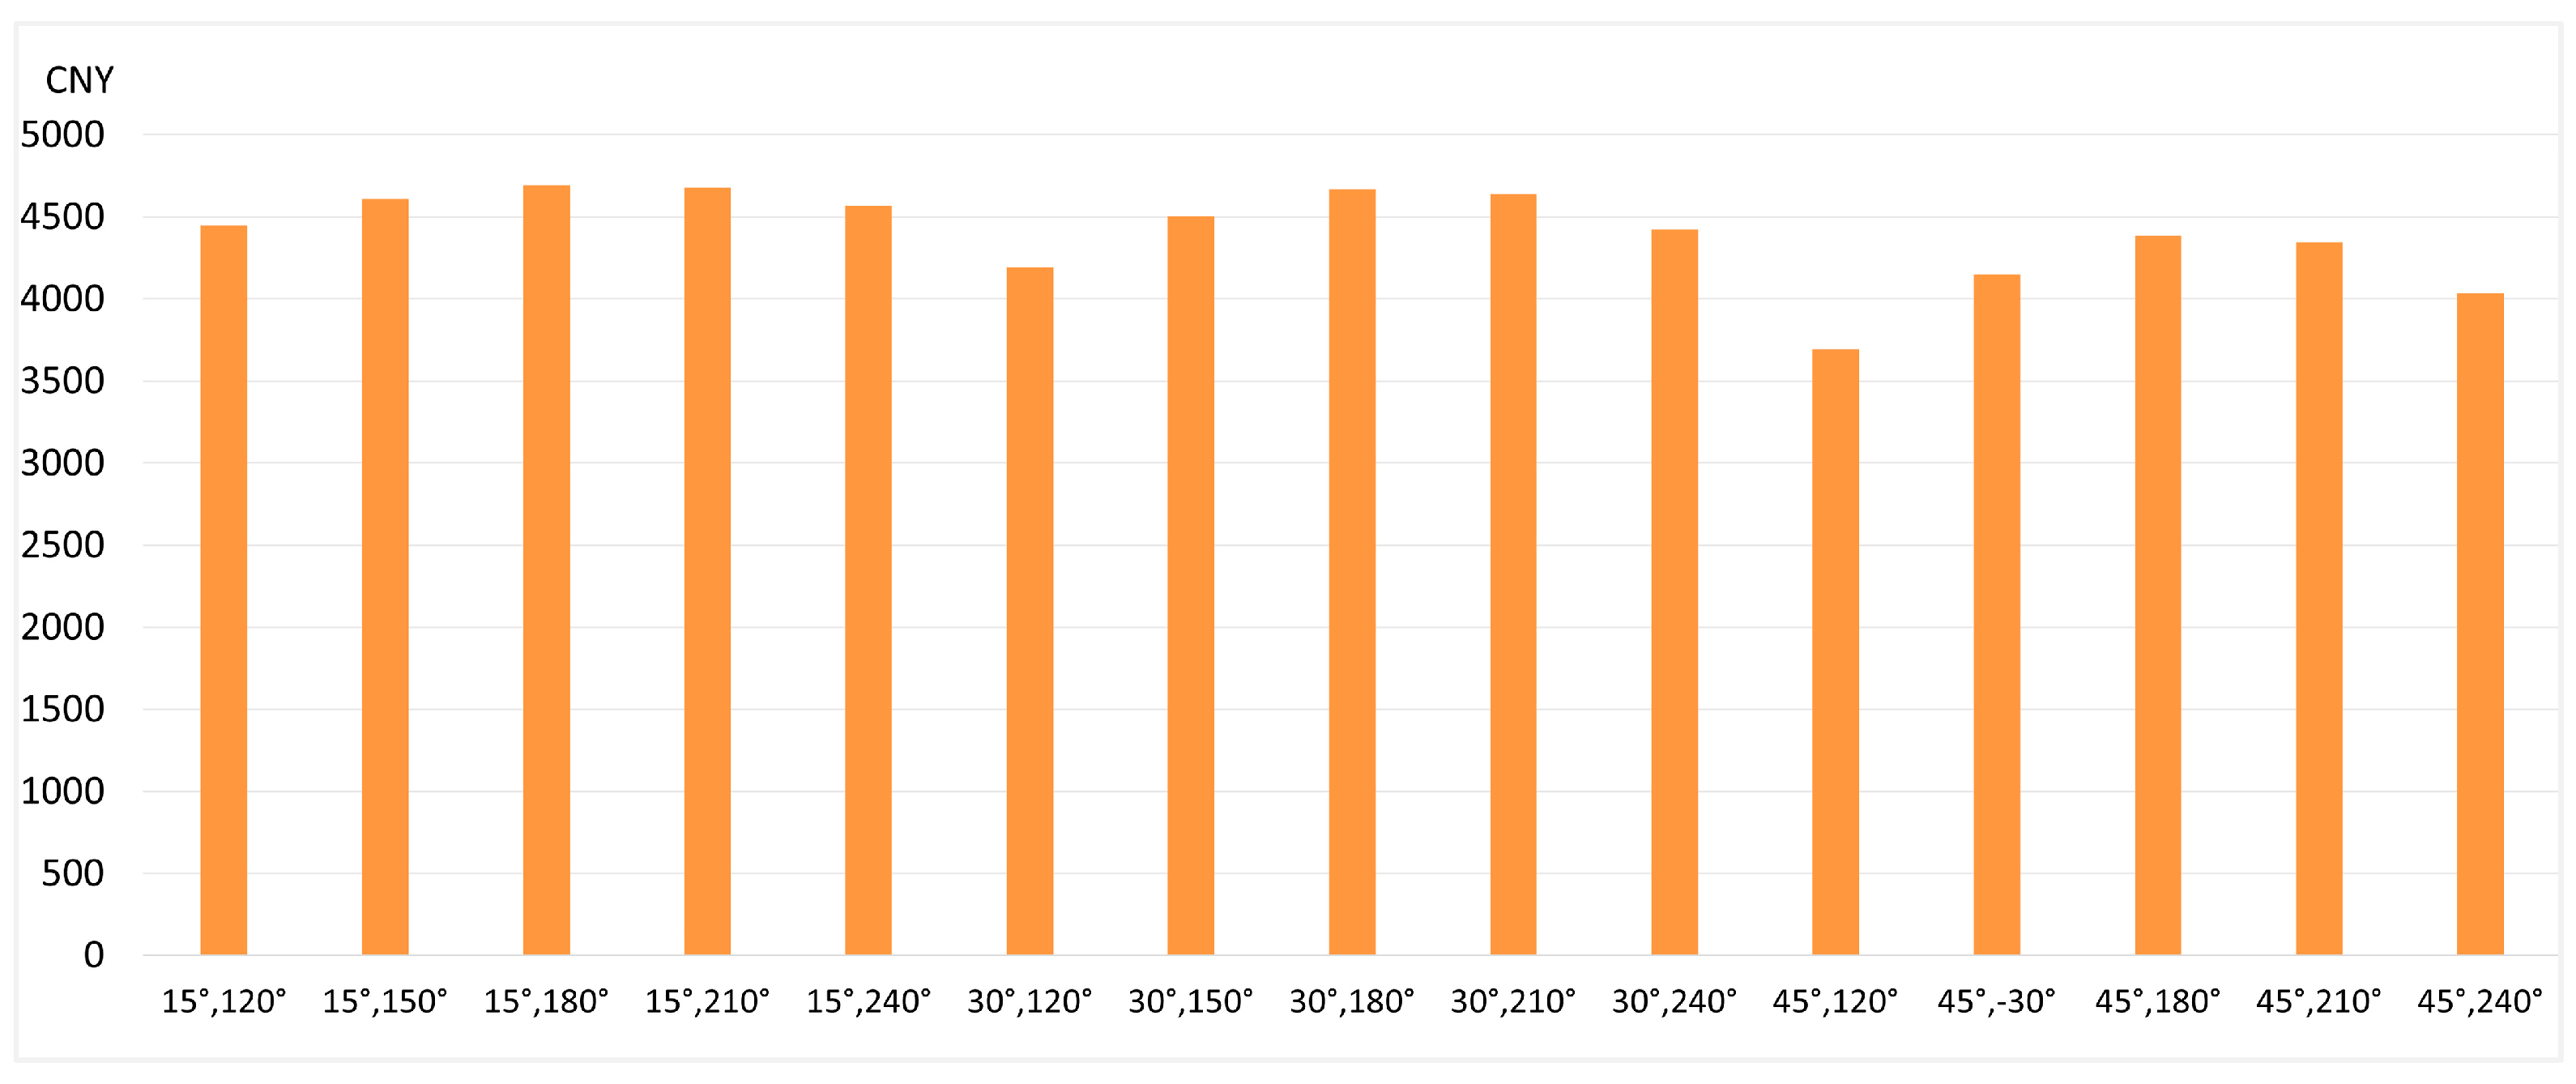
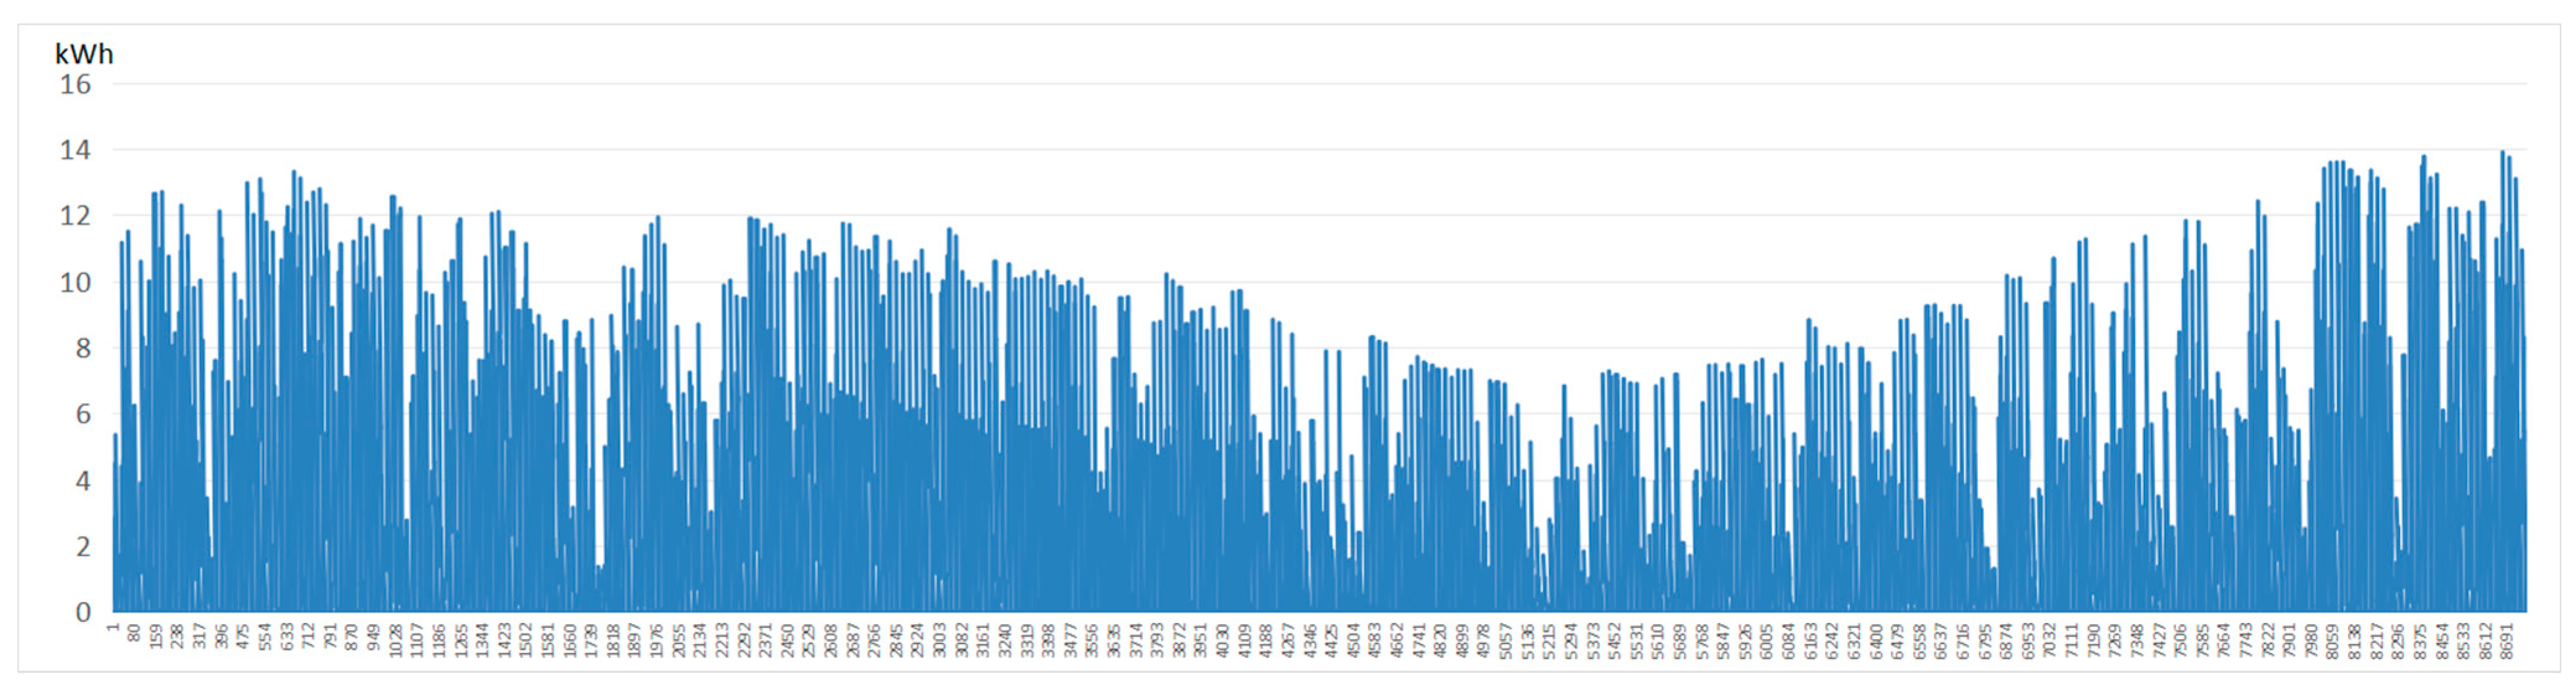
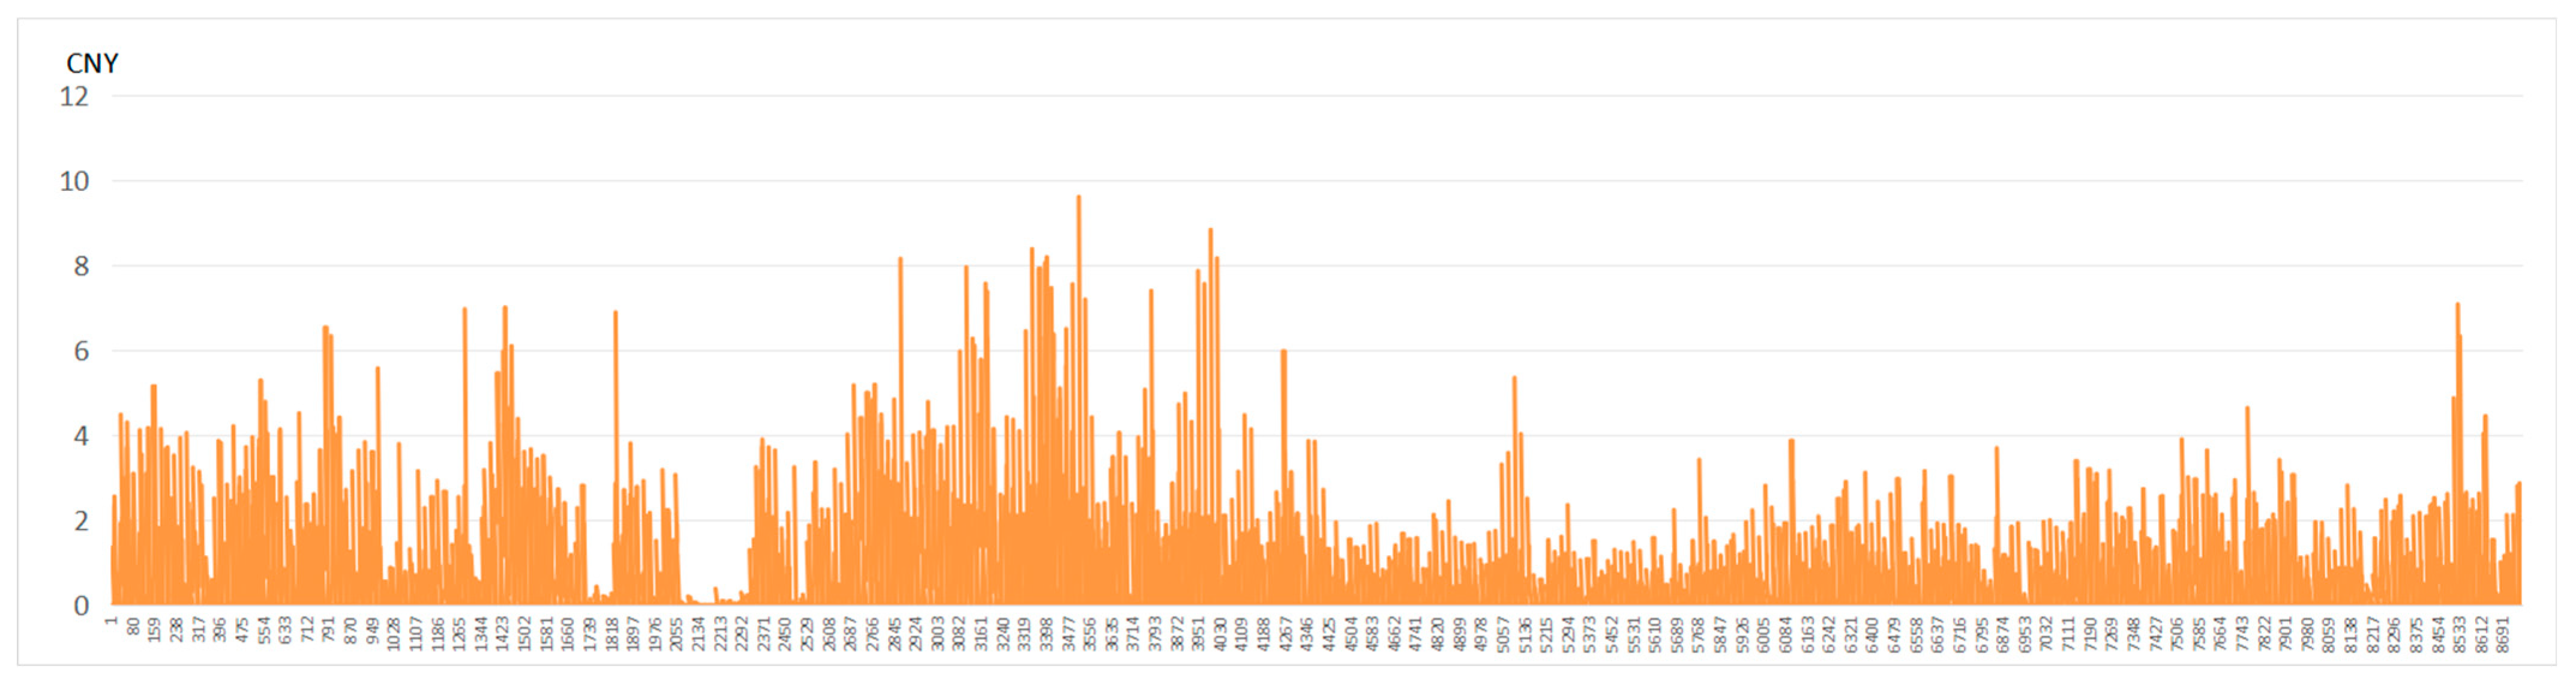
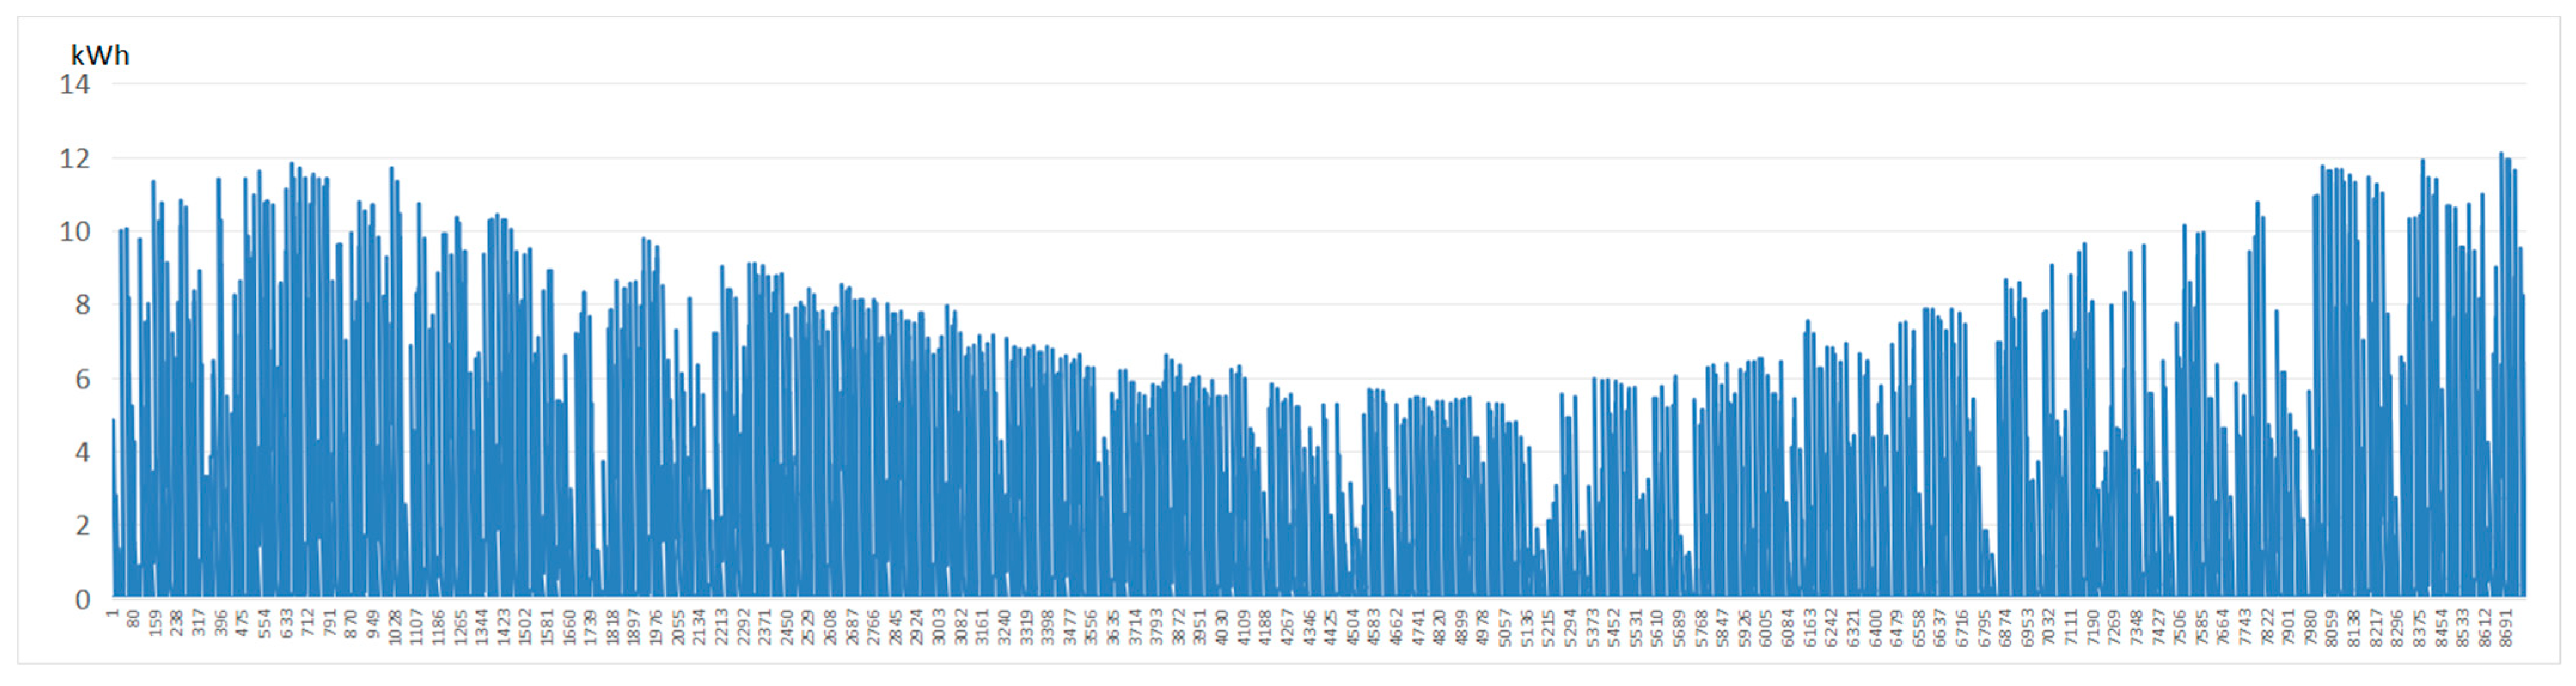
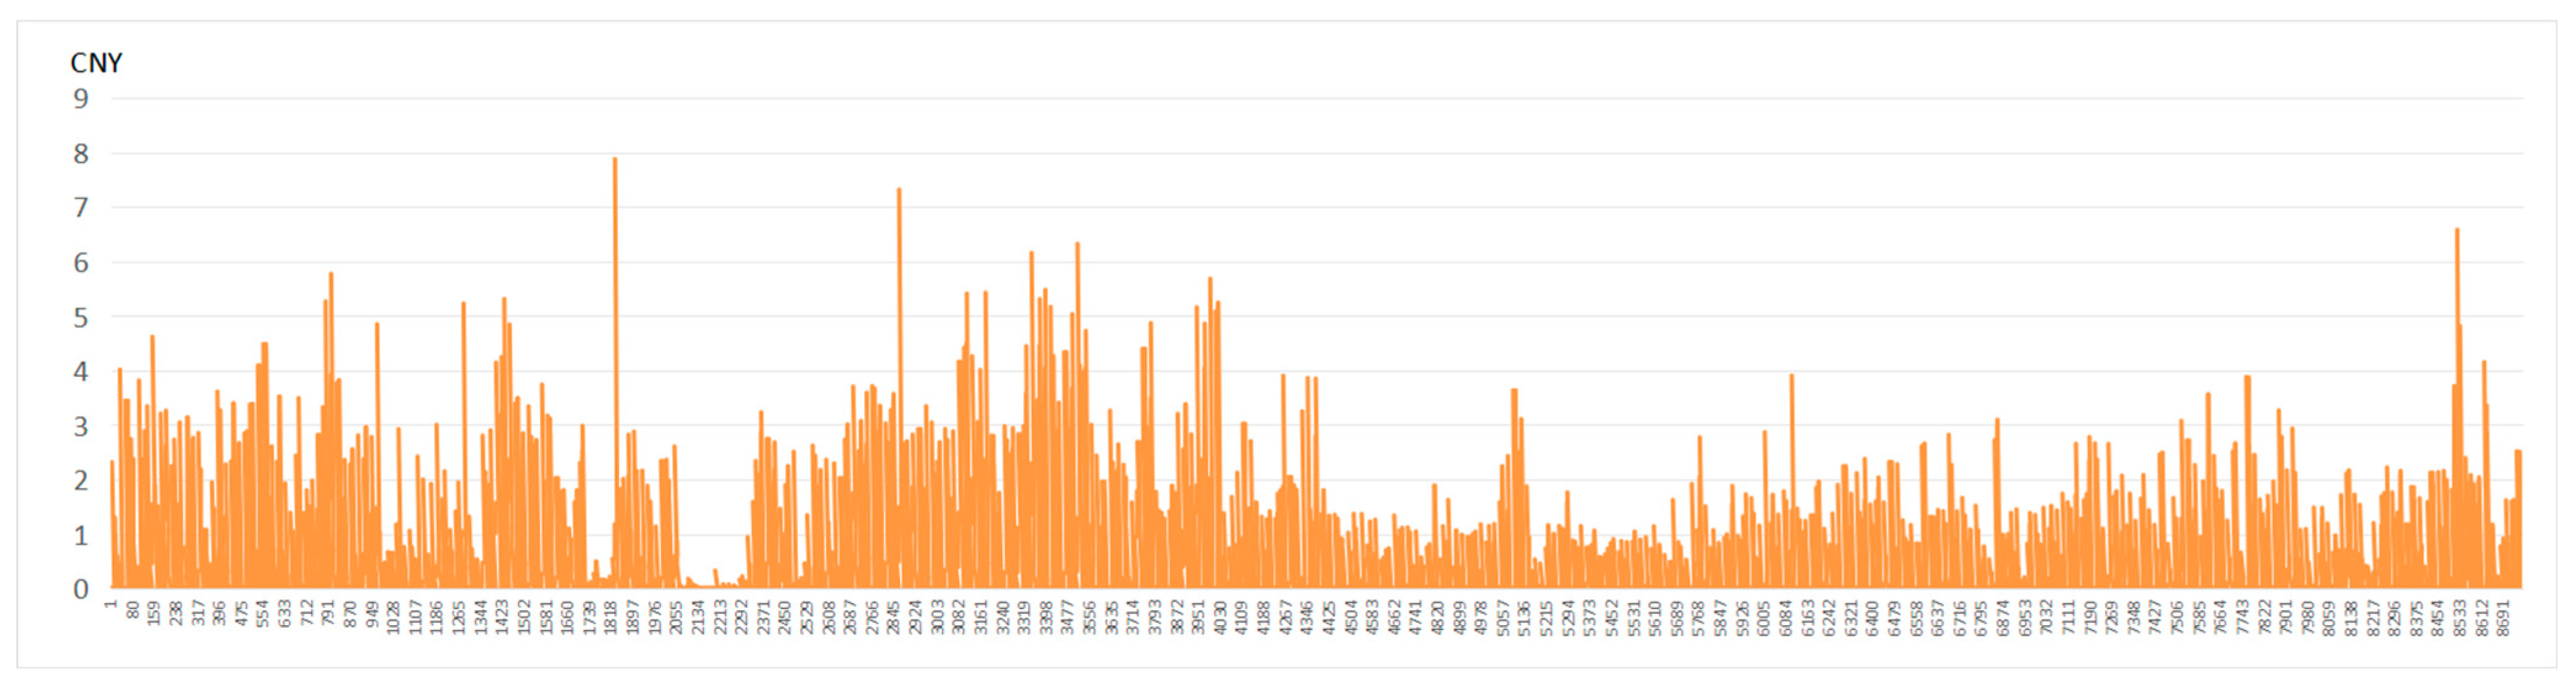
Figure 6, the roof PV configuration with a tilt angle of 15° and an orientation of due south provided the highest economic return, achieving an annual revenue of CNY 4692.2 per PV panel and the annual power generation was 18,676 kWh. Detailed hourly power generation across the 8760 h period of the highest electricity generation and the highest economic return conditions are separately presented in
Figure 7 and
Figure 9, and corresponding hourly revenue are shown in
Figure 8 and
Figure 10.
Figure 5.
The annual electricity generation of the rooftop PV system of 15 tilt-azimuth combinations.
Figure 5.
The annual electricity generation of the rooftop PV system of 15 tilt-azimuth combinations.
Figure 6.
The annual electricity generation revenue of the rooftop PV system of 15 tilt-azimuth combinations.
Figure 6.
The annual electricity generation revenue of the rooftop PV system of 15 tilt-azimuth combinations.
Figure 7.
Hourly rooftop PV power generation of the optimal combination with the highest electricity generation (30° tilt and 180° azimuth).
Figure 7.
Hourly rooftop PV power generation of the optimal combination with the highest electricity generation (30° tilt and 180° azimuth).
Figure 8.
Hourly rooftop PV revenue of the optimal combination with the highest electricity generation (30° tilt and 180° azimuth).
Figure 8.
Hourly rooftop PV revenue of the optimal combination with the highest electricity generation (30° tilt and 180° azimuth).
Figure 9.
Hourly rooftop PV power generation of the optimal combination with the highest economic return (15° tilt and 180° azimuth).
Figure 9.
Hourly rooftop PV power generation of the optimal combination with the highest economic return (15° tilt and 180° azimuth).
Figure 10.
Hourly rooftop PV revenue of the optimal combination with the highest economic return (15° tilt and 180° azimuth).
Figure 10.
Hourly rooftop PV revenue of the optimal combination with the highest economic return (15° tilt and 180° azimuth).
Table 1 presents the electricity revenue per kWh of rooftop PV at different rooftop PV tilt and azimuth angle settings. It can be seen that the unit electricity revenue was generally higher for each combination at a 15° tilt angle, which reflects the fact that it received the strongest solar energy and generated more electricity under the same conditions. This was followed by 30° and finally 45°. In addition, the unit electricity revenue increased with azimuth angle when the azimuth angle was greater than 150°, which implies that west-facing facade PV is more economical because its generation peaks during the peak electricity price hours.
4.2. Power Generation and Revenue from Building Facades
As described in
Section 3.1, this study adopted a simplified standard building model with dimensions of 58 m in length, 12 m in width, and 28 m in height. The window-to-wall ratio was set at 0.25 for the south and north facades, and 0.1 for the east and west facades. The PV module used in the simulation was the Canadian Solar CS5P-220M (220 W) solar panel, with dimensions of 1.602 m in length and 1.061 m in width.
In order to evaluate the influence of installation angle on PV performance across different facades, this study selected façade-mounting tilt angles (i.e., the angle between the PV panel and the vertical wall surface) ranging from 0° to 60°, in 5° increments. This range captures both the case of panels fully flush with the wall (0°) and configurations with moderate outward tilt (up to 60°), which can enhance incident solar radiation and facilitate rainwater self-cleaning. The 5° interval provided sufficient granularity to identify the performance trend and optimal angles without incurring excessive computational cost.
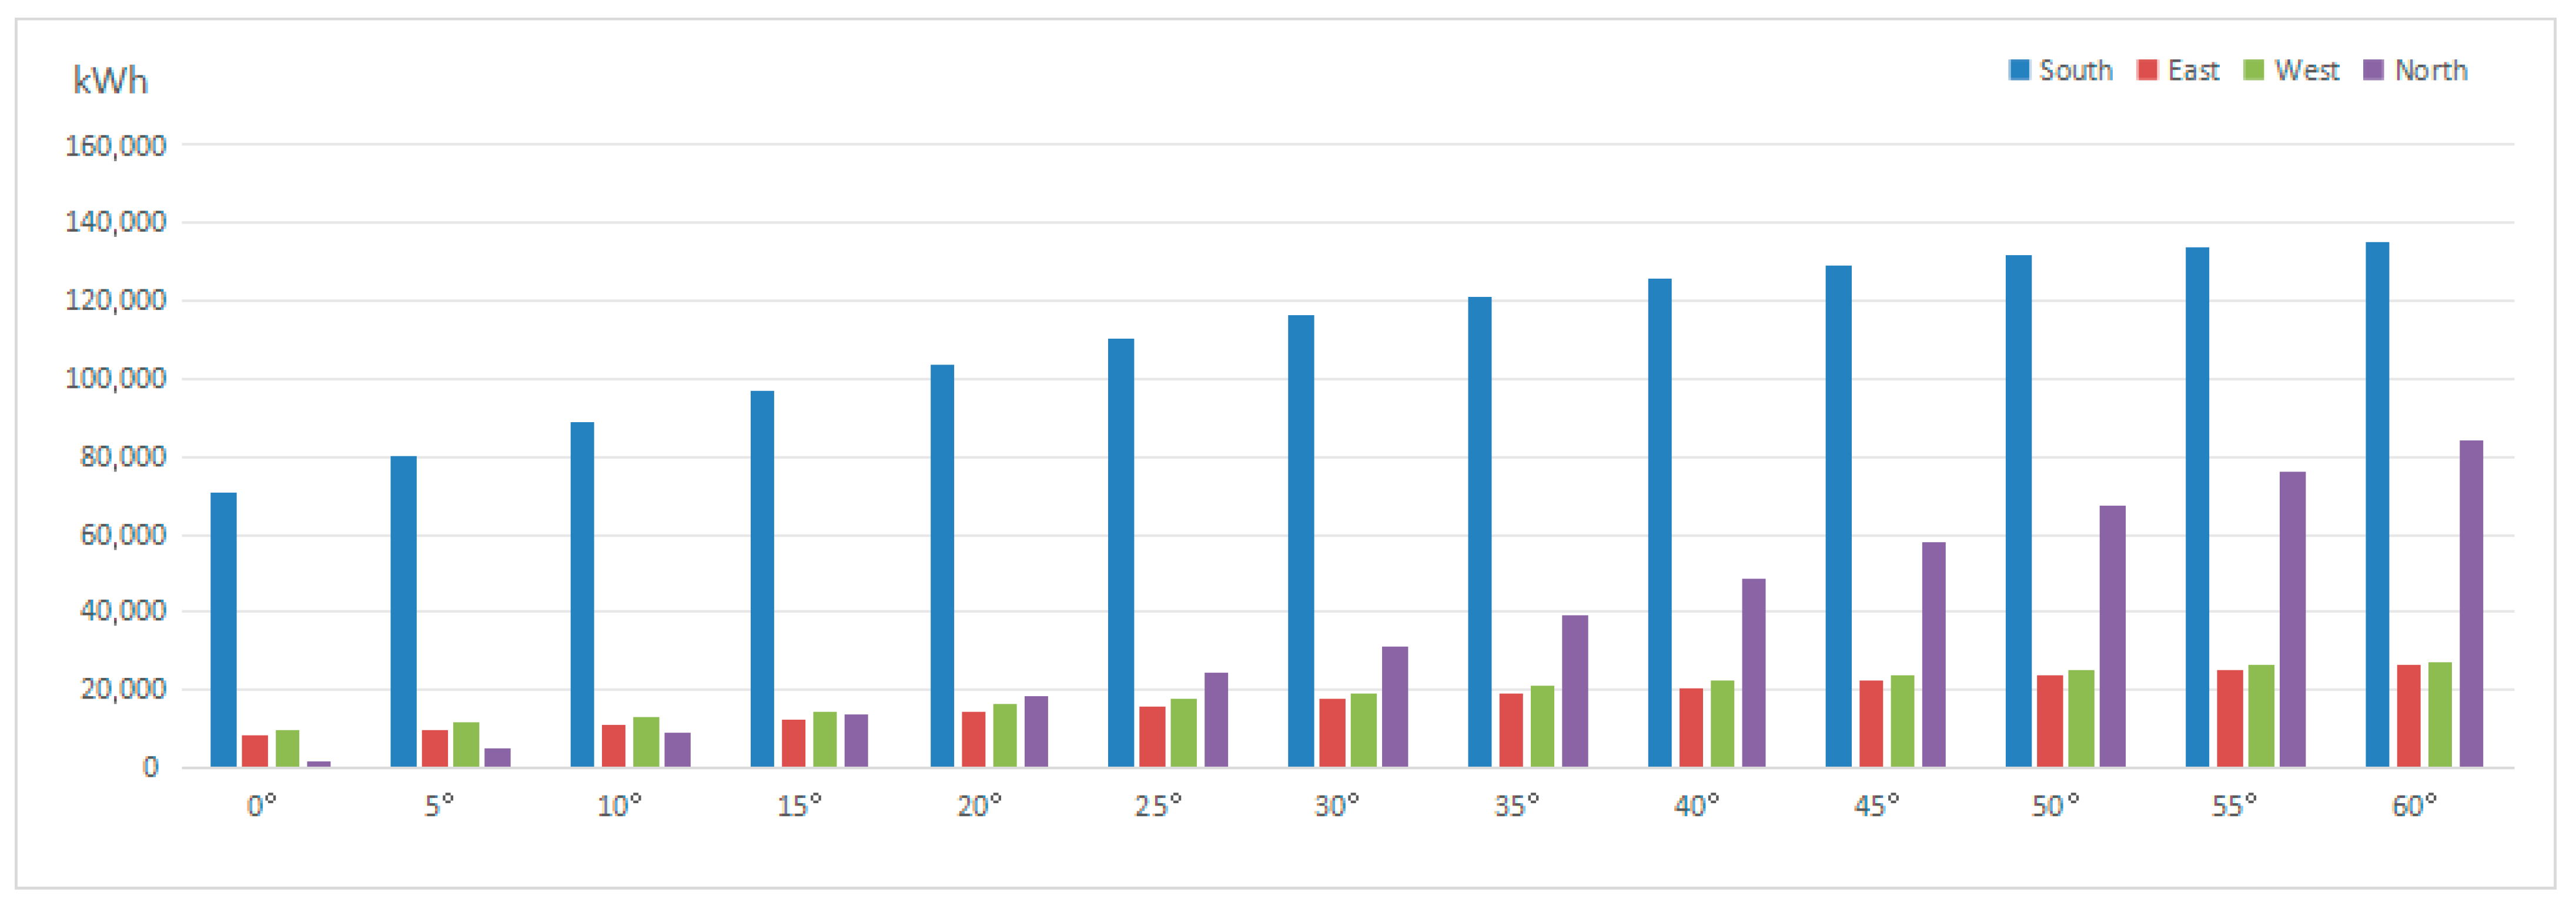
Due to the larger facade area of building faces facing north and south, these surfaces offered a more usable area for PV installation, accommodating up to 716 panels. In contrast, the lower area of the east and west facades limited the available PV area to only 177 panels. As a result, the south-facing facade achieved the highest generation. The power generation of the east facing and west facing facades was similar and relatively stable. It is worth noting that the PV power generation of the north facing facade significantly increased with the increase of the tilt angle. When the tilt angle was less than 10°, the power generation was the lowest. When the inclination angle was greater than 20°, it exceeded that of the east and west walls.
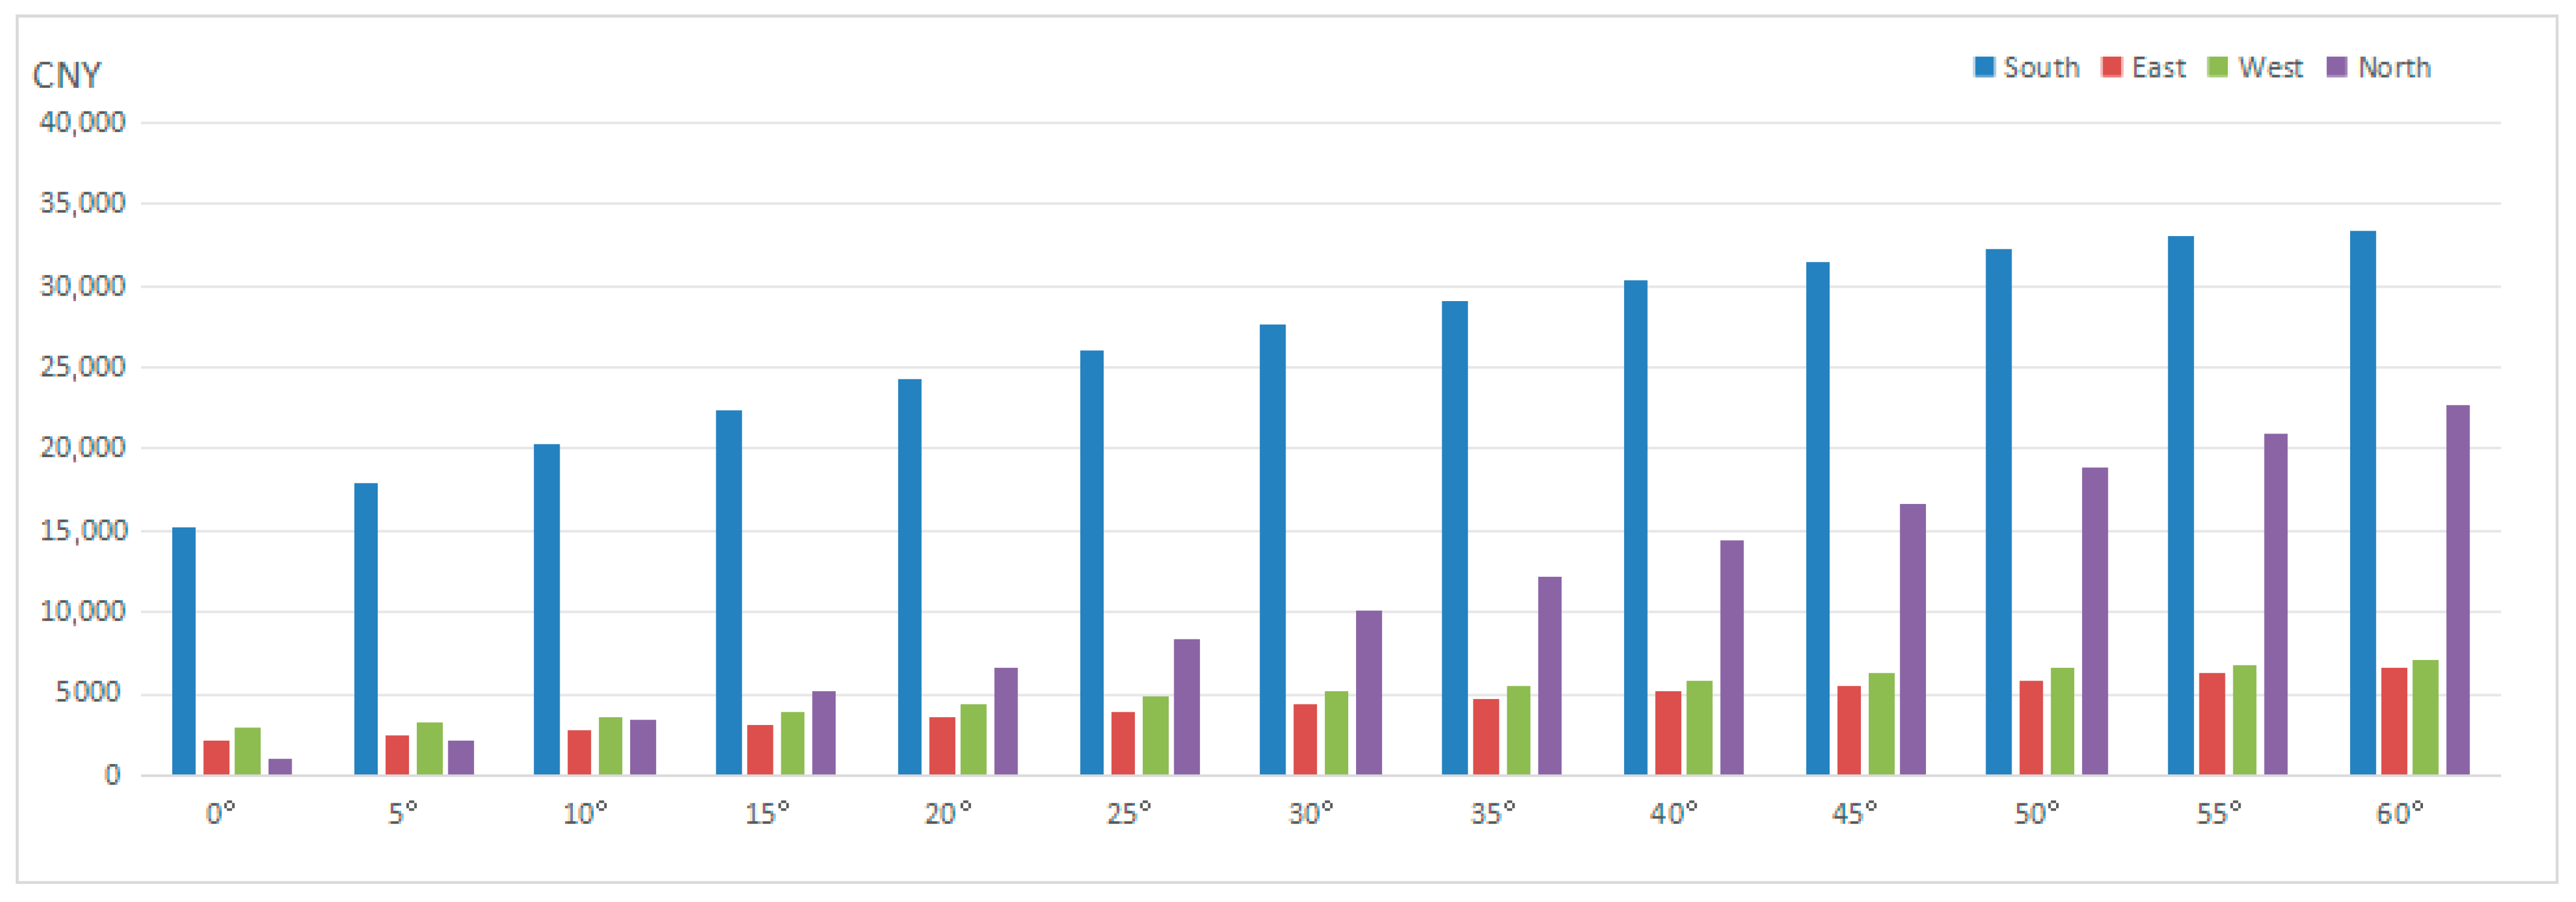
Simulation results also indicate that with a vertical mounting angle (i.e., 0° between the panel and the wall), power generation was at its lowest. As the tilt angle increased, generation improved, reaching its peak at a 60° tilt, as shown in
Figure 11. Corresponding revenue from electricity sales followed the same trend, as seen in
Figure 12. In addition, the simulated electricity generation from façade-integrated PV systems was approximately 5 to 15 times higher (ranging from 91,275 kWh to 273,320 kWh) than that of the rooftop-only configuration under optimal conditions. This highlights the significant potential of façade-mounted PV, which should not be overlooked in building-scale PV planning and design.
In summary, assuming no complex shading or orientation constraints, PV panels mounted on building facades at a 60° angle to the wall surface yielded the highest annual power output and revenue. Detailed hourly generation and income data for each facade are presented in
Figure 13,
Figure 14,
Figure 15,
Figure 16,
Figure 17,
Figure 18,
Figure 19 and
Figure 20.
5. Discussion and Conclusions
In this study, a high-precision building distributed PV power generation and integrated benefit assessment model with meter-scale spatial resolution and 8760 h temporal resolution was constructed. The model integrated the dynamic changes of solar azimuth and altitude angle, as well as the spatial and temporal fluctuation characteristics of real-time market tariffs of electricity, while integrating the influence mechanism of meteorological parameters on the efficiency of PV modules, by coupling the mechanism of solar radiation transmission with the geometrical characteristics of the building. Then, we systematically quantified the power generation characteristics and economic returns of building roof and facade PVs under different tilt and azimuth angles and revealed the law of spatial heterogeneity in the optimal allocation of building PVs. The research results not only provide a scientific basis for the refined design of building PV systems, but also provide a quantifiable technical and economic assessment tool for promoting the low-carbon transformation of building energy systems.
The model developed in this study used Wuhan as a representative sample to validate its effectiveness in mid-latitude, high-density urban environments characterized by significant seasonal climate variability. Due to its high spatial resolution and modular structure, the model demonstrates adaptability across different urban contexts, as variations such as building density, solar resource distribution, and electricity pricing mechanisms can be flexibly addressed through adjustments to input parameters.
It is important to note that the objective of this study was to determine optimal installation orientations for building-integrated photovoltaics (BIPV). To this end, we incorporated 8760 hourly real-time electricity market prices as incentive signals, aiming to explore the impact of pricing mechanisms on the annual economic return of BIPV systems. In this study, electricity prices at each hour were assumed to be fixed market clearing prices.
The results indicate that TOU pricing significantly affects rooftop PV layout strategies, while its impact on façade PV configurations is relatively minor. For rooftop PV, the highest revenue configuration was achieved with a 15° tilt angle, while the highest power generation occurred at a 30° tilt angle (both with an azimuth angle of 180°). South- and north-facing façade PV systems exhibited greater sensitivity to tilt angles in terms of both energy yield and economic return, whereas east- and west-facing façades showed relatively stable performance. Additionally, the study revealed that façade PV had substantial power generation potential—approximately 5 to 15 times that of rooftop PV.
Conventional research on BIPV layouts primarily focuses on physical factors such as solar irradiance [
40], building envelope characteristics (e.g., window-to-wall ratio) [
41], and geometric form [
42], with optimization objectives centered on maximizing annual energy output. However, these studies often overlook the techno-economic feasibility of façade PV. In contrast, our study simultaneously considered rooftop PV, façade PV, and real-time electricity market pricing. The findings reveal that energy-maximization strategies alone may result in suboptimal economic outcomes, and we propose a more comprehensive and economically responsive BIPV planning framework.
To isolate the economic performance of various building-side PV deployment strategies, grid-side operational constraints and distributed energy dispatch limitations were not considered in the current model. This simplification is justified as follows: first, according to relevant policies from the National Energy Administration and the National Development and Reform Commission [
43,
44], China encourages distributed PV systems to connect locally to the grid and operate under either full feed-in or “self-consumption with surplus grid export” modes. Grid operators are mandated to prioritize the integration and full purchase of distributed generation. Second, the system investigated in this study was a single-energy-form BIPV system, without the inclusion of energy storage, demand-side response, or multi-energy integration. Regional or city-scale energy dispatch was also beyond the study’s scope. Therefore, grid operational constraints were excluded from the current modeling framework.
The findings offer clear practical implications for urban planners and policymakers. By developing a BIPV optimization model driven by TOU pricing mechanisms, we demonstrated that coordinated rooftop–façade deployment can substantially enhance solar utilization, particularly in high-density urban areas with limited rooftop availability. Moreover, the TOU pricing structure directly influences PV layout strategies, indicating that market mechanisms can partially substitute for traditional financial subsidies in guiding PV deployment. The high-resolution nature of the model also provides a quantitative tool for assessing urban-scale PV potential and resource optimization, supporting the formulation of zoning policies, incentive scheme design, and green building retrofit strategies. Overall, the study offers both technical support and theoretical guidance for planning distributed renewable energy systems in the context of China’s “dual carbon” goals.
In future research, we plan to investigate the feasibility of incorporating battery storage into BIPV systems. Specifically, we aim to explore adaptive optimization strategies across different building types and climate zones, and to analyze energy storage scheduling under dynamic pricing regimes. These efforts will help assess the role of battery storage in facilitating on-site consumption of PV electricity and advancing the large-scale implementation of BIPV-storage systems in practical engineering contexts.
Additionally, we intend to introduce more complex urban spatial parameters to enhance the realism and adaptability of PV deployment strategies. This includes constructing 3D city models and applying shading analysis algorithms to quantify the effects of spatial occlusion—such as between buildings or between buildings and vegetation—on solar energy availability. We also plan to consider urban microclimate factors, including the impact of urban heat islands on PV module temperature and how wind conditions affect cooling and dust accumulation, which may cause fluctuations in PV efficiency. These enhancements will contribute to developing a more realistic and robust PV assessment framework, bridging the gap between theoretical modeling and practical implementation in urban environments.


