Article

Optimization of Mining Sequence for Ion-Adsorbed Rare Earth Mining Districts Incorporating Environmental Costs

1
School of Economics and Management, Jiangxi University of Science and Technology, Ganzhou 341000, China
2
School of Management, University of Science and Technology of China, Hefei 230026, China
*
Author to whom correspondence should be addressed.
Sustainability 2025, 17(15), 6871; https://doi.org/10.3390/su17156871
Submission received: 20 May 2025 / Revised: 12 July 2025 / Accepted: 21 July 2025 / Published: 29 July 2025

Abstract

The mining sequence of ionic rare earth mineral mining districts is related to the effective utilization of rare earth mineral resources and the protection of ecological environment. This study establishes an optimization model for the mining sequence of ion-adsorption rare earth mining districts that incorporates environmental costs, using the net present value (NPV) of the mining district and the net present value of environmental costs (CE) as objective functions. The model is applied to optimize the mining sequence of Mining District L. The results demonstrate that (1) Four algorithms, namely NSGA-II, NSGA-III, IBEA, and MOEA/D, were selected for comparison. The analysis based on the distribution of solutions, hypervolume values (HV), and computational time revealed that the IBEA exhibited superior performance. (2) The IBEA was employed to solve the multi-objective optimization problem, yielding a set of 30 optimal solutions. Different NPVs corresponded to different CE values, with the CE value increasing correspondingly as the NPV increased. (3) The weighted method was employed to transform the multi-objective optimization problem into a single-objective formulation. Using a genetic algorithm (GA), the optimal solution yielded a decision variable sequence for mining order as [2, 5, 8, 4, 1, 9, 6, 7, 3, 10, 11], with the net present value (NPV) of mining district profits reaching CNY 76,640.65 million and the environmental cost NPV amounting to CNY 19,469.18 million. Compared with the mining sequence optimization scheme that did not consider CE, although the NPV decreased by CNY 3.3266 million, the CE was reduced by CNY 10.6993 million. The mining sequence optimization model with environmental costs constructed in this paper provides a scientific decision-making basis for mining enterprises to consider the mining sequence in mining districts, minimize the damage to the ecological environment, and promote the coordinated progress of resource development and sustainable development.

1. Introduction

Ion-adsorption rare earths (REs) represent a vital strategic mineral resource, containing medium and heavy rare earth elements such as europium (Eu), terbium (Tb), dysprosium (Dy), ytterbium (Yb), lutetium (Lu), and yttrium (Y). These elements are indispensable functional materials for the development of new materials and high-tech applications, and they play a crucial role in supporting the growth of high-tech industries [1,2]. The mining sequence of ion-adsorption rare earth mining districts is not only critical for the effective utilization of rare earth resources but also directly affects production efficiency, cost control, and environmental protection within the mining district [3]. A rational mining sequence can optimize the overall resource utilization rate while ensuring safe production and minimizing environmental degradation.
The existing literature on mining planning primarily focuses on the extraction sequence and volume determination of individual blocks within a single mine. These studies employ mathematical programming methods to optimize the overall mining plan. Optimization is generally based on technical and economic parameters, which serve as comprehensive indicators for optimization. Various modeling and optimization algorithms have been extensively investigated to design the overall optimization of mining plans. Linear programming [4,5,6], mixed-integer programming [7,8,9], multi-objective programming [10,11], and network planning [12,13] are commonly used methods to establish long-term production planning models for mining enterprises.
The mining planning of ion-adsorption rare earth mining districts often neglects environmental costs and fails to implement necessary environmental protection measures to reduce pollution during the extraction process, resulting in concurrent resource wastage and environmental degradation. Therefore, it is essential to incorporate environmental costs into the optimization of mining sequences, providing theoretical support and practical guidance for the green extraction of ion-adsorption rare earth minerals and environmental protection.
In this study, we analyze the mining characteristics, environmental impacts, and associated costs of ion-adsorption rare earth minerals and establish an optimization model for the mining sequence that considers environmental costs. The model integrates economic benefits and environmental costs as objective functions and is applied to the ion-adsorption rare earth mining deposit areas in southern Jiangxi Province, yielding an environmentally cost-conscious mining sequence scheme. This scheme, with the sustainable development of ion-adsorption rare earth resources as its core objective, integrates environmental costs into the extraction-sequencing model of ion-adsorption rare earth mining districts. Rather than pursuing profit maximization alone, it emphasizes improving comprehensive resource-utilization efficiency and explicitly accounts for environmental expenditures during mining operations, thereby mitigating ecological degradation and resource waste and achieving an organic unification of economic and environmental benefits.

2. Construction of the Mining Sequence Optimization Model

2.1. Principles and Assumptions of Model Construction

To overcome the limitations of heap leaching technology and ensure that the development and extraction of ionic rare earths meet environmentally friendly standards, research institutions including the Ganzhou Nonferrous Metallurgy Research Institute have developed the in situ leaching process. This innovative technique involves the exchange leaching of rare earth ions adsorbed in heterogeneous ore bodies under natural burial conditions using leaching solutions, thereby achieving efficient recovery of rare earth elements. Through sustained technological breakthroughs, an innovative mining method utilizing (NH4)2SO4 solution-based in situ leaching coupled with NH4HCO3 precipitation has been established for ion-adsorption rare earth deposits [14].
Based on the overall production layout of mining enterprises and the actual production conditions of individual mines, the fundamental principles for constructing the optimization model of the mining plan for ion-adsorption rare earth mining districts are established as follows: meeting the national requirements for total mining control indicators [15], basing on the actual resource conditions and mining technical capabilities of the mines, arranging production reasonably in accordance with the achievable production capacity, and fully recovering the mineral resources. Meanwhile, the mining sequence of each mine is optimized to minimize environmental costs, thereby maximizing economic benefits. When constructing the model, the following assumptions are considered:
Assumption 1.
The mines within the mineral deposit area are exploited in sequential order, meaning that one mine commences production immediately following the conclusion of the service period of the preceding mine. Prior to the commencement of mining operations, the necessary infrastructure for the initial mining block, including liquid collection tunnels, liquid collection ditches, and liquid injection holes, has been fully established.
Assumption 2.
To protect the ecological environment of the mineral deposit area, the national government encourages the adoption of in situ leaching technology. All mines within the area utilize in situ leaching for the extraction process.
Assumption 3.
Under the constraints of the total control indicators for ion-adsorption rare earth mining, the annual mining plan volume for the mineral area remains constant. The annual production costs and market prices of the products for each mine are also fixed and unchanging.
Assumption 4.
In accordance with the planned service period of the mines, wastewater treatment is required throughout the entire production period. Each mine incurs water pollution control costs starting from the first year of production until the end of the service period.
Assumption 5.
Based on the land reclamation plan, land reclamation can be carried out concurrently with mining activities. Each mine begins to incur land reclamation costs from the third year of production until the entire reclamation is completed two years after the service period ends.
Assumption 6.
Following the completion of land reclamation, vegetation maintenance is conducted. The vegetation maintenance period for each mine lasts for one year.
In the optimization problem of mining sequence considering environmental costs, the decision variable is the mining sequence, with a total number of decision variables denoted as D. The mining sequence is an integer variable, and W = {w1, w2, w3, …, we, …, wN} represents the sequence of mining order variables, where N is the total number of mines, and we is the mining order of the e-th mine. W is a permutation of the integers {1, 2, …, N}. For instance, if W = {2, 1, 4, 5, 3}, the corresponding mining sequence is the 2nd mine → the 1st mine → the 4th mine → the 5th mine → the 3rd mine.

2.2. Objective Functions

2.2.1. Economic Benefit Objective

The evaluation of economic benefits in mining districts typically aims to maximize economic profits or output value. The NPV serves as the key indicator for assessing production efficiency. When NPV ≥ 0, the project is economically viable; if NPV < 0, it becomes unfeasible. In multi-option comparisons, projects with higher NPVs are generally considered superior (assuming similar investment scales across options). The formula for calculating NPV is as follows:
N P V = t = 0 n C I C O t 1 + i 0 t
where
  • CIt is the cash inflow in year t;
  • COt is the cash outflow in year t;
  • n is the project life (or calculation period);
  • i0 is the benchmark discount rate.
This study discounts annual profits and uses the NPV of profit as the economic performance indicator for evaluating the production of the ore concentration area. The calculation process is as follows:
(1)
The average annual profit and mining time of each mine.
First, the annual profit of the e-th mine, Re (in 104 CNY/year), is determined as follows:
R e = P e C e Q i t e
where
  • Pe is the sales price of rare earth ore products from the e-th mine (in 104 CNY/ton);
  • Ce is the unit production cost (in 104 CNY/ton);
  • te is the mining life (year);
  • Qe is the annual production of the e-th mine (ton).
t e = Q z i G e η e Q e
where
  • ηe is the comprehensive mining and beneficiation recovery rate of the e-th mine (%);
  • Qzi is the total resource reserve (TR2O3) of the mine (ton);
  • Ge is the leaching rate (%);
  • Qe is the annual production of the e-th mine (ton).
The comprehensive recovery rate of rare earth mining and beneficiation is employed to evaluate resource utilization efficiency, as specified in the Technical Specification for in-situ Leaching Mining of Ionic Rare Earth Ore [16]. The comprehensive rare earth mining and beneficiation recovery rate is defined as the ratio of rare earth products (converted to rare earth oxides, REO) to the total mobilized reserves of ion-exchangeable rare earth oxides in the mined ore block. The formula for calculating the comprehensive recovery rate η is as follows:
η = Q e Q * × 100 %
where
  • Qe represents the output of ionic rare earth (unit: ton);
  • Q denotes the resource reserves of ionic rare earth (unit: ton).
When the mining sequence is W = {w1, w2, w3, …, we, …, wN}, the vectors Ru = [Rw1, Rw2, Rw3, …, Rwe, …, RwN] and tu = [tw1, tw2, tw3, …, twe, …, twN] represent the average annual profit and the mining duration of each mine, respectively.
(2)
The commencement and termination times of mining in each mine.
The commencement time of the first mine to be exploited is denoted as zero. The commencement time of mining for the mine with the i-th mining sequence, Tu1,i, is calculated as the cumulative sum of the mining durations of all mines that precede it in the sequence. The formula for this calculation is as follows:
T u 1 , i = n = 1 n = i 1 t u ( n )
where
  • tu(n) is the mining time of the mine when the mining sequence is n.
The termination time of mining, denoted as Tu2,i, is calculated as the sum of its commencement time and its own mining duration. The formula for this calculation is as follows:
T u 2 , i = n = 1 n = i t u ( n )
(3)
The NPV of the i-th mine in the mining sequence, denoted as NPVu,i (in 104 CNY).
If the commencement and termination times of mining are in the same calendar year, i.e., the integer parts of Tu1,i (T*u1,i) and Tu2,i (T*u1,i) are equal, the NPV is calculated as follows:
N P V u , i = R u i * T u 2 , i T u 1 , i 1 + d T * ­ u 1 , i 1
where
  • Ru(i) is the average annual profit of the i-th mine in the mining sequence;
  • d is the annual discount rate (%).
If the commencement and termination times of mining do not fall within the same calendar year, the NPV is calculated as follows:
N P V u , i = R u i T * ­ u 1 , i + 1 T u 1 , i 1 + d T * ­ u 1 , i 1 + 1 + d T * ­ u 1 , i 2 + + 1 + d T * ­ u 2 , i + T u 2 , i T * ­ u 2 , i 1 + d T * ­ u 2 , i 1
(4)
The objective function of the optimization model for ion-adsorption rare earth mining district based on maximizing economic benefits is formulated as follows:
M a x N P V = M a x i = 1 N N P V u , i
where
  • NPV is the total net present value of the mining district (in 104 CNY);
  • N is the number of mines in the mining district.

2.2.2. Environmental Cost Target

(1)
Environmental pollution factors.
The primary characteristic of in situ leaching technology is the elimination of the need for stripping surface soil or excavating the ore body. Instead, injection holes for leaching agents are established on the surface of the hillside. By injecting ammonium sulfate leaching solution, an exchange reaction occurs between ammonium ions and rare earth ions. Subsequently, fresh water is injected to form the leaching solution, which is collected in the mother liquor pond via the liquid collection ditches or tunnels at the base of the hill. Finally, rare earth hydrates are extracted through precipitation using oxalic acid or ammonium bicarbonate [17,18,19]. Although in situ leaching is currently one of the more environmentally friendly mining methods, it still causes certain environmental pollution and ecological damage. The environmental impact of in situ leaching technology mainly stems from the layout of injection wells, which can lead to vegetation destruction, slope failures, subsidence at the mining site, and the leakage of leaching solution into the ground, thereby contaminating groundwater [20,21,22]. In accordance with different pollution factors and forms of ecological damage, the environmental costs of ion-adsorption rare earth mining are categorized into water pollution control costs, land reclamation costs, and vegetation maintenance costs.
(2)
Objective function.
This study employs environmental costs as the indicator to assess the environmental implications of production in the mining district. Based on different pollution factors and forms of ecological degradation, the environmental costs of ion-adsorption mining districts are categorized into water pollution treatment costs, land reclamation costs, and vegetation maintenance costs. The calculation methodology is as follows:
C W u = P W × Q W × U U * U *
where
  • CWu is the cost of water pollution control (in 104 CNY/year);
  • PW is the unit cost of wastewater treatment (in CNY/m3);
  • QW is the volume of wastewater (in 104 m3/year);
  • U and U* are the actual and maximum allowable concentrations of the main pollutant (in mg/L), respectively.
It is assumed that wastewater treatment is only required when U exceeds U*.
C L u = P L Y × S L Y + P L B × S L B + P L M × S L M
where
  • CLu is the land reclamation cost (in 104 CNY);
  • PLY is the unit area cost of land reclamation for in situ leaching sites (in CNY/m2);
  • SLY is the total area of land reclamation for in situ leaching sites (in m2);
  • PLB is the unit area cost of land reclamation for temporary waste dumps and topsoil stockpiles (in CNY/m2);
  • SLB is the total area of land reclamation for temporary waste dumps and topsoil stockpiles (in m2);
  • PLM is the unit area cost of land reclamation for pregnant solution and tailwater treatment plants (in CNY/m2);
  • SLM is the total area of land reclamation for mother liquid and tailwater treatment plants (in m2).
C V u = P V × Q V × T *
where
  • CVu is the vegetation maintenance cost (in 104 CNY);
  • PV is the maintenance cost per unit area (in CNY/m2·year);
  • QV is the maintenance area (in m2);
  • T* is the maintenance period (in years).
Considering the time value of money, the annual environmental costs are discounted. The mining sequence affects the start and end times of mining for each mine, and the net present value (NPV) of environmental costs can better reflect the cost expenditures under different mining sequences. The objective function is to minimize the environmental cost of the mining district, and the calculation process is as follows: the environmental cost (CE) of the mine with the i-th mining sequence, denoted as Cu,i
N P V C W ( i ) = C W ­ u ( i ) T * ­ u 1 , i + 1 T u 1 , i 1 + d T * ­ u 1 , i 1 + 1 + d T * ­ u 1 , i 2 + + 1 + d T * ­ u 2 , i + T u 2 , i T * ­ u 2 , i 1 + d T * ­ u 2 , i 1
N P V C L ( i ) = C L ­ u ( i ) T * ­ u 1 , i + 1 T u 1 , i 1 + d T * ­ u 1 , i 3 + 1 + d T * ­ u 1 , i 4 + + 1 + d T * ­ u 2 , i 2 + T u 2 , i T * ­ u 2 , i 1 + d T * ­ u 2 , i 3
N P V C V ( i ) = C V ­ u ( i ) 1 + d T * ­ u 2 , i 3 + T u 2 , i T * ­ u 2 , i 1 + d T * ­ u 2 , i 4
C u ( i ) = N P V C W ( i ) + N P V C L ( i ) + N P V C V ( i )
where
  • Cu(i) is the environmental cost of the i-th mine in the mining sequence (in 104 CNY);
  • CWu(i) is the average annual cost of water pollution control for the i-th mine in the mining sequence (in 104 CNY);
  • CLu(i) is the average annual cost of land reclamation for the i-th mine in the mining sequence (in 104 CNY);
  • CVu(i) is the average annual cost of vegetation maintenance for the i-th mine in the mining sequence (in 104 CNY);
  • d is the annual discount rate (%).
The objective function for environmental costs is:
M i n C E = M i n i = 1 N C u , i
where
  • CE is the total environmental cost of the mining district (in 104 CNY);
  • N is the number of mines in the mining district.

2.3. Constraints

2.3.1. Constraints on Mining Scale

The mining scale refers to the maximum amount of ore that a mine can extract within a certain period, given the existing mining technology. Under the influence of policy, the annual mining plan indicators restrict the total extraction volume of ion-adsorption rare earth mines [23]. The annual extraction volume of each mine is controlled within the maximum mining scale. In Equation (18), Qe represents the maximum mining scale of the e-th mine (in tons).
0 Q e Q * ­ e

2.3.2. Constraints on Production Conditions

Production technology conditions are essential for ensuring the efficiency and cost-effectiveness of mining operations, including mining methods, ore-dressing processes, and equipment selection. These factors collectively determine the mining efficiency and costs. Production indicators are influenced by multifaceted factors, including resource occurrence conditions, technological equipment level, and management proficiency. The comprehensive recovery rate of mining and ore-dressing reflects the technical performance indicators and affects the utilization rate of ore resources as well as the mining costs. In Equation (19), the comprehensive recovery rate of the e-th mine (in %) is controlled within the normal upper and lower limits, as follows:
0 η e η max

2.3.3. Constraints on Mining Sequence

To evaluate the economic benefits of the mining district under different mining sequences, the model is constructed under the assumption that the mines are exploited in sequential order without identical sequence values. Equation (20) indicates that the e-th mine is exploited prior to the k-th mine, as follows:
w e < w k

2.4. Optimization Model

By integrating the aforementioned objective functions and constraints, the optimization model for the mining sequence of ion-adsorption rare earth mining districts, incorporating environmental costs, is formulated as follows:
M a x N P V = M a x i = 1 N N P V u , i M i n C E = M i n i = 1 N C u , i s . t . 0 Q e Q * ­ e e = 1 2 3 N w e < w k e , k ­ 1 2 3 N ­ 0 η e η max e = 1 2 3 N

3. Model Application

3.1. Project Overview

This study employs survey data from rare earth mines in Ganzhou for a case analysis, with Table 1 presenting relevant data for 11 mines within the ore cluster, including mining lifespan, resource reserves, annual production, and environmental costs. The production costs during the mining of ionic rare earth deposits primarily consist of wages and benefits for production workers, workshop management expenses, auxiliary material costs, power expenses, corporate overhead, maintenance costs, safety expenditures, depreciation, and amortization. In China, the environmental costs associated with rare earth mining have not been substantially incorporated into the total mining costs and are instead accounted for separately.

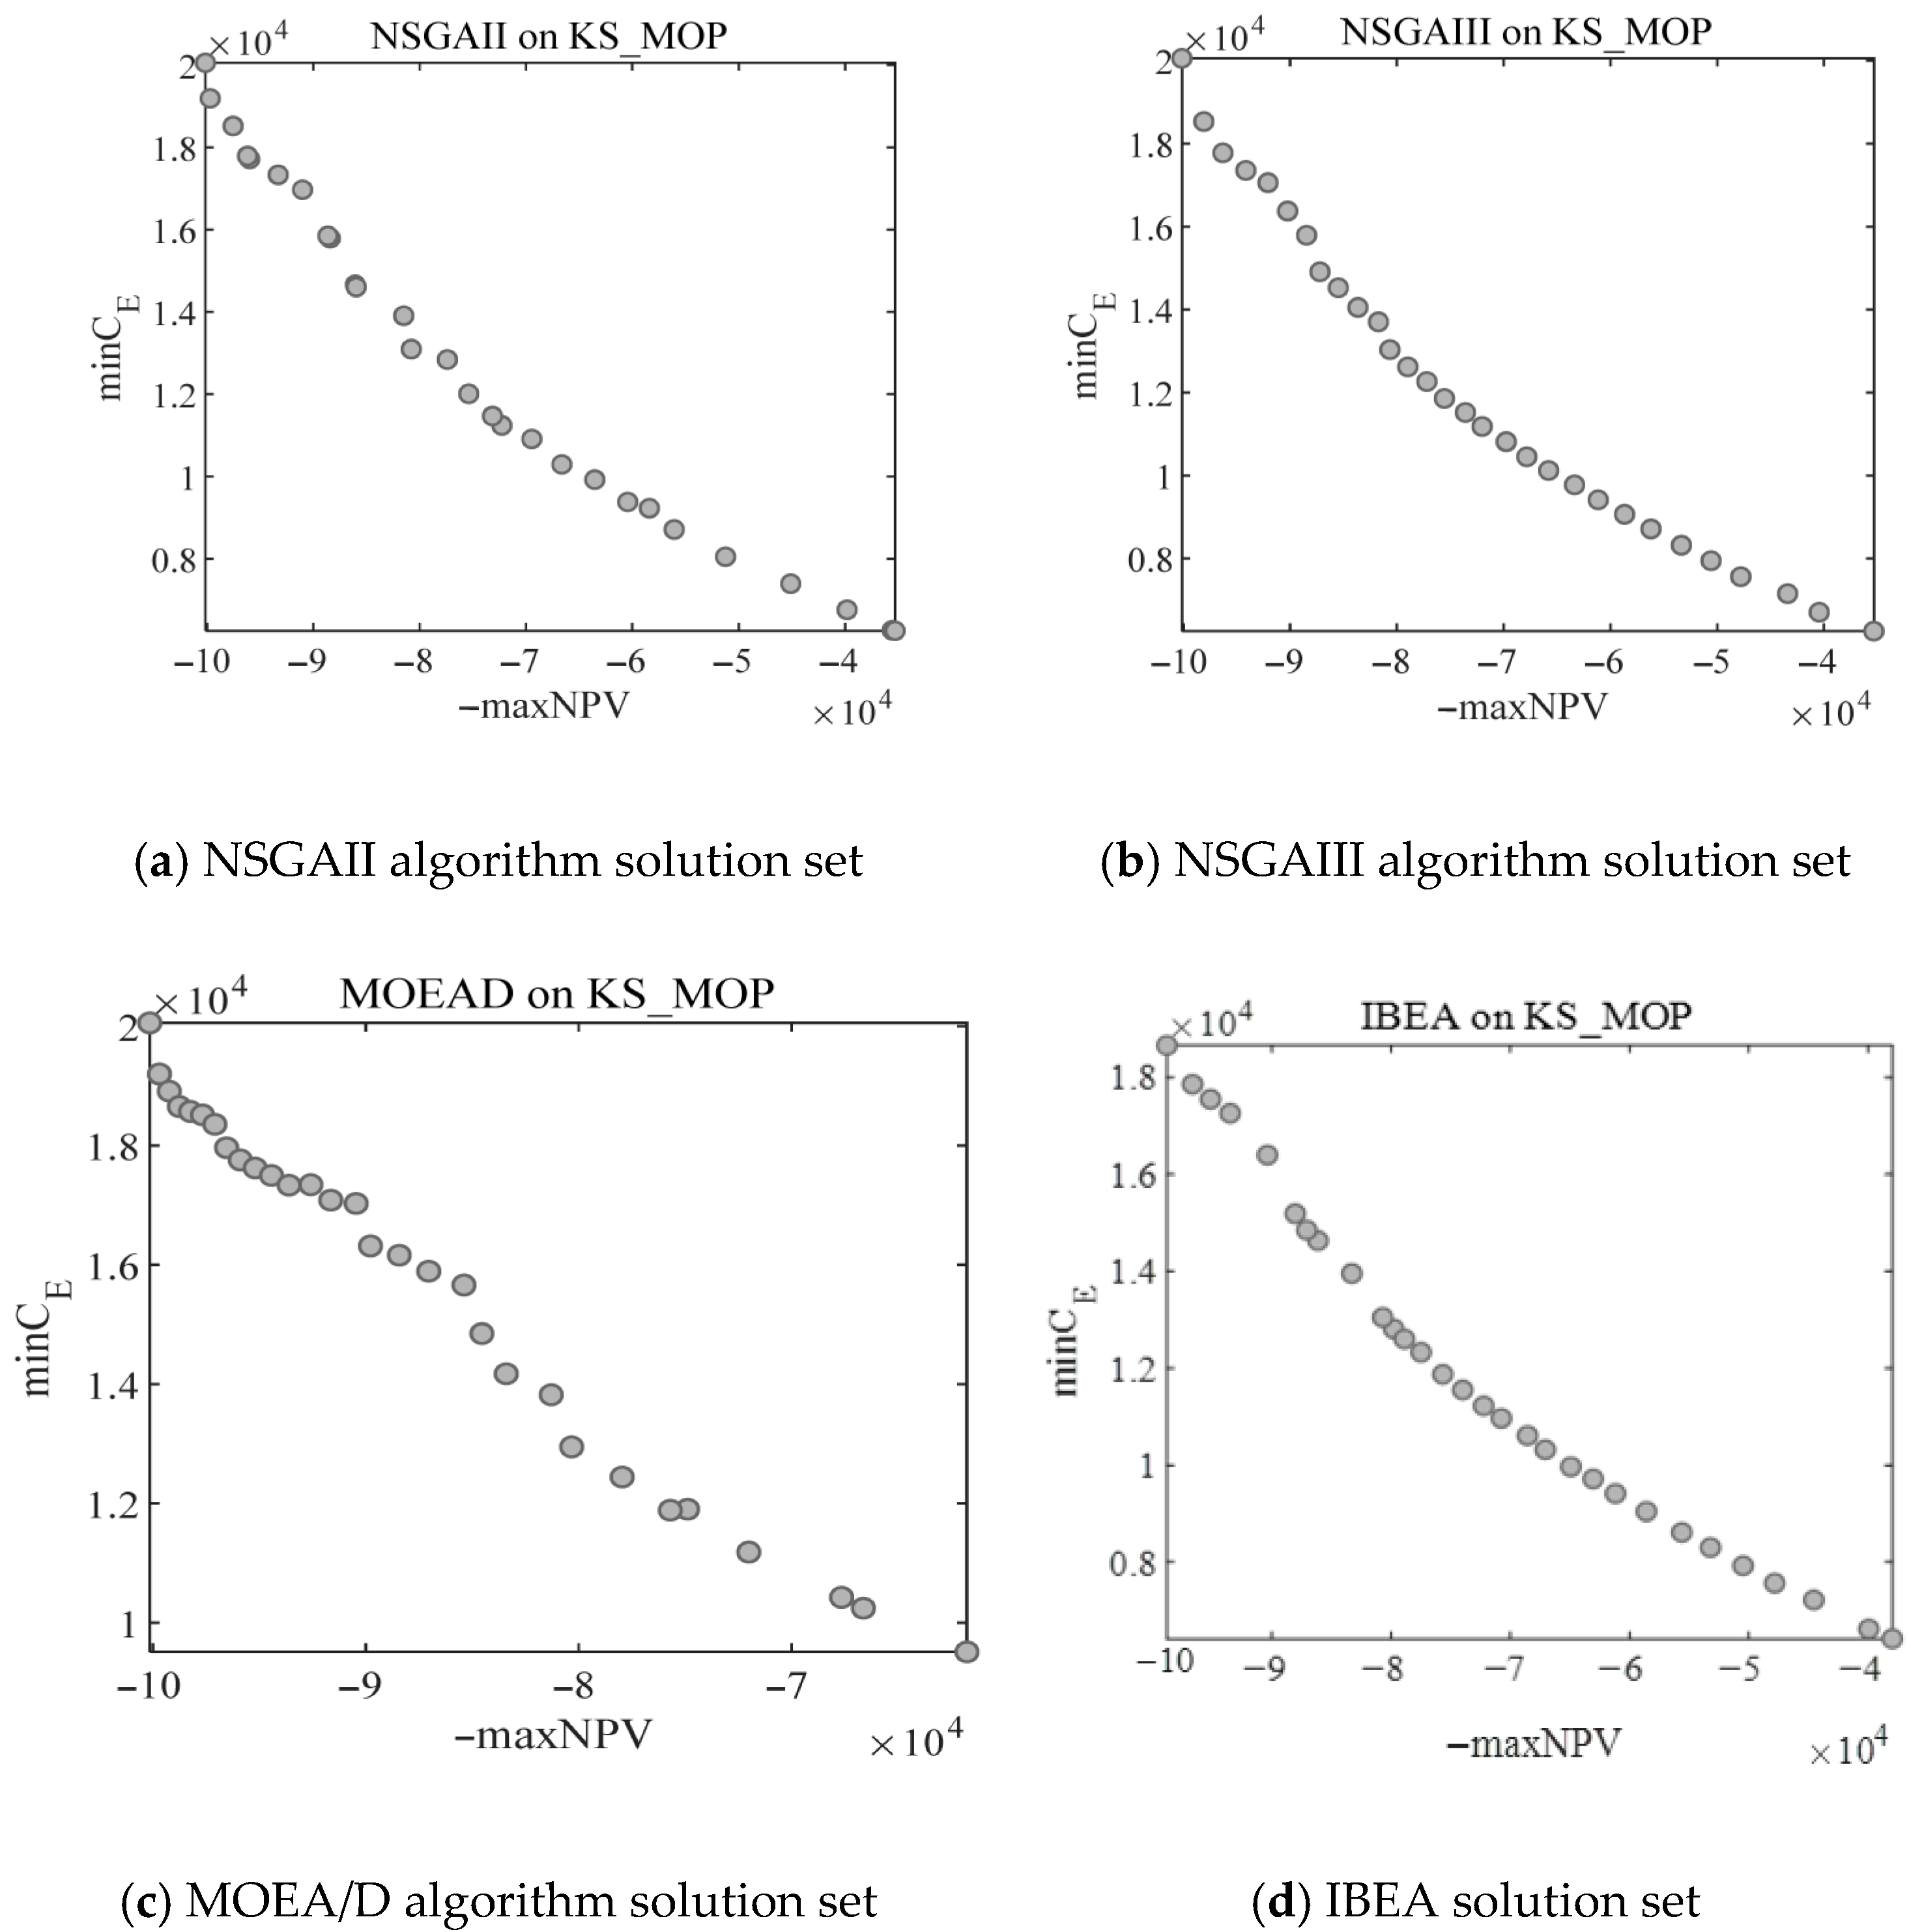
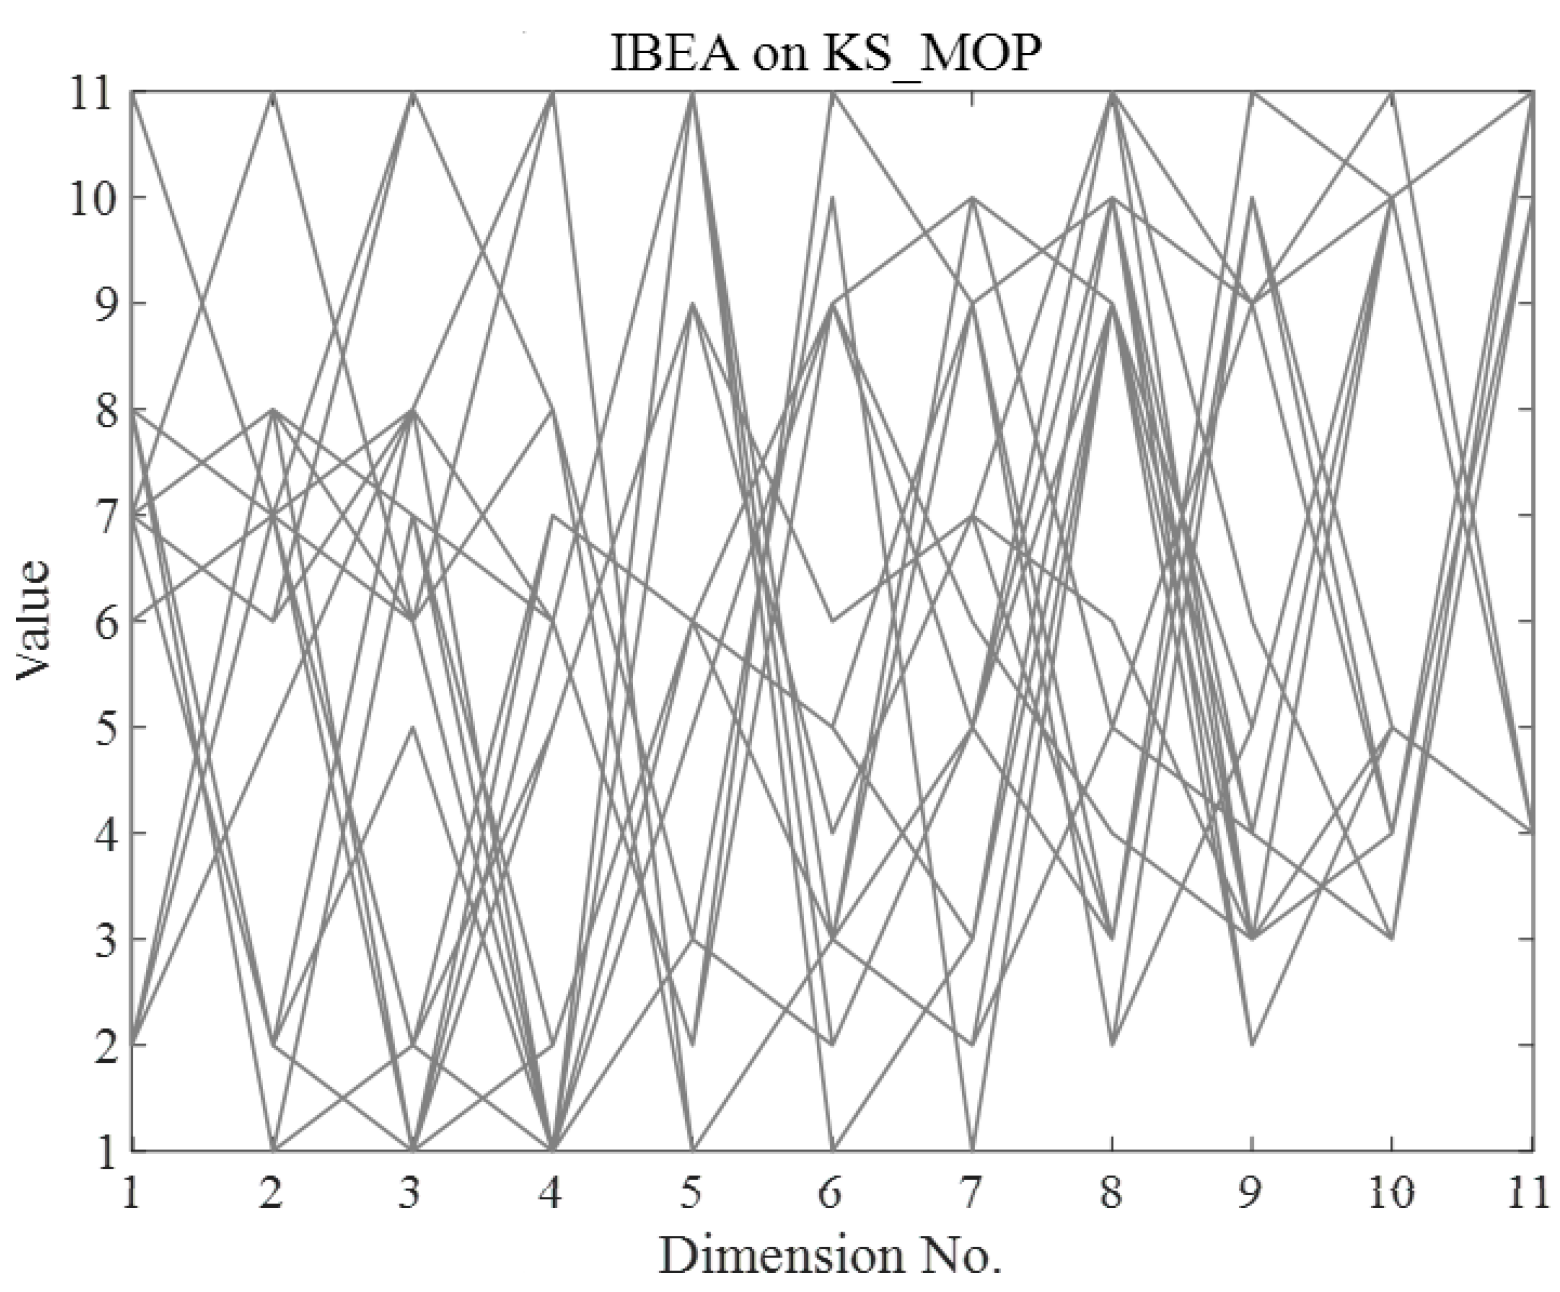
3.2. Algorithm Analysis

The development of multi-objective evolutionary algorithms has produced three main paradigms as follows:
Dominance-based MOEAs, exemplified by NSGA-II (Non-dominated Sorting Genetic Algorithm II) and NSGA-III (Non-dominated Sorting Genetic Algorithm III). These algorithms employ non-dominated sorting, elitism, fitness sharing, and genetic operators, and are well-suited for small- to medium-scale problems involving conflicting objectives where solution diversity must be preserved [24,25].
Indicator-based MOEAs, represented by IBEA (Indicator-Based Evolutionary Algorithm). IBEA uses a performance indicator to evaluate solution quality and guide the entire population’s evolution, offering flexibility in handling multi-objective problems [26].
Decomposition-based MOEAs, typified by MOEA/D (Multi-Objective Evolutionary Algorithm based on Decomposition). MOEA/D leverages flexible decomposition and cooperative mechanisms to obtain high-quality solutions [27].
This study primarily addresses the optimization of mining sequences, which involves optimizing one or multiple objectives through rational sequencing or scheduling strategies under given constraints. The three classes of multi-objective optimization algorithms—dominance-based, indicator-based, and decomposition-based—are all applicable to the multi-objective model constructed in this study [28,29,30]. Leveraging the resources provided by the PlatEMO platform, NSGA-II, NSGA-III, IBEA, and MOEA/D are employed to address the practical multi-objective optimization problem [25,31,32].
To evaluate the superiority of the IBEA in solving the optimization model for the mining sequence of ion-adsorption rare earth mining districts that incorporates environmental costs, this chapter compares the following four algorithms: NSGA-II, NSGA-III, IBEA, and MOEA/D. The model and algorithms are implemented on a PC with 8 GB of memory and a 3.19 GHz CPU, using MatlabR2022b software and the PlatEMO platform. The algorithm configurations are set to the platform’s default settings. The maximum number of function evaluations (maxFE) is set to 10,000, the population size (N) is set to 30, the number of objectives (M) is 2, and the number of decision variables (D) is 11. Each algorithm is run independently for 30 trials, with basic parameters consistent with those specified in Table 1 of this paper.
(1)
Distribution of the Solution Set.
The optimal solution sets obtained from 30 independent runs of the four algorithms are shown in Figure 1. As can be seen from Figure 1, in terms of the distribution of solutions, the solution set obtained by the NSGA-III algorithm is the most evenly distributed. The solution set from the IBEA is the second most evenly distributed, with only a portion of the solutions in the upper-left part of Figure 1d showing some discontinuity. Compared with the NSGA-III and IBEAs, the solution set from the NSGA-II algorithm has a less uniform distribution and poorer continuity. The MOEA/D algorithm performs the worst among the four algorithms in terms of distribution. The solutions in Figure 1c are concentrated in the upper-left corner, with a significant absence of solutions in the lower-right corner.
(2)
Running time.
The four algorithms were applied in the algorithm platform to perform separate computations, with the runtime of each execution recorded. The descriptive statistical results are presented in Table 1. As shown in Table 2, under the same parameter settings and iteration counts, the maximum and minimum runtimes of the IBEA were shorter than those of the other algorithms. Specifically, the minimum runtime of the IBEA was 1.8012 s, and the maximum runtime was 2.1393 s, both significantly lower than the runtimes of the MOEA/D algorithm. Additionally, the average runtime of the IBEA was slightly shorter than those of the NSGA-II and NSGA-III algorithms.
(3)
HV value.
When evaluating the performance of multi-objective optimization algorithms, two primary criteria are considered: diversity and convergence. Since a single performance metric cannot adequately reflect both criteria simultaneously, this study employs the hypervolume (HV) metric to analyze the performance of each algorithm. HV is one of the most commonly used metrics in the field of multi-objective optimization to assess the quality of a solution set or the performance of an algorithm. It provides a comprehensive evaluation of both the convergence and distribution of the solutions obtained by an algorithm. This indicator was proposed by Zitzler et al. [33] and represents the volume of the hypercube formed by the individuals in the solution set and a reference point in the objective space. It is used to measure the total volume of the objective space dominated by at least one solution in the non-dominated set. Let X denote the non-dominated solution set obtained by the algorithm, and P represent the reference point corresponding to the true Pareto front, typically defined as the vector of maximum values for each objective. The hypervolume (HV) metric, which quantifies the volume between a non-dominated solution set and the true Pareto front, is calculated as follows:
HV ( X , P ) = x X X v ( x , P )
In the formula, v(x,P) represents the hypervolume of the space formed between a solution x in the non-dominated solution set X and the reference point P. This is typically defined as the volume of the hypercube constructed with the line segment connecting solution x and reference point P as its diagonal. A larger HV value for a non-dominated solution set indicates that the set is closer to the true Pareto front in terms of both convergence and diversity, suggesting it is a higher-quality non-dominated solution set. The HV indicator can simultaneously assess the convergence and diversity of a solution set, and it requires only a single reference point for calculation. This reference point is a solution that is dominated by all solutions in the set. The accuracy of the HV indicator depends on the selection of the reference point, different reference points may yield different results when evaluating the same solution set. In this study, with the true Pareto front known, the HV reference point is set at (2.5 × 10⁴, −3 × 10⁴). If one solution set dominates another, its HV value will be greater than that of the other set. A higher HV value indicates better algorithmic performance and a superior solution set. Based on Equation (16), the HV values for each of the four algorithms over 30 runs are calculated, with the descriptive statistical results presented in Table 3.
As shown in Table 3, under the same parameter settings and iteration counts, the average HV value obtained by the IBEA is higher than those of the other three algorithms. Specifically, the MOEA/D algorithm has the smallest average HV value. This indicates that the solution set obtained by the IBEA is superior to those of the other three algorithms, suggesting that the IBEA performs better.
To further compare the performance of the algorithms, a one-sided t-test, commonly used in statistics, was employed to analyze the differences. The performance of IBEA was compared with that of NSGA-II, NSGA-III, and MOEA/D algorithms, respectively. The formula for calculating the t-statistic is as follows:
t = y 1 y 2 N s
In the formula, y1 represents the mean value of the metric corresponding to algorithm 1, y2 represents the mean value of the metric corresponding to algorithm 2, s denotes the standard deviation of the first algorithm (In this study, s represents the standard deviation of the IBEA on the HV index), and N is the total number of runs. The significance level is set at 0.05, and the degrees of freedom are N − 1, which equals 29. By consulting the critical value table for the t-test, we obtain t0.05 = 2.045. If ∣t∣ > t0.05, it indicates that the two algorithms are significantly different; if ∣t∣ ≤ t0.05, it suggests that there is no significant difference between the two algorithms. Based on the experimental data, the standard deviation of the HV values for the IBEA is first calculated, followed by the calculation of the t-statistic values for the comparisons between the IBEA and the NSGA-II, NSGA-III, and MOEA/D algorithms, respectively. The results are presented in Table 4.
As shown in Table 4, when comparing the IBEA with the NSGA-II, NSGA-III, and MOEA/D algorithms, the t-statistic values are all greater than t0.05 = 2.045. The symbol “+” indicates that the algorithm is superior to the IBEA at a confidence level of 0.05, “−” indicates that it is inferior to the IBEA, and “=” indicates that there is no significant difference between the two algorithms in terms of statistical significance. This demonstrates that, in solving the optimization model for the mining sequence of ion-adsorption rare earth mining districts incorporating environmental costs, the optimization performance of the IBEA is significantly better than that of the NSGA-II, NSGA-III, and MOEA/D algorithms.

3.3. Results Analysis

After the comparison of the aforementioned algorithms, this study employs the IBEA to solve the current multi-objective problem. Unlike single-objective optimization, multi-objective optimization yields a set of solutions, each corresponding to a set of decision variables. The optimal solution set obtained from 30 runs of the IBEA is presented in Table 5. The data in the table show that different NPVs correspond to different CE values. As the NPV increases, the CE value also rises accordingly. This implies that for mining enterprises, different mining sequences within the mining district can generate different net present values of profit while incurring different net present values of environmental costs. If the enterprise decides to adopt the scheme with the highest NPV, namely the result from the 5th run, it will also incur the highest net present value of environmental costs.
The decision variables corresponding to the optimal solution set of the IBEA are illustrated in Figure 2. Unlike single-objective optimization, which yields a single solution, the figure displays multiple solutions forming an interwoven zigzag pattern. The solution set obtained in the optimization of the mining sequence for ion-adsorption rare earth mining districts incorporating environmental costs can be regarded as alternative plans for mining enterprises to decide on the mining sequence. By comparing and analyzing these plans in conjunction with the company’s business strategy and actual geological conditions, enterprises can make comprehensive and integrated judgments and decisions regarding the mining sequence of each mine within the mining district.

4. Further Discussion

4.1. Transformation of Multi-Objective Problems into Single-Objective Problems

In practical applications, when enterprises select mining sequence plans, they often need to make trade-offs and adjustments based on actual requirements and may find it challenging to directly compare multiple alternative plans. The aforementioned multi-objective optimization simultaneously considers both economic benefits and environmental costs, yielding a set of Pareto-optimal solutions. In contrast, transforming a multi-objective optimization problem into a single-objective optimization problem results in a specific value or solution. This approach provides a more intuitive mining sequence plan, facilitating an objective evaluation of the optimization effects of different mining sequence plans.
The linear weighted method [34] is a relatively simple and intuitive approach that transforms multi-objective problems into single-objective problems by assigning different weights to multiple objectives. Specifically, assuming there are m objective functions, denoted as f1(x), f2(x), …, fm(x), with corresponding weights w1, w2, …, wm, the multi-objective problem can be transformed into a single-objective problem as follows:
F(x) = w1 × f1(x) + w2 × f2(x) + … + wm × fm(x)
By appropriately selecting weights, F(x) can represent the combined effect of multiple objectives to a certain extent. In the linear weighted method for transforming multi-objective optimization into single-objective optimization, the calculation of weights is a crucial step, as it reflects the relative importance of different objectives. Common methods for calculating weights include the entropy weight method, analytic hierarchy process (AHP), CRITIC method, and subjective weighting, etc. This study employs the entropy weight method to calculate the weights of the two objectives, as it is an objective weighting approach that determines the weights of each indicator based on their information entropy. Both the NPV and CE values are of significant importance for the evaluation object, and the degree of variation between them provides a sufficient basis for effective weight allocation. Using the entropy weight method to calculate the weights of these two objective values ensures the objectivity and accuracy of the evaluation results, avoiding interference from subjective factors.
Assuming that the transformation of the two objective functions into a single objective function by taking the maximum value, and since the environmental cost objective should be minimized, the environmental cost objective function is assigned a negative value in the model. The multi-objective optimization model for the mining sequence of ion-adsorption rare earth mining districts incorporating environmental costs is transformed into a single-objective optimization model as follows:
M a x F = α M a x i = 1 N N P V u , i ( 1 α ) M i n i = 1 N C u , i s . t .   0 Q e Q * e e = 1 2 3 N w e < w k e , k 1 , 2 , 3 N ­ 0 η e η max e = 1 2 3 N
In the process of solving the aforementioned model, the key step is to determine the weight value α for each objective. Based on the data from the case study, the entropy weight method was employed to calculate the weights for the two objectives. The weight for the NPV objective was determined to be α = 0.49, while the weight for the CE objective was 1 − α = 0.51. By multiplying each objective function by its corresponding weight, a single-objective function is obtained.
To address the optimization issues in mining planning, such as determining the mining sequence and selecting mining equipment, the genetic algorithm (GA) is widely applicable due to its strong global search capability, high parallel processing efficiency, robustness, and flexibility. These characteristics make GA particularly advantageous for solving single-objective optimization problems and optimization searches [35]. In the context of mining planning, GA has demonstrated significant application value.
In this study, the GA was selected to solve the single-objective optimization model, with specific parameters and data settings consistent with the aforementioned model applications. The decision variable values corresponding to the optimal solution obtained by the GA are shown in Figure 3. In the figure, the x-axis represents the mining sequence, while the y-axis indicates the mine numbers. The optimized mining sequence is as follows: Mine A2 → Mine A5 → Mine A8 → Mine A4 → Mine A1 → Mine A9 → Mine A6 → Mine A7 → Mine A3 → Mine A10 → Mine A11.

4.2. Comparison of Single-Objective Optimization Solutions

When selecting mining sequence schemes, mining enterprises often need to make trade-offs and adjustments based on multiple factors, including their actual needs, resource conditions, and policy environments. For instance, under policy-driven, stricter environmental requirements for ionic rare earth mining, enterprises may prioritize environmental cost objectives when determining the mining sequence within a mining district. Consequently, the preference for different objectives may vary during different operational periods and under varying circumstances. By assigning weights to each objective according to the decision-maker’s preferences, the multi-objective optimization problem can be transformed into a single-objective optimization problem, yielding a specific numerical value or solution. This solution directly reflects the optimal mining sequence scheme after incorporating the decision-maker’s preferences, not only making the scheme more intuitive and comprehensible but also enabling the decision-maker to objectively evaluate the advantages and disadvantages of each option, thereby facilitating more scientific and rational decision-making.
Without incorporating environmental costs, the mining sequence optimization model that solely targets the maximization of economic benefits yields a mining sequence referred to as Plan 1. Additionally, the NPV of environmental costs for each mine is calculated. The mining sequence optimization model that transforms the multi-objective optimization, incorporating environmental costs as discussed earlier, into a single-objective optimization is referred to as Plan 2. A comparison is made between these two mining sequence optimization plans, with the NPV and the CE for each plan presented in Table 6.
As shown in Table 6, different mining sequence plans lead to significant differences in the NPV of mining profits and the net present value of environmental costs. Optimization Plan 1 is determined without considering environmental costs, while optimization Plan 2 takes into account both environmental costs and economic benefits. Compared with Plan 1, Plan 2 has a lower NPV of profit by CNY 3.3266 million but a reduced NPV of environmental costs by CNY 10.6993 million. From the results, Plan 1 achieves greater economic benefits but also causes more environmental damage, necessitating higher environmental costs for ecological restoration. In contrast, Plan 2, which integrates economic benefits and environmental factors, not only enhances economic efficiency but also minimizes environmental impact. The mining sequence changes the range and intensity of environmental damage by changing the stability of geological bodies, the integrity of hydrological system and the migration of pollutants. The hydrogeological and ore deposit conditions of each mine are different, and the leaching agent leakage varies. The geological differences lead to the difference in land reclamation and vegetation conservation area and then lead to the difference in environmental cost.

4.3. Emission-Reduction Measures for Mine-Site Planning

(1)
Siting Wastewater Treatment Plants in Low-Topography Areas.
Constructing wastewater treatment stations in low-lying areas to treat wastewater generated from ionic rare earth mining. The treated water, meeting discharge standards, can be recycled for reuse or safely discharged into the environment.
(2)
Concurrent Mining and Restoration.
Adopting the principle of “mining and restoration simultaneously.” Temporary land-use areas, such as in situ leaching sites, temporary spoil disposal sites, and topsoil storage areas, can undergo soil and vegetation reclamation during the mining period. Permanent land use areas, including centralized mother liquor pools, sedimentation tanks, and tailings water treatment ponds associated with mother liquor and tailings treatment facilities, should be back filled and reclaimed as forestland after the mine’s service life ends.
(3)
Science-Based Vegetation Maintenance Plan.
Developing scientifically sound vegetation maintenance plans based on local climatic and soil conditions. Strengthening vegetation monitoring and management during the maintenance phase can effectively reduce soil erosion, improve soil structure, and enhance ecological protection in mining districts.

5. Conclusions

This study incorporates CE into the optimization of the mining sequence for ion-adsorption rare earth mining districts. Based on the actual geological conditions and environmental restoration plans of the mining district, CE are used as an indicator to measure the environmental impact of mining production. With the objectives of maximizing the NPV of mining profits and minimizing the NPV of CE, an optimization model for the mining sequence of ion-adsorption rare earth mining districts incorporating CE is established. Taking the L rare earth mining district in Ganzhou as a case study, 11 mines within the area are selected as research objects, and the mining sequence is optimized using the established model and algorithms based on existing production data and current operational status.
The NSGA-II, NSGA-III, IBEA, and MOEA/D algorithms were selected as comparative algorithms. For the aforementioned model and algorithms, each algorithm was independently executed 30 times. In terms of solution distribution, the NSGA-III and IBEAs exhibit more uniform distributions. Regarding the HV values, the average HV value of the IBEA is higher than those of the other three algorithms. In terms of runtime, the average runtime of the IBEA is shorter than those of the other three algorithms. Therefore, it is concluded that the IBEA outperforms the NSGA-II, NSGA-III, and MOEA/D algorithms in solving the optimization problem of the mining sequence for ion-adsorption rare earth mining districts incorporating CE.
Using the IBEA to solve the multi-objective problem yields 30 sets of optimal solutions, with different NPVs corresponding to different CE values. As the CE value increases, the NPV also rises accordingly. Further transforming the multi-objective problem into a single-objective problem using the weighted method, the GA is employed to obtain the optimal solution. Compared with the mining sequence optimization plan that does not consider CE, although the NPV of profit is reduced by CNY 3.3266 million, the NPV of CE is decreased by CNY 10.6993 million. When making decisions on the mining sequence, mining enterprises should consider plans that not only enhance economic benefits but also minimize environmental impact.
This study constructs an optimization model for a mining sequence that incorporates environmental costs, breaking away from traditional decision-making methods primarily based on experience. It provides scientific guidance for enterprises to plan rational mining sequences in ore concentration areas and offers technical support for managers to make informed production decisions. By adjusting relevant parameters in the mining sequence optimization model, the proposed approach can also be applied to develop mining plans for other large-scale ore concentration areas. Although in situ leaching is currently regarded as the comparatively eco-friendly extraction technology for ion-adsorption rare earth mining districts, its implementation still inevitably induces a certain degree of environmental pollution and ecological degradation. By incorporating environmental costs—such as ecological restoration and pollution remediation—into the sequential optimization model, this approach systematically reduces the extent of damage that mining activities inflict on the mining-area ecosystem. It moves beyond the single-minded pursuit of profit maximization, achieving a dual improvement in both comprehensive resource-utilization efficiency and environmental-cost control, thereby providing a scientific basis and practical pathway for the green, efficient, and sustainable development of ion-adsorption rare earth resources.

Author Contributions

L.Y. conceived and designed the paper framework; L.Y. and Y.Z. collected the data, performed the experiments, and wrote the paper. M.Z. offered critical comments and participated in revising. All authors have read and agreed to the published version of the manuscript.

Funding

Research on the Security and Stability Strategy of China’s Strategic Mineral Resources Industry Chain and Supply Chain (2025-2060) (Project No. 22XGL003).

Institutional Review Board Statement

Not applicable.

Informed Consent Statement

Not applicable.

Data Availability Statement

The data presented in this study are available on request from the corresponding author.

Conflicts of Interest

The authors declare no conflicts of interest.

Abbreviations

The following abbreviations are used in this manuscript:
NPVNet Present Value
CENet Present Value of Environmental Costs
REsRare Earths
HVHypervolume
GAGenetic Algorithm
REORare Earth Oxide
NSGAIINon-dominated Sorting Genetic Algorithm II
NSGAIIINon-dominated Sorting Genetic Algorithm III
IBEAIndicator-Based Evolutionary Algorithm
MOEA/DMulti-Objective Evolutionary Algorithm based on Decomposition

References

  1. Li, X.; Ge, J.; Chen, W.; Wang, P. Scenarios of rare earth elements demand driven by automotive electrification in China: 2018–2030. Resour. Conserv. Recycl. 2019, 145, 322–331. [Google Scholar] [CrossRef]
  2. Barteková, E.; Kemp, R. National strategies for securing a stable supply of rare earths in different world regions. Resour. Policy 2016, 49, 153–164. [Google Scholar] [CrossRef]
  3. Wang, X.; Ge, J.; Li, J.; Han, A. Market impacts of environmental regulations on the production of rare earths: A computable general equilibrium analysis for China. Clean. Prod. 2017, 154, 614–620. [Google Scholar] [CrossRef]
  4. Chanda, E.; Dagdelen, K. Optimal blending of mine production using goal programming and interactive graphics systems. Surf. Min. Reclam. 1995, 9, 203–208. [Google Scholar] [CrossRef]
  5. Li, S.J.; Xu, Z.H. Application of Linear Programming Approach in Mining Schedule Planning. Met. Mine 2009, 44, 20–21, 25. [Google Scholar]
  6. Liu, L.; Chen, J.H.; Zheng, H.L. Application of fuzzy grey predictability linear programming in capacity allocation of mine. J. Cent. South Univ. (Sci. Technol.) 2012, 57, 611–619. [Google Scholar]
  7. Pourrahimian, Y.; Askari-Nasab, H. An application of mathematical programming to determine the best height of draw in block-cave sequence optimization. Min. Technol. 2014, 123, 162–172. [Google Scholar] [CrossRef]
  8. Wang, L.G.; Ren, Z.L.; Pan, C.P. Optimization analysis of stope mining sequence based on mixed integer programming. Chin. J. Nonferrous Met. 2016, 26, 173–179. [Google Scholar]
  9. Liu, X.; Xu, Z.; Chen, X.; Zhong, D. Underground mine extraction planning based on mixed-integer programming. J. Northeast. Univ. (Nat. Sci.) 2017, 38, 880–885. [Google Scholar]
  10. Liu, D.; Wang, L.; Chen, X.; Zhong, D.; Xu, Z. Study on Multi Objective Optimization and Application of Medium and Long Term Plan for Underground Mine. Gold Sci. Technol. 2018, 26, 228–233. [Google Scholar]
  11. Xu, T.J.; Yang, P. Optimization of mine ore blending based on the fuzzy multi-objective optimum algorithm. Chin. J. Eng. 2009, 31, 1363–1367. [Google Scholar]
  12. Bai, Y.; Wu, Z.Y. Mine construction schedule controlled by multi scheme network plan. Coal Sci. Technol. 2006, 34, 64–66. [Google Scholar]
  13. Chen, D.G.; Hu, N.L.; Li, G.Q. Compilation and Research of Underground Mine Construction Plan Based on CCPM. Met. Mine 2009, 44, 96–99. [Google Scholar]
  14. Li, L.; Yang, L.; Zheng, M.; Dai, Y.; Jiao, Y.; Liao, C. Research progress on rare earth extraction and separation technology and extractants. J. Chin. Soc. Rare Earths 2022, 40, 920–935. [Google Scholar]
  15. Mancheri, N.A.; Sprecher, B.; Bailey, G.; Ge, J.; Tukker, A. Effect of Chinese policies on rare earth supply chain resilience. J. Resources. Conserv. Recycl. 2019, 42, 101–112. [Google Scholar] [CrossRef]
  16. GB/T 35067-2018; Technical Specifications for in-situ Leaching Mining of Ionic Rare Earth Ore. Chinese Standard: Beijing, China, 2018.
  17. Meng, Q.J. Review of the Current Status of Ionic Rare Earth Resource Mining Technology and Ecological Environment Impact Issues. Rare Earth Inf. 2020, 37, 24–25. [Google Scholar]
  18. Luo, X.P.; Hang, Y.B.Z. Review on the Development and Utilization of Ionic Rare Earth Ore. Minerals 2022, 12, 554. [Google Scholar] [CrossRef]
  19. Guan, H.; Mu, Y.; Song, R.; Lan, Y.; Du, X.; Li, J.; Chi, W.; Sang, W. Soil Microbial Communities in Desert Grassland around Rare Earth Mine: Diversity, Variation, and Response Patterns. Sustainability 2022, 14, 15629. [Google Scholar] [CrossRef]
  20. Xu, F.; Li, H.G.; Wang, X.L. Progress in Environmental Problems and Cost Assessment of Ion-adsorption Rare Earth Mining. Chin. Rare Earths 2020, 41, 119–127. [Google Scholar]
  21. Wei, J.P.; Wang, H.N.; Yan, J.B. Environmental damages and control measures in exploiting ion-absorbed rare earth of South China. Nonferrous Met. Sci. Eng. 2016, 7, 125–132. [Google Scholar]
  22. Zheng, X.K.; Feng, X.J.; Chen, Z.; Zhang, Y. Research progress on environmental problems of ionic rare earth mining and restoration of abandoned land. Appl. Chem. Ind. 2019, 48, 681–684. [Google Scholar]
  23. Liang, X.; Ye, M.; Yang, L.; Fu, W.; Li, Z. Evaluation and Policy Research on the Sustainable Development of China’s Rare Earth Resources. J. Sustain. 2018, 10, 3792. [Google Scholar] [CrossRef]
  24. Vukadinović, A.; Radosavljević, J.; Đorđević, A.; Protić, M.; Petrović, N. Multi-objective optimization of energy performance for a detached residential building with a sunspace using the NSGA-II genetic algorithm. Sol. Energy 2021, 224, 1426–1444. [Google Scholar] [CrossRef]
  25. Bi, X.; Wang, C. An improved NSGA-III algorithm based on objective space decomposition for many-objective optimization. Soft Comput. 2017, 21, 4269–4296. [Google Scholar] [CrossRef]
  26. Wang, X.; Wei, J.; Zhou, X.; Gu, X. A multi-objective evolutionary algorithm based on hypervolume indicator. J. East China Univ. Sci. Technol. (Nat. Sci. Ed.) 2020, 46, 780–791. [Google Scholar]
  27. Zhang, Q.; Li, H. MOEA/D:A multi-objective evolutionary algorithm based on decomposition. Trans. Evol. Comput. 2008, 11, 712–731. [Google Scholar] [CrossRef]
  28. Lingling, L.; Weiming, S. An improved NSGA-II with local search for multi-objective integrated production and inventory scheduling problem. J. Manuf. Syst. 2023, 68, 99–116. [Google Scholar]
  29. Gadhvi, B.; Savsani, V.; Patel, V. Multi-Objective Optimization of Vehicle Passive Suspension System Using NSGA-II, SPEA2 and PESA-II. Procedia Technol. 2016, 23, 361–368. [Google Scholar] [CrossRef]
  30. Gao, W.F.; Liu, L.L.; Wang, Z.K.; Gong, M.G. Survey on Multi-objective Optimization Evolutionary Algorithm Based on Decomposition. J. Softw. 2023, 34, 4743–4771. [Google Scholar]
  31. Samir, M.; Brahim, N. Improved Memetic NSGA-II Using a Deep Neighborhood Search. Int. J. Appl. Metaheuristic Comput. (IJAMC) 2021, 12, 138–154. [Google Scholar]
  32. Dhiman, G.; Soni, M.; Pandey, H.M.; Slowik, A.; Kaur, H. A novel hybrid hypervolume indicator and reference vector adaptation strategies based evolutionary algorithm for many-objective optimization. Eng. Comput. 2020, 37, 3017–3035. [Google Scholar] [CrossRef]
  33. Zitzler, E.; Thiele, L. Multi objective Evolutionary Algorithms: A Comparative Case Study and the Strength Pareto Approach. Trans. Evol. Comput. 1999, 3, 257–271. [Google Scholar] [CrossRef]
  34. Feng, S.M.; Wang, X.K.; Sun, X.L. Multi-objective Shortest Path Algorithm Based on Road Section Assignment Method. J. Chongqing Jiaotong Univ. (Nat. Sci.) 2018, 37, 87–92. [Google Scholar]
  35. Katoch, S.; Chauhan, S.S.; Kumar, V. A review on genetic algorithm: Past, present, and future. Multimed. Tools Appl. 2021, 80, 8091–8126. [Google Scholar] [CrossRef]
Figure 1. The optimal solution distribution diagrams of the four algorithms are shown as follows: (a) illustrates the solution set of NSGA-II, (b) of NSGA-III, (c) of MOEA/D, and (d) of IBEA.
Sustainability 17 06871 g001
Figure 2. Decision variables of the optimal solutions from the IBEA.
Sustainability 17 06871 g002
Figure 3. Decision variables corresponding to the optimal solution of the multi-objective to single-objective transformation.
Sustainability 17 06871 g003
Table 1. Production data of the 11 ion-adsorption rare earth mines.
Mine IDPeCeteQ0QziQeβGedCWuCLuCVu
A12612.5010.761401.9499435000.07 0.66360.111429.0312.49117.8
A22611.8016.201853.6416,2416000.09 0.73430.112137.937.26123.55
A32611.305.61420.2828813000.07 0.71620.111201.346.2337.78
A42612.2020.692234.6720,692.86000.09 0.73590.112855.616.36131.27
A52612.4013.581641.8313,9126000.08 0.71880.112133.824.2547.86
A62610.907.52369.2835073000.09 0.78960.11914.824.5831.41
A72611.701.49109.597853000.07 0.70040.11831.448.6811.58
A82611.606.50685.4956515000.08 0.70560.111428.8210.0059.71
A92612.1010.711063.0893175000.09 0.70490.111747.877.2661.81
A102613.005.87395.8731303000.08 0.68970.111163.836.7537.71
A112611.805.8089.4013221500.07 0.80650.11548.542.7111.37
Notes: Pe is the sales price (in 104 CNY/ton); Ce is the unit production cost (in 104 CNY/ton); te is the mining life (in years); Q0 is the total recoverable ore (in 104 tons); Qzi is the total rare earth oxide (REO) reserve (in tons); Qe is the annual REO production (in tons); β is the average ore grade (%); Ge is the leaching rate (%); d is the discount rate (%); CWu is the average annual cost of water pollution control (in 104 CNY); CLu is the average annual cost of land reclamation (in 104 CNY); CVu is the average annual cost of vegetation maintenance (in 104 CNY).
Table 2. Descriptive statistics of algorithm runtime.
AlgorithmNSGAIINSGAIIIIBEAMOEA/D
Average run time (seconds)2.34262.31841.92997.6950
Max run time (seconds)2.78292.84662.13938.2502
Minimum run time (seconds)1.96391.79401.80126.0301
Table 3. Descriptive statistics of algorithm HV values.
AlgorithmNSGAIINSGAIIIIBEAMOEA/D
Mean value0.57630.61120.61630.5636
Maximum value0.58150.61160.61810.5602
Minimum value0.57520.61070.61370.5684
Table 4. t-statistic values of algorithm HV values.
AlgorithmNSGAIINSGAIIIMOEA/D
t140.914218.1870185.4677
+/−/=0/1/00/1/00/1/0
Table 5. Optimal solution sets from 30 runs of the IBEA.
FrequencyMining SequenceNPV (Ten Thousand CNY)CE (Ten Thousand CNY)
1[2, 8, 6, 11, 7, 1, 10, 3, 9, 5, 4]72,837.1017,904.32
2[2, 8, 1, 6, 7, 11, 3, 5, 10, 4, 9]74,218.3618,205.73
3[7, 6, 8, 11, 1, 3, 10, 2, 5, 4, 9]45,351.299401.39
4[2, 7, 6, 8, 11, 3, 1, 10, 9, 5, 4]71,382.4817,623.26
5[2, 4, 5, 8, 9, 1, 7, 6, 3, 10, 11]76,969.0520,537.86
6[8, 7, 2, 1, 6, 5, 11, 3, 10, 9, 4]67,177.5814,942.93
7[2, 8, 5, 1, 6, 11, 7, 10, 3, 9, 4]75,589.8918,739.96
8[8, 1, 7, 6, 2, 11, 10, 3, 9, 5, 4]61,810.0112,898.58
9[6, 11, 8, 1, 2, 7, 5, 10, 3, 9, 4]42,743.399088.22
10[8, 1, 7, 6, 11, 2, 5, 10, 3, 9, 4]60,558.9112,585.33
11[8, 1, 2, 6, 5, 11, 7, 3, 10, 9, 4]65,250.2913,938.52
12[8, 6, 1, 7, 11, 5, 3, 10, 2, 9, 4]56,558.6011,663.78
13[7, 6, 8, 1, 11, 2, 5, 10, 3, 9, 4]48,805.6010,093.20
14[8, 1, 2, 4, 5, 9, 6, 7, 3, 10, 11]65,947.7914,329.89
15[8, 7, 6, 11, 10, 1, 3, 2, 9, 5, 4]51,862.2910,772.25
16[8, 7, 6, 1, 11, 3, 10, 9, 5, 2, 4]55,226.7311,329.15
17[8, 7, 6, 1, 2, 5, 9, 3, 11, 10, 4]57,908.9711,976.25
18[8, 7, 1, 2, 11, 6, 10, 3, 9, 5, 4]62,829.5713,299.63
19[8, 2, 7, 6, 11, 1, 4, 5, 10, 9, 3]68,249.2115,412.39
20[7, 6, 11, 8, 1, 10, 3, 2, 5, 9, 4]41,303.328693.17
21[8, 7, 1, 6, 11, 2, 10, 3, 9, 5, 4]59,303.2612,276.03
22[11, 6, 8, 7, 1, 3, 10, 9, 2, 4, 5]35,915.257916.81
23[7, 11, 6, 8, 1, 2, 5, 4, 9, 3, 10]37,654.178202.56
24[8, 1, 7, 2, 6, 11, 10, 3, 9, 5, 4]64,086.6013,597.17
25[7, 8, 6, 1, 11, 10, 2, 3, 4, 9, 5]53,727.8411,042.56
26[11, 7, 6, 10, 3, 8, 1, 9, 5, 2, 4]31,986.557493.33
27[8, 2, 1, 6, 7, 9, 11, 3, 5, 10, 4]69,594.7815,673.73
28[6, 8, 11, 7, 1, 2, 10, 3, 9, 5, 4]46,865.979763.18
29[6, 8, 1, 11, 7, 2, 5, 10, 3, 9, 4]50,252.5810,435.11
30[8, 2, 5, 7, 1, 6, 11, 10, 3, 4, 9]70,735.1816,157.01
Table 6. Comparison of results between optimization Plan 1 and optimization Plan 2.
Mining SequenceOptimization Plan 1Optimization Plan 2
Mine IDNPV
(Ten Thousand CNY)
CE
(Ten Thousand CNY)
Mine IDNPV
(Ten Thousand CNY)
CE
(Ten Thousand CNY)
1A263,159.5115,905.97A263,159.5115,905.97
2A412,289.444247.36A510,372.122717.50
3A51196.48313.54A81442.18288.57
4A8170.9634.22A41512.09522.55
5A9111.2728.11A1108.3523.14
6A135.487.58A96.249.15
7A66.251.27A66.251.27
8A32.250.62A70.710.14
9A70.400.08A31.930.53
10A100.980.29A100.980.29
11A110.290.07A110.290.07
Sum 76,973.3120,539.11 76,640.6519,469.18
Disclaimer/Publisher’s Note: The statements, opinions and data contained in all publications are solely those of the individual author(s) and contributor(s) and not of MDPI and/or the editor(s). MDPI and/or the editor(s) disclaim responsibility for any injury to people or property resulting from any ideas, methods, instructions or products referred to in the content.

