Article

Towards Sustainable Construction: Experimental and Machine Learning-Based Analysis of Wastewater-Integrated Concrete Pavers

by
Nosheen Blouch
1,
Syed Noman Hussain Kazmi
2,
Mohamed Metwaly
3,*,
Nijah Akram
4,
Jianchun Mi
5 and
Muhammad Farhan Hanif
5,6,*
1
Department of Building and Architectural Engineering, FE&T, Bahauddin Zakariya University, Multan 60000, Pakistan
2
Department of Civil Engineering, FE&T, Bahauddin Zakariya University, Multan 60000, Pakistan
3
Archaeology Department, College of Tourism and Archaeology, King Saud University, P.O. Box 2627, Riyadh 12372, Saudi Arabia
4
Department of Architectural Engineering Technology, Punjab Tianjin University of Technology, Lahore 54590, Pakistan
5
Department of Energy & Resource Engineering, College of Engineering, Peking University, Beijing 100871, China
6
Department of Mechanical Engineering, FE&T, Bahauddin Zakariya University, Multan 60000, Pakistan
*
Authors to whom correspondence should be addressed.
Sustainability 2025, 17(15), 6811; https://doi.org/10.3390/su17156811 (registering DOI)
Submission received: 19 June 2025 / Revised: 22 July 2025 / Accepted: 24 July 2025 / Published: 27 July 2025

Abstract

The escalating global demand for fresh water, driven by urbanization and industrial growth, underscores the need for sustainable water management, particularly in the water-intensive construction sector. Although prior studies have primarily concentrated on treated wastewater, the practical viability of utilizing untreated wastewater has not been thoroughly investigated—especially in developing nations where treatment expenses frequently impede actual implementation, even for non-structural uses. While prior research has focused on treated wastewater, the potential of untreated or partially treated wastewater from diverse industrial sources remains underexplored. This study investigates the feasibility of incorporating wastewater from textile, sugar mill, service station, sewage, and fertilizer industries into concrete paver block production. The novelty lies in a dual approach, combining experimental analysis with XGBoost-based machine learning (ML) models to predict the impact of key physicochemical parameters—such as Biochemical Oxygen Demand (BOD), Chemical Oxygen Demand (COD), and Hardness—on mechanical properties like compressive strength (CS), water absorption (WA), ultrasonic pulse velocity (UPV), and dynamic modulus of elasticity (DME). The ML models showed high predictive accuracy for CS (R2 = 0.92) and UPV (R2 = 0.97 direct, 0.99 indirect), aligning closely with experimental data. Notably, concrete pavers produced with textile (CP-TXW) and sugar mill wastewater (CP-SUW) attained 28-day compressive strengths of 47.95 MPa and exceeding 48 MPa, respectively, conforming to ASTM C936 standards and demonstrating the potential to substitute fresh water for non-structural applications. These findings demonstrate the viability of using untreated wastewater in concrete production with minimal treatment, offering a cost-effective, sustainable solution that reduces fresh water dependency while supporting environmentally responsible construction practices aligned with SDG 6 (Clean Water and Sanitation) and SDG 12 (Responsible Consumption and Production). Additionally, the model serves as a practical screening tool for identifying and prioritizing viable wastewater sources in concrete production, complementing mandatory laboratory testing in industrial applications.

1. Introduction

Using wastewater in concrete research has gained importance due to the increasing strain on freshwater resources and the growing demand for sustainable construction methods [1]. In the construction industry, wastewater presents a significant opportunity for resource conservation despite being primarily perceived as a disposal challenge [2]. Incorporating treated and untreated wastewater in concrete production helps mitigate environmental concerns related to water scarcity while addressing waste management issues [3]. Recycling wastewater into concrete improves sustainability by lowering the need for potable water and providing a more affordable option [4].
The growing worldwide population and swift urbanization have led to an unparalleled demand for construction materials, especially concrete, which depends significantly on water as an essential component. The building industry, producing billions of tons of concrete each year, has become one of the foremost consumers of fresh water. On average, about 150 L of water is used to manufacture one cubic meter of concrete, which can rise to 500 L when considering production and transportation losses [5]. This significant consumption predominantly worsens the global freshwater crisis, with the construction sector accounting for nearly one trillion cubic meters of water used per year [6].
Water scarcity is becoming a critical challenge, with projections indicating that by 2025, almost 1.8 billion people will face severe water shortages [7]. Countries and regions facing significant challenges with fresh water scarcity include Singapore, Japan, Hong Kong, Saudi Arabia, and parts of Pakistan such as Baluchistan and Karachi [8,9]. Given the finite nature of potable water resources and their high cost, utilizing alternative water sources (such as seawater and wastewater) in concrete production has gained attention [10]. This approach offers a dual advantage: conserving fresh water and reducing construction costs by recycling wastewater, which might otherwise pose environmental hazards if discharged untreated [4].
However, because wastewater has different physicochemical characteristics, using it to make concrete creates complications. The viability of utilizing wastewater for concrete is contingent upon numerous essential factors, including pH, TDS, Electrical Conductivity (EC), organic matter concentration, and ions such as chlorides and sulfates. Maintaining a pH range between 6.0 and 8.5 is essential for achieving optimal concrete performance [11]. Increased concentrations of TDS and EC can result in salt accumulation, compromising the integrity of concrete structures [12]. High concentrations of chloride and sulfate ions can accelerate the corrosion of steel reinforcements, which compromises the structural integrity of concrete. Organic matter, if present, can adversely affect the strength and durability of concrete by introducing undesirable chemical reactions during curing [13]. Highly alkaline wastewater can interfere with the setting process and the long-term performance of concrete structures [14]. For instance, industrial wastewater often contains hazardous components such as heavy metals and exhibits high alkalinity. Heavy metals and other pollutants in wastewater can weaken the strength and durability of concrete [
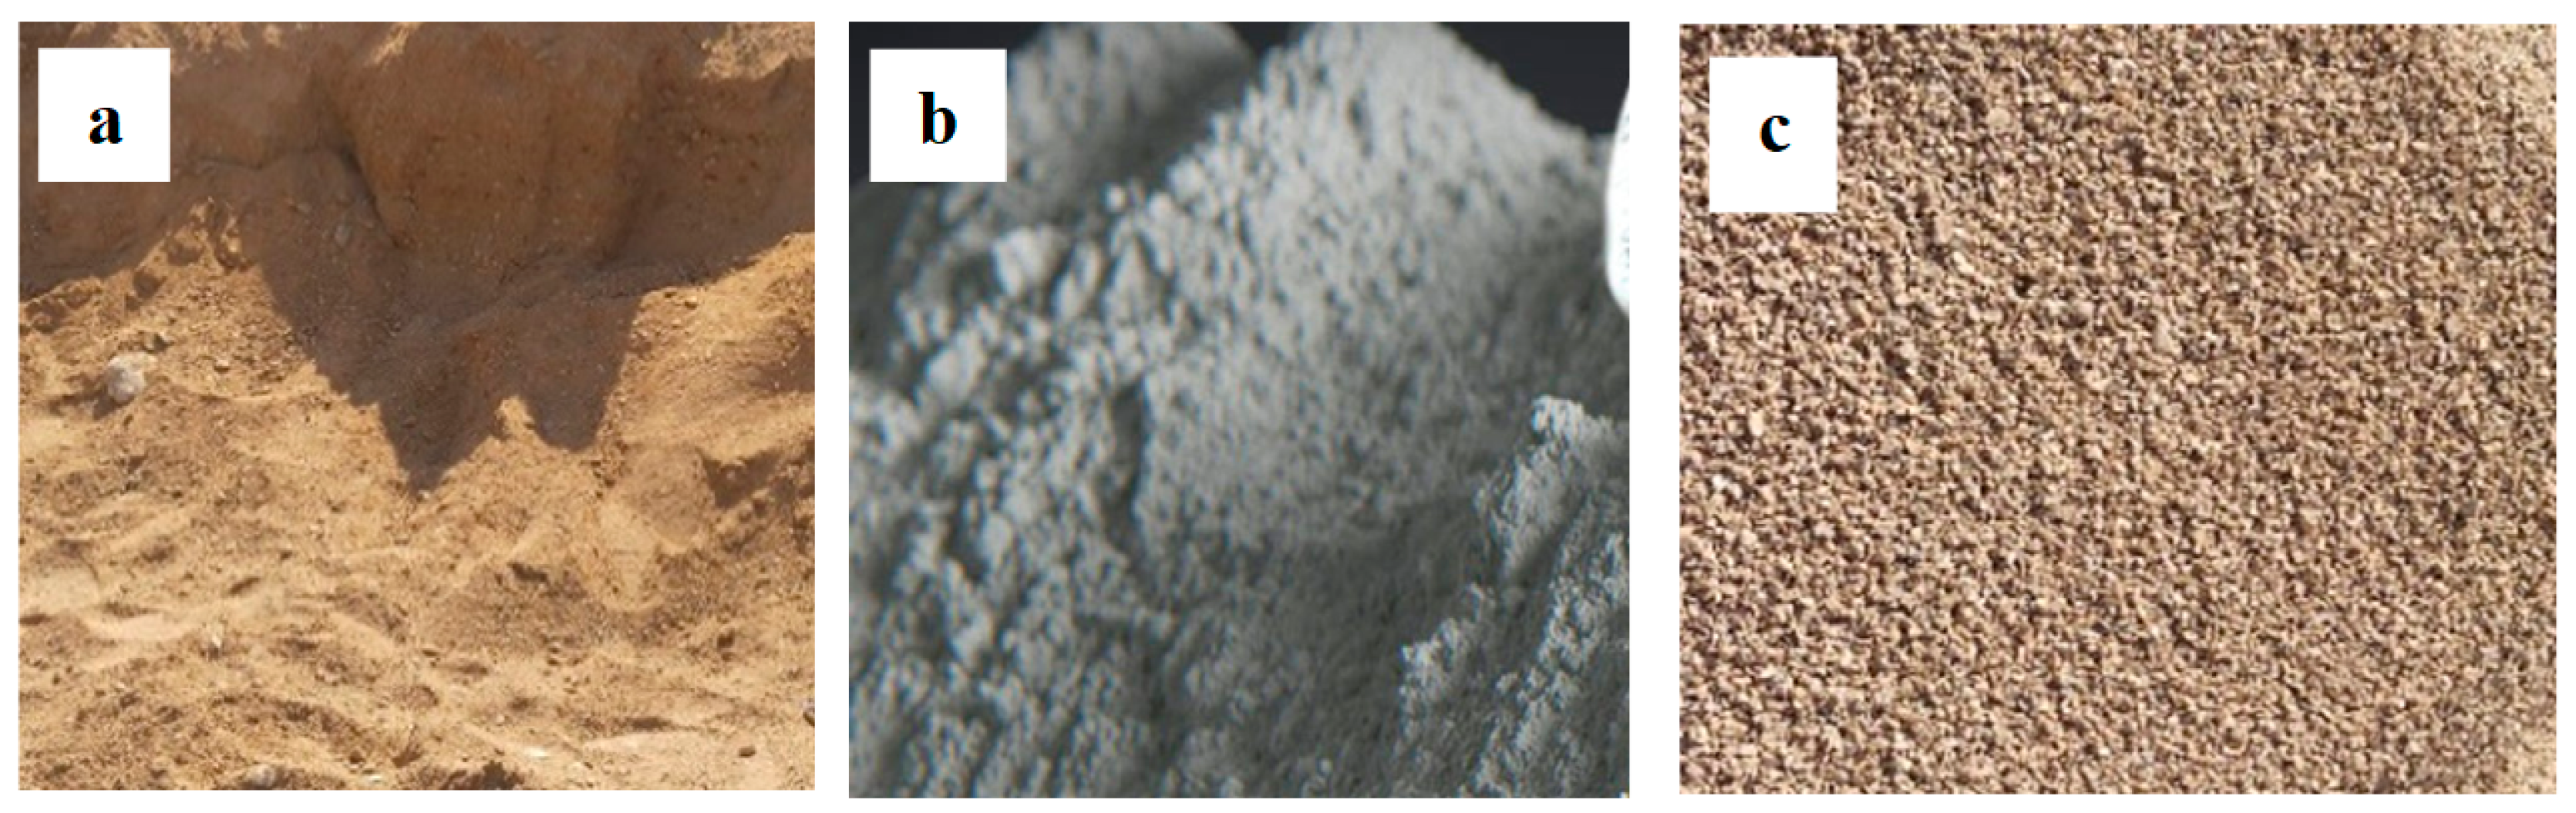
15]. These variables underscore the necessity of understanding wastewater composition to assess its appropriateness for concrete manufacturing. The properties of wastewater used in previous studies are listed in Table 1, and their histograms are presented in Figure 1.
Most researchers used treated wastewater with nearly identical physicochemical characteristics (see Figure 1), focusing on concrete’s mechanical and durability properties. Govedarica et al. (2022) explored the innovative use of solidified wastewater treatment sludge as an auxiliary cementitious material in previous concrete pavements to improve the concrete’s mechanical properties [42]. Almeida and Tonetti (2023) highlighted the advantages of utilizing treated wastewater as a sustainable substitute for potable water in concrete production, demonstrating that this practice conserves freshwater resources while preserving the strength and durability of concrete [1]. Patel et al. [43] investigated the use of textile effluent treatment sludge in rubber mold paver blocks, showing that this method enhances the mechanical properties of the blocks [44]. Although these studies highlight the potential of treated wastewater, they leave unexplored the impact of untreated or partially treated wastewater with diverse compositions on concrete properties. AI and ML offer powerful tools for addressing these gaps [45].
AI, particularly ML, has become an integral tool in concrete research, offering enhanced predictive capabilities over traditional mechanistic models [46,47]. Various ML techniques, including adaptive boosting (AdaBoost), random forest (RF), artificial neural networks (ANNs) [48], and support vector machines (SVMs), have demonstrated significant proficiency in modeling complex relationships within concrete materials that conventional statistical methods often fail to capture [49]. In the realm of concrete technology, AI methodologies have been extensively applied to predict and model properties across different stages—fresh [50], hardening, and hardened states [51]. For instance, ANNs have been utilized to forecast compressive strength based on input parameters such as water content, cement content, water-to-cement ratio, superplasticizers, and aggregate fractions. Moreover, ML approaches have been employed to detect and diagnose defects in concrete structures. Techniques like convolutional neural networks (CNNs) have been applied to image data for crack detection [52], enabling early identification of potential issues and facilitating timely maintenance interventions. Additionally, AI has been integrated into the optimization of concrete mix designs [53]. By analyzing large datasets, AI models can suggest optimal proportions of mix components to achieve desired performance characteristics, thereby reducing the reliance on trial-and-error methods and enhancing efficiency in mix design processes [54]. These advancements underscore the transformative impact of AI in concrete research, paving the way for more efficient, accurate, and innovative approaches to understanding and improving concrete materials and structures [54].
Despite the growing body of research on the use of wastewater in concrete production, significant gaps remain unaddressed. Most existing studies have predominantly focused on treated wastewater with relatively uniform physicochemical characteristics, emphasizing its impact on concrete’s mechanical and durability properties as shown in Figure 1. However, the potential of untreated or partially treated wastewater—which often exhibits diverse chemical compositions due to varying industrial sources—remains largely unexplored. This gap is critical because untreated wastewater can introduce complex variables such as fluctuating pH levels, high concentrations of chlorides, sulfates, heavy metals, and organic matter, all of which can significantly influence concrete performance in unpredictable ways. While traditional experimental methods have provided valuable insights into concrete behavior, they often fall short of capturing the multifaceted interactions between wastewater components and concrete properties. Although AI, particularly in the form of ML techniques, has been successfully applied in concrete research to predict mechanical properties and optimize mix designs, there is a noticeable lack of studies that leverage AI to analyze and predict the specific impacts of untreated wastewater on concrete. Moreover, existing research does not adequately address how advanced predictive models can be used to identify critical wastewater characteristics that affect concrete performance or to develop data-driven strategies for optimizing wastewater use. There is also limited exploration of how AI can guide targeted treatment approaches for wastewater to enhance its suitability for construction applications.
This study bridges experimental investigations with AI-driven modeling to comprehensively assess the feasibility of using untreated wastewater in concrete production. It systematically evaluates key mechanical and durability properties, including compressive strength, water absorption, and UPV, of concrete paver bricks produced with five distinct wastewater sources—sewage, fertilizer industry effluent, sugar industry effluent, textile discharge, and service station wastewater. The experimental data are analyzed using machine learning algorithms to identify critical wastewater characteristics that significantly influence concrete performance. By integrating advanced predictive models, this research not only highlights the most suitable wastewater sources but also quantifies the impact of specific chemical components on concrete behavior. Additionally, it proposes data-driven treatment strategies to optimize wastewater utilization for sustainable and resource-efficient construction practices. By addressing the complex challenges associated with untreated wastewater and leveraging AI for predictive insights, this study fills critical knowledge gaps and offers a strategic framework for harnessing unconventional water resources. The primary research question investigates the feasibility and safety of incorporating untreated or minimally treated wastewater from various industrial sources into concrete paver production. It examines how the physicochemical properties of the wastewater influence critical mechanical properties, including compressive strength, water absorption, ultrasonic pulse velocity (UPV), and dynamic modulus of elasticity (DME). Additionally, it explores the reliability of an XGBoost-based machine learning model in predicting these outcomes to facilitate practical implementation in regions facing water scarcity. Such efforts are pivotal for mitigating fresh water scarcity, minimizing environmental risks, and promoting the long-term sustainability of the construction industry.

2. Materials and Methods

2.1. Materials

Ordinary Portland Cement (OPC), Type II, Grade 43, crushed stone, and aero sand were used to prepare the concrete. The cement was sourced from Maple Leaf Private Limited, and the sand and crushed stone were obtained from Sakhi Sarwar. The raw materials used in the study are shown in Figure 2 and their physical properties are discussed in Table 2. The sieve analysis of coarse and fine aggregates is presented in Figure 3.
Wastewater samples from various sources, including carwash service stations, domestic sewage, and industrial sites like sugar mills, textile mills, and fertilizer plants, were gathered. Domestic wastewater was collected from the WASA management facilities in Multan, while service station wastewater was sampled near the Total Petrol Pump. Industrial wastewater samples were obtained from Pakarab Fertilizers Limited in Multan, Pakistan for fertilizer wastewater, Khoker Textile Mills Pvt. Ltd., Multan, Pakistan for textile wastewater, and Fatima Sugar Mills Limited, Multan, Pakistan for sugar industry wastewater. Prior to use, all collected wastewater samples were subjected to basic settling and coarse filtration to remove large debris and suspended solids while preserving their primary chemical characteristics. The physicochemical characteristics of wastewater samples from various sources were assessed using standard tests, including pH, TSS, COD, BOD, specific gravity, Turbidity, and chloride and nitrate concentrations. The physicochemical properties of the waters used are mentioned in Table 3.
The wastewater samples displayed a notable diversity in their chemical and physical properties. The pH values ranged significantly, from 2.6 in fertilizer wastewater to 11.16 in sugar mill effluent, reflecting varying pH levels (ranging from acidic to highly alkaline). BOD and COD levels varied markedly across the samples, with the highest concentrations found in wastewater from sugar mills and car service stations, while textile wastewater exhibited comparatively moderate levels. TDS values varied significantly, ranging from 381 mg/L in textile wastewater to 5306 mg/L in fertilizer wastewater. Furthermore, alkalinity ranged from 2.5 mmole/L in fresh water to 15 mmole/L in sugar mill wastewater, indicating diverse buffering capacities. Nitrate concentrations also differed significantly, with textile wastewater having 2.7 mg/L and fertilizer wastewater containing up to 102 mg/L of nitrate. Similarly, chloride and sulfate content also varied significantly. These variations in wastewater composition underscore the necessity for targeted treatment strategies that effectively address the unique characteristics of each source and their potential impact on concrete durability.

2.2. Methodology for the Development of Concrete Pavers

Six concrete mixtures were developed using Type II OPC, crushed stone, and aero sand; five mixes incorporated various wastewater sources, while one mix prepared with standard fresh potable water (CP-FRW) served as the control batch for direct comparison. A total of 27 tuff tiles (162 H-type tiles) were manufactured for each blend following a standard mix design ratio of 1:2:4 (cement/sand/aggregate) with a water-to-cement (w/c) ratio of 0.5. This mix proportion was selected in accordance with conventional practice for concrete paving blocks, consistent with industry standards such as ASTM C936 [57] and widely recognized mix design guidelines [58,59]. The chosen mix ensures good workability, structural strength, and durability while minimizing shrinkage and porosity. The concrete mix design and the acronym used are shown in Table 4.
The paving blocks, measuring 178 mm × 152 mm × 19 mm, were fabricated using a high-pressure compaction machine capable of exerting loads between 150 and 300 tons (1500 to 3000 kN). The materials were carefully compacted to achieve a consistent density. The dimensions of the concrete pavers are shown in Figure 4. After casting, the specimens were covered with a polythene sheet and left for 24 h. The following day, the specimens were removed from the molds and placed in a curing tank at a constant air temperature of 22 ± 2 °C and 98% relative humidity, adhering to standard paving block factory practices for optimal curing. The temperature of the wastewater at the time of mixing was measured and maintained at the same laboratory temperature (22 ± 2 °C) to ensure consistent hydration conditions across all batches. The specimens remained in the curing chambers for 7, 14, 21, and 28 days under controlled conditions to evaluate their strength and durability over time.

3. Test Methods

3.1. Experimental Setup

Compressive strength tests were conducted following ASTM C67 [60] at 7, 14, 21, and 28 days of curing to assess the strength development over time. A Denison compression testing machine with a capacity of 3000 kN and a displacement-controlled loading rate of 0.5 mm/min was used to perform the tests. The average compressive strength of 3 samples tested at each interval—a total of 27 samples over the four time periods—was determined for each mixture type. The porosity and permeability of the pavers, which are critical for determining the durability and weather resistance of tuff tiles, were assessed using the water absorption test according to ASTM C642 [61]. After being immersed in water, the tile samples were weighed twice: once dry (Wdry) and once wet (Wwet). The specimens were submerged in water for various periods of time to perform the water absorption test. Before submersion, the oven-dried specimens were weighed. At the required times, the specimens were removed from the water and weighed in their saturated surface dry (SSD) condition. The percentage of water absorption was computed using Equation (1). The testing setup of compressive strength and water absorption is shown in Figure 5.
Water   Absorption   % = W wet W dry W dry × 100
A non-destructive UPV test was conducted to examine the pore structure and mechanical properties of concrete pavers made from different wastewater sources. This technique aimed to identify discontinuities, such as voids and cracks, in the wastewater-based concrete pavers and to calculate their DME. A set of 55 kHz transducers was used for the UPV measurements. UPV measurements were performed using direct, indirect, and semi-direct transmission paths to assess how wave travel orientation affects the measured velocity. The top 15 mm of the concrete pavers were cut with a diamond cutter to create a flat surface to guarantee a smooth contact surface between the test specimens and the transducers. Due to the uneven surface of the pavers during the manufacturing process, this step was crucial. A thick layer of Vaseline gel was then applied to the sample surfaces to eliminate any air gaps during testing. The transducers were connected to an oscilloscope, which recorded the time taken for the ultrasonic waves to pass through each sample. The velocity of ultrasonic waves was calculated by dividing the length of the paver block specimen (in meters) by the recorded time of flight (in seconds). Following the formula, the velocity V was determined by dividing the time t required for the pulse to pass through the concrete by the distance d between the transducers. The equation used to measure UPV is shown in Equation (2).
U P V ( G p a ) = d / t
where UPV is the ultrasonic pulse velocity in m/s, d is the distance between the transducers and t is the time taken for the pulse to travel the distance in seconds.. The formula to calculate DME is shown in Equation (3).
D M E = ρ × ( U P V ) 2 × ( 1 + ν ) ( 1 2 ν ) / 1 ν
where DME is the dynamic modulus of elasticity, Gpa; μ the Poisson’s ratio; ρ the density, kg/m3; and UPV is the ultrasonic pulse velocity, m/s. (A Poisson’s ratio (v) of 0.20 was assumed for all concrete mixtures, aligning with standard values for normal concrete as suggested by Neville (2011) [59] and ACI 211.1 [62], due to the absence of direct measurement.)

3.2. Machine Learning Approach

Following the experimental evaluation of concrete paver blocks, machine learning techniques were employed to model and predict their performance based on the physicochemical characteristics of the wastewater used. The machine learning methodology consisted of several systematic steps: data preparation, feature engineering, model selection, training, evaluation, and optimization. The following sections detail the process.

3.2.1. Data Collection and Pre-Processing

The dataset used in this study is derived from experimental measurements of the physicochemical properties of wastewater and the corresponding mechanical properties of concrete paver blocks. The wastewater properties include pH, TDS, BOD, COD, Turbidity, Hardness, and other related parameters. The target mechanical properties include CS, WA, UPV, and DME.
Data Cleaning
To ensure the reliability of the analysis, the dataset undergoes a thorough cleaning process. Columns containing entirely missing values are removed, and missing values in specific rows are imputed using statistical methods or domain knowledge to maintain the dataset’s integrity. Outliers in physicochemical properties are identified and addressed to ensure uniform data distribution. These cleaning steps are essential to reduce noise and improve the quality of the data, making it suitable for predictive modeling [48].
Data Standardization
Since the variables have different units and ranges, a Standard Scaler is used to standardize the dataset. This technique normalizes the input features to a mean of zero and a standard deviation of one, improving the performance and convergence of the machine learning models [48]. During this process, the features (independent variables) and target properties (dependent variables) are separated into distinct datasets. The features are scaled using the standardization technique, and the scaled values are stored for subsequent analysis, ensuring uniformity across all predictor variables.
Data Partitioning
To evaluate the generalizability of the models, the dataset is split into training and testing subsets in an 80:20 ratio. The training set is utilized for model building and cross-validation, while the test set is reserved for evaluating model performance. This partitioning strategy ensures that the model’s performance metrics remain unbiased and reflect its applicability in real-world scenarios.

3.2.2. Feature Engineering

Feature engineering is employed to maximize the predictive power of the dataset by utilizing relevant information and enhancing the input features [63]. This process involves systematically refining the dataset to improve the models’ ability to capture meaningful relationships between variables and target outcomes [64].
Feature Selection
The initial feature set includes wastewater’s physicochemical properties and concrete blocks’ mechanical properties. Nine primary features—pH, TDS, BOD, COD, Turbidity, nitrate/nitrite levels, Hardness, chlorine levels, and Conductivity—are selected as predictors. These features are chosen based on their critical role in influencing the hydration process and their established relevance to the mechanical characteristics of concrete. By focusing on these properties, the study ensures that the most informative variables are retained, setting a solid foundation for predictive modeling.
Enhanced Feature Set
An enhanced feature set is developed to capture complex interactions among variables [64]. This refined set includes all physicochemical properties and additional mechanical properties, except the one being predicted, as predictors for each target variable. By incorporating interrelated target metrics, the enhanced feature set enables the models to exploit dependencies and synergies among the properties. This comprehensive approach significantly improves the robustness and accuracy of the predictions, offering deeper insights into the relationships governing the system [65].
Correlation Analysis
Correlation analysis is a fundamental step in the feature engineering process, used to identify relationships between the dataset’s input features and target variables [66]. In this study, a Pearson correlation heatmap is generated, which visually represents the strength and direction of linear relationships between wastewater’s physicochemical properties and concrete paver blocks’ mechanical properties.
The heatmap in Figure 6 depicts correlation coefficients that range from −1 to 1. A value of 1 indicates a perfect positive correlation, meaning that as one variable increases, the other also increases proportionally. A value of −1 signifies a perfect negative correlation, where an increase in one variable corresponds to a proportional decrease in the other. A value close to 0 indicates no linear correlation between the variables.
From the heatmap, it is evident that some features exhibit high correlation. For instance, TDS and Conductivity show a strong positive correlation (close to 1), which is expected due to their inherent relationship in characterizing dissolved solids in wastewater. Similarly, a strong positive correlation is observed between COD and BOD, reflecting their shared influence on the organic load of wastewater. On the other hand, weaker correlations, such as between pH level and most mechanical properties, suggest minimal direct linear relationships between these variables.
The high correlations among some features, such as Hardness and TDS, or chlorine and TDS, indicate potential multicollinearity. Multicollinearity can negatively impact machine learning model performance by making it difficult to isolate the effect of individual features. To address this, redundant or highly correlated variables are carefully analyzed, and where appropriate, one of the correlated variables is either removed or combined with others to streamline the dataset. For example, variables like TDS and Conductivity, which show high similarity, may be merged or one of them excluded to reduce redundancy.
The correlation heatmap also highlights relationships between input features and target properties. Strong correlations with mechanical properties, such as compressive strength and dynamic modulus, suggest that variables like age (hours) and Hardness play critical roles in predicting these targets. These insights are valuable for feature selection and ensure that only the most informative variables are retained, improving the model’s efficiency and interpretability.
By carefully analyzing the correlations and addressing multicollinearity, the resulting feature set is refined to provide unique and valuable information for predictive modeling. This reduces noise in the dataset and enhances the performance of the machine learning models, enabling them to effectively capture the essential relationships between wastewater properties and concrete performance metrics.
Data Augmentation
The dataset is enriched with derived features to further enhance generalizability. For instance, interactions between specific physicochemical parameters, such as the product of pH and TDS, are introduced to account for their combined effects on hydration and setting reactions. This augmentation process broadens the dataset’s informational content, allowing the model to better represent complex real-world scenarios.
The feature engineering process not only optimizes the predictive capabilities of the machine learning models [67] but also provides valuable insights into the underlying relationships between wastewater properties and the mechanical performance of concrete paver blocks. This careful refinement of the dataset ensures that the models achieve both high accuracy and interpretability, making the findings applicable to practical implementations [68].

3.2.3. Machine Learning Approach Using XGBoost

In this study, the Extreme Gradient Boosting (XGBoost v2.1.4) algorithm is utilized to predict the mechanical properties of concrete paver blocks based on the physicochemical properties of wastewater and other derived features. XGBoost, a highly efficient and flexible implementation of gradient boosting, is chosen for its ability to handle non-linear relationships, robustness against overfitting, and suitability for small-to-medium-sized datasets [69].
XGBoost is selected due to its proven ability to model complex, non-linear relationships and automatically account for high-order feature interactions among input variables. Unlike traditional linear regression methods that presume a fixed, additive contribution of each variable, XGBoost operates using an ensemble of decision trees where each tree sequentially corrects the errors of its predecessors through gradient boosting. This architecture inherently captures nonlinearities and variable interactions without the need for manually defined interaction terms [70]. In the context of this study, where physicochemical parameters such as BOD, TDS, Turbidity, and pH exhibit interdependencies and multicollinearity, XGBoost offers a robust framework capable of modeling such intricacies [71]. Furthermore, its integrated regularization mechanisms (L1 and L2 penalties) help mitigate overfitting [72], while its capacity to handle missing or sparse data enhances reliability, especially when working with real-world environmental datasets such as wastewater with variable compositions [73]. These theoretical underpinnings make XGBoost an appropriate choice for predicting concrete performance outcomes under variable water chemistry conditions.
Model Explanation and Visualization
Figure 7 presents a visualization of a single decision tree from the XGBoost model trained on the experimental dataset. This tree exemplifies the internal decision-making process of the algorithm. Each node in the tree represents a feature and a corresponding threshold value used to split the dataset into smaller subsets. For example, the root node in Figure 7a evaluates whether the feature f10 is less than 0.225. If this condition is satisfied, the data follows the left branch; otherwise, it moves to the right.
The tree operates by recursively partitioning the dataset at each node to minimize a specified loss function, typically the squared error for regression tasks. This recursive partitioning continues until a stopping condition is met, such as reaching a maximum depth or achieving minimal improvement in the loss function. The leaf nodes, displayed as ovals in Figure 7b, contain the final predictions made by the tree. For instance, if the data satisfies the condition f10 < 0.225, the prediction at the leaf node is −8.037.
An important feature of XGBoost, demonstrated in the tree, is its ability to handle missing values effectively. As seen in Figure 7a, branches explicitly denote paths for missing data, ensuring robustness in cases where certain input features are not available. The model assigns missing values to the branch that minimizes the loss function, as indicated by the “no, missing” labels in the tree. For example, if f10 is missing, the data automatically moves to the right branch to continue the decision process.
To improve interpretability for a broader audience, a simplified version of the tree is also presented in Figure 7b. This visualization focuses on the most influential features for predicting compressive strength—COD, Turbidity, and pH—using intuitive thresholds and clearer node labeling. It reflects domain-relevant variables in a readable format and supports the discussion by directly linking feature importance with practical understanding of wastewater quality impacts.
Although the XGBoost model was trained for all four mechanical properties—compressive strength, water absorption, UPV, and DME—only the representative tree for compressive strength is shown here for illustrative purposes. The same modeling approach and interpretability structure apply to other output variables, each benefiting from gradient-based learning of non-linear relationships and feature interactions.
Quantitatively, each node’s decision threshold is determined during model training based on gradient and hessian calculations, optimizing the reduction in prediction error. For instance, the decision node at f14 < 0.264 further splits the data into subsets, refining predictions with lower residual error. The leaf values, such as 3.31, −8.03, or 5.59, contribute to the final weighted prediction of the ensemble, with the weight determined by the learning rate and the tree’s importance in the model [69].
Overall, the tree shown in Figure 7a,b highlights how XGBoost constructs decision trees to model non-linear relationships in the data, efficiently addressing missing values and producing predictions that form the building blocks of the gradient-boosted ensemble. The visualization underscores the model’s interpretability and its capacity to identify meaningful splits in the feature space, which are instrumental in understanding the factors influencing the mechanical properties of concrete paver blocks.
Hyperparameter Optimization
The performance of the XGBoost models is systematically optimized through a robust hyperparameter tuning process [74]. A grid search coupled with cross-validation is employed to identify the best combination of hyperparameters for each target variable. These hyperparameters include key factors such as the number of trees in the model (n_estimators), the maximum depth of each tree (max_depth), the learning rate (learning_rate), the fraction of samples used per tree (subsample), and the fraction of features sampled for each tree (colsample_bytree). Each of these parameters plays a crucial role in balancing the model’s complexity, predictive accuracy, and computational efficiency.
The results of the tuning process for each target variable are summarized in Table 5, which details the optimized hyperparameters for predicting specific mechanical properties. For instance, the model predicting compressive strength performs best with 200 estimators, a learning rate of 0.01, a maximum tree depth of 5, a subsample ratio of 0.8, and a feature sampling ratio (colsample_bytree) of 0.8. These parameters reflect a balance between capturing the complexity of the data and avoiding overfitting, ensuring robust and accurate predictions.
In contrast, the models predicting UPV demonstrate varied complexity based on measurement methods. The direct and indirect UPV models require 200 estimators with a maximum depth of 3, highlighting the need for frequent data partitioning to capture fine-grained relationships despite their relatively shallow tree structures. Conversely, the semi-direct UPV model achieves optimal performance with a maximum depth of 7 and only 50 estimators, reflecting the model’s ability to handle more complex data patterns with fewer trees.
Similarly, the model predicting the DME for the indirect method benefits from a feature sampling ratio of 1.0, emphasizing the importance of utilizing all available features to improve predictive performance. For both direct and semi-direct DME models, lower estimator counts (50–100 estimators) and shallow tree depths (3–7) are sufficient, suggesting more linear or simpler relationships in these datasets.
The choice of subsample and Col sample by tree values further demonstrates model optimization for specific targets. A subsample ratio of 0.8 is commonly observed, effectively reducing overfitting while maintaining high predictive accuracy. For models with higher variability, such as UPV (direct and indirect) and DME (indirect), a subsample ratio of 1.0 ensures full dataset utilization during training, enhancing generalization.
The hyperparameter tuning process underscores XGBoost’s flexibility and adaptability in handling diverse predictive tasks [75]. The tailored selection of parameters for each target variable, as illustrated in Table 5, ensures that the models are both efficient and capable of capturing the complex relationships between wastewater’s physicochemical properties and the mechanical characteristics of concrete paver blocks. This meticulous optimization enables the models to provide reliable and actionable insights into the sustainable use of wastewater in construction materials.
Model Training and Evaluation
The training process is initiated with an enhanced feature set that combines wastewater’s physicochemical properties with interdependent target metrics, excluding the target variable being predicted [76]. This approach leverages relationships among multiple properties to improve model performance. All features are standardized to ensure uniformity in scale, which facilitates faster convergence during model training and enhances the stability of the learning process.
The XGBoost regressor is trained on the prepared dataset using a rigorous five-fold cross-validation technique [74]. This validation method ensures that the model is evaluated across multiple data splits, reducing the potential for overfitting and providing a more reliable estimate of its generalizability. The cross-validation framework ensures that each data point is used for both training and testing, maximizing the utility of the dataset.
During the evaluation phase, the model’s performance is quantified using a set of standardized metrics. These include Coefficient of Determination (R2), which measures the proportion of variance explained by the model; Mean Squared Error (MSE), which quantifies the average squared difference between predicted and observed values; Mean Absolute Error (MAE), which calculates the average absolute deviation of predictions; and Root Mean Squared Error (RMSE), which provides a measure of the average magnitude of prediction error in the same units as the target variable. Together, these metrics offer a comprehensive view of the model’s predictive accuracy and error characteristics [77].
While it is acknowledged that machine learning models, including XGBoost, require retraining or fine-tuning when applied to different datasets, this adaptability should be viewed as a strength rather than a limitation. XGBoost’s flexible architecture enables rapid updates using sliding windows or incremental retraining strategies, without needing to redesign model structure—for example, adaptive XGBoost methods have successfully handled evolving data streams in environmental applications [73,78]. In contrast to rigid regression equations that must be reformulated when new variables or distributions emerge, XGBoost can seamlessly incorporate new data under consistent feature-schema. This quality is particularly advantageous in decentralized or developing contexts—such as varied industrial wastewater zones—where input characteristics may shift over time or location [79]. Although the algorithm itself is well known, our integration of XGBoost into a sustainable construction framework using untreated industrial wastewater, alongside experimental validation, feature importance ranking, and composite scoring of water sources, represents a novel and practically relevant application. Rather than replacing lab testing, the model serves as a complementary decision-support tool—screening and prioritizing wastewater streams before resource-intensive physical trials—thereby optimizing material usage and reducing environmental impact [71]. The model’s predictions depend on the availability of standard physicochemical measurements, including pH, Turbidity, BOD, COD, and TDS. These measurements are typically accessible in industrial factories and basic construction environments that are equipped with basic testing facilities. This ensures that the model’s practical significance remains both realistic and applicable in contexts where routine water quality data can be collected.

4. Results and Discussion

4.1. Experimental Analysis

This section presents the findings of compressive strength, UPV, and water absorption tests on concrete pavers developed from different wastewater origins. These findings underscore the influence of wastewater on strength growth, internal structure, and durability.

4.1.1. Compressive Strength (CS) Test

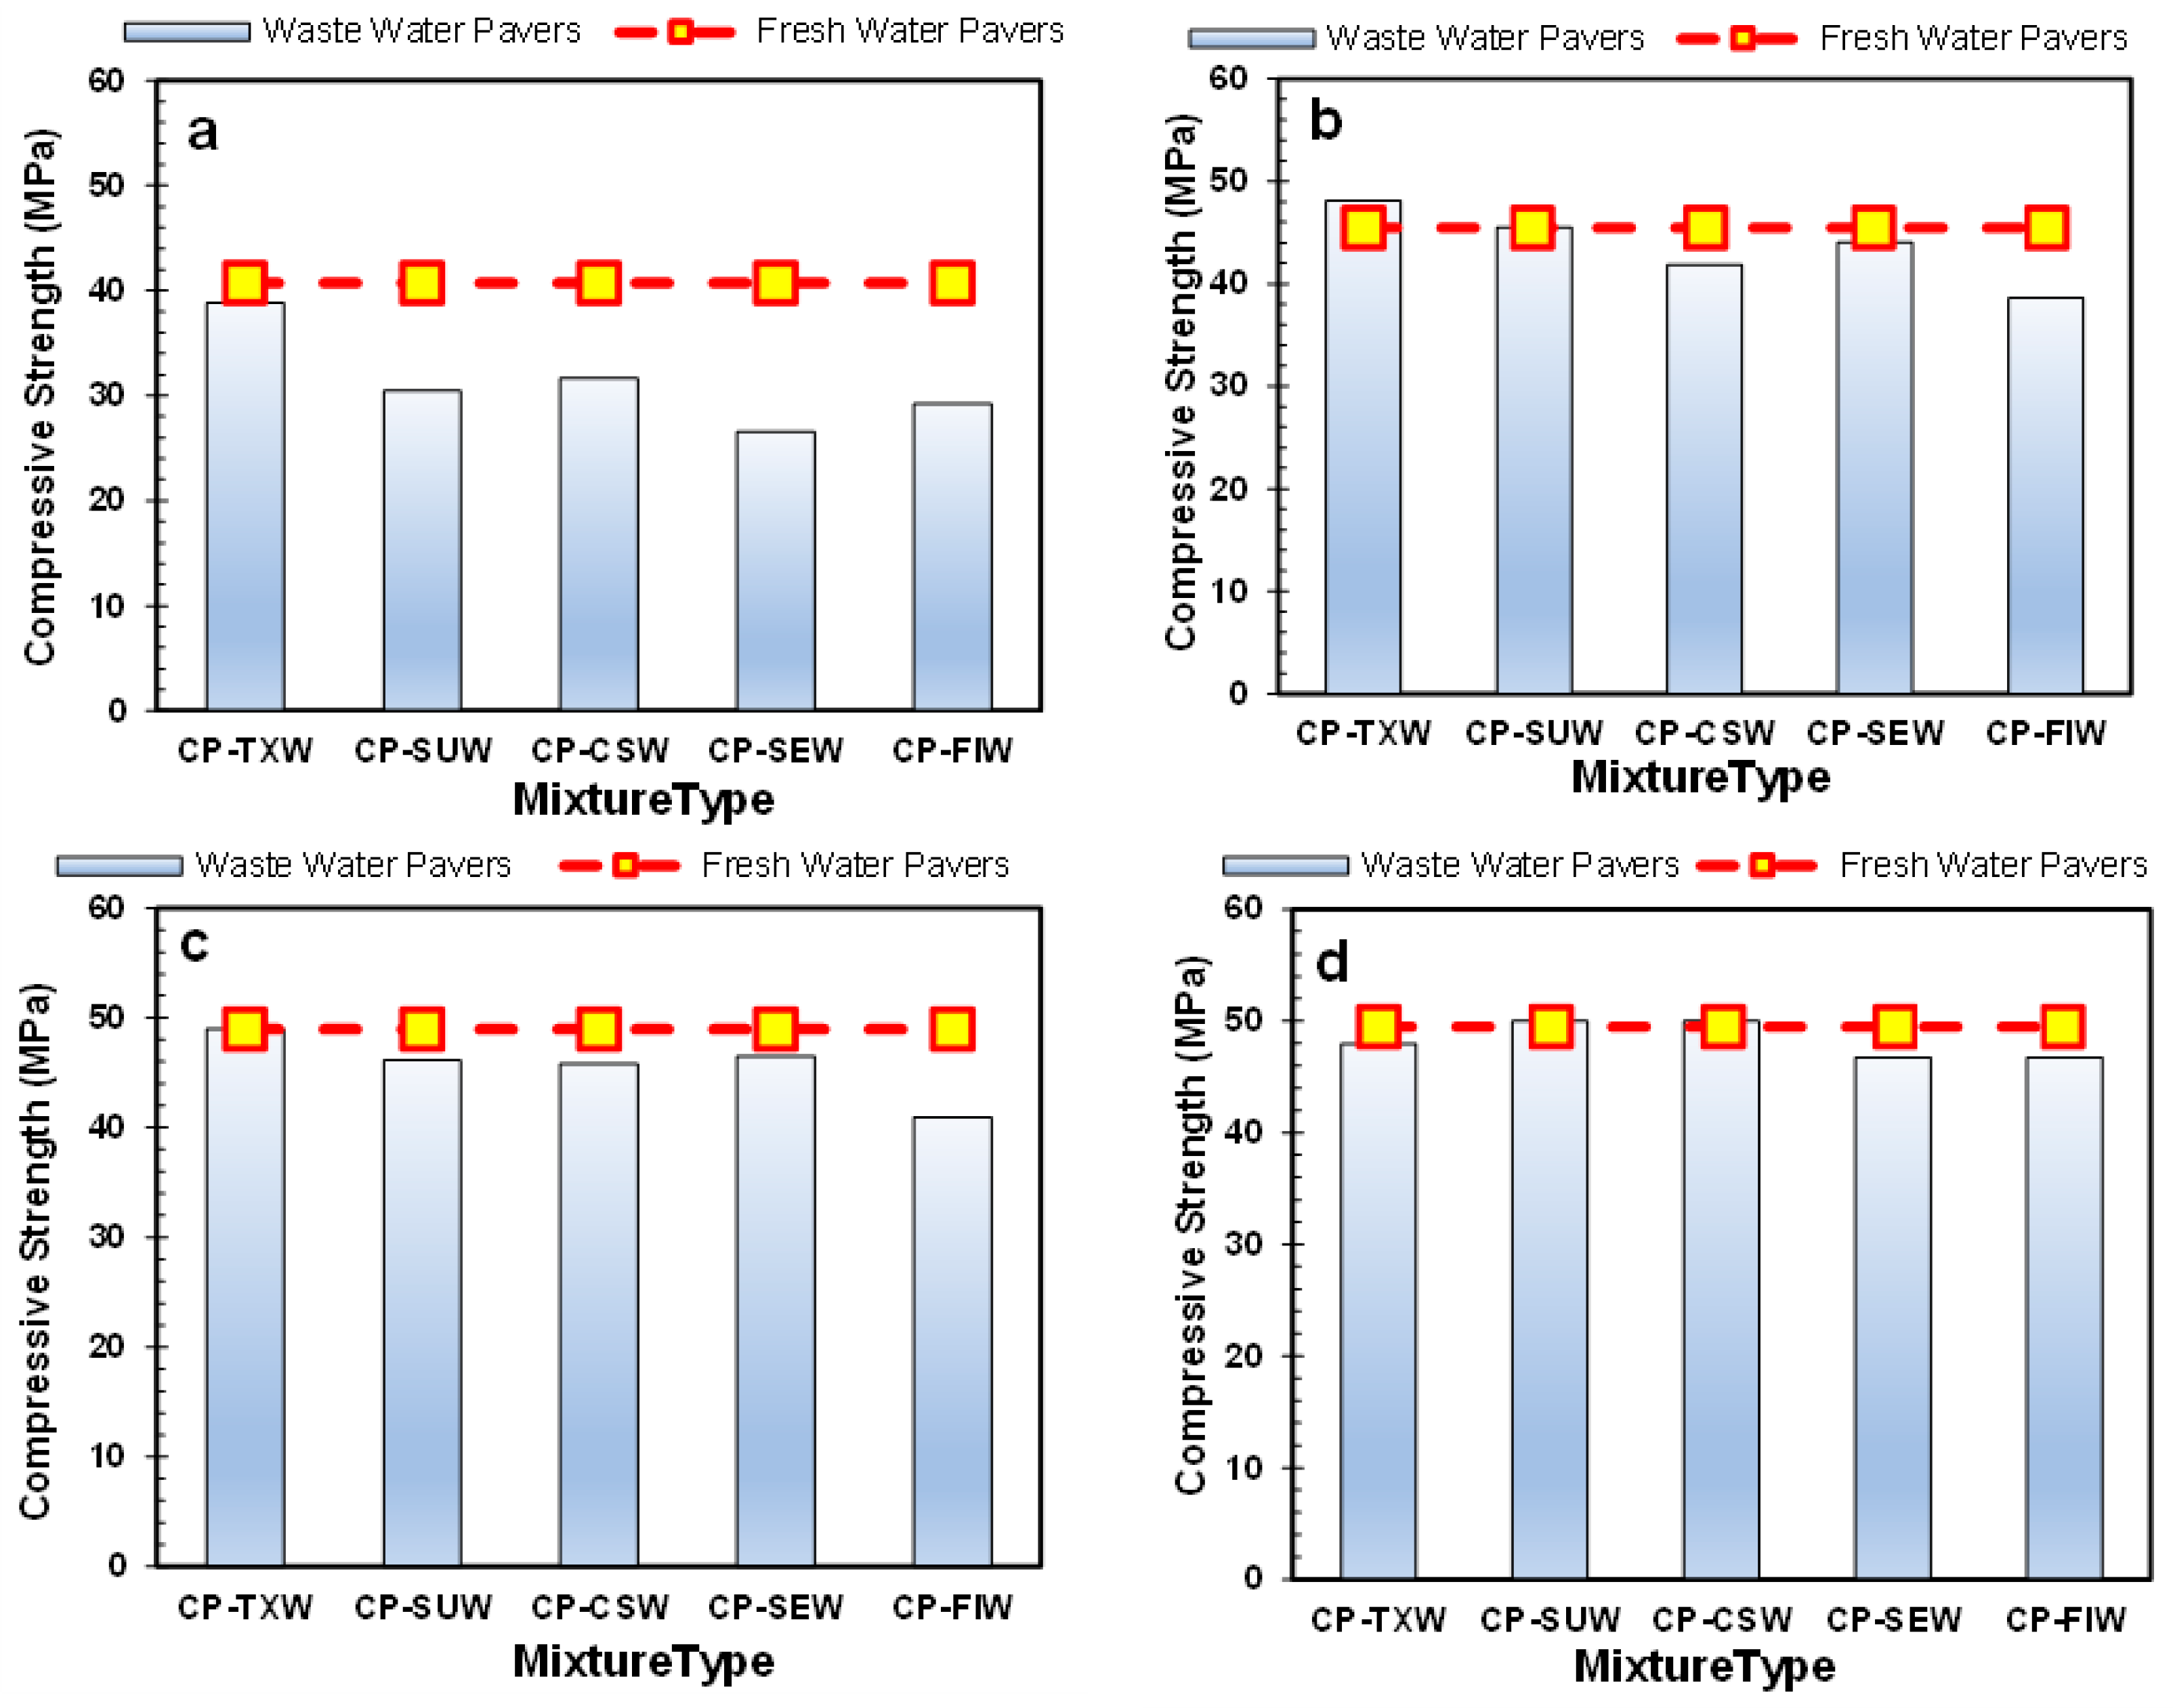
Compressive strength performance is one of the primary indicators of concrete quality, especially for concrete pavers used in load-bearing applications. To ensure durability and structural integrity under traffic loads, ASTM C936 states that concrete pavers should have a minimum compressive strength of 55 MPa at 28 days. The compressive strength of concrete pavers made with wastewater and drinking water was evaluated over 7, 14, 21, and 28 days; the results are illustrated in Figure 8a–d.
At 7 days (Figure 8a), CP-FRW exhibited the highest compressive strength, followed closely by CP-TXW. CP-TXW consistently demonstrated superior compressive strength compared to the other wastewater types. This performance can be attributed to the presence of organic and inorganic pollutants, reactive dyes, and salts in textile wastewater, which promote early hydration reactions and the formation of secondary calcium silicate hydrate (CSH) gel [80]. In contrast, CP-SUW, CP-CSW, and CP-FIW recorded comparatively lower compressive strengths, suggesting their suitability for non-structural or delayed-load applications where high early strength is less critical [81].
At 14 days (Figure 8b), CP-FRW continued to show the highest compressive strength, while CP-TXW maintained strong performance, confirming its ongoing strength development, with CP-SUW closely following. This strength gain in SUW can be attributed to the fine particles in the sludge, which enhance the water-to-cement interaction and promote consistent hydration over time [82]. CP-CSW and CP-FIW exhibited modest strength improvements but remained lower than the leading alternatives.
By 21 days, as shown in Figure 8c, CP-TXW recorded the highest compressive strength, closely followed by CP-FRW. This near-equivalence reinforces CP-TXW’s potential as a reliable substitute for fresh water in concrete production. CP-SUW also achieved comparable strength values, reflecting its competitiveness. Meanwhile, CP-CSW and CP-FIW demonstrated lower strength gains, suggesting limitations in their reactivity or chemical contribution to the hydration process.
At 28 days (Figure 8d), CP-SUW demonstrated superior compressive strength compared to CP-FRW, underscoring its potential for high-strength concrete applications. This enhancement may be attributed to the acidic nature of sugar mill wastewater, which could accelerate cement hydration and lead to a denser, more refined microstructure [83]. CP-CSW and CP-TXW also showed impressive strength development, indicating their viability for structural-grade applications [81]. The consistent progress of CP-TXW throughout the curing periods illustrates its sustainability and potential as a substitute material. Although CP-FIW and CP-SEW exhibited slightly lower compressive strengths, they still met the minimum ASTM requirements for paver applications. These results demonstrate the possibility of specific wastewater sources, especially those from textile and sugar mills, as sustainable alternatives to potable water in the manufacturing of concrete pavers. Their contribution to strength enhancement facilitates overarching objectives for resource-efficient and environmentally sustainable construction methods.

4.1.2. Water Absorption (WA)Test

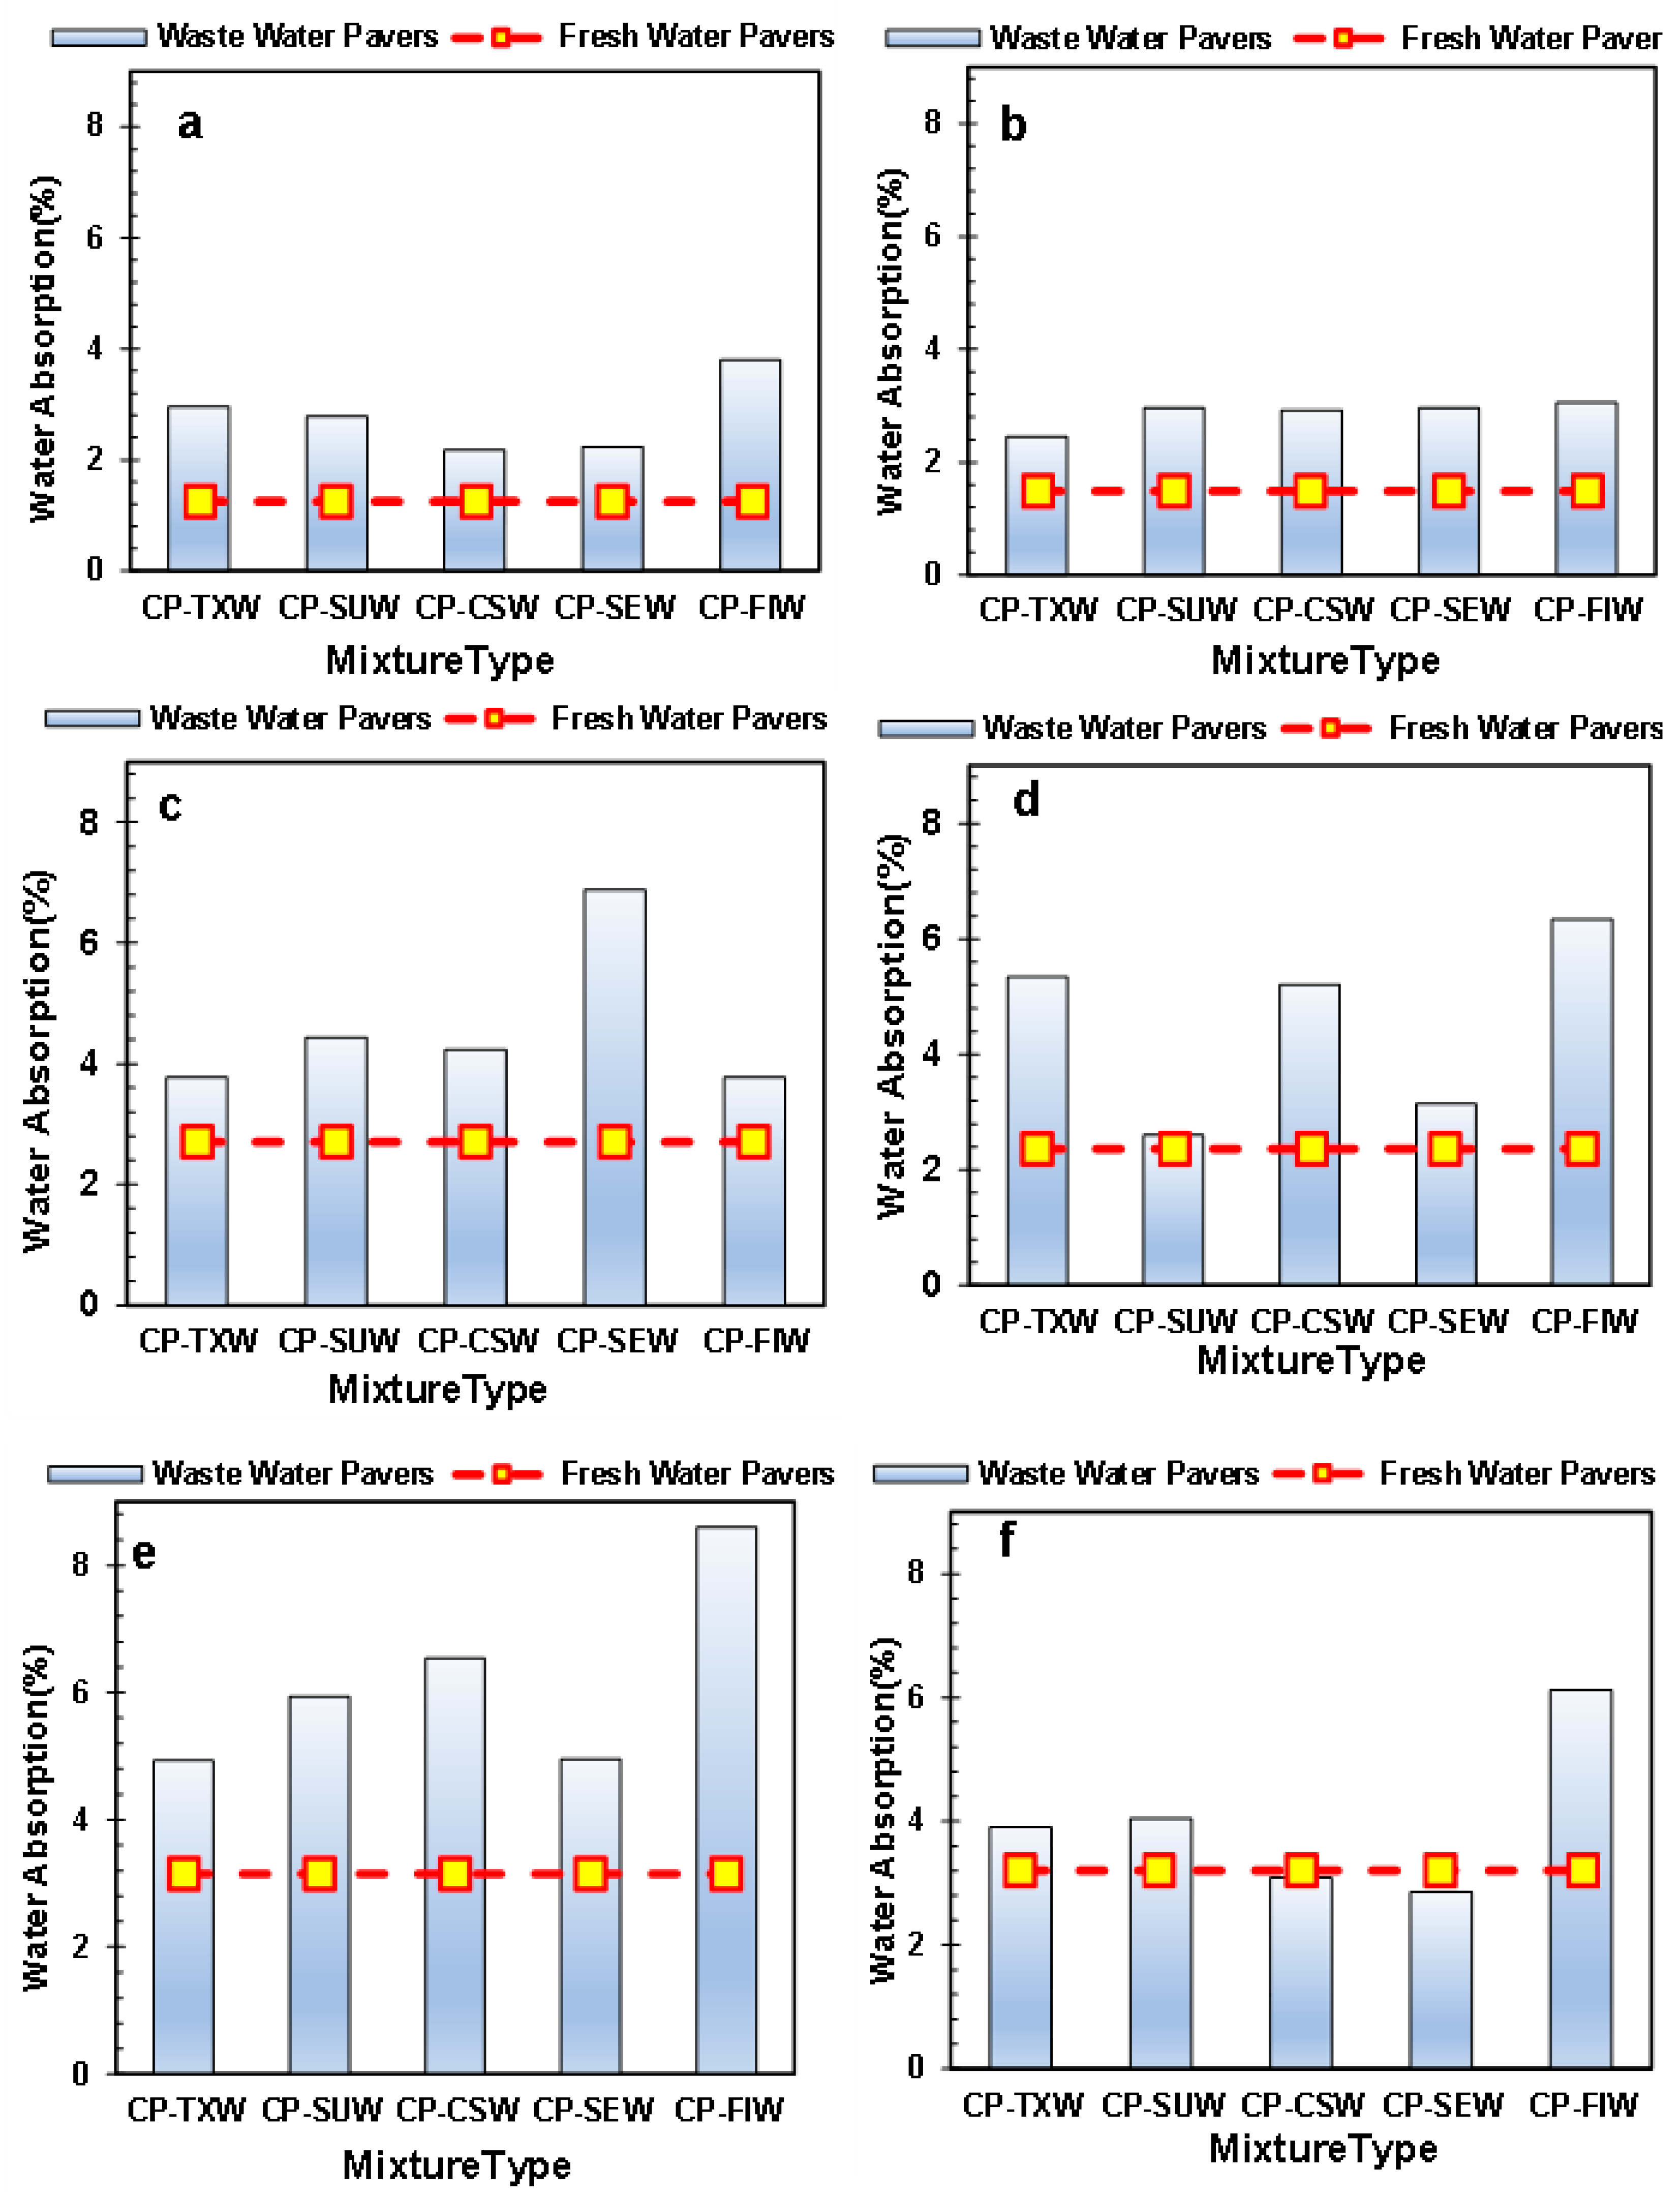
Water absorption testing is a critical measure of concrete resistance to water infiltration, directly linked to its durability. Lower water absorption indicates better resistance to moisture ingress, which is essential for long-term performance. The results of water absorption tests for all types of concrete pavers are presented in Figure 9a–f. A mixed trend is observed among wastewater-based concrete pavers, with absorption rates showing variability across different types of wastewaters. Compared to CP-FRW, all wastewater-derived concrete pavers exhibit higher or comparable water absorption at 7, 14, and 21 days.
At 30 min (Figure 9a), the water absorption properties of wastewater-based concrete pavers exhibited considerable variation. CP-FIW displayed the highest absorption at this early stage, likely attributable to incomplete hydration and increased initial porosity, a typical condition before substantial CSH formation. In contrast, CP-SEW showed low water absorption, indicating early matrix densification potentially facilitated by the calcium and magnesium ions witnessed in sewage effluent, which are recognized for promoting early hydration and reducing permeability [84].
After one day (Figure 9b), both CP-TXW and CP-CSW exhibited higher water absorption rates compared to CP-FRW. This behavior can be attributed to the presence of salts, reactive dyes, and organic compounds found in textile and car service wastewater, which contribute to internal moisture retention and slow down pore refinement. In contrast, CP-SEW consistently displayed lower absorption values, underscoring the significance of multivalent cations in facilitating rapid microstructural development and enhancing early-stage durability [12].
At 7 days (Figure 9c), a mixed trend in absorption was observed. CP-TXW, CP-CSW, and CP-SUW demonstrated higher or comparable absorption levels to CP-FRW. This phenomenon can be attributed to organic and inorganic matters that hinder hydration and densification. Nevertheless, the early compressive strength of CP-TXW remained high, suggesting that secondary hydration reactions involving reactive dyes and salts may promote the formation of additional CSH gel, effectively countering the increased water absorption [85].
By 14 days (Figure 9d), CP-CSW reached peak absorption, while CP-SUW and CP-FIW began showing a downward trend. This improvement likely results from the delayed pozzolanic activity and ongoing hydration processes enabled by the chemical makeup of the wastewater, particularly nutrients and organic matter that sustain long-term matrix development. CP-SEW continued to show minimal absorption throughout, further supporting its suitability in durability-sensitive applications.
At 21 days (Figure 9e), the majority of wastewater-based mixtures exhibited additional reductions in water absorption. CP-CSW began to decrease from its peak, whereas CP-SUW continued to improve, indicating prolonged hydration and pore refinement. Although CP-TXW maintained slightly higher absorption values, its compressive strength remained competitive, suggesting that increased moisture retention does not inherently undermine structural integrity when bolstered by ongoing secondary gel formation.
By 28 days (Figure 9f), all wastewater-derived pavers showed a substantial decrease in absorption rates. Both CP-SUW and CP-FIW attained absorption levels comparable to or lower than those of CP-FRW, highlighting the efficacy of extended hydration and matrix densification over time. This densification is possibly aided by the formation of secondary CSH, a phenomenon supported by previous studies on hydration in chemically enriched environments [86]. For applications necessitating controlled moisture retention throughout extended curing durations, CP-FIW is a viable solution [26]. CP-SEW, in contrast, exhibited consistently low absorption rates and sufficient strength, signifying its substantial potential for applications necessitating both durability and strength. In contrast, while CP-TXW and CP-CSW exhibited slightly higher absorption values, they managed to maintain sufficient mechanical performance, rendering them suitable for strength-focused designs with less rigid permeability standards.
These findings collectively indicate that while wastewater may lead to increased porosity and moisture retention of concrete at early ages, the subsequent hydration and densification processes result in acceptable or enhanced water absorption performance by the 28-day mark. This highlights the potential for incorporating treated wastewater into sustainable concrete production without jeopardizing essential durability parameters, as long as the mix design is optimized to address early-age porosity.

4.1.3. Ultrasonic Pulse Velocity (UPV) Test

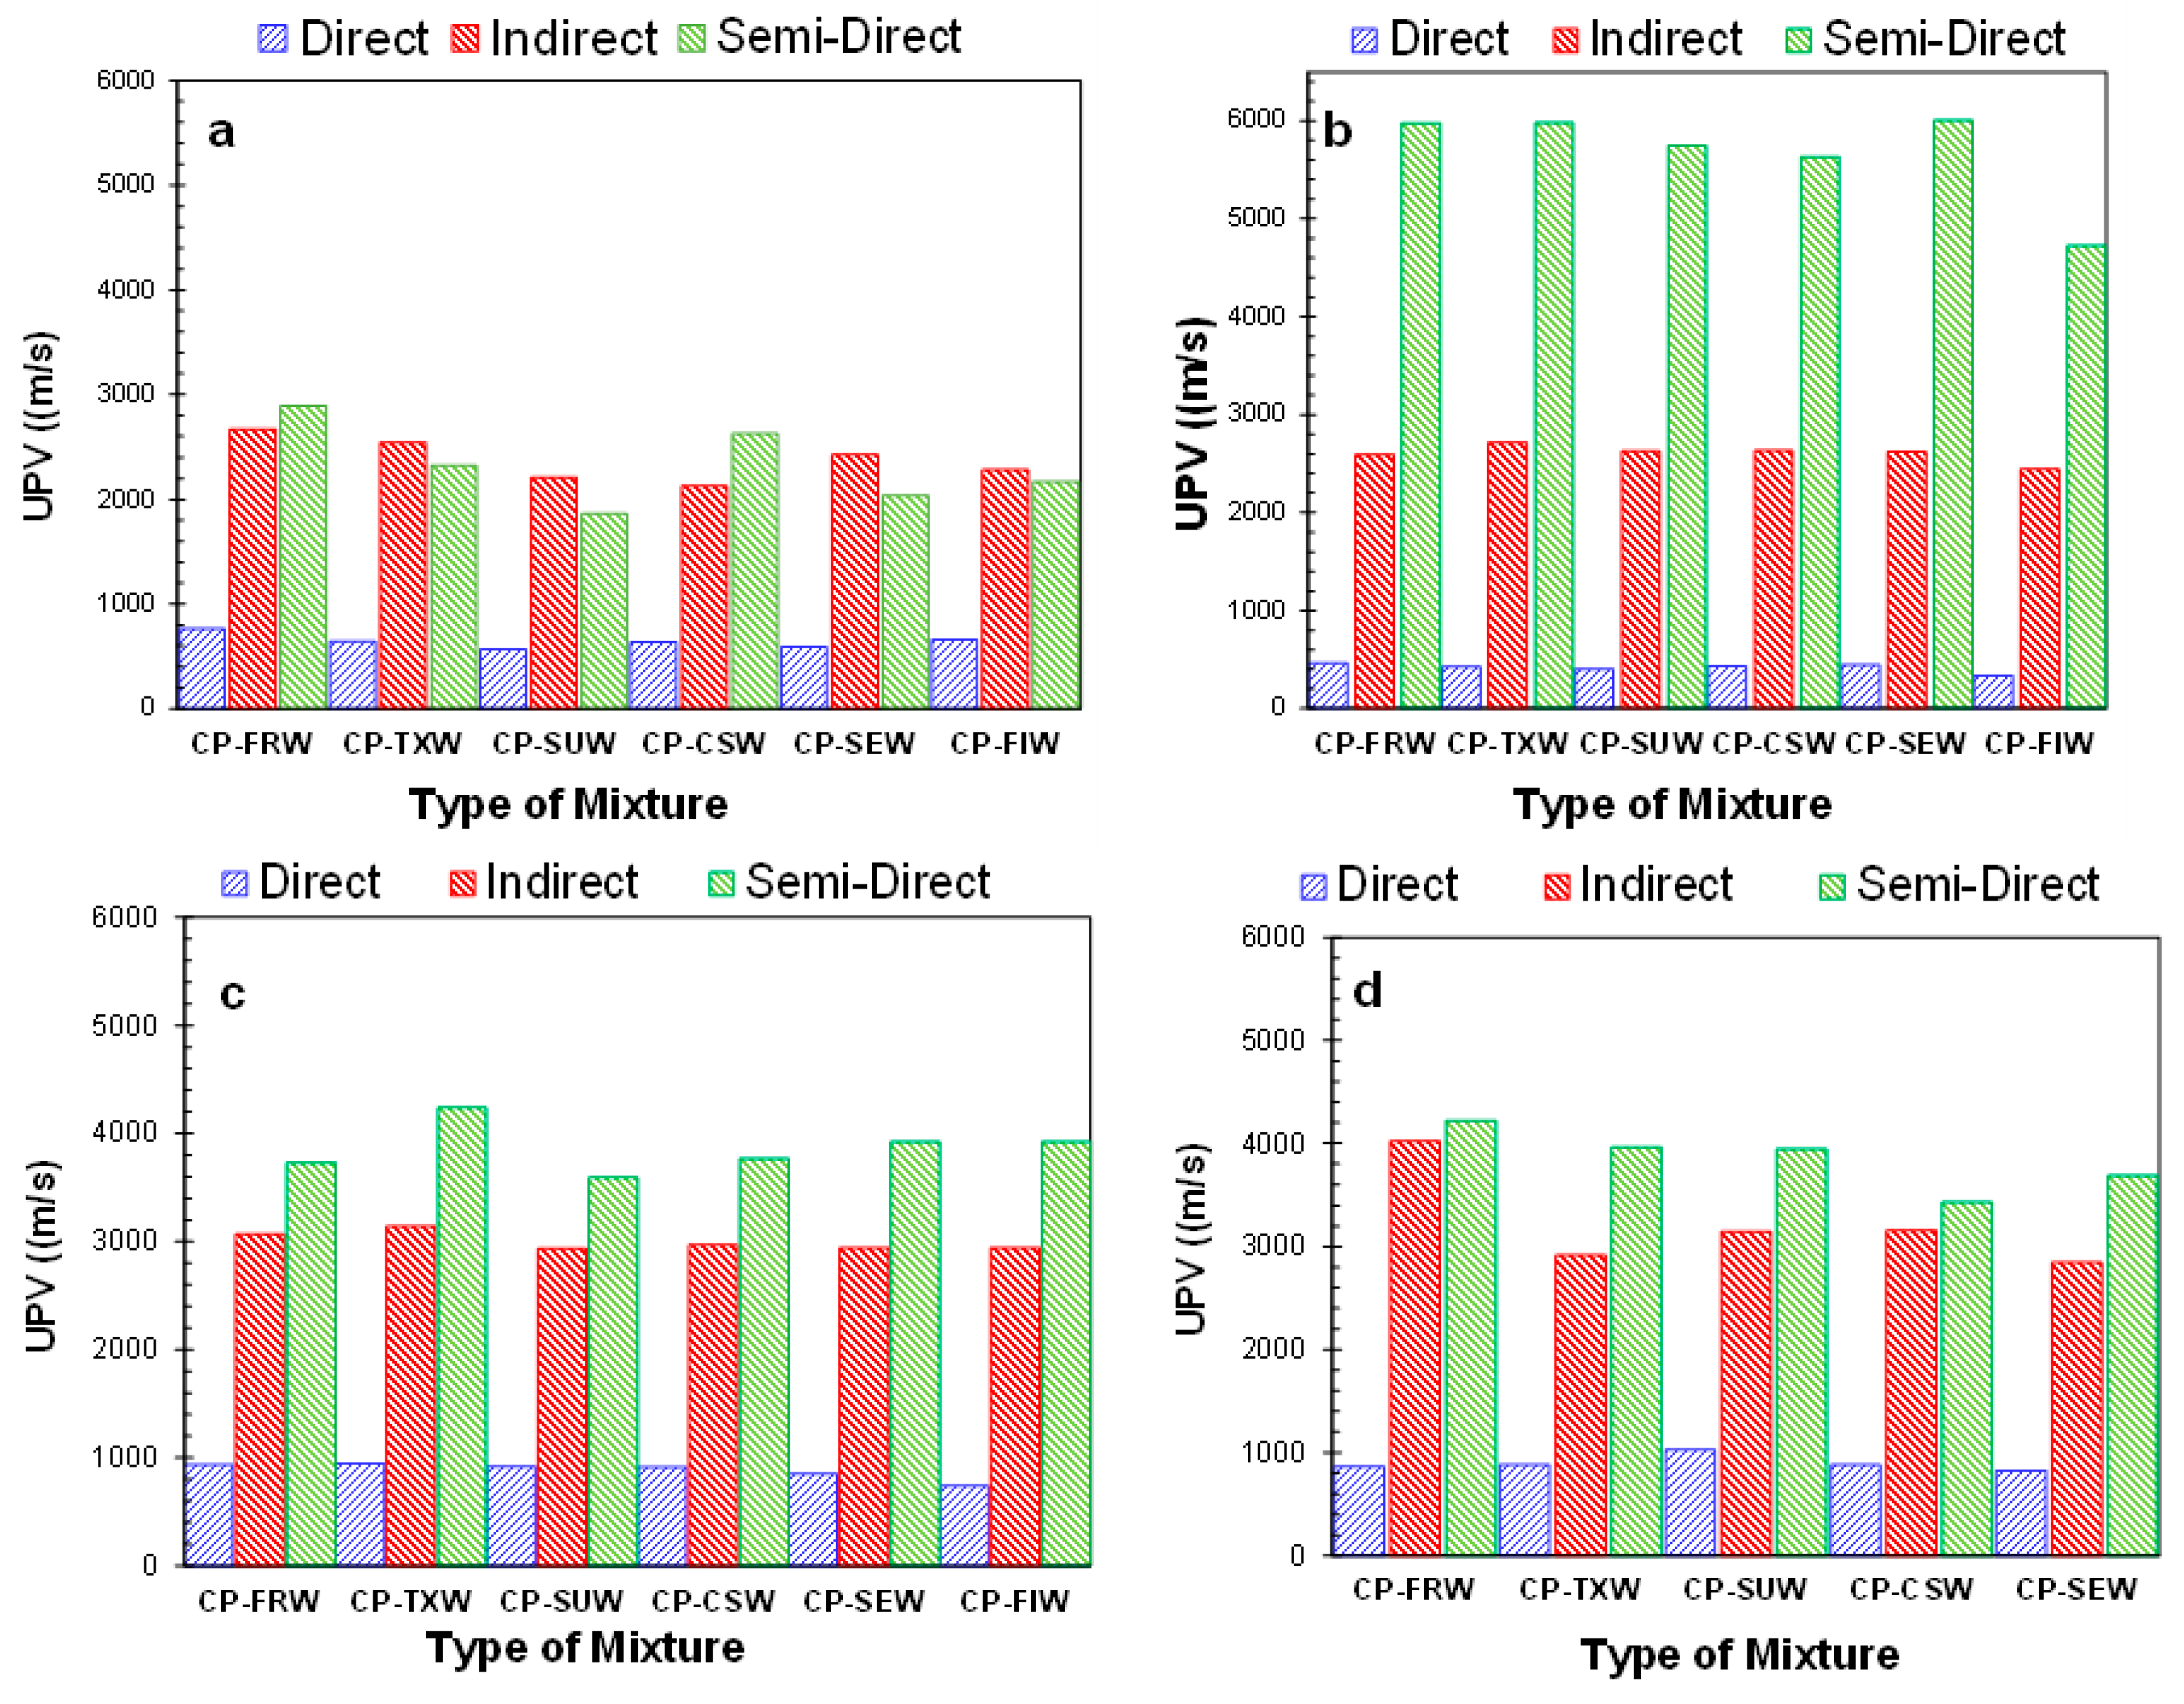
The UPV results at 3, 7, 14, and 28 days are presented in Figure 10a–d. At 3 days (Figure 10a), CP-FRW demonstrated the highest UPV among all wastewater-based concrete pavers, while CP-TW exhibited comparable values, likely attributable to the beneficial constituents in textile wastewater, including potassium, calcium, and magnesium, which improve the microstructure and hydration [87]. The fine particulate matter in textile wastewater enhances the density of the matrix by occupying micro voids, leading to elevated UPV values [80]. In contrast, CP-SSW and CP-SMW demonstrated marginally lower values at this stage, likely due to the presence of organic matter and sugar in SSW and SMW, which may hinder early hydration and compromise the structural integrity of the matrix [83]. CP-FIW and CP-SWG exhibited the lowest UPV values at this age, correlating with their diminished compressive strength and potentially attributable to their specific chemical compositions.
At 7 days (Figure 10b), a comparable pattern was noted, with CP-FRW and CP-TW exhibiting the highest UPV values among the samples, suggesting the persistent influence of textile wastewater constituents continued to facilitate microstructural densification. CP-SSW and CP-SMW showed moderate improvements, indicating the progression of hydration and a partial recovery from early-age interference. CP-FIW and CP-SWG again showed the lowest UPV readings, suggesting a slower or less efficient hydration process compared to the other samples.
At 14 days (Figure 10c), CP-TW nearly equaled CP-FRW in UPV values, indicating ongoing hydration and structural advancement. Both CP-SSW and CP-SMW also exhibited improvement, nearing the UPV levels of CP-FRW and CP-TW. This favorable trend signifies the gradual densification of the matrix due to secondary hydration reactions, particularly in wastewater mixtures. Conversely, CP-FIW and CP-SWG remained comparatively lower, implying that their hydration processes are either slower or less thorough.
At 28 days (Figure 10d), all wastewater-based concrete pavers demonstrated significant increases in UPV values, with CP-TW achieving the highest UPV among all mixtures, exceeding CP-FRW. This suggests robust microstructural development and pulse velocity response; however, while most wastewater-based mixtures neared CP-FRW levels, CP-FIW and CP-SWG lagged slightly, affirming the impact of chemical composition on long-term hydration and matrix densification. Figure 10 illustrates the role of the indirect and semi-direct paths in the testing process. These paths, while yielding marginally reduced velocities, provide valuable insights into the surface quality of the concrete pavers due to their heightened sensitivity to surface pores and microcracks. The direct transmission path, on the other hand, consistently yields the highest UPV values as the wave traverses the full thickness, reflecting the bulk density and internal homogeneity of the concrete. This confirms that the testing path influences the measured wave velocity, with the direct path serving as the primary reference for comparing the bulk quality of the concrete pavers.
The DME results at 3, 7, 14, and 28 days are illustrated in Figure 11a–d. At 7 days (Figure 11a), CP-FRW exhibited the highest DME value among all concrete mixes, with CP-TW closely following due to its advantageous mineral composition and the prompt formation of hydration products that enhance elastic stiffness [86]. CP-SSW and CP-SMW displayed marginally lower values, likely attributable to sugar and organic interference during the initial hydration phase [12]. CP-FIW and CP-SWG recorded the lowest DME values, consistent with their diminished UPV and early compressive strength, likely resulting from excessive organic load and delayed C–S–H development [85].
At 14 days (Figure 11b), CP-TW demonstrated DME values comparable to those of CP-FRW, suggesting a stable progression of the microstructure. In contrast, CP-SSW and CP-SMW exhibited an upward trend, indicating ongoing hydration of unreacted particles and a reduction in porosity. Meanwhile, CP-FIW and CP-SWG maintained lower DME values, reflecting limited stiffness development at this stage due to incomplete hydration and reduced matrix compactness.
At 21 days (Figure 11c), DME values for CP-TW closely approached those of CP-FRW, and CP-SSW and CP-SMW showed further improvement. These trends suggest that the delay in hydration initially caused by wastewater constituents may be mitigated over time, allowing the modulus of elasticity to increase steadily [26]. However, CP-FIW and CP-SWG remained at the lower end, consistent with their limited hydration advancement and nutrient interference in gel formation.
By 28 days (Figure 11d), most of the wastewater-based concrete pavers showed significant increases in DME values, although they remained slightly lower than those of CP-FRW. CP-TW achieved nearly equivalent DME values, indicating a fully developed microstructure. CP-SSW and CP-SMW demonstrated promising results, confirming their long-term viability. Conversely, while CP-FIW and CP-SWG exhibited some improvement, they still presented relatively lower DME values, suggesting potential limitations in long-term stiffness development associated with their respective wastewater sources [86]. The DME values are indicative of the UPV measurement path employed, with the direct path DME serving as the primary metric for assessing bulk stiffness in the comparison of concrete quality across the mixes.

4.2. Machine Learning Model Analysis and Insights

Building upon the experimental performance metrics, this section presents the ML analysis of concrete paver performance, covering model evaluation, feature importance, and composite scoring of wastewater sources. While experimental tests measured CS, WA, UPV, and DME, the ML models provide deeper insights into the influence of individual wastewater properties on these metrics. This integrated approach validates experimental findings and identifies key physicochemical factors critical for optimizing sustainable concrete production.

4.2.1. Model Performance Metrics

The predictive performance of the XGBoost models for various mechanical properties of concrete paver blocks was evaluated using standard metrics (Table 6): MSE, RMSE, MAE, and R2. These metrics provide a comprehensive understanding of the model’s ability to replicate observed trends and capture the inherent variability in the data.
For the model’s performance in predicting water absorption (WA) reveals modest accuracy. It achieved an MSE of 7.92, an RMSE of 2.81, and an MAE of 2.04. The R2 value of 0.02 indicates the model struggles to explain the variance in WA, likely due to complex, non-linear interactions between the physicochemical properties of the concrete and the environmental factors influencing water absorption.
In contrast, for compressive strength (CS), the model demonstrated strong predictive capabilities. The MSE was 37.60, with an RMSE of 6.13 MPa and an MAE of 4.94 MPa. Notably, the R2 value of 0.92 indicates that 92% of the variability in CS was captured by the model, reflecting its effectiveness in handling mechanical properties governed by more linear and predictable relationships.
For ultrasonic pulse velocity (UPV) across different configurations—direct, indirect, and semi-direct—the XGBoost models showed exceptional predictive performance. The direct mode achieved an MSE of 41,106.78, an RMSE of 202.75 m/s, and an MAE of 184.72 m/s with an R2 of 0.97, indicating high accuracy. The indirect mode further improved upon this, achieving an MSE of 11,345.74, an RMSE of 106.52 m/s, and an MAE of 66.41 m/s with an outstanding R2 of 0.99, capturing nearly all the variance. While the semi-direct mode exhibited higher errors (MSE of 5,605,807, RMSE of 2367.66 m/s, and MAE of 1223.04 m/s), the R2 remained robust at 0.97, suggesting strong predictive reliability despite the increased variability.
The models also performed commendably in predicting the DME. For the direct mode, the model achieved an MSE of 0.33, an RMSE of 0.57 GPa, and an MAE of 0.36 GPa with an impressive R2 of 0.99. The indirect mode followed closely, with an MSE of 2.32, an RMSE of 1.52 GPa, and an MAE of 1.01 GPa, supported by an R2 of 0.98. However, the semi-direct DME predictions were more variable, as reflected by an MSE of 3355.14, an RMSE of 57.92 GPa, and an MAE of 34.10 GPa. Although the R2 value dropped to 0.80, it still indicates a substantial level of explanatory power, albeit less precise than the direct and indirect modes.
In summary, the performance metrics suggest that XGBoost models excel in predicting mechanical properties with well-defined, linear relationships, such as compressive strength and pulse velocity. The models faced challenges in predicting properties like water absorption and semi-direct DME, where complex, non-linear interactions play a significant role. Nonetheless, the consistently high R2 values across most targets reaffirm the models’ robustness and potential for practical applications, making them valuable tools for predictive modeling in concrete paver block analysis.

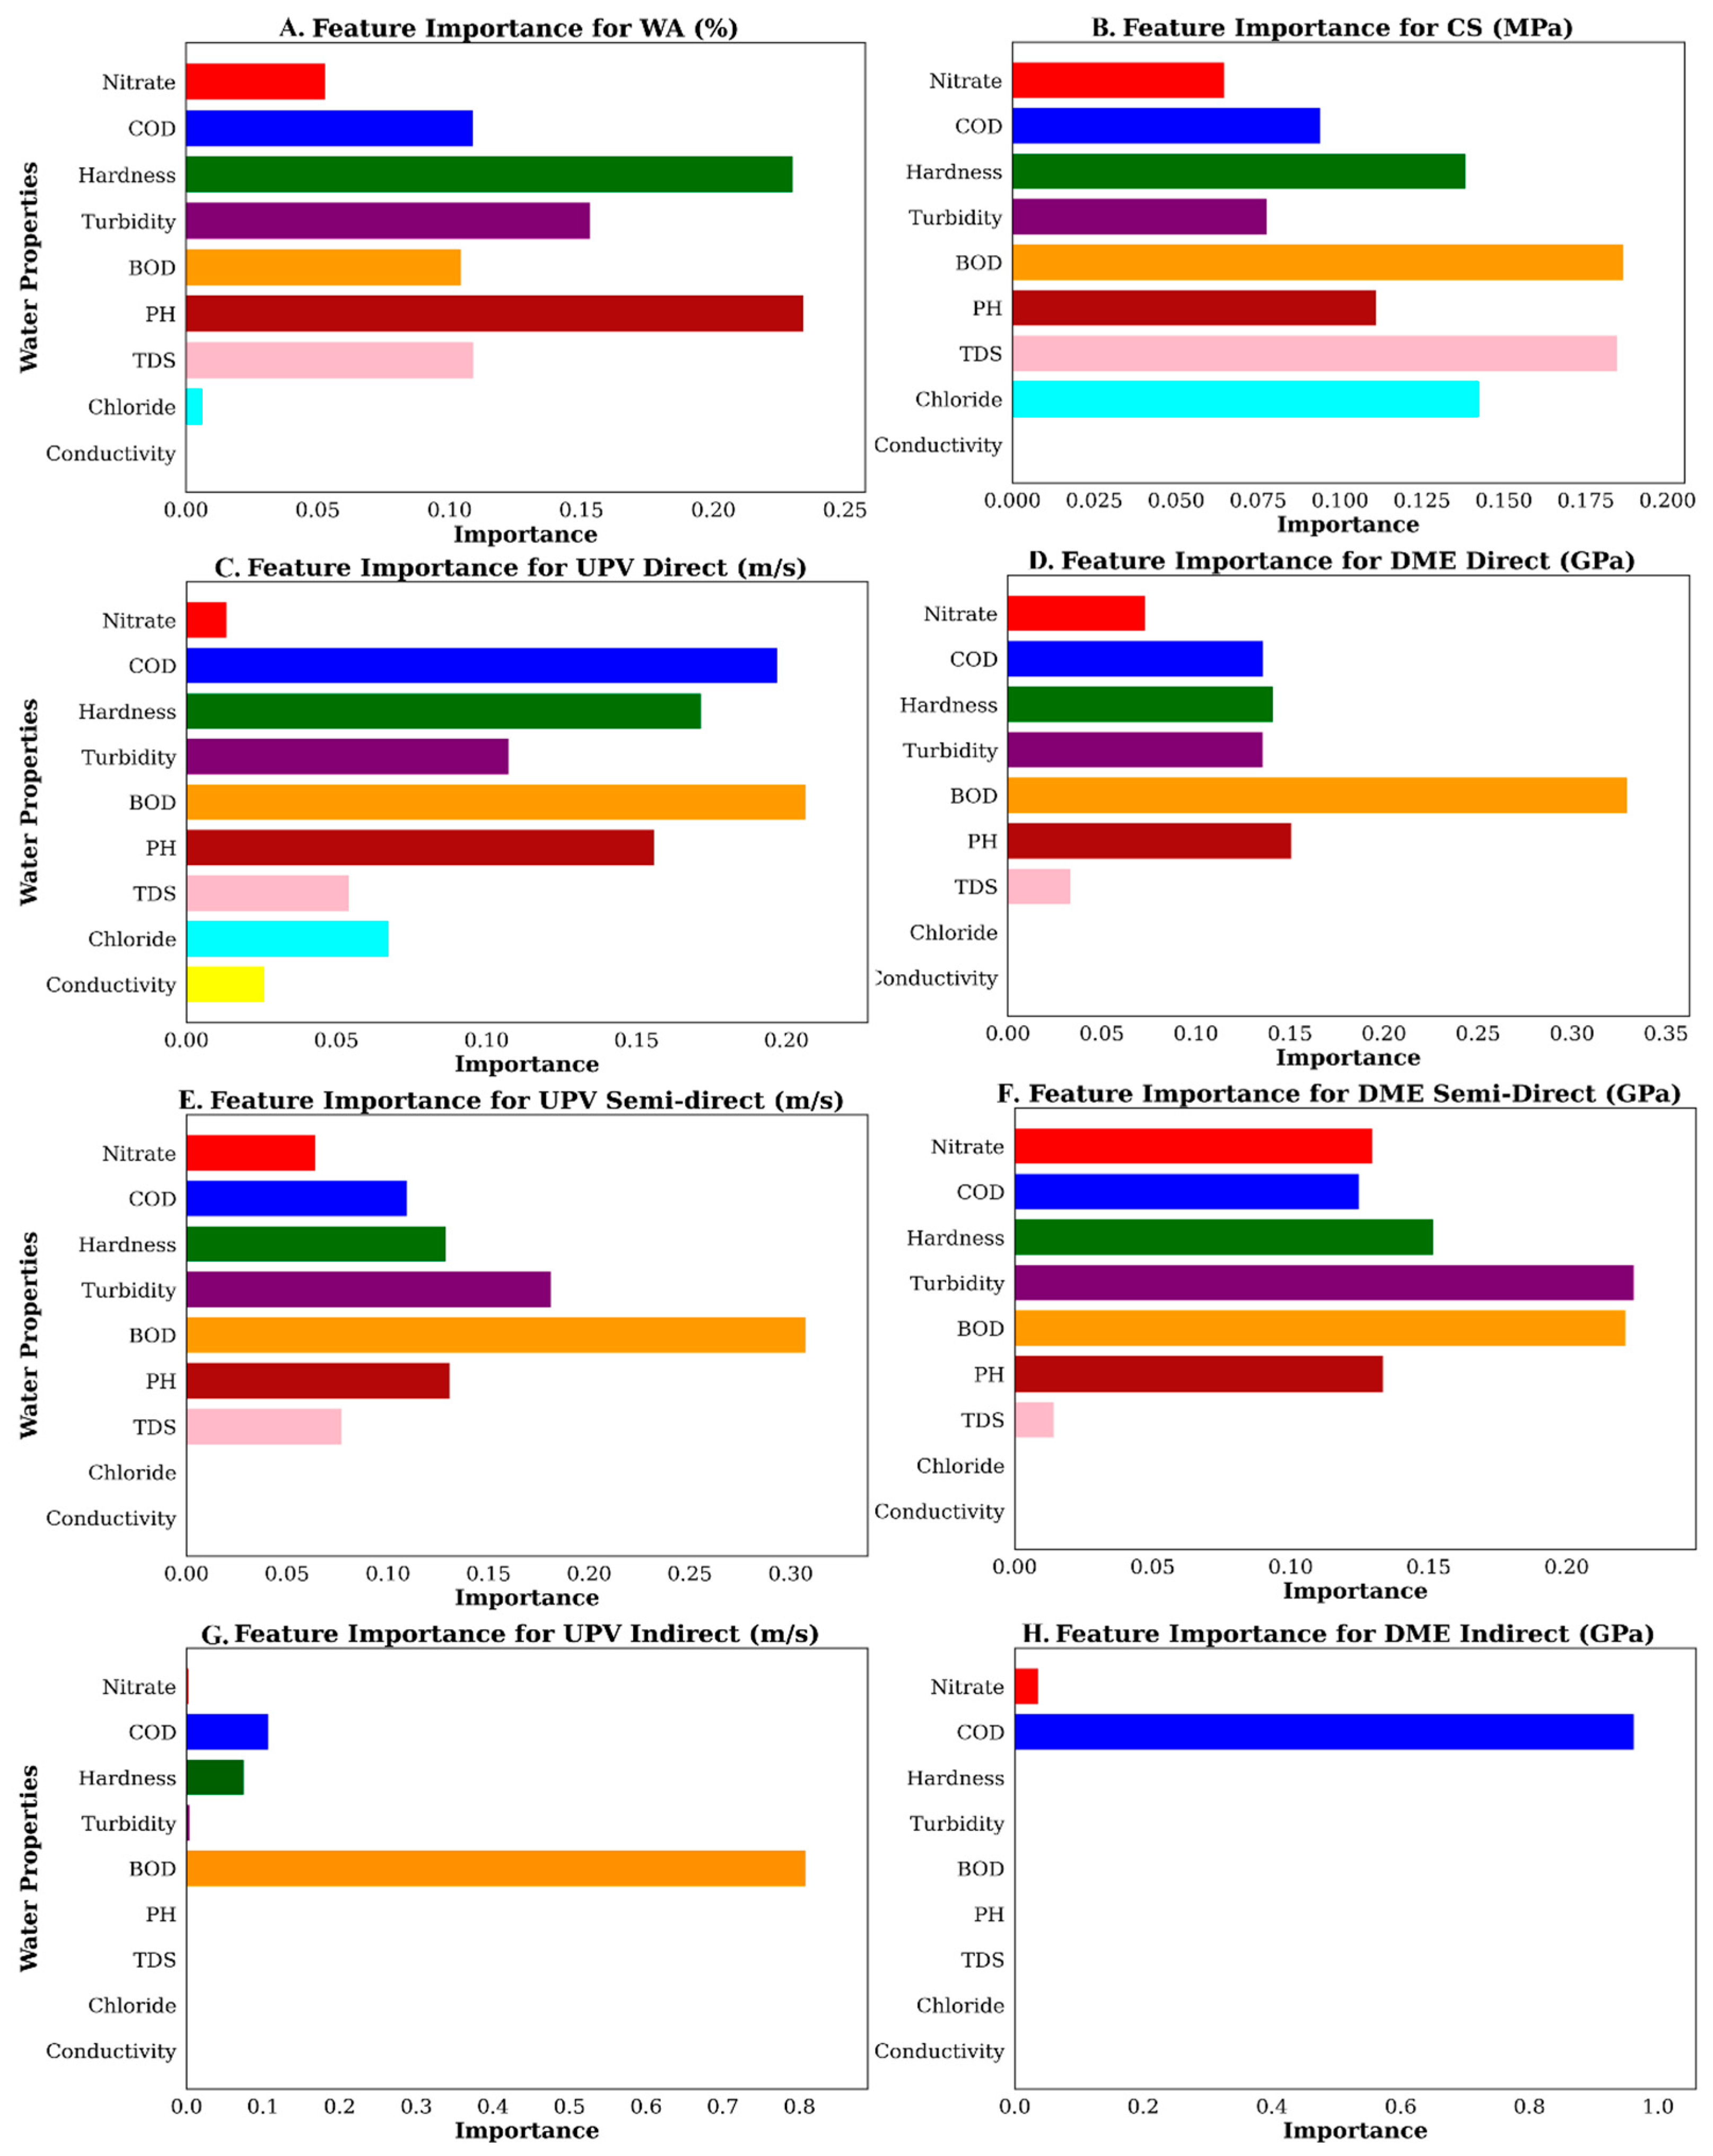
4.2.2. Feature Importance Across Targets

Building upon the performance metrics, the feature importance analysis provides a deeper understanding of the contributions of individual physicochemical properties to the predictive models. Figure 12 and Figure 13 collectively illustrate the significance of these features, both at the individual target level and in cumulative terms across all targets.
In Figure 12A, representing water absorption(WA %), Hardness emerges as the most influential factor, contributing approximately 23.03% to the model’s predictions. This is followed by Turbidity (15.35%) and COD (10.89%), indicating that both mineral content and suspended particles significantly affect the absorption behavior of concrete paver blocks. The relatively high importance of BOD (10.45%) and TDS (13.11%) underscores the role of organic and dissolved content. Nitrate has a lower importance of 5.30%, suggesting a more limited effect in this context.
For compressive strength(CS) in Figure 12B, BOD (18.65%) and TDS (18.46%) are the most dominant factors, followed closely by chloride (14.24%) and Hardness (13.85%). The significance of pH (11.12%) highlights the role of water alkalinity in cement hydration and strength development. These results collectively suggest that the ionic and organic content of water strongly influence concrete’s mechanical strength.
The ultrasonic pulse velocity (UPV) measurements under different modes highlight varying sensitivities to water properties. In Figure 12C (UPV Direct), BOD (17.35%) is the most critical contributor, followed by Turbidity (13.82%) and Hardness (11.24%), indicating that both organic content and suspended particles influence wave propagation. In Figure 12E (UPV Semi-Direct), BOD again dominates (29.37%), alongside Turbidity (16.45%) and Hardness (12.58%). Notably, Figure 12G (UPV Indirect) reveals an overwhelming influence of BOD (78.21%), far surpassing other features such as COD (4.95%) and Hardness (3.48%). This suggests that organic content significantly alters internal porosity and structural continuity, particularly in indirect UPV assessments.
The dynamic modulus of elasticity (DME) predictions also show mode-dependent feature sensitivities. In Figure 12D (DME Direct), BOD leads with 33.41% importance, followed by pH (20.14%) and Hardness (13.45%), suggesting that organic matter and alkalinity influence the stiffness and elastic response of the concrete. In Figure 12F (DME Semi-Direct), while BOD (22.15%) remains dominant, Hardness (15.36%) and pH (13.92%) also contribute substantially, indicating a more balanced dependency across multiple water parameters. In stark contrast, Figure 12H (DME Indirect) reveals an extreme reliance on COD (98.12%), with negligible contributions from all other features. This points to a highly deterministic and potentially non-linear relationship between COD levels and the material’s dynamic modulus under indirect measurement configurations.
Moving beyond individual targets, Figure 13A presents the cumulative feature importance across all models. Here, BOD exhibits the highest cumulative importance (≈2.16), followed by COD (1.84) and Hardness (1.04). This highlights the broad relevance of organic and chemical pollutants, as well as mineral content, in shaping various concrete performance metrics. pH (0.91) and Turbidity (0.88) also demonstrate moderate yet consistent contributions, reinforcing their role in influencing hydration reactions and internal structure.
Figure 13B provides a distributional view of feature importance via boxplots. BOD shows the widest range, with a mean importance of 0.27 and values reaching up to 0.81, reflecting its dominant but variable role across targets. COD displays a similar pattern (mean 0.23, max 0.96), especially elevated in DME Indirect. Hardness, while showing lower variability, maintains a consistent influence (mean 0.13), affirming its baseline significance across mechanical and ultrasonic outcomes. Both pH and Turbidity hover around a mean importance of 0.11, indicating moderate but steady impact across prediction tasks.
Overall, BOD consistently ranks among the top predictors, particularly in the UPV and DME models, reinforcing its central role in altering concrete’s internal structure and mechanical response. Hardness and Turbidity are pivotal in WA and UPV analyses, suggesting the importance of physical and mineral composition. COD, despite being less consistent, shows overwhelming dominance in DME Indirect mode, implying potential for model simplification using fewer variables in specific contexts.
In conclusion, this feature importance analysis complements the model performance metrics by elucidating the underlying physicochemical drivers of predictive accuracy. These insights offer valuable guidance for future experimental design, model refinement, and water quality control in concrete applications.
While the XGBoost algorithm itself is well established, the novelty of this research lies in its application context and its integration with experimental validation. To the authors’ knowledge, this is among the first studies to comprehensively model mechanical properties of concrete using untreated industrial wastewater from five distinct sectors—textile, sugar mill, sewage, carwash, and fertilizer—while simultaneously identifying the governing physicochemical parameters for each performance metric [79]. Through feature importance analysis [71], the model not only predicts performance but also reveals critical chemical drivers such as BOD, Turbidity, and Hardness. This dual role of forecasting and explanation allows for data-driven selection and ranking of wastewater sources, as demonstrated through the composite scoring system. This approach moves beyond standard regression by combining experimental mechanics, environmental chemistry, and machine learning into a single evaluative framework aimed at guiding practical sustainability decisions in real-world construction contexts.

4.2.3. Water Source Composite Score and Ranking

Following the feature importance analysis, the performance of the water sources used in the production of concrete paver blocks is evaluated based on their influence on mechanical properties. The composite scores are calculated by aggregating the contributions of individual performance metrics such as water absorption, compressive strength, pulse velocity, and dynamic modulus. Table 7 provides the average performance metrics for each water source, while Figure 14 visually represents their composite rankings.
In Figure 14, the textile water source demonstrates the highest overall performance with a composite score of 15,169.49. This is primarily attributed to its strong performance in compressive strength (31.31 MPa) and dynamic modulus (direct: 9.39 GPa, indirect: 15.52 GPa, semi-direct: 161.55 GPa), as well as high pulse velocity values across all configurations (direct: 1663.89 m/s, indirect: 2073.75 m/s, semi-direct: 11,218.24 m/s). These metrics indicate that the textile wastewater enhances the mechanical properties of concrete paver blocks significantly.
Sugar wastewater ranks second with a composite score of 14,095.68, closely followed by carwash water at 14,082.83. Sugar water excels in direct pulse velocity (1704.52 m/s) and semi-direct dynamic modulus (149.75 GPa), highlighting its suitability for improving specific mechanical properties. Carwash water, while slightly lower in rank, demonstrates balanced performance across all metrics, achieving notable scores in compressive strength (27.54 MPa) and indirect dynamic modulus (12.05 GPa).
Sewerage wastewater ranks fourth with a composite score of 13,918.35. Despite competitive values for compressive strength (27.31 MPa) and semi-direct pulse velocity (10,316.79 m/s), its overall performance is overshadowed by higher-performing water sources. Fresh water and fertilizer water rank fifth and sixth, with composite scores of 13,849.24 and 12,781.25, respectively. Fertilizer water exhibits lower values across all metrics, particularly in compressive strength (20.64 MPa) and semi-direct dynamic modulus (84.90 GPa), which accounts for its lowest ranking.
Figure 14 reinforces these rankings, visually emphasizing the superiority of textile wastewater in enhancing concrete properties. The bar height for textile water clearly surpasses all other sources, followed by sugar and carwash water. The decline in composite scores from sewerage to fresh and fertilizer water is also evident, reflecting their comparatively lower contributions to concrete performance.
This evaluation highlights the potential of textile wastewater as the most effective alternative for producing high-strength, durable concrete paver blocks, while also demonstrating the practicality of sugar and carwash water in achieving robust performance. Conversely, fertilizer wastewater, with its significantly lower composite score, is less suitable for applications requiring high mechanical performance. These insights serve as a guideline for optimizing the use of alternative water sources in sustainable construction practices.

4.3. Comparative Analysis of Experimental and Machine Learning Results

The comparative analysis between experimental findings and ML predictions demonstrates a strong alignment, particularly for CS, UPV, and DME. The ML models effectively captured the trends observed in the experimental data, accurately predicting the superior performance of concrete pavers made with textile and sugar wastewater. This consistency is further supported by high R2 values (0.92 for CS, 0.97–0.99 for UPV, and 0.98–0.99 for DME), reflecting the models’ robustness in forecasting mechanical properties influenced by the physicochemical characteristics of wastewater.
However, the predictive accuracy for WA was notably lower, with an R2 of 0.02, indicating a weak correlation between the ML predictions and experimental results. This discrepancy can be attributed to the limited dataset and the inherent complexity of water absorption behavior, which is influenced by non-linear interactions between environmental conditions, microstructural variations, and the diverse chemical compositions of wastewater. The relatively small sample size may have constrained the model’s ability to generalize these complex interactions effectively.
Despite this limitation, the overall consistency between the experimental and ML results underscores the reliability of the predictive models in assessing key mechanical properties of wastewater-based concrete. The integration of experimental validation with AI-driven modeling provides a comprehensive framework for optimizing sustainable construction practices, highlighting the feasibility of using wastewater as an alternative resource without compromising structural performance.

5. Analytical Discussion

5.1. Analytical Interpretation of Results

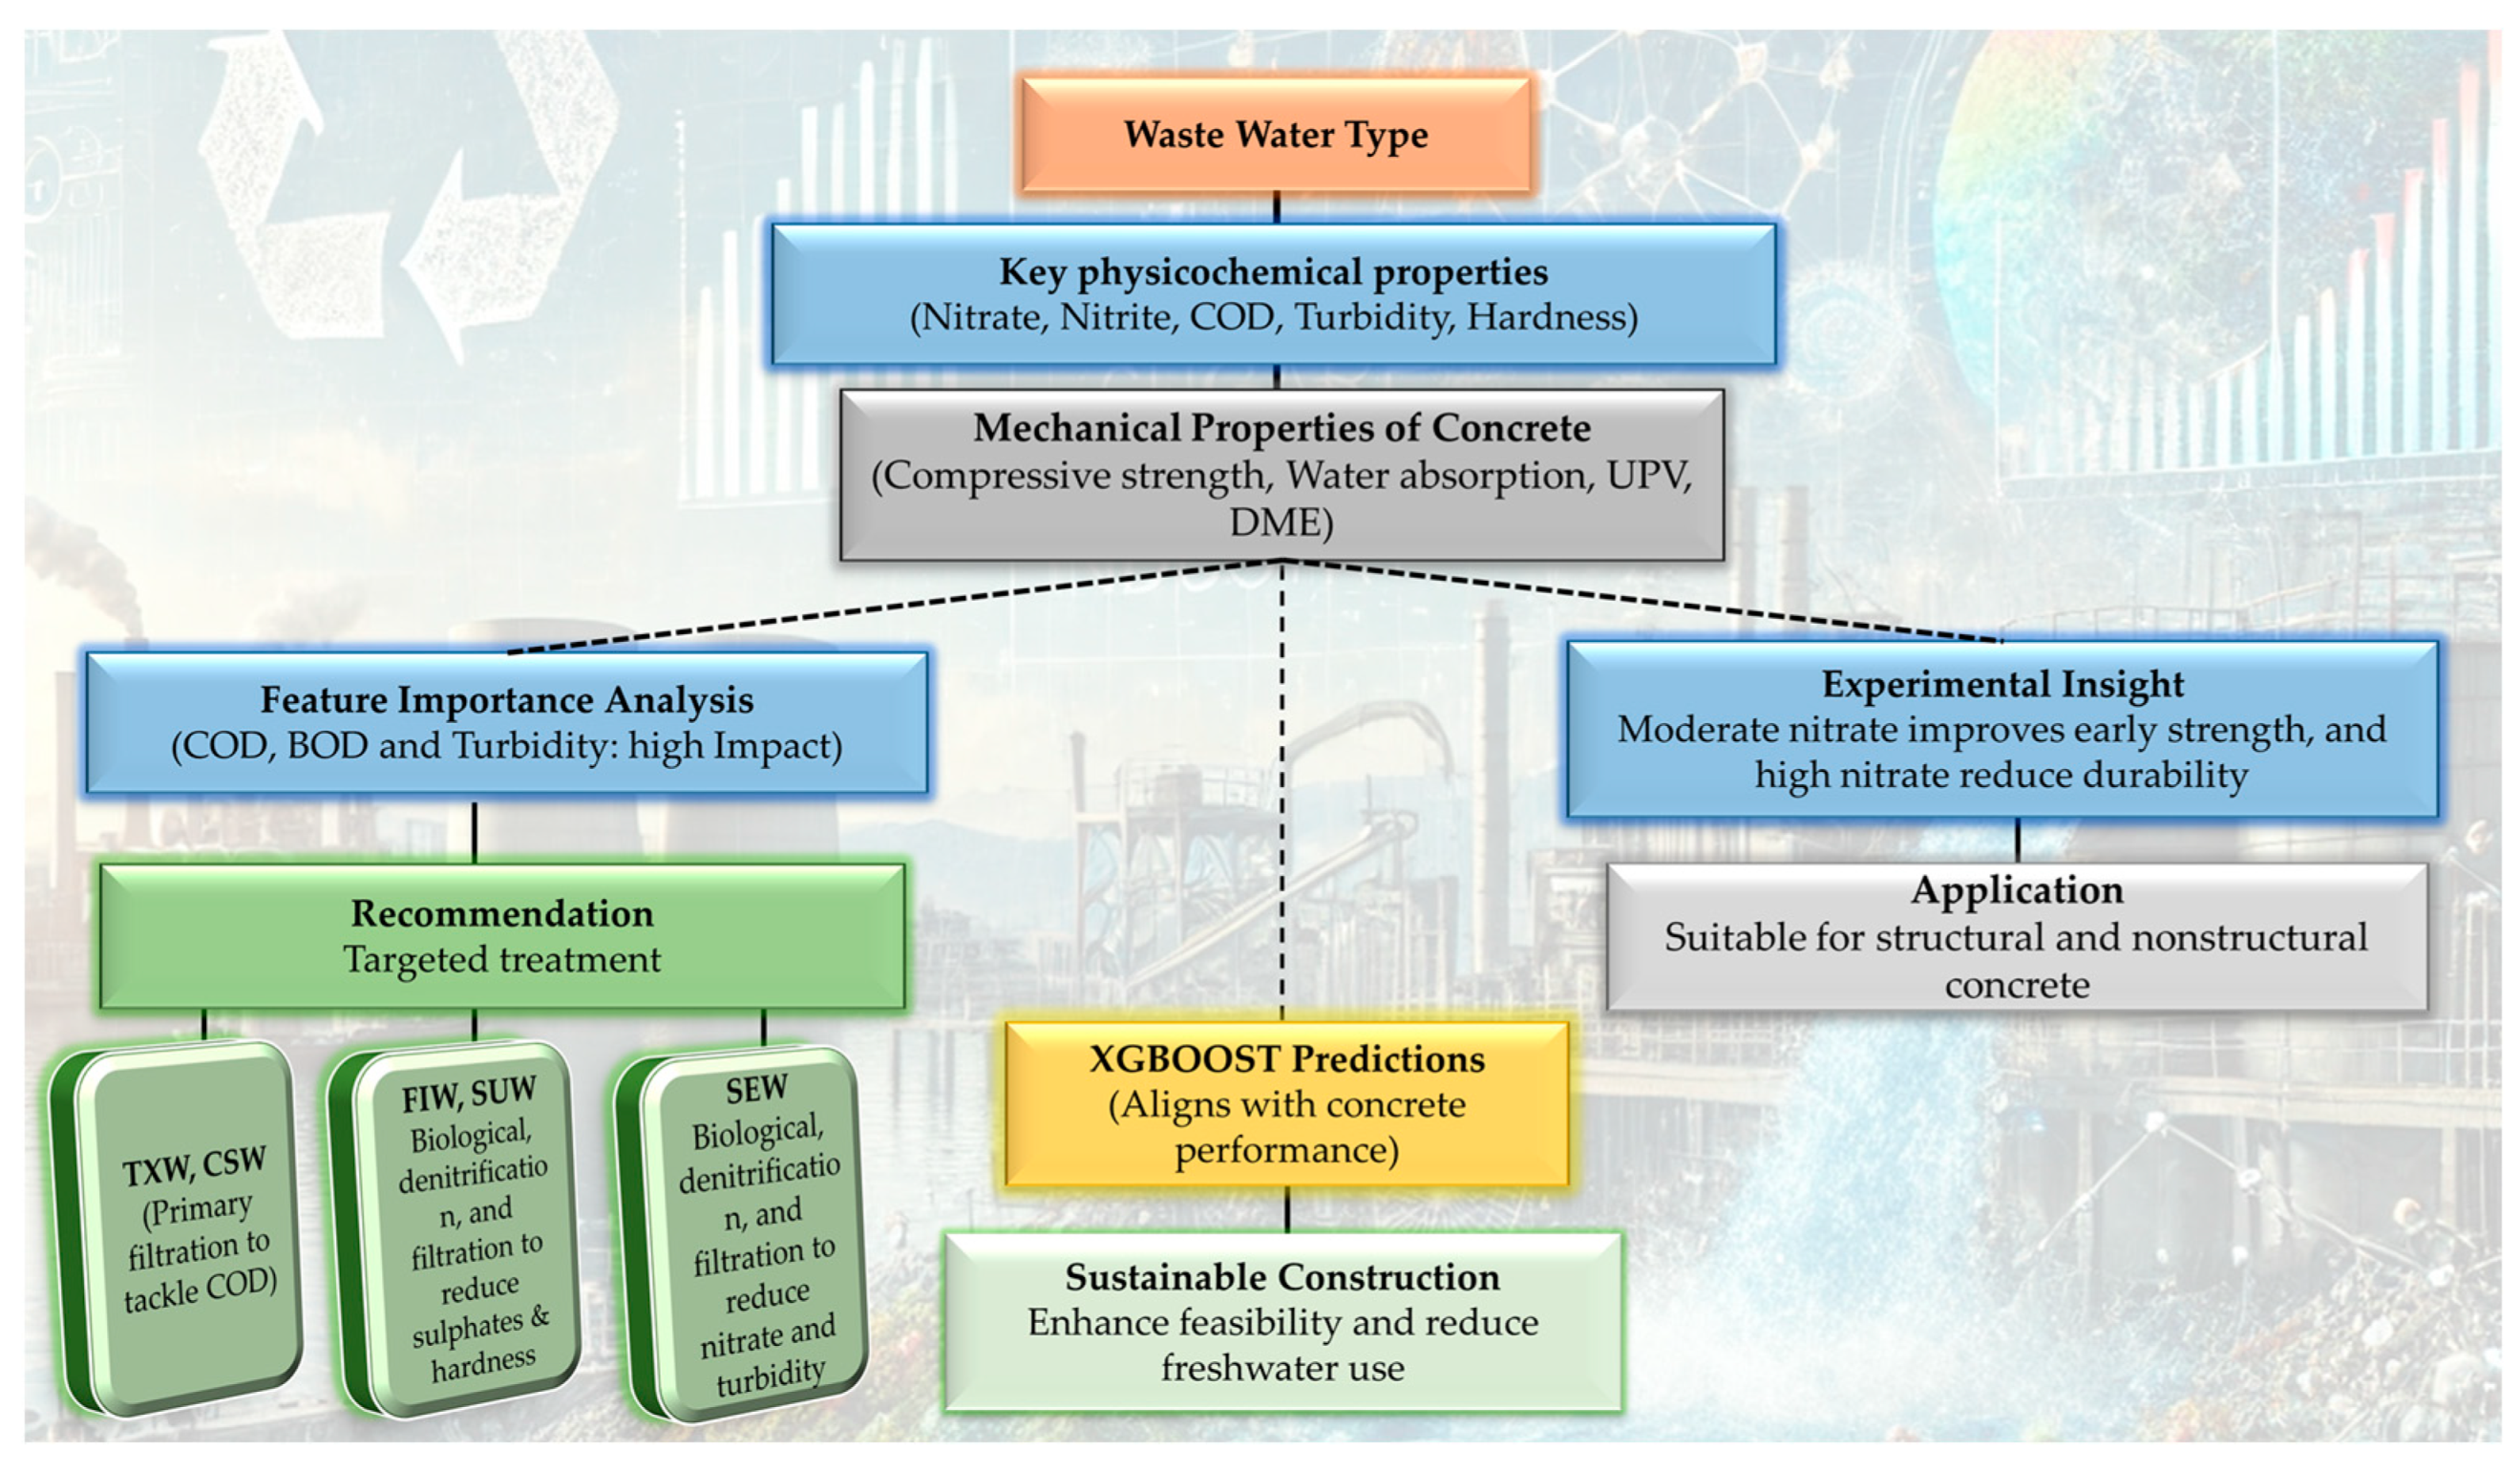
This study integrates experimental findings with ML approaches to establish a comprehensive framework for evaluating the suitability of wastewater in concrete paver block manufacturing. The investigation examines the correlations between key physicochemical characteristics of wastewater—BOD, COD, Turbidity, Hardness, pH, TDS, nitrate, and nitrite—and their influence on vital mechanical properties of concrete, including water absorption, compressive strength, ultrasonic pulse velocity, and dynamic modulus of elasticity. It provides essential recommendations for maximizing the utilization of recycled water with little treatment, thus decreasing dependence on expensive technologies.
The feature importance analysis identifies BOD and COD as the most influential factors affecting all mechanical properties, followed by Hardness and Turbidity, while pH and nitrates exhibit comparatively lower impacts. For water absorption and compressive strength, Hardness shows the highest importance values (0.22–0.25), emphasizing their critical role in concrete’s early-age performance. Experimentally, moderate nitrate levels enhance compressive strength by accelerating hydration and improving early-age strength [88]. However, excessive nitrate concentrations can cause delayed ettringite formation and reduced long-term durability [89]. Hardness, COD, and Turbidity are also the principal factors affecting UPV and DME, with feature importance scores ranging from 0.20 to 0.22. Experimentally, wastewater with high COD levels—indicative of substantial organic contamination—hinders hydration processes, increases porosity, and adversely affects strength development. Similarly, high Turbidity compromises a mix of uniformity and workability [89]. Consequently, wastewater with high Turbidity or COD, such as CSW, FIW, or SUW, is unsuitable for structural applications without appropriate COD and BOD treatment. Nonetheless, such effluent can be efficiently employed for non-structural elements such as masonry blocks and pavers where durability standards are less rigorous. Additionally, chloride content was identified as a key factor influencing UPV, showing a direct correlation in ML analysis. A certain amount of chloride content and Hardness may contribute positively to stiffness and elasticity, making wastewater with these characteristics particularly suitable for precast or rigid concrete elements where rigidity and dimensional stability are critical. However, excessive Hardness can affect workability [10,11], and high chloride levels pose a risk of steel reinforcement corrosion [90], necessitating careful application in unreinforced or non-structural concrete structures. This study focuses on the utilization of untreated wastewater in non-structural concrete components, such as pavers and blocks, which lack steel reinforcement. However, the use of such wastewater in reinforced concrete would result in chloride concentrations surpassing the ASTM threshold, necessitating meticulous treatment and oversight. This is a critical aspect that cannot be overlooked, as it is essential to avert steel corrosion and ensure the structural integrity of the concrete.
Among the various wastewater sources evaluated, textile wastewater appears as a promising prospect for concrete production due to its moderate physicochemical characteristics, with slightly higher Turbidity and TDS, which require minimal treatment. Its widespread availability in industrial regions like Pakistan offers a practical and cost-effective alternative to fresh water, reducing logistical constraints and enhancing sustainability in construction. Enhanced workability and compressive strength development can be achieved with simple treatment methods, such as sand filtration or biological processes, making it suitable for large-scale adoption. However, scalability remains challenging due to transportation, storage, and the need for localized or mobile treatment systems to minimize costs. Regulatory frameworks and standards for wastewater reuse in construction are also required to ensure constant water quality. By addressing these challenges, treated wastewater can be employed more widely in concrete production, opening the door to efficient and ecological building methods.

5.2. Practical Application and Objective of Machine Learning

Integrating experimental and ML insights demonstrates the feasibility of using wastewater in concrete production with minimal treatment. Targeted strategies, such as calcium (Ca2+), magnesium (Mg2+), and sulfate ion reduction (for fertilizer and sugar mill wastewater) that cause Hardness or nitrate removal (for sewage wastewater), effectively address specific contaminant challenges. Techniques like biological denitrification for the removal of calcium, magnesium nitrate, sulfate, or gypsum precipitation mitigate durability risks without requiring extensive chemical interventions [91]. On the other hand, wastewater from textiles and service stations, which exhibits moderate Turbidity, and TDS, may only require primary filtration to improve workability [92], as its COD, BOD, and Hardness levels are within acceptable ranges, making it cost-effective for construction use. Similarly, SUW requires reductions in Turbidity and COD through simple filtration or biological denitrification depending upon the nature of the structural component [92]. SEW has to reduce Turbidity, BOD, and COD, which can be performed using a sustainable wetland treatment system, where organic pollutants and suspended particles are effectively removed by gravel filtration and plant–root microbial interactions.
This dual experimental–ML approach enables the development of predictive models that align wastewater characteristics with desired concrete properties, facilitating the strategic use of untreated or partially treated wastewater. In addition to supporting sustainable construction practices, this study enhances economic feasibility by addressing critical physicochemical limitations and promoting resource efficiency. The findings underscore the potential of combining experimental methods with advanced computational tools to reduce fresh water reliance and enable the sustainable reuse of wastewater in diverse concrete applications. A representation of the whole process is shown in Figure 15.

5.3. Long-Term Durability and Environmental Considerations

While the short-term mechanical performance confirms feasibility, long-term durability must also be ensured to prevent deterioration under weathering, sulfate attack, and chloride exposure. Untreated industrial effluent needs to be assessed for long-term environmental safety in addition to physicochemical treatment. Cementitious matrices can immobilize heavy metals and reduce leaching; however, groundwater exposure and weathering may influence their release [93,94,95]. Future research should include standardized leaching tests, durability monitoring, and environmental risk assessments to ensure that wastewater reuse does not negatively impact soil, water, or the lifespan of the concrete.

5.4. Model Generalizability, Dataset Limitation, and Overfitting Considerations

Although the XGBoost model achieved promising predictive performance across various mechanical properties of concrete, it is important to recognize the limitations posed by the dataset used in this study. The data were derived from five distinct industrial wastewater sources, each characterized by specific physicochemical profiles and linked mechanical outcomes. While these sources represent a useful cross-section of common wastewater types, the dataset remains relatively small and may not fully capture the broader variability that could arise from other industrial processes, regional conditions, or seasonal fluctuations.
To address the risk of overfitting and improve generalization, we implemented five-fold cross-validation along with careful hyperparameter tuning, as described in Section Hyperparameter Optimization. These steps helped the model perform consistently within the scope of the available data. However, given the limited number of unique samples and combinations, the model’s ability to generalize to entirely new or highly dissimilar wastewater scenarios may be constrained.
Therefore, the model should be viewed as a practical pre-screening and prioritization tool, not a replacement for established laboratory testing protocols. Its strength lies in helping engineers and practitioners quickly assess which wastewater streams are most likely to yield viable concrete mixes, thereby streamlining early-stage decision-making and reducing redundant testing. To build upon this foundation, future research should aim to expand the dataset by including a wider variety of wastewater types, incorporating long-term sampling to account for temporal variability, and validating the approach across multiple sites or regions. These efforts would enhance the model’s robustness, extend its applicability, and provide stronger support for its integration into sustainable construction practices.

6. Conclusions

This study presents a comprehensive evaluation of the feasibility of utilizing untreated and partially treated wastewater from diverse industrial sources—textile, sugar mill, service station, sewage, and fertilizer industry—for concrete paver block manufacturing. Through a dual experimental–machine learning (ML) approach, key physicochemical characteristics of wastewater and their influence on mechanical properties, including compressive strength, water absorption, ultrasonic pulse velocity (UPV), and dynamic modulus of elasticity (DME), were systematically assessed.
  • The integration of experimental results with XGBoost-based machine learning models demonstrated strong alignment, particularly in predicting compressive strength (R2 = 0.92) and ultrasonic pulse velocity (UPV) with R2 values of 0.97 (direct) and 0.99 (indirect). The experimental results showed that concrete pavers produced with textile wastewater (CP-TXW) achieved a 28-day compressive strength of 47.95 MPa, closely matching ML-predicted trends. Conversely, water absorption (WA) exhibited limited prediction accuracy (R2 = 0.02), likely due to complex non-linear interactions and limited dataset variability.
  • Feature importance analysis identified BOD, COD, and Hardness as critical determinants of mechanical performance. BOD exhibited the highest cumulative feature importance (~33.4% for direct DME and ~29.4% for semi-direct UPV), directly correlating with experimental findings where wastewater with moderate BOD levels, such as CP-SEW, maintained superior compressive strength (46.73 MPa) and low water absorption (2.80%). COD, influential in both ML models and experimental durability outcomes, negatively impacted hydration in high concentrations (e.g., CP-FIW with COD > 1000 mg/L showed a reduced strength of 20.64 MPa).
  • The finding demonstrates the viability of using untreated wastewater, particularly from textile and sugar industries, in concrete production with minimal treatment requirements. Concrete pavers made from CP-TXW and CP-SUW exhibited compressive strengths exceeding 48 MPa and UPV values surpassing 1700 m/s after 28 days, in line with ASTM C936 standards. This strength is suitable for non-structural or light-duty paving applications, such as footpaths and pedestrian walkways, where the typical compressive strength requirements range between 40 and 50 MPa. Specific treatments, including primary filtration for high-COD wastewater (e.g., CSW) and biological denitrification for SEW, improve performance while reducing resource consumption, thereby promoting sustainable construction practices and decreasing reliance on fresh water.
This study underscores the viability of wastewater reuse in concrete production, particularly for non-structural applications, with minimal treatment interventions. The strategic utilization of wastewater not only reduces fresh water dependency but also promotes sustainable construction practices by addressing environmental and economic challenges associated with industrial effluents. The integration of ML in material performance prediction further enhances decision-making for sustainable construction, paving the way for broader adoption of unconventional water resources in the construction industry. However, this study indicates promising short-term results; it is crucial to verify the long-term durability of the concrete against weathering, sulfate, and chloride effects to ensure its service life under practical conditions. Future efforts will focus on extensive long-term durability testing, standardized leaching assessments, and cost–benefit analyses to guarantee environmental safety, material longevity, and economic viability in sustainable construction practices.

Author Contributions

N.B.: Conceptualization, Methodology, Investigation, Data Curation, Formal Analysis, Validation, Writing—Original Draft. S.N.H.K.: Investigation, Data Curation, Formal Analysis, Validation, Writing—Review and Editing. M.M.: Funding Acquisition, Resources, Supervision, Writing—Review and Editing. N.A.: Data Curation, Investigation, Validation, Writing—Review and Editing. J.M.: Funding Acquisition, Project Administration, Resources, Supervision, Writing—Review and Editing. M.F.H.: Conceptualization, Investigation, Methodology, Software, Formal Analysis, Validation, Visualization, Writing—Original Draft. All authors have read and agreed to the published version of the manuscript.

Funding

This research was funded by the Ongoing Research Funding program (ORF-2025-89), King Saud University, Riyadh, Saudi Arabia.

Institutional Review Board Statement

Not applicable.

Informed Consent Statement

Not applicable.

Data Availability Statement

The data presented in this study are available on request from the corresponding author. The data are not publicly available due to privacy and ethical restrictions.

Acknowledgments

The authors would like to thank the Ongoing Research Funding program (ORF-2025-89), King Saud University, Riyadh, Saudi Arabia, for funding this work.

Conflicts of Interest

The authors declare no conflicts of interest.

References

  1. Almeida, M.; Tonetti, A. Treated wastewater as a sustainable alternative to concrete manufacturing: A literature review on its performance. Int. J. Environ. Sci. Technol. 2023, 20, 8157–8174. [Google Scholar] [CrossRef]
  2. Waidyasekara, K.; De Silva, L.; Rameezdeen, R. Water use efficiency and conservation during construction: Drivers, barriers and practices. Built Environ. Proj. Asset Manag. 2016, 6, 553–566. [Google Scholar] [CrossRef]
  3. Sheikh Hassani, M.; Matos, J.C.; Zhang, Y.; Teixeira, E. Concrete production with domestic and industrial wastewaters—A literature review. Struct. Concr. 2023, 24, 5582–5599. [Google Scholar] [CrossRef]
  4. Soltanianfard, M.A.; Abuhishmeh, K.; Hojat Jalali, H.; Shah, S.P. Sustainable concrete made with wastewater from different stages of filtration. Constr. Build. Mater. 2023, 409, 133894. [Google Scholar] [CrossRef]
  5. Mack-Vergara, Y.L.; John, V.M. Life cycle water inventory in concrete production—A review. Resour. Conserv. Recycl. 2017, 122, 227–250. [Google Scholar] [CrossRef]
  6. Barbier, E. The Water Paradox: Overcoming the Global Crisis in Water Management; Yale University Press: New Haven, CT, USA, 2019. [Google Scholar]
  7. du Plessis, A. Water Resources from a Global Perspective. In South Africa’s Water Predicament: Freshwater’s Unceasing Decline; Springer International Publishing: Cham, Switzerland, 2023; pp. 1–25. [Google Scholar]
  8. Abdella, F.I.A.; El-Sofany, W.I.; Mansour, D. Water scarcity in the Kingdom of Saudi Arabia. Environ. Sci. Pollut. Res. 2024, 31, 27554–27565. [Google Scholar] [CrossRef]
  9. Munir, M.U.; Ahmad, A.; Hopmans, J.W.; Belgacem, A.O.; Baig, M.B. Water Scarcity Threats to National Food Security of Pakistan—Issues, Implications, and Way Forward. In Emerging Challenges to Food Production and Security in Asia, Middle East, and Africa: Climate Risks and Resource Scarcity; Behnassi, M., Barjees Baig, M., El Haiba, M., Reed, M.R., Eds.; Springer International Publishing: Cham, Switzerland, 2021; pp. 241–266. [Google Scholar]
  10. Maddikeari, M.; Das, B.B.; Tangadagi, R.B.; Roy, S.; Nagaraj, P.B.; Ramachandra, M.L. A Comprehensive Review on the Use of Wastewater in the Manufacturing of Concrete: Fostering Sustainability through Recycling. Recycling 2024, 9, 45. [Google Scholar] [CrossRef]
  11. Arooj, M.F.; Haseeb, F.; Butt, A.I.; Irfan-Ul-Hassan, M.; Batool, H.; Kibria, S.; Javed, Z.; Nawaz, H.; Asif, S. A sustainable approach to reuse of treated domestic wastewater in construction incorporating admixtures. J. Build. Eng. 2021, 33, 101616. [Google Scholar] [CrossRef]
  12. Zeyad, A.M. Sustainable concrete Production: Incorporating recycled wastewater as a green building material. Constr. Build. Mater. 2023, 407, 133522. [Google Scholar] [CrossRef]
  13. Kucche, K.; Jamkar, S.; Sadgir, P. Quality of water for making concrete: A review of literature. Int. J. Sci. Res. Publ. 2015, 5, 1–10. [Google Scholar]
  14. Al-Jabri, K.S.; Al-Saidy, A.H.; Taha, R.; Al-Kemyani, A.J. Effect of using Wastewater on the Properties of High Strength Concrete. Procedia Eng. 2011, 14, 370–376. [Google Scholar] [CrossRef]
  15. Amiri, N.; Nakhaei, M. Evaluating the potential of treated municipal wastewater reuse in irrigation and groundwater recharge; 5-year contaminant transport modeling. Int. J. Environ. Sci. Technol. 2024, 21, 577–602. [Google Scholar] [CrossRef]
  16. Meena, K.; Luhar, S. Effect of wastewater on properties of concrete. J. Build. Eng. 2019, 21, 106–112. [Google Scholar] [CrossRef]
  17. Woyciechowski, P.; Łukowski, P.; Szmigiera, E.; Adamczewski, G.; Chilmon, K.; Spodzieja, S. Concrete corrosion in a wastewater treatment plant–A comprehensive case study. Constr. Build. Mater. 2021, 303, 124388. [Google Scholar] [CrossRef]
  18. Al-Ghusain, I.; Terro, M. Use of treated wastewater for concrete mixing in Kuwait. Kuwait J. Sci. Eng. 2003, 30, 213–228. [Google Scholar]
  19. Yaphary, Y.L.; Wee, J.X.; Li, S.F.Y. Synergistic resource recoveries of phosphorus and usable water from sewage sludge incineration ash and concrete slurry wastewater. Resour. Conserv. Recycl. 2025, 212, 107956. [Google Scholar] [CrossRef]
  20. Asadollahfardi, G.; Delnavaz, M.; Rashnoiee, V.; Ghonabadi, N. Use of treated domestic wastewater before chlorination to produce and cure concrete. Constr. Build. Mater. 2016, 105, 253–261. [Google Scholar] [CrossRef]
  21. Klus, L.; Václavík, V.; Dvorský, T.; Svoboda, J.; Papesch, R. The utilization of waste water from a concrete plant in the production of cement composites. Buildings 2017, 7, 120. [Google Scholar] [CrossRef]
  22. Yao, X.; Xu, Z.; Guan, J.; Liu, L.; Shangguan, L.; Xi, J. Influence of wastewater content on mechanical properties, microstructure, and durability of concrete. Buildings 2022, 12, 1343. [Google Scholar] [CrossRef]
  23. Chen, X.; Wu, J.; Ning, Y.; Zhang, W. Experimental study on the effect of wastewater and waste slurry of mixing plant on mechanical properties and microstructure of concrete. J. Build. Eng. 2022, 52, 104307. [Google Scholar] [CrossRef]
  24. Ghrair, A.M.; Al-Mashaqbeh, O. Domestic wastewater reuse in concrete using bench-scale testing and full-scale implementation. Water 2016, 8, 366. [Google Scholar] [CrossRef]
  25. Bahraman, M.; Asadollahfardi, G.; Salehi, A.M.; Yahyaei, B. Feasibility study of using wash water from ready mixed concrete plant and synthetic wastewater based on tap water with different total dissolved solid to produce self-compacting concrete. J. Build. Eng. 2021, 41, 102781. [Google Scholar] [CrossRef]
  26. Nasseralshariati, E.; Mohammadzadeh, D.; Karballaeezadeh, N.; Mosavi, A.; Reuter, U.; Saatcioglu, M. The effect of incorporating industrials wastewater on durability and long-term strength of concrete. Materials 2021, 14, 4088. [Google Scholar] [CrossRef]
  27. Ayyadurai, A.; Saravanan, M.; Devi, M. Integrated method for waste water treatment using water hyacinth and its application in concrete. Int. J. Adv. Technol. Eng. Explor. 2023, 10, 1742. [Google Scholar] [CrossRef]
  28. Hassani, M.S.; Asadollahfardi, G.; Saghravani, S.F.; Jafari, S.; Peighambarzadeh, F.S. The difference in chloride ion diffusion coefficient of concrete made with drinking water and wastewater. Constr. Build. Mater. 2020, 231, 117182. [Google Scholar] [CrossRef]
  29. Teymouri, E.; Mousavi, S.-F.; Karami, H.; Farzin, S.; Kheirabad, M.H. Municipal Wastewater pretreatment using porous concrete containing fine-grained mineral adsorbents. J. Water Process Eng. 2020, 36, 101346. [Google Scholar] [CrossRef]
  30. Yahyaei, B.; Asadollahfardi, G.; Salehi, A.M. Workability, mechanical, and durability properties of self-compacting concrete using the treated wastewater. Struct. Concr. 2021, 22, E997–E1008. [Google Scholar] [CrossRef]
  31. Keneshlo, S.; Asadollahfardi, G.; Homami, P.; Salehi, A.M.; Akarbardoost, J.; Tayebi Jebeli, M. The effect of using treated domestic wastewater with different pHs on workability, mechanical, and durability properties of self-compacting concrete. Environ. Sci. Pollut. Res. 2024, 31, 8633–8649. [Google Scholar] [CrossRef]
  32. Deldar, O.; Akçaoğlu, T.; Ergil, M. Assessing the Impacts of Treated Wastewater on Concrete’s Mechanical Properties and Corrosion Resistance. Iran. J. Sci. Technol. Trans. Civ. Eng. 2024, 48, 4093–4112. [Google Scholar] [CrossRef]
  33. Micheal, A.; Salam, H.A.E. Reliability of using secondary and tertiary treated wastewater in concrete mixing and curing. Environ. Dev. Sustain. 2024, 26, 31657–31676. [Google Scholar] [CrossRef]
  34. Asadollahfardi, G.; Salehi, A.; Cheraghi, S.; Keneshlo, S.; Vatannia, S. Impact of treated industrial wastewater’s pH on different characteristics of self-compacting concrete. Case Stud. Chem. Environ. Eng. 2024, 9, 100696. [Google Scholar] [CrossRef]
  35. Lam, T.Q.K.; Sreekeshava, K.S.; Bhargavi, C.; Ganesh, C.R.; Ambale, N.S.; Do, T.M.D.; Akinwumi, I.I. Exploring the Potential of Green Microalgae-Based Phycoremediation Treated Wastewater for Sustainable Concrete Production. Adv. Civ. Eng. 2024, 2024, 8564202. [Google Scholar] [CrossRef]
  36. Ayyadurai, A.; Saravanan, M.M.; Devi, M. Efficient Wastewater Treatment through Integrated Water Hyacinth Systems: Advances and Applications in Concrete. Mater. Tehnol. 2024, 58, 173–184. [Google Scholar] [CrossRef]
  37. Bodur, B.; Bayraktar, O.Y.; Benli, A.; Kaplan, G.; Tobbala, D.E.; Tayeh, B. Effect of using wastewater from the ready-mixed concrete plant on the performance of one-part alkali-activated GBFS/FA composites: Fresh, mechanical and durability properties. J. Build. Eng. 2023, 76, 107167. [Google Scholar] [CrossRef]
  38. Dehane, S.; Kriker, A.; Salhi, A. Influence of Saline-treated Wastewater on Properties of Concrete: An Experimental Study. Period. Polytech. Civ. Eng. 2023, 67, 695–705. [Google Scholar] [CrossRef]
  39. Al-Tersawy, S.H.; Zakey, S.E.; El-Sadany, R.A.; Sallam, H.E.-D.M. Utilization of Various Industrial Wastes in Ordinary Concrete Under Normal Manufacturing Conditions. Int. J. Concr. Struct. Mater. 2023, 17, 44. [Google Scholar] [CrossRef]
  40. Abushanab, A.; Alnahhal, W. Bond strength of corroded reinforced recycled aggregate concrete with treated wastewater and fly ash. J. Build. Eng. 2023, 79, 107778. [Google Scholar] [CrossRef]
  41. Ahmed, S.; Alhoubi, Y.; Elmesalami, N.; Yehia, S.; Abed, F. Effect of recycled aggregates and treated wastewater on concrete subjected to different exposure conditions. Constr. Build. Mater. 2021, 266, 120930. [Google Scholar] [CrossRef]
  42. Govedarica, O.; Aškrabić, M.; Hadnađev-Kostić, M.; Vulić, T.; Lekić, B.; Rajaković-Ognjanović, V.; Zakić, D. Evaluation of solidified wastewater treatment sludge as a potential SCM in pervious concrete pavements. Materials 2022, 15, 4919. [Google Scholar] [CrossRef]
  43. Patil, U.S.; Raut, S.P.; Giri, J.; Mohammad, F.; Ali, M.S.; Sathish, T. Exploring the potential of textile effluent sludge as a construction material through comprehensive characterization and analysis. AIP Adv. 2024, 14, 065308. [Google Scholar] [CrossRef]
  44. Hemalatha, B.; Shyamala, G.; Babu, M.; Pramila, V. Technical Feasibility of Water Treatment Plant Sludge with Nano Silica as Concrete Paver Block. NanoWorld J. 2024, 10, S301–S306. [Google Scholar]
  45. Nadeem, A.; Hanif, M.F.; Naveed, M.S.; Hassan, M.T.; Gul, M.; Husnain, N.; Mi, J. AI-Driven precision in solar forecasting: Breakthroughs in machine learning and deep learning. AIMS Geosci. 2024, 10, 684–734. [Google Scholar] [CrossRef]
  46. Jamal, A.S.; Ahmed, A.N. Estimating compressive strength of high-performance concrete using different machine learning approaches. Alex. Eng. J. 2025, 114, 256–265. [Google Scholar] [CrossRef]
  47. Hanif, M.; Mi, J. Harnessing AI for solar energy: Emergence of transformer models. Appl. Energy 2024, 369, 123541. [Google Scholar] [CrossRef]
  48. Hanif, M.F.; Siddique, M.U.; Si, J.; Naveed, M.S.; Liu, X.; Mi, J. Enhancing solar forecasting accuracy with sequential deep artificial neural network and hybrid random forest and gradient boosting models across varied terrains. Adv. Theory Simul. 2024, 7, 2301289. [Google Scholar] [CrossRef]
  49. Fan, D.; Yu, R.; Fu, S.; Yue, L.; Wu, C.; Shui, Z.; Liu, K.; Song, Q.; Sun, M.; Jiang, C. Precise design and characteristics prediction of Ultra-High Performance Concrete (UHPC) based on artificial intelligence techniques. Cem. Concr. Compos. 2021, 122, 104171. [Google Scholar] [CrossRef]
  50. Gomaa, E.; Han, T.; ElGawady, M.; Huang, J.; Kumar, A. Machine learning to predict properties of fresh and hardened alkali-activated concrete. Cem. Concr. Compos. 2021, 115, 103863. [Google Scholar] [CrossRef]
  51. Kumar, R.; Althaqafi, E.; Patro, S.G.K.; Simic, V.; Babbar, A.; Pamucar, D.; Singh, S.K.; Verma, A. Machine and deep learning methods for concrete strength Prediction: A bibliometric and content analysis review of research trends and future directions. Appl. Soft Comput. 2024, 164, 111956. [Google Scholar] [CrossRef]
  52. Kulambayev, B.; Astaubayeva, G.; Tleuberdiyeva, G.; Alimkulova, J.; Nussupbekova, G.; Kisseleva, O. Deep CNN Approach with Visual Features for Real-Time Pavement Crack Detection. Int. J. Adv. Comput. Sci. Appl. 2024, 15, 319. [Google Scholar] [CrossRef]
  53. Golafshani, E.M.; Kim, T.; Behnood, A.; Ngo, T.; Kashani, A. Sustainable mix design of recycled aggregate concrete using artificial intelligence. J. Clean. Prod. 2024, 442, 140994. [Google Scholar] [CrossRef]
  54. Chen, B.; Wang, L.; Feng, Z.; Liu, Y.; Wu, X.; Qin, Y.; Xia, L. Optimization of high-performance concrete mix ratio design using machine learning. Eng. Appl. Artif. Intell. 2023, 122, 106047. [Google Scholar] [CrossRef]
  55. Berney Iv, E.S.; Smith, D.M. Mechanical and physical properties of ASTM C33 Sand (No. ERDCGSLTR082). 2008. Available online: https://apps.dtic.mil/sti/tr/pdf/ADA477592.pdf (accessed on 23 July 2025).
  56. 1602/C 1602M-18; Standard Specification for Mixing Water Used in the Production of Hydraulic Cement Concrete. ASTM International: West Conshohocken, PA, USA, 2018.
  57. ASTM C936/C936M-23a; Standard Specification for Solid Concrete Interlocking Paving Units. ASTM: West Conshohocken, PA, USA, 2023.
  58. Nataraja, M.; Das, L. Concrete mix proportioning as per IS 10262: 2009–Comparison with IS 10262: 1982 and ACI 211.1-91. Indian Concr. J. 2010, 84, 64–70. [Google Scholar]
  59. Neville, A.M. Properties of Concrete, 4th, ed.; London Pearson Education Limited: London, UK, 2011; Volume 443, No. 846; p. 444. [Google Scholar]
  60. ASTM C 67; Standard Test Methods for Sampling and Testing Brick and Structural Clay Tile. American Society for Testing Materials: West Conshohocken, PA, USA, 2004.
  61. American Society for Testing and Materials C 642; Standard Test Method for Density, Absorption and Voids in Hardened Concrete. American Society for Testing Materials: West Conshohocken, PA, USA, 1997.
  62. Dixon, D.E.; Prestrera, J.R.; Burg, G.; Chairman, S.A.; Abdun-Nur, E.A.; Barton, S.G.; Bell, L.W.; Blas, S.J., Jr.; Carrasquillo, R.L.; Carrasquillo, P.M. Standard Practice for Selecting Proportions for Normal, Heavyweight, and Mass Concrete (ACI 211.1-91); ACI: Farmington Hills, MI, USA, 1991. [Google Scholar]
  63. Mumuni, A.; Mumuni, F. Automated data processing and feature engineering for deep learning and big data applications: A survey. J. Inf. Intell. 2024, 3, 113–153. [Google Scholar] [CrossRef]
  64. Verdonck, T.; Baesens, B.; Óskarsdóttir, M.; vanden Broucke, S. Special issue on feature engineering editorial. Mach. Learn. 2024, 113, 3917–3928. [Google Scholar] [CrossRef]
  65. Boehm, K.M.; Khosravi, P.; Vanguri, R.; Gao, J.; Shah, S.P. Harnessing multimodal data integration to advance precision oncology. Nat. Rev. Cancer 2022, 22, 114–126. [Google Scholar] [CrossRef]
  66. Nargesian, F.; Samulowitz, H.; Khurana, U.; Khalil, E.B.; Turaga, D.S. Learning Feature Engineering for Classification. In Proceedings of the IJCAI, Melbourne, Australia, 19–25 August 2017; pp. 2529–2535. [Google Scholar]
  67. Naveed, M.S.; Hanif, M.F.; Metwaly, M.; Iqbal, I.; Lodhi, E.; Liu, X.; Mi, J. Leveraging advanced AI algorithms with transformer-infused recurrent neural networks to optimize solar irradiance forecasting. Front. Energy Res. 2024, 12, 1485690. Available online: https://www.frontiersin.org/journals/energy-research/articles/10.3389/fenrg.2024.1485690 (accessed on 23 May 2025). [CrossRef]
  68. Yang, J.; Jiang, P.; Suhail, S.A.; Sufian, M.; Deifalla, A.F. Experimental investigation and AI prediction modelling of ceramic waste powder concrete–An approach towards sustainable construction. J. Mater. Res. Technol. 2023, 23, 3676–3696. [Google Scholar] [CrossRef]
  69. Ansari, A.; Quaff, A.R. Advanced machine learning techniques for precise hourly air quality index (AQI) prediction in Azamgarh, India. Int. J. Environ. Res. 2025, 19, 15. [Google Scholar] [CrossRef]
  70. Huu Nguyen, M.; Nguyen, T.-A.; Ly, H.-B. Ensemble XGBoost schemes for improved compressive strength prediction of UHPC. Structures 2023, 57, 105062. [Google Scholar] [CrossRef]
  71. Al-Taai, S.R.; Azize, N.M.; Thoeny, Z.A.; Imran, H.; Bernardo, L.F.A.; Al-Khafaji, Z. XGBoost Prediction Model Optimized with Bayesian for the Compressive Strength of Eco-Friendly Concrete Containing Ground Granulated Blast Furnace Slag and Recycled Coarse Aggregate. Appl. Sci. 2023, 13, 8889. [Google Scholar] [CrossRef]
  72. Chen, T.; Guestrin, C. XGBoost: A Scalable Tree Boosting System. In Proceedings of the 22nd ACM SIGKDD International Conference on Knowledge Discovery and Data Mining, San Francisco, CA, USA, 13–17 August 2016; pp. 785–794. [Google Scholar] [CrossRef]
  73. Lyngdoh, G.A.; Zaki, M.; Krishnan, N.M.A.; Das, S. Prediction of concrete strengths enabled by missing data imputation and interpretable machine learning. Cem. Concr. Compos. 2022, 128, 104414. [Google Scholar] [CrossRef]
  74. Kavzoglu, T.; Teke, A. Advanced hyperparameter optimization for improved spatial prediction of shallow landslides using extreme gradient boosting (XGBoost). Bull. Eng. Geol. Environ. 2022, 81, 201. [Google Scholar] [CrossRef]
  75. Guo, Y.; Si, J.; Wang, Y.; Hanif, F.; Li, S.; Wu, M.; Xu, M.; Mi, J. Ensemble-Empirical-Mode-Decomposition (EEMD) on SWH prediction: The effect of decomposed IMFs, continuous prediction duration, and data-driven models. Ocean. Eng. 2025, 324, 120755. [Google Scholar] [CrossRef]
  76. Gupta, P.; Bhardwaj, G.; Dubey, S.; Tayal, T.; Sengupta, A.; Narad, P. AI-Enabled Process Optimization for Sustainable Wastewater Treatment Solutions. In The AI Cleanse: Transforming Wastewater Treatment Through Artificial Intelligence: Harnessing Data-Driven Solutions; Springer: Berlin/Heidelberg, Germany, 2024; pp. 141–164. [Google Scholar]
  77. Naveed, M.S.; Iqbal, I.; Hanif, M.F.; Xiao, J.; Liu, X.; Mi, J. Enhanced accuracy in solar irradiance forecasting through machine learning stack-based ensemble approach. Int. J. Green Energy 2025, 22, 2126–2149. [Google Scholar] [CrossRef]
  78. Zanotti, M. Do global forecasting models require frequent retraining? arXiv 2025, arXiv:2505.00356. [Google Scholar] [CrossRef]
  79. Karbassiyazdi, E.; Fattahi, F.; Yousefi, N.; Tahmassebi, A.; Taromi, A.A.; Manzari, J.Z.; Gandomi, A.H.; Altaee, A.; Razmjou, A. XGBoost model as an efficient machine learning approach for PFAS removal: Effects of material characteristics and operation conditions. Environ. Res. 2022, 215, 114286. [Google Scholar] [CrossRef]
  80. Agarwal, S.; Singh, A.P. Effective reutilization of textile sludge from common effluent treatment plant with mineral admixture as a partial replacement for cement in mortar mixes. J. Mater. Cycles Waste Manag. 2024, 26, 2317–2333. [Google Scholar] [CrossRef]
  81. Latif, S.D. Concrete compressive strength prediction modeling utilizing deep learning long short-term memory algorithm for a sustainable environment. Environ. Sci. Pollut. Res. 2021, 28, 30294–30302. [Google Scholar] [CrossRef]
  82. Jahan, N.; Tahmid, M.; Shoronika, A.Z.; Fariha, A.; Roy, H.; Pervez, M.N.; Cai, Y.; Naddeo, V.; Islam, M.S. A Comprehensive Review on the Sustainable Treatment of Textile Wastewater: Zero Liquid Discharge and Resource Recovery Perspectives. Sustainability 2022, 14, 15398. [Google Scholar] [CrossRef]
  83. Raza, A.; Rafique, U.; Haq, F.U. Mechanical and durability behavior of recycled aggregate concrete made with different kinds of wastewater. J. Build. Eng. 2021, 34, 101950. [Google Scholar] [CrossRef]
  84. Xu, B.; Lothenbach, B.; Leemann, A.; Winnefeld, F. Reaction mechanism of magnesium potassium phosphate cement with high magnesium-to-phosphate ratio. Cem. Concr. Res. 2018, 108, 140–151. [Google Scholar] [CrossRef]
  85. Yaseen, D.A.; Scholz, M. Treatment of synthetic textile wastewater containing dye mixtures with microcosms. Environ. Sci. Pollut. Res. 2018, 25, 1980–1997. [Google Scholar] [CrossRef]
  86. Saliu, T.D.; Oladoja, N.A. Nutrient recovery from wastewater and reuse in agriculture: A review. Environ. Chem. Lett. 2021, 19, 2299–2316. [Google Scholar] [CrossRef]
  87. Sasi, S.; Joseph, P.; Haigh, R.; Sandanayake, M.; Vrcelj, Z.; Yaghoubi, E. A Review on the Effects of Waste Textile Polymer Fiber on Concrete Strength: Exploring the Key Parameters. Buildings 2024, 14, 1486. [Google Scholar] [CrossRef]
  88. Xu, Y.; He, T. Effect of nitrate/bromide on the hydration process of cement paste mixed with alkali free liquid accelerator at low temperature. Crystals 2021, 11, 1585. [Google Scholar] [CrossRef]
  89. Abushanab, A.; Alnahhal, W. Combined effects of treated domestic wastewater, fly ash, and calcium nitrite toward concrete sustainability. J. Build. Eng. 2021, 44, 103240. [Google Scholar] [CrossRef]
  90. Oyejobi, D.; Firoozi, A.; Fernandez, D.B.; Avudaiappan, S. Integrating circular economy principles into concrete technology: Enhancing sustainability through industrial waste utilization. Results Eng. 2024, 24, 102846. [Google Scholar] [CrossRef]
  91. Diao, C.; Ye, W.; Yan, J.; Hao, T.; Huang, L.; Chen, Y.; Long, J.; Xiao, T.; Zhang, H. Application of microbial sulfate-reduction process for sulfate-laden wastewater treatment: A review. J. Water Process Eng. 2023, 52, 103537. [Google Scholar] [CrossRef]
  92. Wang, X.; Jiang, J.; Gao, W. Reviewing textile wastewater produced by industries: Characteristics, environmental impacts, and treatment strategies. Water Sci. Technol. 2022, 85, 2076–2096. [Google Scholar] [CrossRef]
  93. Haque, M.A.; Chowdhury, R.A.; Chowdhury, W.A.; Baralaskar, A.H.; Bhowmik, S.; Islam, S. Immobilization possibility of tannery wastewater contaminants in the tiles fixing mortars for eco-friendly land disposal. J. Environ. Manag. 2019, 242, 298–308. [Google Scholar] [CrossRef]
  94. Kalinowski, M.; Chilmon, K.; Bogacki, J.; Woyciechowski, P. Organic and inorganic modifications to increase the efficiency in immobilization of heavy metal (Zn) in cementitious composites—The impact of cement matrix pore network characteristics. Materials 2024, 17, 5281. [Google Scholar] [CrossRef]
  95. Piekkari, K.; Ohenoja, K.; Isteri, V.; Tanskanen, P.; Illikainen, M. Immobilization of heavy metals, selenate, and sulfate from a hazardous industrial side stream by using calcium sulfoaluminate-belite cement. J. Clean. Prod. 2020, 258, 120560. [Google Scholar] [CrossRef]
Figure 1. Histogram of various physicochemical properties of wastewater used in previous studies.
Sustainability 17 06811 g001
Figure 2. Raw materials used in the research: (a) Sakhi Sarwar aero sand; (b) OPC; (c) Sakhi Sarwar aggregate.
Sustainability 17 06811 g002
Figure 3. Sieve analysis: (a) coarse and (b) fine aggregates compared to ASTM C33 standard [55] limits.
Sustainability 17 06811 g003
Figure 4. (a) Production of H-type concrete paver blocks using a high-pressure compaction machine; (b) 3D design drawing of the H-type paver block showing key dimensions.
Sustainability 17 06811 g004
Figure 5. Testing setup: (a) compressive strength test; (b) water absorption.
Sustainability 17 06811 g005
Figure 6. Correlation heatmap of water and paver properties.
Sustainability 17 06811 g006
Figure 7. (a) Original visualization of a single XGBoost tree trained for predicting compressive strength based on physicochemical wastewater features. (b) Simplified tree representation highlighting key decision splits using COD, Turbidity, and pH.
Sustainability 17 06811 g007
Figure 8. Compressive strength of all mixtures at 7 (a), 14 (b), 21 (c), and 28 (d) days.
Sustainability 17 06811 g008
Figure 9. Water absorption of all mixtures at 30 min (a), 1 day (b), 7 days (c), 14 days (d), 21 days (e), and 28 days (f).
Sustainability 17 06811 g009
Figure 10. UPV of concrete paver blocks at 3 (a), 7 (b), 14 (c), and 28 (d) days, comparing direct, indirect, and semi-direct transmission paths for each mix. The results show how testing path orientation affects wave velocity measurements.
Sustainability 17 06811 g010
Figure 11. Dynamic modulus of elasticity (DME) at 3 (a), 7 (b), 14 (c), and 28 (d) days, calculated for each UPV path to illustrate the effect of measurement direction on estimated stiffness.
Sustainability 17 06811 g011
Figure 12. Feature importance for each target.
Sustainability 17 06811 g012
Figure 13. Feature importance analysis for all targets; (A) stacked and (B) distributed.
Sustainability 17 06811 g013
Figure 14. Water source composite score.
Sustainability 17 06811 g014
Figure 15. Integrated framework illustrating the relationship between wastewater physicochemical properties, concrete mechanical performance, and machine learning predictions. The framework highlights experimental insights, targeted treatment recommendations, and the role of XGBoost-based feature analysis in supporting sustainable construction by aligning predictive modeling with practical applications for both structural and non-structural concrete components.
Sustainability 17 06811 g015
Table 1. Physicochemical properties of wastewater used in the literature.
Sr. No.Physicochemical Properties of WastewaterRef.
pH UnitTurbidity NTUSO4 mg/LNO3 mg/LNO2 ORmg/LCl mg/LTSS mg/LBOD mg/LCOD mg/LHardness mg/LAlkalinity mg/LTDS mg/LConductivity ms/cmNitrogen mg/LBicarbonate mg/L
1---14.71.7-14.3-47---- [4]
2 --55.615.50.011292-35----
37.480.305---269.91-20-256--1.59 [16]
470.586---257.92-14-248--1.59
57.27-----21.33 ± 1043.572--11101191 [12]
68-900-110418185440-8.5-1336101.5 [17]
77.2-600.2-154852245720-9.2-1512101.5
87.2-750-134412151.6434-8.4-130884
97.4-23000287221-407-228--- [18]
107.8-1800.4029012-61-66---
117.3-160L90.63407-29-57---
127.11.5562.50.22403.2235140110---102[19]
137.712180143.655303093--170---[20]
146.774-40.2689.4-14.182--5.236---336.12--[21]
1512.538-1702.1--183.469------13.39--
1612-34--78-----391---[22]
179---0.20–0.25------67---[23]
18≥10.0---<0.005------387---
197.2-106--251148226538--900---[24]
207.5-106.2--29110.52.646.9--974---
217.59-78.4--107<2<2<5--499---
236-<5--<5<2<2<5--<2---
247.791.224.5--14--3201-560---[25]
251333439--191--1961290-2380---
267.921080--123025114150--18703950--[26]
277.68800145--74045112403215--25414120--
287.2250--9412130--412193--
297.234.21.40.52-10------[26]
308.113.518515.54.247-50160------
318.6--9.2-44.02192230315--1240---[27]
327.8--1.21-35.8945130155--620---
337.234.21.40.52-10------[28]
348.113.518515.54.247-50160------
35-650----375456985------[29]
367.91.8924.527.950.0280.589-00--590---[30]
377.2220.005673.556-3050--1086---
387.5-----103-96-450---[31]
398.18-4.2--24.631.44.3--121242.1--[32]
10.12-16.6--276.7293.369.8--5411083--
407.7-24--8026-64--436--156[33]
7.7-48--8013-37--412--124.8
417.55456.8--4619-5.566-820191018-[34]
427.6----9410--280180--32-[35]
438.2----78.9715--295248--28-
448.80.6---22019259.6335--1925-45.02-[36]
457.26.5---1259351.4145--935-33.8-
4612.4710268--115----9082870--12.4[37]
477.27-----21.3343.572--11101191--[12]
487.5-----450396--450---[31]
49---------<1000-<50,000<3000--
50500-----------1000--
517.33-71--5125-30114--18,00031480.0231365[38]
529.06-90--5616----31003100-1365[39]
5310.12-16.6--276.7293.369.8--5411083--[32]
547.8-490--511338--1690---[40]
558----100147<10--670---[41]
56≥10.0->400-->150-----387-<0.005-[23]
Table 2. Physical properties of raw materials used.
Sr. NoPropertyCementFine AggregateCoarse AggregateUnit
1Consistency28.93%
2Initial setting time110min
3Final setting time229min
4Specific gravity32.672.71
5Water absorption2.011.8%
Fineness modulus2.41
6Blaine fineness2800cm2/g
Table 3. Physicochemical properties of wastewater.
ComponentDesirable Level (ASTM C1602/C1602M) [56]UnitsFresh WaterType of Wastewater
Textile IndustrySugar MillCar Service StationSewerageFertilizer
Bicarbonate 200mg/L200200750370400nil
Alkalinity2.5mmole/L2.54157.48nil
Conductivity1500micro-s/cm1500692667088018508560
PH8.5 8.5711.16872.6
Hardness 300mg/L30034121203707212560
TDS500mg/L500381415049010955306
COD10mg/L1012095014204211045
BOD 5mg/L5707201120311610
Fluoride 1.5mg/L1.50.710.10.121.150.43
Turbidity5mg/L51.2325372503.25
TTS30mg/L3022657051053
DO5mg/L55.332.62.82.5
Chloride250mg/L25063105055340840
Sulfate500---50010222101154552450
Nitrate10----102.7301010266
Table 4. Concrete mixture design.
Mixture IDAcronymWater SourceCement (kg/m3)Sand (kg/m3)Aggregate (kg/m3)Water (kg/m3)
Mix-1CP-FRWFresh Water (Control Mix)198.9795.6397.899.45
Mix-2CP-TXWTextile Wastewater198.9795.6397.899.45
Mix-3CP-SUWSugar Mill Wastewater198.9795.6397.899.45
Mix-4CP-CSWCar Service Station Wastewater198.9795.6397.899.45
Mix-5CP-SEWSewerage Wastewater198.9795.6397.899.45
Mix-6CP-FIWFertilizer Industry Wastewater198.9795.6397.899.45
Table 5. XGBoost hyperparameters for each target variable.
TargetColsample_BytreeLearning_RateMax_Depthn_EstimatorsSubsample
WA (%)0.80.0171000.8
CS (MPa)0.80.0152000.8
UPV (Direct (m/s)0.80.0132001
UPV (Indirect (m/s))0.80.132001
UPV (Semi-direct (m/s))0.80.27500.8
DME (Direct (Gpa))10.23500.8
DME (Indirect (Gpa))10.131001
DME (Semi-direct (Gpa))0.80.171000.8
Table 6. Model performance metrics.
TargetMSERMSEMAER2
WA (%)7.922.812.040.02
CS (MPa)37.606.134.940.92
UPV—Direct (m/s)41,106.78202.75184.720.97
UPV—Indirect (m/s)11,345.74106.5266.410.99
UPV—Semi-direct (m/s)5,605,8072367.661223.040.97
DME—Direct (Gpa)0.330.570.360.99
DME—Indirect (Gpa)2.321.521.010.98
DME—Semi-Direct (Gpa)3355.1457.9234.100.80
Table 7. Average performance metrics for each water source.
Water SourceWater Absorption (%)Compressive Strength (MPa)Pulse Velocity Direct (m/s)Pulse Velocity Indirect (m/s)Pulse Velocity Semi-Direct (m/s)Dynamic Modulus Direct (GPa)Dynamic Modulus Indirect (GPa)Dynamic Modulus Semi-Direct (GPa)
Textile4.1731.311663.892073.7511,218.249.3915.52161.55
Sugar3.9427.631704.521776.5610,421.039.9310.18149.75
Fresh Water2.7830.771533.622028.3910,093.698.3615.03142.17
Carwash4.0327.541621.141806.5410,492.599.0112.05117.98
Sewerage4.3827.311606.891853.6010,316.798.6110.7298.82
Fertilizer5.5120.641489.801754.269419.487.5510.1184.90
Disclaimer/Publisher’s Note: The statements, opinions and data contained in all publications are solely those of the individual author(s) and contributor(s) and not of MDPI and/or the editor(s). MDPI and/or the editor(s) disclaim responsibility for any injury to people or property resulting from any ideas, methods, instructions or products referred to in the content.

