Article

Dynamic Temperature–Vacuum Swing Adsorption for Sustainable Direct Air Capture: Parametric Optimisation for High-Purity CO2 Removal

by
Maryam Nasiri Ghiri
1,
Hamid Reza Nasriani
1,*,
Leila Khajenoori
1,
Samira Mohammadkhani
2 and
Karl S. Williams
1
1
School of Engineering & Computing, University of Lancashire, Preston PR1 2HE, UK
2
Geological Survey of Denmark and Greenland, Department of Geo-Energy and Storage, ΦsterVoldgade 10, 1350 Copenhagen, Denmark
*
Author to whom correspondence should be addressed.
Sustainability 2025, 17(15), 6796; https://doi.org/10.3390/su17156796
Submission received: 12 April 2025 / Revised: 7 July 2025 / Accepted: 15 July 2025 / Published: 25 July 2025
(This article belongs to the Section Waste and Recycling)

Abstract

Direct air capture (DAC), as a complementary strategy to carbon capture and storage (CCS), offers a scalable and sustainable pathway to remove CO2 directly from the ambient air. This study presents a detailed evaluation of the amine-functionalised metal-organic framework (MOF) sorbent, mmen-Mg2(dobpdc), for DAC using a temperature–vacuum swing adsorption (TVSA) process. While this sorbent has demonstrated promising performance in point-source CO2 capture, this is the first dynamic simulation-based study to rigorously assess its effectiveness for low-concentration atmospheric CO2 removal. A transient one-dimensional TVSA model was developed in Aspen Adsorption and validated against experimental breakthrough data to ensure accuracy in capturing both the sharp and gradual adsorption kinetics. To enhance process efficiency and sustainability, this work provides a comprehensive parametric analysis of key operational factors, including air flow rate, temperature, adsorption/desorption durations, vacuum pressure, and heat exchanger temperature, on process performance, including CO2 purity, recovery, productivity, and specific energy consumption. Under optimal conditions for this sorbent (vacuum pressure lower than 0.15 bar and feed temperature below 15 °C), the TVSA process achieved ~98% CO2 purity, recovery over 70%, and specific energy consumption of about 3.5 MJ/KgCO2. These findings demonstrate that mmen-Mg2(dobpdc) can achieve performance comparable to benchmark DAC sorbents in terms of CO2 purity and recovery, underscoring its potential for scalable DAC applications. This work advances the development of energy-efficient carbon removal technologies and highlights the value of step-shape isotherm adsorbents in supporting global carbon-neutrality goals.

1. Introduction

The continued rise in atmospheric CO2—driven by population growth, urbanisation, and industrialisation—has intensified global climate change, making carbon mitigation a critical priority for long-term environmental sustainability. Despite growing efforts to decarbonise, fossil fuels such as coal, oil, and natural gas remain the dominant energy sources, and account for over 75% of anthropogenic CO2 emissions [1,2,3,4,5]. While renewable energy technologies (e.g., wind, solar, hydro, and bioenergy) offer low-carbon alternatives, their adoption is challenged by intermittency, storage limitations, and spatial constraints [6,7,8,9,10,11]. While the global energy transition is underway, the pace of decarbonisation remains insufficient to meet the targets set by the Paris Agreement and ensure climate sustainability. Atmospheric CO2 levels have risen from approximately 180 parts per million (ppm) during the last three glacial cycles to about 426 ppm as of May 2024, with an ongoing annual increase of around 2 ppm [12,13]. To limit the global temperature rise to below 2 °C, with an aspirational target of 1.5 °C above pre-industrial levels, as outlined in the Paris Agreement, large-scale removal of atmospheric CO2 is required, with estimates indicating a need to extract 10 GtCO2/year by 2050, increasing to 20 GtCO2/year thereafter [14,15].
Direct air capture (DAC) has emerged as a promising negative emission technology to address both current and historical CO2 emissions, complementing traditional carbon capture, utilisation, and storage (CCUS) technologies that primarily target point sources [7,16]. Among the available DAC technologies, absorption using liquid solvents is the most widely applied due to its high CO2 capacity and relatively low cost. However, its application in DAC is limited by challenges such as complex waste management, solvent degradation, evaporation losses, and high thermal energy demand for regeneration, especially under variable atmospheric conditions [17,18,19]. While alternatives like ionic liquids offer improved thermal stability, their practical use is constrained by thermal decomposition and high cost [20,21,22,23]. These limitations have shifted attention towards adsorption-based DAC processes, which offer the advantage of partially overcoming the limitations associated with absorption [24].
Various porous materials, including carbon, zeolites, silica, resin, and metal-organic frameworks (MOFs), have been investigated for CO2 separation [25,26,27,28,29,30,31]. While activated carbons (ACs) and zeolites have been widely studied for DAC due to their porosity and thermal stability, both exhibit significant limitations under ambient conditions. ACs exhibit reduced CO2 capacity under humid environments and may degrade thermally during repeated regeneration, particularly at high desorption temperatures [32,33], though modifications, such as hydrophobic surface treatments and potassium carbonate incorporation, offer partial improvements [34,35,36]. Zeolites offer high CO2 selectivity and strong structural stability but suffer from moisture sensitivity and loss adsorption capacity above 100 °C, requiring high regeneration energy [37,38,39]. To overcome these issues, approaches such as core–shell hydrophobic coatings and ion exchange have been investigated, with Fe-modified 13X zeolites showing enhanced performance [21]. Recent advances have positioned MOFs as promising candidates, offering extremely high surface areas (up to 7140 m2/g, and theoretically even 10,000 m2/g) and structural tunability through metal-organic coordination, with over 88,000 MOF structures reported and many more possible [40,41]. The mechanisms and strategies for optimising CO2 capture in MOFs under high-concentration conditions are well established, resulting in the development of highly stable and high-performing materials that are now commercialised for industrial use. For example, CALF-20, a MOF developed for flue gas CO2 capture, features channel-like pores of approximately ~3 Å and demonstrated a CO2 uptake of 4.07 mmol g−1 at 293 K and 1.2 bar, with an IAST selectivity of 230 for a 10/90 CO2/N2 mixture [42]. Similarly, UTSA-16, an ultra-microporous MOF based on citric acid, achieves a CO2 uptake of 4.25 mmol g−1 with pore dimensions of 3.3 × 5.4 0A2 [43]. Moreover, recent developments in MOF design have explored the integration of catalytic sites for simultaneous CO2 capture and conversion, broadening the potential application of these materials beyond pure adsorption processes [44,45]. However, for capturing CO2 directly from the air, with its extremely low partial pressure, these MOFs, like CALF-20 and UTSA-16, often underperform due to weak binding sites [42,43] and moisture-induced degradation [46].
For low-concentration CO2 capture, chemisorption is advantageous by providing strong binding affinity. In particular, amine-functionalisation of porous materials via physical impregnation, chemical grafting, or in situ polymerisation has proven effective in improving both CO2 capture capacity and selectivity [14,47,48]. This approach has been particularly successful with MOFs, enabling the design of highly tuneable materials (via linker or metal–ligand modifications) and superior CO2 selectivity and capacity through strong Lewis base sites [49,50]. A prominent example is mmen-Mg2(dobpdc), developed by grafting N, N′ dimethyl ethylene diamine (mmen) and ethylene diamine (ED) onto the Mg2(dobpdc) framework [25]. This sorbent exhibits exceptional CO2 capacity at low pressures (2.0 mmol/g (8.1 wt %) at 0.39 mbar and 25 °C) and benefits from fast adsorption kinetics and cooperative adsorption mechanisms that enhance efficiency [51]. In addition, mmen-Mg2(dobpdc) demonstrated favourable recyclability and thermal stability. McDonald et al. [49] reported consistent performance over multiple adsorption–desorption cycles, while later research confirmed structural integrity during vacuum or N2-based regeneration up to 150 °C and its tolerance to moderate humidity [52]. These characteristics further reinforce its suitability for long-term DAC operation. Subsequent studies have confirmed its potential under DAC conditions [38,50,53,54,55]. However, Darunte et al. [56] evaluated its performance for CO2 capture from ultra-dilute feeds and observed a reduced CO2 capture fraction due to the unique stepped isotherm and kinetic characteristics of this sorbent. Further investigation under 1000 ppm CO2 confirmed the high working capacity of mmen-Mg2(dobpdc) despite mass transfer limitations [57].
To maximise DAC efficiency, the choice of regeneration strategy has a critical role in determining the overall process efficiency. TVSA has been identified as the most suitable regeneration strategy for amine-functionalised solid sorbents, offering high working capacities and lower energy demands without requiring extreme vacuum or temperature [58,59,60], which makes it well suited for DAC, where careful balance between sorbent efficiency and the regeneration energy demand is essential. Phase-change adsorbents like mmen-Mg2(dobpdc), which exhibit sharp stepwise isotherm transitions, particularly benefit from TVSA because it enables effective regeneration with minimal energy input [51].
While several studies have explored the application of different amine-functionalised MOFs for CO2 capture from flue gas [61,62] and the indoor environment [57], this study specifically targets the 400 ppm CO2 concentration typical of DAC, where lower partial pressures intensify both kinetic and thermodynamic challenges. A dynamic simulation of a modular DAC process is developed using the amine-functionalised MOF, mmen-Mg2(dobpdc), known for its distinctive step-shaped CO2 adsorption isotherm. A one-dimensional TVSA framework, implemented in Aspen Adsorption, incorporates mass, energy, and momentum balances to simulate the transient behaviour of adsorption–desorption cycles at lab scale. Sensitivity analysis is conducted to evaluate the effects of key operating parameters—feed flow rate and temperature, vacuum pressure, and step durations—on critical performance metrics, including CO2 purity, recovery, productivity, and specific energy consumption. The findings establish operational guidelines to improve process efficiency and provide valuable insights for the design and optimisation of energy-efficient MOF-based DAC systems, aligning with broader environmental sustainability goals.

2. Materials and Methods

During adsorption, CO2 is captured by high-affinity porous material, followed by a regeneration step that releases CO2 and restores the sorbent’s capacity. The efficiency of this process depends on the sorbent properties, operating conditions, and regeneration strategy. In this study, a TVSA process was simulated in an axial-flow fixed-bed reactor, where mmen-Mg2(dobpdc) was used as the adsorbent. TVSA combines mild heating and vacuum pressure reduction to desorb CO2 while restoring the sorbent’s adsorption capacity for subsequent cycles [63]. The released CO2 was collected through a condenser to ensure high purity, while a heat exchanger was integrated within the bed to optimise thermal management during adsorption and desorption.

2.1. Simulation Framework (Numerical Modelling and Assumption)

A dynamic model for non-isothermal, adiabatic TVSA was developed in Aspen Adsorption to evaluate the technical performance of mmem-Mg2(dobpdc) under DAC conditions. The software simulates the complete adsorption/desorption cycle, incorporating mass, energy, and momentum balances to predict system behaviour and evaluate process parameters (Aspen Adsorption V14). To solve the coupled partial differential equations (PDEs) under specified boundary conditions, this study applied a set of assumptions to simplify the computational complexity while maintaining model accuracy, as follows:
  • The sorbent has a spherical shape with uniform, continuous properties, as the selected particles used in the experimental studies were derived from MOF powders composed of fine crystallites that were agglomerated and sieved to obtain particles with controlled and consistent size [56].
  • The gas phase follows ideal gas behaviour, which is a reasonable approximation under the low operating pressures and dilute CO2 concentrations typical of DAC systems.
  • Constant adsorbed phase heat capacity is assumed because the amount of adsorbed CO2 is small in DAC.
  • The column thickness effect is ignored, assuming the adiabatic conditions.
  • No parasitic reactions between the gas and the adsorbent.
  • A one-dimensional model incorporating convection.
  • The air flow mixture consists of CO2 and N2, with CO2 as the sole adsorbed component.
  • CO2 adsorption kinetics differ below and above Pₛₜₑₚ, and the model captures this through dual-regime rate constants derived from experimental fitting [56].
These assumptions are consistent with prior TVSA modelling studies [53,54,64,65], allowing focus on parametric influences rather than complex 2D effects or humidity interactions.
The exceptional CO2 selectivity of mmen-Mg2(dobpdc) allows the exclusion of N2 and O2 from adsorption considerations. McDonald [49] reported that CO2/N2 selectivity of this sorbent exceed 49,000, with negligible uptake of O2 and N2. Mason et al. [66] further confirmed that N2 adsorption was undetectable in mixed-gas conditions. Based on these findings, N2 and O2 can be treated as inert gases in this model. Additionally, the effect of water adsorption was not considered in the present study, as experimental results have consistently demonstrated that the presence of H2O has minimal influence on CO2 adsorption in mmen-Mg2(dobpdc). Notably, CO2 uptake under humid conditions is comparable to, or slightly higher than, that observed in dry environments [49,50,51,52,53,54,55,56,57,58,59,60,61,62,63,64,65,66]. Similarly, breakthrough experiments conducted at 50% relative humidity under DAC conditions illustrated an increase in CO2 capture capacity from 2.16 mmol/g to 2.41 mmol/g [67].

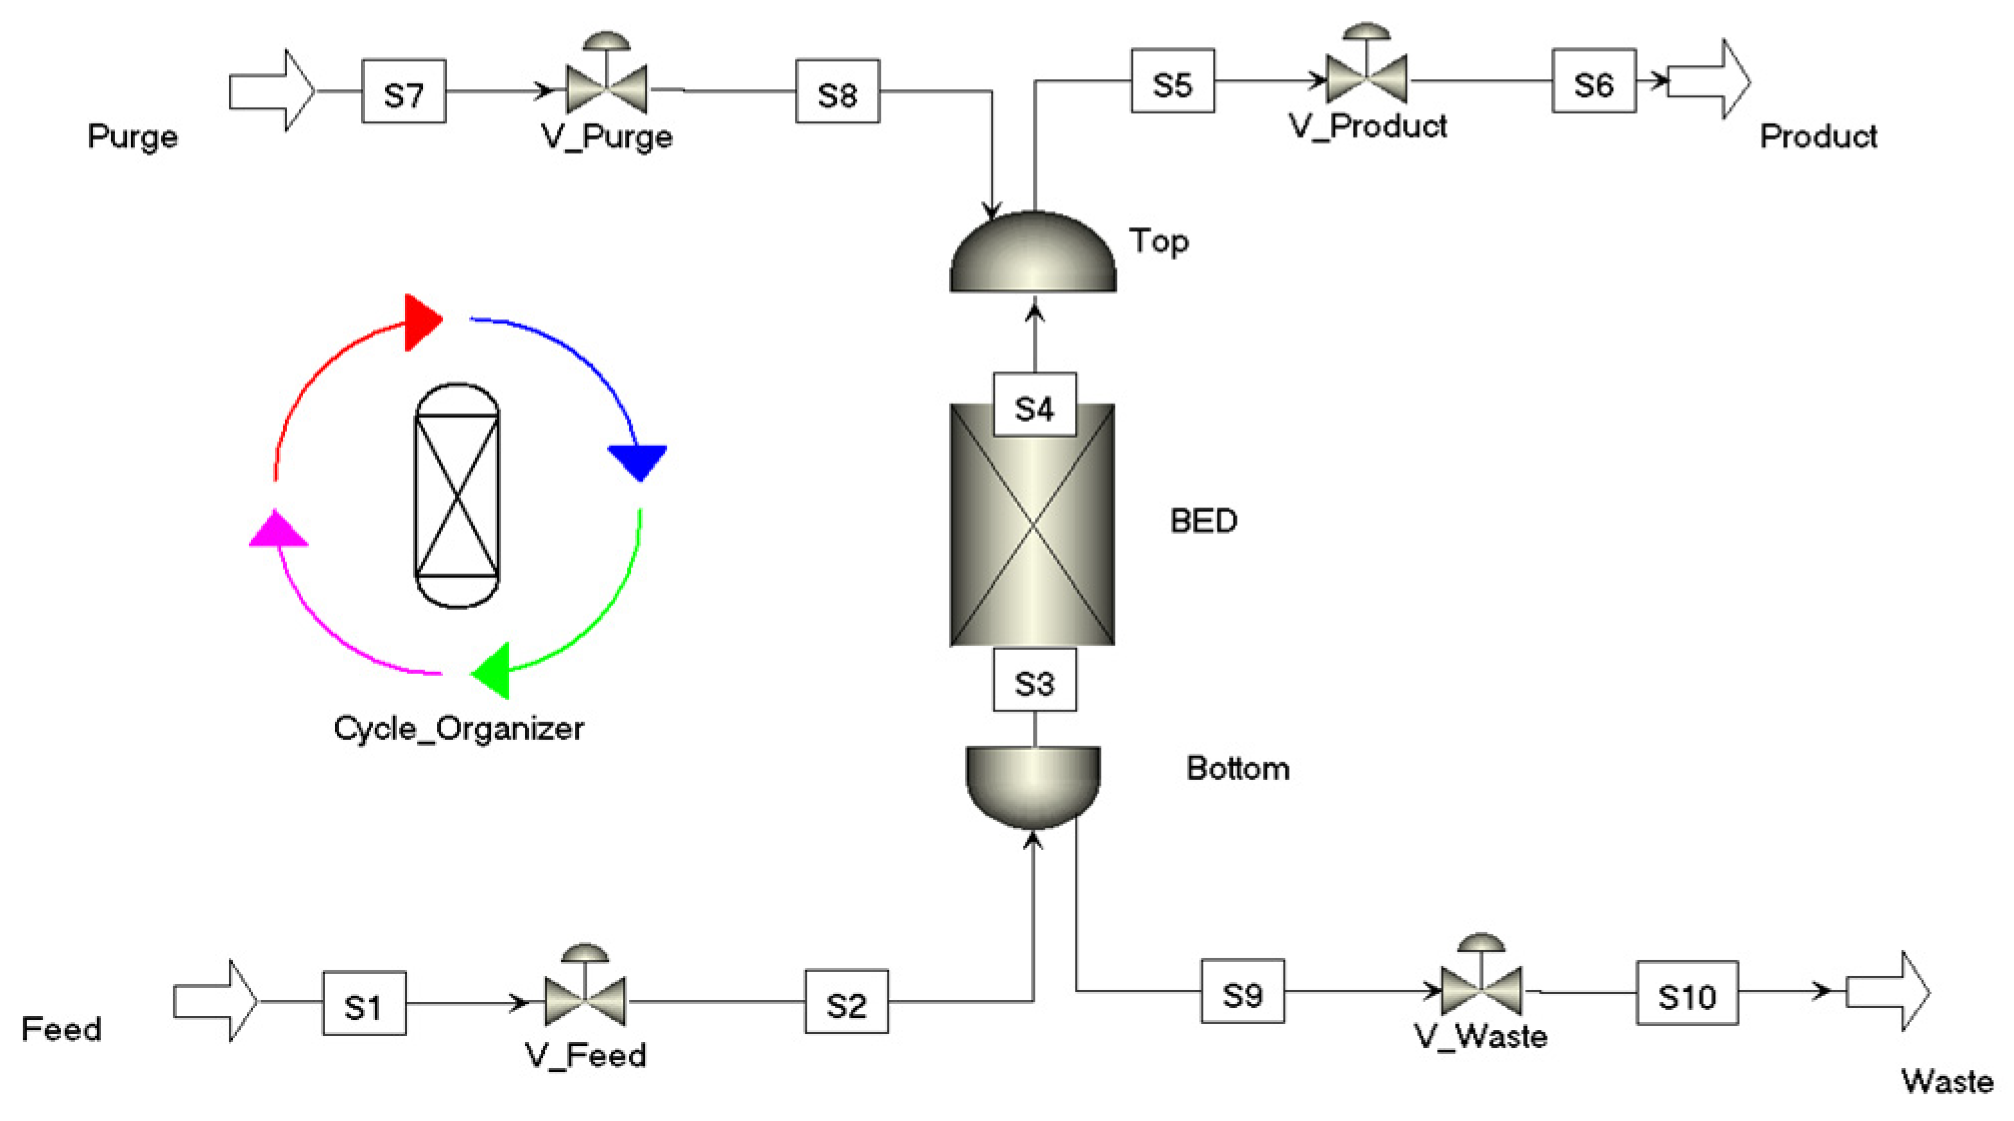
2.1.1. Packed-Bed Specification

The packed-bed reactor was designed based on the experimental parameters reported by Darunte [56]. The air feed conditions were set at 1.1013 bar and 25 °C, with a molar composition of 99.96% N2 and 0.04% CO2. Table 1 lists the key design parameters for the packed-bed reactor model used in this study. These parameters define the physical characteristics of the adsorption column and operating conditions, which govern adsorption behaviour and system performance by influencing flow dynamics, mass transfer, and adsorbent capacity.

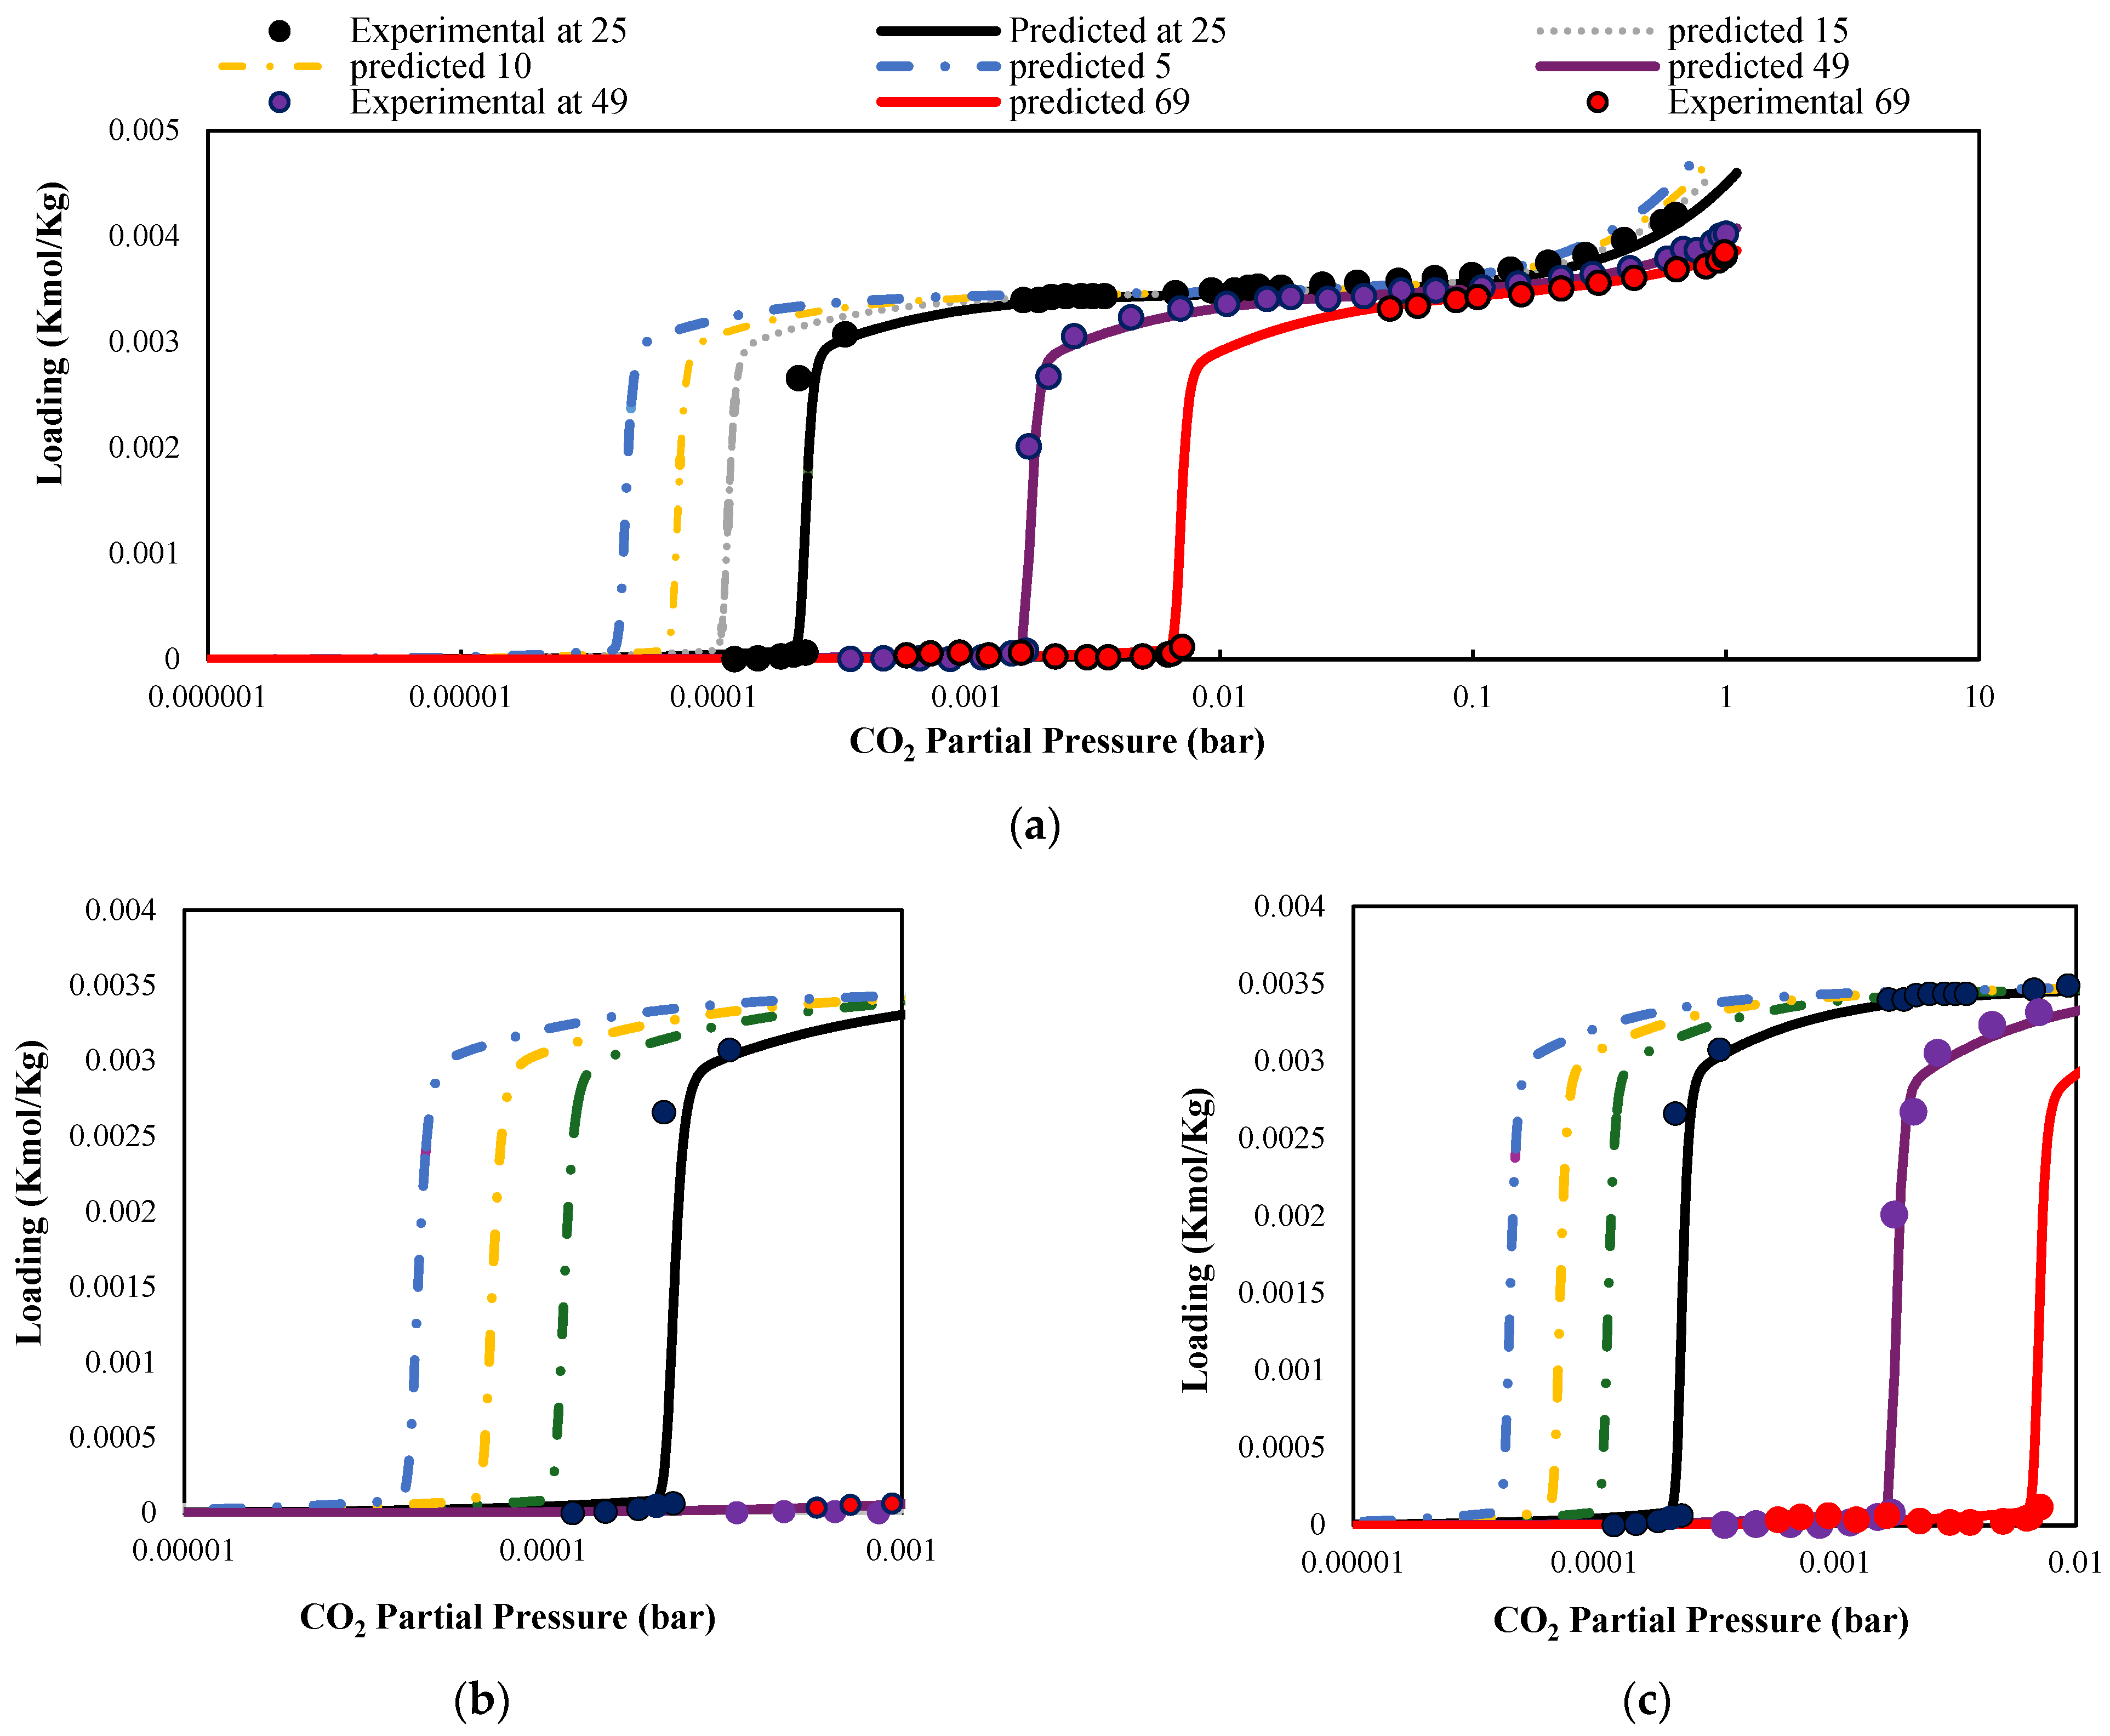
2.1.2. Adsorption Equilibrium and Kinetics

The development of the model required accurate adsorption characteristics. The relevant thermal properties used in the simulation are summarised in Table 2.
Table 2. Thermal characteristics of mmen-Mg2(dobpdc) and adsorbates.
ParametersUnitValuesReference
CO2 heat of adsorptionKJ/mol−71[68]
N2 heat of adsorptionKJ/mol−18[57]
Heat capacity of the crystalKJ/Kg·K1.6[51]
CO2 heat capacityKJ/Kmol·K37.4673(Aspen Plus)
N2 heat capacityKJ/Kmol·K29.1806(Aspen Plus)
Thermal conductivityW/m·K0.3 [69]
The adsorption behaviour of mmen-Mg2(dobpdc) follows step-shape (S-shape) CO2 adsorption isotherm, characterised by two distinct adsorption regimes. Below isotherm transition pressure (Pstep), CO2 adsorption occurs through the reaction of two free amine groups with CO2, forming ammonium carbamate, similar to conventional amine functionalised sorbents. Above Pstep, the cooperative adsorption mechanism is observed, where both ends of the diamine participate in CO2 binding, leading to the formation of one-dimensional ammonium carbamate chains aligned along the Mg2+ framework [51]. This study employed the model proposed by Darunte et al. [56], which builds upon Hefti’s framework [54], incorporating the Sips isotherm to accurately describe CO2 adsorption below Pstep, as defined by Equations (1)–(8). Here, q 1 * and q 2 * describe CO2 uptake before and after Pstep, respectively, w presents a smooth transition function between two regions, q L , q H , and q U represent the affinity of sorbents, and n reflects the surface homogeneity factor. The temperature dependence of Pstep is calculated by Equation (8), where p s t e p , 0 = 0.8 mbar at T0 = 313.5 0K, and H s t e p represent the enthalpy change associated with the adsorption transition [51]. Darunte et al. [56] fitted the isotherm model to the experimental data to determine the isotherm parameters. The fitted parameters with the formula of temperature-dependent parameters are presented in Table 3:
q t o t a l = q 1 * + q 2 *
q 1 * = q l o w × 1 w + q s a t × w
q 2 * = ( q h i g h q s a t ) × w
q l o w = q L ( b L p ) n L 1 + ( b L p ) n L
q h i g h = q H b H p 1 + b H p + q U p             p < p s t e p
q s a t = q L b L p s t e p n 1 + b L p s t e p n                 p > p s t e p
w = [ e x p ( log p l o g ( p s t e p ) σ ) 1 + exp log p log p s t e p σ ] γ
p s t e p T = p s t e p , 0 e x p H s t e p R 1 T 0 1 T
The parameters b L and b H represent the temperature-dependent adsorption equilibrium constants for the low-affinity (L) and high-affinity (H) sites, respectively. The terms H L and H H denote the heat of adsorption for low- and high-affinity sites, respectively, while H u corresponds to the heat of adsorption for uniform adsorption sites. The parameter σ characterises the sharpness of the phase transition in the cooperative adsorption mechanism. To describe the adsorption kinetic ( W i t ), a dual-kinetic approach based on the work of Darunte et al. [56] was adopted. Their study demonstrated that the conventional linear driving force (LDF) model alone could not adequately capture the experimental kinetic data. Consequently, they proposed two different kinetic models based on CO2 partial pressure: an LDF model for pressure below the step pressure ( p s t e p ), where CO2 adsorption proceeds via ammonium carbamate formation with a 2:1 amine-to-CO2 stoichiometry [51,70] (Equation (9)), and an Avrami fractional-order model for pressures above pstep. At these higher pressures, CO2 adsorption is governed by cooperative insertion, characterised by a rapid saturation of amine sites due to 1:1 stoichiometry and chain propagation effects (Equation (10)) [56]:
W i t = K k w * i w i                                         p < p s t e p                
W i t = K A n A t n A 1 w * i w i               p > p s t e p                  
In Equation (9), the initial value of the overall mass transfer coefficient K k   (1/s) is estimated using a lumped resistance model, as expressed in Equation (11), which accounts for both external film resistance and macropore diffusion [71]. Since such correlations alone are often insufficiently precise, the initial estimate was subsequently refined by calibrating the simulation results against experimental observations:
1 K k = r p 3 K f k + r p 2 15   ε p K p k
In Equation (11), r p and ε p represent particle radius (m) and intraparticle void fraction, respectively. The film resistance coefficient K f k (m/s) is calculated using Equations (12)–(15). The K p k is the macropore diffusion coefficient (m2/s), which is calculated by Equations (16) and (17):
K f k = s h k D m k 2 r p
s h k = 2 + 1.1 × S c k 1 / 3 R e 0.6
S c k = μ D m k ρ g
R e = v g 2 r p ρ g μ
1 K p k = τ ( 1 D K k + 1 D m k )
D K k = 97 r p ( T M k ) 0.5
The Sherwood ( s h k ), Reynolds ( R e ), and Schmidt numbers ( S c k ) are defined in Equations (12)–(15). The Knudsen diffusion coefficient D K k (m2/s), shown in Equation (17), is a function of temperature (0K), molar mass   M k (g/mol), and pore radius. The total molecular diffusion ( D m k ) is estimated using data from the Aspen Properties database.
In Equation (10), the Avrami parameters kA, t, w * i , and nA represent the Avrami rate constant, time, saturation capacity, and Avrami fractional constant, respectively. The constant parameters ( K A and n A ) were fitted to experimental data, with values of 4.36 × 10⁻⁵ (1/s) and 1.5 for 0.4 mbar CO2 partial pressure [56].

2.1.3. Energy Balance

In a non-isothermal system, energy balance applies to both gas and solid phases. The energy balance for the solid phase is expressed as Equation (18). This equation includes a contribution from heat transfer through convection, the heat released during adsorption, the heat capacity of the adsorbed phase, and the heat transfer between the gas and solid phase. The gas phase energy balance accounts for the effects of convection, heat accumulation, heat transfer between the gas and solid phases, and the heat of reaction, which are outlined in Equation (19). The adsorbed-phase heat capacity and heat transfer coefficient were estimated by using Aspen V14 software:
ρ s C p s T s t + H k + ρ s ( H k w k t ) H T C a p ( T g T s ) = 0
Here, ρ s denotes solid phase density (Kg/m3), C p s is the specific heat capacity of the solid phase (MJ/Kmol·K), T g and T s represent the temperatures of solid and gas phases (K), H k is the heat of adsorption for component K (J/Kg), H T C refers to the heat transfer coefficient between the gas and solid (W/m2·K), and a p is the external surface area per unit volume of the particle (1/m):
C v g v g ρ g T g z + ε t C v g ρ g T g t + H T C   a p T g T s + a H x Q H x = 0
In this equation, C v g represents the specific heat capacity of the gas phase (MJ/kmol·K), v g is the superficial gas velocity (m/s), ρ g is the gas density (Kg/m3), and ε t denotes the total bed porosity. Additionally, a H x is the heat exchanger surface area per unit volume (1/m), and Q H x refers to the heat supplied or removed by the heat exchanger (W/m3).

2.1.4. Pressure Drop

Since the system operates at a constant mass flow rate with uniform adsorbent distribution, steady-state conditions were assumed for pressure drop across the bed. Consequently, the Ergun equation (Equation (20)) was applied to describe the total pressure drop, accounting for both viscous and kinetic energy loss in the fixed bed. In this equation, μ g refers to gas viscosity (N.s/m2), u g is the superficial velocity of the gas phase (m/s), r p represents the particle radius (m), ε is the interparticle voidage fraction (m3(Void)/m3(Bed)), and ρ g is the gas phase density (Kg/m3):
P t o t a l z = 150 μ g 1 ε 2 ε 3 2 r p 2 u g + 1.75 ( 1 ε ) ρ g 2 r p ε 3 u g 2

2.2. Process Design: Basis and Criteria

A cyclic adsorption model was developed as the basis for evaluating mmem-Mg2(dobpdc) under DAC conditions. The process flowchart diagram is depicted in Figure 1. The TVSA sequences were defined in five sequential steps, as outlined below:
  • Adsorption: Ambient air flows through the packed bed, where CO2 is selectivity adsorbed onto the sorbent while CO2-depleted air is released.
  • Evacuation: The system pressure is reduced to remove N2.
  • Heating + Evacuation: The bed is heated using a heat exchanger to reach the regeneration temperature while maintaining vacuum conditions to promote efficient CO2 desorption.
  • Cooling: The heat exchanger cools the bed to maintain thermal stability, prevent amine degradation, and facilitate the next adsorption step.
  • Pressurisation: The system is returned to atmospheric pressure by gradually reintroducing air, initiating the next adsorption cycle.
The initial process cycle duration, considering the breakthrough behaviour, is detailed in Table 4. An event-driven approach was applied to the cooling and pressurisation step to eliminate unnecessary idle time and improve overall cycle efficiency.

2.3. Performance Metrics

To evaluate the steady-state performance of the TVSA process, four key performance indicators—recovery, CO2 purity, productivity, and specific energy consumption—were evaluated, with their respective definitions provided in Table 5. The total energy demand comprises the electrical energy required for the vacuum pump and the thermal energy for the heat exchanger. The electrical energy consumption of the vacuum pump was estimated using the corresponding thermodynamic expression shown in Table 5, with a vacuum pump efficiency (ƞ) assumed to be 0.8. The heat capacity ratio (Cp/Cv), γ , was taken as 1.4, which is the typical value for air and CO2. Thermal energy input associated with the heat exchanger was calculated directly using Aspen Adsorption. Given the negligible pressure drop across the bed under experimental conditions, fan energy consumption was considered insignificant and excluded from the overall energy analysis.

3. Results and Discussion

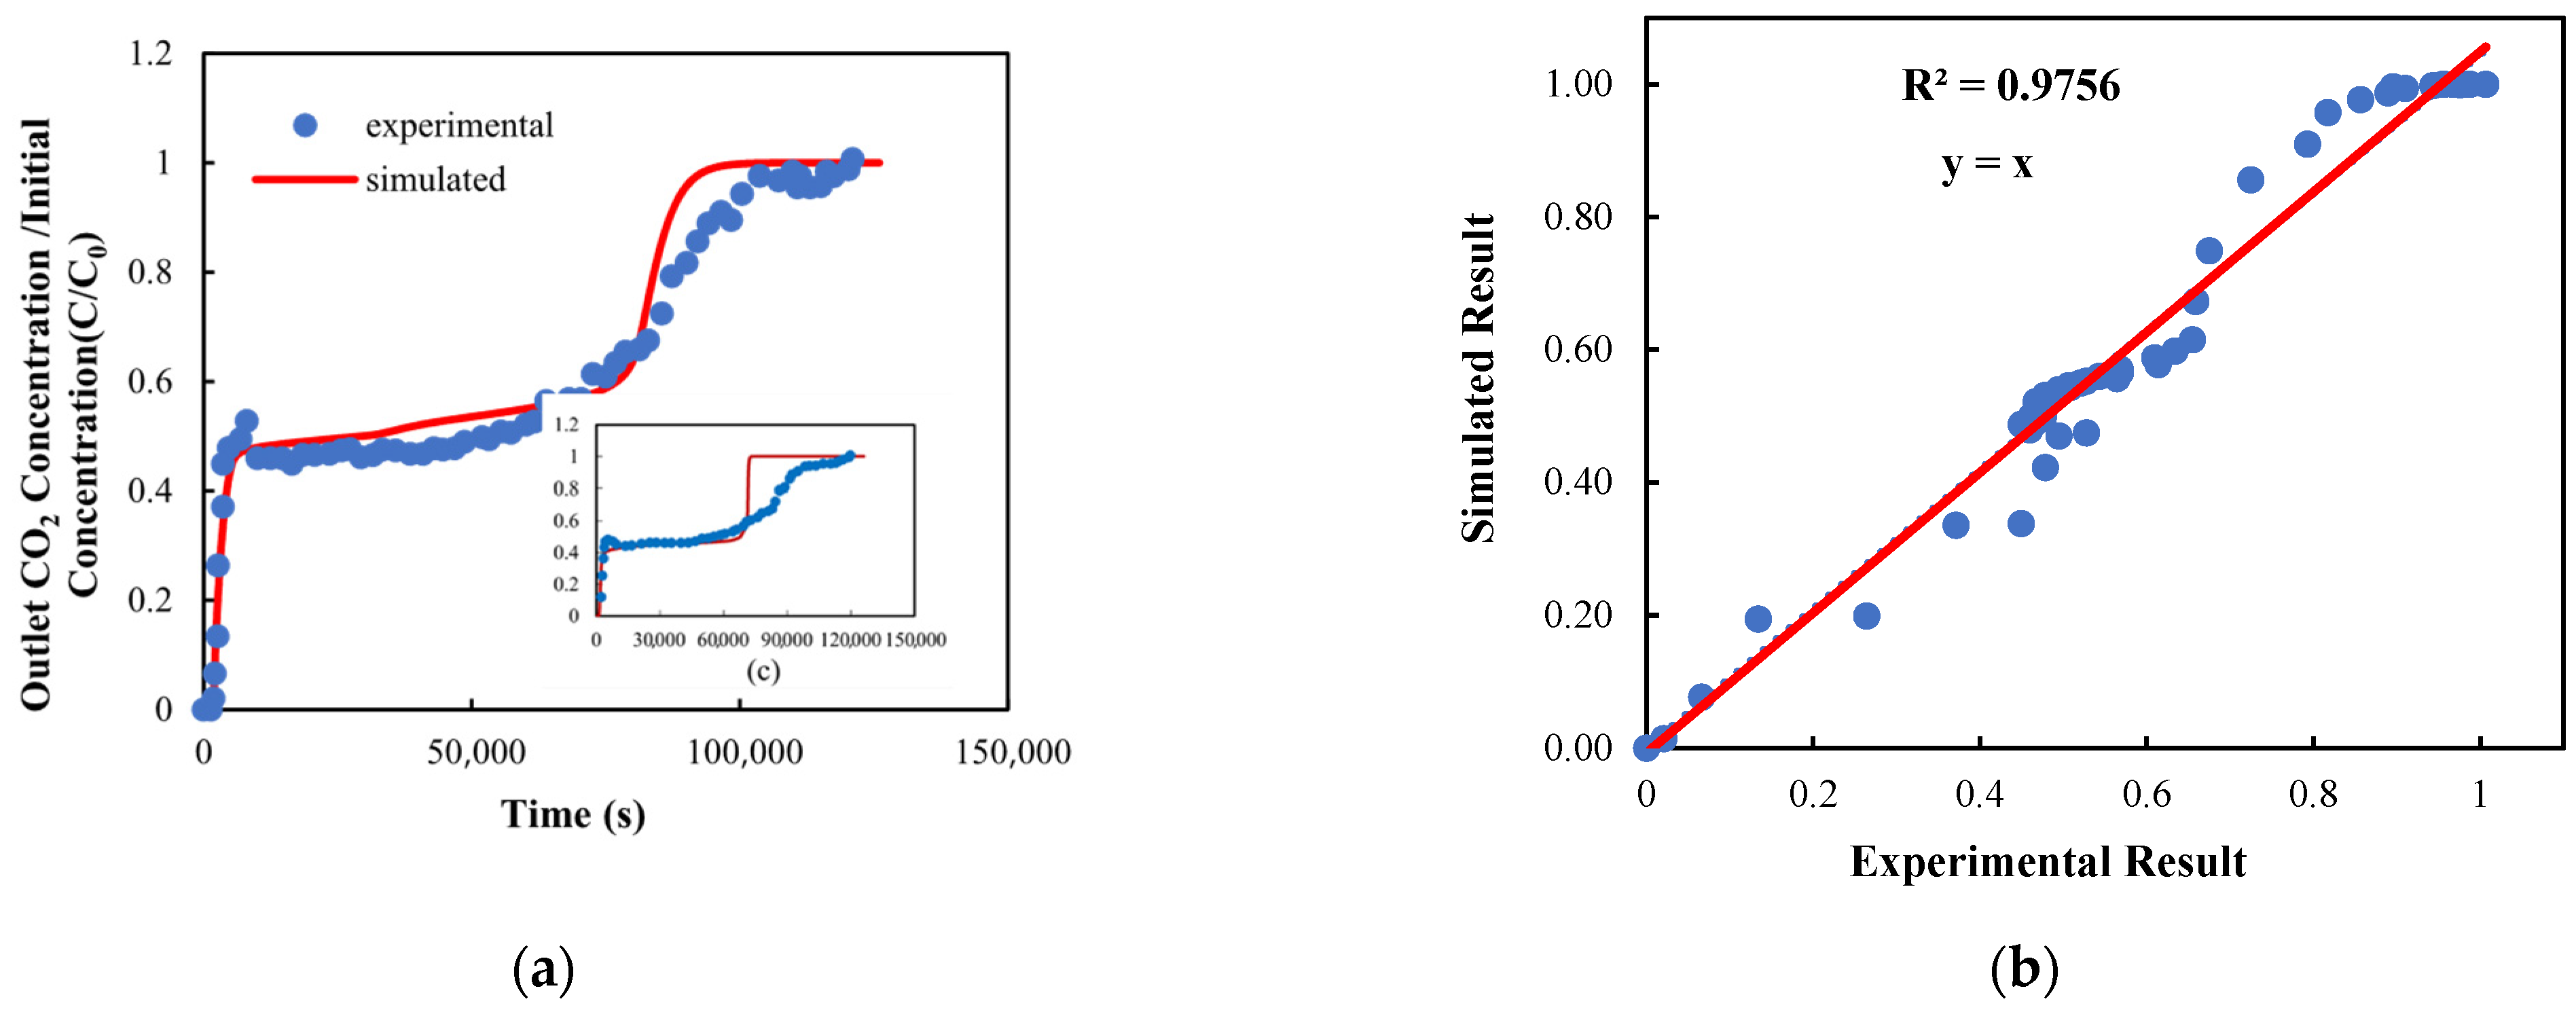
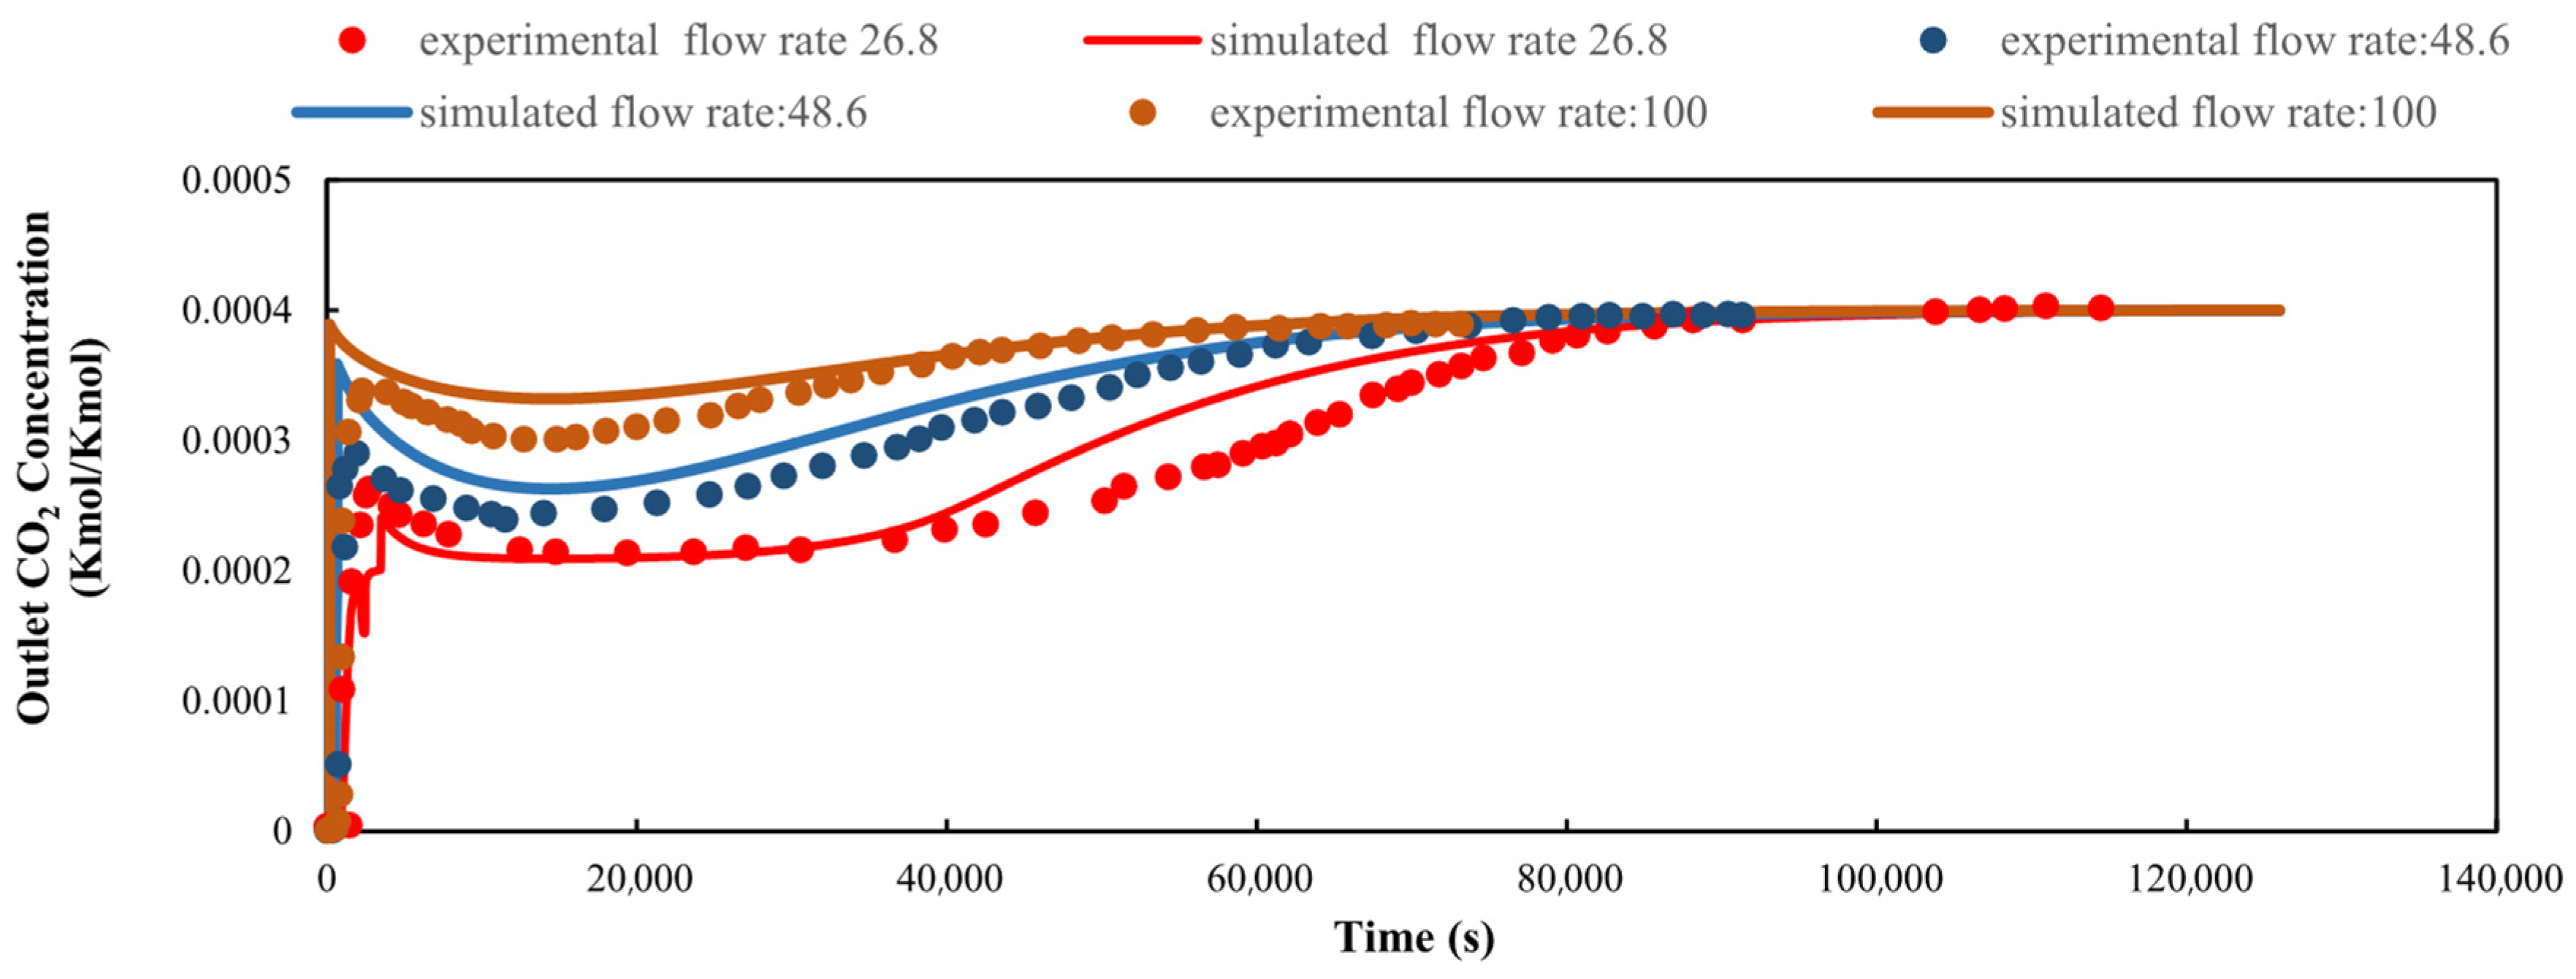
3.1. Mass Transfer Coefficient (MTC) Validation: Breakthrough Curve Comparison

To achieve accurate modelling of breakthrough dynamics, the reliability of the isotherm model was first established. Figure 2a–c demonstrate the close alignment between simulated and experimental CO2 adsorption isotherms at 25, 49, and 69 °C, which are shown in different ranges of CO2 partial pressure. The model also reproduced the adsorption behaviour trend at lower temperatures, supporting its suitability for DAC simulations under reduced temperature conditions. The validated isotherm model was utilised to simulate breakthrough performance, which was subsequently compared with experimental data. Figure 3a presents the breakthrough curves at 23 °C and a flow rate of 17.2 N mL/min. Quantitatively, the predicted breakthrough time deviated by about 3% (Figure 3b), underscoring the model’s predictive accuracy. Further validation at different inlet flow rates (Figure 4) demonstrated the model’s robustness across varying operational conditions. For flow rates of 26.8, 48.6, and 100 NmL/min, the average absolute relative deviation (AARD) values were 8.18%, 7.24%, and 4.97%, the root mean squared error (RMSE) values were 2.99 × 10⁻⁵, 3.10 × 10⁻⁵, and 2.88 × 10⁻⁵, and the R2 values were 0.81, 0.72, and 0.80, respectively.
Validation against experimental breakthrough curves at different flow rates led to the adjustment of the initial estimation of the mass transfer coefficient to 0.05 S−1 for pressure before the step. The values of Avrami equation parameters reported in [56] effectively describe the breakthrough behaviour beyond the step pressure. The simulation results demonstrated that applying a dual-kinetic approach provided a more accurate representation of the adsorption process compared to using the LDF model alone (Figure 3a).
The LDF model captured the initial sharp breakthrough resulting from mmen-Mg2(dobpdc)’s cooperative adsorption behaviour. This sorbent exhibited a step-shaped isotherm, where CO2 uptake began abruptly once a threshold partial pressure was reached. At low loading, strong exothermic chemisorption drove the rapid formation of ammonium carbamate chains, producing a steep concentration front and a sharp breakthrough transition [51]. However, the LDF model alone was not sufficient to reproduce the gradual uptake observed at the intermediate and high CO2 loading. This later-stage behaviour was attributed to moderate chemisorption and weak physisorption, driven by enthalpy-dependent adsorption mechanisms [47].

3.2. Parametric Evaluation

The performance of mmen-Mg2(dobpdc) in DAC was governed by its relatively slow adsorption kinetics and step-shaped isotherm. While the sorbent exhibited high theoretical CO2 capacity, enhancing recovery depends not only on its intrinsic uptake potential but also on its kinetics behaviour. At ambient CO2 concentration, adsorption proceeded in two distinct stages: an initial chemisorption phase with slower kinetics, followed by a faster cooperative insertion step at higher loading. These kinetic characteristics resulted in a sharp breakthrough, followed by a gradual saturation phase, leading to prolonged adsorption times. Therefore, careful tuning of process parameters is essential to enable the sorbent to approach equilibrium loading. A systematic investigation of key process parameters, such as feed flow rate, temperature, and step durations, is critical to overcoming mass transfer limitations and improving overall process performance.
This section evaluates the effects of ambient temperature, inlet flow rate, vacuum pressure, heat exchanger temperature, and step durations on the performance of the DAC process. Parametric analysis provides a systematic framework for assessing the sensitivity of system outputs to these variables and defining optimal conditions for improving process efficiency. A related techno-economic analysis of solid-sorbent DAC systems demonstrated how variations in process conditions and bed geometry affect both energy requirements and cost, highlighting the importance of identifying the most influential parameters to balance CO2 capture efficiency with operational feasibility [72]. The results of this study identified effective operating windows and illustrated the trade-offs among CO2 recovery, specific energy consumption, and system scalability under varying conditions.

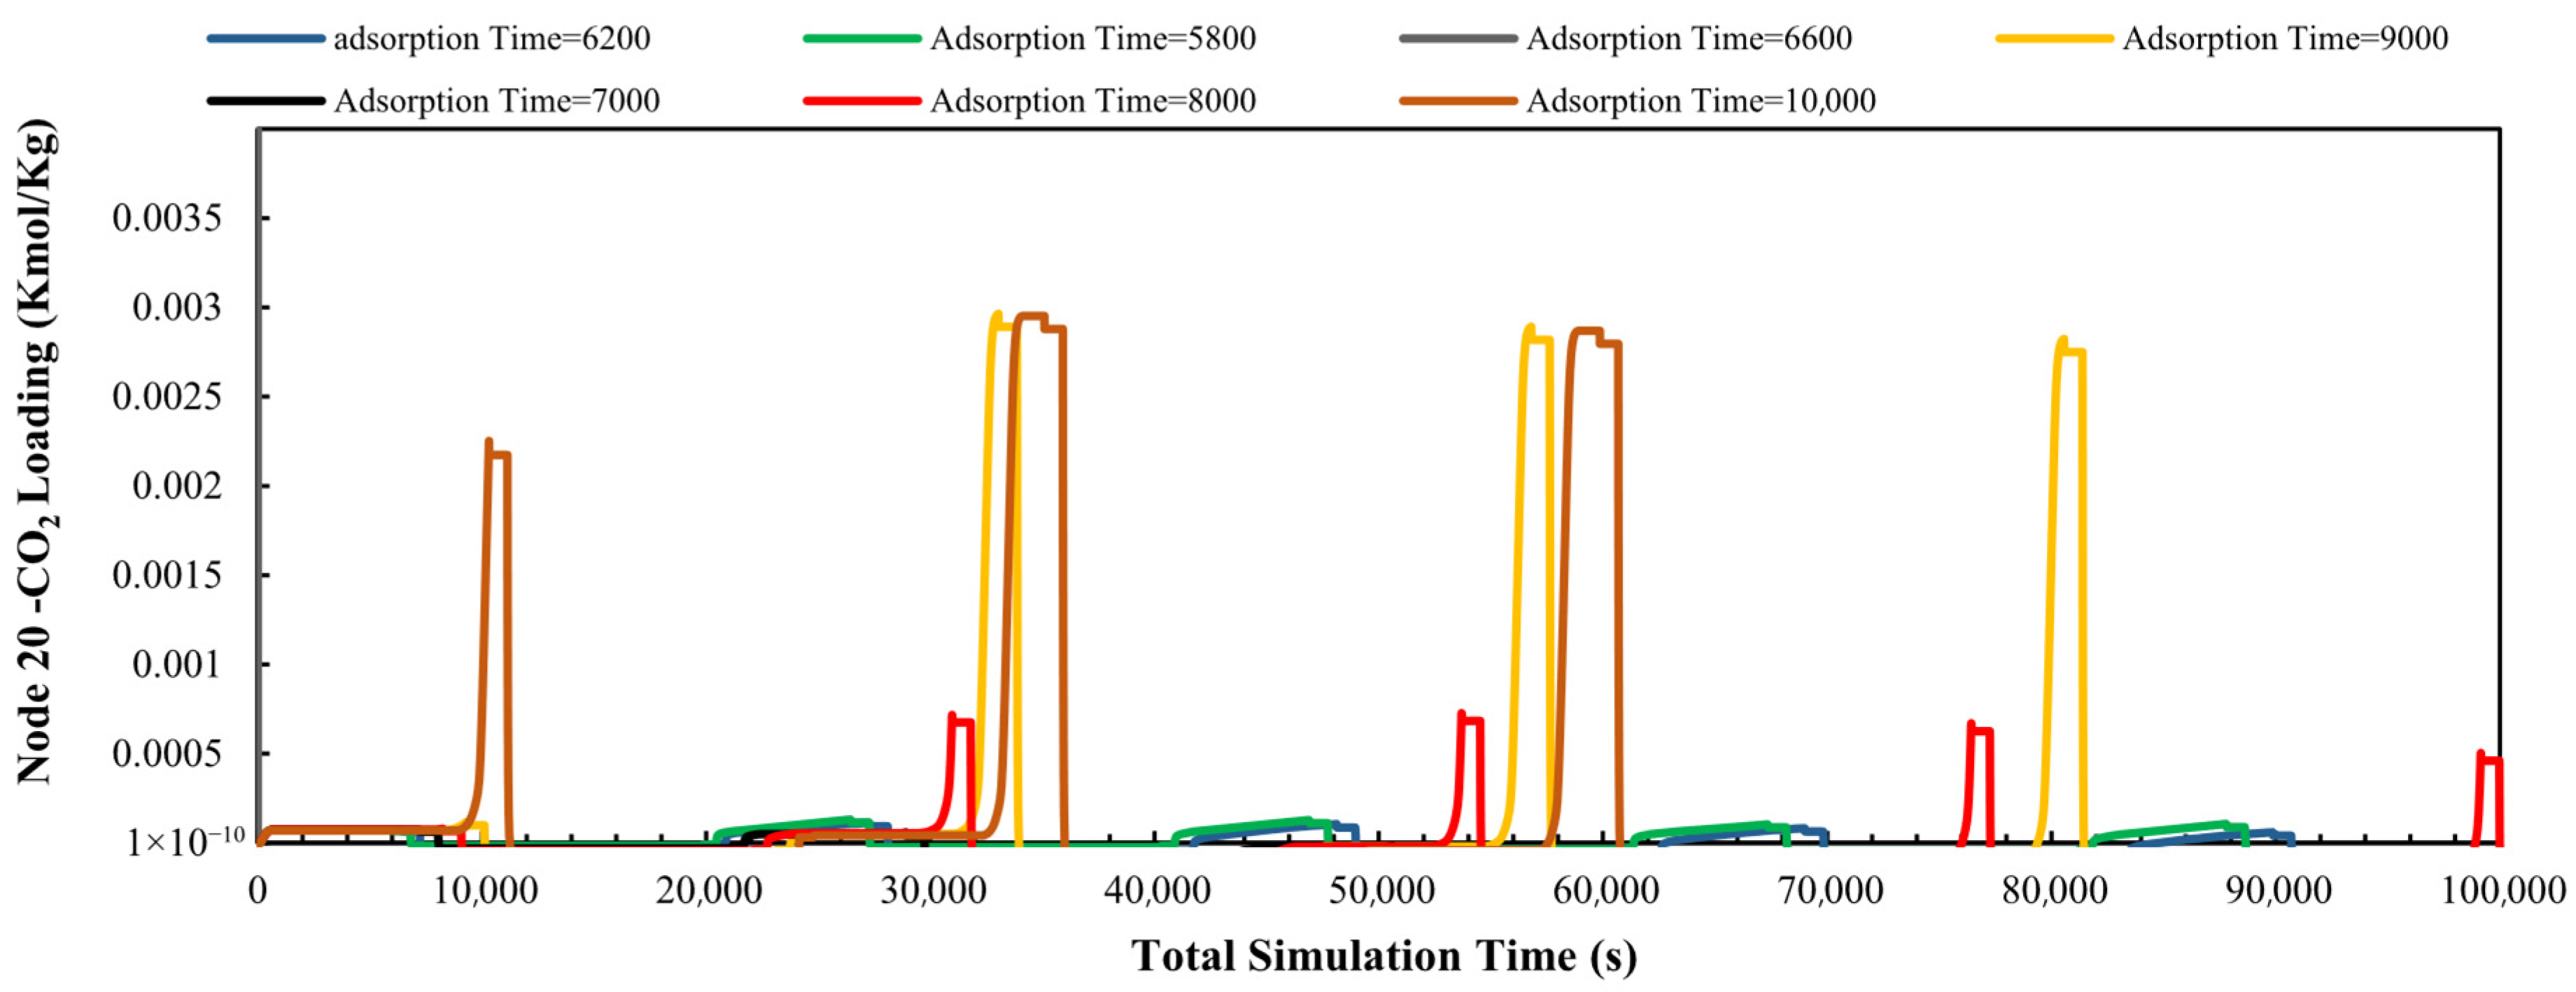
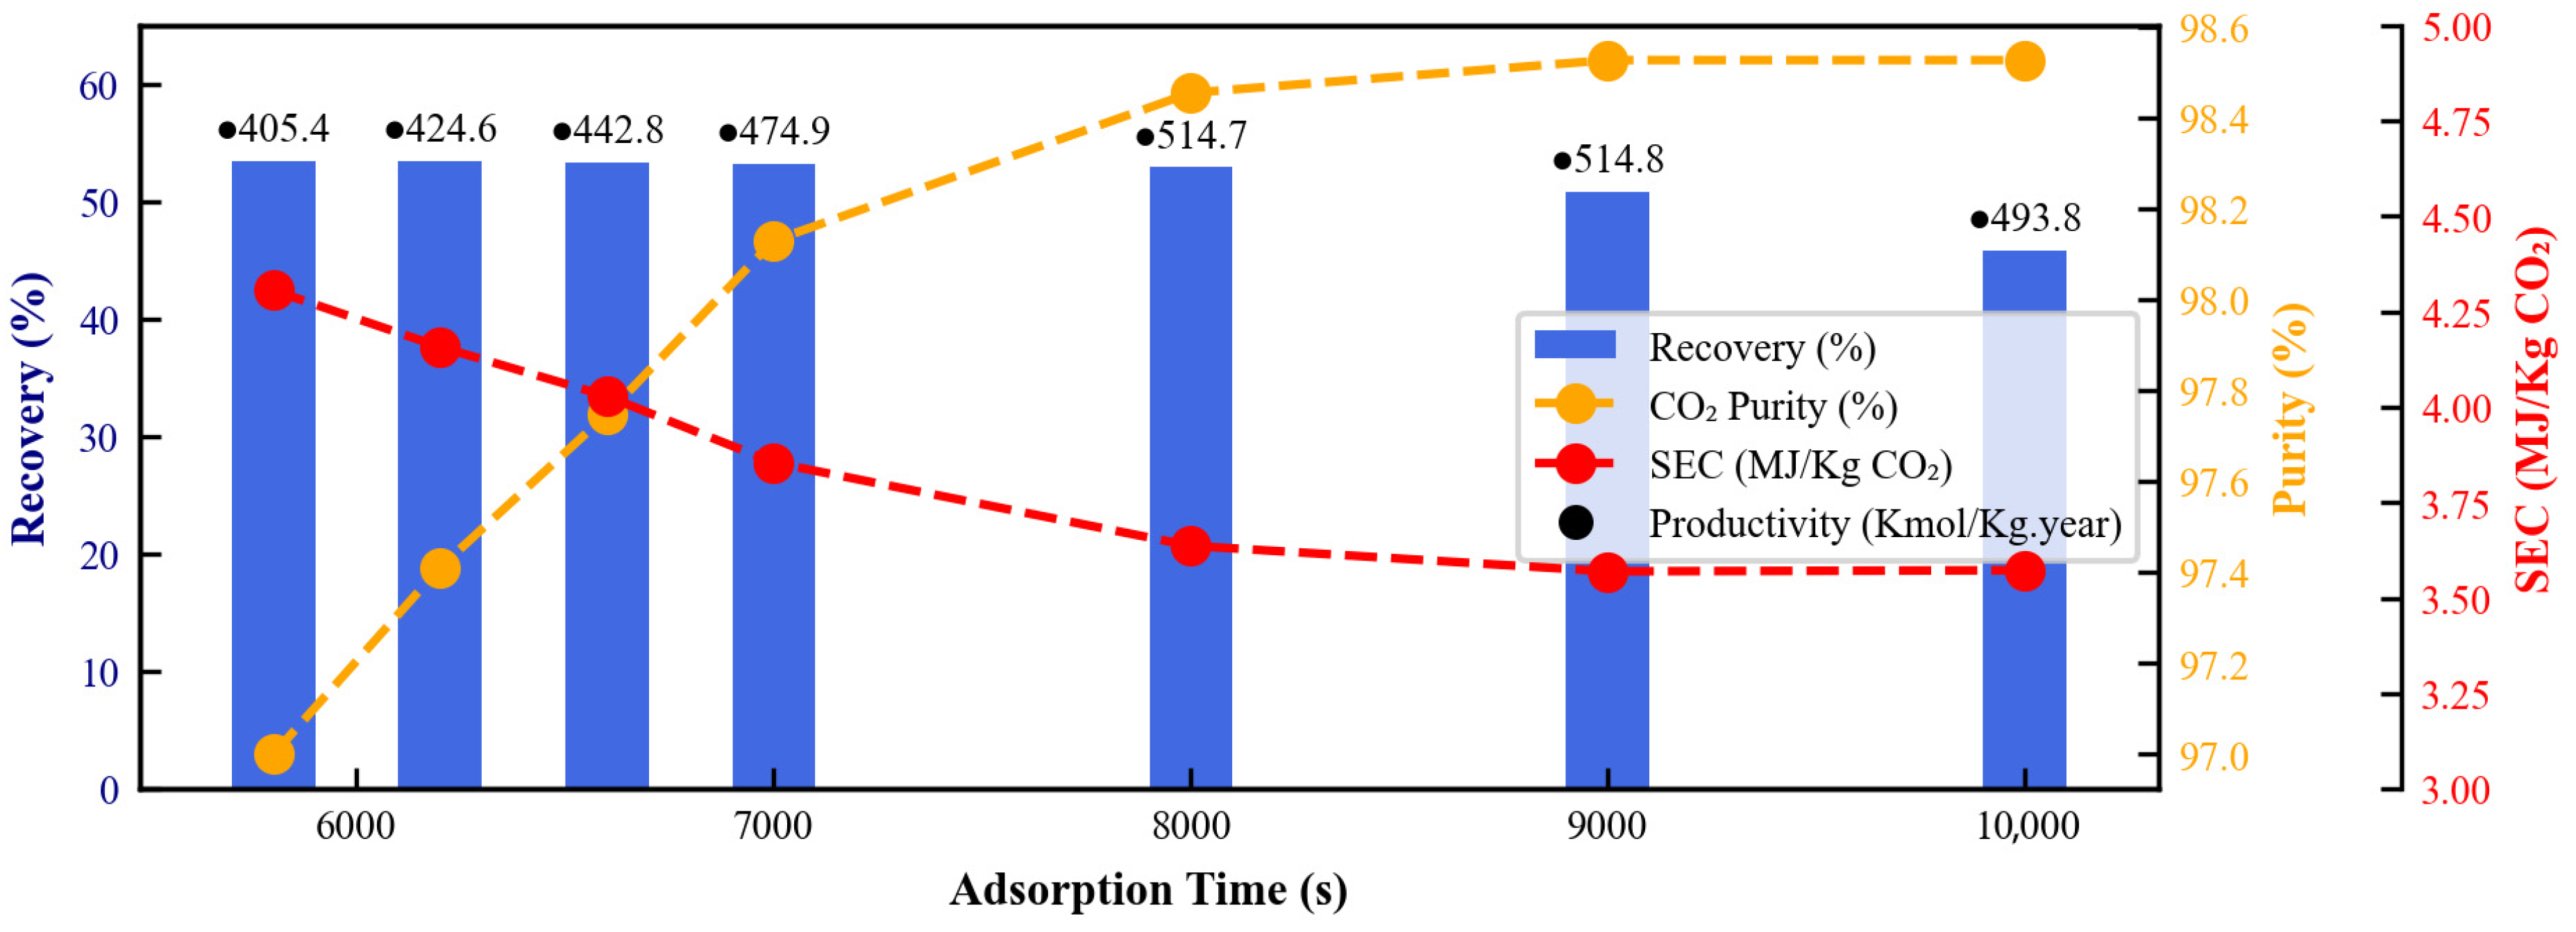
3.2.1. Adsorption Time

During the adsorption step, the primary objective was to maximise CO2 uptake and achieve full bed saturation [73]. This study examined the effect of extending the adsorption time from 5000 to 10,000 s on overall process efficiency. While saturation was consistently achieved at nodes 1 and 10—representing the inlet and midpoint of the bed—the saturation level at node 20—located near the bed outlet—increased with longer adsorption durations. As shown in Figure 5, full saturation at node 20 was attained only when the adsorption time exceeded 9000 s, indicating improved bed utilisation with an extended adsorption period. The prolonged bed saturation was primarily attributed to the limited CO2 mass transfer rate of the sorbent, as reflected in the breakthrough curve profile. As shown in Figure 3a, the curve exhibits a distinct plateau phase following the initial breakthrough front, during which CO2 continues to adsorb gradually, particularly in the downstream segments of the bed. This observation aligns with the work of Stampi-Bombelli et al. [73], who argued that, due to the inherently slow CO2 mass transfer in DAC processes, the adsorption step should be sufficiently long to ensure saturation of the entire column. They proposed defining adsorption time based on the saturation of the final bed segment rather than relying solely on the breakthrough time, particularly because, in DAC systems, the CO2 recovery constraint is less stringent than in post-combustion capture, allowing for longer adsorption durations to prioritise bed saturation.
However, this extended adsorption period introduces a trade-off. While longer adsorption times improved bed utilisation and allowed the bed to approach full saturation, they also coincided with the plateau region of the breakthrough curve, where the adsorbent was no longer able to capture all incoming CO2. Consequently, CO2 recovery slightly decreased by approximately 2%. As shown in Figure 6, increasing the adsorption time enhanced specific energy consumption and CO2 purity, with both metrics plateauing around 9000 s, signifying that the system approached equilibrium and the adsorption bed was saturated with CO2 (Figure 5). Meanwhile, beyond 9000 s, process productivity declined, as fewer operational cycles could be completed annually. This reflects a performance limitation—while prolonging the adsorption phase initially improved overall performance, it eventually led to diminishing returns in both productivity and CO2 recovery.

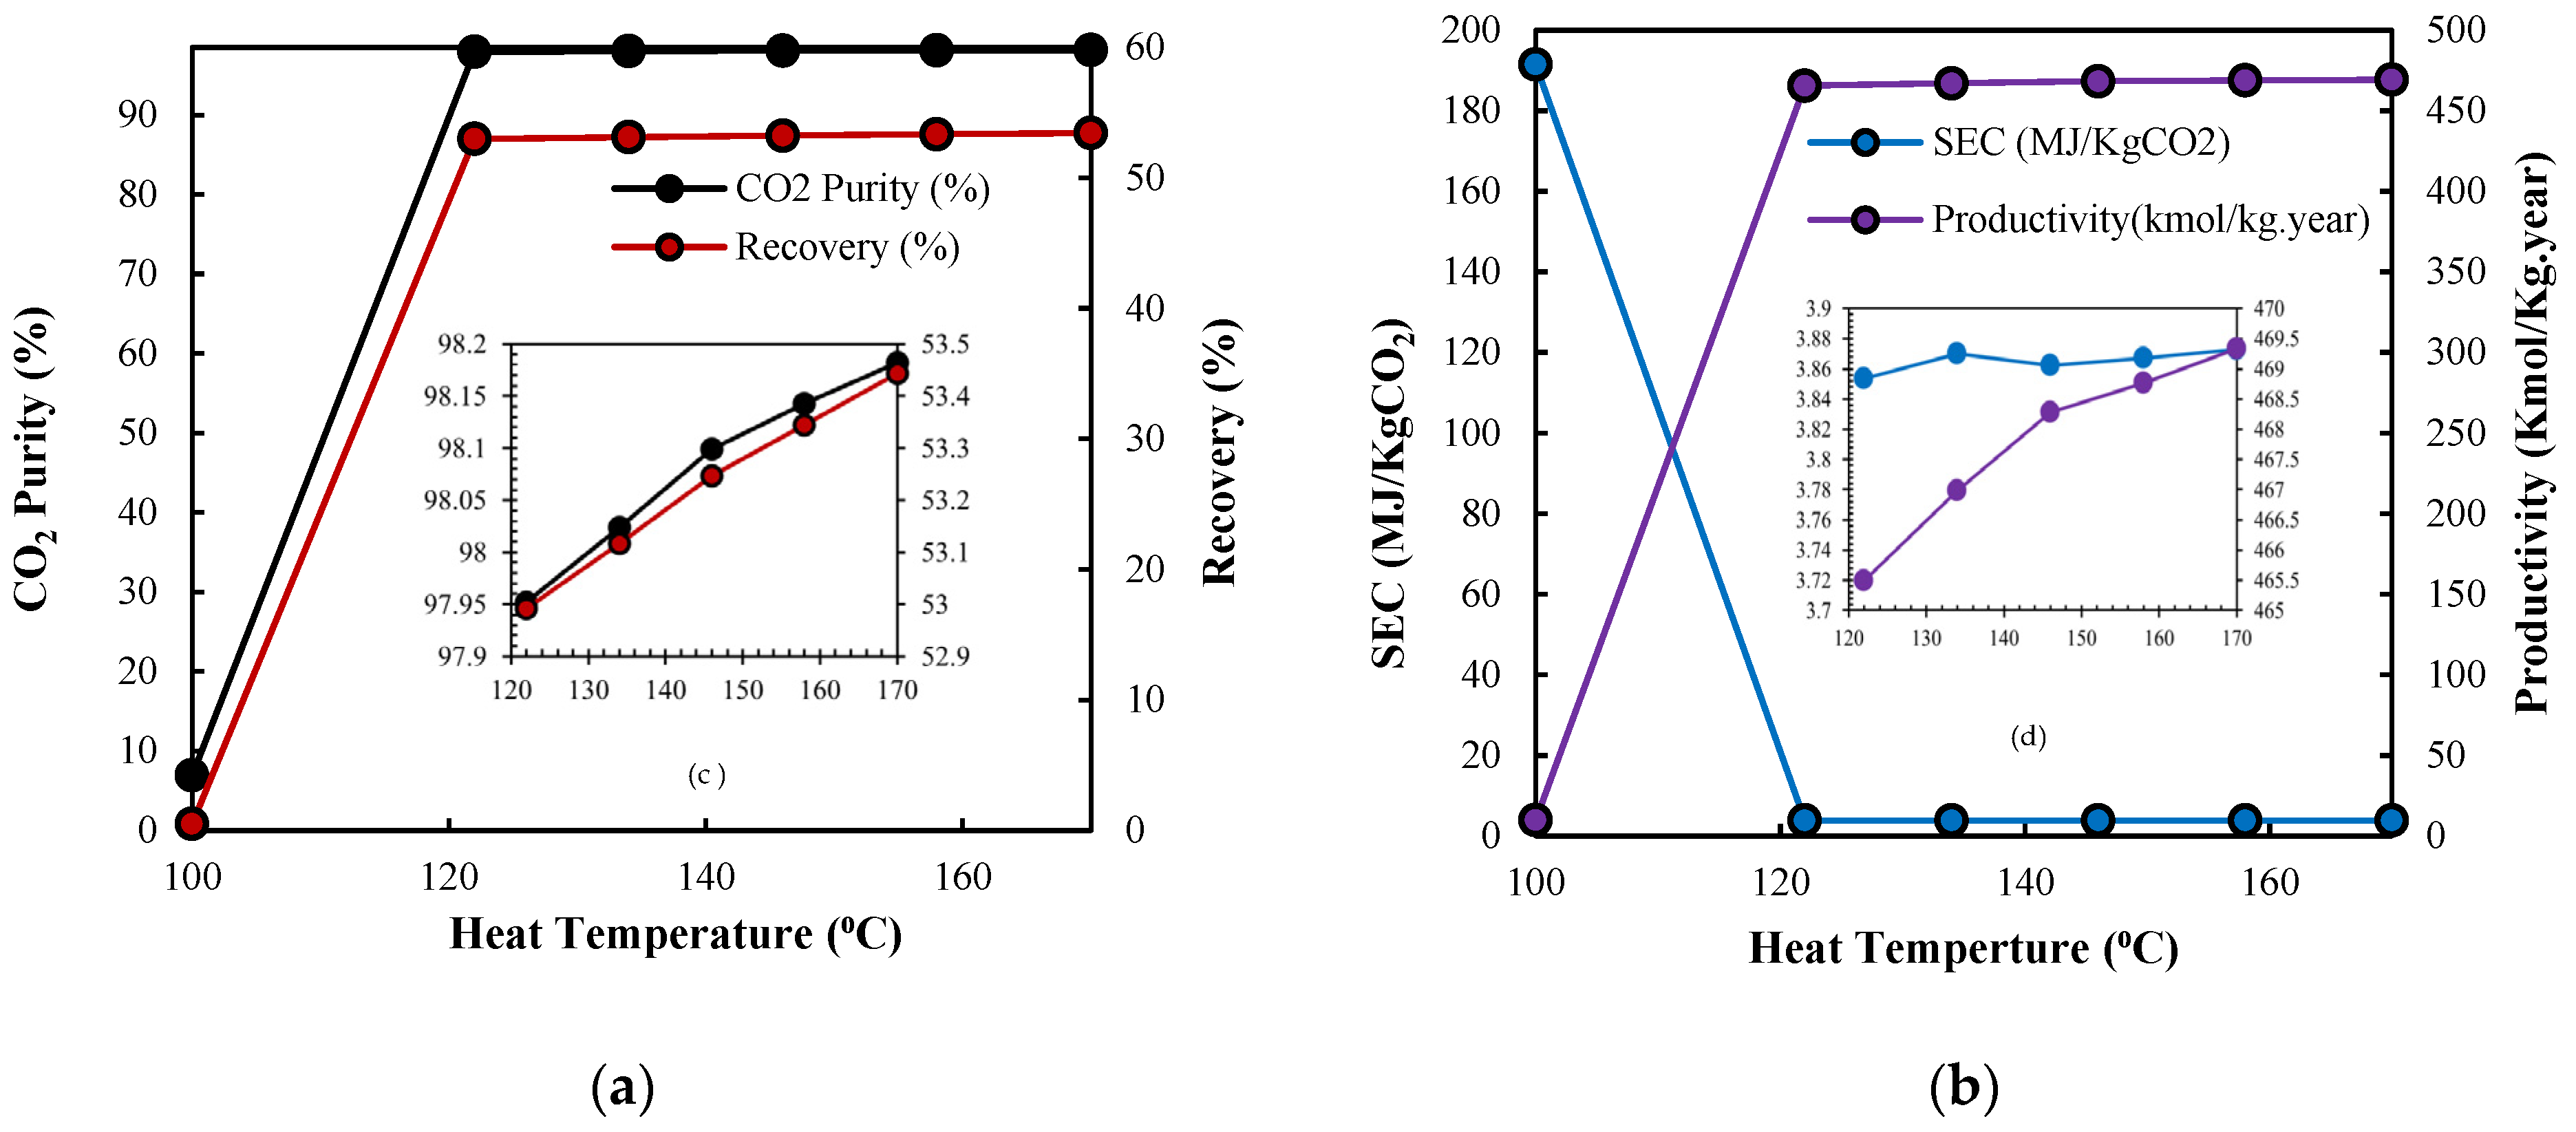
3.2.2. Desorption Temperature

In a TVSA process, regeneration of the adsorbent is achieved by applying both elevated temperature and reduced pressure, which together enhance the thermodynamic driving force for CO2 desorption [57,73,74]. Therefore, the selection and optimisation of desorption temperature and vacuum pressure are closely interdependent.
Figure 7a,b present the effect of desorption temperature under a fixed vacuum pressure (Peva = 0.09 bar) on performance indexes. As shown, CO2 recovery and productivity remained negligible at temperatures around 100 °C but increased sharply once a specific threshold temperature was reached, approximately 120 °C. However, increasing the desorption temperature beyond 120 °C had minimal impact on further improving process performance, reflecting the cooperative desorption mechanism of mmen-Mg2(dobpdc) associated with its characteristic step-shaped isotherm and temperature-dependent kinetics. These frameworks exhibited long induction periods near the step temperature, with desorption only becoming significant once a critical temperature was reached [75]. Importantly, the desorption threshold temperature was influenced by the applied vacuum level. Under deeper vacuum pressure, the equilibrium partial pressure of CO2 decreased, enabling desorption at lower temperatures [76]. These findings establish a practical threshold that can guide the optimisation of regeneration strategies in DAC systems employing this sorbent.

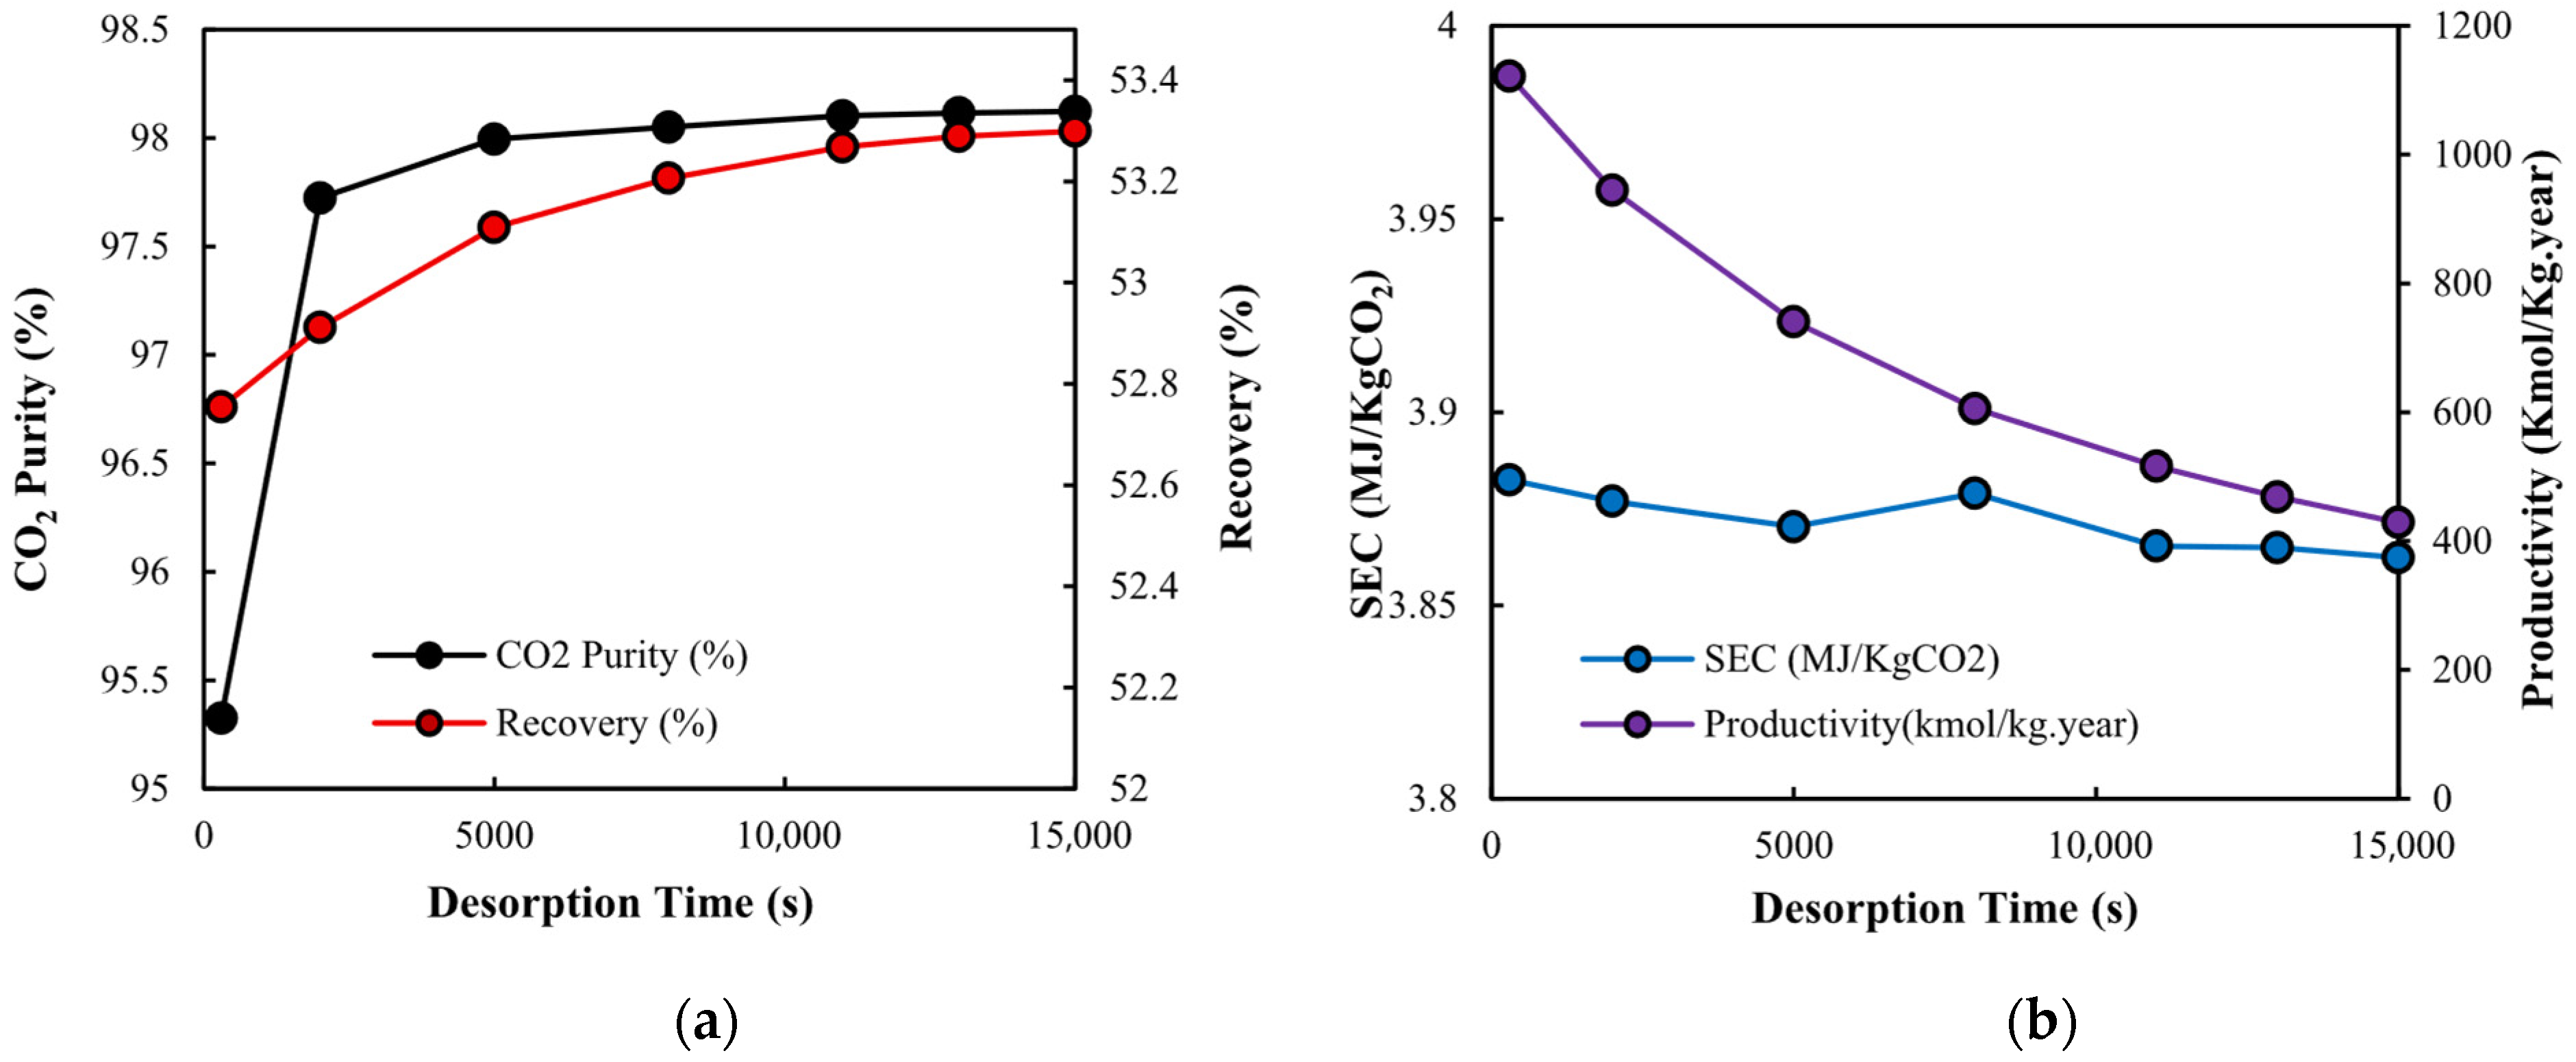
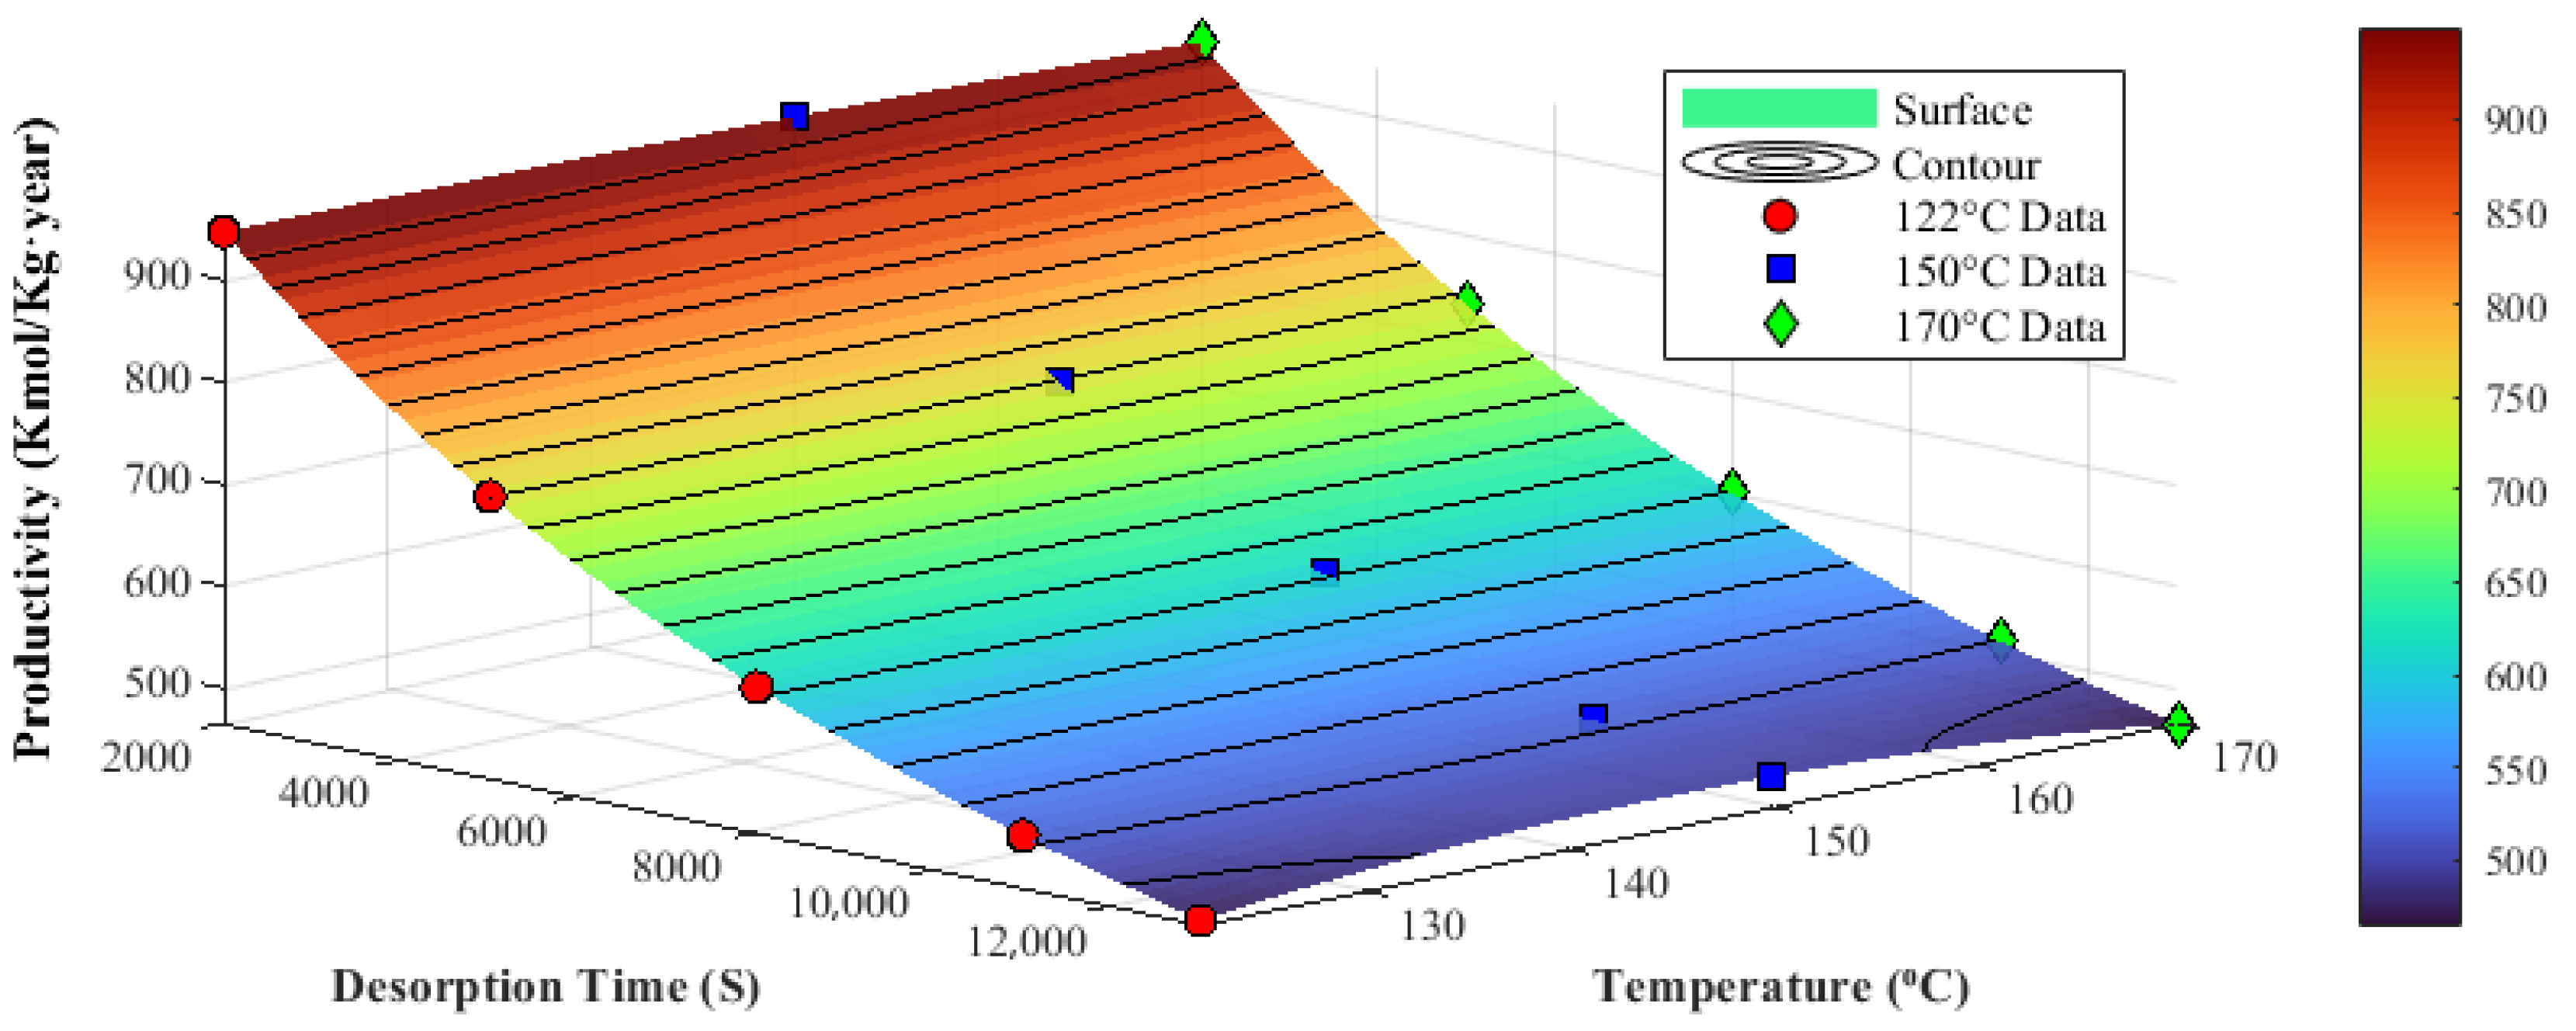
3.2.3. Desorption Time

Figure 8a,b illustrate the variation in productivity, CO2 purity, recovery, and specific energy consumption across different desorption durations under a constant evacuation pressure (Peva = 0.09). Extending the desorption time beyond 500 s had minimal impact on specific energy consumption (which remained nearly constant) and CO2 recovery (which stabilised around 52.8–53.2%) since the bed reached its target temperature early in the desorption stage, and both metrics subsequently stabilised. However, desorption time showed a more significant influence on CO2 purity and overall process productivity. Increasing the duration up to 2000 s improved purity, as more CO2 was removed from the bed. Beyond this point, further improvement in purity was negligible (<0.2%), indicating that the sorbent’s desorption capacity was nearly exhausted at 120 °C. Meanwhile, longer desorption times reduced the number of process cycles that could be completed annually, thereby decreasing overall productivity. Previous studies have demonstrated that an optimal desorption duration exists that maximises CO2 yield with minimal energy input [73]. Similarly, findings from multi-objective optimisations of TVSA cycles using amine-functionalised solid sorbents showed that prolonged desorption offers diminishing returns in terms of purity and recovery, while significantly reducing productivity due to extended cycle times [77]. Moreover, Figure 9 shows the variation in productivity with desorption temperatures between 120 and 170 °C across desorption durations ranging from 2000 to 12000 s. The curve indicates that the desorption temperature exceeded the identified threshold (~120 °C), making the desorption duration increasingly influential. In this regime, rather than further increasing the temperature, reducing the desorption time becomes a more effective strategy for improving annual productivity without compromising separation performance.

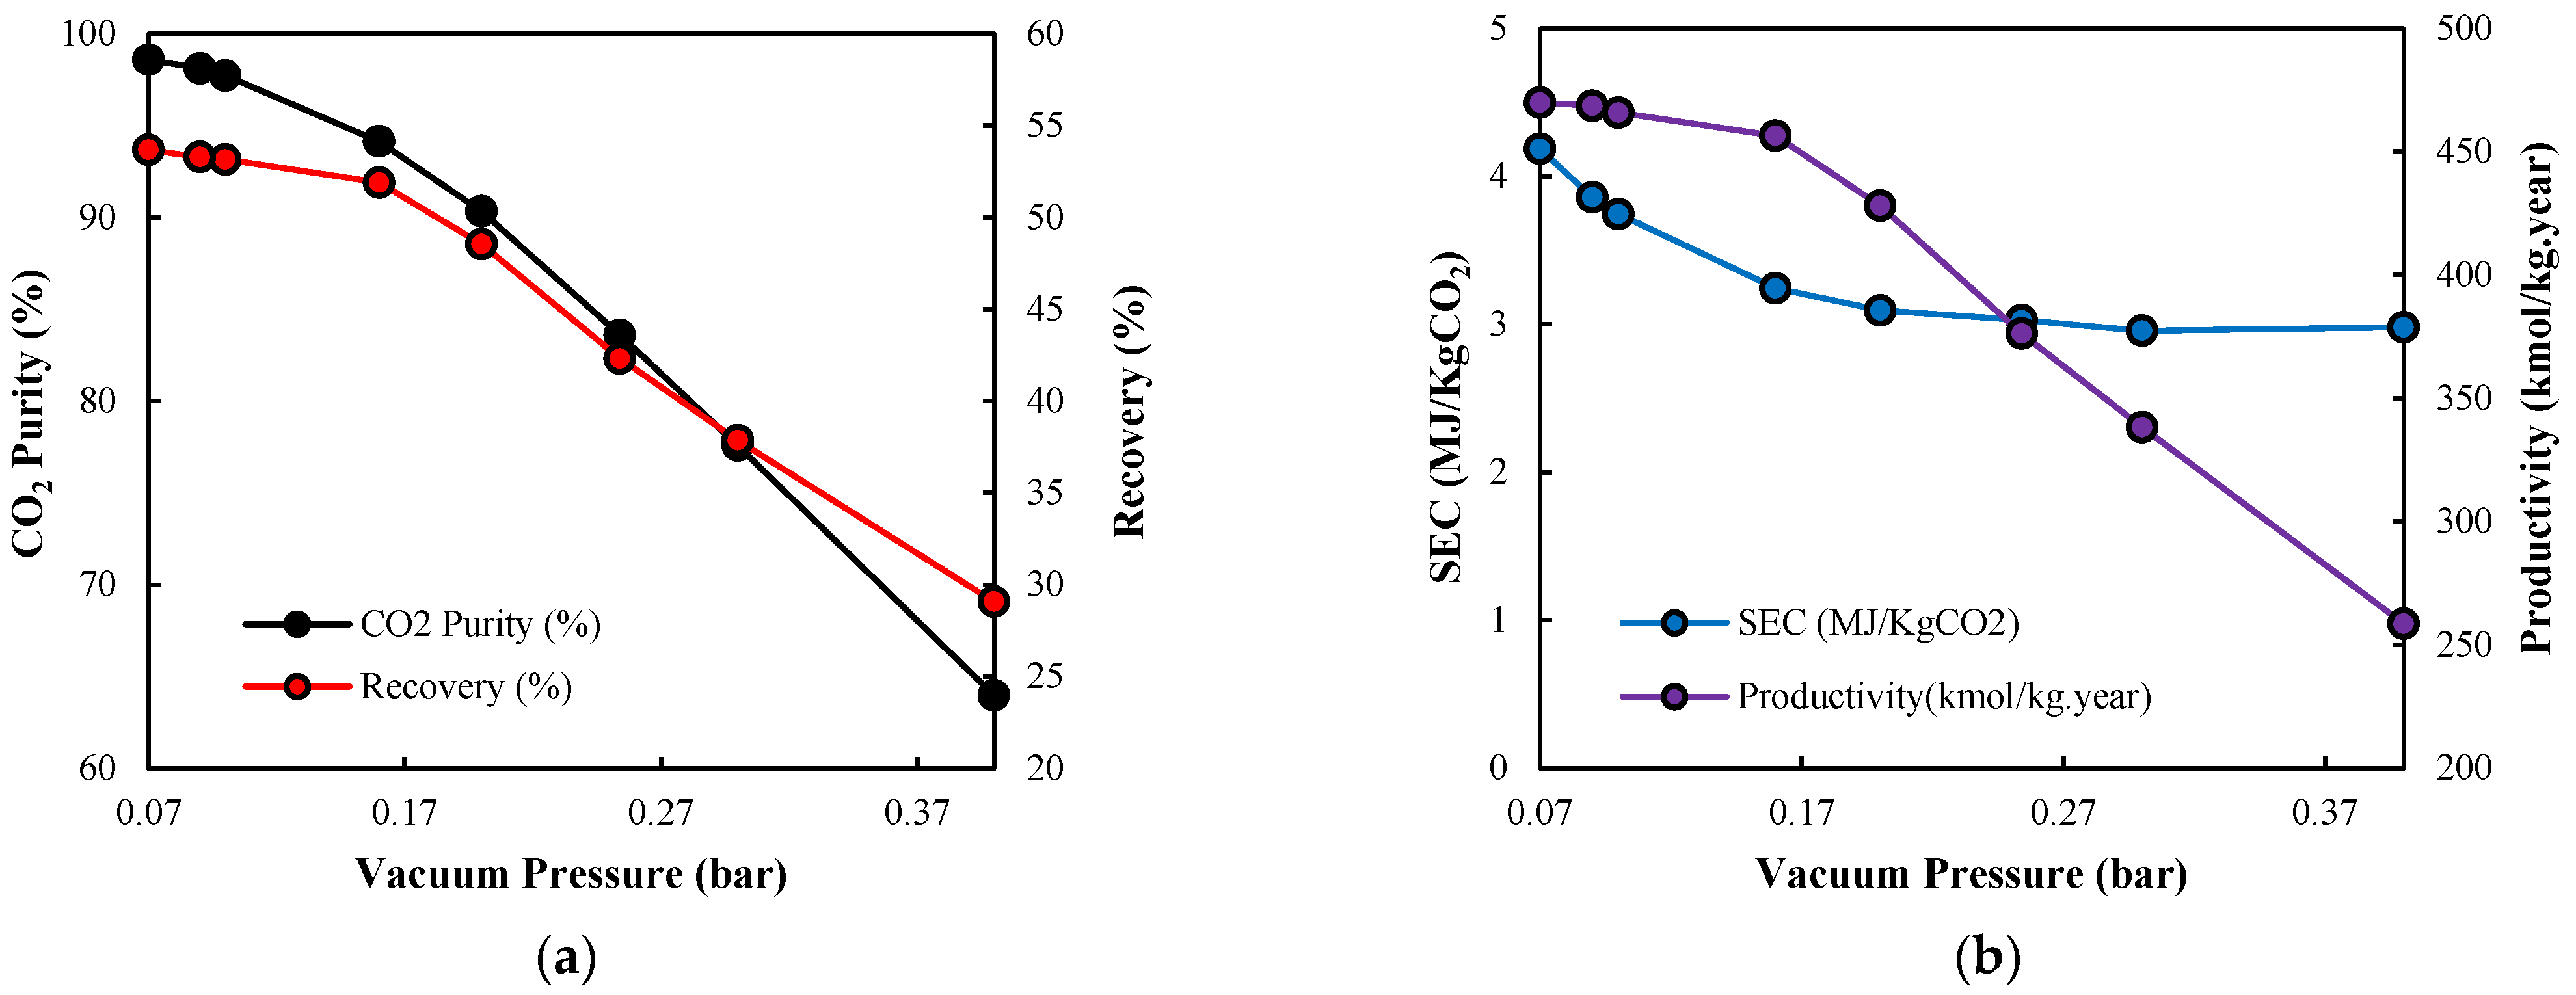
3.2.4. Evacuation Pressure

One of the important objectives of DAC processes is to achieve high CO2 purity, ensuring that the captured product meets the quality requirements for downstream applications. This necessitates the effective removal of residual air from the adsorption bed before initiating the desorption step. Moreover, this step also helps prevent oxygen-induced degradation of amine-functionalised sorbents during subsequent heating [78].
Figure 10a,b compare CO2 purity, productivity, specific energy consumption, and recovery for different evacuation pressures, ranging from 0.07 to 0.4 bar. As shown in the figure, there was a gradual reduction in purity, recovery, and productivity with increasing vacuum pressure up to 0.15 bar, followed by a more pronounced drop beyond this point. Additionally, a slight trade-off existed between specific energy consumption and CO2 purity, recovery, and productivity. While operating at higher vacuum pressures reduced the energy demand of the vacuum pump—thereby reducing specific energy consumption—this benefit became less significant beyond 0.15 bar, as the weakened desorption driving force led to a decline in CO2 recovery. The findings indicate that lower evacuation pressures significantly enhanced CO2 recovery, purity, and productivity by enabling more complete regeneration of the sorbent. This improvement was attributed to the stronger thermodynamic driving force for desorption at lower pressures, which facilitated more efficient CO2 release from the adsorbent [73]. By increasing the pressure differential between the adsorbed CO2 and the surrounding gas phase, lower evacuation pressures enhanced the effectiveness of sorbent regeneration. However, the energy savings achieved at higher vacuum pressures were offset by corresponding reductions in recovery and productivity.

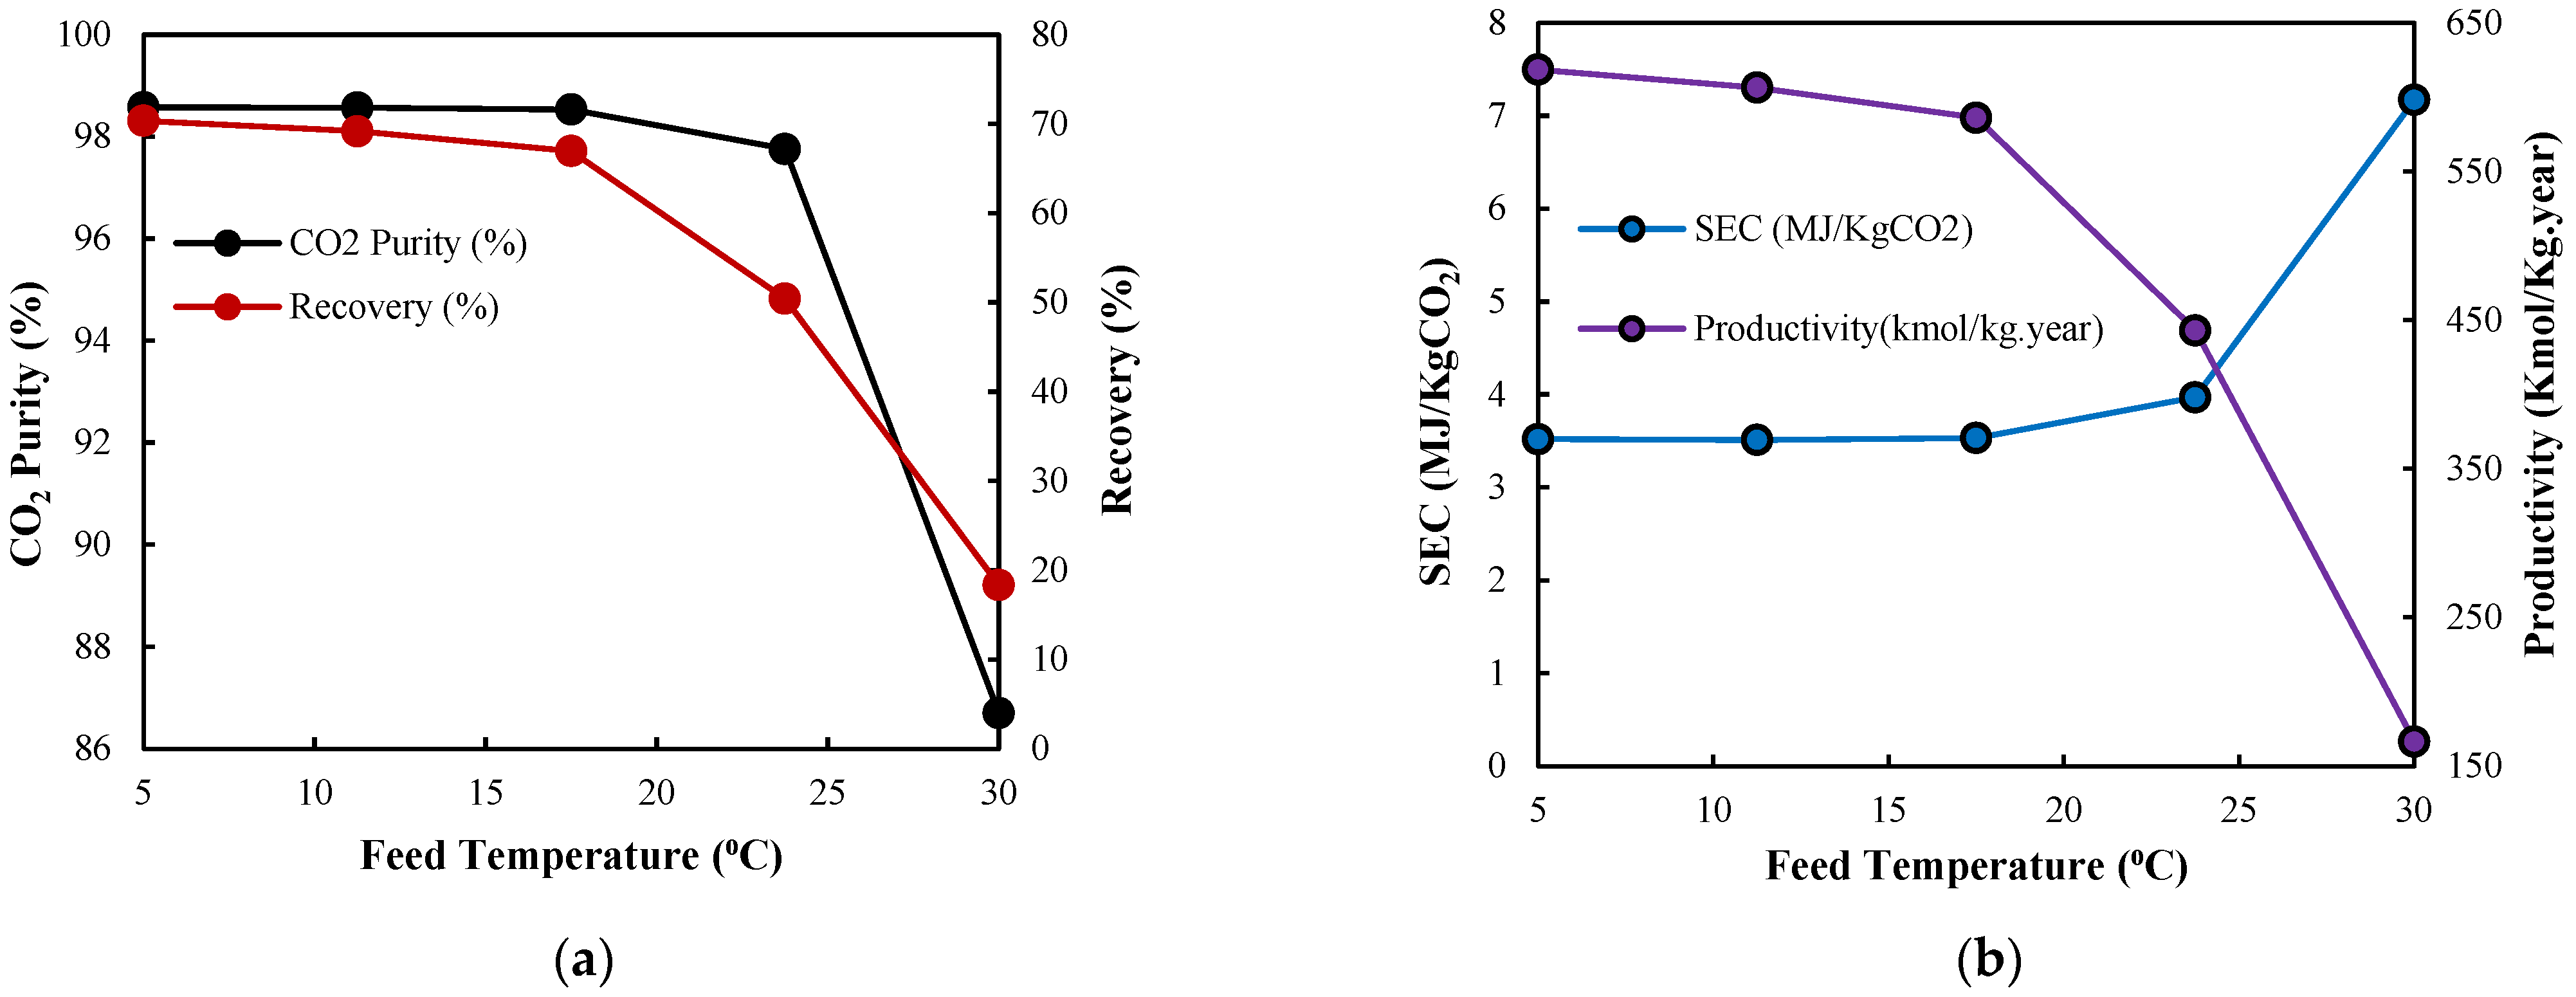
3.2.5. Inlet Feed Temperature

The effect of feed temperature on CO2 purity, recovery, productivity, and specific energy consumption was investigated to consider different ranges of environmental temperatures. According to the simulation results in Figure 11a,b, CO2 purity, recovery, and productivity remained relatively stable at feed temperatures below 20 °C. As the temperature increased beyond this point, all three performance indicators exhibited a consistent downward trend. This suggests that lower ambient (feed) temperatures were more favourable for achieving optimal DAC process performance using mmen-Mg2(dobpdc), particularly in maintaining high product purity and maximising sorbent utilisation.
This behaviour can be attributed to the thermodynamics of the sorbent’s cooperative adsorption mechanism, in which CO2 is captured through insertion into metal–amine bonds, forming extended chains of ammonium carbamate along the one-dimensional channels [49,79]. This process is exothermic and highly temperature sensitive [49]. As a result, at elevated temperatures, the formation of ammonium carbamate chains becomes thermodynamically less favourable, with reduced CO2 uptake and diluted product streams. This trend was also observed by Martell et al. [75], who reported more favourable adsorption kinetics and thermodynamics at lower temperatures due to cooperative chemisorption mechanisms in diamine-appended Mg2(dobpdc) frameworks.
Higher feed temperatures also led to increased specific energy consumption. This was primarily due to the reduced amount of CO2 captured, which outweighed the benefit of lower heating energy input required to reach the target desorption (Figure 11b).

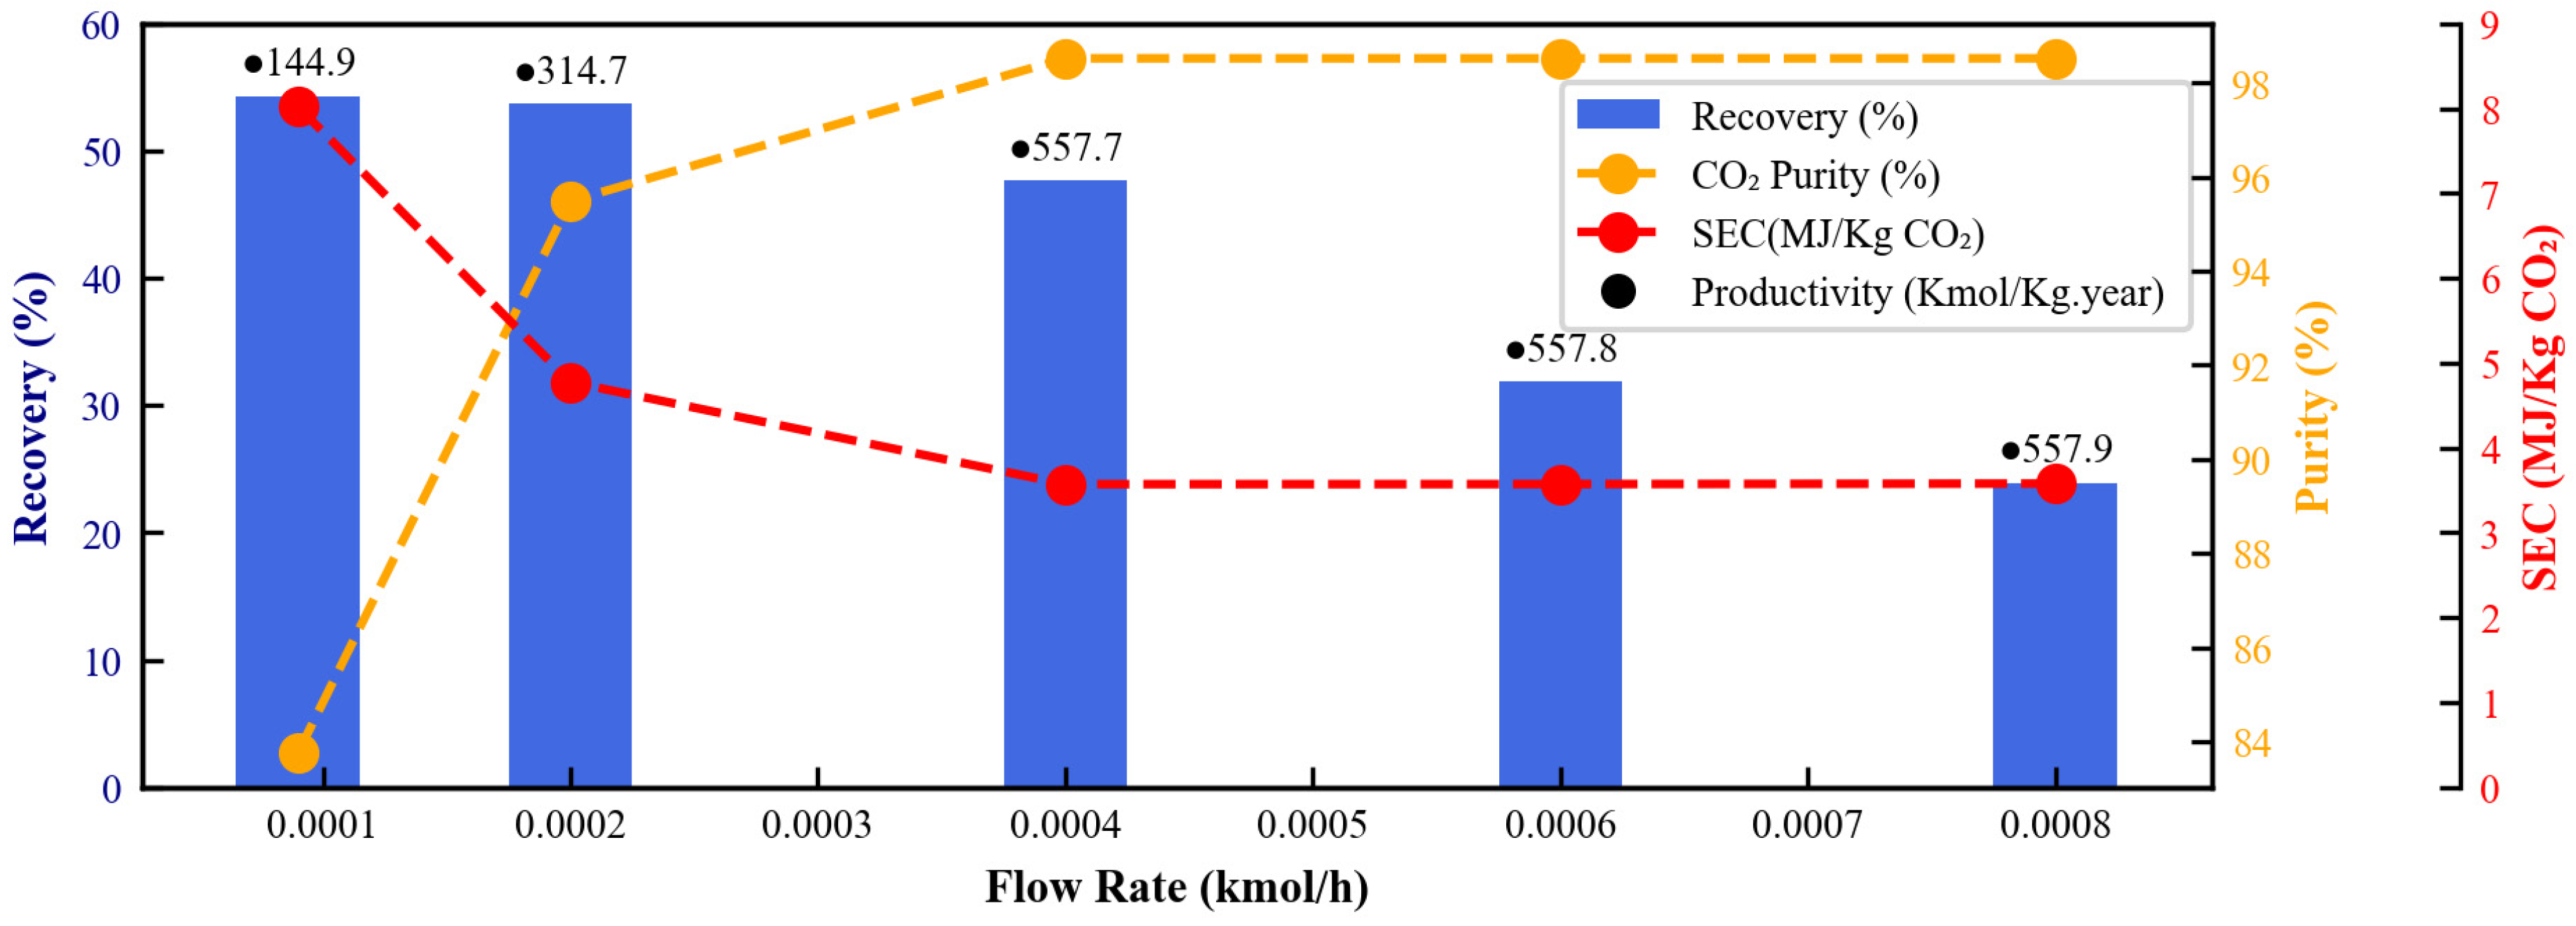
3.2.6. Inlet Feed Flow Rate

The sensitivity analysis on feed flow rate, conducted under constant feed temperature (23 °C) and evacuation pressure (0.09 bar), revealed that increasing the inlet air flow rate beyond 0.0004 Kmol/h had a minimal influence on CO2 purity, productivity, and specific energy consumption. However, a significant decline in CO2 recovery was observed (column plot in Figure 12). This reduction was attributed to the insufficient gas residence time within the adsorption bed, which restricted CO2 diffusion and hindered effective adsorption onto the sorbent surface. Consequently, a significant fraction of CO2 bypassed the bed without being captured. Conversely, at lower flow rates, extended gas–solid contact time enabled the sorbent to approach full saturation, thereby improving CO2 recovery. The stability of CO2 purity, specific energy consumption, and productivity at higher flow rates can be explained by the dynamic balance between adsorption kinetics and process throughput. Although increasing the flow rate reduced the contact time, the high velocity also increased the mass transfer driving force, allowing CO2 to be quickly adsorbed.

3.3. Optimal Design Discussion

To complement the individual parameter investigations, a normalised sensitivity analysis was conducted to compare the relative impact of each process parameter on four key performance indicators: SEC, CO2 purity, recovery, and productivity. The study considered the following parameter ranges: adsorption time (5000–10,000 s), desorption time (300–15,000 s), feed temperature (5–30 °C), feed flow rate (0.0001–0.0008 Kmol/h), and vacuum pressure (0.07–0.4 bar). According to Figure 13, feed temperature consistently demonstrated a strong influence across all metrics, significantly affecting SEC, recovery, and productivity. Its role in controlling the thermal and mass transport within the bed made it particularly impactful. Vacuum pressure also strongly influenced recovery and purity, as it governed the thermodynamic driving force for CO2 desorption. Desorption time significantly affected productivity by limiting the number of annual operational cycles, while also influencing CO2 purity through its impact on bed regeneration. By contrast, adsorption time showed minimal influence across all indicators in the sensitivity analysis, indicating that once sufficient bed saturation was achieved, further increases in adsorption time had a negligible effect on system performance. Finally, heating temperature appeared to have a minimal impact in this analysis, which aligns with prior findings in Section 3.2.2, where it was demonstrated that heating temperatures above 120 °C did not substantially improve performance due to the system reaching equilibrium; hence, the effect of further increases within the 120–170 °C range was limited.
Translating the insights from the sensitivity analysis into process improvements, the base case performance was compared with optimised condition performance. Table 6 succinctly summarises the resulting performance indicators for both the baseline and optimised scenarios. The optimised configuration demonstrated substantial enhancement over the base case. Specifically, it achieved a significant improvement in CO2 recovery (from 53.26 to 75%) and productivity (from 474.85 to 1373 Kmol/Kg·year). Crucially, these gains were realised while maintaining a consistently high CO2 purity of 98% and notably reducing the specific energy consumption from 3.85 to 3.64 MJ/Kg CO2. These improvements were primarily attributable to strategic adjustments in operating conditions, including a reduction in vacuum pressure to 0.08 bar, a decrease in desorption time to 1000 s, an extension of adsorption time to 8200 s, and lowering the feed temperature to below 7 °C. These adjustments align directly with the sensitivities identified for each parameter and collectively support the development of more energy-efficient and sustainable DAC systems.
To further contextualise the performance of our developed system, Table 6 also incorporates a comparison with three established benchmark sorbents reported in the DAC literature. One of these was Lewatit VP OC 1065, evaluated under a packed-bed TVSA process, which closely aligns with our system’s bed configuration and process type. The other two sorbents were mmen-Mg2(dobpdc) and MIL-101(cr)-PEI-800, employing novel coated monolith adsorption beds. Additionally, the table presents performance data from the Climeworks commercial DAC process to provide a broader industrial benchmark.
This analysis focused on purity, recovery, and specific energy consumption, providing a comprehensive assessment of the system’s operational efficiency and effectiveness. Our optimised system highlighted competitive capabilities, particularly in achieving lower specific energy consumption alongside enhanced purity and recovery rates. These improvements indicate the potential for reduced operational costs and increased process sustainability. The calculated energy requirement in our benchmark case was approximately 59% lower than the reported value for the Climeworks system. This deviation was anticipated, as our model represents a highly idealised and optimised scenario. For example, Climeworks adsorption bed configuration [80] likely limits full bed saturation due to practical design constraints, whereas our simulation assumes optimal sorbent utilisation. Several additional factors contribute to this difference:
  • The current model assumes negligible pressure drop, thereby excluding blower energy consumption.
  • Real-world vacuum equipment typically operates at lower efficiencies than assumed in ideal models.
  • The Climeworks contactor design includes additional flow resistance due to the parallel flow path through structured adsorbent sheets, whereas the current model assumes axial flow through a thin sorbent layer, reducing resistance and energy loss.
  • The current study does not consider the presence of water in the feed and associated energy required for water–CO2 separation. These factors would likely increase the energy demand in real-word systems.
Among the benchmark sorbents considered, the Lewatit VP OC 1065, evaluated by Deschamps et al. [81], stood out for its relatively high energy consumption despite operating under idealised process conditions. This can be attributed, in part, to the inclusion of moisture and its interactions with CO2, a level of complexity not considered in the current study. Additionally, the sorbent demonstrated the ability to achieve high CO2 purity without the need for deep vacuum conditions.
Furthermore, the study by Sinha et al. [53] investigated mmen-Mg2(dobpdc) and MIL-101(cr)-PEI-800 under experimental conditions using a monolithic adsorption configuration. The predicted energy consumption for mmen-Mg2(dobpdc) in their study was slightly lower than that reported in the present study. This variation can be attributed to differences in bed configuration and the higher CO2 purity achieved in our system, which was facilitated by operating at deeper vacuum levels. Although such conditions increase energy demand, they also enhance separation performance. In contrast, the use of MIL-101(cr)-PEI-800 in monolithic configurations resulted in substantially higher energy consumption and lower CO2 recovery, indicating that this sorbent may be a less promising candidate for DAC applications compared to mmen-Mg2(dobpdc) under the applied condition.
Table 6. Performance comparison of the optimised mmen-Mg2(dobpdc) packed-bed TVSA system with established benchmark sorbents for DAC.
Performance IndicatorsProcessPurityRecoverySpecific Energy ConsumptionProductivityReference
Unit %%MJ/KgKmol/Kg·year
Base casePacked bed, TVSA98.1353.263.85474.85This work
Designed casePacked bed, TVSA98.05753.641373This work
Climeworks amine-based sorbentTVSA99.985.46.12–8.181344[82,83]
Lewatit VP OC 1065Packed bed, TVSA99775.421090[81]
Mmen-Mg2(dobpdc)Coated monolith Steam assistance, TVSA95603.52-[53]
MIL-101(cr)-PEI-800Coated monolith Steam assistance, TVSA95505.34-[53]

4. Conclusions and Prospect

This study evaluated the performance of mmen-Mg2(dobpdc) under realistic DAC process conditions using a dynamic simulation framework. This metal-organic framework, known for its distinctive step-shaped isotherm, was evaluated within a TVSA process in Aspen Adsorption. After validating the simulation model against experimental breakthrough data and confirming its reliability, a sensitivity analysis was conducted to identify the most influential process parameter (vacuum pressure, adsorption and desorption times, feed temperature, feed flow rate, and heat exchanger temperature) on CO2 purity, recovery, productivity, and specific energy consumption. Beyond demonstrating high CO2 purity and recovery, the analysis highlighted the complex and interdependent relationships between process variables and their implications for system performance and design.
A key insight from this work was the trade-off between CO2 recovery and productivity. While lower feed temperatures and extended adsorption time enhanced recovery by increasing sorbent loading and saturation levels, they concurrently reduced the frequency of adsorption–desorption cycles, thus lowering productivity. Another significant finding was the dual role of vacuum pressure: deeper vacuums improved desorption efficiency and boosted both CO2 purity and recovery. However, this came at the expense of increased SEC, particularly from mechanical work. The interplay between feed temperature and vacuum pressure was particularly noteworthy—lower feed temperatures shifted the isotherm’s step pressure downward, enabling effective desorption at milder vacuum conditions, and thus offering potential energy saving if properly tuned. This study also revealed a threshold effect for desorption temperature, beyond which further heating yielded marginal benefit. At a deeper vacuum level, effective regeneration can occur at lower temperatures, provided sufficient desorption time is allowed. This introduces a critical design trade-off where longer desorption times reduce thermal energy demand (lowering SEC), but again, may compromise overall productivity.
Although the current study was conducted at an experimental scale and did not explicitly account for humidity fluctuations or long-term material stability, the demonstrated performance underscores the potential of this sorbent for DAC applications. These results provide a robust foundation for sustainable DAC process development, offering guidance for future research aimed at optimising the process and improving system scalability. Future investigation is needed into the sorbent degradation mechanism under cyclic operation, as well as the scalability of the adsorption bed design for industrial-scale development. Further work will also prioritise a comprehensive evaluation of competitive adsorption between H2O and CO2 under realistic atmospheric conditions. Furthermore, the insights gained from this study revealed the interconnected dynamics among process variables, highlighting the limitations of isolated parameter tuning and emphasising the need for system-level optimisation. The complexity of balancing CO2 purity, recovery, SEC, and productivity justifies the application of advanced multi-objective optimisation techniques to define operating strategies that achieve optimal performance across these key indicators and support the development of sustainable carbon removal technologies.

Author Contributions

Conceptualization, M.N.G. and H.R.N.; Methodology, M.N.G., H.R.N. and S.M.; Software, M.N.G.; Validation, M.N.G.; Formal analysis, M.N.G., H.R.N. and S.M.; Investigation, M.N.G., H.R.N. and L.K.; Resources, M.N.G. and L.K.; Writing—original draft, M.N.G.; Writing—review & editing, M.N.G., H.R.N., L.K., S.M. and K.S.W.; Supervision, H.R.N., L.K., S.M. and K.S.W.; Project administration, H.R.N.; Funding acquisition, H.R.N. All authors have read and agreed to the published version of the manuscript.

Funding

This research received no external funding.

Institutional Review Board Statement

Not applicable.

Informed Consent Statement

Not applicable.

Data Availability Statement

The original contributions presented in this study are included in the article. Further inquiries can be directed to the corresponding authors.

Conflicts of Interest

The authors declare no conflict of interest.

Abbreviations

NomenclatureKfkFilm resistance coefficient (m/s)
RpParticle radius (m)KpkMacropore diffusion coefficient (m2/s)
RbBed radius (m)KkOverall mass transfer coefficient (1/s)
aPExternal surface area per unit volume of the particle (1/m)DkkKnudsen diffusion coefficient (m2/s)
qFeed flow rate (Kmol/h)VgSuperficial gas velocity (m/s)
ΔHCO2CO2 heat of adsorption (KJ/mol)PfeedFeed pressure (bar)
ΔHN2N2 heat of adsorption (KJ/mol)FproductProduct flow rate (Kmol/h)
CpsCrystal heat capacity (KJ/Kmol·K)FfeedFeed flow rate (Kmol/h)
KThermal conductivity(W/m K)kAAvrami rate constant (1/s)
HTCHeat transfer coefficient (W/m2·K)nAAvrami fractional constant
aHxHeat exchanger surface area per unit volume (1/m)T cycleFull cycle time (s)
QHxHeat supplied or removed by the heat exchanger (W/m3)WadsorbentAdsorbent mass (Kg)
ΔHIsosteric heat of adsorption (KJ/mol)PvacVacuum pressure (bar)
CpHeat capacity at constant pressure (KJ/mol·K)yGas mole fraction
CvHeat capacity at constant volume (KJ/mol·K)AARDAverage absolute relative deviation
CpsSpecific solid phase heat capacity (MJ/Kmol·K)RMSERoot mean squared error
CvgSpecific gas phase heat capacity (MJ/kmol·K),Greek letters
P stepIsotherm step pressure (bar) ρ g Gas density (Kg/m3)
q 1 * CO2 uptake before Pstep (mol/Kg) ρ s Solid (crystal) density (Kg/m3)
q 2 * CO2 uptake after Pstep (mol/Kg)γIsotherm parameters (sharpness of the transition)
qLLow-affinity adsorption capacity (mol/Kg)λIsotherm parameter controlling the effect of temperature (1/K)
qHHigh-affinity adsorption capacity (mol/Kg)µFluid viscosity (N.s/m2)
qUUltimate affinity adsorption capacity(mol/Kg)εpIntraparticle void fraction (m3 void/m3particle)
nSurface homogeneity factorεbBed porosity (m3void/m3bed)
RGas constant (J/mol. K)εtTotal bed porosity (m3void + m3pore)/m3bed
bLangmuir constant (isotherm parameters) (1/bar)γSpecific heat ratio
WSolid loading (Kmol/Kg)ηPump efficiency
W*Equilibrium solid loading (Kmol/Kg)ωIsotherm parameter (smooth transition function)
ShkSherwood numberAbbreviations
ReReynolds numberDACDirect air capture
SckSchmidt numberMOFMetal-organic framework
MTCMass transfer coefficient (1/s)CCUSCarbon capture, utilisation, and storage
LDFLinear driving forceTVSATemperature–vacuum swing adsorption

References

  1. Nasriani, H.R.; Jamiolahmady, M. Maximizing fracture productivity in unconventional fields; analysis of post hydraulic fracturing flowback cleanup. J. Nat. Gas Sci. Eng. 2018, 52, 529–548. [Google Scholar] [CrossRef]
  2. Nasriani, H.R.; Kalantariasl, A. Choke Performance in High-rate Gas Condensate Wells Under Subcritical Flow Condition. Energy Sources Part A Recovery Util. Environ. Eff. 2014, 37, 192–199. [Google Scholar] [CrossRef]
  3. Nasriani, H.R.; Jamiolahmady, M.; Saif, T.; Sánchez, J. A systematic investigation into the flowback cleanup of hydraulic-fractured wells in unconventional gas plays. Int. J. Coal Geol. 2018, 193, 46–60. [Google Scholar] [CrossRef]
  4. Nasriani, H.R.; Jamiolahmady, M. A Comparison of Clean-Up Efficiency of Multiple Fractured Horizontal Wells and Hydraulically Fractured Vertical Wells in Tight Gas Reservoirs. In Proceedings of the SPE Europec Featured at 80th EAGE Conference and Exhibition, Society of Petroleum Engineers, Copenhagen, Denmark, 11 June 2018. [Google Scholar] [CrossRef]
  5. Nasriani, H.R.; Jamiolahmady, M. Optimising Flowback Strategies in Unconventional Reservoirs: The Critical Role of Capillary Forces and Fluid Dynamics. Energies 2024, 17, 5822. [Google Scholar] [CrossRef]
  6. Medaiyese, F.J.; Nasriani, H.R.; Khan, K.; Khajenoori, L. Sustainable Hydrogen Production from Plastic Waste: Optimizing Pyrolysis for a Circular Economy. Hydrogen 2025, 6, 15. [Google Scholar] [CrossRef]
  7. Medaiyese, F.J.; Nasriani, H.R.; Khajenoori, L.; Khan, K.; Badiei, A. From Waste to Energy: Enhancing Fuel and Hydrogen Production through Pyrolysis and In-Line Reforming of Plastic Wastes. Sustainability 2024, 16, 4973. [Google Scholar] [CrossRef]
  8. Joonaki, E.; Rostaminikoo, E.; Ghanaatian, S.; Nasriani, H.R. Thermodynamic properties of hydrogen containing systems and calculation of gas critical flow factor. Meas. Sens. 2025, 38, 101587. [Google Scholar] [CrossRef]
  9. Gholami, S.; Rostaminikoo, E.; Khajenoori, L.; Nasriani, H.R. Density determination of CO2-Rich fluids within CCUS processes. Meas. Sens. 2025, 38, 101739. [Google Scholar] [CrossRef]
  10. Rostaminikoo, E.; Ghanaatian, S.; Joonaki, E.; Nasriani, H.R.; Whitton, J. Advanced thermodynamics of hydrogen and natural gas blends for gas transmission and distribution networks. Meas. Sens. 2025, 38, 101765. [Google Scholar] [CrossRef]
  11. Joonaki, E.; Rostaminikoo, E.; Ghanaatian, S.; Nasriani, H. Thermodynamics of Hydrogen; Analysing and Refining of Critical Flow Factor Through Comprehensive Uncertainty Assessment and Experimental Data Integration. In Proceedings of the ADIPEC, Abu Dhabi, United Arab Emirates, 4–7 November 2024. [Google Scholar] [CrossRef]
  12. IEA. Clean Energy Market MonitorParis, Mar. 2024. Available online: https://www.iea.org/reports/clean-energy-market-monitor-march-2024 (accessed on 1 March 2024).
  13. Stein, T. No Sign of Greenhouse Gases Increases Slowing in 2023. Available online: https://research.noaa.gov/no-sign-of-greenhouse-gases-increases-slowing-in-2023/ (accessed on 5 April 2024).
  14. Ozkan, M.; Custelcean, R. The status and prospects of materials for carbon capture technologies. MRS Bull. 2022, 47, 390–394. [Google Scholar] [CrossRef]
  15. UNFCCC. Key aspects of the Paris Agreement. In Proceedings of the COP21/CMP11, UNFCCC, Paris, Franch, 12 December 2015. Available online: https://unfccc.int/ (accessed on 1 December 2015).
  16. Lackner, K.; Ziock, A.H.-J.; Grimes, P.; Associates, G. Carbon Dioxide Extraction From Air: Is It An Option? In Proceedings of the Los A: 24th Annual Technical Conference on Coal Utilization and Fuel Systems. Clearwater, FL, USA, 1 February 1999; Available online: https://www.osti.gov/biblio/770509 (accessed on 1 February 1999).
  17. Custelcean, R. Direct Air Capture of CO2 Using Solvents. Annu. Rev. Chem. Biomol. Eng. 2025, 13, 217–234. [Google Scholar] [CrossRef] [PubMed]
  18. Zeman, F. Energy and material balance of CO2 capture from ambient air. Environ. Sci. Technol. 2007, 41, 7558–7563. [Google Scholar] [CrossRef] [PubMed]
  19. An, K.; Farooqui, A.; McCoy, S.T. The impact of climate on solvent-based direct air capture systems. Appl. Energy 2022, 325, 119895. [Google Scholar] [CrossRef]
  20. Pidko, E.A.; Couck, S.; Remy, T.; Hensen, E.J.M.; Weckhuysen, B.M.; Denayer, J.; Gascon, J.; Kapteijn, F. Complexity behind CO2 Capture on NH2-MIL-53(Al). Langmuir 2011, 27, 3970–3976. [Google Scholar] [CrossRef] [PubMed]
  21. Gandomkar, A.; Torabi, F.; Nasriani, H.R.; Enick, R.M. Decreasing Asphaltene Precipitation and Deposition during Immiscible Gas Injection Via the Introduction of a CO2-Soluble Asphaltene Inhibitor. SPE J. 2023, 28, 2316–2328. [Google Scholar] [CrossRef]
  22. Gandomkar, A.; Nasriani, H.R.; Enick, R.M.; Torabi, F. The effect of CO2-philic thickeners on gravity drainage mechanism in gas invaded zone. Fuel 2023, 331, 125760. [Google Scholar] [CrossRef]
  23. Nasriani, H.R.; Borazjani, A.A.; Iraji, B.; MoradiDowlatAbad, M. Investigation into the effect of capillary number on productivity of a lean gas condensate reservoir. J. Pet. Sci. Eng. 2015, 135, 384–390. [Google Scholar] [CrossRef]
  24. Mehra, P.; Paul, A. Decoding Carbon-Based Materials’ Properties for High CO2 Capture and Selectivity. ACS Omega 2022, 7, 34538–34546. [Google Scholar] [CrossRef] [PubMed]
  25. Acevedo, S.; Giraldo, L.; Moreno-Piraján, J.C. Adsorption of CO2 on Activated Carbons Prepared by Chemical Activation with Cupric Nitrate. ACS Omega 2020, 5, 10423–10432. [Google Scholar] [CrossRef] [PubMed]
  26. Casas, N.; Schell, J.; Pini, R.; Mazzotti, M. Fixed bed adsorption of CO2/H2 mixtures on activated carbon: Experiments and modeling. Adsorption 2012, 18, 143–161. [Google Scholar] [CrossRef]
  27. Serafin, Ł.; Baca, M.; Biegun, M.; Mijowska, E.; Kaleńczuk, R.J.; Sreńscek-Nazzal, J.; Michalkiewicz, B. Direct conversion of biomass to nanoporous activated biocarbons for high CO2 adsorption and supercapacitor applications. Appl. Surf. Sci. 2019, 497, 143722. [Google Scholar] [CrossRef]
  28. Wang, L.; Liu, Z.; Li, P.; Wang, J.; Yu, J. CO2 capture from flue gas by two successive VPSA units using 13XAPG. Adsorption 2012, 18, 445–459. [Google Scholar] [CrossRef]
  29. Datta, S.J.; Khumnoon, C.; Lee, Z.H.; Moon, W.K.; Docao, S.; Nguyen, T.H.; Hwang, I.C.; Moon, D.; Oleynikov, P.; Terasaki, O.; et al. CO2 capture from humid flue gases and humid atmosphere using a microporous copper silicate. Science (1979) 2015, 350, 302–306. [Google Scholar]
  30. Amaraweera, S.M.; Gunathilake, C.A.; Gunawardene, O.H.; Dassanayake, R.S.; Cho, E.B.; Du, Y. Carbon Capture Using Porous Silica Materials. Nanomaterials 2023, 13, 2050. [Google Scholar] [CrossRef] [PubMed]
  31. Kundu, J.; Stilck, J.F.; Lee, J.H.; Neaton, J.B.; Prendergast, D.; Whitelam, S. Cooperative Gas Adsorption without a Phase Transition in Metal-Organic Frameworks. Phys. Rev. Lett. 2018, 121, 015701. [Google Scholar] [CrossRef] [PubMed]
  32. Zhang, C.; Sun, S.; He, S.; Wu, C. Direct air capture of CO2 by KOH-activated bamboo biochar. J. Energy Inst. 2022, 105, 399–405. [Google Scholar] [CrossRef]
  33. Ledesma, B.; Román, S.; Álvarez-Murillo, A.; Sabio, E.; González, J.F. Cyclic adsorption/thermal regeneration of activated carbons. J. Anal. Appl. Pyrolysis 2014, 106, 112–117. [Google Scholar] [CrossRef]
  34. Belmabkhout, Y.; Serna-Guerrero, R.; Sayari, A. Adsorption of CO2-containing gas mixtures over amine-bearing pore-expanded MCM-41 silica: Application for gas purification. Ind. Eng. Chem. Res. 2010, 49, 359–365. [Google Scholar] [CrossRef]
  35. Guo, J.; He, S.; Liu, X.; Xu, M.; Liang, J.; Chu, Y. Hydrophobic modification of walnut shell biomass-derived porous carbon for the adsorption of VOCs at high humidity. Chem. Eng. J. 2024, 488, 150792. [Google Scholar] [CrossRef]
  36. Rodríguez-Mosqueda, R.; Bramer, E.A.; Roestenberg, T.; Brem, G. Parametrical Study on CO2 Capture from Ambient Air Using Hydrated K2CO3 Supported on an Activated Carbon Honeycomb. Ind. Eng. Chem. Res. 2018, 57, 3628–3638. [Google Scholar] [CrossRef] [PubMed]
  37. Boer, D.G.; Langerak, J.; Pescarmona, P.P. Zeolites as Selective Adsorbents for CO2 Separation. ACS Appl. Energy Mater. 2023, 23, 2634–2656. [Google Scholar] [CrossRef]
  38. Wilson, S.M.W.; Tezel, F.H. Direct Dry Air Capture of CO2 Using VTSA with Faujasite Zeolites. Ind. Eng. Chem. Res. 2020, 59, 8783–8794. [Google Scholar] [CrossRef]
  39. Saha, D.; Bao, Z.; Jia, F.; Deng, S. Adsorption of CO2, CH4, N2O, and N2 on MOF-5, MOF-177, and zeolite 5A. Environ. Sci. Technol. 2010, 44, 1820–1826. [Google Scholar] [CrossRef] [PubMed]
  40. Farha, O.K.; Eryazici, I.; Jeong, N.C.; Hauser, B.G.; Wilmer, C.E.; Sarjeant, A.A.; Snurr, R.Q.; Nguyen, S.T.; Yazaydın, A.Ö.; Hupp, J.T. Metal-organic framework materials with ultrahigh surface areas: Is the sky the limit? J. Am. Chem. Soc. 2012, 134, 15016–15021. [Google Scholar] [CrossRef] [PubMed]
  41. Moghadam, P.Z.; Li, A.; Wiggin, S.B.; Tao, A.; Maloney, A.G.; Wood, P.A.; Ward, S.C.; Fairen-Jimenez, D. Development of a Cambridge Structural Database Subset: A Collection of Metal-Organic Frameworks for Past, Present, and Future. Am. Chem. Soc. 2017, 29, 2618–2625. [Google Scholar] [CrossRef]
  42. Lin, J.B.; Nguyen, T.T.; Vaidhyanathan, R.; Burner, J.; Taylor, J.M.; Durekova, H.; Akhtar, F.; Mah, R.K.; Ghaffari-Nik, O.; Marx, S.; et al. A scalable metal-organic framework as a durable physisorbent for carbon dioxide capture. Science 2021, 374, 1464–1469. [Google Scholar] [CrossRef] [PubMed]
  43. Xiang, S.; He, Y.; Zhang, Z.; Wu, H.; Zhou, W.; Krishna, R.; Chen, B. Microporous metal-organic framework with potential for carbon dioxide capture at ambient conditions. Nat. Commun. 2012, 3, 954. [Google Scholar] [CrossRef] [PubMed]
  44. Chen, S.; Li, W.-H.; Jiang, W.; Yang, J.; Zhu, J.; Wang, L.; Ou, H.; Zhuang, Z.; Chen, M.; Sun, X.; et al. MOF Encapsulating N-Heterocyclic Carbene-Ligated Copper Single-Atom Site Catalyst towards Efficient Methane Electrosynthesis. Angew. Chem. 2021, 61, e202114450. [Google Scholar] [CrossRef] [PubMed]
  45. Chen, S.; Zheng, X.; Zhu, P.; Li, Y.; Zhuang, Z.; Wu, H.; Zhu, J.; Xiao, C.; Chen, M.; Wang, P.; et al. Copper Atom Pairs Stabilize * OCCO Dipole Toward Highly Selective CO2 Electroreduction to C2H4. Angew. Chem. Int. Ed. 2024, 63, e202411591. [Google Scholar] [CrossRef] [PubMed]
  46. Lyu, H.; Chen, O.I.-F.; Hanikel, N.; Hossain, M.I.; Flaig, R.W.; Pei, X.; Amin, A.; Doherty, M.D.; Impastato, R.K.; Glover, T.G.; et al. Carbon Dioxide Capture Chemistry of Amino Acid Functionalized Metal-Organic Frameworks in Humid Flue Gas. J. Am. Chem. Soc. 2022, 144, 2387–2396. [Google Scholar] [CrossRef] [PubMed]
  47. Hack, J.; Maeda, N.; Meier, D.M. Review on CO2 Capture Using Amine-Functionalized Materials. Am. Chem. Soc. 2022, 7, 39520–39530. [Google Scholar] [CrossRef] [PubMed]
  48. Liu, F.; Wang, S.; Lin, G.; Chen, S. Development and characterization of amine-functionalized hyper-cross-linked resin for CO2 capture. New J. Chem. 2018, 42, 420–428. [Google Scholar] [CrossRef]
  49. McDonald, T.M.; Lee, W.R.; Mason, J.A.; Wiers, B.M.; Hong, C.S.; Long, J.R. Capture of carbon dioxide from air and flue gas in the alkylamine-appended metal-organic framework mmen-Mg 2(dobpdc). J. Am. Chem. Soc. 2012, 134, 7056–7065. [Google Scholar] [CrossRef] [PubMed]
  50. Darunte, L.A.; Terada, Y.; Murdock, C.R.; Walton, K.S.; Sholl, D.S.; Jones, C.W. Monolith-Supported Amine-Functionalized Mg2(dobpdc) Adsorbents for CO2 Capture. ACS Appl. Mater. Interfaces 2017, 9, 17042–17050. [Google Scholar] [CrossRef] [PubMed]
  51. McDonald, T.M.; Mason, J.A.; Kong, X.; Bloch, E.D.; Gygi, D.; Dani, A.; Crocellà, V.; Giordanino, F.; Odoh, S.O.; Drisdell, W.S.; et al. Cooperative insertion of CO2 in diamine-appended metal-organic frameworks. Nature 2015, 519, 303–308. [Google Scholar] [CrossRef] [PubMed]
  52. Bose, S.; Sengupta, D.; Malliakas, C.D.; Idrees, K.B.; Xie, H.; Wang, X.; Barsoum, M.L.; Barker, N.M.; Dravid, V.P.; Islamoglu, T.; et al. Suitability of a diamine functionalized metal-organic framework for direct air capture. Chem. Sci. 2023, 14, 9380–9388. [Google Scholar] [CrossRef] [PubMed]
  53. Sinha, A.; Darunte, L.A.; Jones, C.W.; Realff, M.J.; Kawajiri, Y. Systems Design and Economic Analysis of Direct Air Capture of CO2 through Temperature Vacuum Swing Adsorption Using MIL-101(Cr)-PEI-800 and mmen-Mg2(dobpdc) MOF Adsorbents. Ind. Eng. Chem. Res. 2017, 56, 750–764. [Google Scholar] [CrossRef]
  54. Joss, L.; Hefti, M.; Bjelobrk, Z.; Mazzotti, M. On the Potential of Phase-change Adsorbents for CO2 Capture by Temperature Swing Adsorption. Energy Procedia 2017, 114, 2271–2278. [Google Scholar] [CrossRef]
  55. Darunte, L.A. Application of Metal Organic Frameworks (mofs) to Capturing CO2 Directly from Air. Ph.D. Thesis, Georgia Institute of Technology, Atlanta, GA, USA, 2018. Available online: https://smartech.gatech.edu/handle/1853/60614 (accessed on 25 March 2018).
  56. Darunte, L.A.; Sen, T.; Bhawanani, C.; Walton, K.S.; Sholl, D.S.; Realff, M.J.; Jones, C.W. Moving beyond Adsorption Capacity in Design of Adsorbents for CO2 Capture from Ultradilute Feeds: Kinetics of CO2 Adsorption in Materials with Stepped Isotherms. Ind. Eng. Chem. Res. 2019, 58, 366–377. [Google Scholar] [CrossRef]
  57. Shi, W.K.; Zhang, X.J.; Liu, X.; Wei, S.; Shi, X.; Wu, C.; Jiang, L. Temperature-vacuum swing adsorption for direct air capture by using low-grade heat. J. Clean. Prod. 2023, 414, 137731. [Google Scholar] [CrossRef]
  58. Gholami, M.; Van Assche, T.R.; Denayer, J.F. Temperature vacuum swing, a combined adsorption cycle for carbon capture. Curr. Opin. Chem. Eng. 2023, 39, 100891. [Google Scholar] [CrossRef]
  59. Liu, W.; Lin, Y.C.; Ji, Y.; Yong, J.Y.; Zhang, X.J.; Jiang, L. Thermodynamic study on two adsorption working cycles for direct air capture. Appl. Therm. Eng. 2022, 214, 118920. [Google Scholar] [CrossRef]
  60. Elfving, J.; Bajamundi, C.; Kauppinen, J.; Sainio, T. Modelling of equilibrium working capacity of PSA, TSA and TVSA processes for CO2 adsorption under direct air capture conditions. J. CO2 Util. 2017, 22, 270–277. [Google Scholar] [CrossRef]
  61. Hughes, R.; Kotamreddy, G.; Ostace, A.; Bhattacharyya, D.; Siegelman, R.L.; Parker, S.T.; Didas, S.A.; Long, J.R.; Omell, B.; Matuszewski, M. Isotherm, Kinetic, Process Modeling, and Techno-Economic Analysis of a Diamine-Appended Metal-Organic Framework for CO2Capture Using Fixed Bed Contactors. Energy Fuels 2021, 35, 6040–6055. [Google Scholar] [CrossRef]
  62. Lee, J.H.; Siegelman, R.L.; Maserati, L.; Rangel, T.; Helms, B.A.; Long, J.R.; Neaton, J.B. Enhancement of CO2 binding and mechanical properties upon diamine functionalization of M2(dobpdc) metal-organic frameworks. Chem. Sci. 2018, 9, 5197–5206. [Google Scholar] [CrossRef] [PubMed]
  63. Sinha, A.; Realff, M.J. A parametric study of the techno-economics of direct CO2 air capture systems using solid adsorbents. AIChE J. 2019, 65, e16607. [Google Scholar] [CrossRef]
  64. Wilson, S.M.W. High purity CO2 from direct air capture using a single TVSA cycle with Na-X zeolites. Sep. Purif. Technol. 2022, 294, 121186. [Google Scholar] [CrossRef]
  65. Bagheri, M.; Fakhroleslam, M.; Fatemi, S. Ultra-Dilute CO2 capture in an ethane treatment plant via temperature swing adsorption: Simulation-based analysis and multi-objective optimal design. Sep. Purif. Technol. 2025, 356, 129968. [Google Scholar] [CrossRef]
  66. Mason, J.A.; McDonald, T.M.; Bae, T.H.; Bachman, J.E.; Sumida, K.; Dutton, J.J.; Kaye, S.S.; Long, J.R. Application of a High-Throughput Analyzer in Evaluating Solid Adsorbents for Post-Combustion Carbon Capture via Multicomponent Adsorption of CO2, N2, and H2O. J. Am. Chem. Soc. 2015, 137, 4787–4803. [Google Scholar] [CrossRef] [PubMed]
  67. Wu, J.; Zhu, X.; Chen, Y.; Wang, R.; Ge, T. The analysis and evaluation of direct air capture adsorbents on the material characterization level. Chem. Eng. J. 2022, 450, 137958. [Google Scholar] [CrossRef]
  68. Ozkan, M.; Akhavi, A.A.; Coley, W.C.; Shang, R.; Ma, Y. Progress in carbon dioxide capture materials for deep decarbonization. Elsevier Inc. 2022, 8, 141–173. [Google Scholar] [CrossRef]
  69. Liu, D.; Purewal, J.J.; Yang, J.; Sudik, A.; Maurer, S.; Mueller, U.; Ni, J.; Siegel, D.J. MOF-5 composites exhibiting improved thermal conductivity. Int. J. Hydrogen Energy 2012, 37, 6109–6117. [Google Scholar] [CrossRef]
  70. Siegelman, R.L.; McDonald, T.M.; Gonzalez, M.I.; Martell, J.D.; Milner, P.J.; Mason, J.A.; Berger, A.H.; Bhown, A.S.; Long, J.R. Controlling Cooperative CO2 Adsorption in Diamine-Appended Mg2(dobpdc) Metal-Organic Frameworks. J. Am. Chem. Soc. 2017, 139, 10526–10538. [Google Scholar] [CrossRef] [PubMed]
  71. Farooq, S.; Ruthven, D.M.; Basmadjian, D. An Analysis of Adiabatic Sorption of Single Solutes in Fixed Beds: Pure Thermal Wave Formation and its Practical Implications; Academic Press: New York, NY, USA, 1990; Available online: https://pubs.acs.org/sharingguidelines (accessed on 6 July 2025).
  72. Luukkonen, A.; Elfving, J.; Inkeri, E. Improving adsorption-based direct air capture performance through operating parameter optimization. Chem. Eng. J. 2023, 471, 144525. [Google Scholar] [CrossRef]
  73. Stampi-Bombelli, V.; van der Spek, M.; Mazzotti, M. Analysis of direct capture of CO 2 from ambient air via steam-assisted temperature–vacuum swing adsorption. Adsorption 2020, 26, 1183–1197. [Google Scholar] [CrossRef]
  74. Wurzbacher, J.A. Development of a Temperature-Vacuum Swing Process for Co 2 Capture from Ambient Air. Ph.D. Thesis, ETH Zurich, Zürich, Switzerland, 2015. Available online: https://www.research-collection.ethz.ch/ (accessed on 26 May 2015).
  75. Martell, J.D.; Milner, P.J.; Siegelman, R.L.; Long, J.R. Kinetics of cooperative CO2adsorption in diamine-appended variants of the metal-organic framework Mg2(dobpdc). Chem. Sci. 2020, 11, 6457–6471. [Google Scholar] [CrossRef] [PubMed]
  76. Darunte, L.A.; Oetomo, A.D.; Walton, K.S.; Sholl, D.S.; Jones, C.W. Direct Air Capture of CO2 Using Amine Functionalized MIL-101(Cr). ACS Sustain. Chem. Eng. 2016, 4, 5761–5768. [Google Scholar] [CrossRef]
  77. Balasubramaniam, B.M.; Thierry, P.T.; Lethier, S.; Pugnet, V.; Llewellyn, P.; Rajendran, A. Process-performance of solid sorbents for Direct Air Capture (DAC) of CO2 in optimized temperature-vacuum swing adsorption (TVSA) cycles. Chem. Eng. J. 2024, 485, 149568. [Google Scholar] [CrossRef]
  78. Wurzbacher, J.A.; Gebald, C.; Brunner, S.; Steinfeld, A. Heat and mass transfer of temperature–vacuum swing desorption for CO2 capture from air. Chem. Eng. J. 2016, 283, 1329–1338. [Google Scholar] [CrossRef]
  79. Mcdonald, T.M. Synthesis and Characterization of Alkylamine-Functionalized Metal-Organic Frameworks as Adsorbents for Carbon Dioxide. Ph.D. Thesis, University of Califirnia, Berkerly, CA, USA, 2015. Available online: https://escholarship.org/uc/item/8ph267b9 (accessed on 6 July 2025).
  80. Russbueldt, P.; Weitenberg, J.; Vernaleken, A.; Sartorius, T.; Schulte, J. Method and Arrangement For Spectral Broadening of Laser Pulses for Non-Linear Pulse Compression. U.S. Patent US 9,847,615, 19 December 2017. [Google Scholar]
  81. Deschamps, T.; Kanniche, M.; Grandjean, L.; Authier, O. Modeling of Vacuum Temperature Swing Adsorption for Direct Air Capture Using Aspen Adsorption. Clean. Technol. 2022, 4, 258–275. [Google Scholar] [CrossRef]
  82. Olga, F.; Christian, E.; Mahdi, B. Techno-economic assessment of CO2 direct air capture plants. J. Clean. Prod. 2019, 224, 957–980. [Google Scholar] [CrossRef]
  83. Bardow, S.; Deutz, A. Life-cycle assessment of an industrial direct air capture process based on temperature–vacuum swing adsorption. Nat. Energy 2021, 6, 203–213. [Google Scholar]
Figure 1. Process flowsheet diagram (PFD) of the TVSA process in Aspen Adsorption.
Sustainability 17 06796 g001
Figure 2. CO2 pure-component adsorption isotherms plotted over different partial pressure ranges: (a) 1 × 10 −6 to 10 bar, (b) 1 × 10 −5 to 1 × 10 −3 bar, and (c) 1 × 10 −5 to 1 × 10 −2 bar. Curves correspond to temperatures of 69 °C (red), 49 °C (purple), 25 °C (black), and model predictions at 15 °C (green), 10 °C (yellow), and 5 °C (blue). Circle markers represent experimental data.
Sustainability 17 06796 g002
Figure 3. (a) Breakthrough curve fitting at 23 °C and flow rate of 17.2 N mL/min using the dual-kinetic approach (main plot). (b) Error estimation between experimental and simulated breakthrough points for the dual-kinetic approach. (c) Breakthrough curve fitting using the LDF model (inset), with axis titles consistent with the main plot.
Sustainability 17 06796 g003
Figure 4. Breakthrough fitting at 23 °C for different flow rates. Circle points show experimental data and solid lines represent simulated results. Red, blue, and orange correspond to flow rates of 26.8, 48.6, and 100 NmL/min, respectively.
Sustainability 17 06796 g004
Figure 5. CO2 loading at the bed outlet (node 20) as a function of total simulation time (adsorption + desorption), extending until equilibrium is reached. Each curve corresponds to a different adsorption duration: 5800 s (green), 6200 s (dark blue), 6600 s (purple), 7000 s (black), 8000 s (red), 9000 s (yellow), and 10,000 s (brown).
Sustainability 17 06796 g005
Figure 6. Effect of adsorption time on process performance indicators. The column plot represents recovery (%), with numerical values above each column indicating productivity (kmol CO2/Kg·year). The two dashed lines correspond to CO2 purity (%; yellow) and specific energy consumption (MJ/Kg CO2; red).
Sustainability 17 06796 g006
Figure 7. Effect of different heating temperatures during the desorption stage on performance indicators. Panels (a,b) show temperature ranges from 100 to 170 °C, while panels (c,d) zoom in on the range of 120–170 °C, with axis titles consistent with the main figures. (a) CO2 purity (%) and recovery (%) are represented by black and red lines, respectively. (b) Productivity (Kmol CO2/Kg·year) and specific energy consumption (MJ/Kg CO2) are shown by purple and blue lines, respectively.
Sustainability 17 06796 g007
Figure 8. Effect of desorption time on performance indicators over the range of 300 to 1500 s. (a) CO2 purity (%) and recovery (%) are shown by black and red lines, respectively. (b) Productivity (Kmol CO2/Kg·year) and specific energy consumption (MJ/Kg CO2) are shown by purple and blue lines, respectively.
Sustainability 17 06796 g008
Figure 9. Effect of desorption temperature on productivity (Kmol CO2/Kg·year) for different desorption durations (2000–12,000 s) over a temperature range of 120 to 170 °C.
Sustainability 17 06796 g009
Figure 10. Effect of vacuum pressure (0.07–0.3 bar) on DAC performance indicators. (a) CO2 purity (%) and recovery (%) are shown by black and red lines, respectively. (b) Productivity (Kmol CO2/Kg·year) and specific energy consumption (MJ/Kg CO2) are shown by purple and blue lines, respectively.
Sustainability 17 06796 g010
Figure 11. (a) Effect of different feed temperatures (5–30 °C) on performance indicators. (a) CO2 purity (%) and recovery (%) are shown by black and red lines, respectively. (b) Productivity (Kmol CO2/Kg·year) and specific energy consumption (MJ/Kg CO2) are shown by purple and blue lines, respectively.
Sustainability 17 06796 g011
Figure 12. Effect of different feed flow rates on process performance indicators. The column plot represents recovery (%), with numerical values above each column indicating productivity (Kmol CO2/Kg·year). The two dashed lines correspond to CO2 purity (%; yellow) and specific energy consumption (MJ/Kg CO2; red).
Sustainability 17 06796 g012
Figure 13. Sensitivity analysis of six process parameters on key performance indicators: CO2 purity, recovery, specific energy consumption, and productivity.
Sustainability 17 06796 g013
Table 1. Design and operating parameters of the packed bed used for simulation [56].
ParametersUnitValues
Bed Lengthm0.055
Bed Internal Radiusm0.004
Desorption Temperature°C115
Adsorption Temperature°C23
Particle Radiusm2.25 × 10−4
Crystal DensityKg/m3860
Bed Porosityfraction0.32
Adsorbent Weightg60
Particle Porosityfraction0.85
Feed Flow rateN mL/min17.2
Table 3. Isotherm fitting parameters and equations for temperature-dependent variables [56].
ParametersUnitValueParametersUnitValues
q L mol/Kg28.25 H s t e p KJ/mol−62.49
b L 0 1/bar2.51 × 10−15 H L KJ/mol70.74
n 0 -0.518 H n KJ/mol1.35
q H mol/Kg3.46 H H KJ/mol67.72
b H 0 1/bar2.42 × 10−11 H u KJ/mol18.67
q u 0 mol/Kg.bar5.27 × 10−4 λ 1 -1.74 × 10⁻²
ϒ-4 λ 2 1/0K6.53
Temperature-dependent variables’ formulas
b U = b L 0 exp H L R T g q U = q u 0 exp H u R T g
σ = λ 1 e x p [ λ 2 1 T 0 1 T g ] b H = b H 0 e x p ( H H R T g )
n = n 0 e x p ( H L n R T g )
Table 4. Process cycle durations for the base case.
Cycles of ProcessUnitDuration
Adsorptions7200
Evacuations6
Heating + Evacuations10,000
CoolingsTemperature matched the feed temperature
PressurisingsPressure matched the atmospheric pressure
Table 5. Formulas for performance indicators.
Performance IndicatorsUnitFormula
CO2 Purity% 0 t c y c l e F p r o d u c t   y C O 2 d t i = 1 m 0 t c y c l e F p r o d u c t   y i d t
Recovery% 0 t c y c l e ( y p r o d u c t , C O 2 F p r o d u c t z = L ) d t 0 t c y c l e ( y f e e d , C O 2 F f e e d z = 0 ) d t
ProductivityKmol/Kg·year 3600 × 0 t c y c l e ( F p r o d u c t   y C O 2 ) d t w a d s o r b e n t t c y c l e
SEC (vacuum)MJ/Kg CO2 0 t c y c l e F v a c P v a c γ η ( γ 1 ) ( P f e e d P v a c ) 1 1 γ 1 d t 0 t c y c l e F p r o d u c t y p r o d u c t , C O 2 d t
Disclaimer/Publisher’s Note: The statements, opinions and data contained in all publications are solely those of the individual author(s) and contributor(s) and not of MDPI and/or the editor(s). MDPI and/or the editor(s) disclaim responsibility for any injury to people or property resulting from any ideas, methods, instructions or products referred to in the content.

