1. Introduction
The issue of carbon dioxide (CO
2) emissions and their detrimental effects on the environment is one of the most pressing challenges humanity faces today [
1,
2]. These emissions can be dispersed in low quantities and are related to individuals, or they can be concentrated in significant quantities, which are typically related to industry. The dispersed emissions, even though low in quantity, are numerous and are generated by automobiles, gas-burning boilers, etc. [
3]. In response, countries worldwide are striving to identify effective solutions to mitigate these emissions [
4,
5,
6]. A significant role in reducing and eliminating scattered emissions is played not only by education [
7]. For the focused emissions, among the most promising strategies is the capture and storage of CO
2 in depleted hydrocarbon reservoirs, a solution that has been extensively studied [
8,
9,
10,
11].
Carbon capture involves preventing CO
2 from being released into the atmosphere, achievable through three main technologies: pre-combustion, oxy-combustion, and post-combustion. Of these, post-combustion technology is the most widely adopted due to its flexibility and applicability in both coal-fired and natural gas-fired power plants. It is particularly effective and economically viable for industrial facilities emitting over 100,000 tons of CO
2 annually [
12,
13].
Following the capture process, CO
2 must be transported to designated storage sites. The transport method—via pipelines or ships—depends on several factors, including the location of storage (onshore or offshore), the distance between the capture and storage sites, and the volume of CO
2 to be transported [
14,
15].
The final step is permanent storage, conducted under stringent safety protocols in underground formations. Potential storage sites include deep saline aquifers, basalt formations, unmineable coal seams, and most relevant to this study, depleted oil and natural gas reservoirs [
16].
This paper focuses on Romania’s potential to utilize depleted hydrocarbon deposits for CO
2 storage, positioning this technology as a viable solution for reducing environmental impacts. Romania has over 30 storage facilities for oil and natural gas, with a combined capacity exceeding 514 million tons [
16]. These sites, mapped in
Figure 1, could play a significant role in supporting the global energy transition and achieving climate neutrality. Uncontrolled CO
2 emissions from fossil fuels exacerbate climate change, underscoring the urgency of deploying such technologies. This work aims to promote CO
2 capture and storage as an effective means to reduce emissions, raise awareness about the dangers of greenhouse gases, and demonstrate the possibility of using fossil fuels responsibly alongside renewable energy sources.
The main research purpose of our endeavor was to examine the Oltenia region, as one of Romania’s largest sources of CO2 emissions, and identify potential pairs of power plants and storage sites with significant storage capacities of up to 75 million tons, with linear distances of up to 50 km between the two. The storage capacity was to be confirmed using proven reservoir simulation workflows.
For this study, the emission source chosen for analysis is Turceni Power Plant, and the depleted hydrocarbon reservoir is Bibești-Bulbuceni.
The table below (
Table 1) presents the distance and storage capacity of the deposit for storing carbon dioxide from the Turceni industrial facility in the Oltenia area:
1.1. Turceni Power Plant
The Turceni Power Plant, located in Gorj County, Romania, is one of the largest thermal power plants in Europe and a significant electricity producer in Romania. It is situated on the banks of the Jiu River, halfway between the cities of Craiova and Târgu Jiu. The plant is owned and operated by Complexul Energetic Oltenia (CE Oltenia). Originally, its installed capacity was 2310 MW, consisting of 7 units of 330 MW each; however, the current operational capacity is approximately 1260 MW, with 2 units operational and others decommissioned or mothballed. The fuel type is lignite coal with over 1450 kcal/kg calorific power, sourced from the Jilț Coal Quarry and Tehomir underground mine, and for the cooling system, it utilizes water from the Jiu River and 7 natural draft cooling towers. Boilers are of tower type with forced circulation with intermediate overheating with a steam flow of 1035 t/h, steam temperature of 540 °C, and steam pressure of 192 bar. The turbines are of Rateau-Schneider license type with four cylinders on one rotor line. The generator is synchronous, Alsthom license, hydrogen-cooled, with a nominal active power of 330 MW. The first unit was commissioned in 1978, and the last in 1987. Units 1, 2, and 3 have been retired, while Unit 6 is mothballed. Units 4 and 5 remain operational but are planned for decommissioning by 2025 and 2029, respectively [
17,
18].
The plant has faced criticism for its high CO2 emissions and environmental incidents, such as a coal ash spill in 2013 that affected local agricultural lands and households. The plant has been one of the most polluting industrial facilities in Europe, with significant CO2 and sulphur emissions. In 2019, Turceni Power Plant ranked third in Romania for CO2 emissions, with 3.3 MtCO2.
For Turceni, as part of Romania’s “2021–2030 Integrated National Energy and Climate Plan,” a 475 MW gas unit is planned to replace one of the existing coal units to reduce greenhouse gas emissions and align with EU climate goals. In January 2025, the Romanian Government put out a public auction for the installation of this 475 MW combined cycle energy production group using natural gas [
3,
16,
19].
To make the Turceni plant a zero-emissions power generator, complementary to the CO2 generation reducing measure mentioned above, our study proposes a novel carbon capture at the source and storage in the nearby Bibești-Bulbuceni depleted gas field.
1.2. Bibești-Bulbuceni—Geological Setting
The Bibești-Bulbuceni structure, the focus of this case study, lies on the northern edge of the Moesian Platform, near its contact with the Getic Depression. It is characterized by an elongated anticline trending NW-SE, with a faulted southern flank.
The Moesian Platform spans the lower Danube region, bounded by the pre-Carpathian depression (north), Prebalkans (south), and North Dobrogean orogen (northeast). The sedimentary succession comprises four tectonic mega sequences: Paleozoic, Permian-Triassic, Jurassic-Cretaceous, and Miocene-Pliocene.
In the Bibești-Bulbuceni area, Lower Paleozoic deposits consist of carbonate complexes (dolomites, limestones) topped by detrital formations. Permian-Triassic sequences include continental facies (conglomerates, sandstones, clays) overlain by carbonate series (limestones, dolomites, marls, anhydrites). Jurassic deposits (300–420 m thick) comprise siliceous sandstone-rich lower and marl-clay upper complexes. Badenian marine deposits feature limestones and calcareous sandstones, while Sarmatian deposits are predominantly pelitic marls and sandstones. Meotian formations show similar lithology with increased sandstone content [
20].
The adjacent Getic Depression, part of the Carpathian Foredeep, provides favourable conditions for hydrocarbon formation. The Bibești-Bulbuceni structure contains overlapping hydrocarbon targets across Devonian, Triassic, Sarmatian, and Meotian layers. Drilled wells on the Bibești-Bulbuceni structure reached a depth of 5104 m, encountering the following sequence:
Upper-Devonian (~400 m);
Lower red series (Lower Carboniferous) (180–240 m);
Triassic carbonate series (160–180 m);
Upper Jurassic (100–130 m).
Above these layers, Neogene formations of the sedimentary cover include:
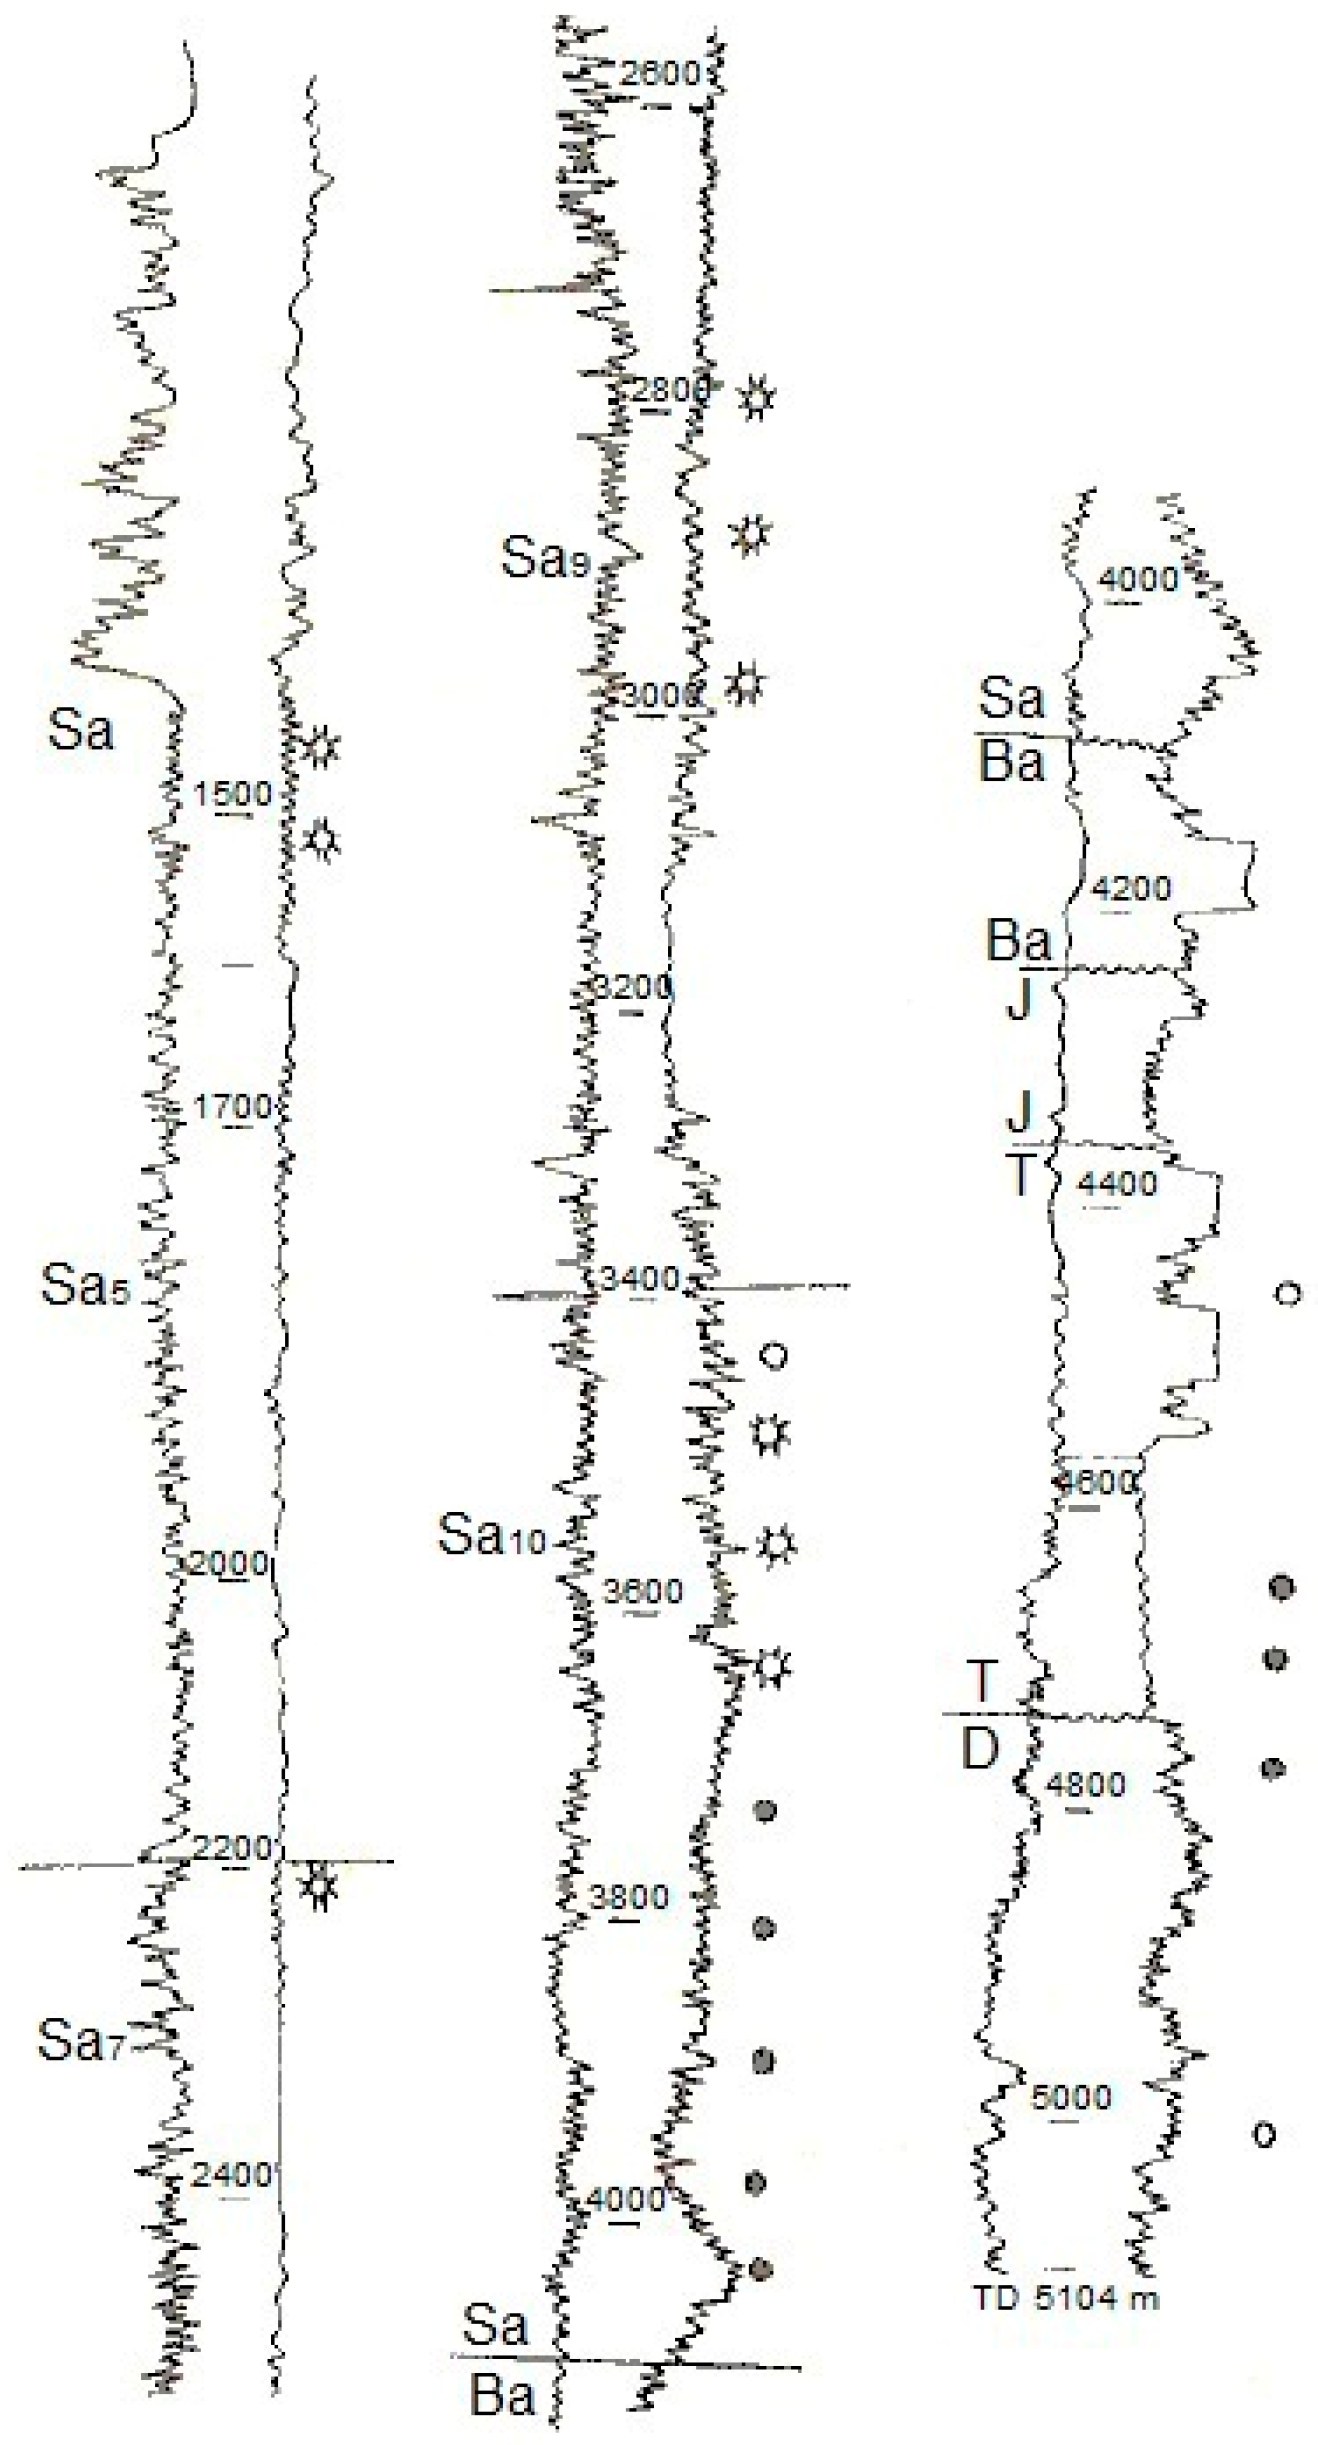
Figure 2 shows type logs for the Miocene, Triassic, and Devonian layers in the studied area (Bibești-Bulbuceni structure).
The Devonian dolomites exhibit porosities averaging 10%, while Triassic complexes A1 and A2, with thicknesses of ~90 m each, feature varying porosity (3.5–17.1%) and permeability (1.5–308 mD). Gas and oil were produced from these formations, with notable contributions from Sarmatian and Meotian reservoirs.
Figure 3 illustrates the distribution of hydrocarbon reservoirs in the Oltenia region (South-West Romania).
In the Sarmatian, the thickness of the complexes varies between 24 and 130 m, with porosity ranging from 2.3% to 24%.
The Meotian, which contains only gas, is characterized by a porosity of 18% and permeability ranging from 5 to 100 mD.
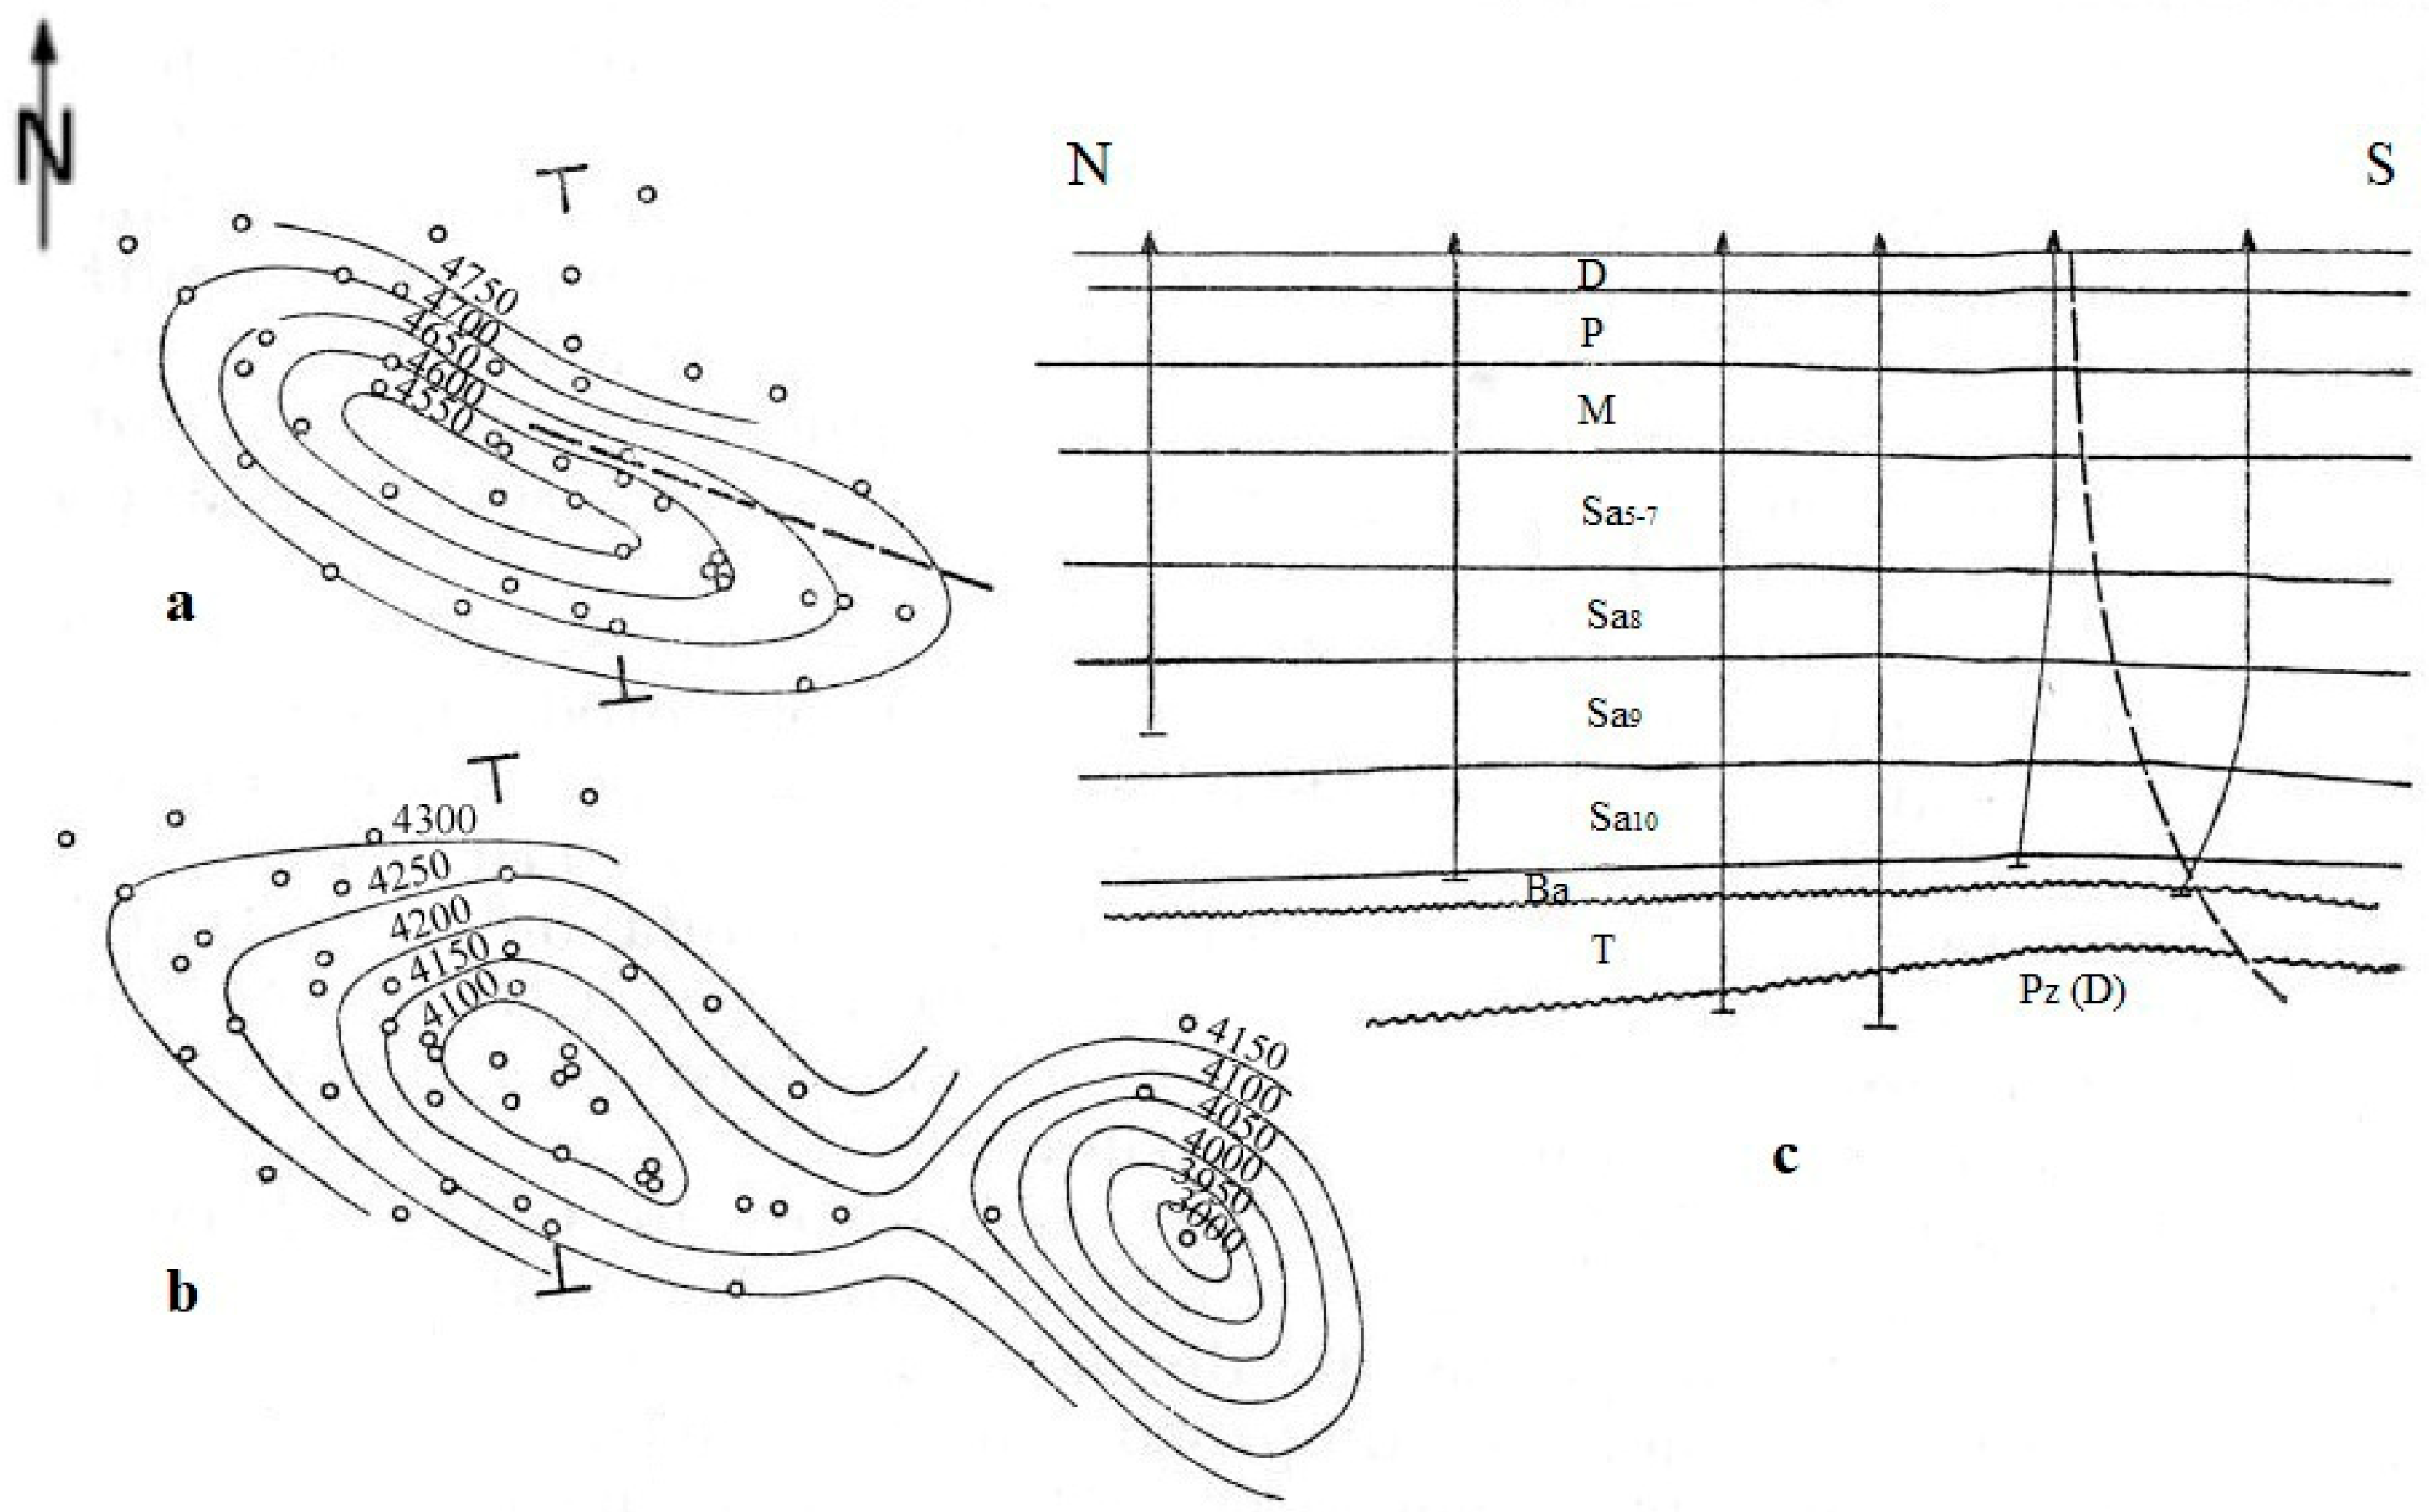
Figure 4 illustrates a cross-sectional geological profile with position of the Bibești-Bulbuceni structure to the South.
Figure 5 illustrates the same geological structure, including a structural map at the top Paleozoic level (a), a structural map at the top Triassic level (b), and a geological cross-section illustrating main geological formations in the sedimentary cover (c).
2. Materials and Methods
This section outlines the model development and simulation process covering the initial hydrocarbon production period for Bibești-Bulbuceni. Synthetic datasets with realistic inputs were used for this case study. These reflect valid models of the subsurface using average parameters identified and presented in the previous chapter. The subsurface model formed the foundation of our research, providing input for numerical simulations that evaluated CO2 injectivity and storage capacity. For the development of this static model, Petrel software was used.
A static reservoir model is created by integrating geological, petrophysical, and geophysical data. The process begins with structural mapping using seismic interpretation to define reservoir geometry and faults. Core samples and well logs provide data on rock properties like porosity and permeability, which are distributed throughout the model using geostatistical methods. Facies modeling captures depositional environments, while property modeling assigns petrophysical values to each grid cell.
The completed static model represents the reservoir’s physical characteristics before any dynamic simulation of fluid flow. The following chapter details our CO2 injection and storage assessment simulations.
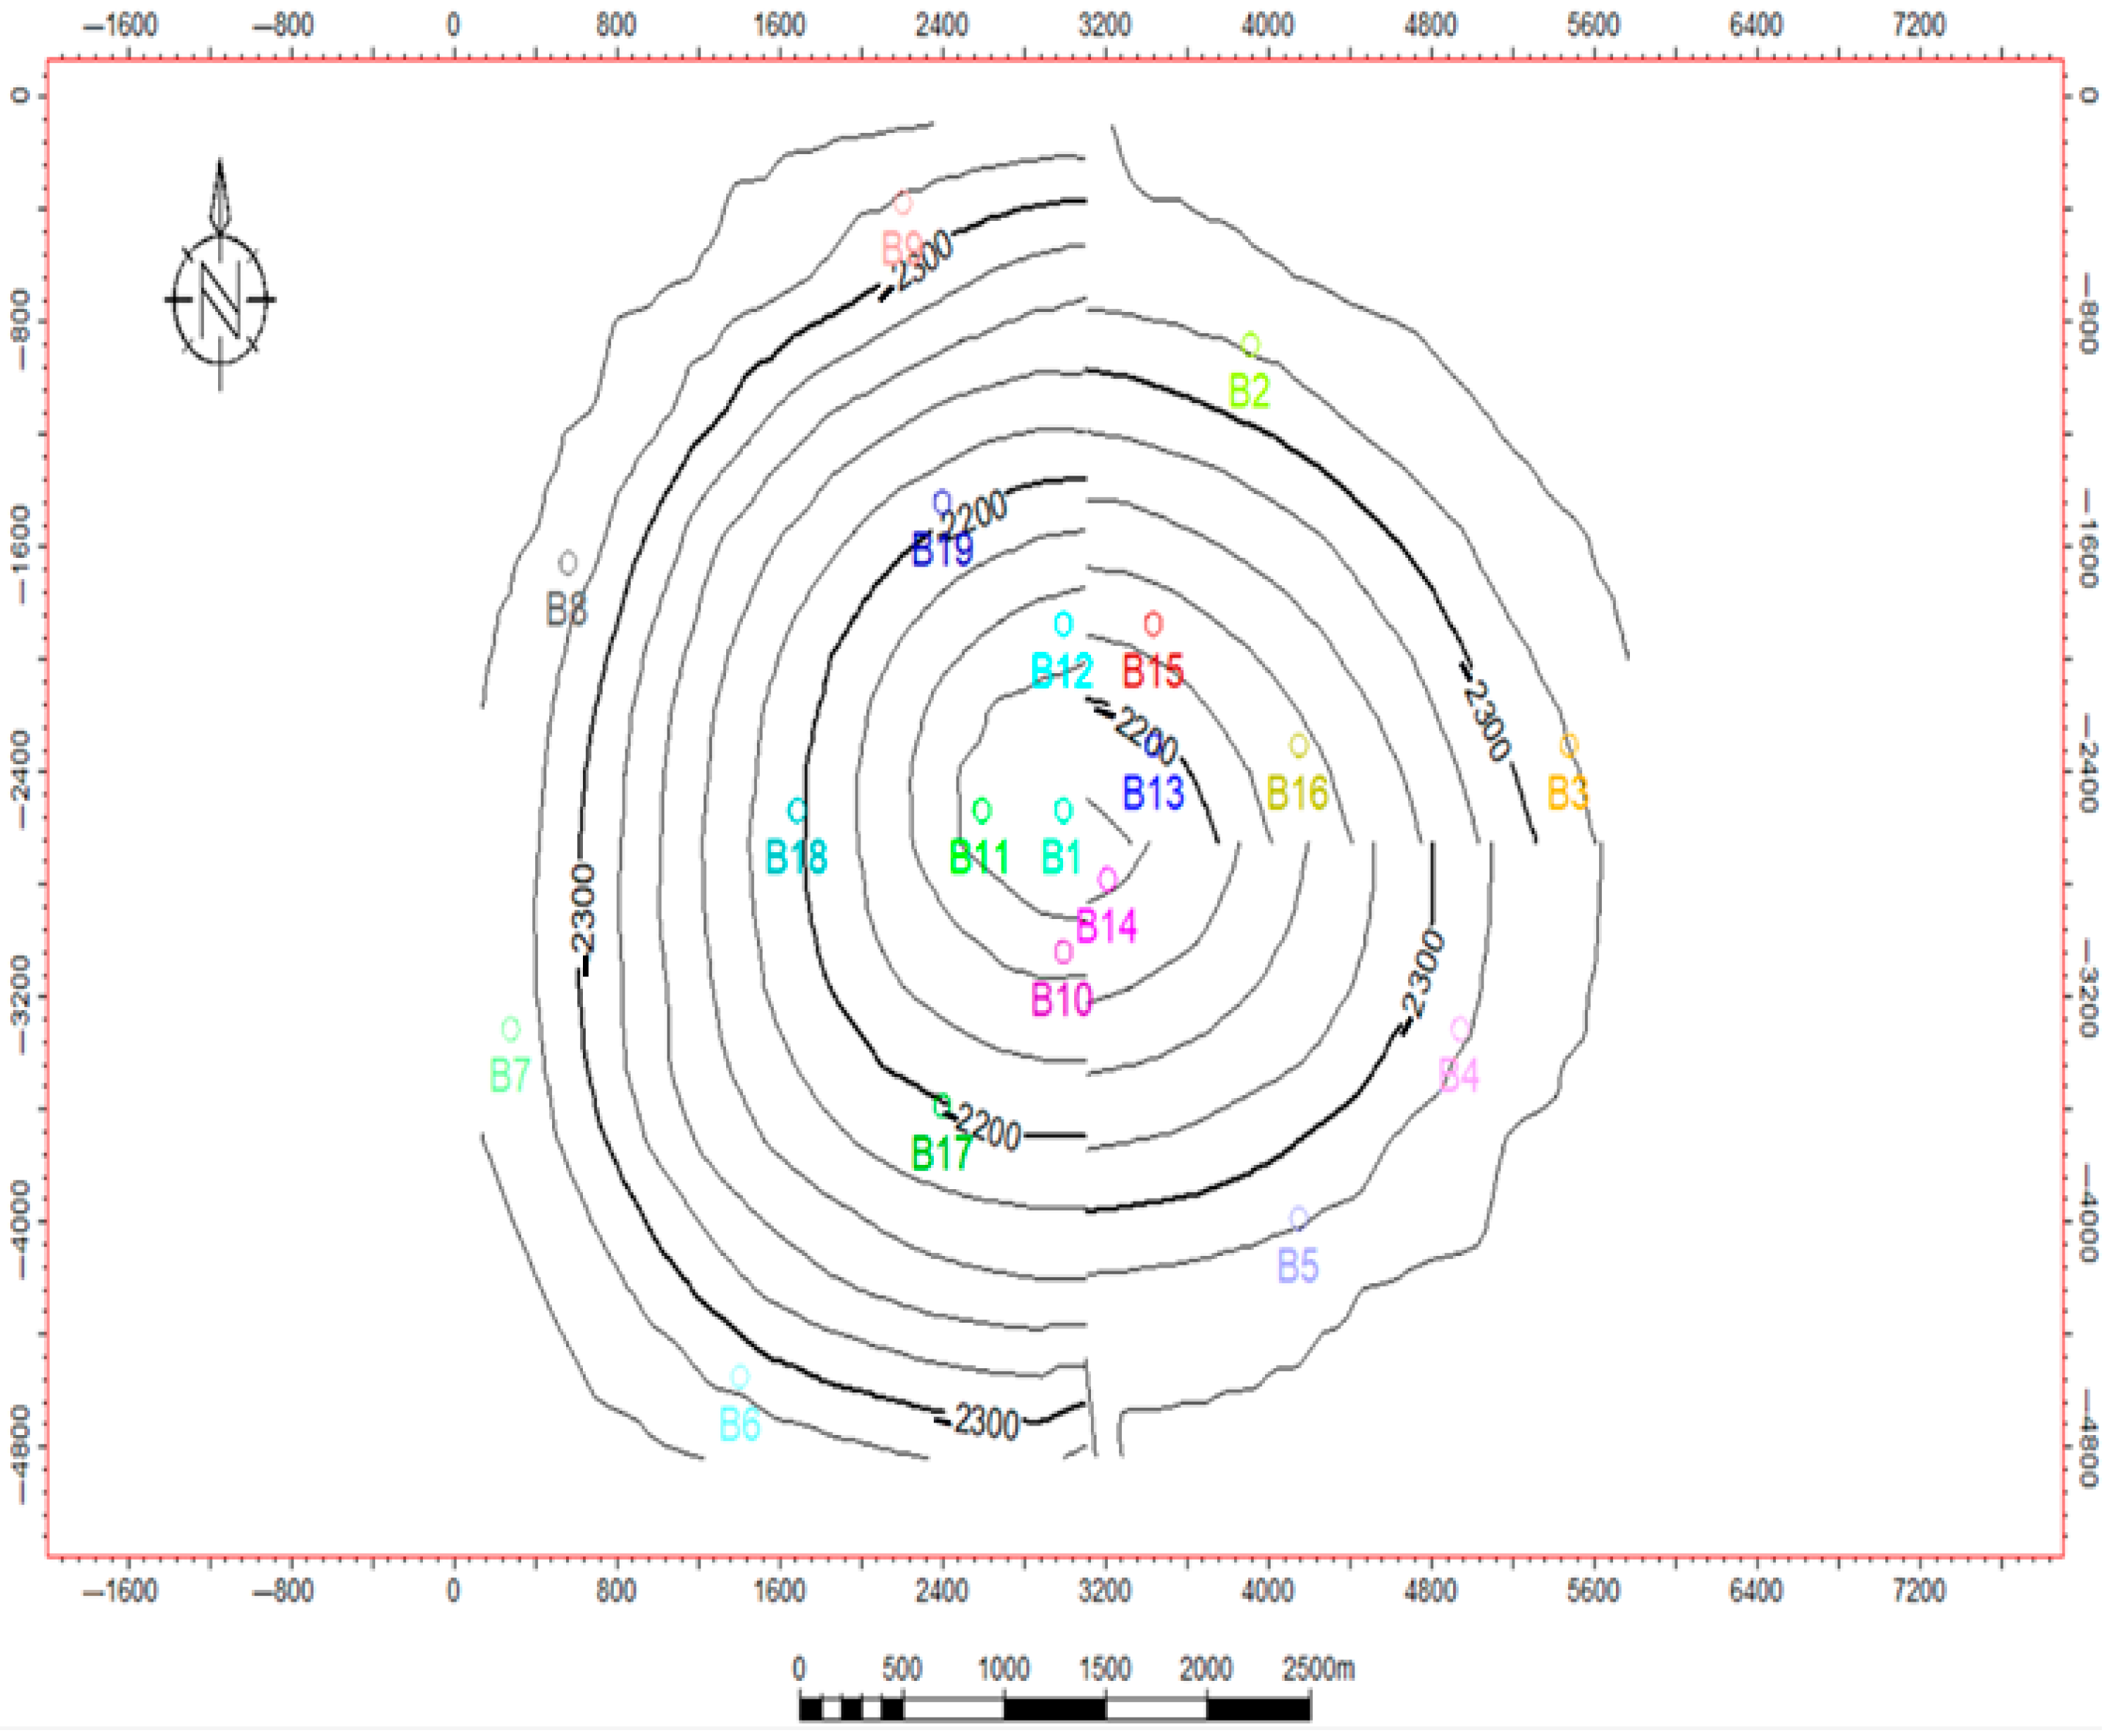
In
Figure 6, the structural map of Meotian layer top surface is displayed along with the locations of each well in the deposit under study.
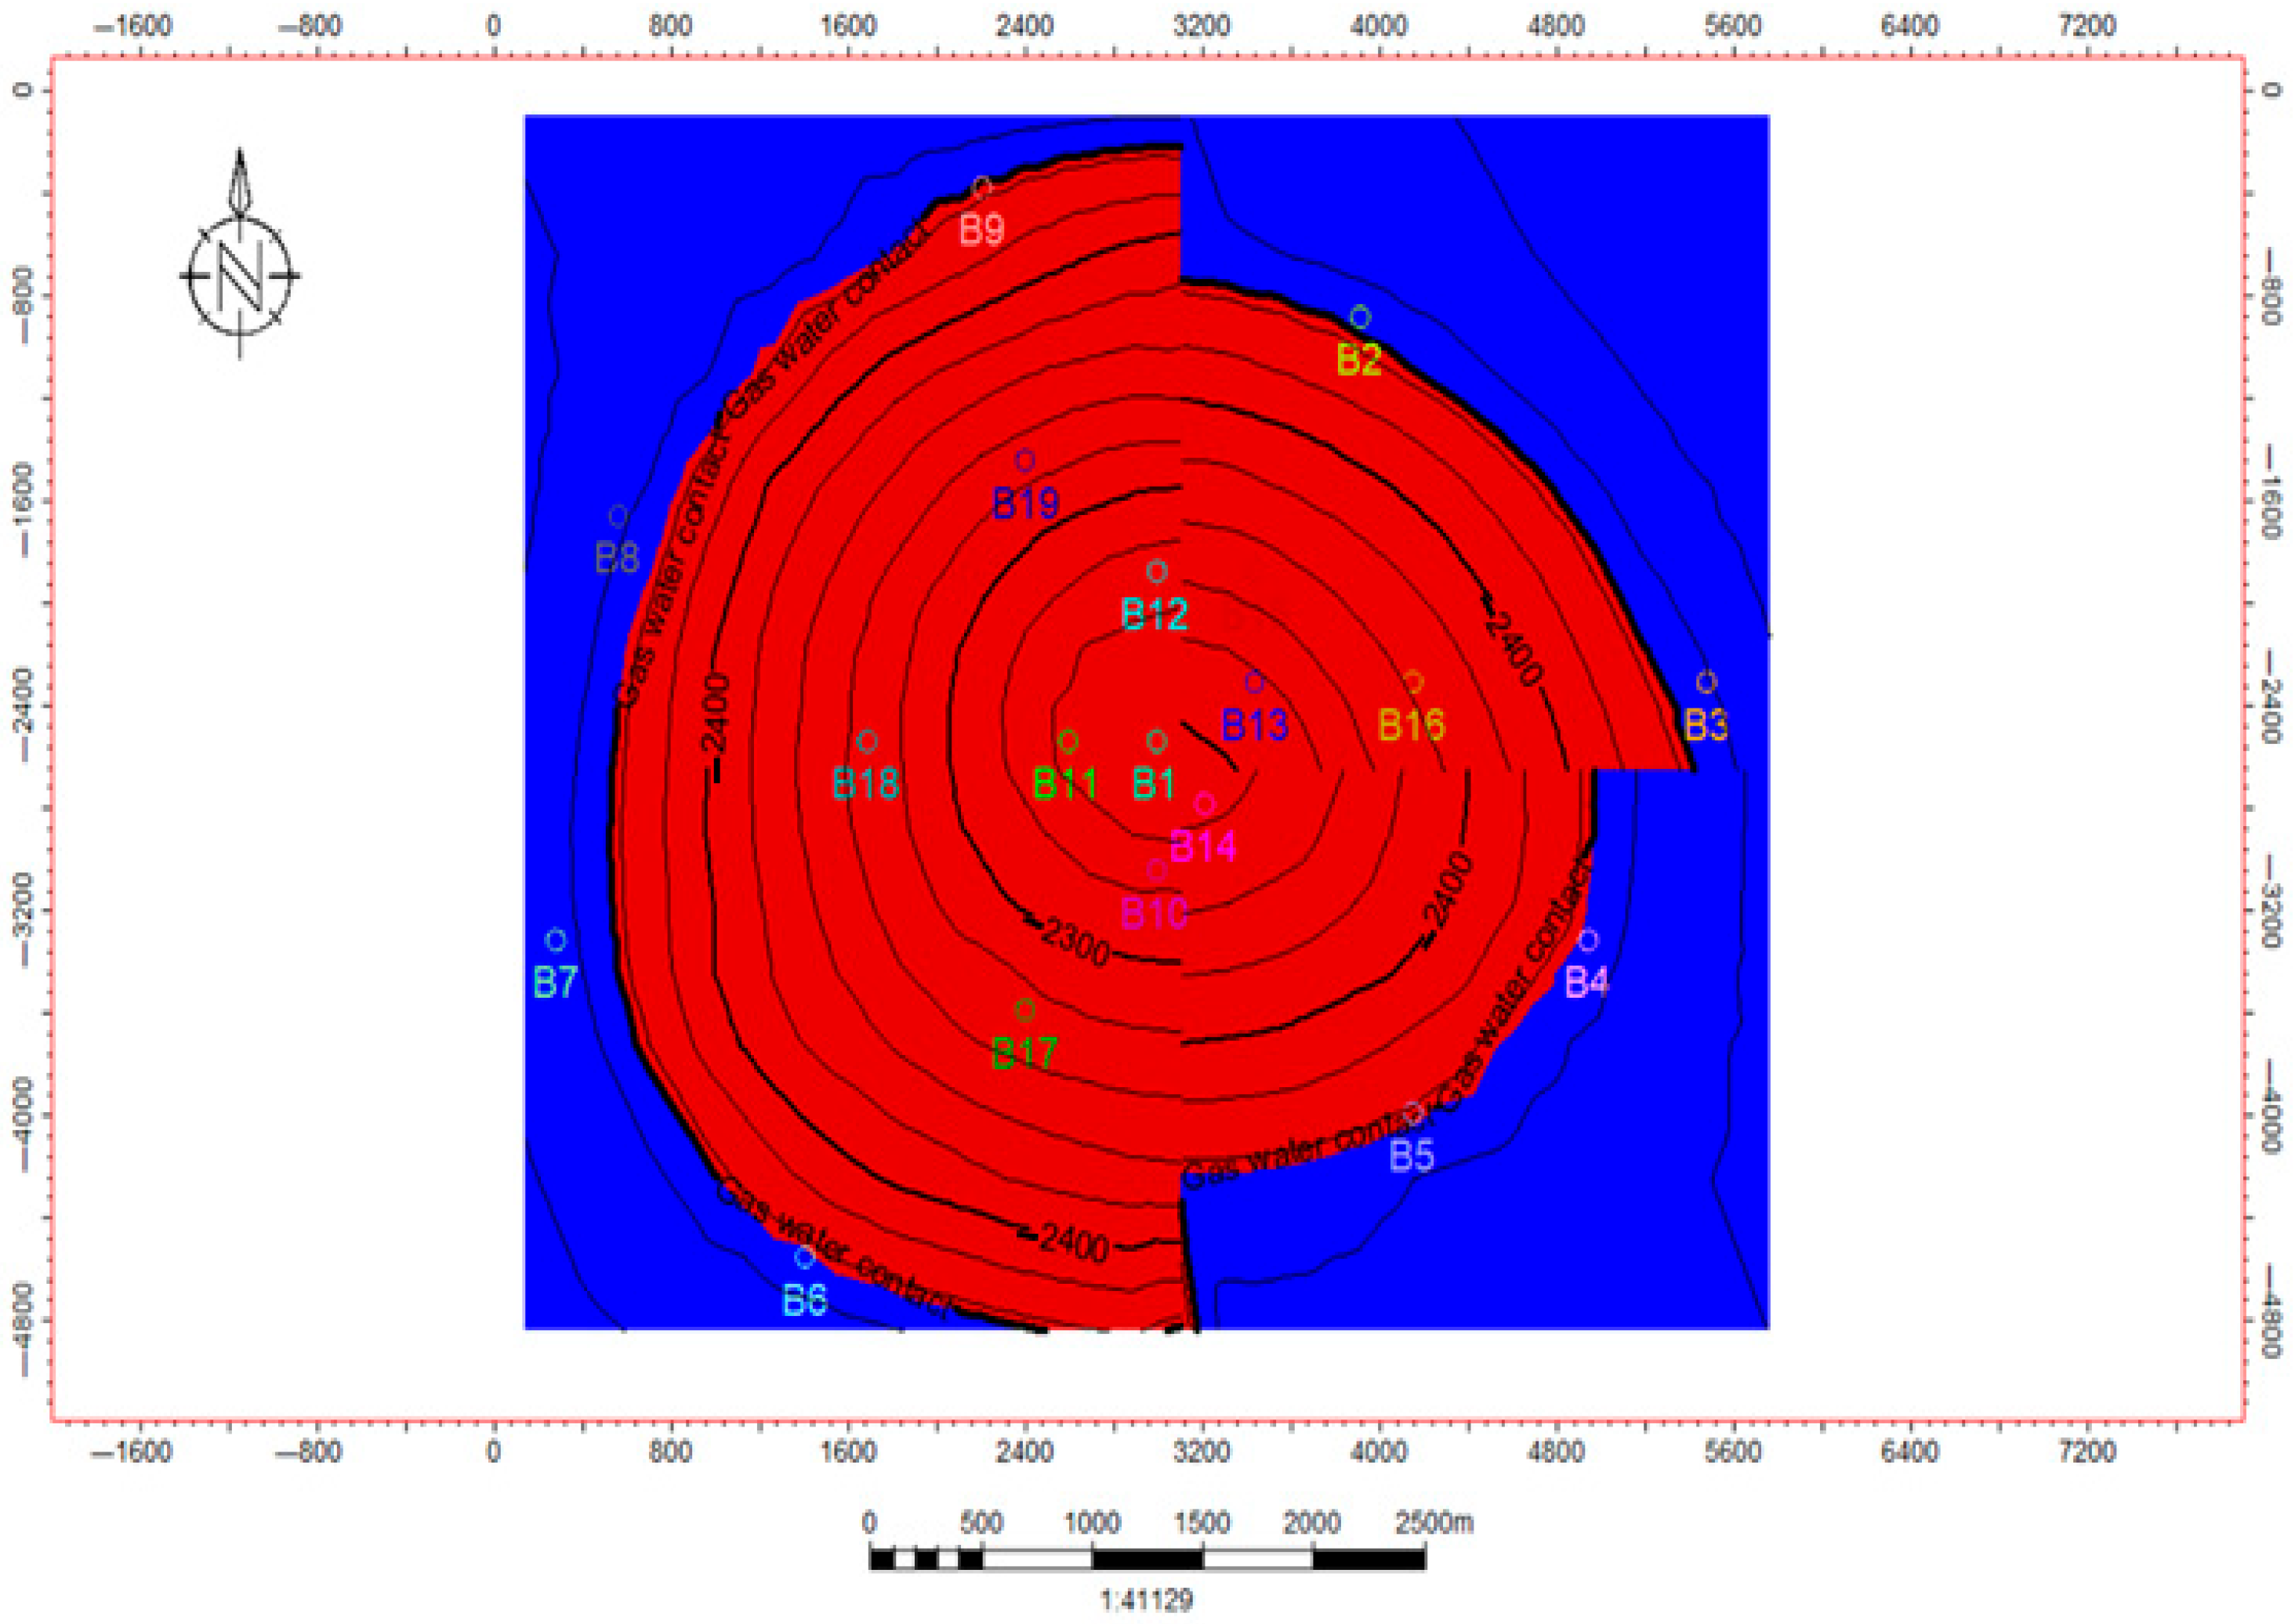
Base Meotian structural map, highlighting the water-saturated zone in blue and the gas-saturated zone in red, is presented in
Figure 7. The gas–water contact was defined at 2450 m. Upon closer inspection, it is evident that some wells are located within the water-saturated zone (blue), structurally positioned in that area; however, their perforations are higher in the gas-saturated zone (red), indicating that they were not producing water.
A three-dimensional visualization of horizontal permeability distribution throughout the reservoir is displayed in
Figure 8. The model exhibits stochastic variation in permeability values, which range from 5 to 100 millidarcies across the modeled volume.
It should be noted that the vertical permeability was obtained by multiplying the horizontal permeability by a factor of 0.1, which is the average starting multiplier in the industry.
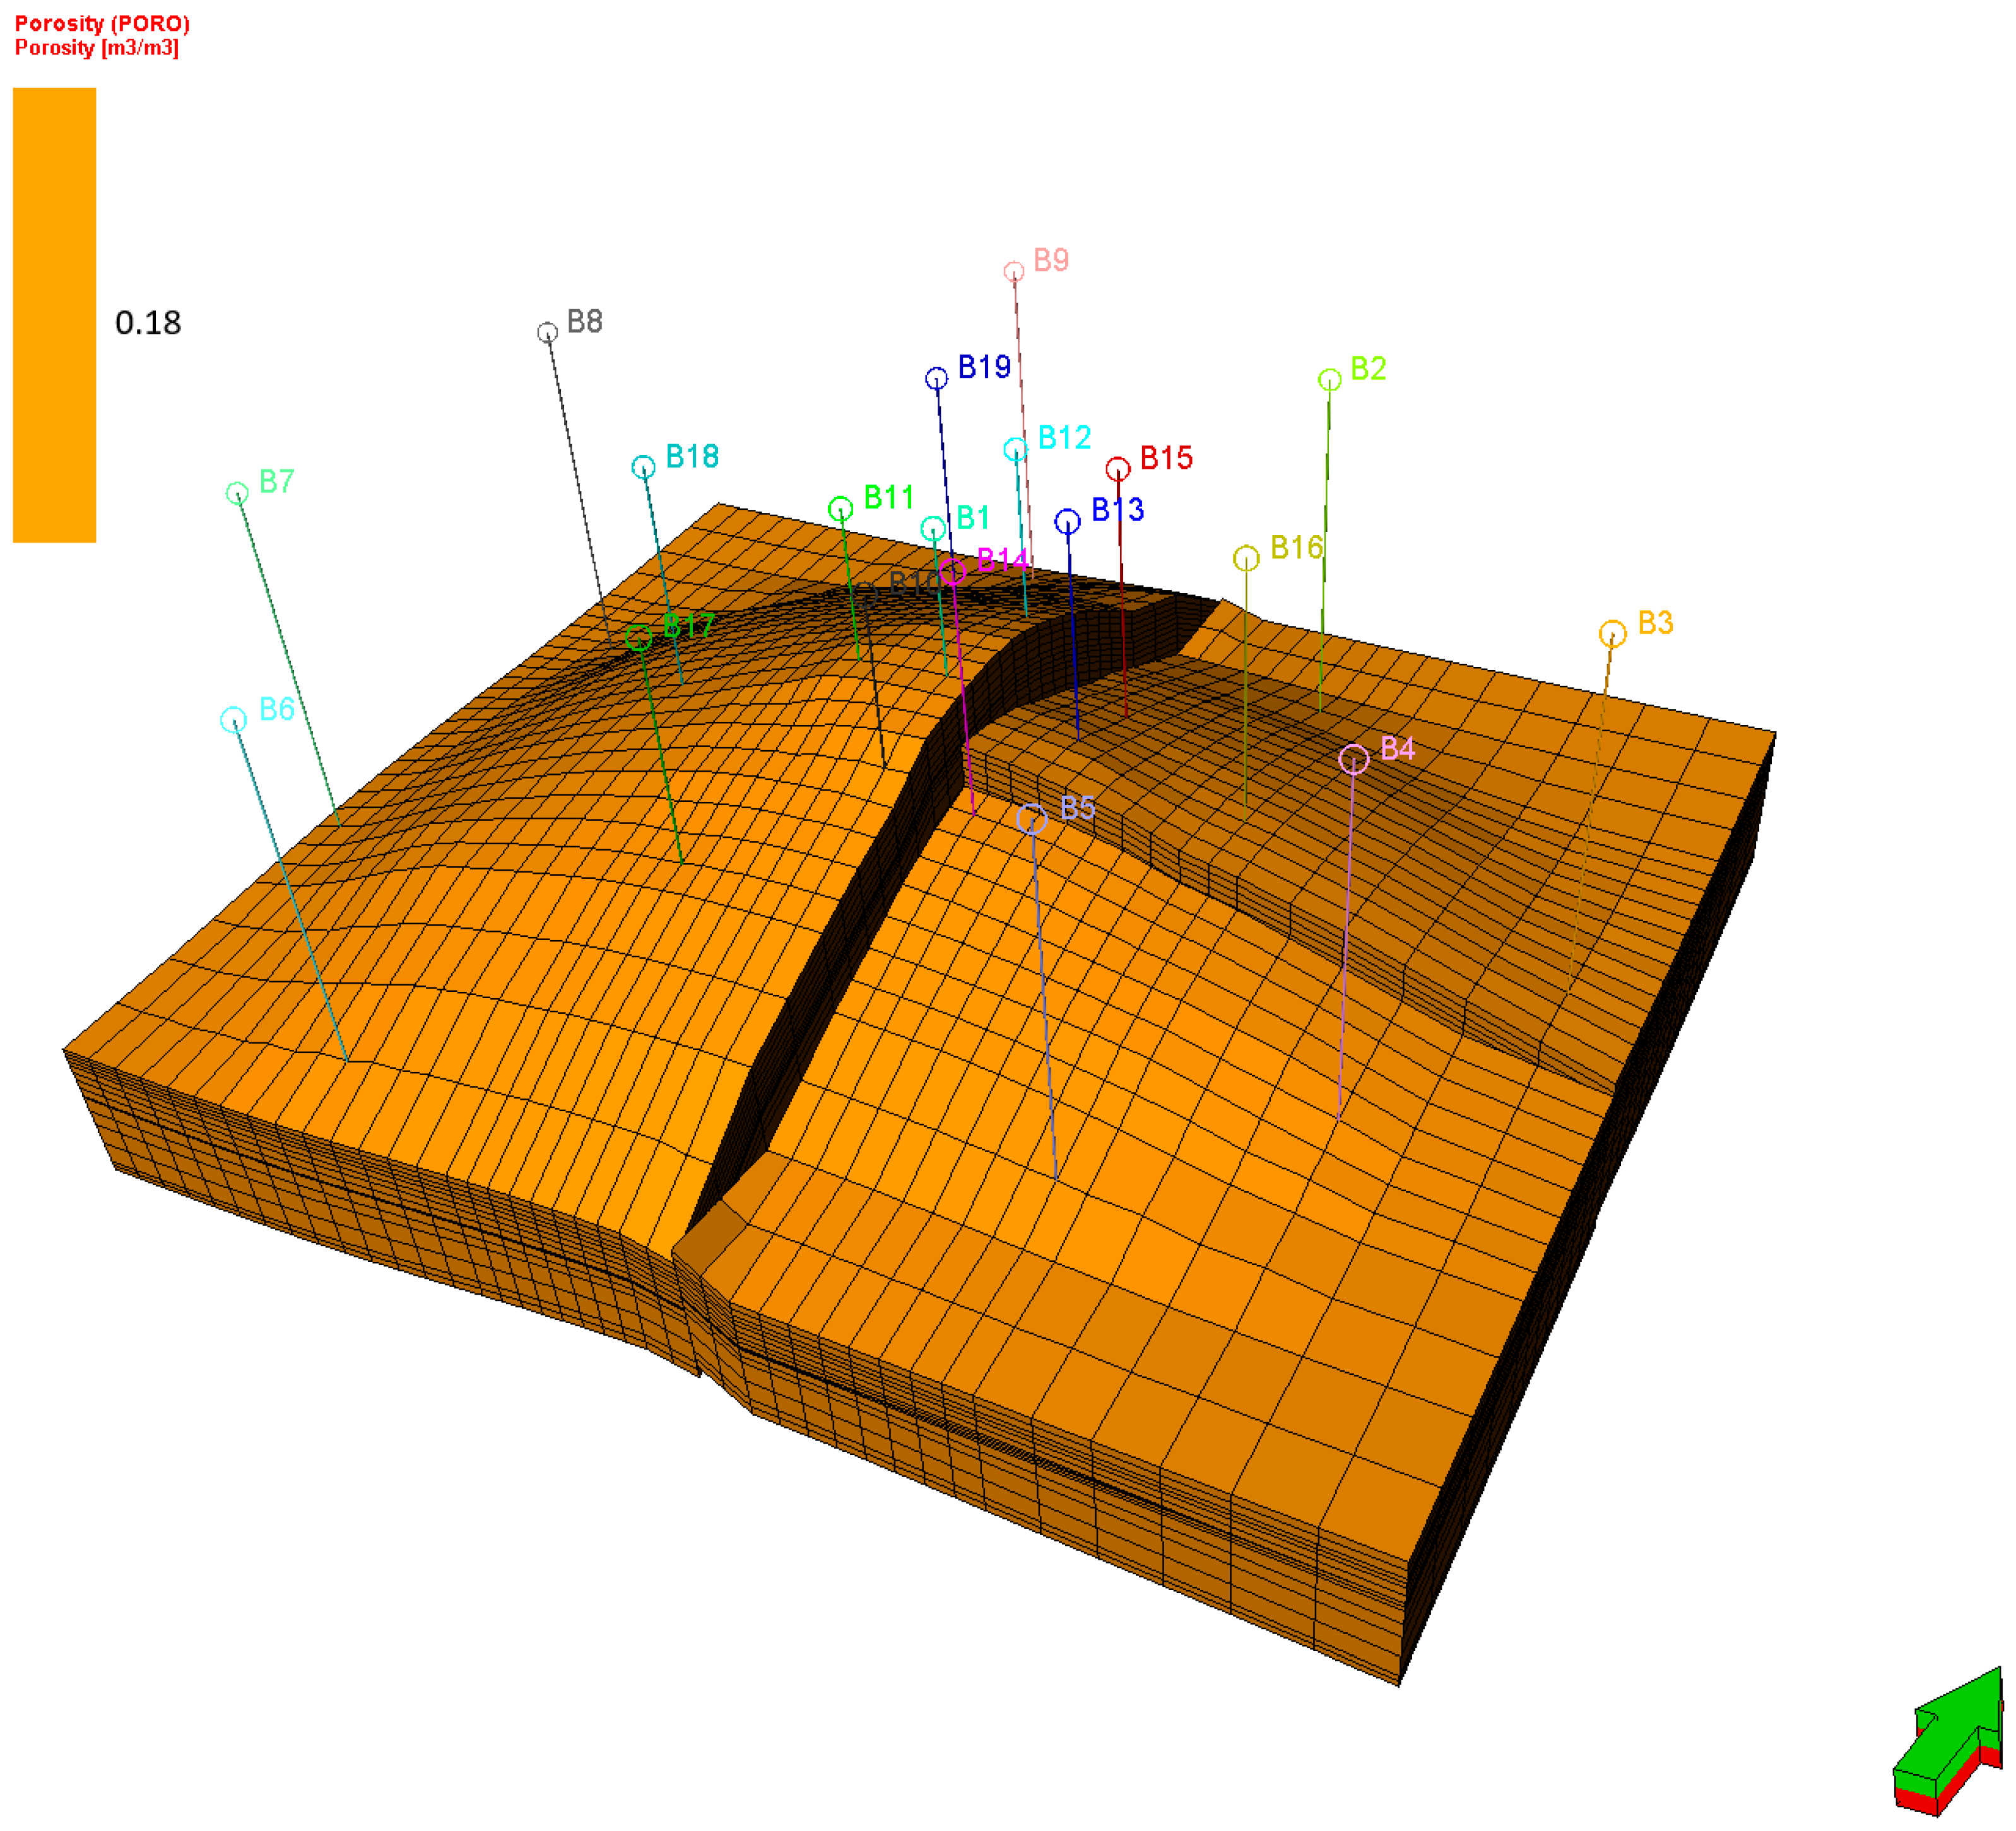
In
Figure 9, the distribution of porosity in 3D space is shown. It appears from the initial data that it is 18%.
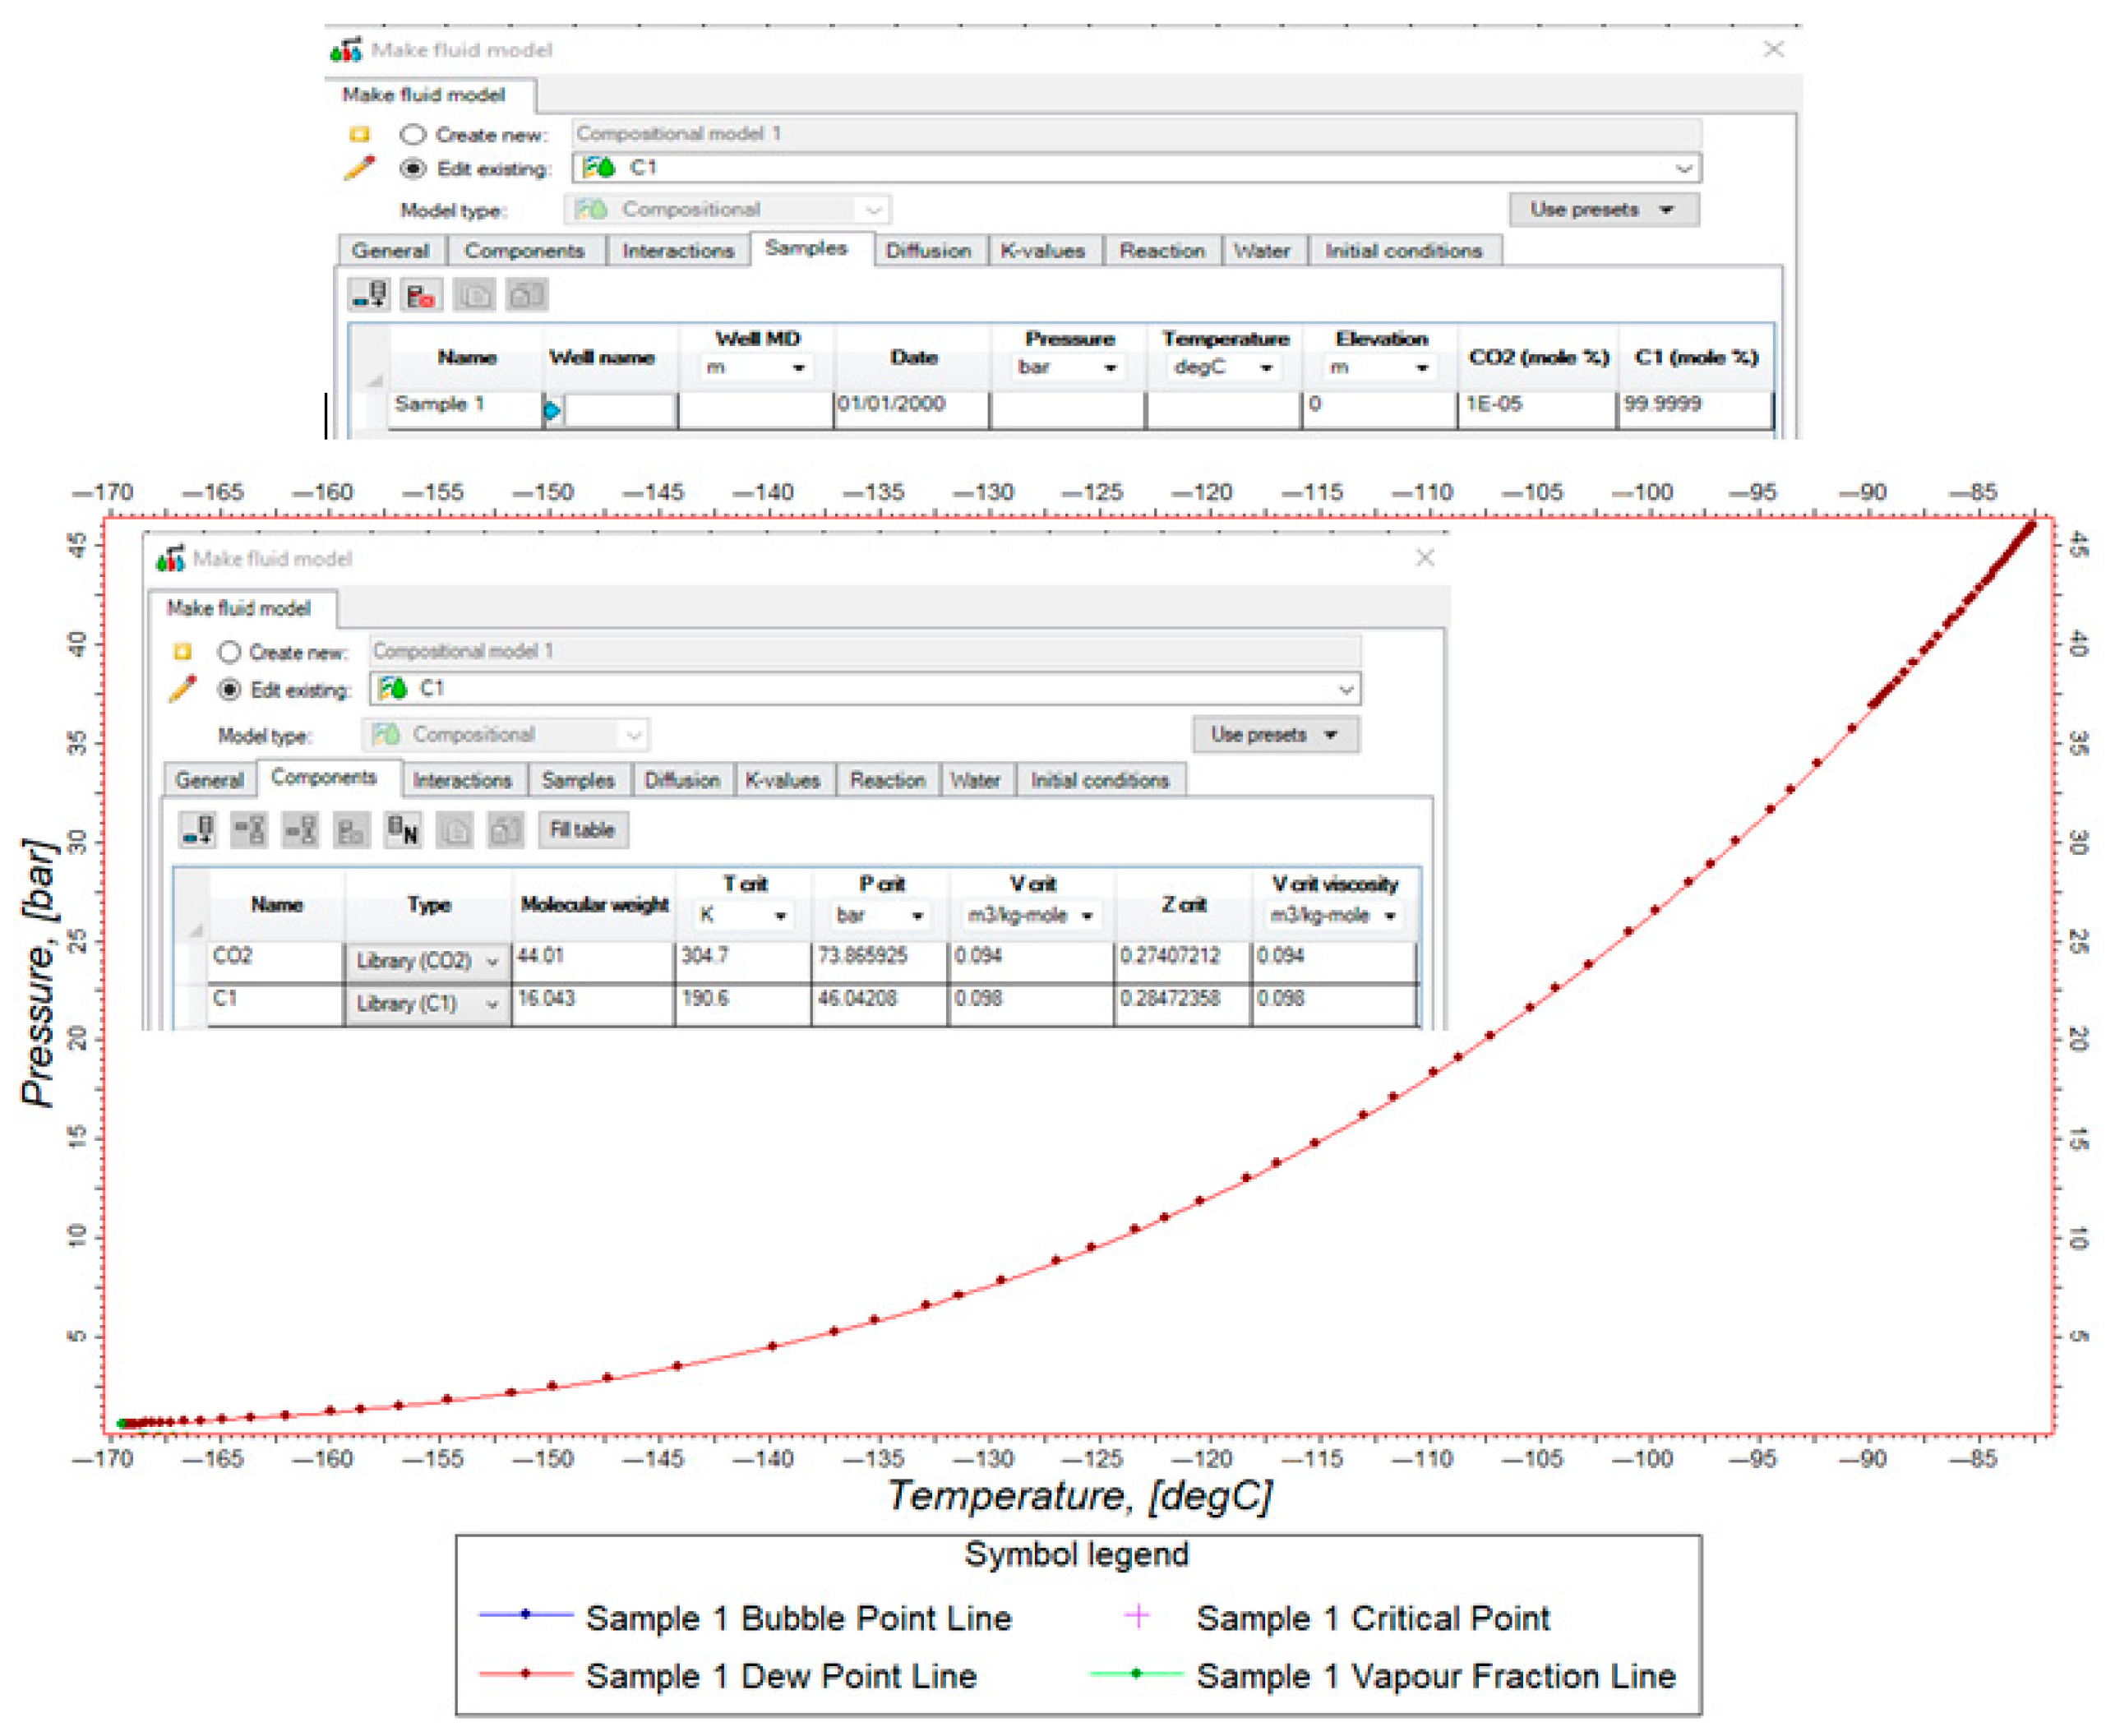
After the creation of the static model, this needs to be complemented with a fluid model. This was created with the Peng–Robinson equation of state, as per
Figure 10. Two components are present: methane, 99.99%, and carbon dioxide, 0.01%. The Peng–Robinson equation of state is a cubic equation used to predict the thermodynamic properties of pure components and mixtures, particularly for hydrocarbon systems.
In the depletion stage of the study, the fluid stream with the above composition, 99.99% methane and 0.01% carbon dioxide, is produced; hence, this stream was used in simulation. For the CO2 injection stage of the study, a fluid stream of 100% carbon dioxide is used; hence, this stream was the one injected.
The compositional framework for the fluids used at the different stages of the reservoir simulation study needs to incorporate all the components used by the different fluid streams used at any different times.
Relative permeability curves quantify the simultaneous flow of multiple fluid phases through porous media, defining the relationship between saturation and effective permeability for each phase. These curves are essential for reservoir simulation as they govern fluid mobility and displacement efficiency, with their shapes influenced by rock wettability, pore geometry, and fluid interfacial tensions.
Figure 11 shows the relative permeability curves used for this work. The curves used here are based on specific Petrel software correlations available for the rock type identified in the modeled Meotian reservoir. In the given geological context, this input has a certain degree of uncertainty associated with it.
Table 2 below centralizes the static model inputs.
For reservoir simulation, we employed Eclipse, an industry-standard compositional simulator featuring cubic equation of state, pressure-dependent K-values, the vapor liquid equilibrium ratios, and black oil fluid capabilities [
23].
The simulation validates all the data input in the static and additionally the dynamic data emulates their behavior for the hydrocarbon production and CO2 injection stages.
The boundary conditions of the model are presented in
Table 3. The dynamic ones are further detailed in the following
Section 3.
The simulation controls of the model are presented in
Table 4 and are further presented in the following
Section 3.
3. Results
Initializing a dynamic reservoir model refers to the process of setting up the initial conditions and parameters required for simulating the behavior of fluids (gas and water) within a reservoir over time.
This step is crucial in reservoir simulation, as it establishes the starting point for the simulation and ensures that the model accurately represents the reservoir’s physical and fluid properties.
The main outcomes of the initialization are the initial saturation and pressure distributions, and the model’s volumes in place: pore volumes and the hydrocarbon saturated pore volumes.
Figure 12 illustrates, as a simulation grid result, the 3D ternary saturation distribution after the model was initialized in the dynamic reservoir simulator. Red cells represent areas occupied by gas, and blue cells correspond to areas occupied by water.
The 3D saturation distribution displays a ternary triangular legend. In its corners, we have 100% water saturation (lower corner blue), 100% gas saturation (upper corner red), and 100% oil saturation (right corner green). In between, there are intermediate values. Since this is a dry gas reservoir, originally, only gas and water are present.
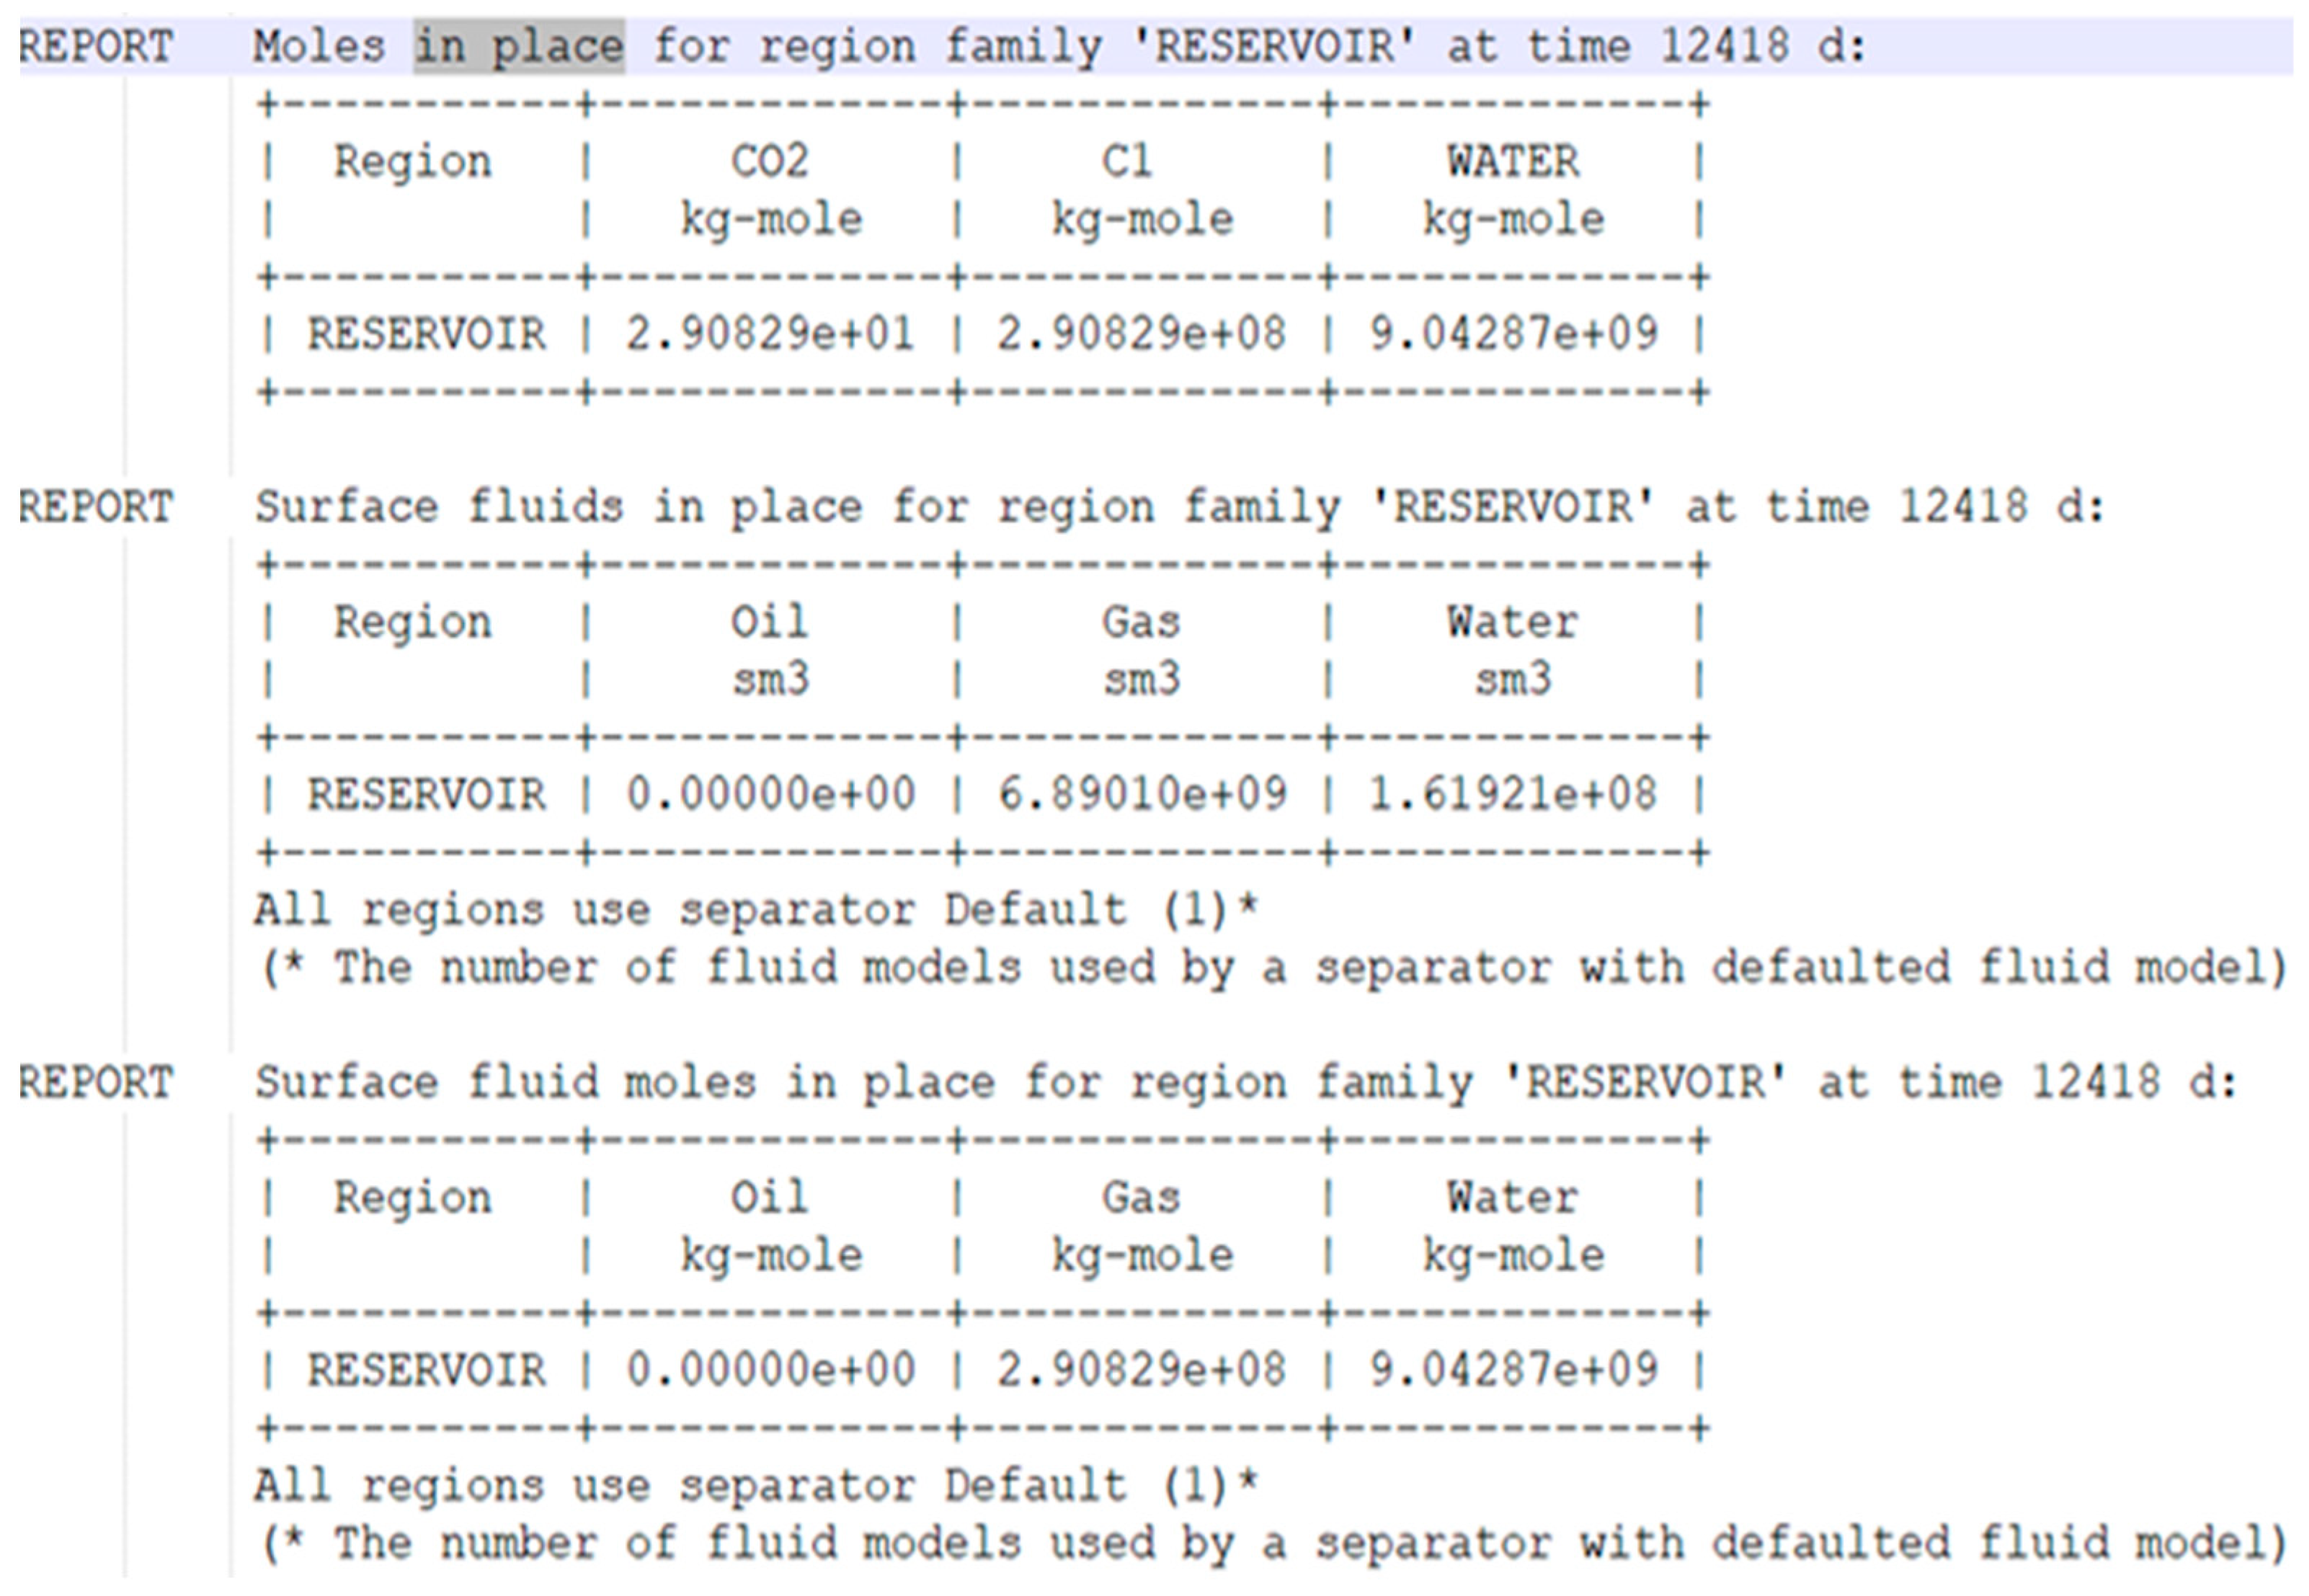
In
Figure 13, the reference pore volume is 0.6 × 10
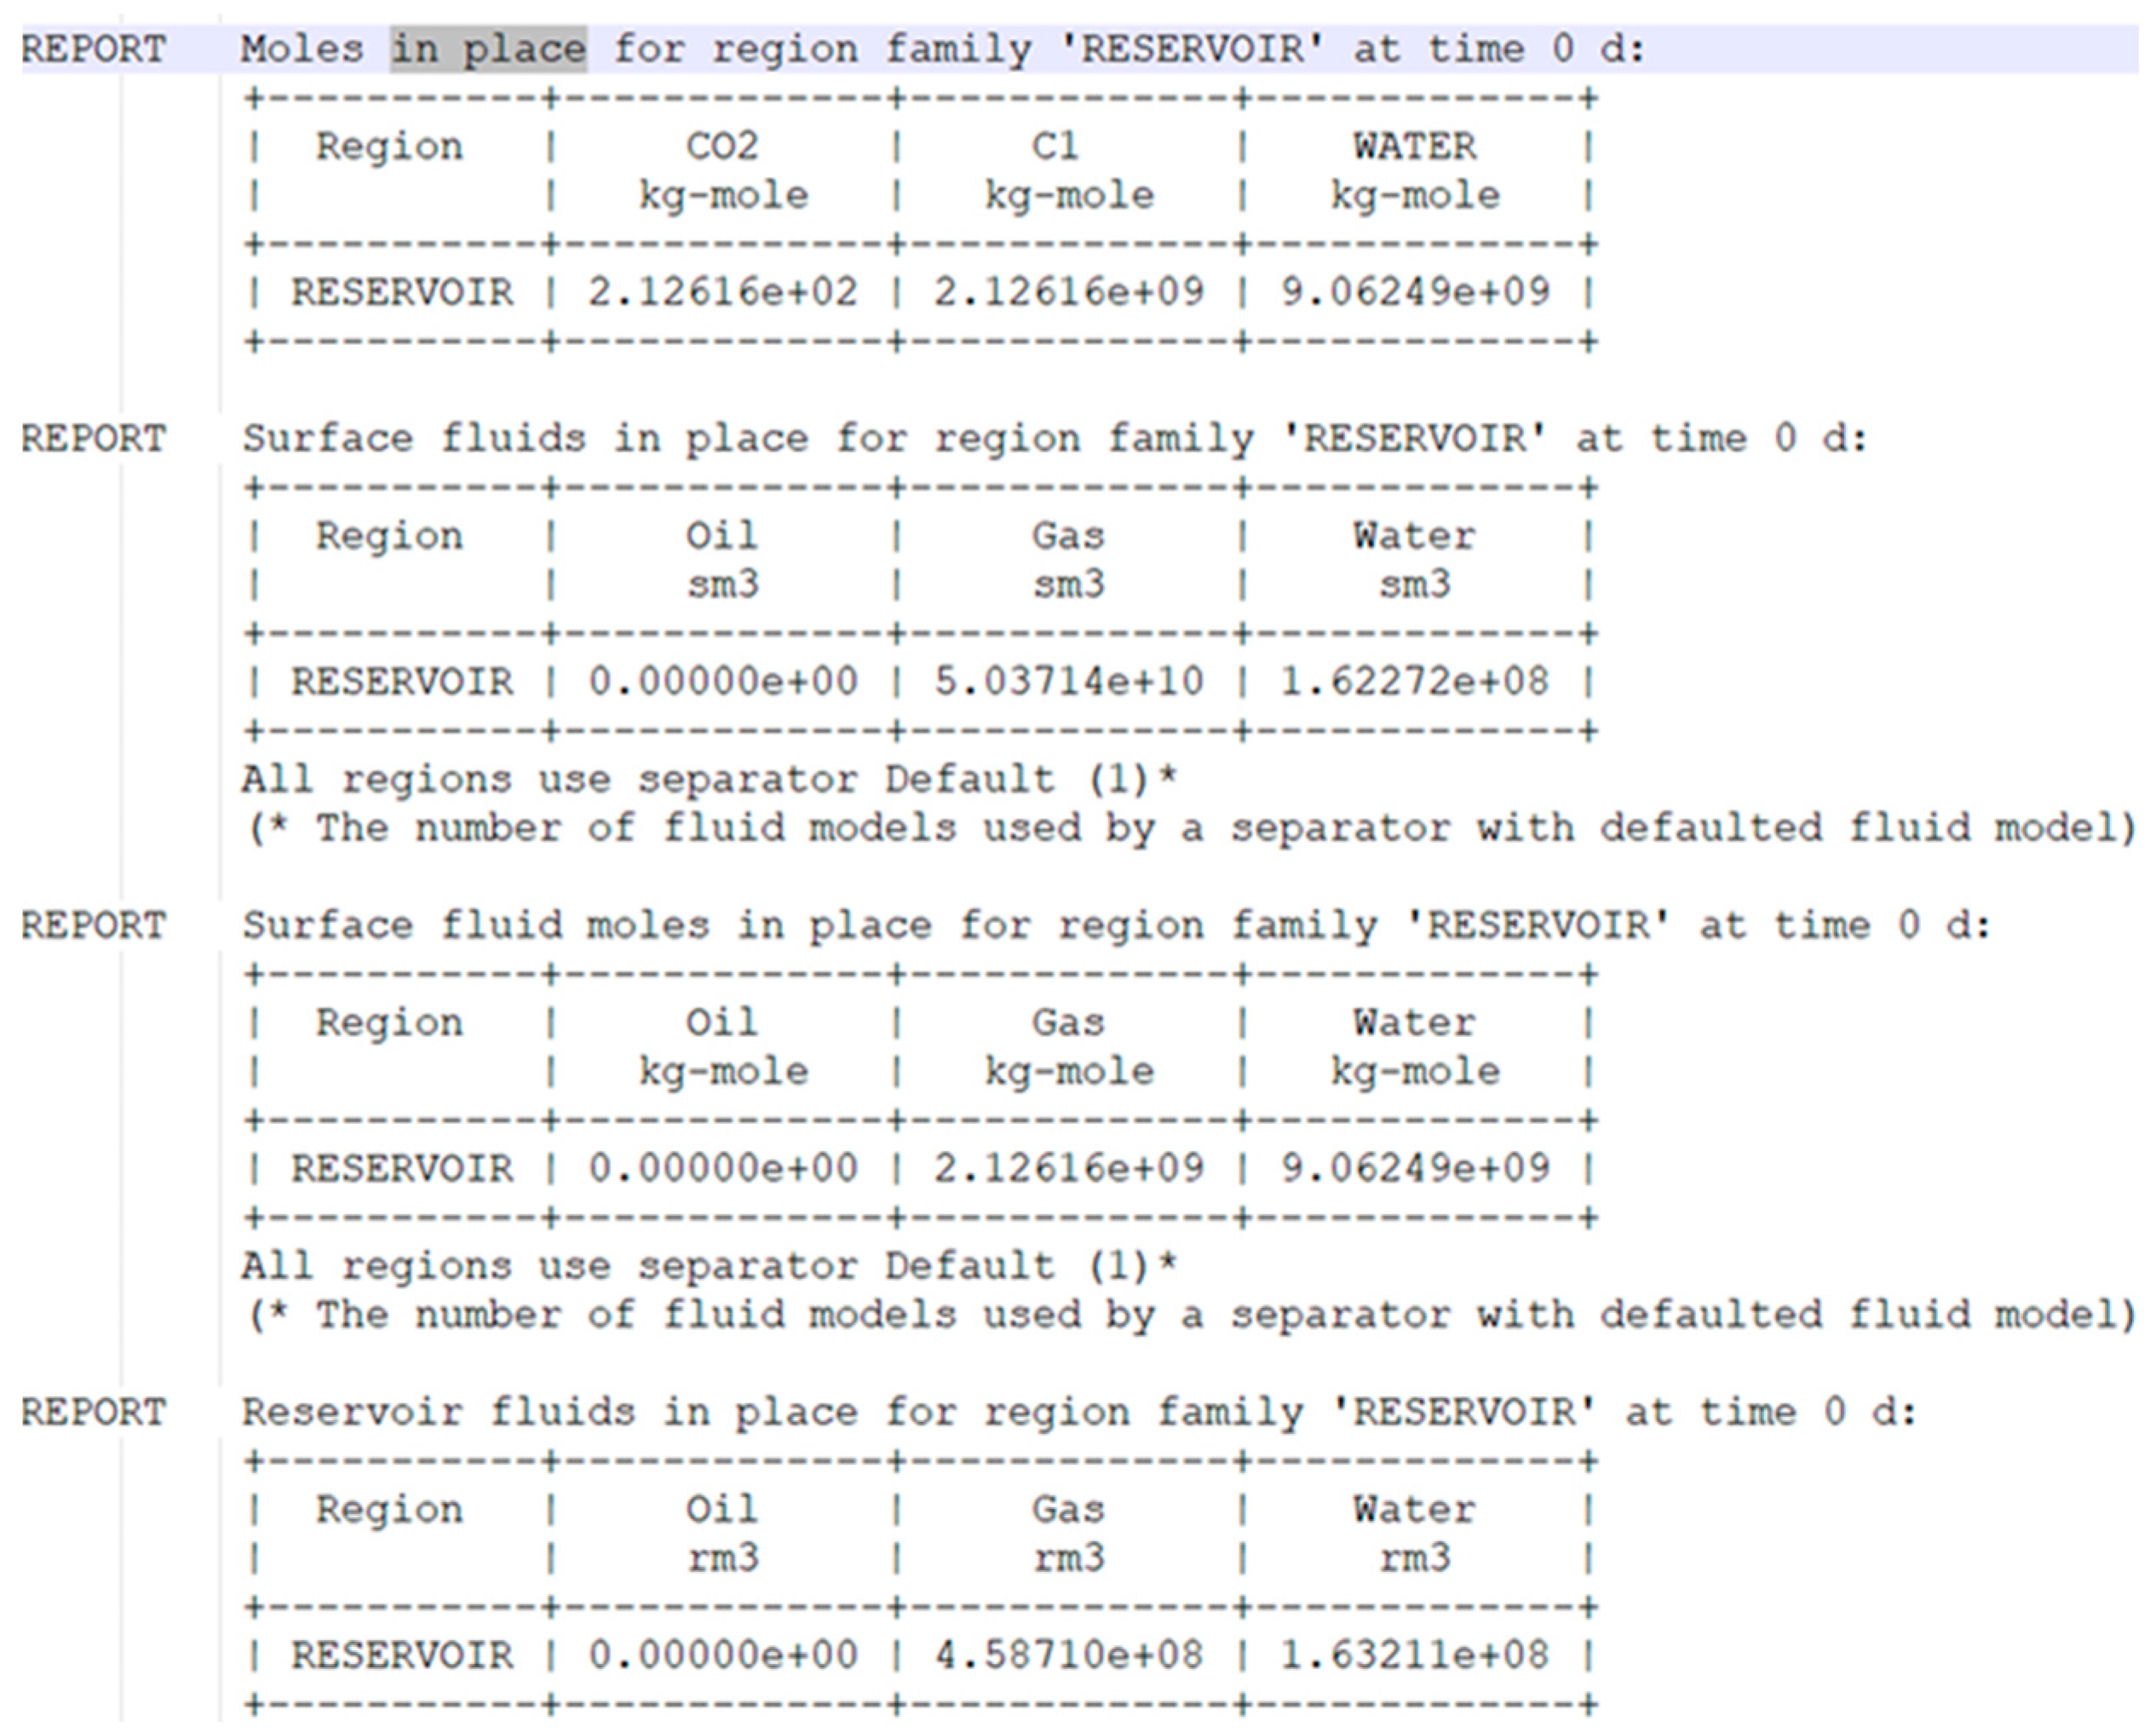
9 rm3 with an initial reservoir pressure of 149 bar. The dynamic pore volume is equal to the reference pore volume (PV) since the effective and total porosities are considered equal. From a flow modeling perspective, this is considered normal. These represent the total pore volumes of the reservoir. The hydrocarbon pore volume (HCPV) is the reservoir pore volume occupied by hydrocarbons, in this case, natural gas.
Surface and reservoir volumes for each reservoir phase are presented in
Figure 14; one can see that the hydrocarbon gas initially in place is approx. 50 Bsm
3. Moreover, the quantity of substance for each component and each phase is expressed in kg-mole.
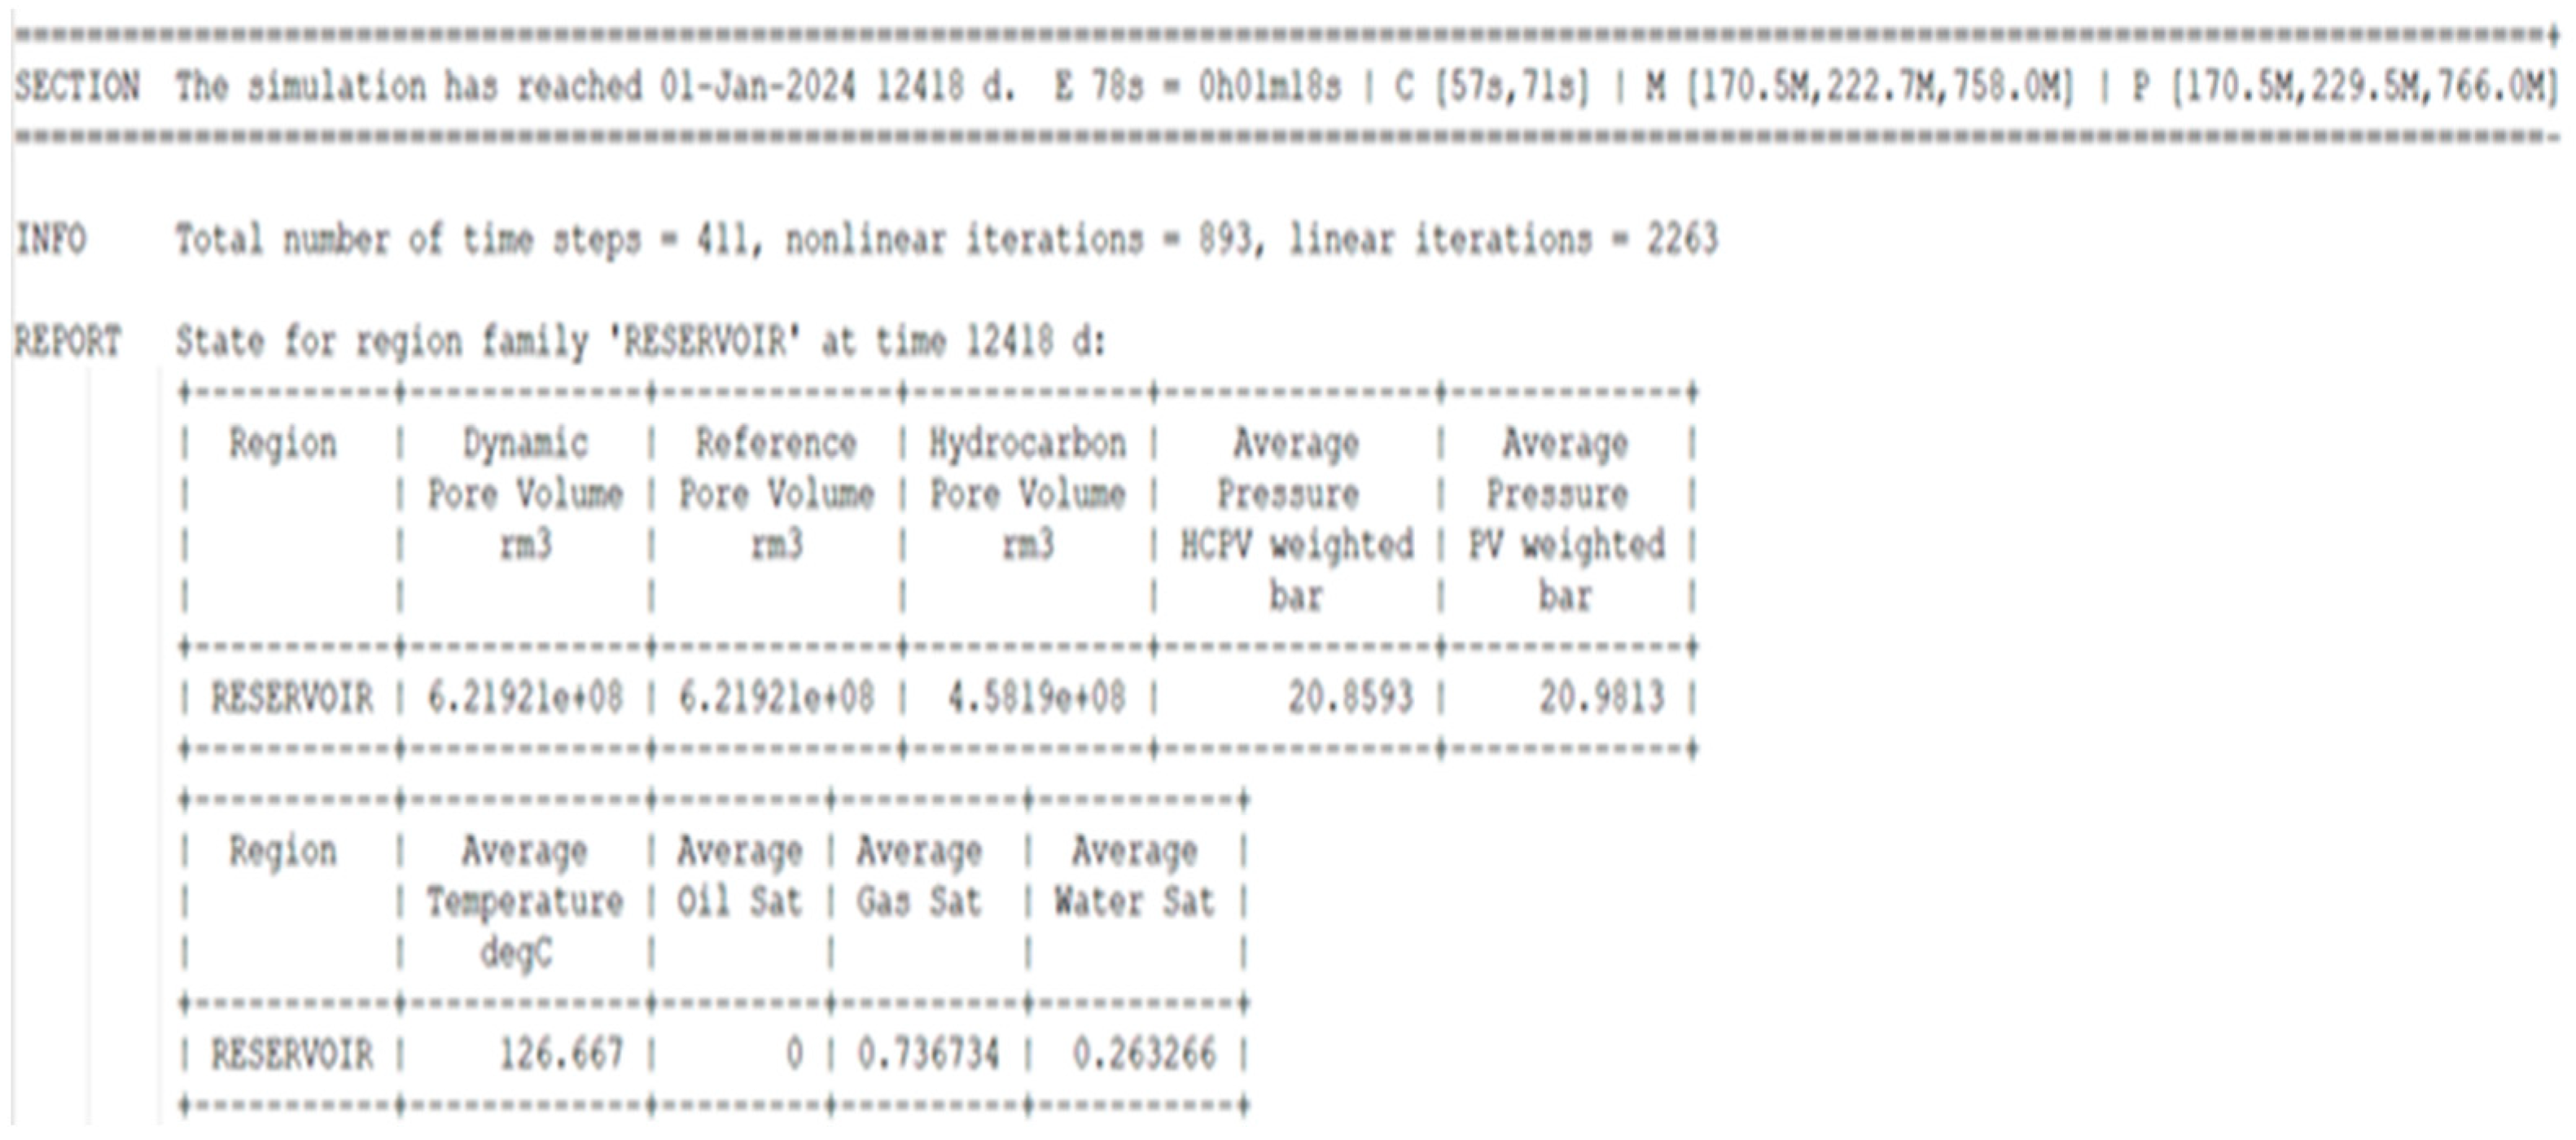
The model is produced through 19 production wells between 1990 and the present time. All producing with the same operational parameters: the bottom hole dynamic pressure of 20 bar and the production flow rate of 200,000 Sm3/day maximum.
Figure 15 presents the production profiles made for well B1, which is at the top of the structure.
The upper left quadrant shows the well bottom hole pressure variation over time; the upper right quadrant shows the cumulative well gas production; the lower left quadrant shows the well gas rate production over time; the lower right quadrant shows the well water production rate.
This well does not produce water, and the other wells from the top of the structure have similar profiles.
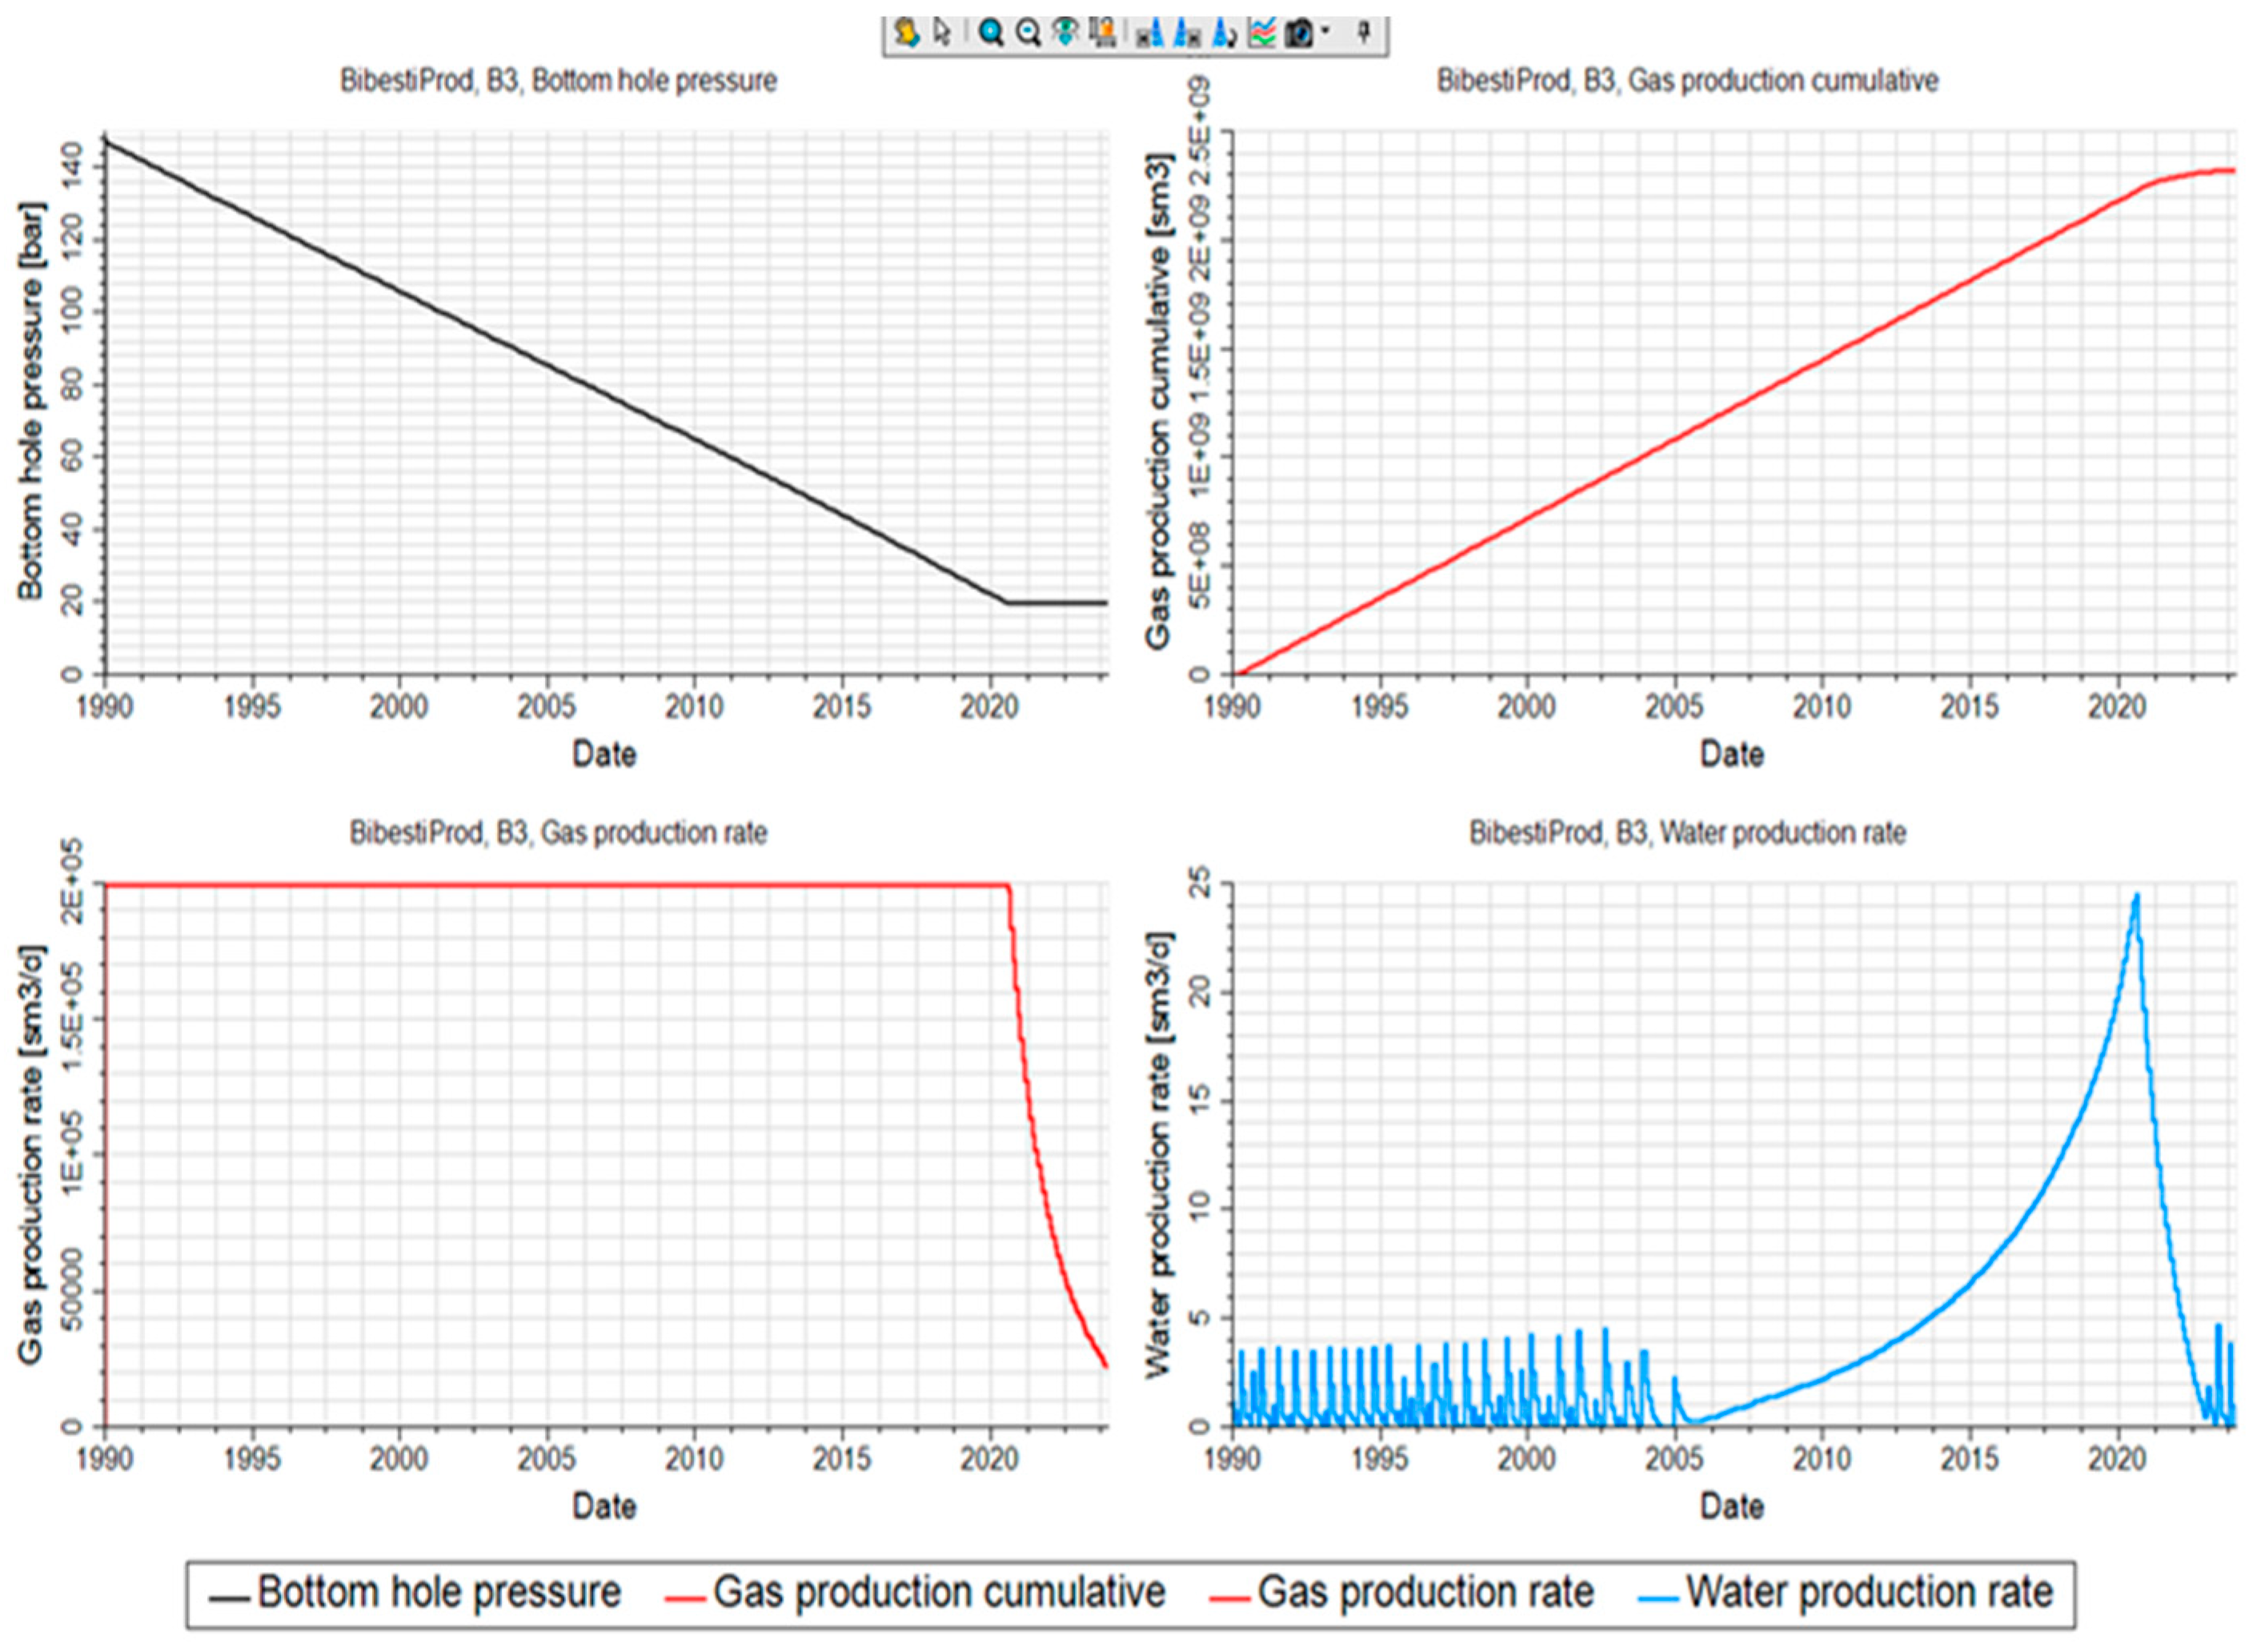
Figure 16 presents the production profiles for well B3, which is at the base of the structure in the vicinity of the gas–water contact. One can notice that this well is producing some water (the blue curve in the lower right quadrant). The upper left quadrant shows the well bottom hole pressure variation over time; the upper right quadrant shows the cumulative well gas production; the lower left quadrant shows the well gas production rate over time; the lower right quadrant shows the well water production over time.
The production profile for the whole of the reservoir is obtained by adding up the wells’ individual behaviors, namely the ones presented in
Figure 15 and
Figure 16, and it is presented in
Figure 17.
The upper left quadrant shows the field gas production cumulative variation in time; the upper right quadrant shows the field gas production rate; the lower left quadrant shows the field pressure variation in time; and the lower right quadrant shows the field water production rate.
As per
Figure 18, the remaining gas in place is 6.9 Bsm
3, and by the difference with the initial volume, we conclude that 43.14 Bsm
3 was produced throughout the hydrocarbon exploitation stage. The recovery factor of the reservoir is close to 80%, which is a reasonable value for the gas reservoirs.
Moreover, of importance to the next CO
2 injection stage is also the final reservoir pressure, as illustrated in
Figure 19, which has a value of 20.85 bar. One can observe the decrease of the reservoir pressure from 140 bar initially to approximately 21 bar presently.
This is a clear indication of the depletion/exhaustion of the hydrocarbon reservoir, making it the perfect candidate for receiving the CO2 emitted by the Turceni power plant.
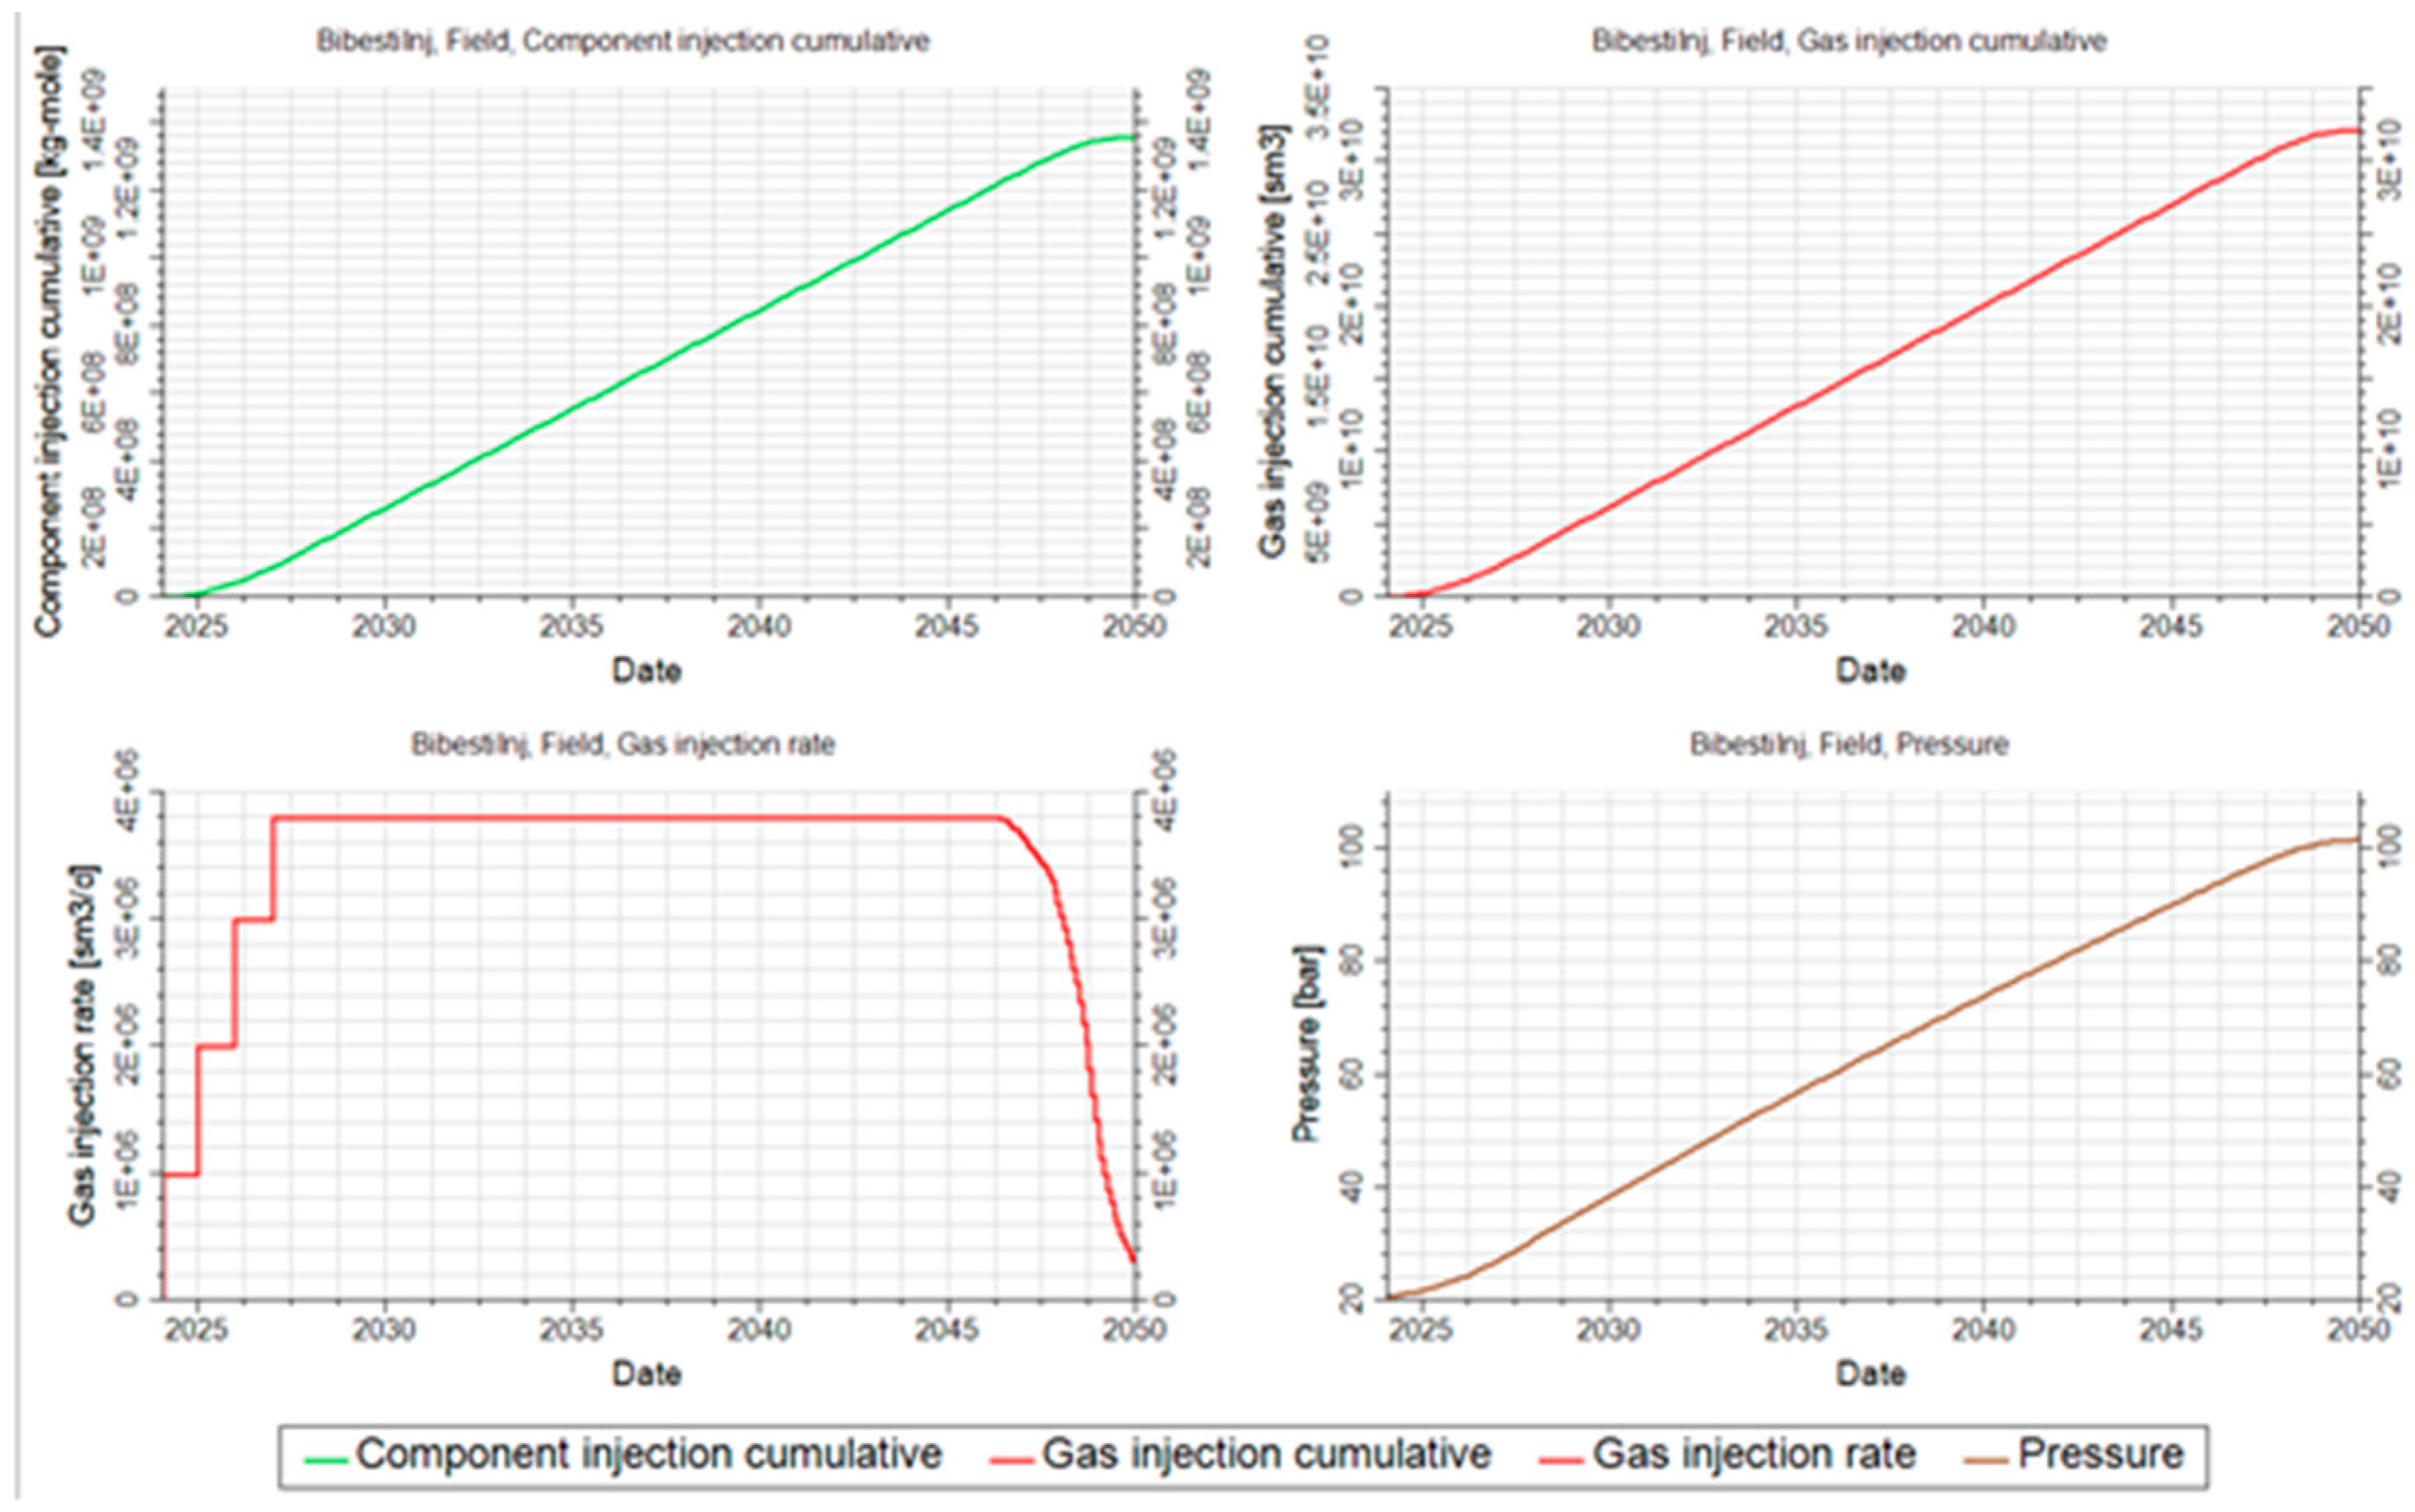
In this study, a gradual injection into the deposit was desired; more precisely, the injection will start with five wells and have five wells at the end of year 2025, five wells in the year 2026, and another four wells in the year 2027. All the wells have the same injection parameters: dynamic injection bottom hole pressure of 100 bar, an injection rate of 200,000 Sm3/day, and the injected fluid being carbon dioxide.
The injection profiles for the B1 well at the top of the structure are presented in
Figure 20, with the other wells having similar profiles. In the upper left quadrant well bottom hole pressure variation in time, in the upper right quadrant well gas injection cumulative, in the lower left quadrant well injection gas rate in time, in the lower right the reservoir volume injection rate is presented.
Adding up the individual wells’ injection profiles gives the injection behavior of the reservoir. This reservoir behavior is presented in
Figure 21. The upper left quadrant shows the field CO
2 component rate expressed in [kg-mole]; the upper right quadrant shows the cumulative well field gas injection; the lower left quadrant shows the field gas injection rate over time; the lower right shows the field pressure.
At the end of the injection cycle, in 2050, the final reservoir surface volume is 39.1 Bsm
3, indicating that a total injection of 32.21 Bsm
3 was achieved, as shown in
Figure 22.
As per the simulation and as presented in
Figure 23, the final pressure after CO
2 injection into the reservoir was 101 bar.
4. Discussion
Carbon capture, utilization, and storage (CCUS) is regarded as a highly effective approach for industries and regions to mitigate global climate change and often complements reducing energy poverty projects [
24]. The underground storage of carbon dioxide in geological formations, particularly those with existing infrastructure from previous hydrocarbon production, is especially appealing. This is because such fields already benefit from extensive research, equipment, and established site locations [
25,
26,
27,
28,
29].
However, widespread support is essential for the success of this method. Misinformation has created skepticism around such technologies, and it is crucial to educate the public on its advantages and disadvantages, with a particular focus on reassuring local communities about safety and health concerns [
30].
Mature and depleted hydrocarbon reservoirs located near major CO2 emitters, such as coal or hydrocarbon-burning power plants, fertilizer plants, and cement production facilities, are ideal candidates for carbon capture, utilization, and storage projects. This is exemplified by the Bibești-Bulbuceni reservoir and the Turceni Power Plant.
In the past, multiple conceptual studies have assessed the CO
2 storage potential for Romania’s depleted oil and gas fields, primarily at the basin level. In the Transylvanian Basin, depleted gas fields showed a total CO
2 storage capacity potential of approximately 2.30 Gt. Additional assessments covered multiple fields across South Romania, including sites in the Getic Basin (Bradu-Albota, Silistea, Babeni, Balteni), the Moesian Platform (Jugureanu-Odaieni, Oprisenesti, Ghercesti, Plopu), and the Pannonian Basin (Calacea, Satchinez, Turnu) [
31].
Our study takes a step forward by examining the Bibești-Bulbuceni hydrocarbon field on the Getic basin as a potential CO2 injection site for the nearby Turceni Power Plant. This research is conducted within the framework of carbon dioxide capture and storage (CCS), a critical solution for high-emitting CO2 industries to significantly reduce greenhouse gas emissions and combat climate change.
The limitation of our study is that its design does not allow detailed insight and reporting of the CO
2 storage mechanisms in geological formations. Carbon dioxide is sequestered through multiple mechanisms: physical containment via stratigraphic and structural features; hydrodynamic entrapment where CO
2 becomes molecularly immobilized in pore spaces; and geochemical processes involving dissolution and mineral reactions that can alter the reservoir’s permeability and mechanical characteristics [
32,
33,
34,
35]. Moreover, from a fluid perspective, currently, the injected stream is 100% CO
2. However, impurities, such as N
2 and SOx/NOx components, are often present in post-combustion streams. These presences could affect compressibility, miscibility, and rock interactions.
At this stage, our study validated the CO2 volumes that can be stored for the identified pair of the Turceni Power Plant/Bibești-Bulbuceni storage reservoir, and it has not investigated its economic feasibility.
Additionally, our study has heavily used data published in 1975 to describe the geological setting of the Bibești-Bulbuceni structure [
20]. Unfortunately, even though more recent structural and stratigraphic descriptions do exist, these are not part of the public domain, and the team did not have access to them. Hence, some uncertainties could be associated with static modelling.
The current work omits studying geomechanical evaluation of caprock integrity, fault reactivation risks, or upward CO2 migration. This itself is a complex study on its own, which normally complements this work. Currently, caprock integrity is considered; no fault reactivation was foreseen, which enables CO2 migration from the considered reservoir.
As recommendations, all the limitations mentioned above can be addressed in detail in a further iteration of the study.
5. Conclusions
This study was conceived and implemented to find a reliable solution to combat the negative effects of carbon dioxide emissions, primarily originating from industrial sources.
The capture and storage of carbon dioxide is increasingly seen as a viable future solution, enabling the continued use of fossil fuels with minimal environmental impact. In addition to significantly reducing carbon dioxide emissions, this method also offers benefits such as job creation and increased life expectancy.
While this solution is complex and requires in-depth studies for successful implementation, it also calls for investment and support from both large corporations and governments.
As EU countries strive for climate neutrality, this method could help any nation progress toward this goal, benefiting citizens with job opportunities, longer life spans, and a more sustainable future.
Romania has significant potential to be a key player in this field, with over 30 storage facilities in depleted hydrocarbons deposits, offering a total CO2 storage capacity exceeding 514 Mt. This growing interest from major companies to invest in such projects, despite the high costs, is driven by the desire to achieve climate neutrality and the rising price of carbon credits.
In line with the set research objective, through reservoir simulation modeling, our study evaluated the feasibility of capturing CO2 emissions from the Turceni Power Plant in Oltenia region, Romania, and permanently storing them via injection wells in the adjacent Meotian depleted hydrocarbon reservoirs of the Bibești-Bulbuceni field within the Getic Basin as a novelty.
The study results demonstrate that the Bibești-Bulbuceni depleted hydrocarbon reservoir near Turceni has the capacity to sequester approximately up to 32.21 Bsm3 or 60 MtCO2 through the proposed carbon capture system, with storage completion projected for 25 years under standard injection scenarios with up to 20 years under optimized injection plateau conditions.
The CO2 storage capacity of depleted hydrocarbon reservoirs in Romania’s Oltenia Region presents an opportunity to establish secure, long-term carbon sequestration projects for nearby power plants that currently generate electricity from coal combustion or may transition to hydrocarbon-based energy production.


 ,
, 


