


An Analysis of the Relationship Between ESG Activities and the Financial Performance of Japanese Companies Toward Sustainable Development


Abstract
1. Introduction
1.1. Background
1.2. Objectives and Framework of This Study
2. Literature Review and Hypotheses
3. Materials and Methods
3.1. Materials
3.2. Methods
4. Data
5. Results and Discussion
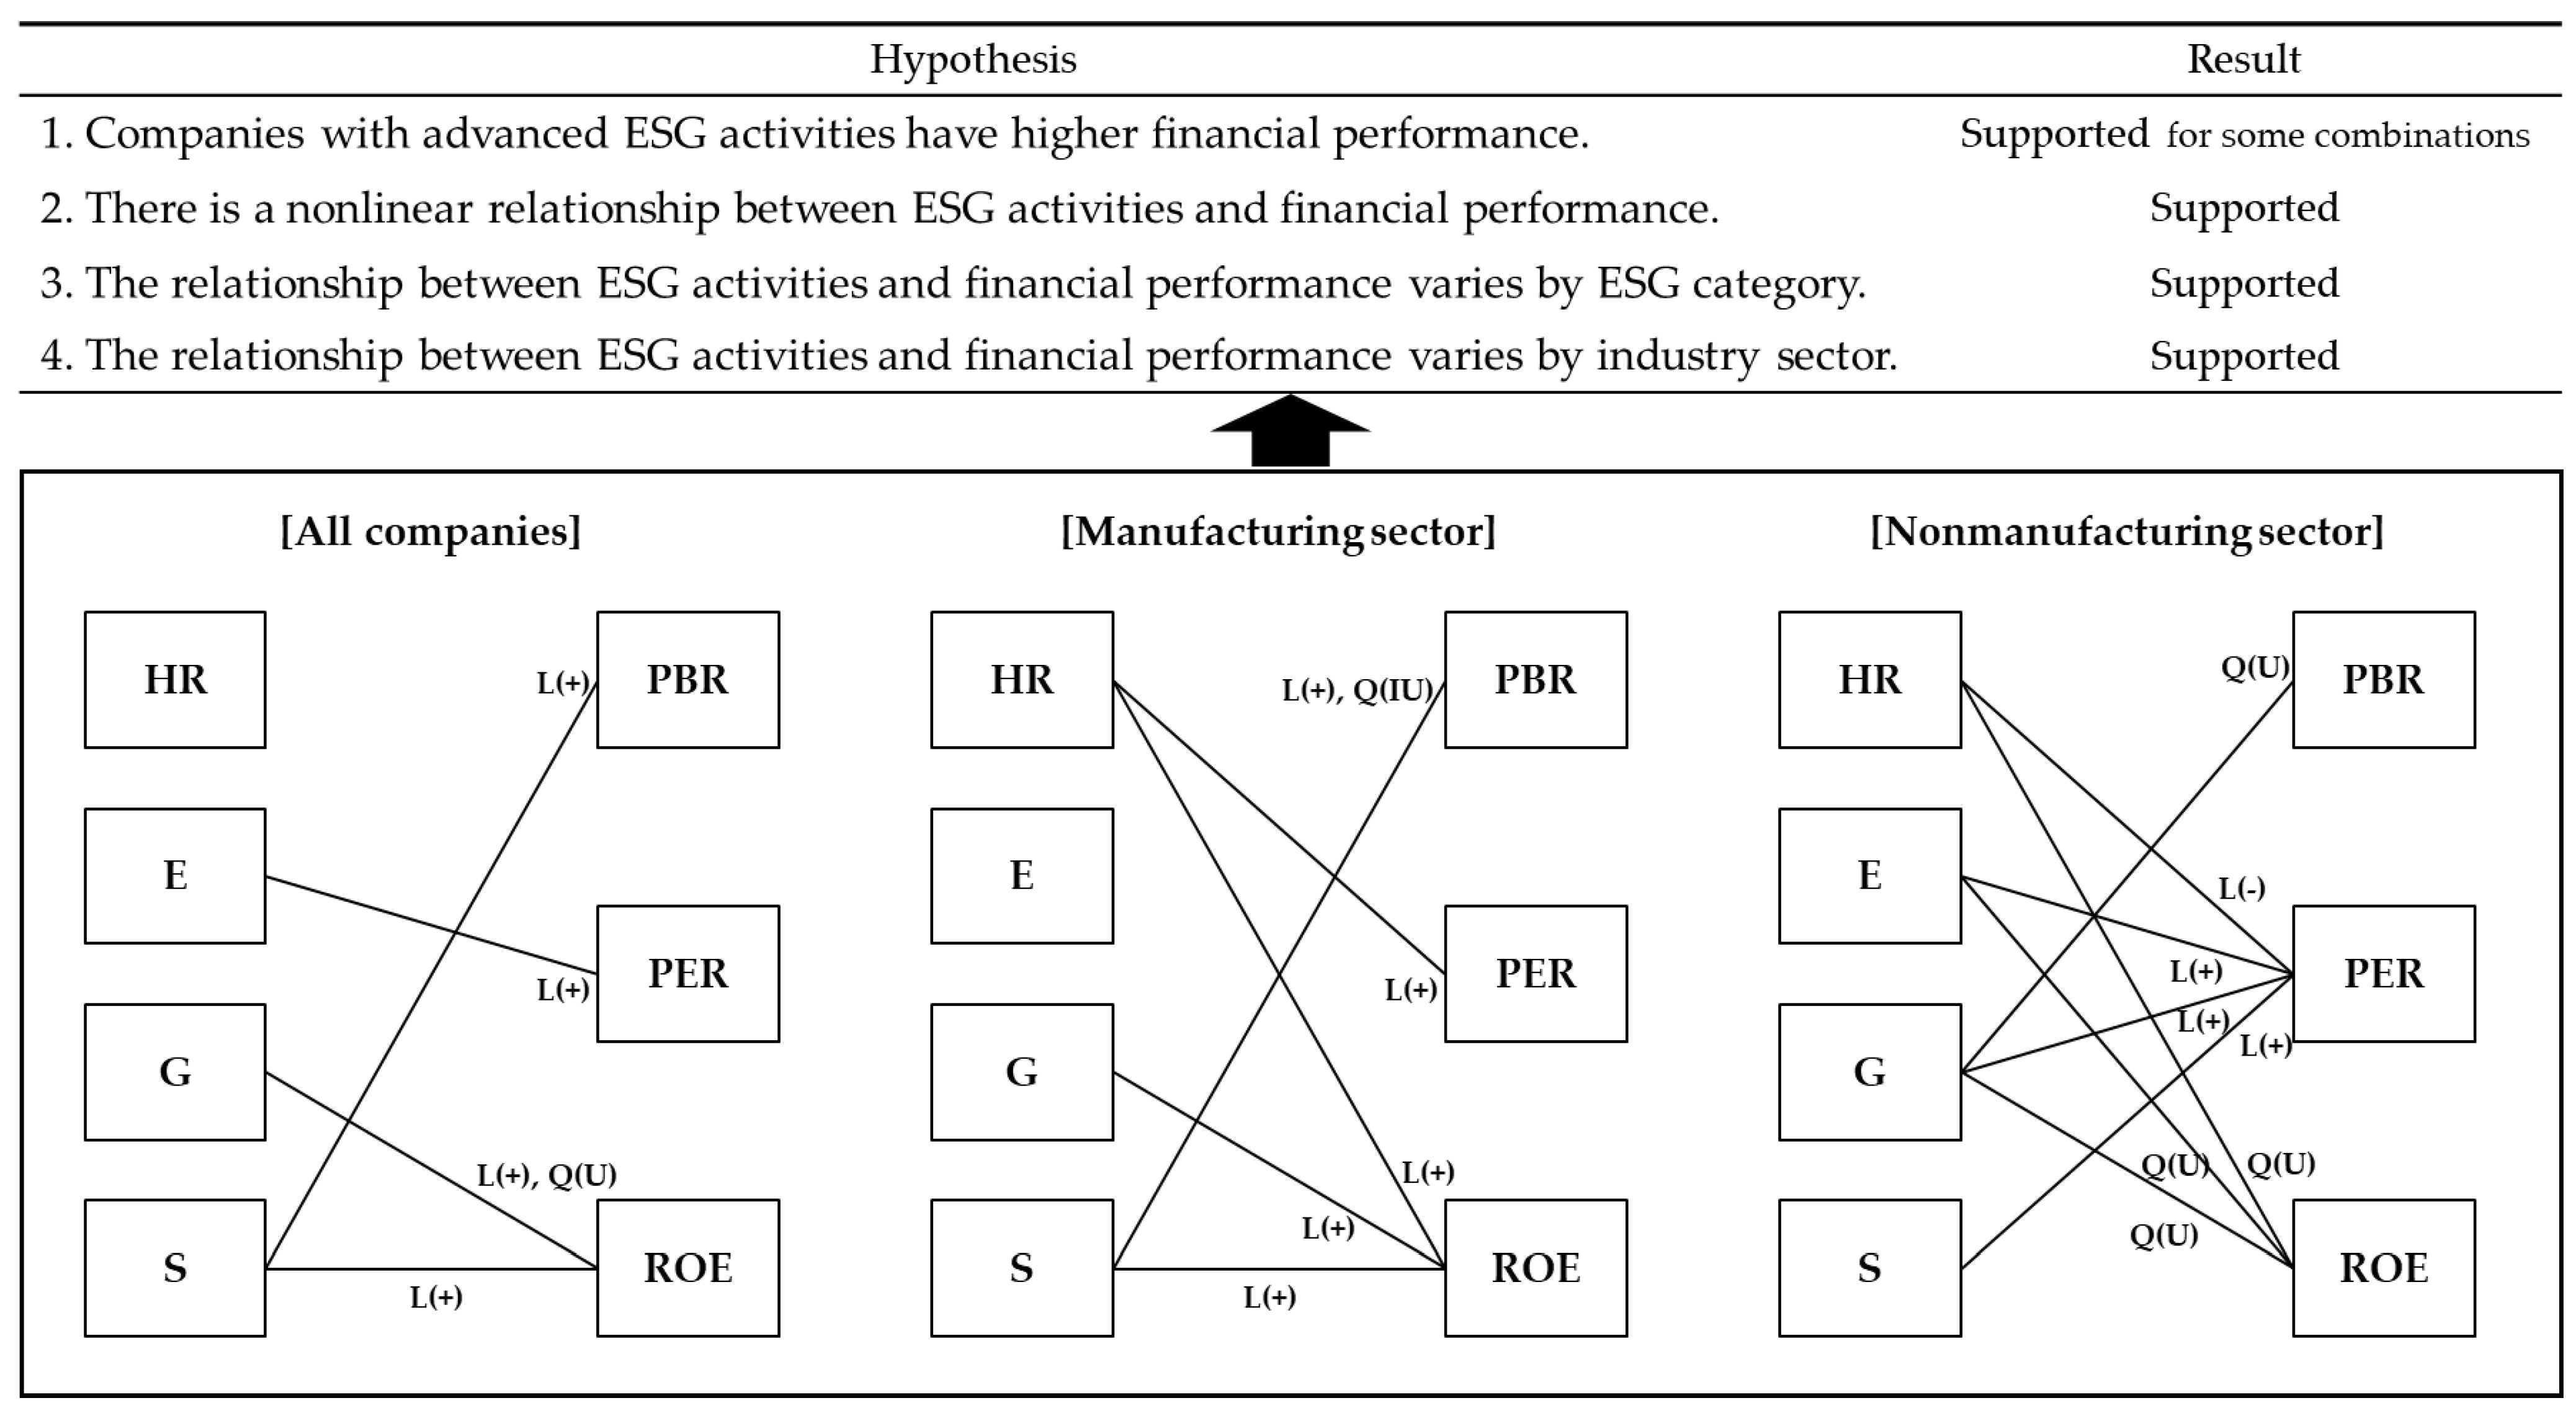
5.1. Results
5.1.1. All Companies
5.1.2. Manufacturing Sector
5.1.3. Nonmanufacturing Sector
5.1.4. Summary
5.2. Discussion
5.2.1. Relationship Between ESG Activities and Financial Performance
5.2.2. Research Limitations and Further Topics
6. Conclusions
Author Contributions
Funding
Institutional Review Board Statement
Informed Consent Statement
Data Availability Statement
Conflicts of Interest
Appendix A

| CSR Rating | HR | E | G | S | ||||||||
|---|---|---|---|---|---|---|---|---|---|---|---|---|
| Financial Indicator | PBR | PER | ROE | PBR | PER | ROE | PBR | PER | ROE | PBR | PER | ROE |
| Model | FE | FE | FE | FE | RE | RE | FE | FE | RE | FE | FE | RE |
| COEF | 0.012 (0.261) | −0.854 (−0.308) | −0.309 (−0.835) | 0.053 (1.179) | 4.232 *** (3.051) | 0.345 (1.358) | 0.062 (1.470) | 0.237 (0.085) | 0.675 *** (3.015) | 0.089 * (1.713) | −0.448 (−0.638) | 0.715 *** (2.747) |
| Ln(Emp) | −0.188 *** (−3.408) | 0.936 (0.118) | 1.586 ** (2.280) | −0.189 *** (−3.444) | −3.395 *** (−3.377) | 0.642 *** (3.807) | −0.188 *** (−3.446) | 0.948 (0.119) | 0.581 *** (3.666) | −0.186 *** (−3.366) | 0.942 (0.119) | 0.522 *** (2.900) |
| CER | −0.001 * (−1.895) | −0.047 (−1.499) | 0.009 * (1.874) | −0.001 * (−1.949) | −0.004 *** (−2.374) | 0.001 *** (3.171) | −0.001 * (−1.922) | −0.047 (−1.495) | 0.001 *** (2.987) | −0.001 * (−1.922) | −0.047 (−1.495) | 0.001 *** (2.956) |
| EM | 0.035 ** (2.204) | 0.486 (0.687) | 0.145 (1.137) | 0.035 ** (2.219) | −0.322 (−0.635) | 0.097 (0.841) | 0.034 ** (2.187) | 0.483 (0.686) | 0.094 (0.818) | 0.035 ** (2.207) | 0.485 (0.686) | 0.096 (0.842) |
| Constant | 2.943 *** (6.716) | 19.203 (0.341) | −3.111 (−0.606) | 2.842 *** (6.712) | 34.553 *** (5.591) | 2.164 * (1.913) | 2.810 *** (6.784) | 16.071 (0.284) | 1.680 (1.471) | 2.722 *** (6.463) | 18.011 (0.313) | 1.990 * (1.801) |
| Adjusted R2 | 0.811 | 0.292 | 0.449 | 0.811 | 0.008 | 0.015 | 0.812 | 0.292 | 0.020 | 0.812 | 0.292 | 0.018 |
| CSR Rating | HR | E | G | S | ||||||||
|---|---|---|---|---|---|---|---|---|---|---|---|---|
| Financial Indicator | PBR | PER | ROE | PBR | PER | ROE | PBR | PER | ROE | PBR | PER | ROE |
| Model | FE | - | FE | FE | - | FE | FE | - | RE | FE | - | RE |
| COEF_L | 0.111 (0.784) | - | −1.234 (−1.067) | 0.138 (0.845) | - | 1.293 (0.982) | −0.056 (−0.332) | - | −2.316 ** (−2.045) | 0.174 (1.252) | - | −1.197 (−1.201) |
| COEF_Q | −0.018 (−0.678) | - | 0.168 (0.744) | −0.015 (−0.510) | - | −0.211 (−0.869) | 0.021 (0.673) | - | 0.535 ** (2.566) | −0.016 (−0.561) | - | 0.352 * (1.868) |
| Ln(Emp) | −0.188 *** (−3.411) | - | 1.587 ** (2.278) | −0.190 *** (−3.448) | - | 1.584 ** (2.290) | −0.189 *** (−3.441) | - | 0.590 *** (3.715) | −0.187 *** (−3.378) | - | 0.516 *** (2.856) |
| CER | −0.001 * (−1.887) | - | 0.009 * (1.865) | −0.001 * (−1.958) | - | 0.009 * (1.852) | −0.001 * (−1.911) | - | 0.001 *** (2.838) | −0.001 * (−1.924) | - | 0.001 *** (2.814) |
| EM | 0.035 ** (2.199) | - | 0.145 (1.139) | 0.035 ** (2.222) | - | 0.146 (1.140) | 0.034 ** (2.190) | - | 0.094 (0.811) | 0.035 ** (2.229) | - | 0.093 (0.821) |
| Constant | 2.820 *** (5.965) | - | −1.956 (−0.372) | 2.738 *** (6.351) | - | −5.751 (−1.107) | 2.965 *** (6.313) | - | 5.378 *** (3.316) | 2.621 *** (6.154) | - | 4.344 *** (2.706) |
| Adjusted R2 | 0.811 | - | 0.449 | 0.811 | - | 0.449 | 0.812 | - | 0.022 | 0.812 | - | 0.020 |
| Turning point | N.S. | - | N.S. | N.S. | - | N.S. | N.S. | - | 2.16 | N.S. | - | N.S. |
| Mean | 2.79 | |||||||||||
| CSR Rating | HR | E | G | S | ||||||||
|---|---|---|---|---|---|---|---|---|---|---|---|---|
| Financial Indicator | PBR | PER | ROE | PBR | PER | ROE | PBR | PER | ROE | PBR | PER | ROE |
| Model | FE | RE | RE | FE | FE | RE | FE | FE | RE | FE | FE | RE |
| COEF | 0.026 (0.491) | 6.772 *** (3.580) | 0.593 * (1.843) | 0.053 (0.848) | 4.843 (1.258) | 0.448 (1.383) | 0.065 (1.276) | −1.752 (−0.474) | 0.554 * (1.915) | 0.118 * (1.809) | −4.010 (−0.966) | 1.097 *** (3.101) |
| Ln(Emp) | −0.218 ** (−2.454) | −4.003 *** (−2.647) | 1.096 *** (5.089) | −0.219 ** (−2.452) | 5.079 (0.400) | 1.130 *** (5.151) | −0.217 ** (−2.443) | 5.082 (0.404) | 1.109 *** (5.261) | −0.220 ** (−2.446) | 5.172 (0.410) | 0.896 *** (3.101) |
| CER | −0.002 ** (−2.284) | −0.040 * (−1.723) | 0.009 *** (3.206) | −0.002 ** (−2.285) | −0.065 (−1.092) | 0.010 *** (3.309) | −0.002 ** (−2.258) | −0.067 (−1.139) | 0.010 *** (3.265) | −0.002 ** (−2.312) | −0.067 (−1.130) | 0.009 *** (2.950) |
| EM | 0.043 ** (2.191) | −0.014 (−0.024) | 0.075 (0.531) | 0.044 ** (2.202) | 0.236 (0.317) | 0.071 (0.504) | 0.043 ** (2.182) | 0.219 (0.293) | 0.072 (0.511) | 0.044 ** (2.190) | 0.203 (0.274) | 0.072 (0.528) |
| Constant | 3.170 *** (4.425) | 32.161 *** (3.224) | −2.492 * (−1.670) | 3.090 *** (4.310) | −27.307 ((−0.296) | −2.361 (−1.584) | 3.049 *** (4.382) | −7.602 (−0.083) | −2.480 * ((−1.668) | 2.912 *** (4.362) | −1.549 ((−0.017) | −2.524 * (−1.740) |
| Adjusted R2 | 0.797 | 0.012 | 0.042 | 0.797 | 0.283 | 0.039 | 0.797 | 0.283 | 0.041 | 0.797 | 0.283 | 0.045 |
| CSR Rating | HR | E | G | S | ||||||||
|---|---|---|---|---|---|---|---|---|---|---|---|---|
| Financial Indicator | PBR | PER | ROE | PBR | PER | ROE | PBR | PER | ROE | PBR | PER | ROE |
| Model | - | - | - | FE | - | - | - | - | - | FE | - | - |
| COEF_L | - | - | - | 0.187 (0.510) | - | - | - | - | - | 0.678 *** (2.928) | - | - |
| COEF_Q | - | - | - | −0.022 (−0.369) | - | - | - | - | - | −0.096 ** (−2.463) | - | - |
| Ln(Emp) | - | - | - | −0.218 ** (−2.460) | - | - | - | - | - | −0.219 ** (−2.436) | - | - |
| CER | - | - | - | −0.002 ** (−2.296) | - | - | - | - | - | −0.002 ** (−2.319) | - | - |
| EM | - | - | - | 0.044 ** (2.219) | - | - | - | - | - | 0.045 ** (2.259) | - | - |
| Constant | - | - | - | 2.900 *** (3.606) | - | - | - | - | - | 2.153 *** (3.049) | - | - |
| Adjusted R2 | - | - | - | 0.797 | - | - | - | - | - | 0.798 | - | - |
| Turning point | - | - | - | N.S. | - | - | - | - | - | 3.53 | - | - |
| Mean | 2.93 | |||||||||||
| CSR Rating | HR | E | G | S | ||||||||
|---|---|---|---|---|---|---|---|---|---|---|---|---|
| Financial Indicator | PBR | PER | ROE | PBR | PER | ROE | PBR | PER | ROE | PBR | PER | ROE |
| Model | FE | FE | RE | RE | RE | RE | FE | RE | RE | FE | RE | RE |
| COEF | −0.004 (−0.053) | −8.638 * (−1.907) | 0.228 (0.528) | 0.067 (1.282) | 4.170 * (1.937) | 0.402 (0.953) | 0.050 (0.714) | 7.027 *** (2.968) | 0.802 (2.233) | 0.046 (0.571) | 9.383 *** (3.665) | 0.295 (0.790) |
| Ln(Emp) | −0.205 *** (−2.665) | −4.958 (−0.539) | 0.365 (1.491) | −0.101 * (−1.932) | −3.975 *** (−3.461) | 0.309 (1.230) | −0.206 *** (−2.695) | −4.215 *** (−3.792) | 0.263 (1.103) | −0.203 ** (−2.589) | −5.528 *** (3.665) | 0.336 (1.251) |
| CER | −0.000 (−0.962) | −0.030 (−1.101) | 0.001 ** (2.352) | −0.000 (−1.463) | −0.003 *** (−3.165) | 0.001 ** (2.172) | −0.000 (−1.007) | −0.004 *** (−3.373) | 0.000 * (1.663) | −0.000 (−0.975) | −0.005 *** (−3.824) | 0.001 ** (2.143) |
| EM | 0.022 (0.841) | 0.893 (0.623) | 0.099 (0.488) | 0.024 (0.912) | −0.533 (−0.574) | 0.104 (0.517) | 0.021 (0.825) | −0.631 (0.712) | 0.096 (0.484) | 0.022 (0.841) | −0.647 (0.718) | 0.101 (0.504) |
| Constant | 3.027 *** (5.398) | 78.141 (1.224) | 4.999 *** (2.807) | 2.125 *** (5.711) | 39.298 *** (5.082) | 4.971 *** (2.836) | 2.892 *** (5.453) | 33.144 (4.096) | 4.208 ** (2.333) | 2.879 *** (4.890) | 36.650 *** (4.891) | 5.047 *** (2.954) |
| Adjusted R2 | 0.836 | 0.308 | 0.004 | −0.003 | 0.009 | 0.005 | 0.836 | 0.018 | 0.010 | 0.836 | 0.026 | −0.002 |
| CSR rating | HR | E | G | S | ||||||||
|---|---|---|---|---|---|---|---|---|---|---|---|---|
| Financial Indicator | PBR | PER | ROE | PBR | PER | ROE | PBR | PER | ROE | PBR | PER | ROE |
| Model | - | - | RE | RE | - | RE | RE | - | RE | - | - | - |
| COEF_L | - | - | −2.059 * (−1.882) | -0.010 (-0.062) | - | −2.731 (−1.635) | −0.416 * (−1.714) | - | −3.953 ** (−2.436) | - | - | - |
| COEF_Q | - | - | 0.429 * (1.895) | 0.015 (0.465) | - | 0.602 * (1.870) | 0.097 ** (1.973) | - | 0.873 *** (2.807) | - | - | - |
| Ln(Emp) | - | - | 0.347 (1.424) | −0.100 * (−1.923) | - | 0.323 (1.293) | −0.102 ** (−1.994) | - | 0.284 (1.186) | - | - | - |
| CER | - | - | 0.001 ** (1.965) | −0.000 (−1.500) | - | 0.001 * (1.821) | −0.000 (−1.643) | - | 0.000 (1.494) | - | - | - |
| EM | - | - | 0.090 (1.199) | 0.024 (0.916) | - | 0.104 (0.514) | 0.023 (0.893) | - | 0.082 (0.410) | - | - | - |
| Constant | - | - | 7.866 *** (3.784) | 2.206 *** (5.560) | - | 8.481 (3.392) | 2.652 *** (5.567) | - | 9.870 *** (4.224) | - | - | - |
| Adjusted R2 | - | - | 0.007 | −0.002 | - | 0.012 | 0.020 | - | 0.017 | - | - | - |
| Turning point | - | - | 2.40 | N.S. | - | N.S. | 2.14 | - | 2.26 | - | - | - |
| Mean | 2.64 | 2.61 | 2.61 | |||||||||
| CSR Rating | HR | E | G | S | |||||||||
|---|---|---|---|---|---|---|---|---|---|---|---|---|---|
| Financial Data | PBR | PER | ROE | PBR | PER | ROE | PBR | PER | ROE | PBR | PER | ROE | |
| Linear | Model | FE | RE | FE | FE | RE | RE | FE | RE | RE | FE | RE | RE |
| COEF | −0.033 (−0.520) | 7.064 *** (4.070) | −0.166 (−0.309) | 0.005 (0.112) | 3.083 * (1.941) | 0.493 (1.464) | 0.036 (0.757) | 5.809 *** (3.992) | 0.695 ** (2.082) | −0.018 (−0.250) | 8.845 *** (5.387) | 0.813 ** (2.489) | |
| Adjusted R2 | 0.886 | 0.017 | 0.613 | 0.886 | 0.006 | 0.019 | 0.886 | 0.013 | 0.023 | 0.886 | 0.024 | 0.025 | |
| Quad -ratic | Model | FE | - | - | FE | - | RE | FE | - | RE | FE | - | - |
| COEF_L | 0.071 (0.418) | - | - | −0.042 (−0.251) | - | −1.668 (−0.994) | 0.125 (0.698) | - | −2.579 (−1.635) | 0.196 (1.251) | - | - | |
| COEF_Q | −0.018 (−0.552) | - | - | 0.008 (0.266) | - | 0.392 (1.293) | −0.016 (−0.531) | - | 0.585 ** (2.027) | −0.040 (−1.111) | - | - | |
| Adjusted R2 | 0.886 | - | - | 0.886 | - | 0.021 | 0.886 | - | 0.026 | 0.886 | - | - | |
| Turning point | - | - | - | - | - | - | - | - | - | - | - | - | |
| Mean | |||||||||||||
| CSR Rating | HR | E | G | S | |||||||||
|---|---|---|---|---|---|---|---|---|---|---|---|---|---|
| Financial Data | PBR | PER | ROE | PBR | PER | ROE | PBR | PER | ROE | PBR | PER | ROE | |
| Linear | Model | FE | RE | FE | FE | FE | FE | FE | RE | FE | FE | RE | FE |
| COEF | −0.008 (−0.115) | 4.885 ** (2.213) | 0.297 (0.412) | −0.038 (−0.581) | −11.524 * (−1.723) | −0.023 (−0.023) | 0.014 (0.240) | 5.487 *** (3.075) | −0.161 (−0.207) | 0.083 (1.058) | 9.875 *** (4.343) | −0.359 (−0.310) | |
| Adjusted R2 | 0.877 | 0.012 | 0.602 | 0.877 | 0.435 | 0.602 | 0.877 | 0.013 | 0.602 | 0.877 | 0.027 | 0.602 | |
| Quad -ratic | Model | - | - | - | FE | - | - | - | - | - | FE | - | - |
| COEF_L | - | - | - | −0.329 (−0.826) | - | - | - | - | - | 0.442 * (1.714) | - | - | |
| COEF_Q | - | - | - | 0.049 (0.720) | - | - | - | - | - | −0.061 (−1.472 | - | - | |
| Adjusted R2 | - | - | - | 0.877 | - | - | - | - | - | 0.877 | - | - | |
| Turning point | - | - | - | - | - | - | - | - | - | - | - | - | |
| Mean | |||||||||||||
| CSR Rating | HR | E | G | S | |||||||||
|---|---|---|---|---|---|---|---|---|---|---|---|---|---|
| Financial Data | PBR | PER | ROE | PBR | PER | ROE | PBR | PER | ROE | PBR | PER | ROE | |
| Linear | Model | FE | FE | RE | RE | FE | RE | RE | FE | RE | FE | FE | RE |
| COEF | −0.074 (−0.582) | 18.25 ** (2.536) | 0.564 (1.095) | 0.078 (1.510) | 6.469 (1.335) | 0.915 (1.628) | 0.134 ** (2.257) | 4.657 (0.850) | 0.790 (1.384) | −0.125 (−1.015) | −3.898 (−0.798) | 0.755 (1.582) | |
| Adjusted R2 | 0.904 | 0.487 | 0.008 | −0.002 | 0.479 | 0.008 | 0.016 | 0.479 | 0.009 | 0.904 | 0.478 | 0.009 | |
| Quad -ratic | Model | - | - | - | RE | - | RE | - | - | RE | - | - | - |
| COEF_L | - | - | - | −0.257 (−1.499) | - | −1.379 (−0.636) | - | - | −1.936 (−0.706) | - | - | - | |
| COEF_Q | - | - | - | 0.066 * (1.921) | - | 0.442 (1.029) | - | - | 0.497 (0.957) | - | - | - | |
| Adjusted R2 | - | - | - | 0.006 | - | 0.011 | - | - | 0.014 | - | - | - | |
| Turning point | - | - | - | - | - | - | - | - | - | - | - | - | |
| Mean | |||||||||||||
References
- United Nations. Transforming Our World: The 2030 Agenda for Sustainable Development; A/RES/70/1; United Nations: New York, NY, USA, 2015; Volume 16301. [Google Scholar]
- GSI-Alliance. Global Sustainabile Investment Review 2022. Available online: https://www.gsi-alliance.org/wp-content/uploads/2023/12/GSIA-Report-2022.pdf (accessed on 29 March 2025).
- PRI. Annual Report 2024. Available online: https://www.unpri.org/about-us/about-the-pri/annual-report#storytext-end (accessed on 29 March 2025).
- Teja, K.R.; Liu, C.-M. ESG investing: A statistically valid approach to data-driven decision making and the impact of ESG factors on stock returns and risk. IEEE Access 2024, 12, 69434–69444. [Google Scholar] [CrossRef]
- TCFD. Recommendations of the Task Force on Climate-Related Financial Disclosures. Available online: https://assets.bbhub.io/company/sites/60/2021/10/FINAL-2017-TCFD-Report.pdf (accessed on 29 March 2025).
- TNFD. Recommendations of the Task Force on Nature-Related Financial Disclosures. Available online: https://tnfd.global/wp-content/uploads/2023/08/Recommendations_of_the_Taskforce_on_Nature-related_Financial_Disclosures_September_2023.pdf (accessed on 29 March 2025).
- PR Newswire US. Launch of the Taskforce on Inequality and Social-Related Financial Disclosures (TISFD). Available online: https://www.prnewswire.com/news-releases/launch-of-the-taskforce-on-inequality-and-social-related-financial-disclosures-tisfd-302254978.html (accessed on 29 March 2025).
- European Union. Directive (EU) 2022/2464 of the European Parliament and of the Council of 14 December 2022 Amending Regulation (EU) No 537/2014, Directive 2004/109/EC, Directive 2006/43/EC and Directive 2013/34/EU, as Regards Corporate Sustainability Reporting (Text with EEA Relevance); European Union: Brussels, Belgium, 2022. [Google Scholar]
- Sato, S. Current status and challenges of sustainability reporting in the EU: Focusing on the corporate sustainability reporting directive (CSRD). Doshisha Bus. Rev. 2023, 75, 277–292. [Google Scholar]
- Lagasio, V. ESG-washing detection in corporate sustainability reports. Int. Rev. Financ. Anal. 2024, 96, 103742. [Google Scholar] [CrossRef]
- Attig, N.; Boshanna, A. ESG washing: When cheap talk is not cheap! S P Glob. Mark. Intell. 2023. [Google Scholar] [CrossRef]
- GPIF. ESG Report 2023. Available online: https://www.gpif.go.jp/en/investment/GPIF_ESGReport_FY2023_E_02.pdf (accessed on 29 March 2025).
- SSBJ. About SSBJ Standards. Available online: https://www.ssb-j.jp/jp/wp-content/uploads/sites/7/20250305_e.pdf (accessed on 15 June 2025).
- METI, Japan. Guidance for Integrated Corporate Disclosure and Company-Investor Dialogue for Collaborative value Creation 2.0. Available online: https://www.meti.go.jp/policy/economy/keiei_innovation/kigyoukaikei/guidance_for_collaborative_value_creation_2.0_en.pdf (accessed on 29 March 2025).
- KPMG International. The Move to Mandatory Reporting: Survey of Sustainaility Reporting 2024. Available online: https://assets.kpmg.com/content/dam/kpmgsites/uk/pdf/2024/11/survey-of-sustainability-reporting.pdf (accessed on 15 June 2025).
- IFRS Foundation. International <IR> Framework. Available online: https://integratedreporting.ifrs.org/wp-content/uploads/2024/08/IntegratedReporting_Framework_061024.pdf (accessed on 29 March 2025).
- PwC Japan. The Current State of Value Creation Stories in Japanese Integrated Reports. Available online: https://www.pwc.com/jp/ja/knowledge/column/sustainability-disclosure/value-creation-story.html (accessed on 19 May 2025).
- Toyo Keizai Inc. CSR Companies Complete Guide; Toyo Keizai Inc.: Tokyo, Japan, 2020. [Google Scholar]
- Porter, M.E.; Kramer, M.R. Creating Shared Value; Harvard Business Review Press: Boston, MA, USA, 2011; Volume 89, pp. 62–77. [Google Scholar]
- Paulman, P.; Winston, A. Net Positive: How Courageous Companies Thrive by Giving More Than They Take; Harvard Business Review Press: Boston, MA, USA, 2021. [Google Scholar]
- Freeman, R.E. The politics of stakeholder theory: Some future directions. In R. Edward Freeman’s Selected Works on Stakeholder Theory and Business Ethics; Springer International Publishing: Cham, Switzerland, 1994; Volume 53, pp. 119–132. [Google Scholar]
- Kong, L.; Akbar, M.; Poulova, P. The role of environment, social, and governance performance in shaping corporate current and future value: The case of global tech leaders. Sustainability 2023, 15, 13114. [Google Scholar] [CrossRef]
- Branco, M.; Rodrigues, L. Corporate social responsibility and resource-based perspectives. J. Bus. Ethics 2006, 69, 111–132. [Google Scholar] [CrossRef]
- Freeman, R.E.; Dmytriyev, S.D.; Phillips, R.A. Stakeholder theory and the resource-based view of the firm. J. Manag. 2021, 47, 1757–1770. [Google Scholar] [CrossRef]
- Ikuta, T.; Fujii, H. Reserch perspective of ESG management and corporate non-financial information disclosure. Rev. Environ. Econ. Policy Stud. 2020, 13, 44–56. (In Japanese) [Google Scholar]
- Jung, H. The moderating effect of board characteristics in the relationship between ESG and corporate financial performance. Stud. Bus. Econ. 2024, 19, 110–119. [Google Scholar] [CrossRef]
- Tanahashi, K. Current status and challenges of studies for ESG investment and non-financial information: Consideration from literature review. HUE J. Econ. Bus. 2022, 45, 13–28. [Google Scholar]
- Whelan, T.; Atz, U.; Clark, C. ESG and Financial Performance: Uncovering Therelation-Ship by Aggregating Evidence from 1000 Plus Studies Published Between 2015–2020. NYU Stern. Centre for Sustainable Business. Available online: https://www.stern.nyu.edu/experience-stern/about/departments-centers-initiatives/centers-of-research/center-sustainable-business/research/research-initiatives/esg-and-financial-performance (accessed on 29 March 2025).
- Chen, S.; Song, Y.; Gao, P. Environmental, social, and governance (ESG) performance and financial outcomes: Analyzing the impact of ESG on financial performance. J. Environ. Manag. 2023, 345, 118829. [Google Scholar] [CrossRef] [PubMed]
- Gawęda, A. Does environmental, social, and governance performance elevate firm value? Financ. Res. Lett. 2025, 73, 106639. [Google Scholar] [CrossRef]
- Li, Y.; Gong, M.; Zhang, X.-Y.; Koh, L. The impact of environmental, social, and governance disclosure on firm value: The role of CEO power. Br. Account. Rev. 2018, 50, 60–75. [Google Scholar] [CrossRef]
- Jo, H.; Harjoto, M.A. The causal effect of corporate governance on corporate social responsibility. J. Bussiness Ethics 2012, 106, 53–72. [Google Scholar] [CrossRef]
- Ahmed, O.; Abu Khalaf, B. The impact of ESG on firm value: The moderating role of cash holdings. Heliyon 2025, 11, e41868. [Google Scholar] [CrossRef]
- Kuang, W. Reexamining ownership structure, ESG engagements, and corporate financial performance: The nonlinear relationship in Japan. Osaka Econ. Pap. 2022, 72, 1–26. [Google Scholar]
- Nollet, J.; Filis, G.; Mitrokostas, E. Corporate social responsibility and financial performance: A non-linear and disaggregated approach. Econ. Model. 2016, 52, 400–407. [Google Scholar] [CrossRef]
- Bruna, M.G.; Loprevite, S.; Raucci, D.; Ricca, B.; Rupo, D. Investigating the marginal impact of ESG results on corporate financial performance. Financ. Res. Lett. 2022, 47, 102828. [Google Scholar] [CrossRef]
- Zhang, Y.; Xiong, T. More ESG practices, higher financial performance? The U-shaped pattern in China’s agricultural and food firms. Agribusiness 2024, 1–12. [Google Scholar] [CrossRef]
- Bhandari, K.R.; Ranta, M.; Salo, J. The resource-based view, stakeholder capitalism, ESG, and sustainable competitive advantage: The firm’s embeddedness into ecology, society, and governance. Bus. Strategy Environ. 2022, 31, 1525–1537. [Google Scholar] [CrossRef]
- Xie, J.; Nozawa, W.; Yagi, M.; Fujii, H.; Managi, S. Do environmental, social, and governance activities improve corporate financial performance? Bus. Strategy Environ. 2018, 28, 286–300. [Google Scholar] [CrossRef]
- Meier, O.; Naccache, P.; Schier, G. Exploring the curvature of the relationship between HRM–CSR and corporate financial performance. J. Bus. Ethics 2021, 170, 857–873. [Google Scholar] [CrossRef]
- Ming, K.L.Y.; Vaicondam, Y.; Mustafa, A.M.A.A.; Roslan, S.N.M.; Yi, S.; Chopra, K.; Khanna, P. ESG integration and financial performance: Evidence from Malaysia’s leading companies. Int. J. Energy Econ. Policy 2024, 14, 487–494. [Google Scholar] [CrossRef]
- Velte, P. Does ESG performance have an impact on financial performance? Evidence from Germany. J. Glob. Responsib. 2017, 8, 169–178. [Google Scholar] [CrossRef]
- Lee, L.-C.; Lau, W.-Y.; Yip, T.-M. Do environmental, social and corporate governance practices enhance malaysian public-listed companies performance? J. Inst. Econ. 2023, 15, 5–32. [Google Scholar] [CrossRef]
- Aydoğmuş, M.; Gülay, G.; Ergun, K. Impact of ESG performance on firm value and profitability. Borsa Istanb. Rev. 2022, 22, S119–S127. [Google Scholar] [CrossRef]
- Wang, S. The respective relationship between environmental, social, governance and financial performance. Adv. Econ. Manag. Political Sci. 2024, 115, 107–111. [Google Scholar] [CrossRef]
- Doğan, M.; Komath, M.A.C.; Sayılır, Ö.; Çimen, E. Prediction of market value of firms with corporate sustainability performance data using machine learning models. Financ. Res. Lett. 2025, 77, 107085. [Google Scholar] [CrossRef]
- Ikuta, T.; Fujii, H. An analysis of the progress of Japanese companies’ commitment to the SDGs and their economic systems and social activities for communities. Sustainability 2022, 14, 4833. [Google Scholar] [CrossRef]
- Brogi, M.; Lagasio, V. Environmental, social, and governance and company profitability: Are financial intermediaries different? Corp. Soc. Responsib. Environ. Manag. 2018, 26, 576–587. [Google Scholar] [CrossRef]
- Tokyo Stock Exchange, I. Action to Implement Management That Is Conscious of Cost of Capital and Stock Price. Available online: https://www.jpx.co.jp/english/news/1020/dreu250000004n19-att/dreu250000004n8s.pdf (accessed on 29 March 2025).
- Yanagi, R. CFO Policy; Chuokeizai-Sha Holdings Inc.: Tokyo, Japan, 2020. [Google Scholar]
- Porter, M.E. America’s green strategy. Sci. Am. 1991, 264, 168. [Google Scholar] [CrossRef]
- Ito, Y.; Urashima, K. Porter hypothesis and green innovation. Kagakugijutsu Doko 2013, 134, 30–39. (In Japanese) [Google Scholar]
- Becker, B.E.; Huselid, M.A. Strategic human resources management: Where do we go from here? J. Manag. 2006, 32, 898–925. [Google Scholar] [CrossRef]
- Japan Exchange Group. Data & Statitics. Available online: https://www.jpx.co.jp/english/markets/statistics-equities/misc/04.html (accessed on 29 March 2025).
- Chau, L.; Anh, L.; Duc, V. Valuing ESG: How financial markets respond to corporate sustainability. Int. Bus. Rev. 2025, 34, 102418. [Google Scholar] [CrossRef]
- Rojo-Suárez, J.; Alonso-Conde, A.B. Short-run and long-run effects of ESG policies on value creation and risk. Econ. Anal. Policy 2023, 77, 599–616. [Google Scholar] [CrossRef]
- Bagh, T.; Fuwei, J.; Khan, M.A. Corporate ESG investments and Firm’s value under the real-option framework: Evidence from two world-leading economies. Borsa Istanb. Rev. 2024, 24, 324–340. [Google Scholar] [CrossRef]
- METI. Report of the Study Group on Improvement of Sustainable Corporate Value and Human Capital. Japan. Available online: https://www.meti.go.jp/policy/economy/jinteki_shihon/pdf/20200930_1e.pdf (accessed on 29 March 2025).
- Teubler, J. Logic Model for Environmental, Social, and Governance (Esg) Impact Pathways and Assessments; University of Duisburg: Essen, Germany, 2024. [Google Scholar]
- Rouen, E.; Serafeim, G. Impact-weighted financial accounts: A paradigm shift. CESifo Forum 2021, 22, 20–25. [Google Scholar]
- Teece, D.J. Explicating dynamic capabilities: The nature and microfoundations of (sustainable) enterprise performance. Strateg. Manag. J. 2007, 28, 1319–1350. [Google Scholar] [CrossRef]
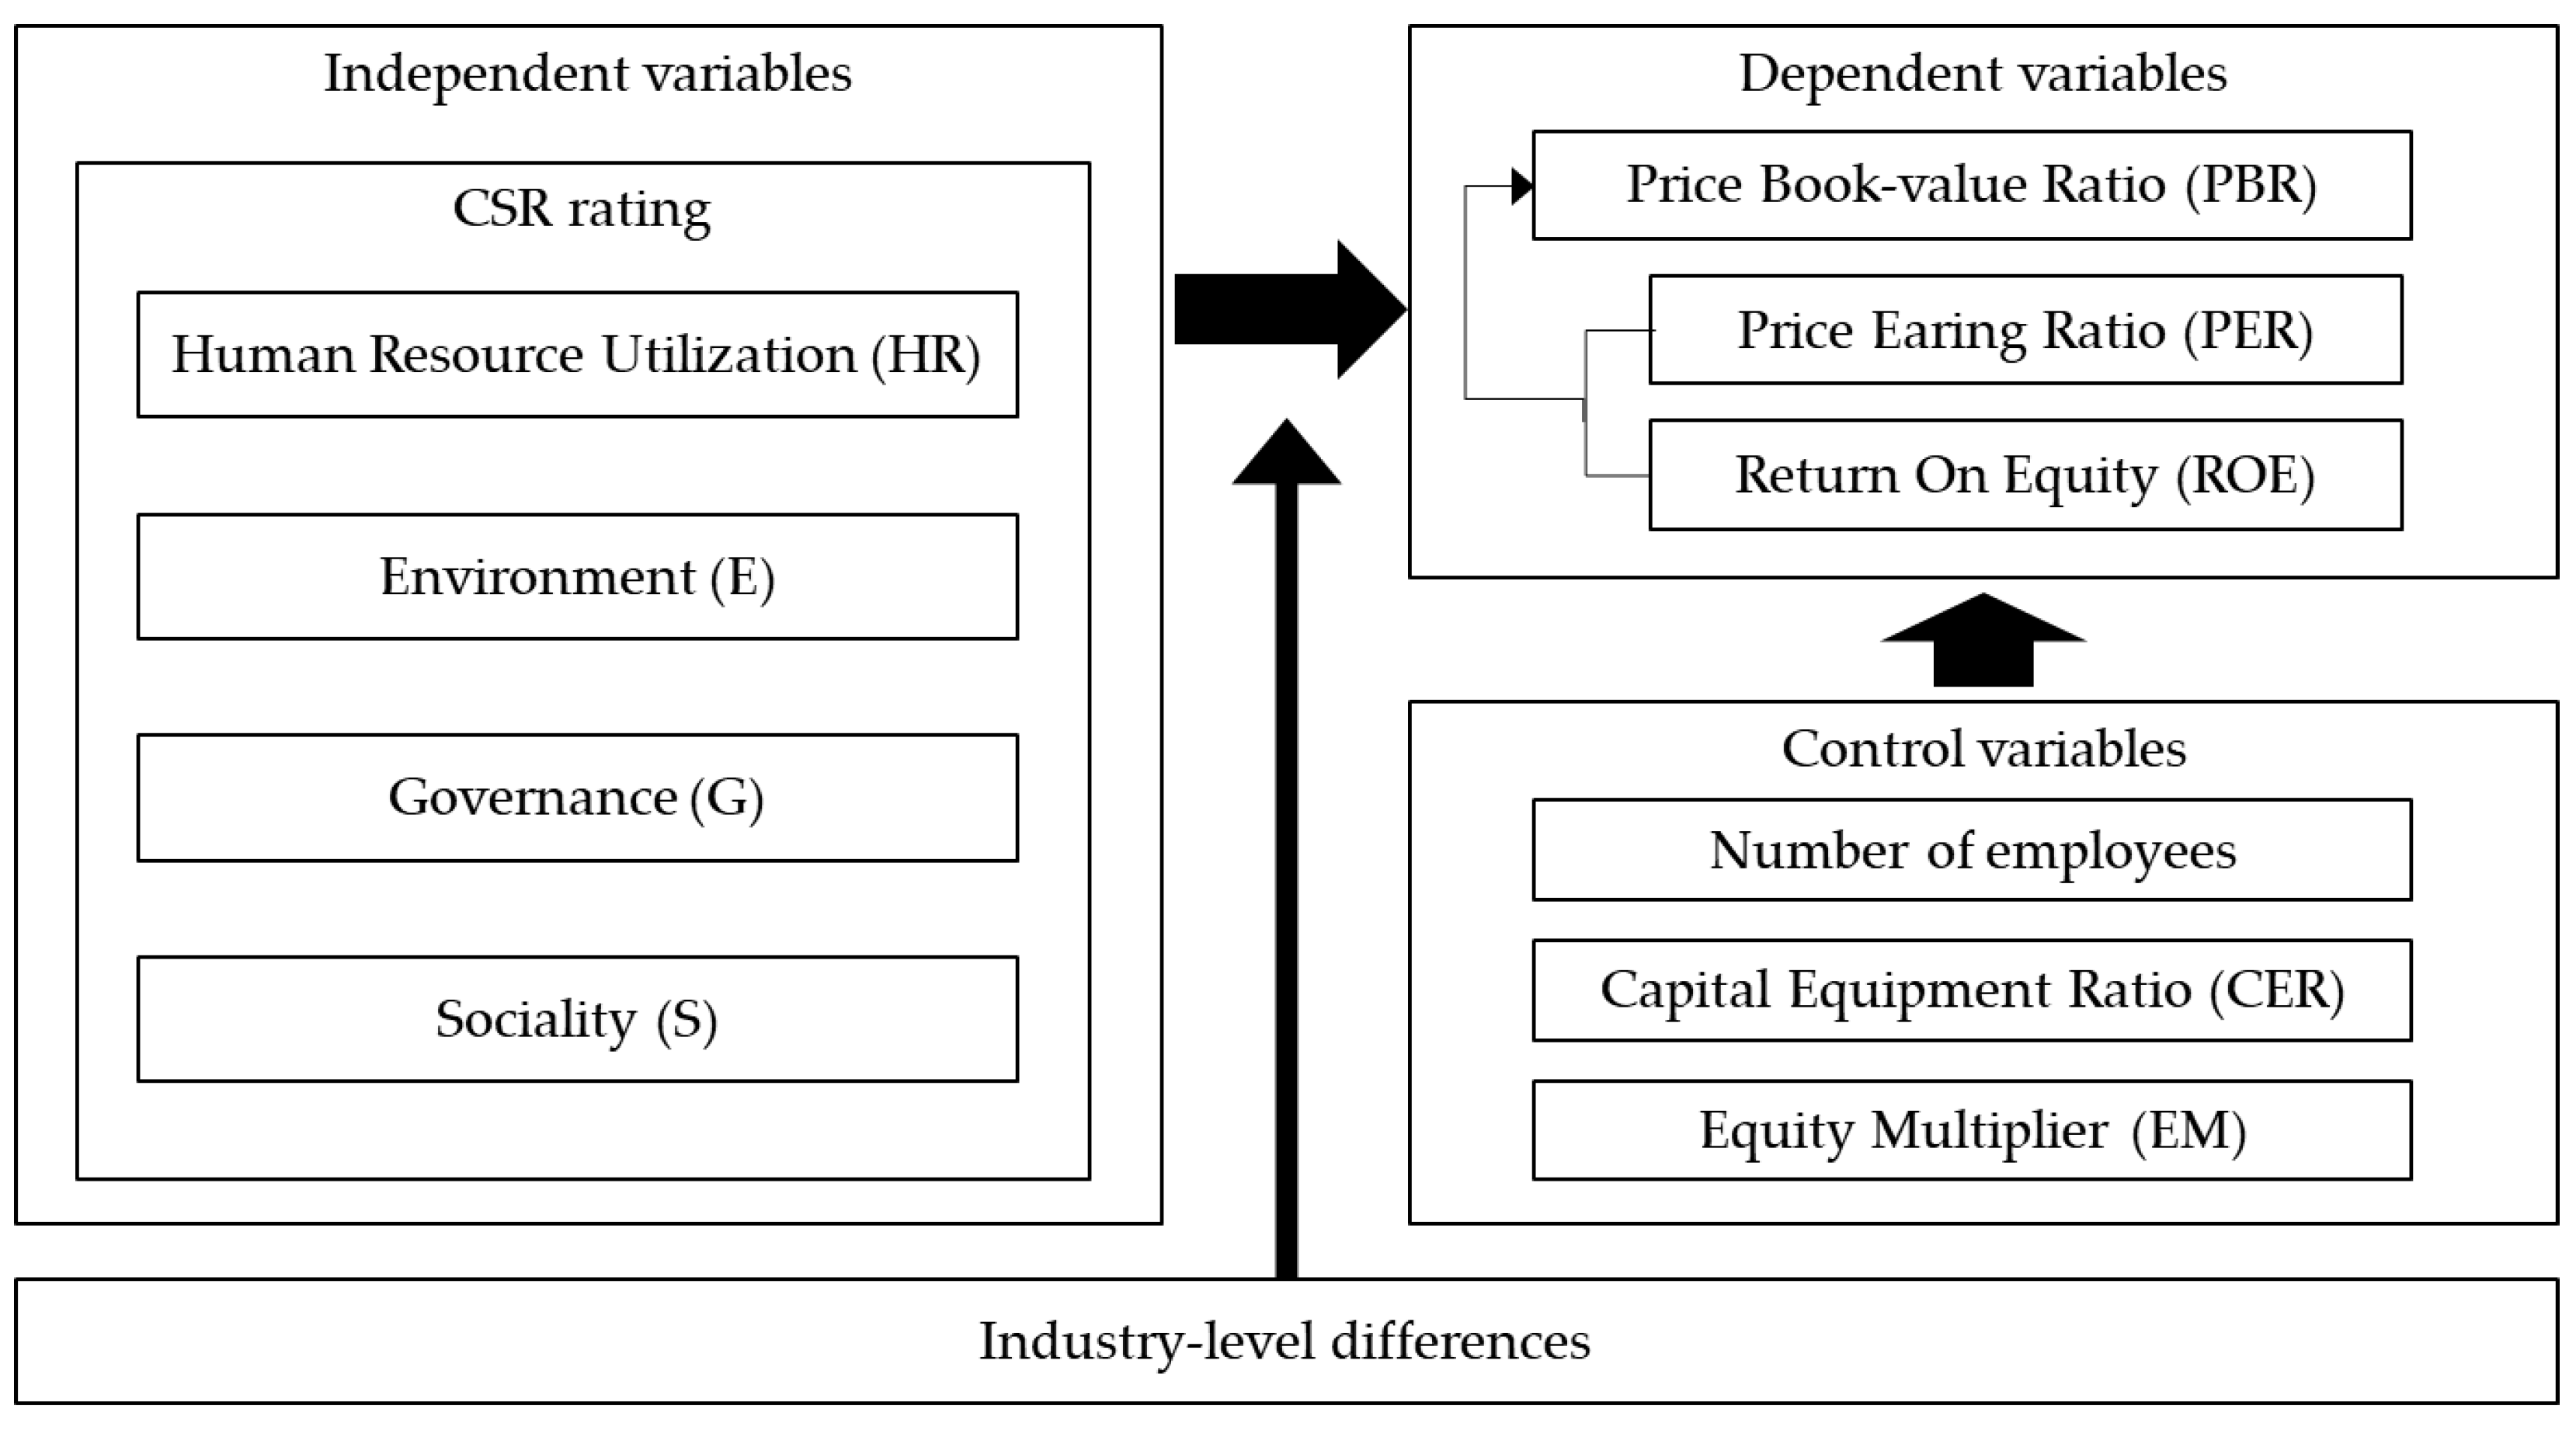
| Indicator | Abbreviation | Source | ||
|---|---|---|---|---|
| Dependent variable | Price-book value ratio | PBR | Nikkei NEEDS-Financial QUEST Micro Comprehensive Database | |
| Price earnings ratio | PER | |||
| Return on equity | ROE | |||
| Independent variable | CSR rating | Human resource utilization | HR | Toyo Keizai Inc.’s CSR Companies Complete Guide |
| Environment | E | |||
| Corporate Governance | G | |||
| Sociality | S | |||
| Control variable | Natural logarithmic number of employees | Ln (Emp) | Nikkei NEEDS-Financial QUEST Micro Comprehensive Database | |
| Capital equipment ratio | CER | |||
| Equity multiplier | EM | |||
| PBR | PER | ROE | Ln (Emp) | CER | EM | CSR Rating | |||||
|---|---|---|---|---|---|---|---|---|---|---|---|
| HR | E | G | S | ||||||||
| All companies (Sample = 635) | Mean | 1.68 | 21.75 | 7.87 | 6.96 | 56.24 | 2.23 | 3.80 | 3.78 | 3.79 | 3.77 |
| SD | 1.38 | 51.52 | 8.76 | 1.48 | 318.44 | 1.42 | 0.87 | 0.91 | 0.89 | 0.91 | |
| Manufacturing sector (Sample = 375) | Mean | 1.70 | 21.83 | 7.57 | 7.16 | 34.78 | 2.23 | 3.91 | 4.00 | 3.91 | 3.93 |
| SD | 1.41 | 50.60 | 8.92 | 1.41 | 88.04 | 1.44 | 0.84 | 0.86 | 0.86 | 0.87 | |
| Nonmanufacturing sector (Sample = 260) | Mean | 1.66 | 21.65 | 8.31 | 6.67 | 87.18 | 2.23 | 3.64 | 3.47 | 3.61 | 3.53 |
| SD | 1.34 | 52.84 | 8.51 | 1.54 | 484.74 | 1.39 | 0.87 | 0.89 | 0.89 | 0.92 | |
| T-value of the t-test of the mean of manufacturing and nonmanufacturing sectors | 0.71 | 0.10 | −2.36 *** | 9.06 *** | −3.85 *** | −0.03 | 8.98 *** | 16.66 *** | 9.42 *** | 12.54 *** | |
| CSR Rating | HR | E | G | S | |||||||||
|---|---|---|---|---|---|---|---|---|---|---|---|---|---|
| Financial Indicator | PBR | PER | ROE | PBR | PER | ROE | PBR | PER | ROE | PBR | PER | ROE | |
| Linear | Model | FE | FE | FE | FE | RE | RE | FE | FE | RE | FE | FE | RE |
| COEF | 0.012 (0.261) | −0.854 (−0.308) | −0.309 (−0.835) | 0.053 (1.179) | 4.232 *** (3.051) | 0.345 (1.358) | 0.062 (1.470) | 0.237 (0.085) | 0.675 *** (3.015) | 0.089 * (1.713) | −0.448 (−0.638) | 0.715 *** (2.747) | |
| Adjusted R2 | 0.811 | 0.292 | 0.449 | 0.811 | 0.008 | 0.015 | 0.812 | 0.292 | 0.020 | 0.812 | 0.292 | 0.018 | |
| Quadratic | Model | FE | - | FE | FE | - | FE | FE | - | RE | FE | - | RE |
| COEF_L | 0.147 (0.762) | - | −1.573 (−0.986) | 0.168 (0.761) | - | 1.716 (0.959) | −0.098 (−0.426) | - | −3.386 ** (−2.193) | 0.206 (1.066) | - | −1.900 (−1.393) | |
| COEF_Q | −0.018 (−0.678) | - | 0.168 (0.744) | −0.015 (−0.510) | - | −0.211 (−0.869) | 0.021 (0.673) | - | 0.535 ** (2.566) | −0.016 (−0.561) | - | 0.352 * (1.868) | |
| Adjusted R2 | 0.811 | - | 0.449 | 0.811 | - | 0.449 | 0.812 | - | 0.022 | 0.812 | - | 0.020 | |
| Turning point | N.S. | - | N.S. | N.S. | - | N.S. | N.S. | - | 3.16 | N.S. | - | N.S. | |
| Mean | 3.79 | ||||||||||||
| CSR Rating | HR | E | G | S | |||||||||
|---|---|---|---|---|---|---|---|---|---|---|---|---|---|
| Financial Indicator | PBR | PER | ROE | PBR | PER | ROE | PBR | PER | ROE | PBR | PER | ROE | |
| Linear | Model | FE | RE | RE | FE | FE | RE | FE | FE | RE | FE | FE | RE |
| COEF | 0.026 (0.491) | 6.772 *** (3.580) | 0.593 * (1.843) | 0.053 (0.848) | 4.843 (1.258) | 0.448 (1.383) | 0.065 (1.276) | −1.752 (−0.474) | 0.554 * (1.915) | 0.118 * (1.809) | −4.010 (−0.966) | 1.097 *** (3.101) | |
| Adjusted R2 | 0.797 | 0.012 | 0.042 | 0.797 | 0.283 | 0.039 | 0.797 | 0.283 | 0.041 | 0.797 | 0.283 | 0.045 | |
| Quadratic | Model | - | - | - | FE | - | - | - | - | - | FE | - | - |
| COEF_L | - | - | - | 0.232 (0.476) | - | - | - | - | - | 0.870 *** (2.831) | - | - | |
| COEF_Q | - | - | - | −0.022 (−0.369) | - | - | - | - | - | −0.096 ** (−2.463) | - | - | |
| Adjusted R2 | - | - | - | 0.797 | - | - | - | - | - | 0.798 | - | - | |
| Turning point | - | - | - | N.S. | - | - | - | - | - | 4.53 | - | - | |
| Mean | 3.93 | ||||||||||||
| CSR Rating | HR | E | G | S | |||||||||
|---|---|---|---|---|---|---|---|---|---|---|---|---|---|
| Financial Indicator | PBR | PER | ROE | PBR | PER | ROE | PBR | PER | ROE | PBR | PER | ROE | |
| Linear | Model | FE | FE | RE | RE | RE | RE | FE | RE | RE | FE | RE | RE |
| COEF | −0.004 (−0.053) | −8.638 * (−1.907) | 0.228 (0.528) | 0.067 (1.282) | 4.170 * (1.937) | 0.402 (0.953) | 0.050 (0.714) | 7.027 *** (2.968) | 0.802 (2.233) | 0.046 (0.571) | 9.383 *** (3.665) | 0.295 (0.790) | |
| Adjusted R2 | 0.836 | 0.308 | 0.004 | −0.003 | 0.009 | 0.005 | 0.836 | 0.018 | 0.010 | 0.836 | 0.026 | −0.002 | |
| Quadratic | Model | - | - | RE | RE | - | RE | RE | - | RE | - | - | - |
| COEF_L | - | - | −2.918 * (−1.904) | −0.040 (−0.184) | - | −3.934 * (−1.711) | −0.610 * (−1.799) | - | −5.699 ** (−2.550) | - | - | - | |
| COEF_Q | - | - | 0.429 * (1.895) | 0.015 (0.465) | - | 0.602 * (1.870) | 0.097 ** (1.973) | - | 0.873 *** (2.807) | - | - | - | |
| Adjusted R2 | - | - | 0.007 | −0.002 | - | 0.012 | 0.020 | - | 0.017 | - | - | - | |
| Turning point | - | - | 3.40 | N.S. | - | 3.27 | 3.14 | - | 3.26 | - | - | - | |
| Mean | 3.64 | 3.47 | 3.61 | 3.61 | |||||||||
Disclaimer/Publisher’s Note: The statements, opinions and data contained in all publications are solely those of the individual author(s) and contributor(s) and not of MDPI and/or the editor(s). MDPI and/or the editor(s) disclaim responsibility for any injury to people or property resulting from any ideas, methods, instructions or products referred to in the content. |
© 2025 by the authors. Licensee MDPI, Basel, Switzerland. This article is an open access article distributed under the terms and conditions of the Creative Commons Attribution (CC BY) license (https://creativecommons.org/licenses/by/4.0/).
Share and Cite
Ikuta, T.; Fujii, H. An Analysis of the Relationship Between ESG Activities and the Financial Performance of Japanese Companies Toward Sustainable Development. Sustainability 2025, 17, 6790. https://doi.org/10.3390/su17156790
Ikuta T, Fujii H. An Analysis of the Relationship Between ESG Activities and the Financial Performance of Japanese Companies Toward Sustainable Development. Sustainability. 2025; 17(15):6790. https://doi.org/10.3390/su17156790
Chicago/Turabian StyleIkuta, Takafumi, and Hidemichi Fujii. 2025. "An Analysis of the Relationship Between ESG Activities and the Financial Performance of Japanese Companies Toward Sustainable Development" Sustainability 17, no. 15: 6790. https://doi.org/10.3390/su17156790
APA StyleIkuta, T., & Fujii, H. (2025). An Analysis of the Relationship Between ESG Activities and the Financial Performance of Japanese Companies Toward Sustainable Development. Sustainability, 17(15), 6790. https://doi.org/10.3390/su17156790