Multi-Scale Ecosystem Service Supply–Demand Dynamics and Driving Mechanisms in Mainland China During the Last Two Decades: Implications for Sustainable Development
Abstract
1. Introduction
2. Data and Methods
2.1. Study Area and Data Sources
2.2. Evaluation of Supply and Demand for ES
2.2.1. Quantifying Supply and Demand for ES
2.2.2. ES Supply–Demand Ratio
2.3. Spatiotemporal Quantification of Trade-Offs and Synergies in ES
2.3.1. Spearman-Based Correlation Method
2.3.2. Bivariate Local Autocorrelation Analysis
2.3.3. Spatiotemporal Interaction Analysis
2.4. Identification of ES Supply–Demand Bundles
2.5. Driver Analysis Based on Explainable Machine Learning Models
2.5.1. Model Selection and Evaluation
2.5.2. Variable Selection and SHAP-Based Driver Identification
3. Results
3.1. Spatiotemporal Dynamics of ES Supply and Demand
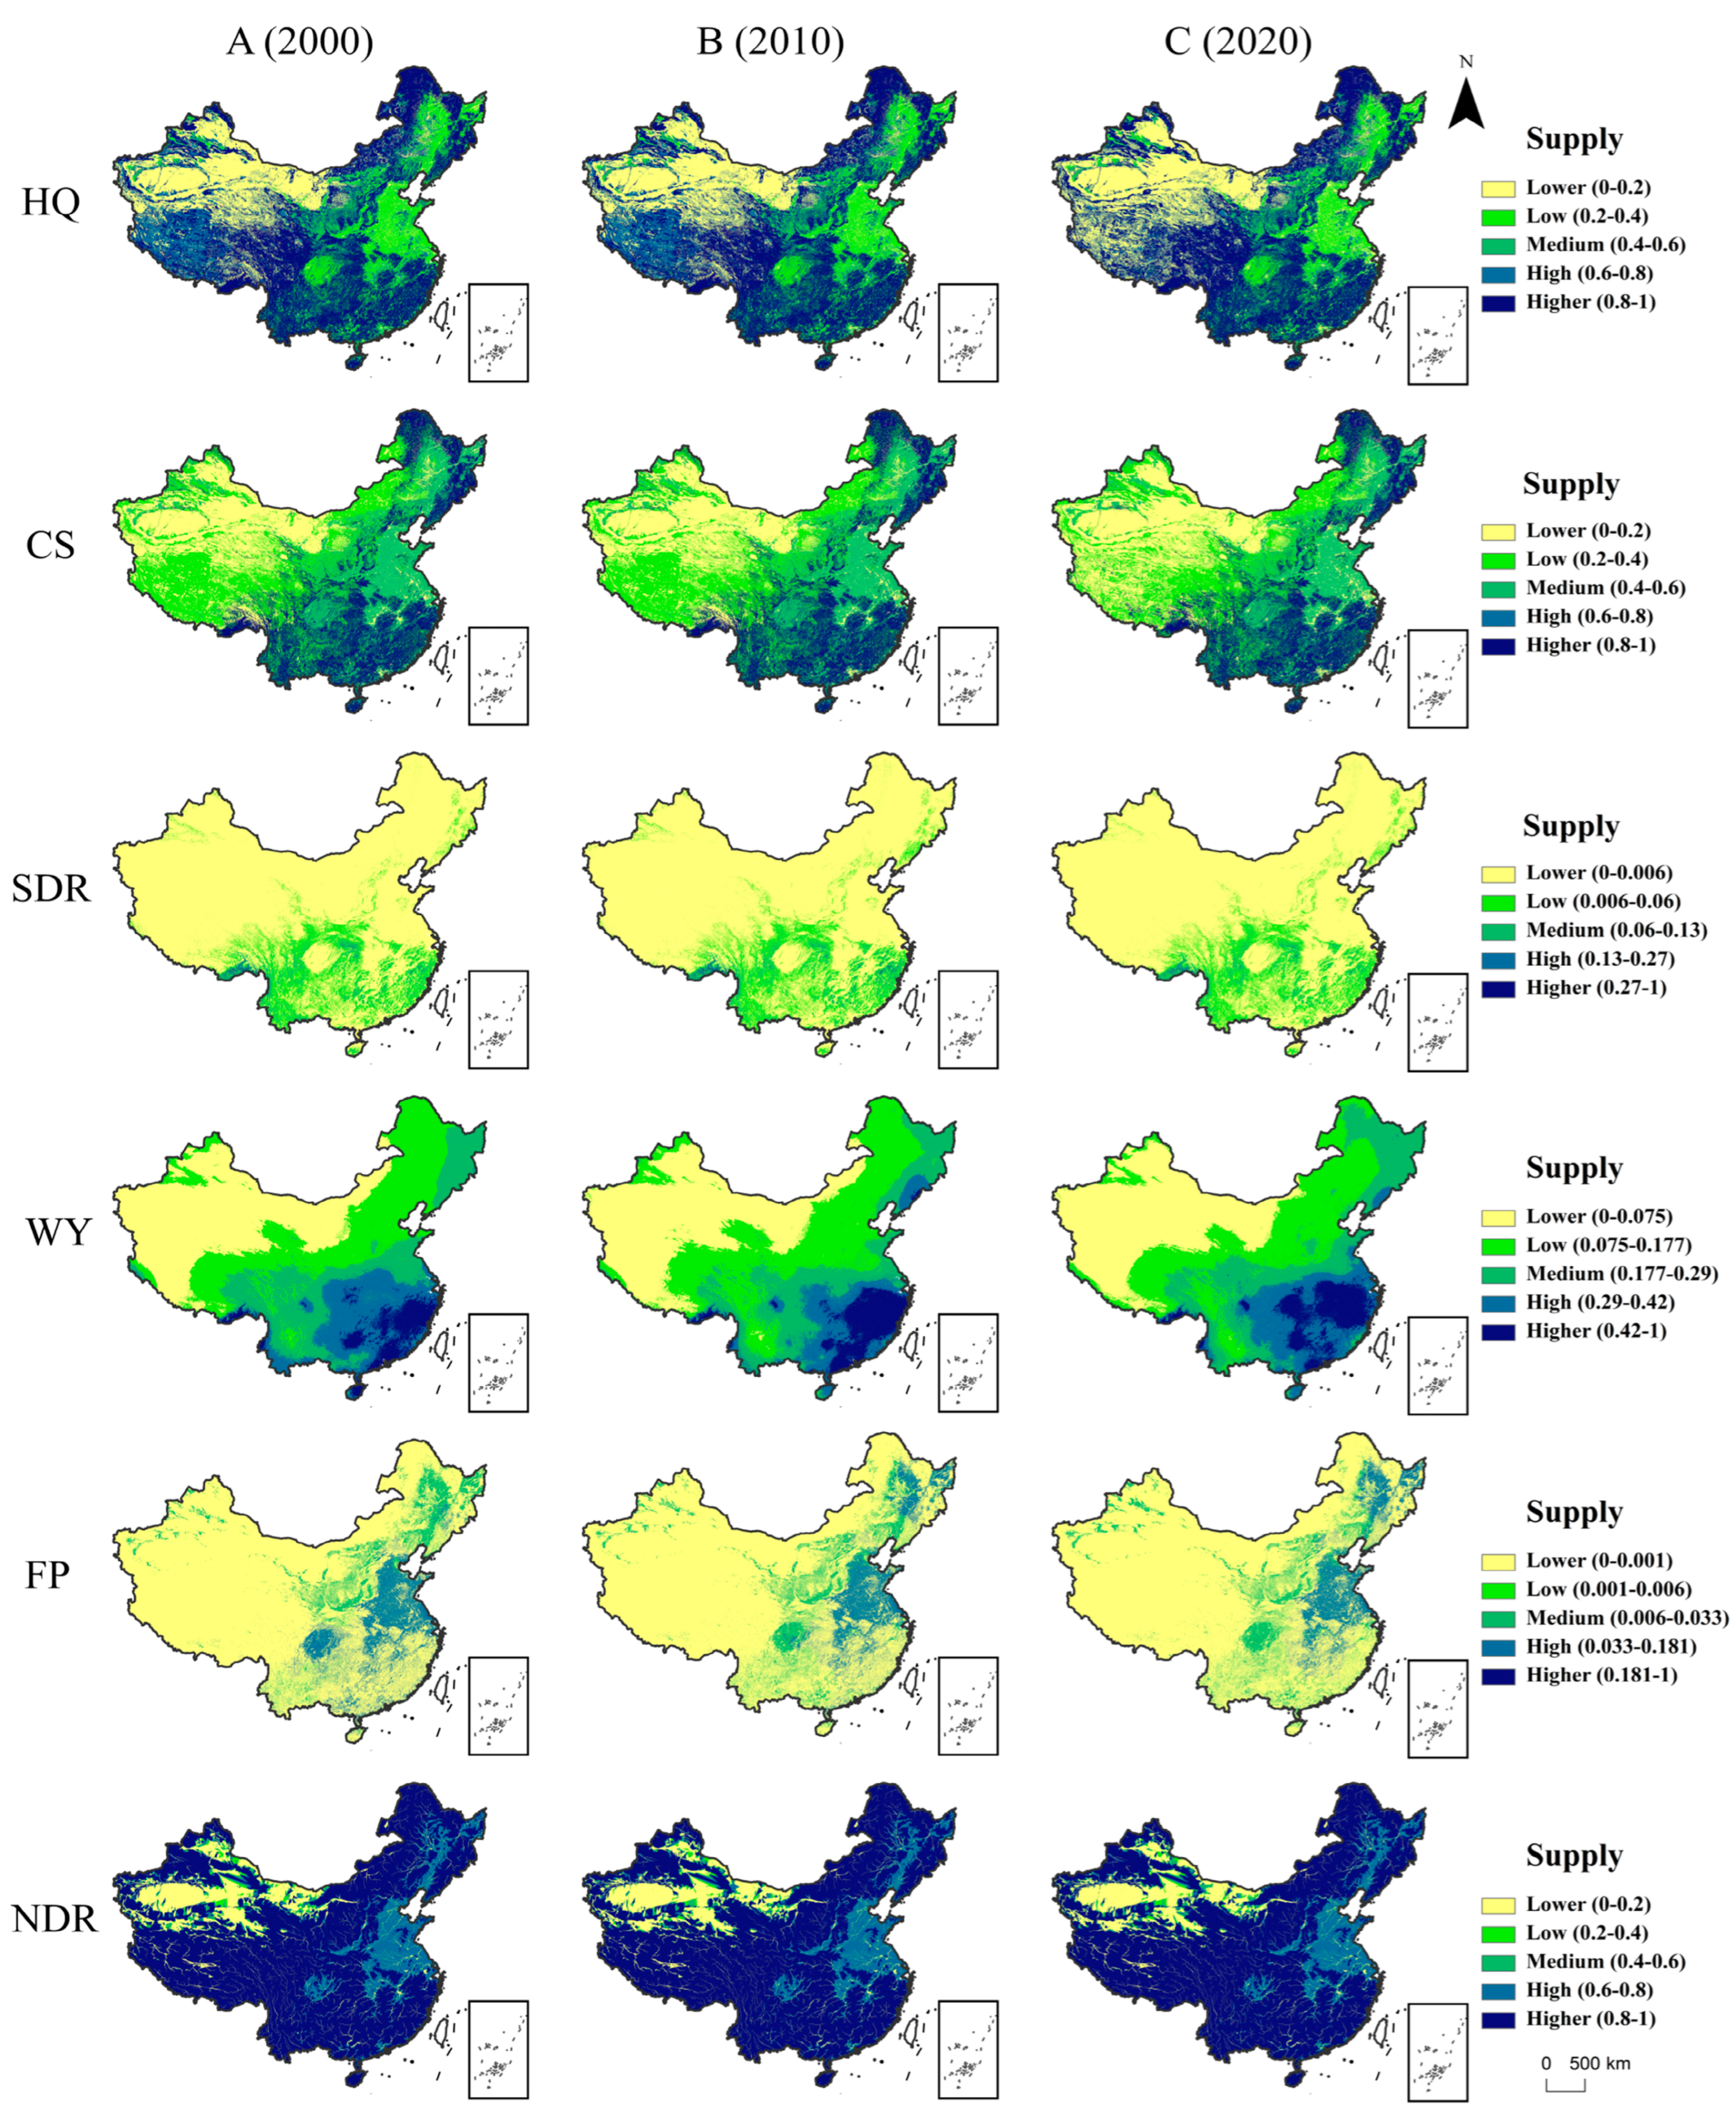
3.1.1. Analysis of ES Supply
3.1.2. Analysis of ES Demand
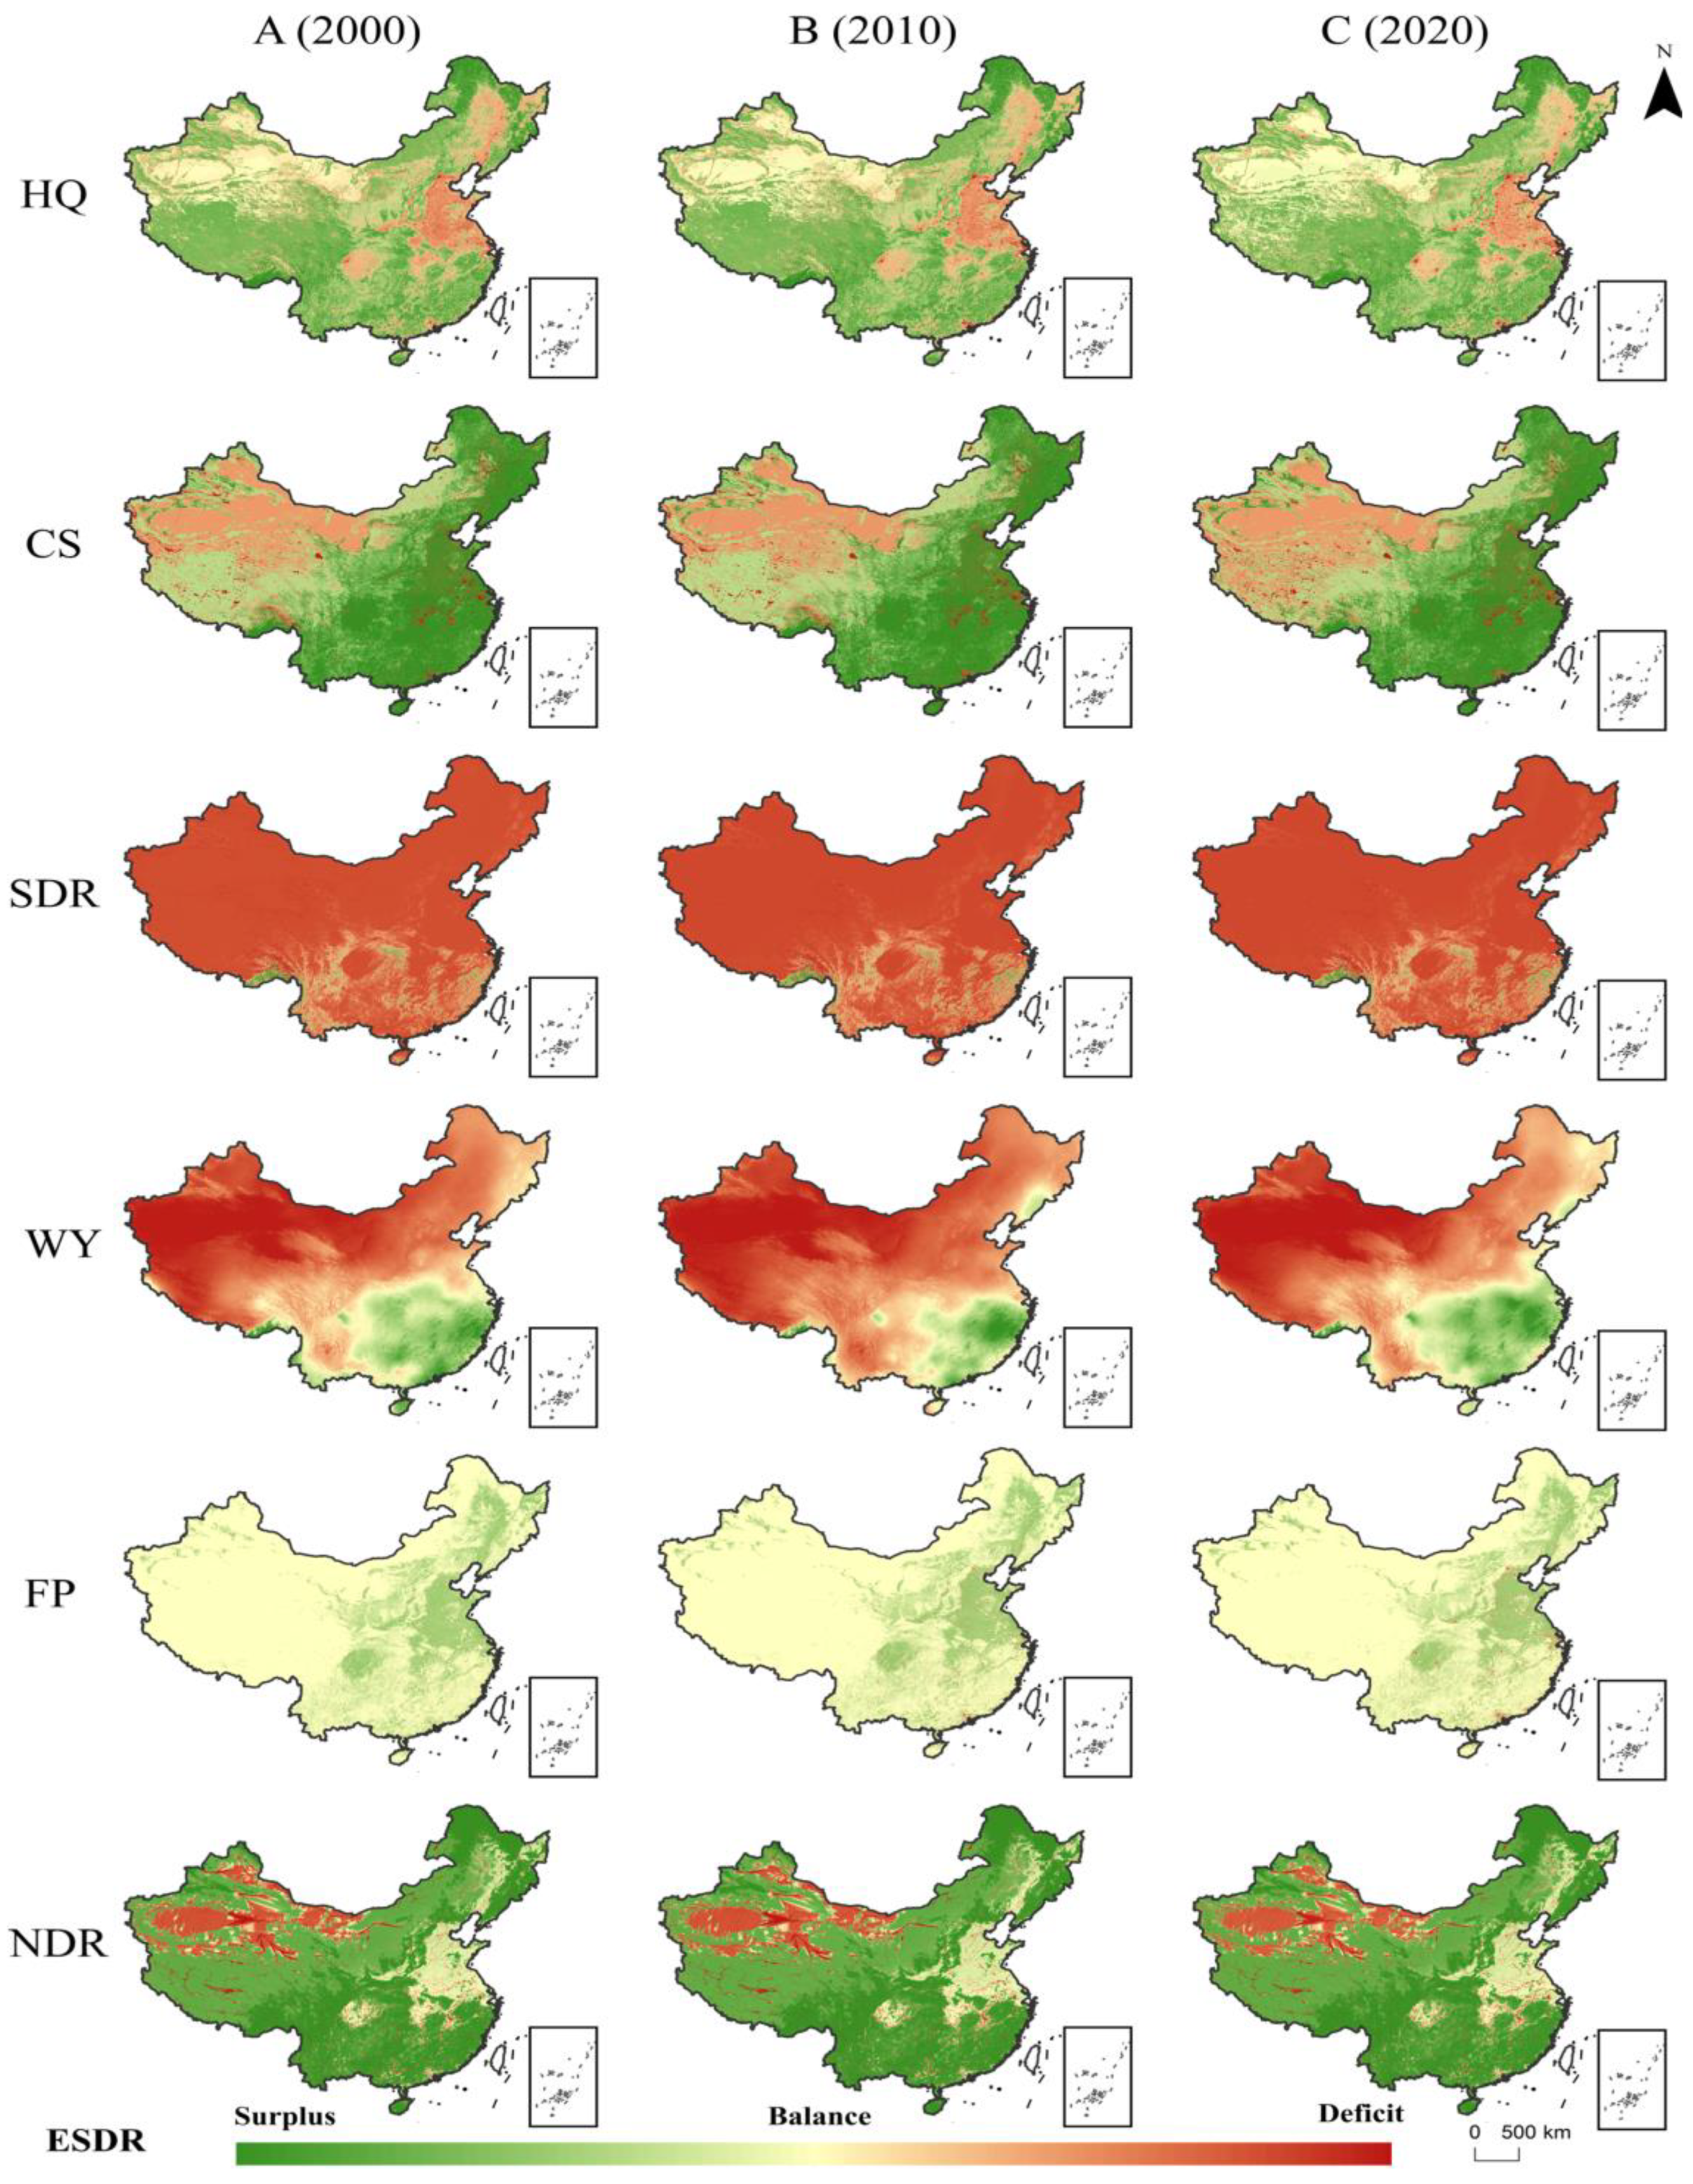
3.1.3. Analysis of ESDR
3.2. Trade-Offs and Synergies in ES Supply and Demand
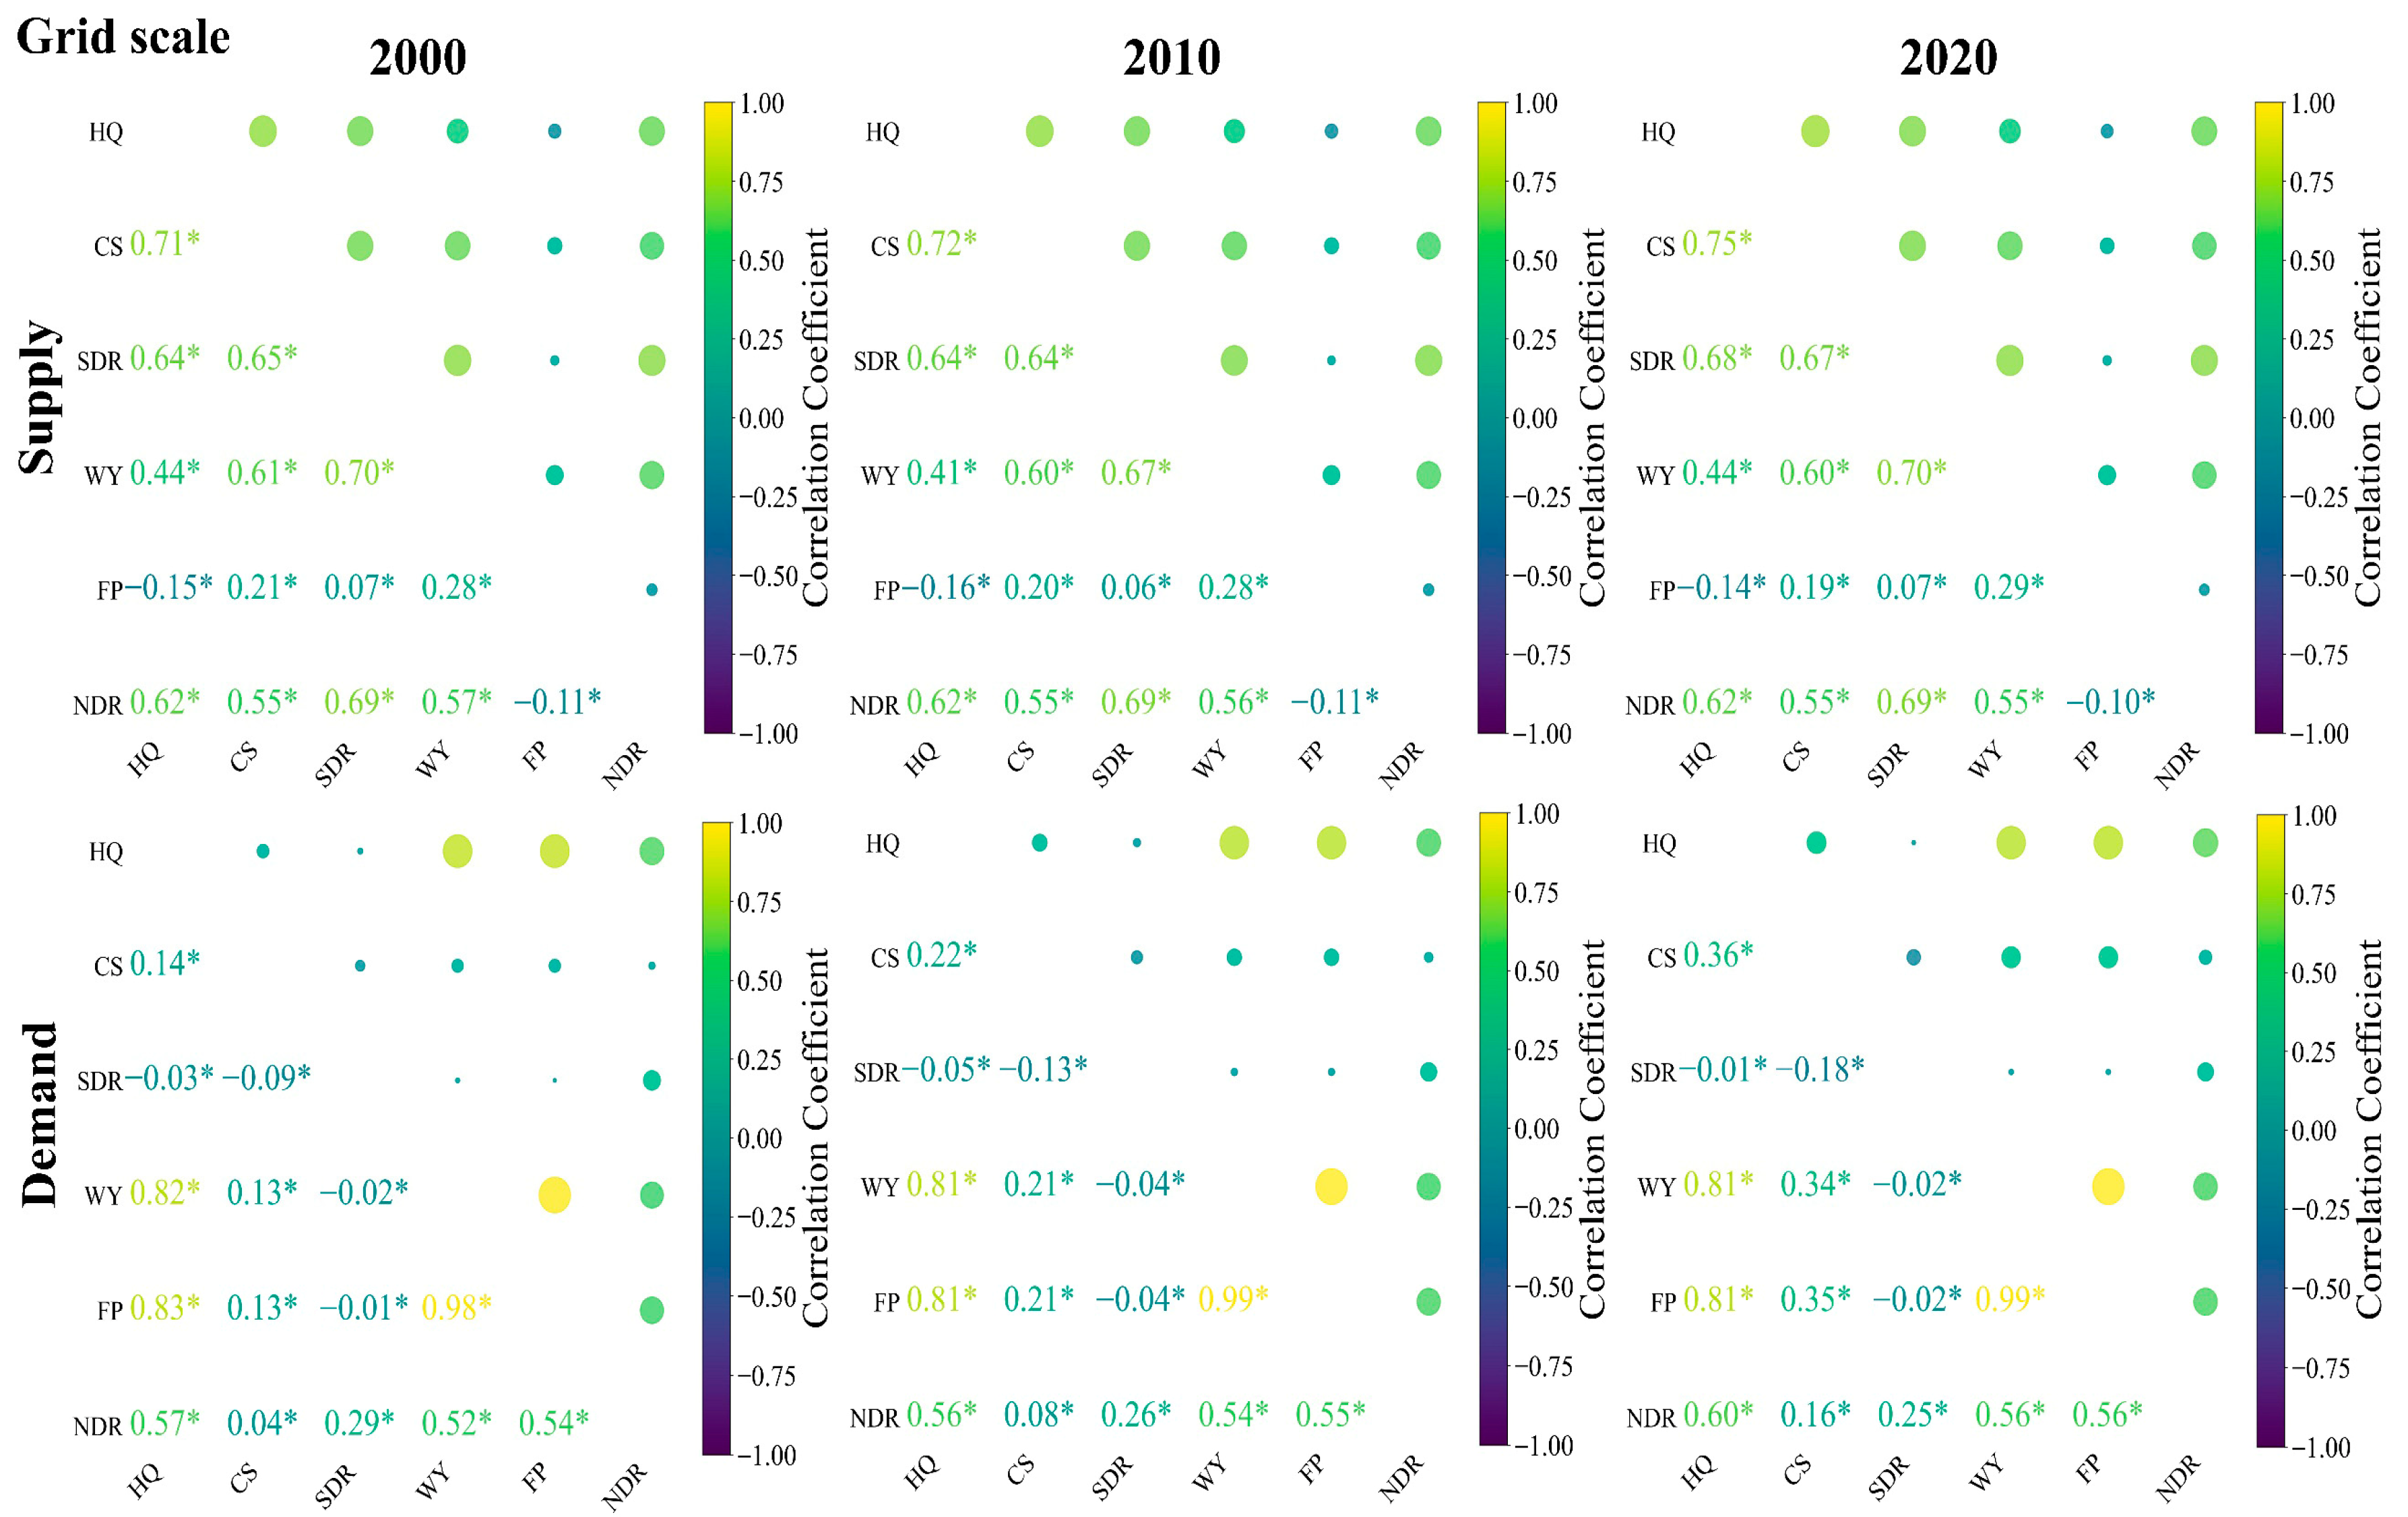
3.2.1. Spearman Correlation Analysis
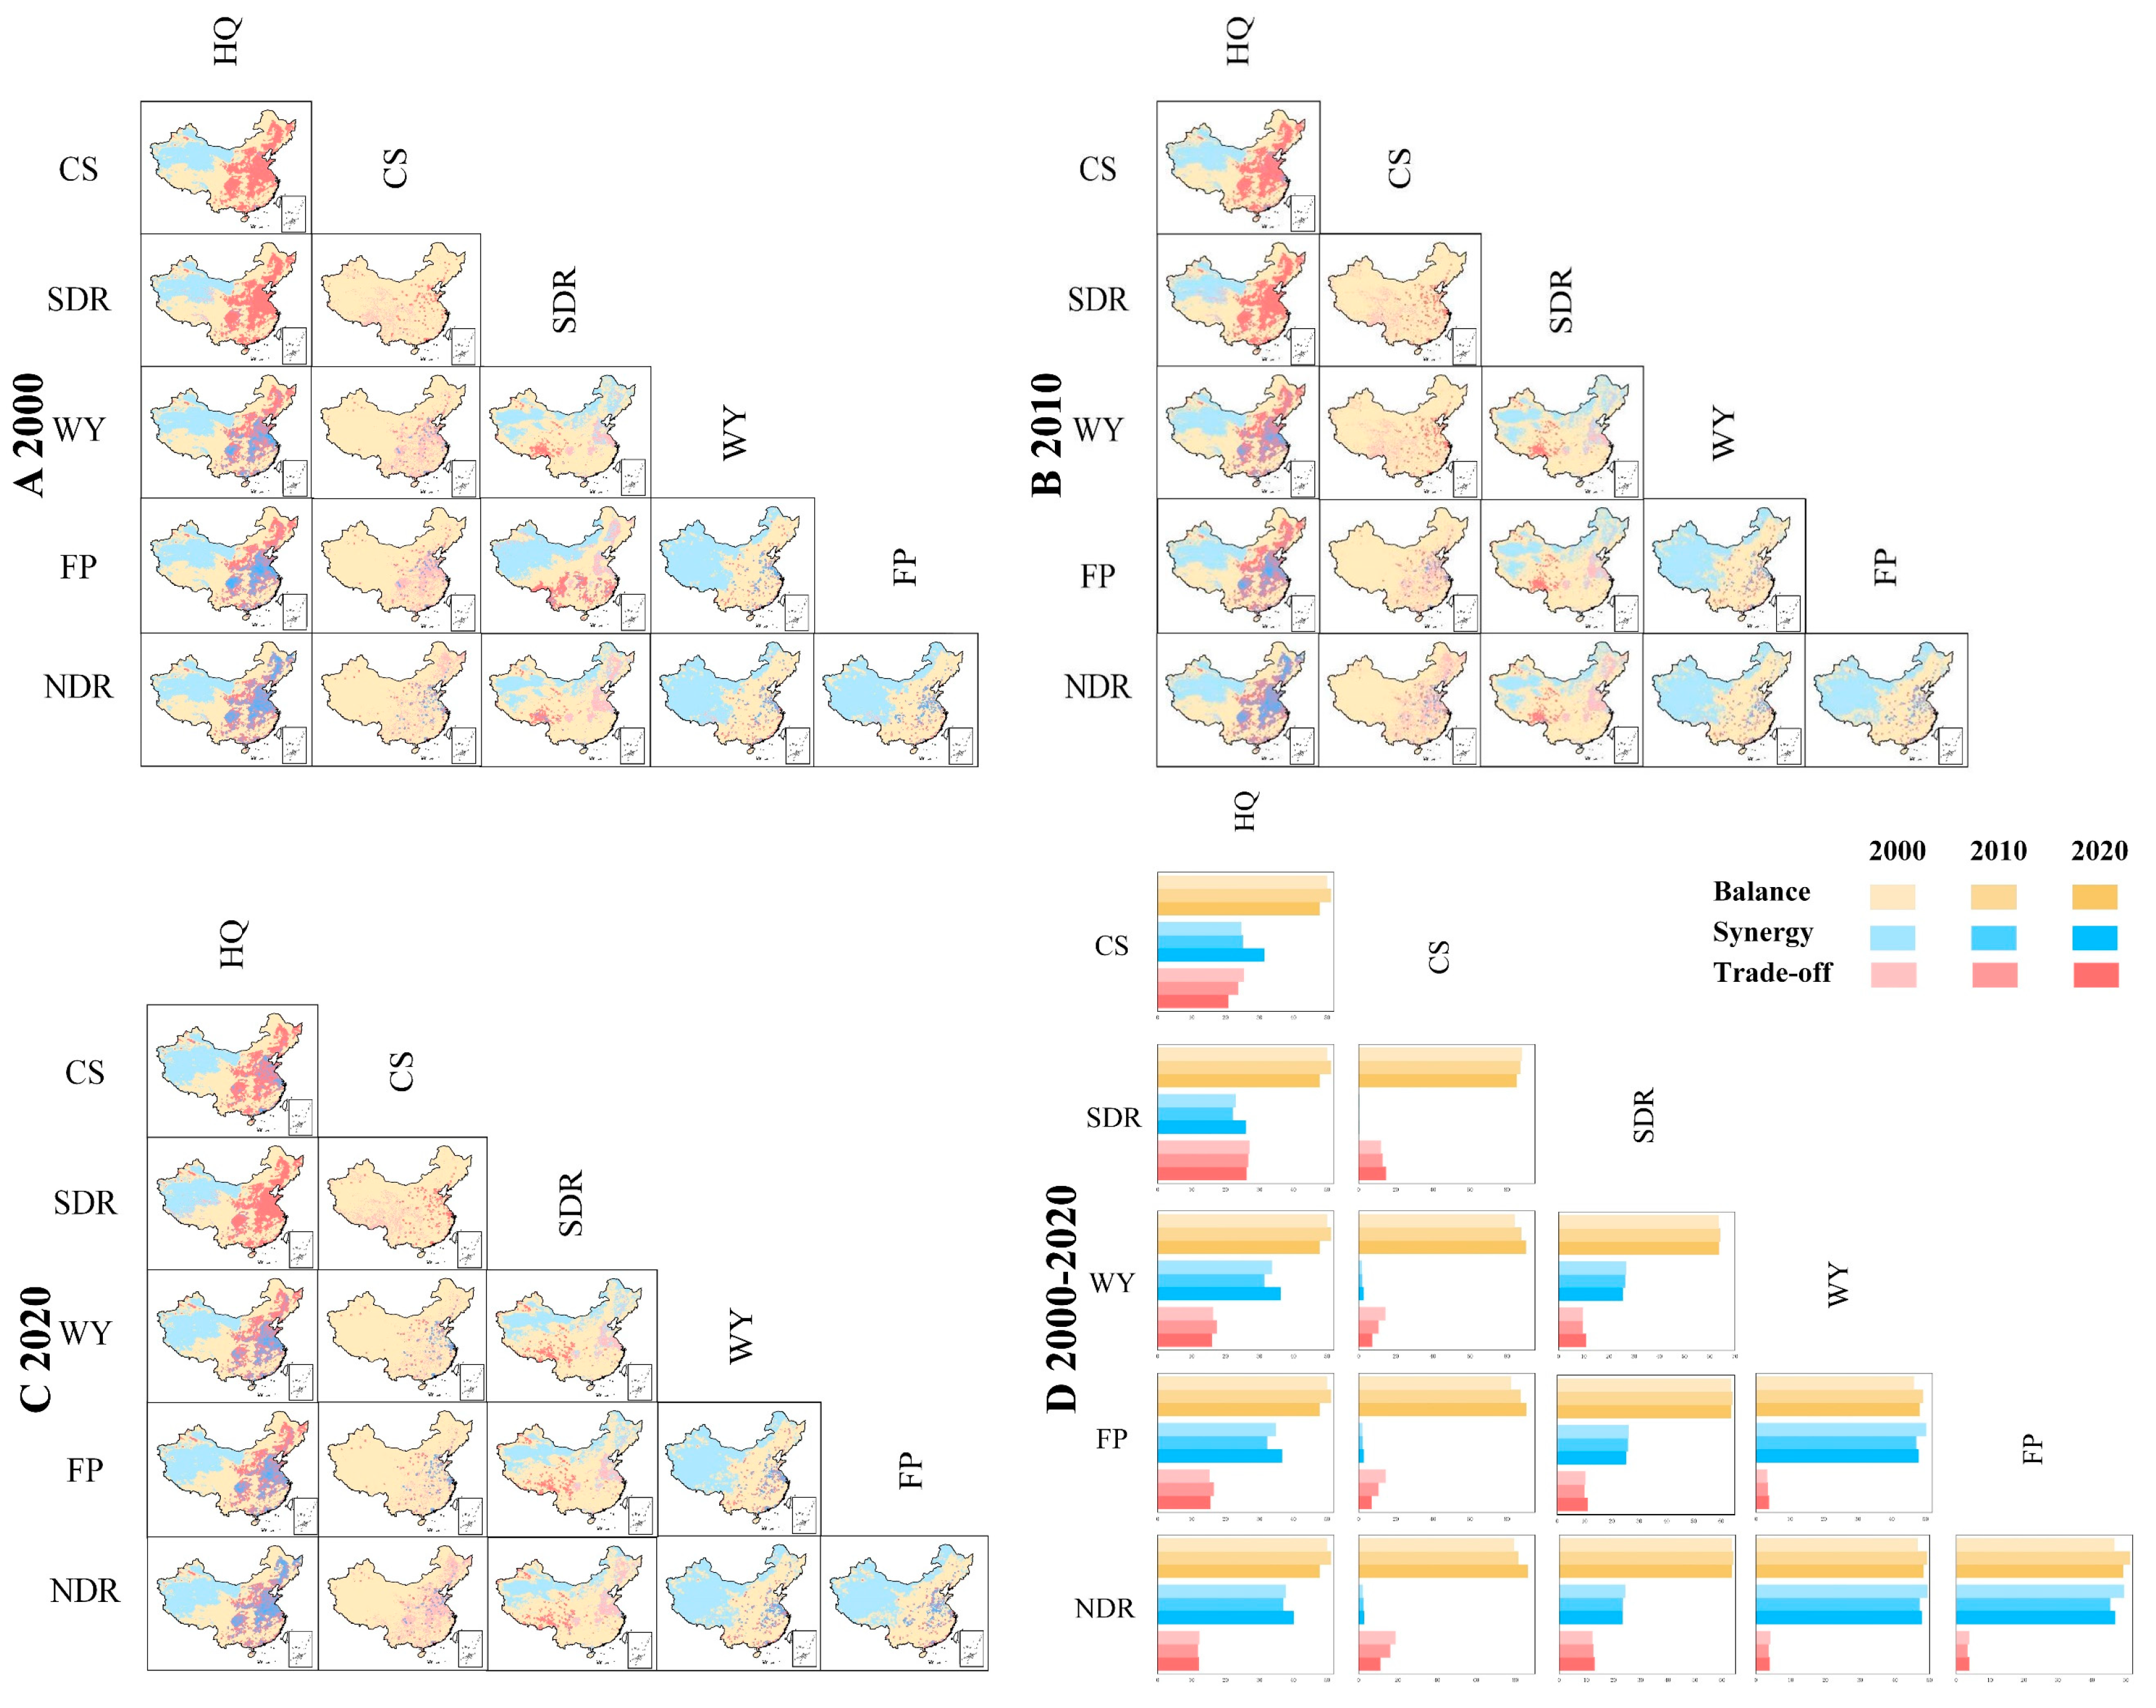
3.2.2. SpatioTemporal Patterns of Trade-Offs and Synergies
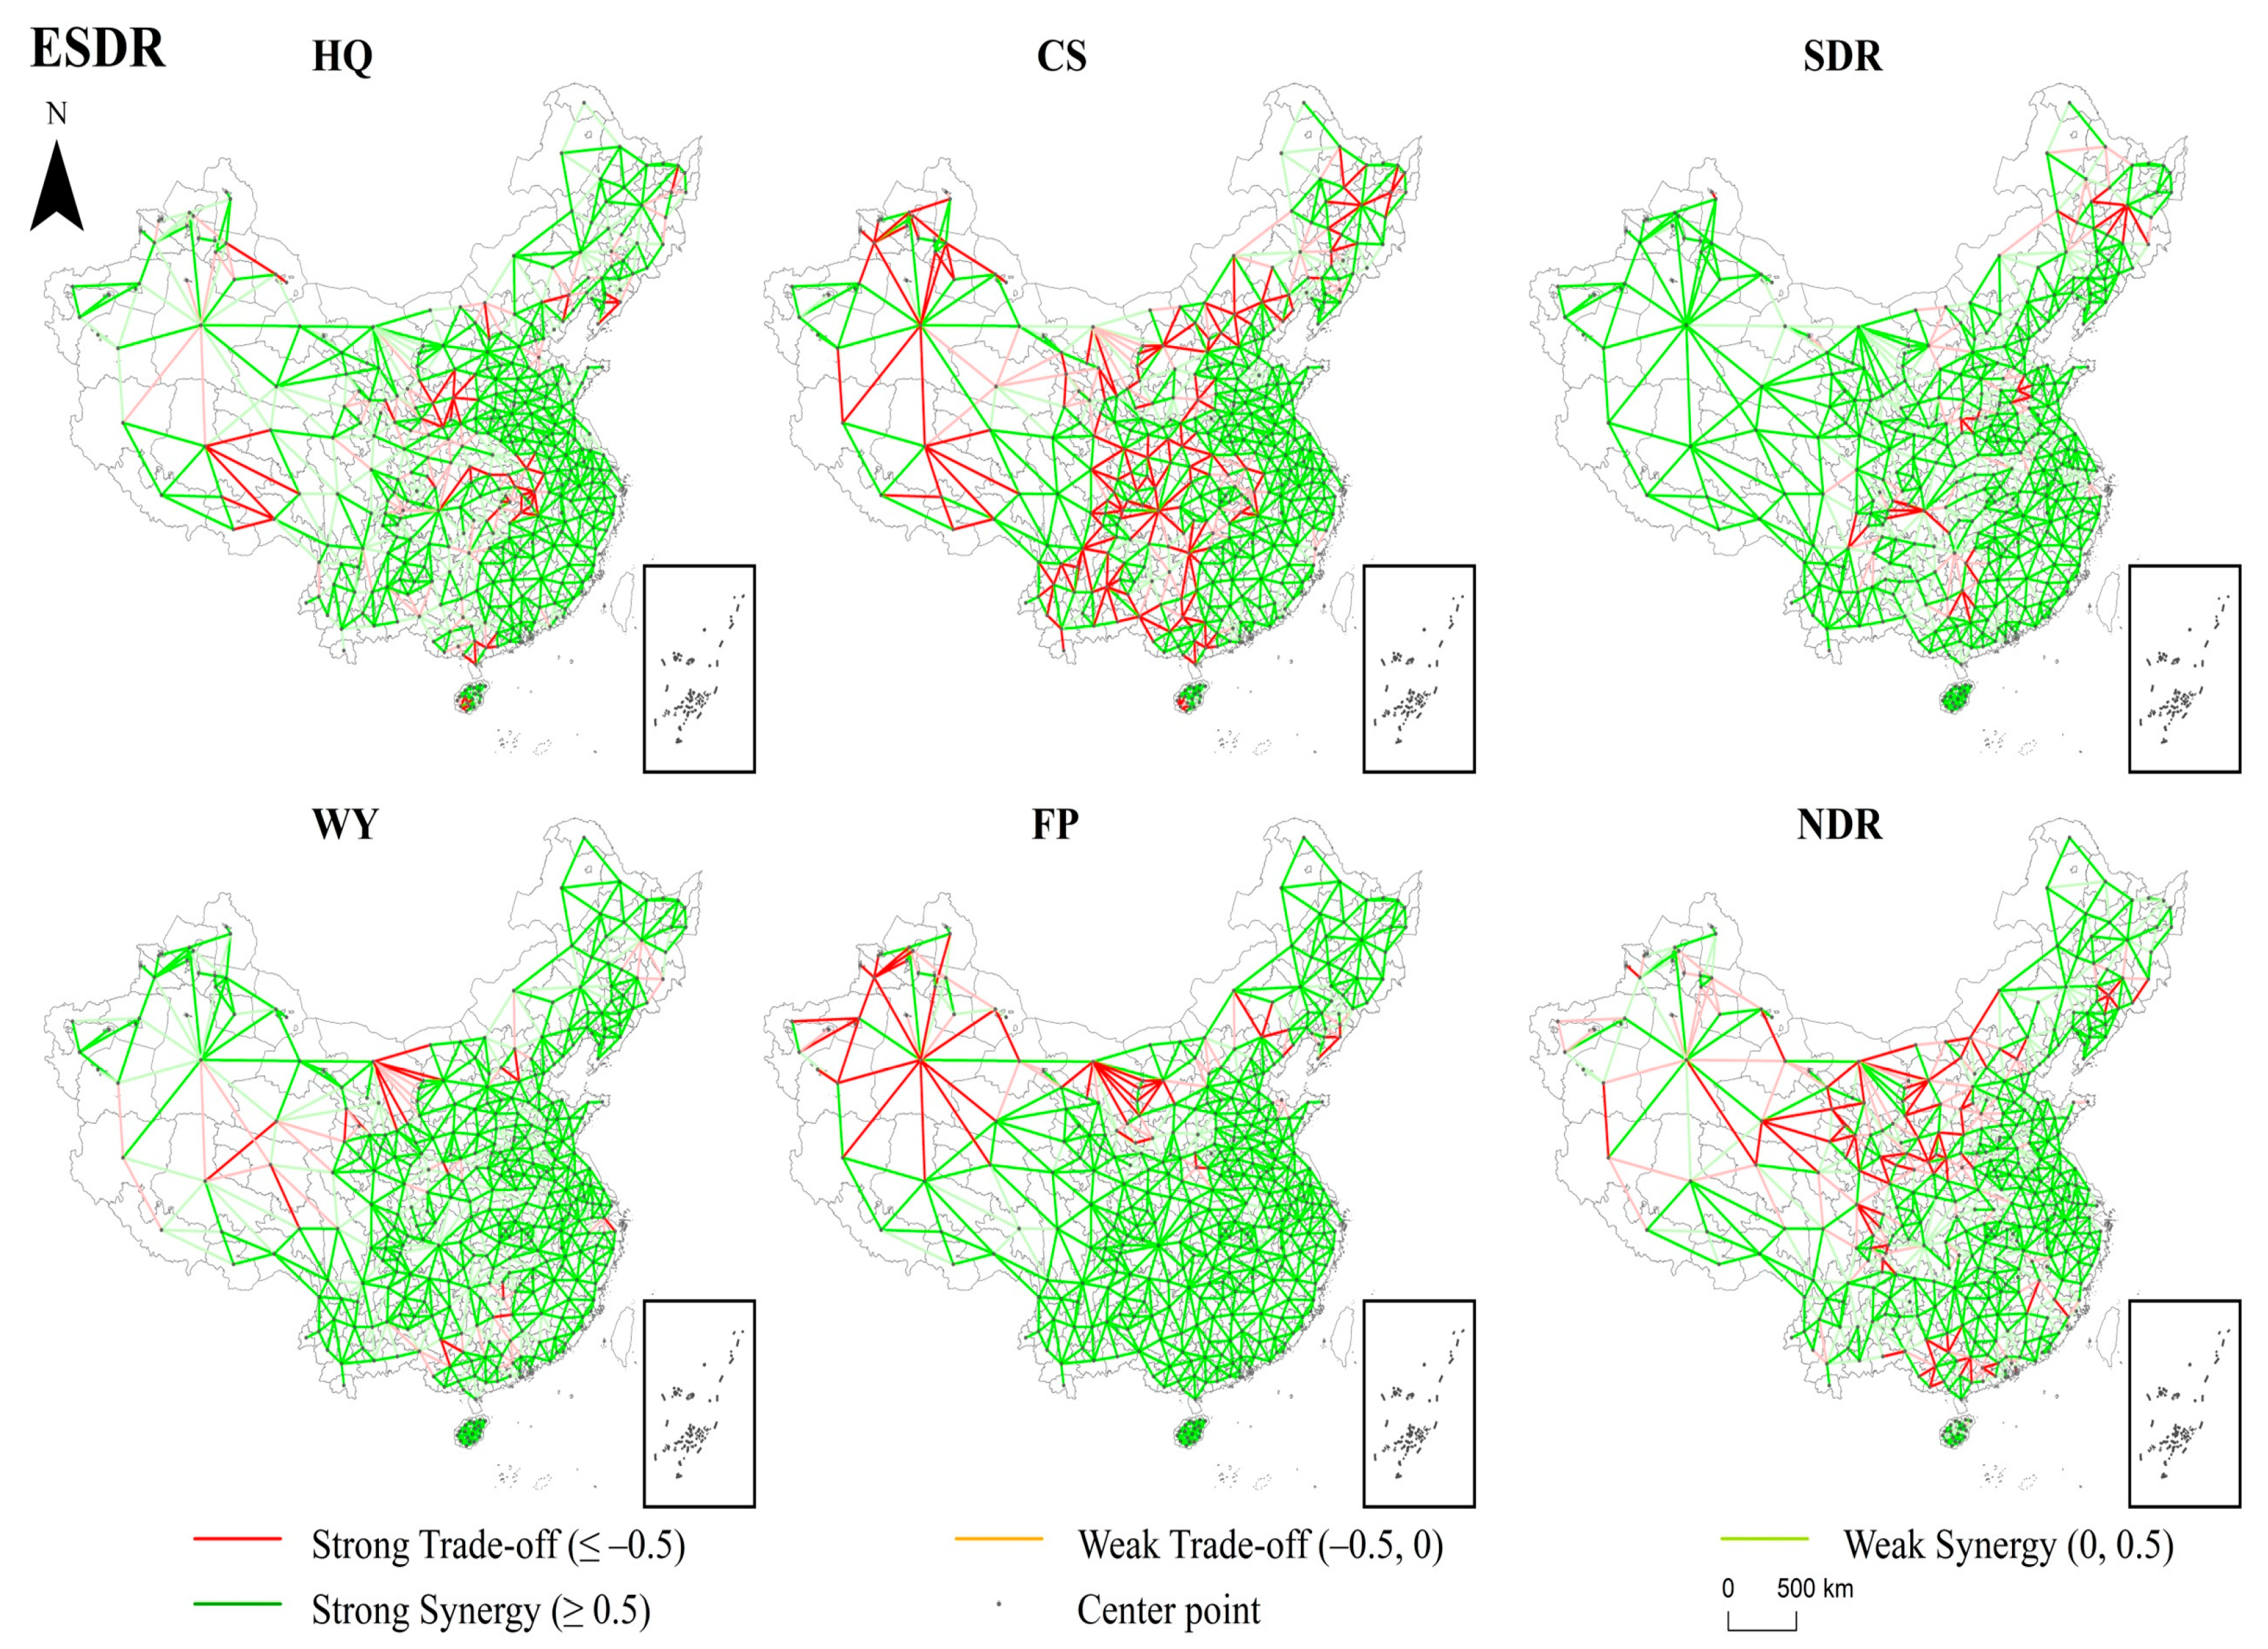
3.2.3. Interactive Spatio-Temporal Visualization of Trade-Offs and Synergies
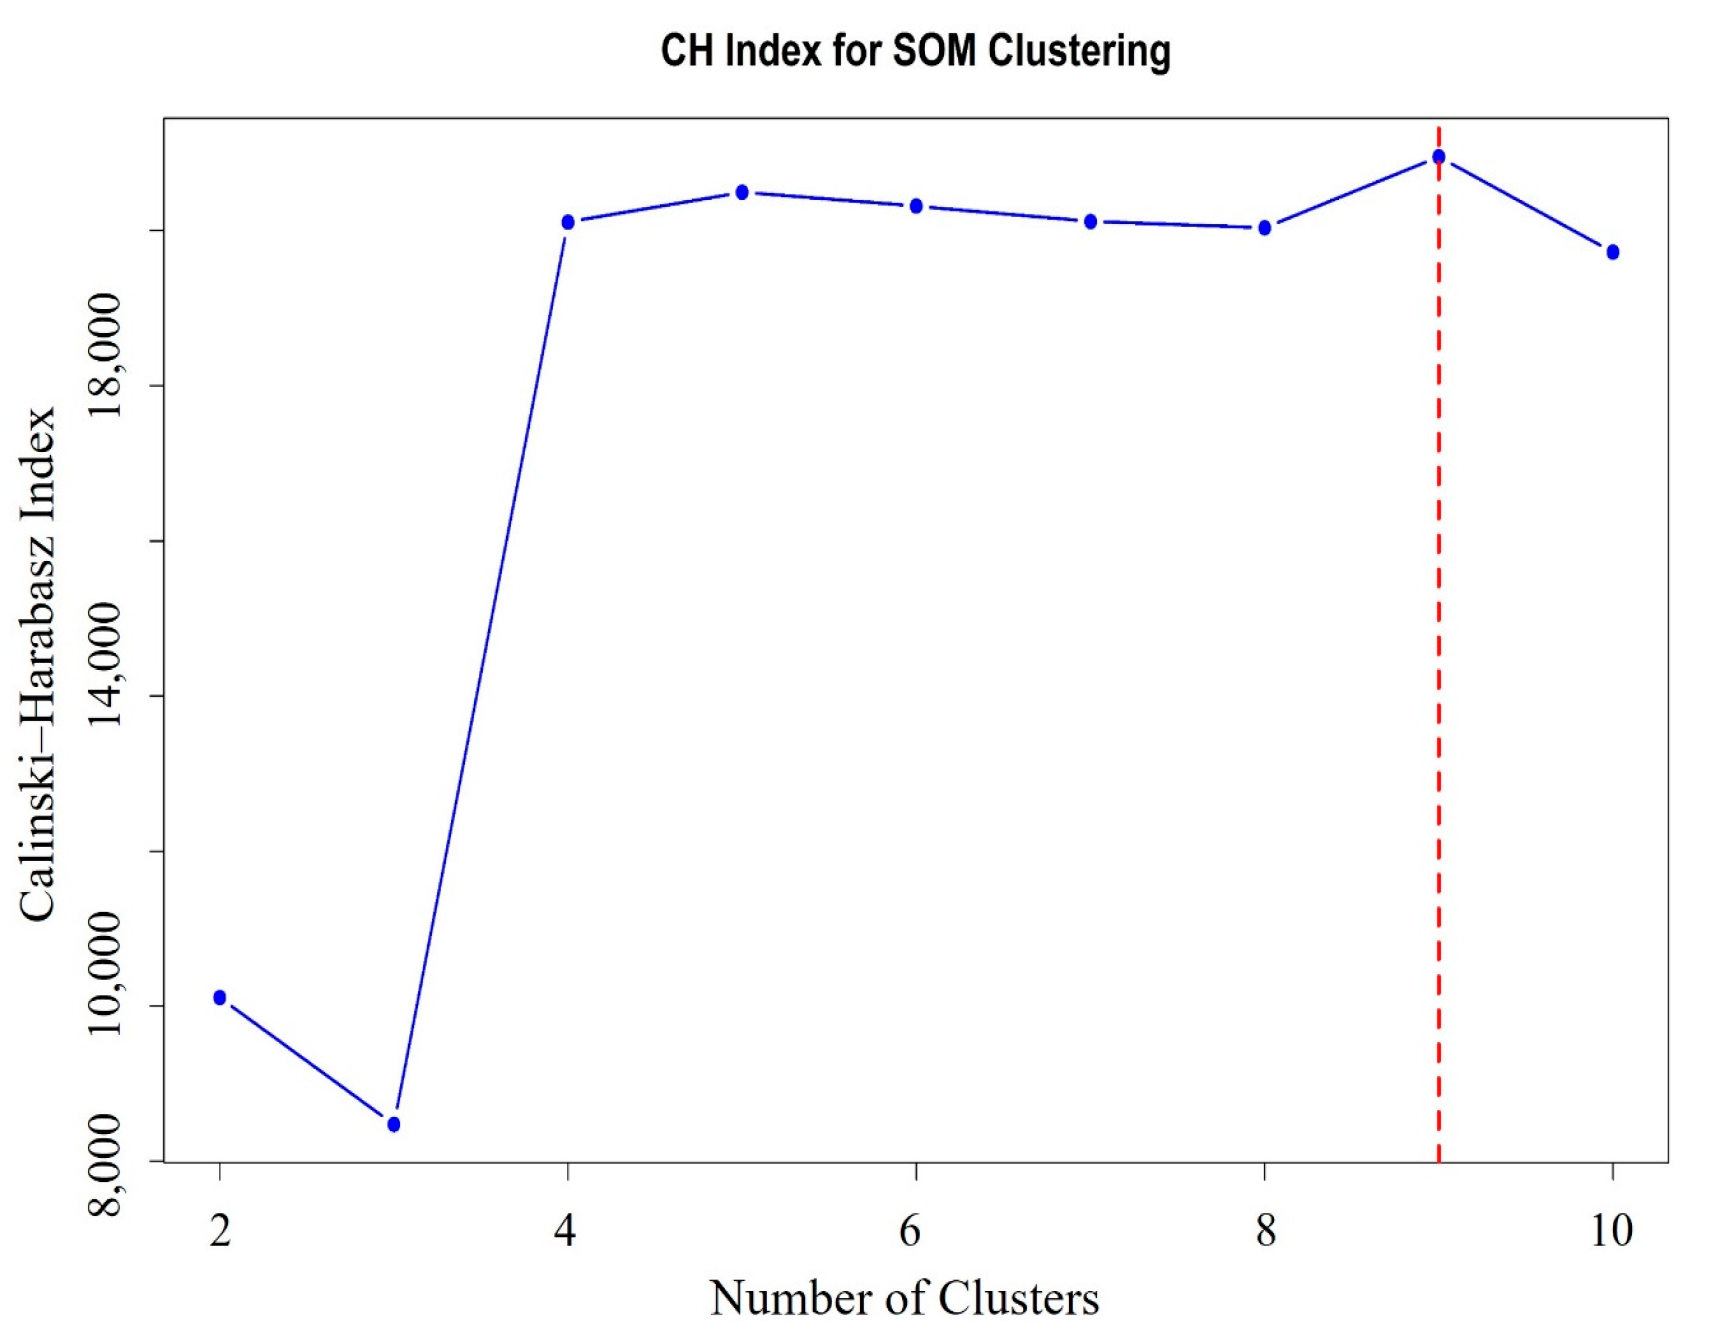
3.3. Spatial Differentiation of ES Supply–Demand Bundles Across Dual Scales
3.4. Dual-Scale Driver Analysis
3.4.1. Model Performance Evaluation
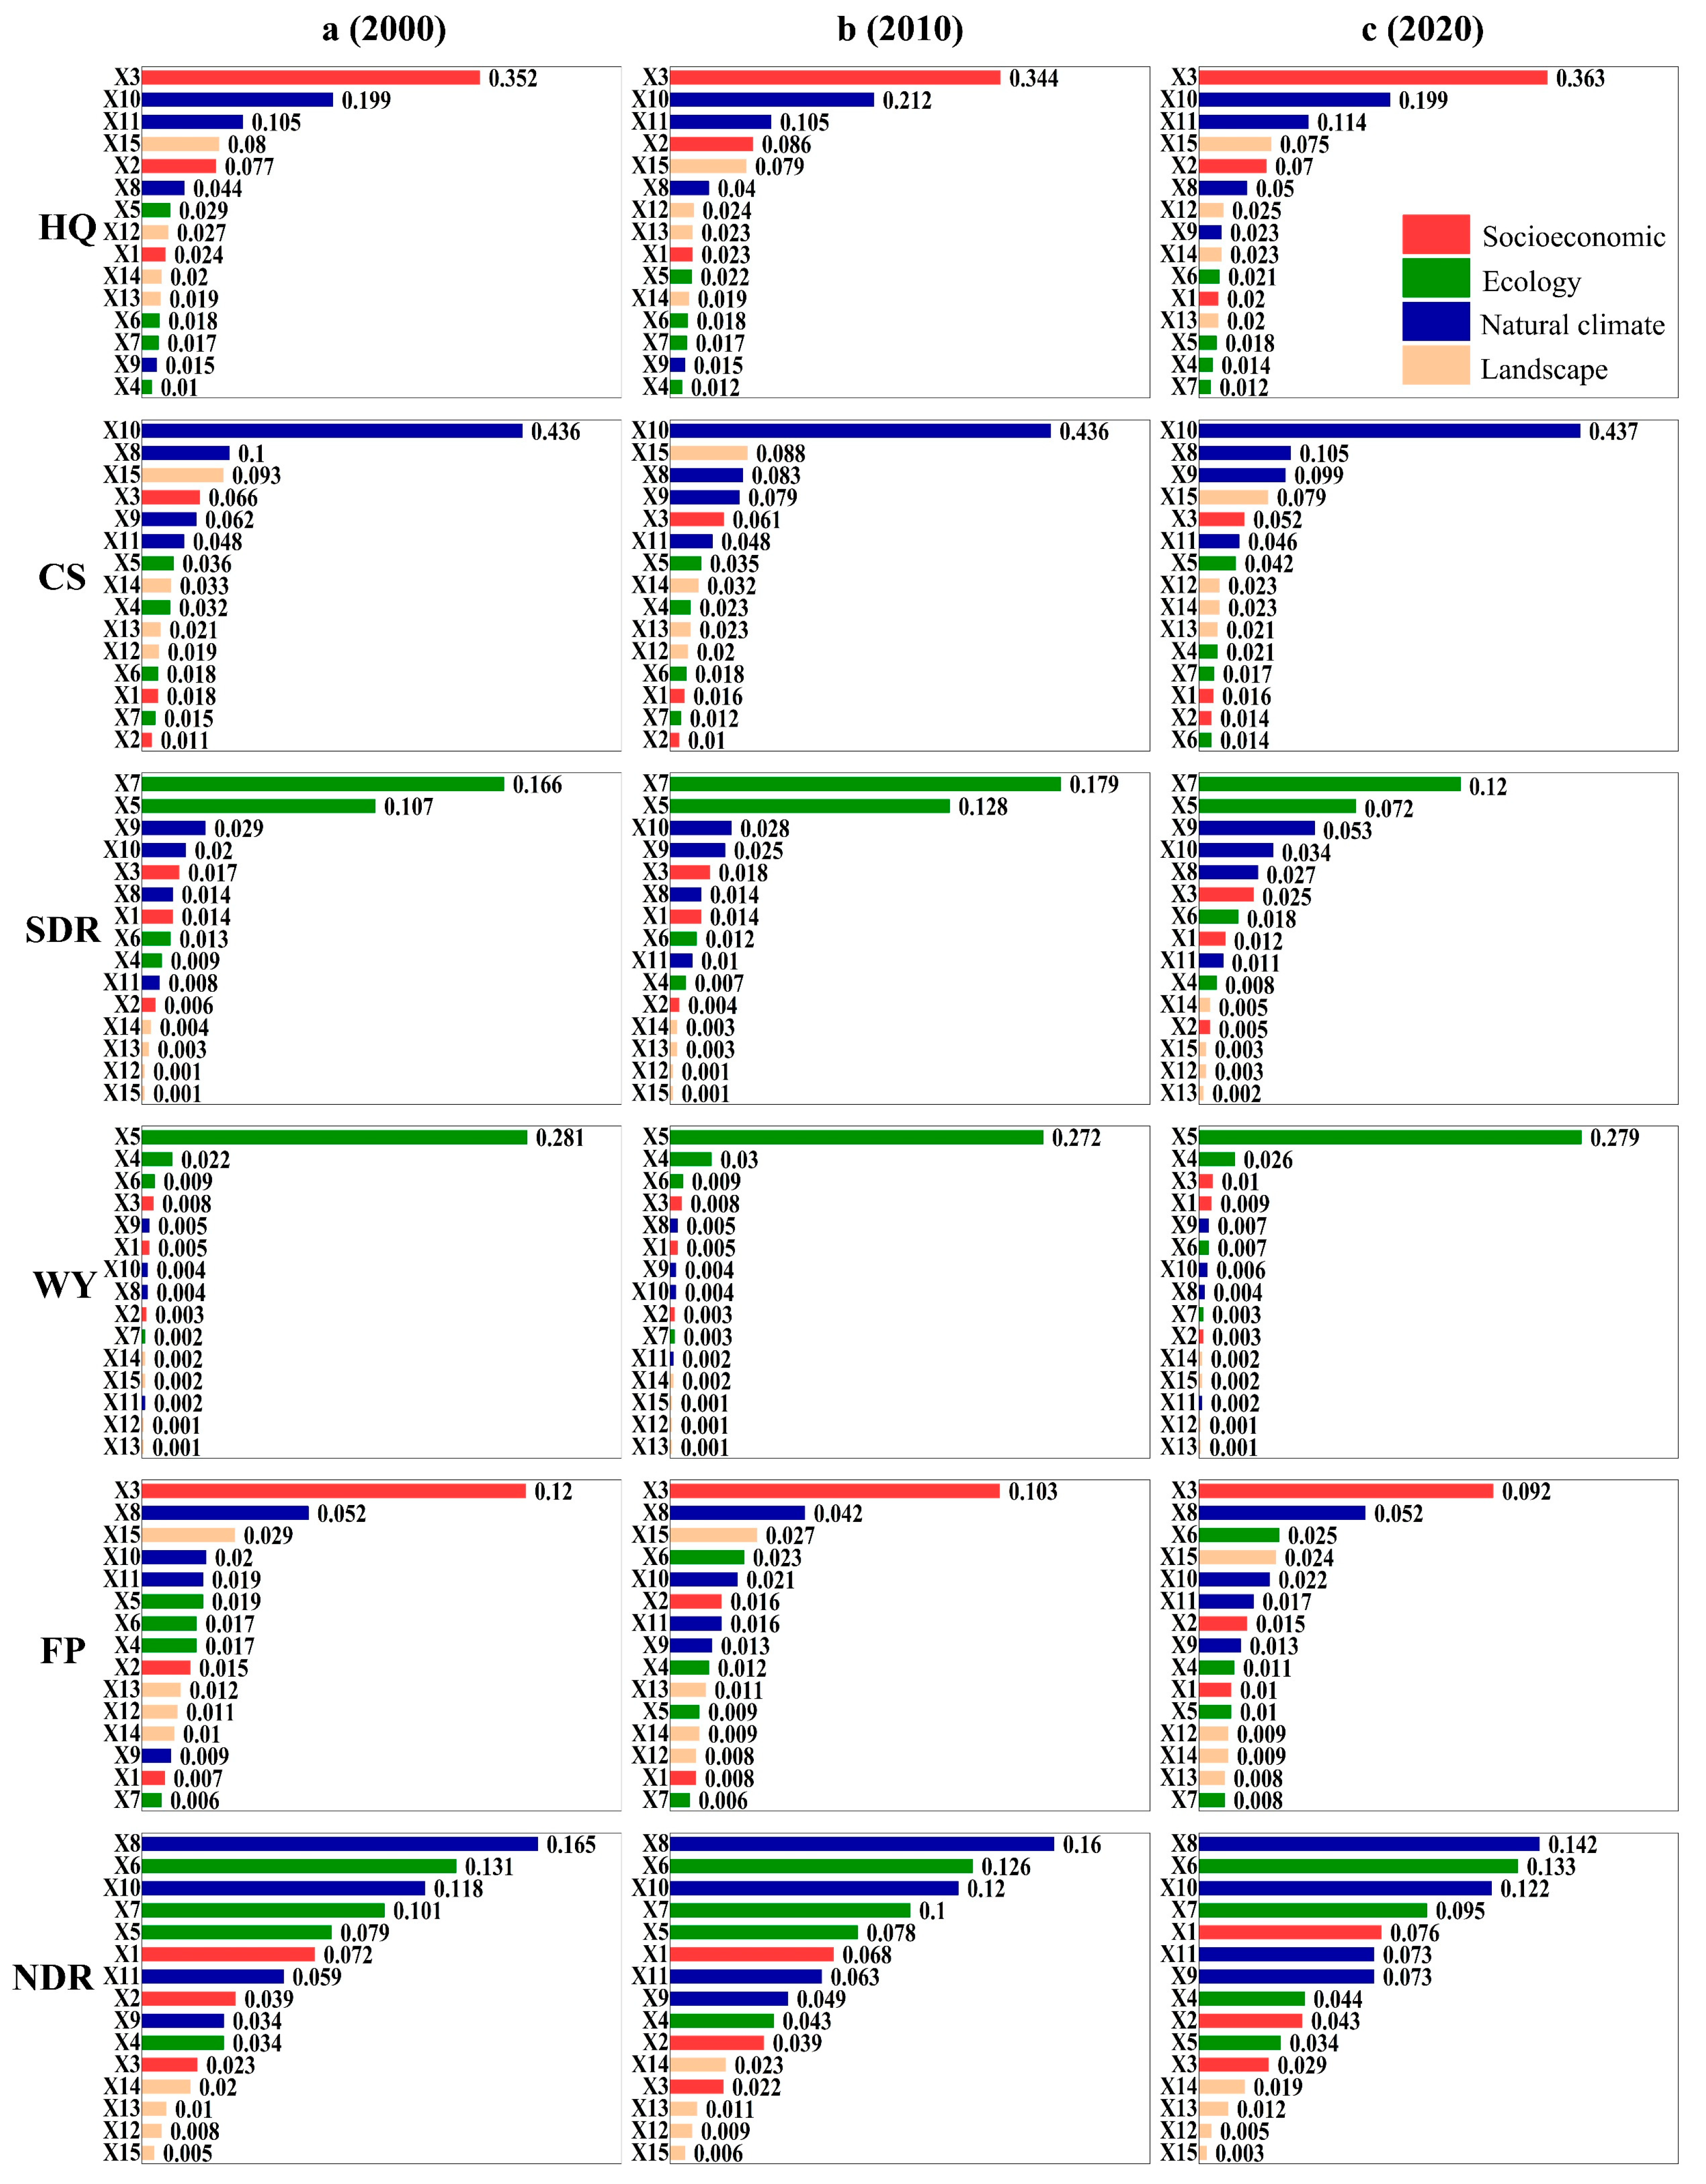
3.4.2. Analysis of Driving Factors at the Grid Scale
3.4.3. Analysis of Driving Factors at the City Scale
4. Discussion
4.1. The Characteristics of ES Supply and Demand
4.2. Influence of Spatial Scale on Driving Factors
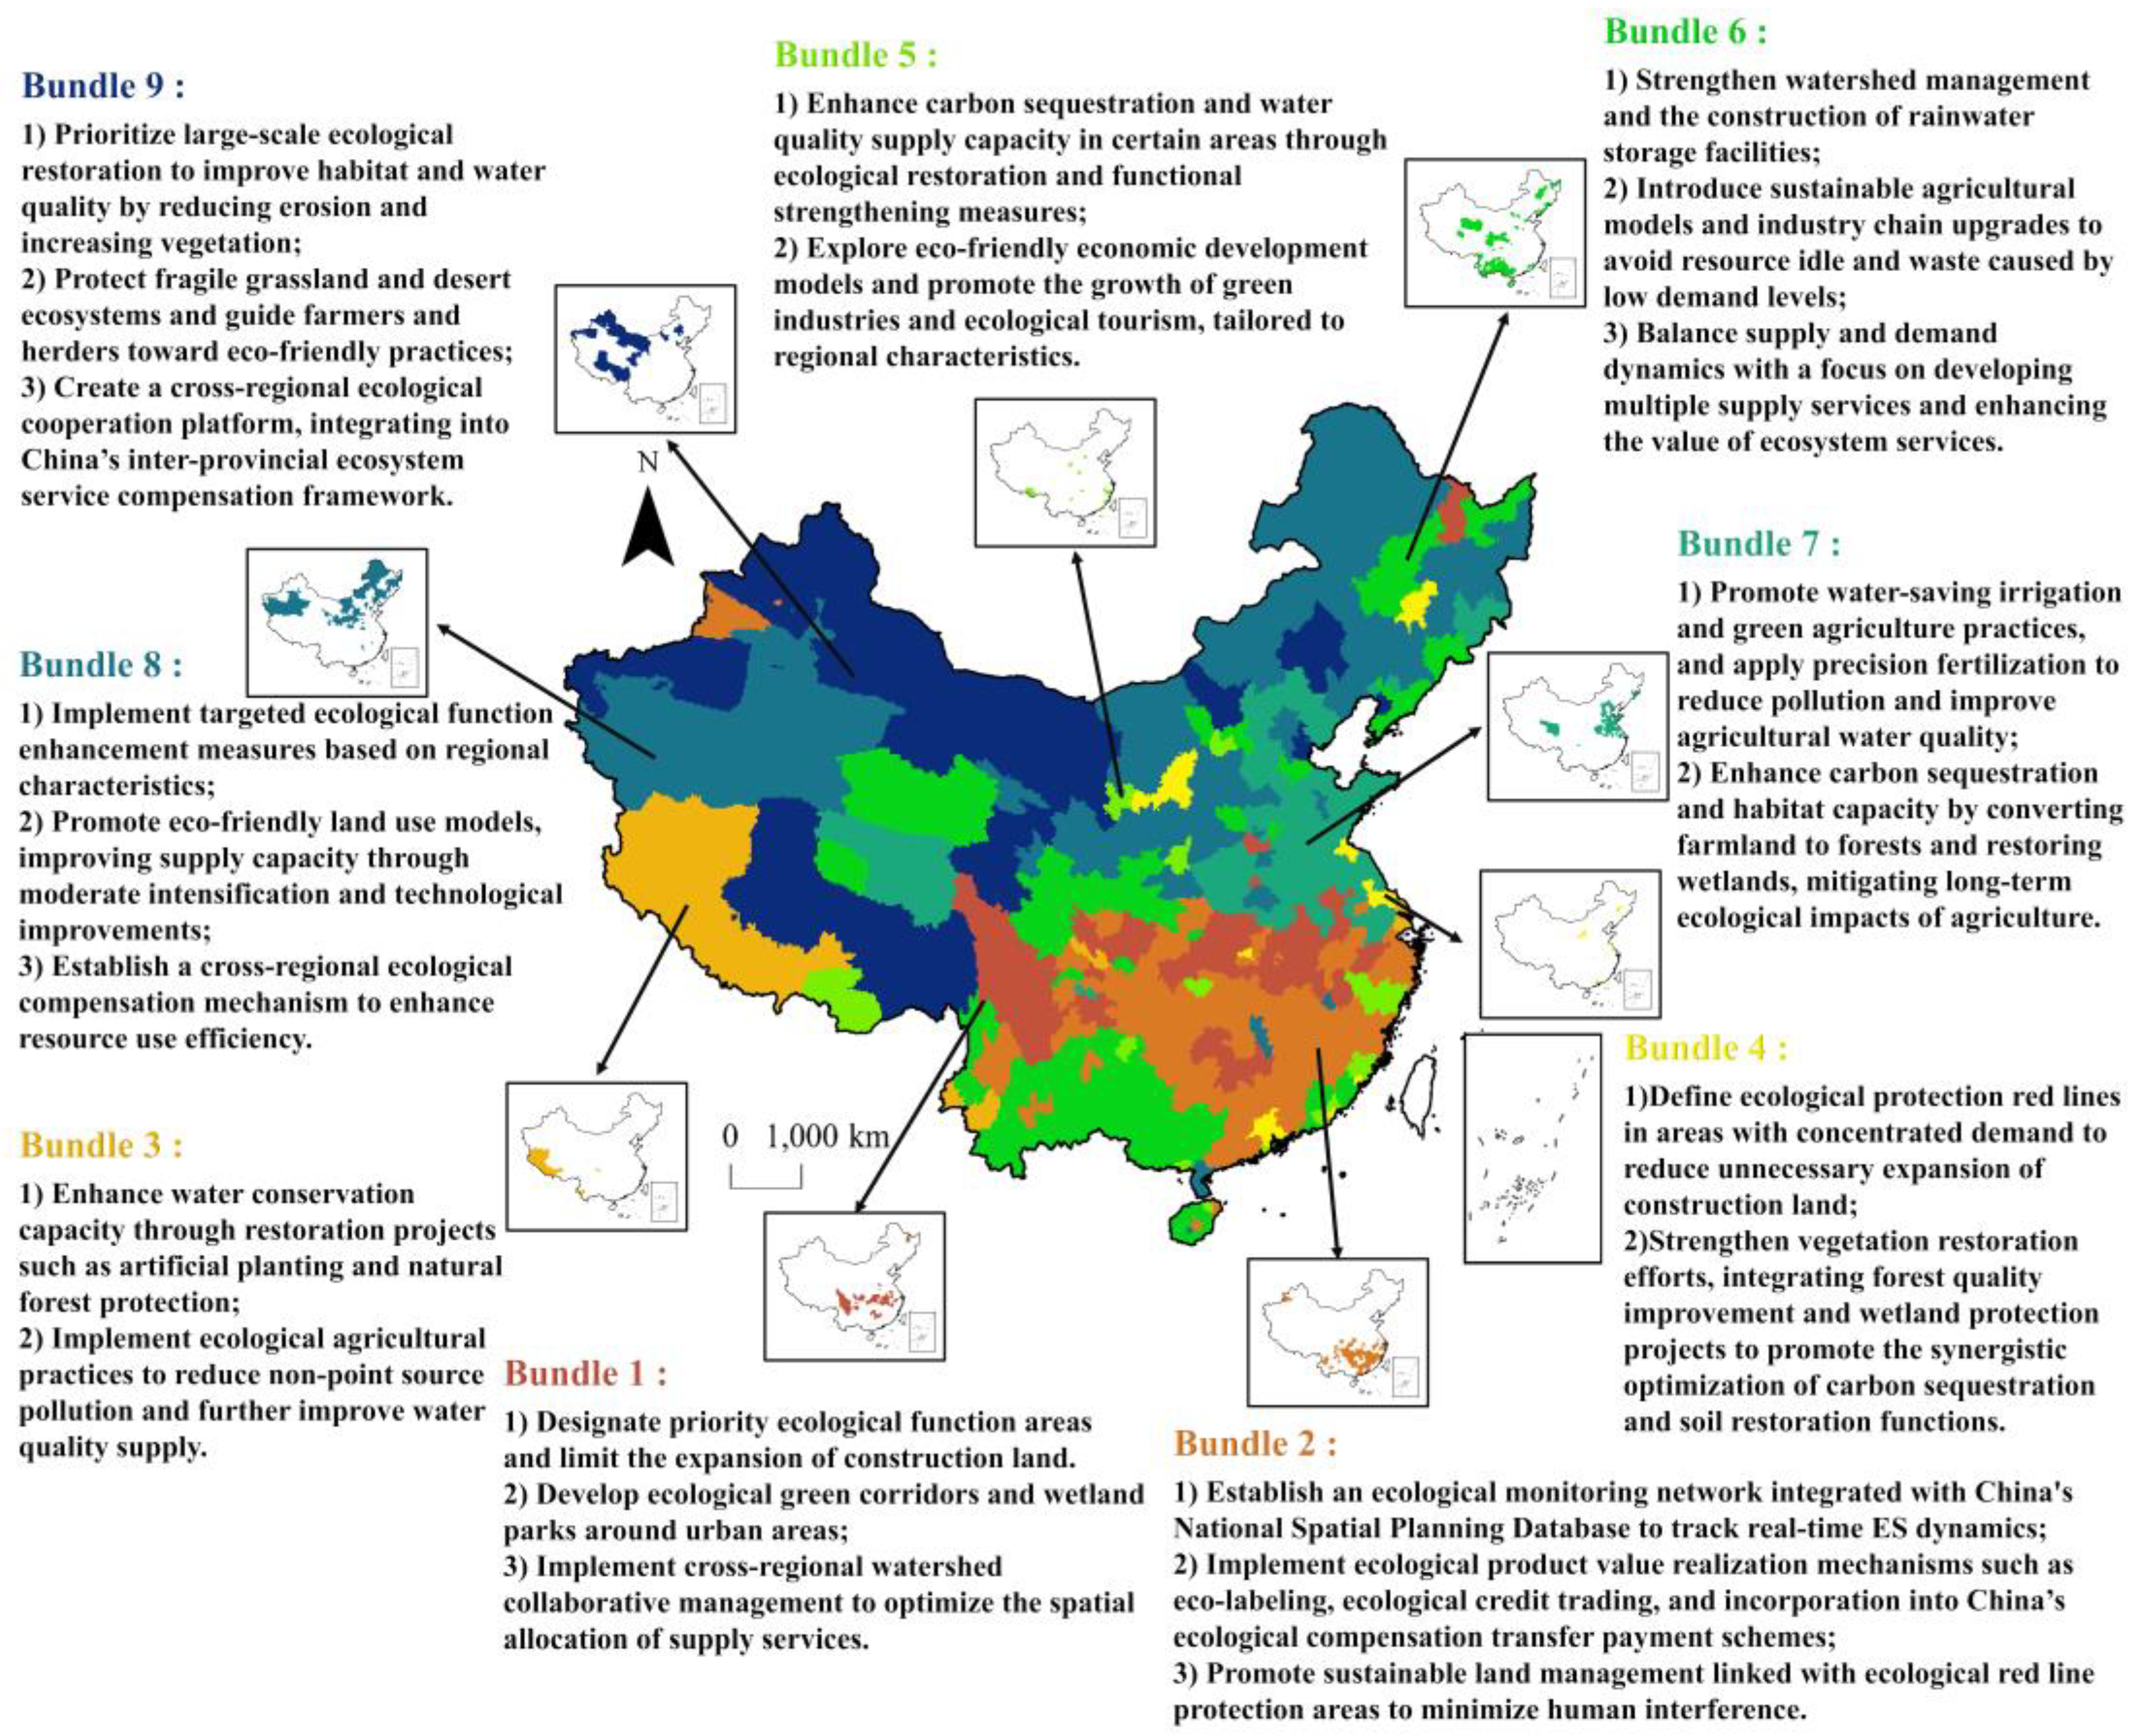
4.3. Localized Management Strategies for Dual-Scale ES Supply–Demand Bundles
5. Conclusions
Supplementary Materials
Author Contributions
Funding
Institutional Review Board Statement
Informed Consent Statement
Data Availability Statement
Acknowledgments
Conflicts of Interest
References
- Gallardo, B.; Bacher, S.; Barbosa, A.M.; Gallien, L.; González-Moreno, P.; Martínez-Bolea, V.; Sorte, C.; Vimercati, G.; Vilà, M. Risks posed by invasive species to the provision of ecosystem services in Europe. Nat. Commun. 2024, 15, 2631. [Google Scholar] [CrossRef]
- He, L.; Xie, Z.; Wu, H.; Liu, Z.; Zheng, B.; Wan, W. Exploring the interrelations and driving factors among typical ecosystem services in the Yangtze river economic Belt, China. J. Environ. Manag. 2024, 351, 119794. [Google Scholar] [CrossRef] [PubMed]
- Liu, C.; Yang, M.; Hou, Y.; Xue, X. Ecosystem service multifunctionality assessment and coupling coordination analysis with land use and land cover change in China’s coastal zones. Sci. Total Environ. 2021, 797, 149033. [Google Scholar] [CrossRef]
- Xu, W.; Xiao, Y.; Zhang, J.; Yang, W.; Zhang, L.; Hull, V.; Wang, Z.; Zheng, H.; Liu, J.; Polasky, S.; et al. Strengthening protected areas for biodiversity and ecosystem services in China. Proc. Natl. Acad. Sci. USA 2017, 114, 1601–1606. [Google Scholar] [CrossRef] [PubMed]
- Cui, F.; Tang, H.; Zhang, Q.; Wang, B.; Dai, L. Integrating ecosystem services supply and demand into optimized management at different scales: A case study in Hulunbuir, China. Ecosyst. Serv. 2019, 39, 100984. [Google Scholar] [CrossRef]
- Yuan, Y.; Bai, Z.; Zhang, J.; Huang, Y. Investigating the trade-offs between the supply and demand for ecosystem services for regional spatial management. J. Environ. Manag. 2023, 325, 116591. [Google Scholar] [CrossRef]
- Xue, C.; Xue, L.; Chen, J.; Tarolli, P.; Chen, X.; Zhang, H.; Qian, J.; Zhou, Y.; Liu, X. Understanding driving mechanisms behind the supply-demand pattern of ecosystem services for land-use administration: Insights from a spatially explicit analysis. J. Clean. Prod. 2023, 427, 139239. [Google Scholar] [CrossRef]
- Gou, M.; Li, L.; Ouyang, S.; Wang, N.; La, L.; Liu, C.; Xiao, W. Identifying and analyzing ecosystem service bundles and their socioecological drivers in the Three Gorges Reservoir Area. J. Clean. Prod. 2021, 307, 127208. [Google Scholar] [CrossRef]
- Tian, P.; Liu, Y.; Li, J.; Pu, R.; Cao, L.; Zhang, H. Spatiotemporal patterns of urban expansion and trade-offs and synergies among ecosystem services in urban agglomerations of China. Ecol. Indic. 2023, 148, 110057. [Google Scholar] [CrossRef]
- Feng, Z.; Jin, X.; Chen, T.; Wu, J. Understanding trade-offs and synergies of ecosystem services to support the decision-making in the Beijing–Tianjin–Hebei region. Land. Use Policy 2021, 106, 105446. [Google Scholar] [CrossRef]
- Huang, J.; Xia, Z.; Liu, L. Impacts of landscape configurations on ecosystem services and their trade-offs across different landscape compositions. Ecosyst. Serv. 2024, 70, 101666. [Google Scholar] [CrossRef]
- Zuo, L.; Gao, J. Investigating the compounding effects of environmental factors on ecosystem services relationships for Ecological Conservation Red Line areas. Land. Degrad. Dev. 2021, 32, 4609–4623. [Google Scholar] [CrossRef]
- He, G.; Zhang, L.; Wei, X.; Jin, G. Scale effects on the supply–demand mismatches of ecosystem services in Hubei Province, China. Ecol. Indic. 2023, 153, 110461. [Google Scholar] [CrossRef]
- Ou, D.H.; Wu, N.J.; Li, Y.X.; Ma, Q.; Zheng, S.Y.; Li, S.Q.; Yu, D.R.; Tang, H.L.; Gao, X.S. Delimiting Ecological Space and Simulating Spatial-Temporal Changes in Its Ecosystem Service Functions Based on a Dynamic Perspective: A Case Study on Qionglai City of Sichuan Province, China. J. Resour. Ecol. 2022, 13, 1128–1142. [Google Scholar] [CrossRef]
- Chang, B.; Chen, B.; Chen, W.; Xu, S.; He, X.; Yao, J.; Huang, Y. Analysis of trade-off and synergy of ecosystem services and driving forces in urban agglomerations in Northern China. Ecol. Indic. 2024, 165, 112210. [Google Scholar] [CrossRef]
- Jin, G.; Deng, X.Z.; Dong, Y.; Wu, F. China’s multidimensional poverty measurement and its spatiotemporal interaction characteristics in the perspective of development geography. Acta Geogr. Sin. 2020, 75, 1633–1646. [Google Scholar]
- Geng, Y.W.; Li, X.S.; Chen, J.Q.; Liu, X.Z.; Zhang, J.X.; Cheng, J.M. Coupling relationship and transition mechanism between resilience and efficiency in China’s territorial space. Acta Ecol. Sin. 2024, 44, 6003–6019. [Google Scholar]
- Liu, J.; Wang, H.; Hui, L.; Tang, B.; Zhang, L.; Jiao, L. Identifying the Coupling Coordination Relationship between Urbanization and Ecosystem Services Supply–Demand and Its Driving Forces: Case Study in Shaanxi Province, China. Remote Sens. 2024, 16, 2383. [Google Scholar] [CrossRef]
- Xu, J.; Wang, S.; Xiao, Y.; Xie, G.; Wang, Y.; Zhang, C.; Li, P.; Lei, G. Mapping the spatiotemporal heterogeneity of ecosystem service relationships and bundles in Ningxia, China. J. Clean. Prod. 2021, 294, 126216. [Google Scholar] [CrossRef]
- Yuan, Z.; Liang, Y.; Zhao, H.; Wei, D.; Wang, X. Trade-offs and synergies between ecosystem services on the Tibetan Plateau. Ecol. Indic. 2024, 158, 111384. [Google Scholar] [CrossRef]
- Sun, X.; Liu, H.; Liao, C.; Nong, H.; Yang, P. Understanding recreational ecosystem service supply-demand mismatch and social groups’ preferences: Implications for urban-rural planning. Landsc. Urban. Plan. 2024, 241, 104903. [Google Scholar] [CrossRef]
- Zhou, B.; Chen, G.; Yu, H.; Zhao, J.; Yin, Y. Revealing the Nonlinear Impact of Human Activities and Climate Change on Ecosystem Services in the Karst Region of Southeastern Yunnan Using the XGBoost–SHAP Model. Forests 2024, 15, 1420. [Google Scholar] [CrossRef]
- Ouyang, N.; Rui, X.; Zhang, X.; Tang, H.; Xie, Y. Spatiotemporal evolution of ecosystem health and its driving factors in the southwestern karst regions of China. Ecol. Indic. 2024, 166, 112530. [Google Scholar] [CrossRef]
- Zhang, J.; Ma, X.; Zhang, J.; Sun, D.; Zhou, X.; Mi, C.; Wen, H. Insights into geospatial heterogeneity of landslide susceptibility based on the SHAP-XGBoost model. J. Environ. Manag. 2023, 332, 117357. [Google Scholar] [CrossRef] [PubMed]
- Zhao, X.; Xu, Y.; Pu, J.; Tao, J.; Chen, Y.; Huang, P.; Shi, X.; Ran, Y.; Gu, Z. Achieving the supply-demand balance of ecosystem services through zoning regulation based on land use thresholds. Land Use Policy 2024, 139, 107056. [Google Scholar] [CrossRef]
- Jaligot, R.; Chenal, J.; Bosch, M. Assessing spatial temporal patterns of ecosystem services in Switzerland. Landsc. Ecol. 2019, 34, 1379–1394. [Google Scholar] [CrossRef]
- Chen, Y.; Lu, Y.; Meng, R.; Li, S.; Zheng, L.; Song, M. Multi-scale matching and simulating flows of ecosystem service supply and demand in the Wuhan metropolitan area, China. J. Clean. Prod. 2024, 476, 143648. [Google Scholar] [CrossRef]
- Wen, Y.; Li, H.; Zhang, X.; Li, T. Ecosystem services in Jiangsu province: Changes in the supply and demand patterns and its influencing factors. Front. Environ. Sci. 2022, 10, 931735. [Google Scholar] [CrossRef]
- Huang, Y.; Wu, J. Spatial and temporal driving mechanisms of ecosystem service trade-off/synergy in national key urban agglomerations: A case study of the Yangtze River Delta urban agglomeration in China. Ecol. Indic. 2023, 154, 110800. [Google Scholar] [CrossRef]
- Costanza, R.; de Groot, R.; Braat, L.; Kubiszewski, I.; Fioramonti, L.; Sutton, P.; Farber, S.; Grasso, M. Twenty years of ecosystem services: How far have we come and how far do we still need to go? Ecosyst. Serv. 2017, 28, 1–16. [Google Scholar] [CrossRef]
- Tao, Q.; Gao, G.; Xi, H.; Wang, F.; Cheng, X.; Ou, W.; Tao, Y. An integrated evaluation framework for multiscale ecological protection and restoration based on multi-scenario trade-offs of ecosystem services: Case study of Nanjing City, China. Ecol. Indic. 2022, 140, 108962. [Google Scholar] [CrossRef]
- Wang, L.; Gong, J.; Ma, S.; Wu, S.; Zhang, X.; Jiang, J. Ecosystem service supply–demand and socioecological drivers at different spatial scales in Zhejiang Province, China. Ecol. Indic. 2022, 140, 109058. [Google Scholar] [CrossRef]
- Shi, Y.; Shi, D.; Zhou, L.; Fang, R. Identification of Ecosystem Services Supply and Demand Areas and Simulation of Ecosystem Service Flows in Shanghai. Ecol. Indic. 2020, 115, 106418. [Google Scholar] [CrossRef]
- He, S.Y.; Wang, L.; Chen, J.C.; Qi, Q.; Wang, B.Y.; Li, K.; Li, Z.H.; Li, K. Supply-demand Spatial Pattern of Ecosystem Services and Influencing Factors in Agricultural Production Area: A Case of Sihu Lake Basin in Hubei Province. Resour. Environ. Yangtze Basin 2024, 33, 810–821. [Google Scholar]
- Yang, K.; Han, Q.; Vries, B.D. Urbanization effects on the food-water-energy nexus within ecosystem services: A case study of the Beijing-Tianjin-Hebei urban agglomeration in China. Ecol. Indic. 2024, 160, 111845. [Google Scholar] [CrossRef]
- Hou, W.; Hu, T.; Yang, L.; Liu, X.; Zheng, X.; Pan, H.; Zhang, X.; Xiao, S.; Deng, S. Matching ecosystem services supply and demand in China’s urban agglomerations for multiple-scale management. J. Clean. Prod. 2023, 420, 138351. [Google Scholar] [CrossRef]
- Zhou, L.; Li, M.; Guan, D.; Tan, S.; Wang, C.; Cao, J.; Zhu, K.; He, X. Quantitative identification on spatial mismatch characteristics between supply and demand of carbon sequestration services. J. Environ. Manag. 2024, 365, 121636. [Google Scholar] [CrossRef]
- Li, Y.; Luo, H. Trade-off/synergistic changes in ecosystem services and geographical detection of its driving factors in typical karst areas in southern China. Ecol. Indic. 2023, 154, 110811. [Google Scholar] [CrossRef]
- Hu, B.; Xie, M.; He, R.; Shi, Z.; Zhou, Y.; Ni, H.; Li, H. Spatio-temporal evolution of cropland ecosystem services value and its spatially varying dominate over the past two decades: A case study in Jiangxi Province in southern China. J. Clean. Prod. 2023, 427, 139228. [Google Scholar] [CrossRef]
- Ren, J.; Ma, R.; Huang, Y.; Wang, Q.; Guo, J.; Li, C.; Zhou, W. Identifying the trade-offs and synergies of land use functions and their influencing factors of Lanzhou-Xining urban agglomeration in the upper reaches of Yellow River Basin, China. Ecol. Indic. 2024, 158, 111279. [Google Scholar] [CrossRef]
- Xu, Y.; Song, X.; Deng, M.; Bai, T.; Tao, W. Shifting from Trade-Offs to Synergies in Ecosystem Services Through Effective Ecosystem Management in Arid Areas. Remote Sens. 2024, 16, 4115. [Google Scholar] [CrossRef]
- Feng, M.; Xiong, K.; Chen, Y.; Zhang, W.; Xu, M. The Temporal Variation and Spatial Scale Dependence of the Trade-Offs and Synergies among Multiple Ecosystem Services in the World Heritage Site of South China Karst. Land 2024, 13, 1391. [Google Scholar] [CrossRef]
- Qiu, J.; Carpenter, S.R.; Booth, E.G.; Motew, M.; Kucharik, C.J. Spatial and temporal variability of future ecosystem services in an agricultural landscape. Landsc. Ecol. 2020, 35, 2569–2586. [Google Scholar] [CrossRef]
- Feng, L.; Lei, G.P. Study on Spatial-temporal Evolution Characteristics and Functional Zoning of Ecosystem Services and Trade-offs/Synergies Relationships in Northeastern China. China Land Sci. 2023, 37, 100–113. [Google Scholar]
- Zhang, Z.; Shi, K.; Tang, L.; Su, K.; Zhu, Z.; Yang, Q. Exploring the spatiotemporal evolution and coordination of agricultural green efficiency and food security in China using ESTDA and CCD models. J. Clean. Prod. 2022, 374, 133967. [Google Scholar] [CrossRef]
- Liu, X.; Jin, X.; Luo, X.; Zhou, Y. Quantifying the spatiotemporal dynamics and impact factors of China’s county-level carbon emissions using ESTDA and spatial econometric models. J. Clean. Prod. 2023, 410, 137203. [Google Scholar] [CrossRef]
- Gong, L.; Wang, L.; Hu, R.; Lu, X.; Sun, Y.; Zhang, S.; Zhang, G.; Tan, B. Identification of unique ecosystem service bundles in farmland-A case study in the Huang-Huai-Hai Plain of China. J. Environ. Manag. 2024, 370, 122516. [Google Scholar] [CrossRef]
- Li, W.; Kang, J.; Wang, Y. Identifying the impacts of landscape structure on ecosystem services trade-offs among ecosystem services bundles in the mountains of Southwest China. Ecol. Eng. 2024, 209, 107419. [Google Scholar] [CrossRef]
- Peng, Y.; Chen, W.; Pan, S.; Gu, T.; Zeng, J. Identifying the driving forces of global ecosystem services balance, 2000–2020. J. Clean. Prod. 2023, 426, 139019. [Google Scholar] [CrossRef]
- Jas, K.; Dodagoudar, G.R. Explainable machine learning model for liquefaction potential assessment of soils using XGBoost-SHAP. Soil. Dyn. Earthq. Eng. 2023, 165, 107662. [Google Scholar] [CrossRef]
- Tian, Y.; Zhang, Q.; Tao, J.; Zhang, Y.; Lin, J.; Bai, X. Use of interpretable machine learning for understanding ecosystem service trade-offs and their driving mechanisms in karst peak-cluster depression basin, China. Ecol. Indic. 2024, 166, 112474. [Google Scholar] [CrossRef]
- Wei, Y.; Wu, S.; Jiang, C.; Feng, X. Managing supply and demand of ecosystem services in dryland catchments. Curr. Opin. Environ. Sustain. 2021, 48, 10–16. [Google Scholar] [CrossRef]
- Sun, W.; Li, D.; Wang, X.; Li, R.; Li, K.; Xie, Y. Exploring the scale effects, trade-offs and driving forces of the mismatch of ecosystem services. Ecol. Indic. 2019, 103, 617–629. [Google Scholar] [CrossRef]
- Yu, Y.; Wang, Y.; Li, J.; Han, L.; Zhang, S. Optimizing Management of the Qinling–Daba Mountain Area Based on Multi-Scale Ecosystem Service Supply and Demand. Land 2023, 12, 1744. [Google Scholar] [CrossRef]
- Gao, M.; Hu, Y.; Liu, X.; Liang, M. Revealing multi-scale characteristics of ecosystem services supply and demand imbalance to enhance refined ecosystem management in China. Ecol. Indic. 2025, 170, 112971. [Google Scholar] [CrossRef]
- Qiao, X.; Gu, Y.; Zou, C.; Xu, D.; Wang, L.; Ye, X.; Yang, Y.; Huang, X. Temporal variation and spatial scale dependency of the trade-offs and synergies among multiple ecosystem services in the Taihu Lake Basin of China. Sci. Total Environ. 2019, 651, 218–229. [Google Scholar] [CrossRef]
- Yang, Y.; Yuan, X.; An, J.; Su, Q.; Chen, B. Drivers of ecosystem services and their trade-offs and synergies in different land use policy zones of Shaanxi Province, China. J. Clean. Prod. 2024, 452, 142077. [Google Scholar] [CrossRef]
- Huang, F.; Zuo, L.; Gao, J.; Jiang, Y.; Du, F.; Zhang, Y. Exploring the driving factors of trade-offs and synergies among ecological functional zones based on ecosystem service bundles. Ecol. Indic. 2023, 146, 109827. [Google Scholar] [CrossRef]
- Xia, H.; Yuan, S.; Prishchepov, A.V. Spatial-temporal heterogeneity of ecosystem service interactions and their social-ecological drivers: Implications for spatial planning and management. Resour. Conserv. Recycl. 2023, 189, 106767. [Google Scholar] [CrossRef]
- Wang, G.; Yue, D.; Niu, T.; Yu, Q. Regulated Ecosystem Services Trade-Offs: Synergy Research and Driver Identification in the Vegetation Restoration Area of the Middle Stream of the Yellow River. Remote Sens. 2022, 14, 718. [Google Scholar] [CrossRef]
- Liu, H.; Liu, S.; Wang, F.; Liu, Y.; Han, Z.; Wang, Q.; Yu, L.; Dong, Y.; Sun, J. Multilevel driving factors affecting ecosystem services and biodiversity dynamics on the Qinghai-Tibet Plateau. J. Clean. Prod. 2023, 396, 136448. [Google Scholar] [CrossRef]
- Gu, W.; Wu, C.F.; Xu, Z.G.; You, H.Y.; Wang, M.J. Planning lag and planning paradox: A new perspective of territorial spatial planning. J. Nat. Resour. 2024, 39, 2881–2896. [Google Scholar] [CrossRef]
- Li, X.; Xiao, L.; Tian, C.; Zhu, B.; Chevallier, J. Impacts of the ecological footprint on sustainable development: Evidence from China. J. Clean. Prod. 2022, 352, 131472. [Google Scholar] [CrossRef]







| Data Type | Data Format and Scale | Year | Data Source |
|---|---|---|---|
| Land use/land cover | Raster, 30 m | 2000, 2010, 2020 | https://zenodo.org/records/12779975 (accessed on 7 December 2024) |
| DEM (digital elevation model) | Raster, 30 m | 2009 | https://lpdaac.usgs.gov/products/astgtmv003/ (accessed on 12 December 2024) |
| Precipitation | Raster, 1 km2 | 2000, 2010, 2020 | https://data.tpdc.ac.cn/ (accessed on 12 December 2024) |
| Temperature | Raster, 1 km2 | 2000, 2010, 2020 | https://data.tpdc.ac.cn/ (accessed on 12 December 2024) |
| Potential evapotranspiration | Raster, 500 m | 2000, 2010, 2020 | https://lpdaac.usgs.gov/products/mod16a2gfv061/ (accessed on 12 December 2024) |
| Land surface temperature | Raster, 1 km2 | 2000, 2010, 2020 | https://developers.google.com/earth-engine/datasets/catalog/MODIS_006_MOD11A1?hl=zh-cn (accessed on 21 December 2024) |
| Soil data | Raster, 1 km2 | 2009 | https://data.tpdc.ac.cn/zh-hans/data/611f7d50-b419-4d14-b4dd-4a944b141175/ (accessed on 12 December 2024) |
| Statistical data | Spreadsheet | 20011, 2011, 2021 | https://www.stats.gov.cn/sj/ndsj/ (accessed on 24 December 2024) |
| GDP | Raster, 1 km2 | 2000, 2010, 2020 | https://www.resdc.cn/ (accessed on 24 December 2024) |
| NDVI (normalized difference vegetation index) | Raster, 250 m | 2000, 2010, 2020 | https://developers.google.com/earth-engine/datasets/catalog/MODIS_006_MOD13Q1?hl=zh-cn (accessed on 21 December 2024) |
| NPP (net primary productivity) | Raster, 500 m | 2000, 2010, 2020 | https://wiki.earthdata.nasa.gov/display/DAS/ (accessed on 21 December 2024) |
| POP | Raster, 1 km2 | 2000, 2010, 2020 | https://www.worldpop.org/ (accessed on 24 December 2024) |
| Types of ES | Quantitative Approaches Supply | Demand | Details of Each Parameter | References |
|---|---|---|---|---|
| HQ | represents the habitat quality index of the -th landscape at grid , is the habitat suitability value, and the range is 0–1. is the scaling constant; is the half saturation constant. denotes the habitat degradation degree. represents the habitat quality demand at grid ; is the land use intensity; is the population density at grid (persons·grid−1); is the GDP at grid (yuan·grid−1); is the night-time light intensity at grid . | [31,32] | ||
| CS | is the entire storage of carbon, and and are the carbon stocks in above-ground and below-ground vegetation in grid . and are the carbon stocks in deceased organic matter and soil, respectively. is the carbon sequestration demand in grid ; is the population density of grid ; n is the category of energy consumed; represents the amount (million tons of standard coal) of -type energy following conversion to standard coal. is the carbon emission coefficient of the -type energy, set to be 0.68, and represents the population. | [31,33] | ||
| SDR | is the soil conservation supply (tons) in grid ; , , , , and are the rainfall erosion, soil erosion, slope-length gradient, vegetation cover, and support practice factor in grid , respectively. is the soil retention demand (tons) in grid . | [32,34] | ||
| WY | represents the annual water yield of grid , and and are the annual precipitation and actual evapotranspiration, respectively. is the water demand of grid (m3), is the volume of water used for residents living (m3), and is the population (person/km2). | [32,34] | ||
| FP | is the grain production assigned to the -th grid (ton/km2); represents the cumulative production of grains (ton); denotes the NDVI of the x-th grid; is the sum of NDVI of the farmland. is the food consumption (kg) at grid , and represents food consumption per person (kg/person). | [33,35] | ||
| NDR | represents the water purification supply at grid ; is the nitrogen retention at grid (kg); represents the water purification demand at grid (kg); is the nitrogen export at grid (kg); is the allowable nitrogen discharge concentration under ClassIII water quality standard (mg/L); is the annual water yield at grid (m3). | [35] |
| Category | Indicator | Code |
|---|---|---|
| Socioeconomic | GDP | X1 |
| POP | X2 | |
| Land use degree | X3 | |
| Ecology | Normalized difference vegetation index | X4 |
| Net primary productivity | X5 | |
| Forest cover ratio | X6 | |
| Grassland cover ratio | X7 | |
| Natural climate | Land surface temperature | X8 |
| Precipitation | X9 | |
| Digital elevation model | X10 | |
| Slope | X11 | |
| Landscape | Aridity index | X12 |
| Connectivity index | X13 | |
| Largest patch index | X14 | |
| Landscape shape index | X15 |
| Model | Grid Scale | City Scale | ||
|---|---|---|---|---|
| R2 | RMSE | R2 | RMSE | |
| SVM | 0.742 | 0.169 | 0.882 | 0.104 |
| RF | 0.79 | 0.084 | 0.93 | 0.02 |
| XGBoost | 0.798 | 0.081 | 0.939 | 0.017 |
| LightGBM | 0.796 | 0.083 | 0.936 | 0.018 |
| MLR | 0.782 | 0.14 | 0.922 | 0.076 |
Disclaimer/Publisher’s Note: The statements, opinions and data contained in all publications are solely those of the individual author(s) and contributor(s) and not of MDPI and/or the editor(s). MDPI and/or the editor(s) disclaim responsibility for any injury to people or property resulting from any ideas, methods, instructions or products referred to in the content. |
© 2025 by the authors. Licensee MDPI, Basel, Switzerland. This article is an open access article distributed under the terms and conditions of the Creative Commons Attribution (CC BY) license (https://creativecommons.org/licenses/by/4.0/).
Share and Cite
Qi, M.; Sun, M.; Liu, Q.; Tian, H.; Sun, Y.; Yang, M.; Zhang, H. Multi-Scale Ecosystem Service Supply–Demand Dynamics and Driving Mechanisms in Mainland China During the Last Two Decades: Implications for Sustainable Development. Sustainability 2025, 17, 6782. https://doi.org/10.3390/su17156782
Qi M, Sun M, Liu Q, Tian H, Sun Y, Yang M, Zhang H. Multi-Scale Ecosystem Service Supply–Demand Dynamics and Driving Mechanisms in Mainland China During the Last Two Decades: Implications for Sustainable Development. Sustainability. 2025; 17(15):6782. https://doi.org/10.3390/su17156782
Chicago/Turabian StyleQi, Menghao, Mingcan Sun, Qinping Liu, Hongzhen Tian, Yanchao Sun, Mengmeng Yang, and Hui Zhang. 2025. "Multi-Scale Ecosystem Service Supply–Demand Dynamics and Driving Mechanisms in Mainland China During the Last Two Decades: Implications for Sustainable Development" Sustainability 17, no. 15: 6782. https://doi.org/10.3390/su17156782
APA StyleQi, M., Sun, M., Liu, Q., Tian, H., Sun, Y., Yang, M., & Zhang, H. (2025). Multi-Scale Ecosystem Service Supply–Demand Dynamics and Driving Mechanisms in Mainland China During the Last Two Decades: Implications for Sustainable Development. Sustainability, 17(15), 6782. https://doi.org/10.3390/su17156782


