Article

Productivity, Biodiversity and Forage Value of Meadow Sward Depending on Management Intensity and Silicon Application

by
Barbara Borawska-Jarmułowicz
* and
Grażyna Mastalerczuk
Department of Agronomy, Institute of Agriculture, Warsaw University of Life Sciences, Nowoursynowska 166 Str., 02-787 Warsaw, Poland
*
Author to whom correspondence should be addressed.
Sustainability 2025, 17(15), 6717; https://doi.org/10.3390/su17156717
Submission received: 19 June 2025 / Revised: 16 July 2025 / Accepted: 21 July 2025 / Published: 24 July 2025

Abstract

The efficiency and quality of meadows is affected by, among others, the botanical composition of the sward and the frequency of cutting. The research was conducted in 2023–2024 on the experiment established in 2014 on arable land, where 3-species mixtures of grasses and legumes were sown. During the next three years, the sward was fertilized and cut 3-times per year, and then, for five years, was mown twice a year, without fertilization. On the sward formed at that time, in 2023, an experiment was established to evaluate how management intensity (2- or 3-cuts and rate of fertilizer) and silicon application (Si or 0Si) affect botanical composition, yield, and nutrient content in perennial meadow swards under variable precipitation over two years. Species richness rose in the sward in the second year, especially under 3-cut management (from 15 to 21 species). The share of species sown earlier in the mixtures Dactylis glomerata, Festulolium braunii, and Medicago x varia was very high at both management intensities (66–87% DM). Yield and the content of crude protein and nutrients were higher in the 3-cut system in the second and third regrowths. Silicon supplementation increased plant diversity and yield resilience during drought, with more intensive management supporting sustainable forage production. Moreover, the sward contained more nutrients with 3-cuttings in the second and third regrowths. These findings indicate that intensive meadow management and silicon application enhance productivity, forage value, and biodiversity, providing valuable insights for sustainable meadow management strategies.

1. Introduction

In temperate regions, grassland provides most of the feed requirements for ruminants. Its management has implications for agricultural production and environmental quality [1]. Cultivation of mixtures of grasses and legumes provides a valuable source of protein for animals. In sustainable agriculture, this enables the production of feed with small doses of nitrogen fertilization [2]. In particular, alternating grasslands located on arable land, where simple mixtures of grasses and legumes are sown, provide high yields of protein-rich fodder [3]. The use of these mixtures also has a significant impact on the environment, as it not only increases the content of organic matter and minerals in the soil but also affects its structure and physicochemical features [4]. Legumes also increase the biodiversity of grass communities, and by fixing atmospheric nitrogen via rhizobial symbiosis, they help to limit mineral fertilization with this component, which reduces the costs of feed production and protects the natural environment [5,6]. The species composition of grasslands is an important factor because it affects the quality of forage and animal feed. Legumes and herbaceous plants are valuable components of meadow communities, a rich source of essential nutrients with therapeutic and medicinal properties, as well as other compounds that affect the intake and use of feed by animals [5].
Drought events can have very different effects on grassland yields, depending on local conditions such as soil type, pre-drought climatic conditions, and management intensity [7]. The increasing frequency of extreme weather conditions related to global climate change, especially long-term droughts, is affecting changes in grassland productivity [8]. Due to ongoing climate change, the use of various types of growth regulators and biostimulants is becoming increasingly important to achieve higher and better-quality yields [9,10]. The use of biostimulants helps plants to absorb nutrients, to grow a stronger root system, and to produce more green matter, especially leaves, thus facilitating plant survival under unfavorable ambient conditions [11,12]. One of several possible methods of reducing the effects of drought stress, which often occurs during the growing season, is the use of a stimulant in the form of silicon. This element blocks the free escape of water from the plant and is responsible for reducing transpiration during drought [13]. Silicon enhances cuticular silicification, reducing stomatal conductance and transpiration [14]. It is considered a component that positively influences plant growth [15]. However, the beneficial effects of silicon application are visible mainly under stressful conditions [16]; plants are less susceptible to lodging and drought [17]. The beneficial effect of silicon may be related to the depression of water loss by transpiration and consequently reduced rate of passive uptake and transport of minerals [14].
Silicon fertilization is mainly used in monocotyledonous cultivation, for example, cereals [18,19,20]. The results of the field experiment of Kowalska et al. [19] confirmed a beneficial effect of silicon fertilizers for organically cultivated spring Triticum aestivum. The plants treated by silicon were better developed, which was expressed by a higher number of emergences, the height of plants, and the density of spikes and yield. Studies conducted on grasslands have shown the effect of foliar application of silicon on the botanical composition and nutritional value of meadow sward [21,22]. It was noted that silicon deficiency under drought conditions limits root growth [23]. The research by Mastalerczuk et al. [24] showed a beneficial effect of silicon application under drought conditions on root dry mass, length, and root area, as well as the ratio of the root mass to the shoot mass of Lolium perenne. Silicon application leads to the development of a two-cell-layer exodermis, which reduces the water losses in L. perenne roots and shoots and consequently improves the drought tolerance of plants.
Some dicotyledonous plants, such as legumes, do not accumulate Si in tissues and tend to exclude this element. These plants take up Si more slowly than water, and they contain less silicon [25]. According to the literature [26,27], legumes may exhibit lower Si uptake due to lacking Si transporters, which are required at least for the uptake, root-to-shoot translocation, and distribution. Moreover, most plant species are not able to accumulate high Si due to the lack of an efficient transport system, therefore failing to benefit from Si.
The value of feed obtained from grasslands is primarily determined by its chemical composition, i.e., the content of organic components (total protein, crude fibre) and minerals, as well as digestibility [28]. Peoples [29] points out that the nutritional value of a plant depends on many factors, including the type of soil, the amount of precipitation and fertilization doses, as well as the stage of its development at harvest. Diets rich in minerals promote animal health, proper development and physiological functions, and increased productivity [30,31].
Feed from temporary grasslands is characterized by a better balance of protein, energy, and mineral content compared to forage obtained from permanent grasslands [32,33], which, according to the European Union definition [34], are defined as land used to grow grasses or other herbaceous forage and which has not been included in the crop rotation of the holding for five years or more.
In animal production where bulk feed is used, fodder plants provide micronutrients such as copper (Cu), manganese (Mn), zinc (Zn), and iron (Fe) [35,36]. The appropriate concentration of micronutrients in herbage is an important criterion when assessing their quality and suitability as livestock feed for farm animals [37]. The content of microelements in herbaceous plants is variable, which reflects the dependence on many factors: species composition of the sward, mowing date, availability of nutritional elements in the soil, and fertilization [38]. A diet poor in micronutrients can have a negative impact on animals, which is visible on industrial dairy farms, where animals are fed mixtures containing only 2–3 species of grasses that are characterized by high yields [36,39]. Mixtures of legumes and grasses contain more minerals in the biomass than monocultures [40,41] and are richer in micronutrients, and are richer in micronutrients, so their supplementation in the animal diet can be reduced [31,42,43]. In the study of Høgh-Jensen and Søegaard [40], grasses sown with legumes were characterized by higher contents of N, Ca, S, Zn, and Cu and a tendency to higher Mg concentration, both in stems and leaves.
The condition for obtaining high nutritional value of bulk feed from permanent grasslands is, among others, the appropriate species composition of the sward [5]. Plant communities with a higher number of species, i.e., higher biodiversity, are expected to make better use of available habitat conditions due to species complementarity and positive interactions between species and may also contain species that show high productivity and dominate the community [44].
Previous studies of Vogel et al. [6] focused on determining the influence of plant biodiversity on resistance and resilience to drought disturbances in grasslands with varying management intensity (combining mowing frequency with annual fertilizer application rate) and showed that the response of experimental grasslands to drought depended on management intensity. Aboveground biomass decreased after induced summer drought only in grasslands with frequent mowing (four times per year), not in grasslands with only two cuts per year. In turn, other research [45] concerning biodiversity showed that the addition of silicon in conditions of increased soil moisture in spring, when the groundwater table is higher, may influence the increase in the number of species and biodiversity. The authors concluded that a larger number of species in the meadow, including dicotyledonous plants, may contribute to the palatability of the sward and, simultaneously, its consumption by animals. In turn, the research by Schaub et al. [46] showed that plant diversity was an important production factor independent of management intensity, as it enhanced quality-adjusted yield similarly to increasing fertilization and cutting frequency.
Our previous studies evaluated the effect of silicon application on the yield, botanical composition, and nutritional value of species as well as the sward of temporary meadow mixtures under 3-cut management [21]. The available literature still provides that the results of many studies on silicon application on plants are inconsistent, and there is a lack of information on the effects of silicon on plants used in different types of grasslands. In this respect, the aim of this research was to assess the effect of management intensity (encompassing different frequencies of cutting, 2–3 times per year, and fertilizer rates) and silicon application on the botanical composition, yield, and content of nutrients in perennial meadow sward. We hypothesized that Si application would mitigate drought-induced yield losses and enhance nutrient retention. To test this, we varied cutting frequency, fertilization, and Si application.

2. Materials and Methods

2.1. Experimental Design

The study was carried out at the Experimental Field in Miedniewice (Experimental Station of the Institute of Agriculture of the Warsaw University of Life Sciences in Skierniewice, 515805” N, 201122” E) in central Poland. The research was conducted in the years 2023–2024 on the experiment established in 2014 on arable land on Luvisol soils of the texture of loamy sand. The soil was slightly acidic (pHKCl = 5.8), the content (mg kg−1 of soil) of the organic carbon (C org) was 72.0, and the nitrogen (N) was 9.5. The content of available P—was low (30.8 mg kg−1), K—high (139.0 mg kg−1), Mg—very high (109.0 mg kg−1). Mixtures of grasses and legumes containing three species: M1—Dactylis glomerata (cv. Berta), Festulolium braunii cv. Sulino, Trifolium pratense cv. Rozeta (the share is 55%, 30%, and 15%, respectively); M2—D. glomerata cv. Berta, F. braunii cv. Sulino, and Medicago x varia cv. Radius (55%, 30%, and 15%); and M3—D. glomerata cv. Berta, F. braunii cv. Sulino, and Lolium perenne cv. Gagat (45%, 30%, and 25%) were sown in three replications, described in detail in a previous study [21]. Over the next three years (2015–2017), the sward was fertilized and cut three times. Fertilization of NPK in the years of utilization was (kg ha−1 year−1): N—90 (in three parts—in spring, early April, and after the 1st and 2nd cut), P—35 (once in spring), and K—100 (in two equal parts—in spring and after the 1st cut). Then, for five years (till 2022), the sward was cut twice a year, without fertilization. On the sward formed at that time, the experiment was established in 2023 using the randomized block method in three replications. Within two years (2023–2024), the frequency of utilization varied, and the sward was cut two- or three times during the growing season. In the case of 3-times cutting, the first cut was made during the heading stage of the dominant grass species in the sward, and the second and third harvests were taken 6–8 weeks after the previous mowing. In two-cut use, the first cut was in the flowering phase of the dominant grass species in the sward, and the second one was after 12–14 weeks.
In the period of two years of research, a treatment of two levels of foliar silicon was applied—no Si (control) or Si sprayed as a solution of Optysil (1.0 L Optysil stimulator 200 L−1 H2O per ha) on top of forage crops two weeks before each cut. The fertilizer Optysil (Intermag Sp., Olkusz, Poland), which contained mainly silicon (16.5%, 200 g SiO2) and chelated iron (2%, 24 g Fe L−1), is considered to be a mineral growth stimulator.
Regardless of the silicon application, mineral nitrogen fertilization adjusted to the cutting frequency was used (kg ha−1): N (ammonium nitrate, 34%)—120 in 2-cut utilization (in two parts—in spring and after the 1st cut), 180 in 3-cuts (in spring and after the 1st and 2 nd cut). Phosphorus (P, triple superphosphate) was used once in spring at a dose of 35 kg ha−1 while potassium (K, potassium salt) was used at 100 kg ha−1 in two equal parts—in spring and after the 1st cut. The entire experiment consisted of 12 plots, and the separated plot size was 20 m2 (4 × 5 m).

2.2. Weather Conditions

It was noted that the weather conditions were very diverse in the study period, especially with regard to the amount and distribution of precipitation (Table 1). The amount and distribution of precipitation (608.3 mm) in the 2023 growing season were more favorable for plants compared to the next year, when precipitation was much smaller (477.2 mm) and unevenly distributed. Water deficiency after the first cut (at the beginning of June) in the 3-cut system was unfavorable for plant growth already in the second regrowth (in July) in both years of the study. Similarly, low precipitation in September (8.6 mm in 2023 and 37.6 mm in 2024) could have a negative impact on plant growth before the last harvest in the 2- and 3-cut systems (at the end of September).

2.3. Evaluation of Botanical Composition and Plant Productivity

The botanical composition of permanent meadow sward was determined in each re-growth by botanical-weight analysis. Fresh biomass samples (500 g) were collected from each plot and separated into sown in 2014 grass and legume species, herbs, and others (unsown grasses and dicotyledonous weeds). After drying (air-dried mass for a week), the share of the individual components of the sward was assessed (% of dry mass, DM). Yields of DM (Mg ha−1) were evaluated at each harvest.

2.4. Nutritive Value Analyses

Protein and mineral content in the sward was evaluated in each regrowth in two years of study (2023–2024). The content of nitrogen (N) for the calculation of crude protein (CP) and sulphur (S) in plants was determined by catalytic combustion on a CHNS Vario MacroCube Elementar analyzer. Crude protein (CP) content was determined based on the calculation: nitrogen content × 6.25, assuming an average N content of feed of 16 g per 100 g true protein [28].
Phosphorus (P), potassium (K), sodium (Na), calcium (Ca), magnesium (Mg), iron (Fe), manganese (Mn), copper (Cu), zinc (Zn), and boron (B) content was assessed using ICP-OES (Avio 200, Perkin Elmer) after sample mineralization in a microwave system (EthosUp, Milestone) in 65% HNO3. Silicon (Si) was evaluated by ICP-OES (Avio 200, Perkin Elmer) after sample mineralization in a microwave system (EthosUp, Milestone) in 65% HNO3 + 40% HF (hydrofluoric acid) (8 + 2 v/v).

2.5. Statistical Analysis

The statistical analyses of the data were performed using the Statistica 13.3 software (Statsoft, Inc., Tulsa, OK, USA). Multifactorial analysis of variance (ANOVA) was used to evaluate the data. Two intensities of sward management (2-times and 3-times cutting) and two silicon application variants (no Si and Si) were used. Each treatment was replicated three times. The normality of distribution was checked using the Q-Q test. The significance of differences between means was determined using the Tukey HSD test at the significance level of 0.05. In order to assess the interactions between plant nutritional value parameters and intensity of sward management, as well as silicon application, they were evaluated.

3. Results

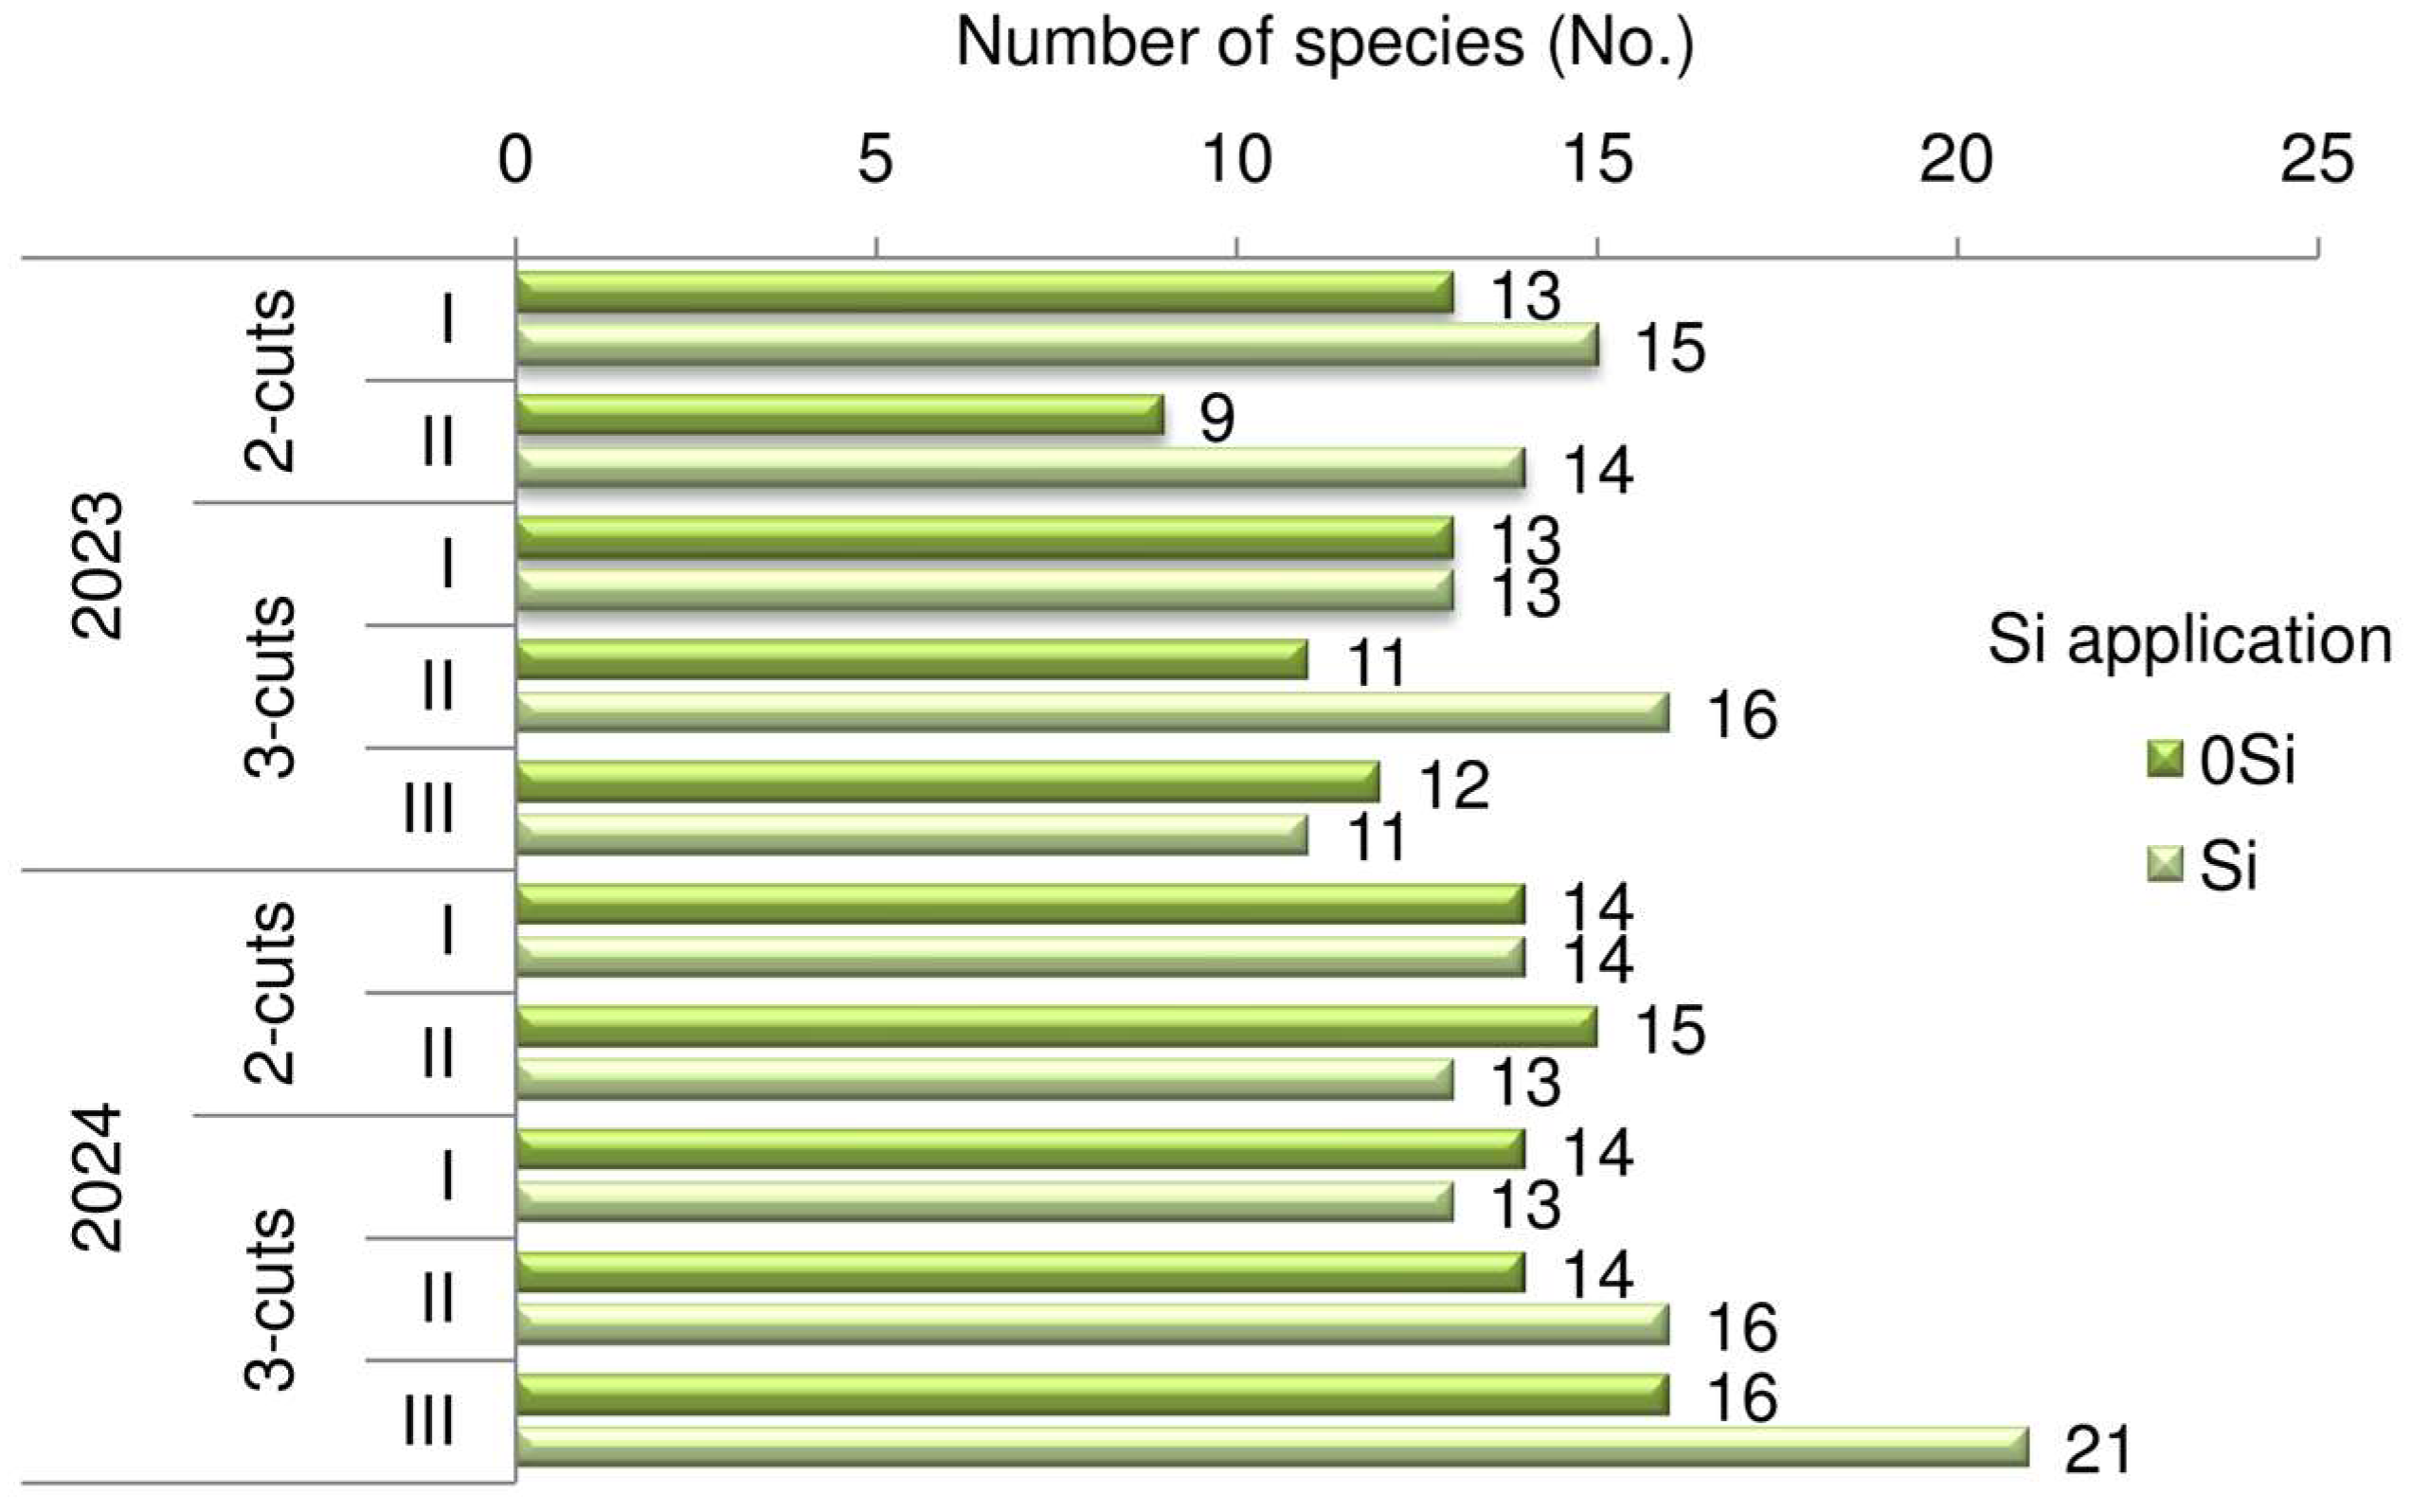
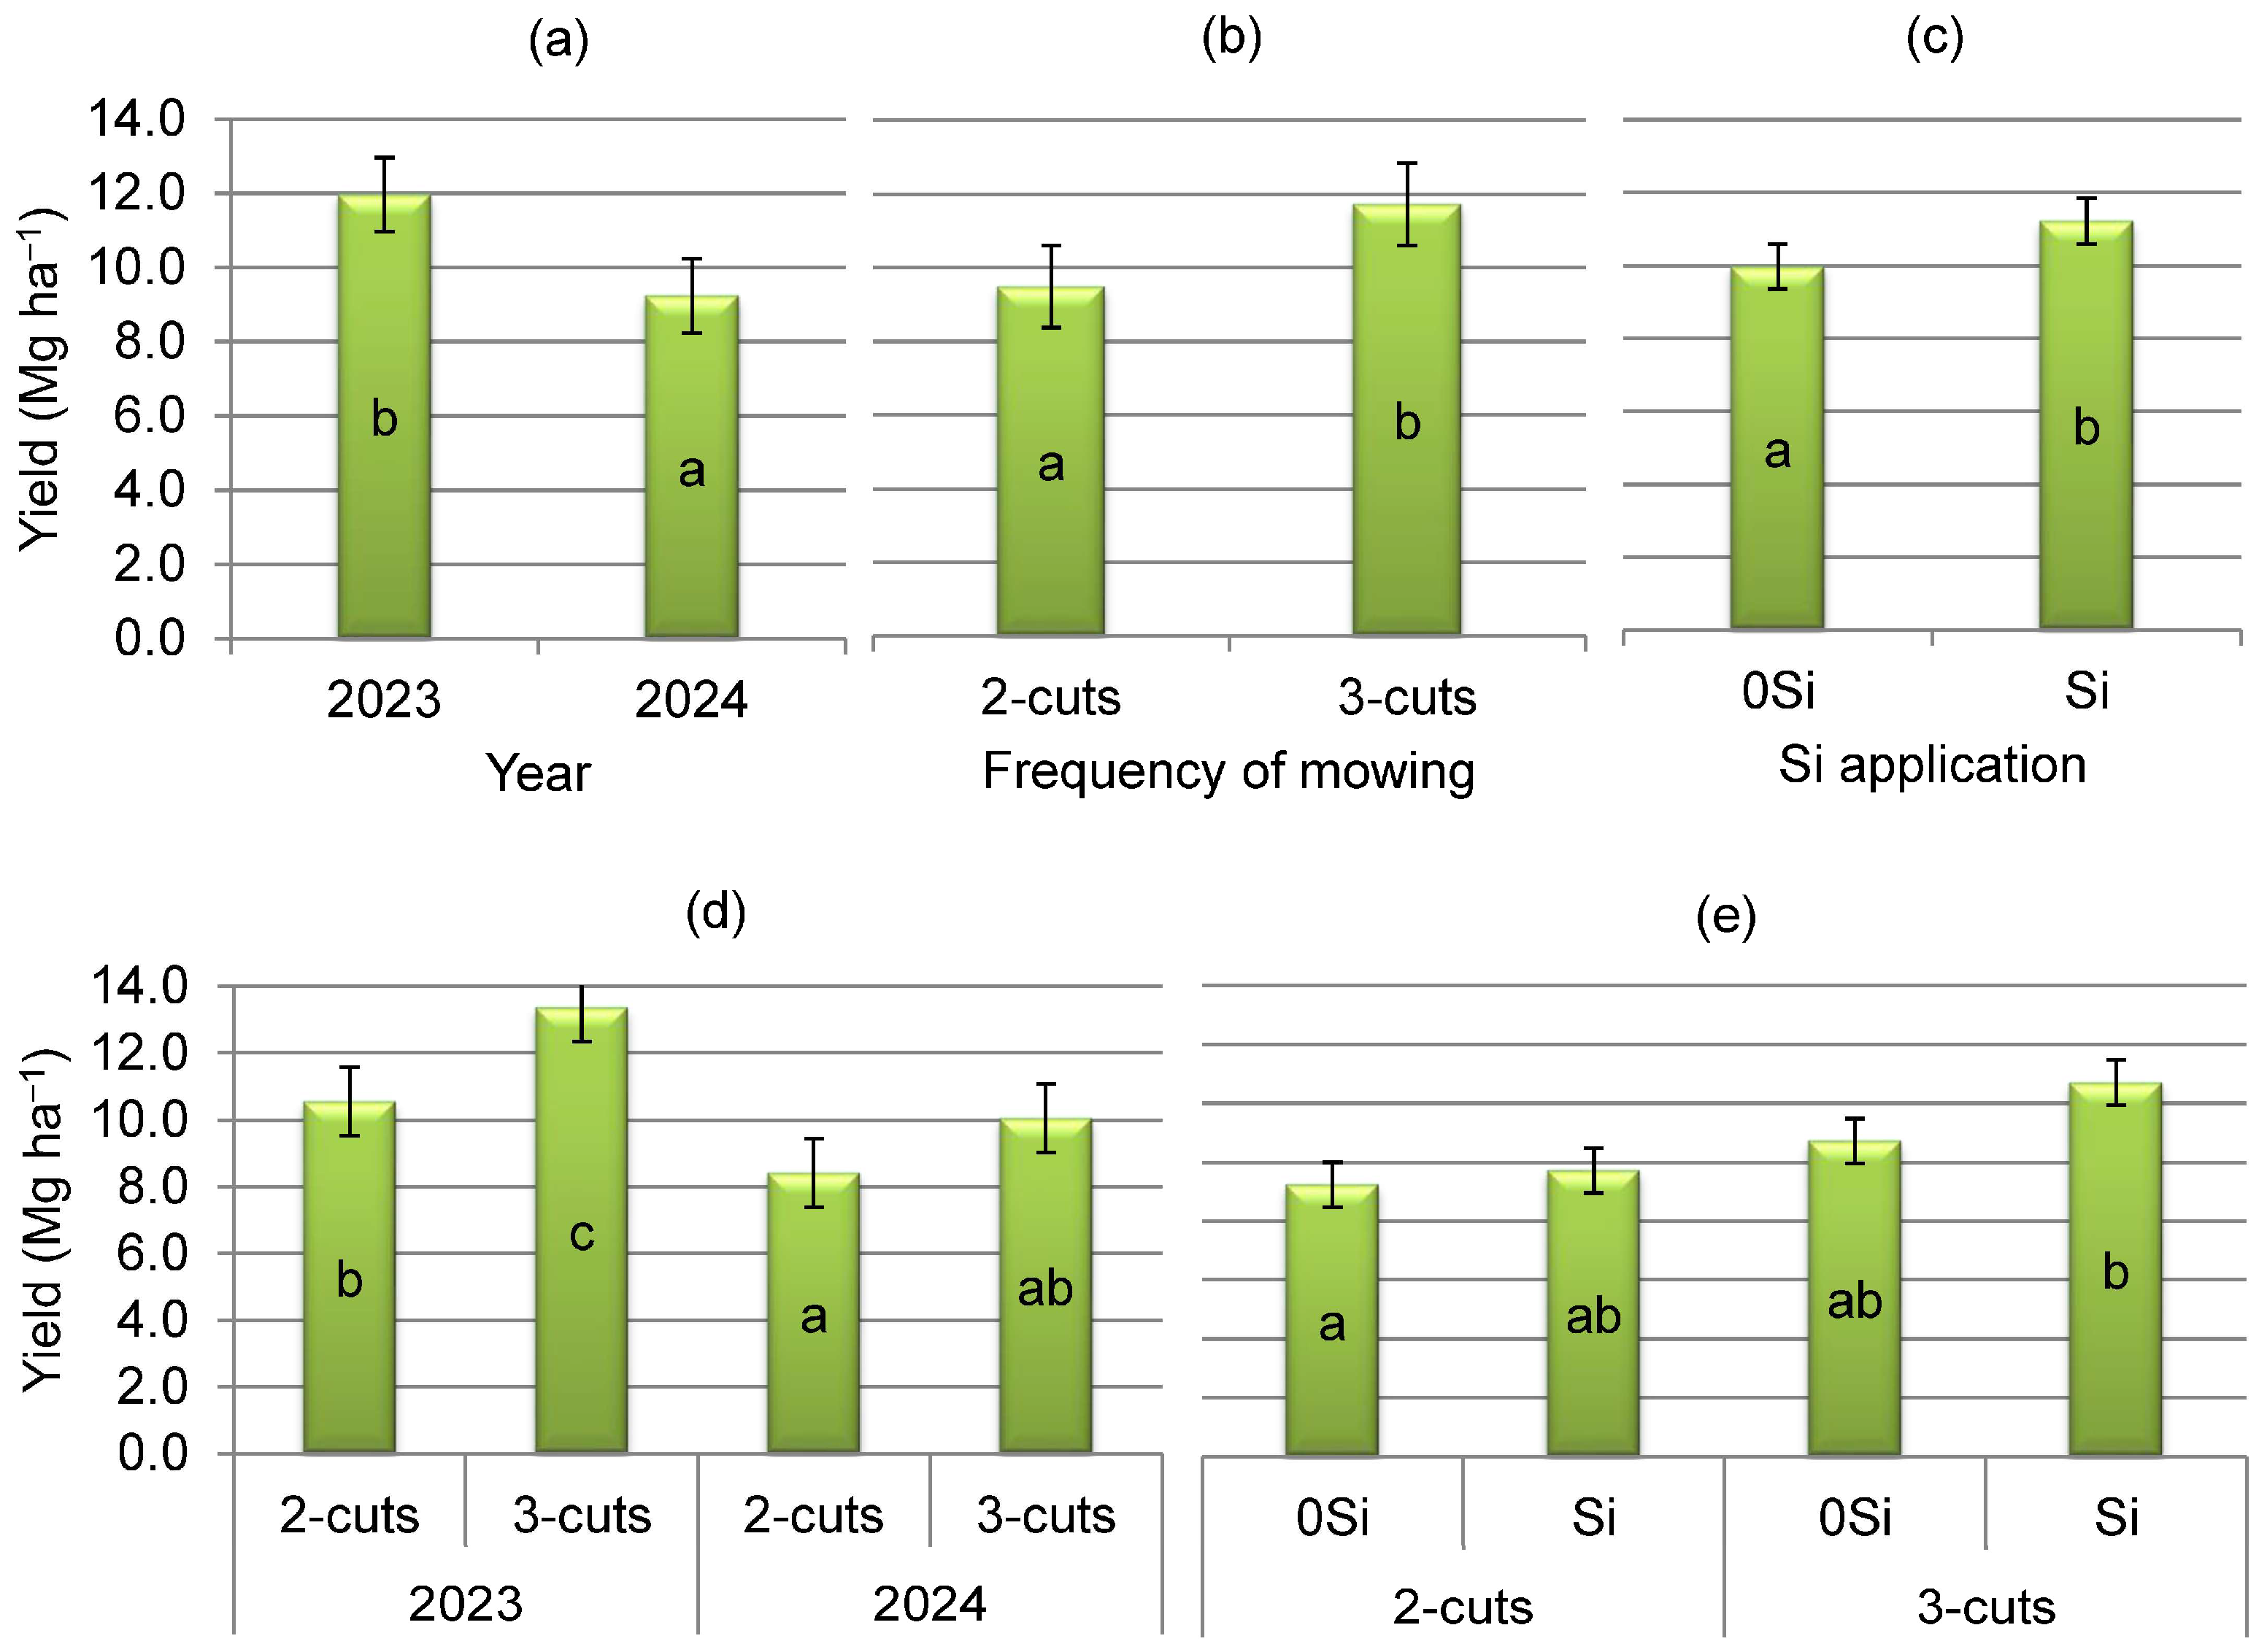
3.1. Botanical Composition and Plant Productivity

The sward was dominated by species sown in mixtures in 2014 (66–87% DM), regardless of the management intensity and the year of research (Figure 1). During the study period, in the 2-cut management, the largest share was noted by Festulolium braunii (27–32%) and Dactylis glomerata (30–32%), whereas in the 3-cut system, these two species contributed less to the total yield (16–18% and 22–23%, respectively). The share of Medicago x varia in the sward with 2-cut use was similar in both years of the study (10–16%), whereas in the second year (2024) with insufficient precipitation (477 mm), the share of these species in the case of 3-times cutting was very high (increased 3 times to 33%). In turn, Trifolium pratense constituted 12–13% of the sward in the first year of the study, regardless of the frequency of cutting, but in the following year it occurred in the sward in a negligible share (2%). The share of Lolium perenne in the sward during the study period was also only 2%. The share of herbs depended on the management intensity and was clearly lower when 2-cuts were used (7–9%) compared to 3-cuts (15–16%). Among them, Taraxacum officinale and Plantago lanceolata dominated.
The share of other species (mostly dicotyledonous) in less intensive 2-cut use increased from 7% (2023) to 12% (2024), while in the case of 3-cuts, it decreased from 19% to 8%, respectively. The results showed that the number of species in the sward changed between the study years and regrowths depending on the frequency of cutting (Figure 2). It was found that the number of species in the sward increased in the second year of the study, especially with more intensive management (21 species) compared to the 2-cut system (15 species) (by 40%). Among those, herbs dominated (T. officinale and P. lanceolata, approx. 15%). In addition, it was found that the application of silicone had a beneficial effect on the occurrence of a greater number of species in the sward. During the two-year study period, in the 0Si variant with 2-cut use, the number of species ranged from 9 to 15 depending on the cut, and under Si application, from 13 to 15 species. In the 3-cut system, in the 0Si variant, 11–16 species were present in the sward, and under the Si application, 11–21 species.
In the first year (2023) with 2-cut use, the largest average share in the sward of other plants was recorded by Cerastium holosteoides (2.1%) and the legume—Trifolium repens (1.1%), while the remaining species accounted for less than 1% each (e.g., the grasses Holcus lanatus and Poa trivialis). In the following year, in addition to the previous grasses (the share of 1.7%), there was a small share of Bromus hordeaceus (2.5%), Cirsium arvense (1.1%), and T. repens (1.0%). The share of the remaining species was negligible (less than 1%). In the 3-cut use, a greater share of T. repens in the sward was noted, especially in the first year (4.0%). In both years, the other species, e.g., B. hordeaceus, C. holosteoides, P. trivialis, and C. arvense, did not exceed 1.0%. Annual yields of DM were significantly higher in 2023 (about 12 Mg ha−1) due to sufficient precipitation (608 mm) compared to 2024 (9.2 Mg ha−1) with lower precipitation (477 mm) independent of other factors (Figure 3a, Table 1).
Average dry matter yields during the study period were the highest under conditions of more intensive management (by 23.5%, Figure 3b). At the same time, the highest yields were obtained in 2023 with 3-cut use (13.1 Mg ha−1, Figure 3d). A beneficial effect (significant) of silicon application on yields was also found regardless of other factors (years and frequency of mowing, Figure 3c), especially when 3-time cutting was used (Figure 3e).

3.2. Nutritive Value

The chemical composition of the meadow sward changed significantly over the years due to the intensity of management and regrowth (Table 2 and Table 3).
The content of crude protein significantly increased (p ≤ 0.05) under more intensive cutting conditions (by about 36%, mean for two years). Simultaneously, the content of this nutrient in subsequent regrowths was twice as high as in the first one, regardless of other factors (Table 3).
The content of macronutrients such as Na and Ca was significantly higher, while K was lower in the year with lower precipitation (2024) (Table 3). Moreover, the content of all elements increased significantly in the subsequent regrowths as well as was higher when 3-times cutting was used independent of Si application (except K). Interactions were found between the years of study and the frequency of mowing and the use of silicon in relation to the nutrient content (Table 4). In the second year of the study (2024), the content of P, Na, Ca, and Mg in plants was higher when 3-time cutting was used. A similar relationship was noted for K, but in 2023, when annual precipitation was higher. It was also found that under the conditions of silicon application, K content was significantly lower in the year with lower precipitation (2024), while Na content was higher in such conditions.
The content of P, Na, Ca, and Mg in the first regrowth was significantly lower in both 2- and 3-cut management. The concentrations of micronutrients in plants depended on the year of research, frequency of cutting, and subsequent regrowths (Table 5). There was no effect of silicon application on the protein content in plants in both years of the study (p ≤ 0.345), but it was shown that silicon application significantly influenced the protein content with more intensive utilization (3-cuts) in comparison with extensive 2-cut management (Table 4).
Their content was higher (significantly for S, Cu, B, and Si) in the second year of the study. It was found that the concentrations of S, Fe, Cu, Zn, B, and Si were higher in subsequent regrowths, while those of and Mn were the highest in the first one. However, no effect of silicon application on the content of assessed micronutrients (except Mn) was found, regardless of the year of the study or frequency of cutting. Interactions between year and frequency of mowing showed that the content of micronutrients was higher when a more intensive cutting system was used (except for Mn as well as Si in 2024) (Table 6).

4. Discussion

4.1. Botanical Composition and Plant Productivity

The species composition of the sward changed during the study period depending on the intensity of management. A large share was held by grass and legume species sown when the experiment was established in 2014 (Figure 1). Among the grasses, these were Dactylis glomerata and Festulolium braunii, which in conditions of 2-cut use constituted as much as 30–32% and 27–32%, respectively. Legumes, on the other hand, constituted 23–29% of the sward in the first year of the study (2023), regardless of the cutting frequency. In the second year, however, their share decreased significantly with the 2-cut system to only 12%, but with 3-cut management, they constituted as much as 35% in the sward (mainly Medicago x varia). This could be influenced by unfavorable moisture conditions in April, July, and September (approx. 31–37 mm in each month) and throughout the year (only 477 mm). The results of our study may also indicate a greater competitiveness of M. x varia than F. braunii. A similar relationship was shown by Olszewska et al. [47] in their studies of Medicago media and F. braunii.
It was found that the share of weeds (others) increased twice with 2-cut use in the second year (2024), probably due to the decrease in the share of legumes (from approx. 30% to 12%), especially Trifolium pratense (from 13% to only 2%). Simultaneously, the sward was dominated by grass species, D. glomerata and F. braunii, which accounted for as much as 57–62%. This was due to the lower durability of clover, which is grown in meadow mixtures with grasses, usually for 2-year use [46,48]. The disappearance of T. pratense from the sward could be related to poorer soil moisture conditions in 2024, as there was little precipitation in some spring and summer months, because their water requirements are significantly greater than those of M. media [48]. It was also found that in this year, in the 3-cut system, the amount of M. x varia was very high (approx. 33%). The year 2004 was drier than usual (477 mm), which can explain the dominance of M. x varia, as it develops a deep-reaching root system [48]. In our previous studies [21], this species maintained itself well in the sward, even in a year when little rainfall occurred. In the year 2024, it was also observed that with more intensive management, the share of herbs doubled in the years of utilization compared to the 2-cut system (mean 8% and 15.5%, respectively).
The present results demonstrated that management intensity influenced the number of species in the sward. This increased with 3-cut management compared to the 2-cut system, especially in the second year of the study (21 species and 15 species, respectively). This research confirms the research of Vogel et al. [6], who showed that species richness was only positively related in the very intensively managed grasslands (frequently mown and highly fertilized).
We also found a beneficial influence of precipitation on annual yields of DM (Figure 3a), which were significantly higher (about 12 Mg ha−1) in 2023 with favorable precipitation for plant growth (608 mm) compared to 2024 (9.2 Mg ha−1) with lower precipitation (477 mm).There were also obtained the highest yields with 3-cut frequency (about 12 Mg ha−1) compared to the 2-cut system (about 10 Mg ha−1) independent of other factors, as well as in 2003 under more intensive management (13.1 Mg ha−1, Figure 3b,d). The present results are consistent with the research of Vogel et al. [6], who showed that species richness and aboveground biomass were positively related even under drought conditions, which shows that biomass yield is higher the more diverse a community is. In turn, research of other authors [33,49] showed that the yields of the mixtures of F. braunii with M. media were higher and more stable in comparison with the yields of the species in pure stands, due to better utilization of the habitat conditions and different rates of plant growth and development.
We demonstrated a beneficial effect (significant) of silicon application on yields, regardless of other factors (years and frequency of cutting), as well as under more intensive management (Figure 3c,e). The same pattern was observed in our previous studies on the ecological meadow [50]. In turn, the studies of Radkowski et al. [22] did not show a greater impact of foliar application of silicon fertilizers on the yield, but there was a noticed impact on the floristic composition of the meadow sward, similarly to our study.

4.2. Nutritive Value

The nutritional value of feed obtained from permanent grasslands reflects the floristic composition of the sward, i.e., the quantitative share of individual species from the groups of grasses, legumes, and herbs, which are characterized by a diverse chemical composition [5]. Increasing the share of legumes in the sward increases yields and improves the nutritional value of feed [51].
Protein content was the lowest in the first regrowth (only 86 g kg−1), which could be due to the large share of grasses in the sward and the generative shoots that developed (Table 3). The protein content in grasses decreases from the beginning of earing, which is associated with the increase in the share of cell walls in the plant mass, which contain cellulose, hemicelluloses, and lignin [52]. In our research, the significantly higher protein content in plants in the sward under 3-time cutting conditions should probably be related to the higher share of legumes in the sward, especially in 2024 (35%). The symbiosis between legumes and rhizobia is a system of biological nitrogen fixation, which, according to Adams et al. [53], is stimulated if the soil around the legume rhizosphere is deficient in N, while it is inhibited if the soil N is in surplus. Studies by other authors [47] also indicate that legume-grass mixtures had better feed value than Medicago sativa and F. braunii sown separately.
According to White [54], both soil moisture and transpiration rate are related to mineral uptake by plants and can explain the ability of the model to predict variation in herbage mineral concentration among growing seasons. This study showed that the content of macronutrients in plants varied in the individual years of use significantly (apart from P and Mg) but was sufficient, except for Na, to meet the nutritional needs of animals [28] (Table 3). Tiley and Frame [55] reported that the Na content in plants was varied, and the most abundant species include Plantago lanceolata (0.55%), which could have influenced the Na content in the assessed sward, in which this species was present in a large share among the herbs. The research by Grzegorczyk et al. [56] also showed that the Na content of meadow herbage varied widely (from 0.6 to 1.3 g kg−1), and therefore no significant differences were found between the analyzed types of meadow communities. The results indicated that cattle feed was deficient in this nutrient [57]. The present study revealed that the content of macronutrients in the meadow sward increased in subsequent cuts, similarly to the research by Gaweł [48] on mixtures of legumes and grasses.
The optimal P content in cattle feed is at the level of 2.8–3.6 g kg−1 [28]. Our studies showed that the P content of the plants was sufficient for the animals, except for the first regrowth in 2-cut extensive use (Table 4). According to the literature [28,58], plants in the early stages of development are characterized by a higher content of this element than in the flowering phase.
In our study, the K content in plants exceeded the optimal values for animals of 17–20 g kg−1 [28]. Only in the first regrowth with 2-cut use was it up to 20 g kg−1 (Table 4). Many factors could have contributed to this, including nitrogen fertilization, intensive use, species diversity of the sward, and the movement of K during rainfall to deeper soil layers, where legumes could easily absorb it with their long root system [28,48,58]. According to Falkowski et al. [28], among the grasses, D. glomerata can show the presence of potassium up to 4% in dry mass. As a rule, plants contain more potassium in the early stages of development, and its content decreases until inflorescence formation. The presence of dicotyledonous plants in the sward also increases the potassium content; for example, Taraxacum officinale contains 1–1.5%.
Good feed contains 7 g kg−1 Ca [28]. In this study, the sward contained slightly more, sometimes even twice as much, especially with a large share of legumes. The results obtained may indicate a relationship between these plants and a high Ca content in the sward. This confirms the research by Gaweł [48], who showed that legumes dominated in summer regrowth with periodic rainfall deficiency, increasing the content of macronutrients (mainly N, Ca, and Mg) in the sward. Moreover, the Ca content of the forage increased significantly until the fourth cutting period, along with the increased share of legumes in the mixture sward. The present study revealed that the Ca content also increased in subsequent regrowths and was significantly higher with more intensive management (Table 3). The Mg content of the mixtures during the entire study period exceeded the standard of the optimal demand of cows for this element (except for the first cut, regardless of the intensity of management), which is 2 g kg−1, which resulted from the large share of legumes in the sward [28].
Micronutrients, also known as trace elements, which mainly include boron (B), molybdenum (Mo), copper (Cu), zinc (Zn), manganese (Mn), and iron (Fe), are required in very small amounts by crops and livestock. However, their deficiency can cause serious problems in the cultivation of forage crops and health disorders in livestock [59,60]. The correct level of microelements in tissues and body fluids promotes healthy growth and development, while microelement deficiencies reduce animal performance and cause economic losses [61].
Legumes have been shown to have higher concentrations of some nutrients, for example, copper (Cu) and zinc (Zn), than forage grasses. However, grasses typically have a higher dry matter (DM) yield than legumes, which results in similar amounts of Cu and Zn being harvested in the forage [35]. In addition to the differences between species, there are site-specific factors such as soil properties and, to some extent, weather conditions that may affect micronutrient concentrations of forage plants [62]. Lindström et al. [42] reported that D. glomerata had on average two to three times higher Mn concentrations than the other grass species, while T. pratense had the highest Cu concentrations. Moreover, in these studies, micronutrient concentrations of Cu, Fe, Mn, and Zn decreased with phenological development and were lower in the stems compared to the leaves and flowers of T. pratense, L. perenne, and Phleum pratense at the flowering stage. Markovic et al. [63] detected higher contents of Fe, Zn, and Cu in the leaves of M. sativa at the initial stage of plant development. In our study, the concentrations of micronutrients also depended on the stage of plant development, and the content of Cu, Fe, and Zn in plants was significantly lower in the first cut, as well as when 2 cuts were used (Table 5). Our research on the effect of mowing frequency on the content of nutrients in meadow sward confirms previous studies of these authors.
According to the standards, the amount that covers the animal demand for Cu is 10 mg kg−1 DM [28,64,65]. López-Alonso and Miranda [66] reported that Cu is an important element in the diet of animals. It is involved in enzymatic reactions related to, among others, the formation of red blood cells, hormone synthesis, and prevention against oxidative damage. The present studies showed that the Cu content changed not only over the years but also depended on the intensity of management. The aboveground biomass of the meadow was poor in Cu. Only in the second and third cuts with more intensive use did the Cu content cover the animals’ requirements (10.37–10.65 mg kg−1) (Table 6). Olszewska [67] found that throughout the 3-year study, Cu content was lowest in the biomass of pure-sown F. braunii and D. glomerata (4.1–4.8 mg kg−1), whereas it was higher in M. media than in grasses. Analysis of the Cu content of the plant species used as mixture components revealed that pure-sown grasses accumulated less Cu than grasses grown in mixtures with M. media.
Zinc (Zn) is an essential micronutrient in the diet of animals that regulates various processes in the body because it influences the activity of many enzymes and hormones [68]. Forage crops should contain 50 mg kg−1 Zn [28,65]. We stated that the average Zn content in biomass increased in subsequent cuts and ranged from 17.24 mg kg−1 (first regrowth in 2-cut system, regardless of the year and silicon application) to 30.42 mg kg−1 in the third cut in 3-cut management (Table 6), which confirms the literature [69]. The relatively high Zn content, though insufficient to meet the nutritional needs for this micronutrient, could result from the high share of M. x varia [67].
Manganese (Mn) plays an important role in animal nutrition as an essential component of enzymes involved in lipid, carbohydrate, and protein metabolism, as well as in reproductive and immune functions [30]. This is a growth stimulator and activator of numerous enzymatic processes; it takes part in nitrogen assimilation and protein synthesis and respiration, as well as in oxygen release reactions during photosynthesis [37]. The optimal Mn content in the diet of ruminants is 50 mg kg−1 [28,65]. The present study showed the significant effect of silicon application only on the content of Mn, regardless of the year of the study or frequency of cutting. During the two-year experiment, the average Mn content of biomass varied from 91.1 to 118 mg kg−1 (Table 5).
High-quality animal feed should contain 50 to 100 mg Fe kg−1 D.M. [28]. The analyzed meadow swards differed significantly with respect to the content of Fe in regrowths, which ranged from 113.2. mg kg−1 in the 1st cut to 245.1 mg kg−1 in the 3rd cut (Table 5). According to Grzegorczyk et al. [70], T. officinale and P. lanceolata are characterized by high Fe content. This micronutrient stimulates the biosynthesis of chlorophyll pigments in plants and participates in the light phase of photosynthesis [37]. Studies by Kabata-Pendias [69] Fe concentration in pasture showed seasonal fluctuations, with peaks in spring and autumn.
The Si content depended on the year of study and was higher in 2024 with lower rainfall (Table 5). A higher Si content was also found in subsequent regrowths. In turn, silicon fertilization resulted in a lower, but insignificant, Si concentration in plants. This could be due to the large share of D. glomerata in the sward during the study period (22–32%, depending on the intensity of management), as this species is considered to be quite rich in silicon [28]. Moreover, there is a wide variation in Si accumulation in the shoots among plant species, and grass species show particularly high Si accumulation compared to legumes [27]. According to literature [71], analysis of silicon content and its increase gives a contradictory picture. On the one hand, an increase in yield for individual cultivated crops is noted; on the other hand, a deterioration in forage quality—the rate of digestion, with a high content of organic silicon. Therefore, with an increase in the proportion of silicon in the consumed vegetation per unit, digestibility decreases linearly by one-third or one-quarter. The fermentation limit is set at a silicon content in the feed at the level of 3–4% of dry weight. Among the main groups of forage plants (cereals and forbs), the amount of silicon is significantly higher in cereals (1.70% and 0.91%, respectively).

5. Conclusions

Changes in the botanical composition caused by different intensities of management (cutting frequency and amount of fertilizer) and unfavorable weather conditions resulted primarily in lower annual yield. More frequent cutting increased the yield, and it was the highest with 3-cut use. The sward was dominated by species sown 10 years earlier in mixtures: Dactylis glomerata, Festulolium braunii and Medicago x varia. It was also noted that the number of species in the sward increased in the second year of the study, especially with more intensive management (21 species) compared to 2-cut frequency (15 species). Silicon application increased yields and the number of species, especially when 3-times cutting was used.
The nutritional value of the sward was mainly influenced by weather conditions in the years, cutting frequency, and species composition in regrowths. Under silicon application, the sward was characterized by a higher content of nutrients in the 3-cut system in the second and third regrowth. The present experiment indicates that the yield and quality of forage obtained from meadow sward can be influenced by the use of silicon and the intensity of management. Silicon application can improve the tolerance of meadow plants to increasingly frequent summer droughts in temperate climates. However, the influence of silicon fertilization on botanical composition, yield, and the nutritional value of multi-species meadow swards should be further investigated under different habitat conditions. The use of silicon additives in forms of silicon available for plant absorption in fertilizers, including organic ones, and the exclusion of the factor of reducing the digestion rate for forage plants require further comprehensive study.

Author Contributions

Conceptualization, B.B.-J. and G.M.; methodology, B.B.-J. and G.M.; software, G.M.; formal analysis, B.B.-J. and G.M.; investigation, B.B.-J. and G.M.; writing—original draft preparation, B.B.-J. and G.M.; writing—review and editing, B.B.-J. and G.M.; visualization, G.M. and B.B.-J. All authors have read and agreed to the published version of the manuscript.

Funding

This research received no external funding.

Institutional Review Board Statement

Not applicable.

Informed Consent Statement

Not applicable.

Data Availability Statement

Data available on request due to restrictions, e.g., privacy or ethical. The data presented in this study are available on request from the corresponding author.

Conflicts of Interest

The authors declare no conflicts of interest.

References

  1. Hopkins, A.; Wilkins, R.J. Temperate grassland: Key developments in the last century and future perspectives. J. Agric. Sci. 2006, 144, 503–523. [Google Scholar] [CrossRef]
  2. Mălinas, A.; Rotar, I.; Vidican, R.; Iuga, V.; Păcurar, F.; Mălinas, C.; Moldovan, C. Designing a sustainable temporary grassland system by monitoring nitrogen use efficiency. Agronomy 2020, 10, 149. [Google Scholar] [CrossRef]
  3. Søegaard, K.; Gierus, M.; Hopkins, A.; Halling, M. Temporary grassland-challenges in the future. Permanent and temporary grassland: Plant, environment and economy. In Proceedings of the 14th Symposium of the European Grassland Federation, Ghent, Belgium, 3–5 September 2007; Belgian Society for Grassland and Forage Crops: Ghent, Belgium, 2007; pp. 27–38. [Google Scholar]
  4. Hajduk, E.; Właśniewski, S.; Szpunar-Krok, E. Influence of legume crops on content of organic carbon in sandy soil. Soil Sci. Ann. 2015, 66, 52–56. [Google Scholar] [CrossRef]
  5. Grzelak, M.; Gaweł, E.; Barszczewski, J. Impact of the occurrence of herbs and weeds on variations in meadow sward economic value. Prog. Plant Prot. 2013, 53, 182–185. [Google Scholar] [CrossRef]
  6. Vogel, A.; Scherer-Lorenzen, M.; Weigelt, A. Grassland resistance and resilience after drought depends on management intensity and species richness. PLoS ONE 2012, 7, e36992. [Google Scholar] [CrossRef] [PubMed]
  7. Thumm, U.; Tonn, B. E ect of precipitation on dry matter production of a meadow with varied cutting frequency. Grassl. Sci. Eur. 2010, 15, 90–92. [Google Scholar]
  8. Gabryszuk, M.; Barszczewski, J.; Wróbel, B. Characteristics of grasslands and their use in Poland. J. Water Land Dev. 2021, 51, 243–249. [Google Scholar] [CrossRef]
  9. Calvo, P.; Nelson, L.; Kloepper, J.W. Agricultural uses of plant biostimulants. Plant Soil 2014, 383, 3–41. [Google Scholar] [CrossRef]
  10. Tiwari, R.K.; Lal, M.K.; Kumar, R.; Chourasia, K.N.; Naga, K.C.; Kumar, D.; Das, S.K.; Zinta, G. Mechanistic insights on melatonin-mediated drought stress mitigation in plants. Physiol. Plant. 2021, 72, 1212–1226. [Google Scholar] [CrossRef]
  11. Ciepiela, G.A.; Godlewska, A. Changes in protein compounds and monosaccharides in select grass species following application of a seaweed extract. Pol. J. Environ. Stud. 2014, 23, 29–35. [Google Scholar]
  12. Wolski, K.; Biernacik, M.; Świerszcz, S.; Talar-Krasa, M.; Leshchenko, O. Effect of the application of a biostimulant and mineral fertilizers on the concentration of mineral elements in the sward of forage mixtures cultivated on light soil. J. Elem. 2019, 24, 385–397. [Google Scholar]
  13. Ma, J.F. Role of silicon in enhancing the resistance of plants to biotic and abiotic stresses. Soil Sci. Plant Nutr. 2004, 50, 11–18. [Google Scholar] [CrossRef]
  14. Gao, X.; Zou, C.; Wang, L.; Zhang, F. Silicon decreases transpiration rate and conductance from stomata of maize plants. J. Plant Nutr. 2006, 29, 1637–1647. [Google Scholar] [CrossRef]
  15. Capstaff, N.M.; Miller, A.J. Improving the yield and nutritional quality of forage crops. Front. Plant Sci. 2018, 9, 535. [Google Scholar] [CrossRef]
  16. Zargar, S.M.; Mahajan, R.; Bhat, J.A.; Nazir, M.; Deshmukh, R. Role of silicon in plant stress tolerance: Opportunities to achieve a sustainable cropping system. 3 Biotech 2019, 9, 73–86. [Google Scholar] [CrossRef]
  17. Sacała, E. Role of silicon in plant resistance to water stress. J. Elementol. 2009, 14, 619–630. [Google Scholar] [CrossRef]
  18. Bukhari, M.A.; Ashraf, M.Y.; Ahmad, R.; Waraich, E.A.; Hameed, M. Improving drought tolerance potential in wheat (Triticum aestivum L.) through exogenous silicon supply. Pak. J. Bot. 2015, 47, 1641–1648. [Google Scholar]
  19. Kowalska, J.; Tyburski, J.; Jakubowska, M.; Krzymińska, J. Effect of different forms of silicon on growth of spring wheat cultivated in organic farming system. Silicon 2021, 13, 211–217. [Google Scholar] [CrossRef]
  20. Sierra, M.J.; Schmid, T.; Guirado, M.; Escolano, O.; Millan, R. How management practices affect silicon uptake by Hordeum vulgare grown in a highly calcareous soil. Soil Use Manag. 2021, 37, 802–814. [Google Scholar] [CrossRef]
  21. Borawska-Jarmułowicz, B.; Mastalerczuk, G.; Janicka, M.; Wróbel, B. Effect of silicon-containing fertilizers on the nutritional value of grass-legume mixtures on temporary grasslands. Agriculture 2022, 12, 145. [Google Scholar] [CrossRef]
  22. Radkowski, A.; Sosin-Bzducha, E.; Radkowska, I. Effects of silicon foliar fertilization of meadow plants on nutritional value of silage fed to dairy cows. J. Elem. 2017, 22, 1311–1322. [Google Scholar]
  23. Zhang, P.; Ouyang, N.; Wei, X.; Zhang, Y.; Hu, B.; Lu, Z.; Peng, H.; Zhang, J.; Li, X.; Xie, M. Factors affecting the vertical distribution of silicon in paddy soils in Mid-Subtropical China. Silicon 2023, 15, 7477–7487. [Google Scholar] [CrossRef]
  24. Mastalerczuk, G.; Borawska-Jarmułowicz, B.; Sujkowska-Rybkowska, M.; Bederska-Błaszczyk, M.; Borucki, W.; Dąbrowski, P. Silicon mitigates the adverse effects of drought on Lolium perenne physiological, morphometric and anatomical characters. PeerJ 2025, 13, e18944. [Google Scholar] [CrossRef] [PubMed]
  25. Liang, Y.; Sun, W.; Zhu, Y.-G.; Christie, P. Mechanisms of silicon alleviation of abiotic stresses in higher plants: A review. Environ. Pollut. 2007, 147, 422–428. [Google Scholar] [CrossRef] [PubMed]
  26. Ma, J.F.; Tamai, K.; Yamaji, N.; Mitani, N.; Konishi, S.; Katsuhara, M.; Ishiguro, M.; Murata, Y.; Yano, M. A silicon transporter in rice. Nature 2006, 440, 688–691. [Google Scholar] [CrossRef] [PubMed]
  27. Mitani-Ueno, N.; Ma, J.F. Linking transport system of silicon with its accumulation in different plant species. Soil Sci. Plant Nutr. 2006, 67, 10–17. [Google Scholar] [CrossRef]
  28. Falkowski, M.; Kukułka, I.; Kozłowski, S. Chemical Properties of Meadow Plants; Wyd. Akademii Rolniczej w Poznaniu: Poznań, Poland, 2000; p. 132. [Google Scholar]
  29. Peoples, M.B. Legumes root nitrogen in cropping system nitrogen cycling. Graine Legume 2001, 33, 8–9. [Google Scholar]
  30. Pajarillo, E.A.B.; Lee, E.; Kang, D.K. Trace metals and animal health: Interplay of the gut microbiota with iron, manganese, zinc, and copper. Anim. Nutr. 2021, 7, 750–761. [Google Scholar] [CrossRef]
  31. Pirhofer-Walzl, K.; Søegaard, K.; Høgh-Jensen, H.; Eriksen, J.; Sanderson, M.A.; Rasmussen, J.; Rasmussen, J. Forage herbs improve mineral composition of grassland herbage: Forage herbs improve mineral composition of grassland herbage. Grass Forage Sci. 2011, 66, 415–423. [Google Scholar] [CrossRef]
  32. Gaweł, E. Nutritive value of legume-grass mixtures cultivated in organic farms. J. Res. Appl. Agric. Eng. 2012, 57, 91–97. [Google Scholar]
  33. Lüscher, A.; Mueller-Harve, I.; Soussana, I.F.; Rees, R.M.; Peyraud, J.L. Potential of legume-based grassland-livestock systems in Europe: A review. Grass Forage Sci. 2014, 69, 206–228. [Google Scholar] [CrossRef]
  34. Regulation (EU) 2021/2115 of the European Parliament and of the Council of 2 December 2021 Establishing Rules on Support for Strategic Plans to be Drawn up by Member States Under the Common Agricultural Policy (CAP Strategic Plans) and Financed by the European Agricultural Guarantee Fund (EAGF) and by the European Agricultural Fund for Rural Development (EAFRD) and Repealing Regulations (EU) No 1305/2013 and (EU) No 1307/2013. Available online: http://data.europa.eu/eli/reg/2021/2115/2024-05-25 (accessed on 16 July 2025).
  35. Brink, G.E.; Pederson, G.A.; Sistani, K.R.; Fairbrother, E. Uptake of selected nutrients by temperate grasses and legumes. Agron. J. 2001, 93, 887–890. [Google Scholar] [CrossRef]
  36. Marijanušić, K.; Manojlović, M.; Bogdanović, D.; Čabilovski, R.; Lombnaes, P. Mineral composition of forage crops in respect to dairy cow nutrition. Bulg. J. Agric. Sci. 2017, 23, 204–212. [Google Scholar]
  37. Grzyś, E. The role and importance of micronutrients in plants nutrition. Zesz. Probl. Post. Nauk Rol. 2004, 502, 89–99. [Google Scholar]
  38. Jones, G.B.; Tracy, B.F. Evaluating seasonal variation in mineral concentration of cool-season pasture herbage. Grass Forage Sci. 2013, 70, 94–101. [Google Scholar] [CrossRef]
  39. Darch, T.; McGrath, S.P.; Lee, M.R.F.; Beaumont, D.A.; Blackwell, M.S.A.; Horrocks, C.A.; Evans, J.; Storkey, J. The mineral composition of wild-type and cultivated varieties of pasture species. Agronomy 2020, 10, 1463. [Google Scholar] [CrossRef]
  40. Høgh-Jensen, H.; Søegaard, K. Robustness in the mineral supply from temporary grasslands. Acta Agric. Scand. 2012, 62, 79–90. [Google Scholar] [CrossRef]
  41. Olszewska, M.; Mackiewicz-Walec, E. The effect of different proportions of Medicago media Pers. in two-component alfalfa-grass mixtures on the macronutrient content of aboveground biomass. J. Elem. 2023, 28, 1055–1072. [Google Scholar] [CrossRef]
  42. Lindström, B.E.M.; Frankow-Lindberg, B.E.; Dahlin, A.S.; Wivstad, M.; Watson, C.A. Micronutrient concentrations in common and novel forage species and varieties grown on two contrasting soils. Grass Forage Sci. 2012, 68, 427–436. [Google Scholar] [CrossRef]
  43. Zemenchik, R.A.; Albrecht, K.A.; Shaver, R.D. Improved nutritive value of kura clover and birdsfoot trefoil grass mixtures compared with grass monocultures. Agron. J. 2002, 94, 1131–1138. [Google Scholar] [CrossRef]
  44. Allana, E.; Weissera, W.; Weigelta, A.; Roschere, C.; Fischerb, M.; Hillebrandf, H. More diverse plant communities have higher functioning over time due to turnover in complementary dominant species. Proc. Natl. Acad. Sci. USA 2011, 108, 17034–17039. [Google Scholar] [CrossRef] [PubMed]
  45. Kocięcka, J.; Liberacki, D.; Kupiec, J.M.; Stróżecki, M.; Dłużewski, P. Effects of silicon application and groundwater level in a subirrigation system on yield of a three-cut meadow. Water 2023, 15, 2103. [Google Scholar] [CrossRef]
  46. Schaub, S.; Finger, R.; Leiber, F.; Probst, S.; Kreuzer, M.; Weigelt, A.; Buchmann, N.; Scherer-Lorenzen, M. Plant diversity effects on forage quality, yield and revenues of semi-natural grasslands. Nat Commun. 2020, 7, 768. [Google Scholar] [CrossRef] [PubMed]
  47. Olszewska, M.; Grzegorczyk, S.; Bałuch-Małecka, A. The effect of different proportions of Medicago media Pers. in mixtures with Festulolium braunii (K. Richt.) A. Camus on the yield and feed value of green fodder. Agric. Food Sci. 2019, 28, 18–26. [Google Scholar] [CrossRef]
  48. Gaweł, E. Skład gatunkowy i mineralny mieszanek motylkowato-trawiastych w ekologicznej uprawie i kośno-pastwiskowym użytkowaniu. Pol. J. Agron. 2011, 6, 17–26. [Google Scholar]
  49. Staniak, M.; Harasim, E. Changes in nutritive value of alfalfa (Medicago x varia T. Martyn) and Festulolium (Festulolium braunii (K. Richt.) A. Camus) under drought stress. J. Agron. Crop Sci. 2018, 204, 456–466. [Google Scholar] [CrossRef]
  50. Mastalerczuk, G.; Borawska-Jarmułowicz, B.; Dąbrowski, P.; Szara, E.; Perzanowska, A.; Wróbel, B. Can the application the silicon improve the productivity and nutritional value of grass-clover sward in conditions of rainfall shortage in organic management? Agronomy 2020, 10, 1007. [Google Scholar] [CrossRef]
  51. Terlikowski, J. The effect of permanent grassland sward enrichment with special varieties of grasses and legumes on the quality of produced bulk fodder. J. Res. Appl. Agric. Eng. 2014, 59, 107–110. [Google Scholar]
  52. Boller, B.; Nüesch, B. Wann kann man sehr frühreife Englische Raigras Arion im Fruhjahr zum ersten Mal nutzen? Landwirtsch. Schweiz 1991, 4, 462–467. [Google Scholar]
  53. Adams, M.A.; Buchmann, N.; Sprent, J.; Buckley, T.N.; Turnbull, T.L. Crops, nitrogen, water: Are legumes friend, foe, or misunderstood ally? Trends Plant Sci. 2018, 23, 539–550. [Google Scholar] [CrossRef]
  54. White, P.J. Long-distance transport in the xylemand phloem. In Marschner’s Mineral Nutrition of Higher Plants, 3rd ed.; Marschner, P., Ed.; Academic Press: Waltham, MA, USA, 2012; pp. 49–70. [Google Scholar]
  55. Tiley, G.E.D.; Frame, J. Evaluation of forage herbs in grass/herbs mixtures. In Proceedings of the 14th General Meeting of the European Grassland Federation, Lahti, Finland, 8–11 June 1992; pp. 542–544. [Google Scholar]
  56. Grzegorczyk, S.; Grabowski, K.; Olszewska, M. Content of potassium, calcium, magnesium, phosphorus and sodium in meadow sward irrigated with wastewater. J. Elem. 2020, 25, 249–257. [Google Scholar] [CrossRef]
  57. Kuusela, E. Annual and seasonal changes in mineral contents (Ca, Mg, P, K and Na) of grazed clovergrass mixtures in organic farming. Agric Food Sci. 2006, 15, 23–34. [Google Scholar] [CrossRef]
  58. Mastalerczuk, G. Nutrient content in organs of meadow plants in different conditions of management intensity. Grassl. Sci. Pol. 2007, 9, 131–140. [Google Scholar]
  59. Miller, E.R.; Lei, X.; Ullrey, D.E. Trace Elements in Animal Nutrition. In Micronutrients in Agriculture; Mortvedt, J.J., Cox, F.R., Schuman, L.M., Welch, R.M., Eds.; SSSA Soil Science Society of America: Madison, WI, USA, 1991; pp. 593–662. [Google Scholar]
  60. Romheld, V.; Marschner, H. Function of Micronutrients in Plants. In Micronutrients in Agriculture; Mortvedt, J.J., Cox, F.R., Shuman, L.M., Welch, R.M., Eds.; SSSA Soil Science Society of America: Madison, WI, USA, 1991; pp. 297–328. [Google Scholar]
  61. Żarczyńska, K.; Żarczyński, P.; Sobiech, P.; Snarska, A.; Stopyra, A.; Wieteska, M.; Płaczek, A. The effect of micronutrient deficiencies on the health status of transition cows. J. Elem. 2017, 22, 1223–1234. [Google Scholar] [CrossRef]
  62. Roche, J.R.; Turner, L.R.; Lee, J.M.; Edmeades, D.C.; Donaghy, D.J.; MacDonald, K.A.; Penno, J.W.; Berry, D.P. Weather, herbage quality and milk production in pastoral systems, 3: Interrelationships and associations between weather variables and herbage growth rate, quality and mineral concentration. Anim. Prod. Sci. 2009, 49, 211–221. [Google Scholar] [CrossRef]
  63. Markovic, J.; Štrbanovi, R.; Cvetkovi, M.; Andjelkovic, B.; Živkovi, B. Effects of growth stage on the mineral concentrations in alfalfa (Medicago sativa L.) leaf, stem and the whole plant. Biotechnol. Anim. Husb. 2009, 25, 1225–1231. [Google Scholar]
  64. NRC. National Research Council. Nutrient Requirements of Dairy Cattle, 7th ed.; National Academic Press: Washington, DC, USA, 2001. [Google Scholar]
  65. Vigh, A.; Criste, A.D.; Corcionivoschi, N.; Gerard, C. Rumen solubility of copper, manganese and zinc and the potential link between the source and rumen function: A systematic review. Agriculture 2023, 13, 2198. [Google Scholar] [CrossRef]
  66. López-Alonso, M.; Miranda, M. Copper supplementation, a challenge in cattle. Animals 2020, 10, 1890. [Google Scholar] [CrossRef]
  67. Olszewska, M. Micronutrient content of aboveground biomass as influenced by different proportions of Medicago media Pers. in two-component alfalfa-grass mixtures. Agriculture 2024, 14, 2205. [Google Scholar] [CrossRef]
  68. Sloup, V.; Jankowská, I.; Nechybová, S.; Pesinková, P.; Langrová, I. Zinc in the animal organism: A review. Sci. Agric. Bohem. 2017, 48, 13–21. [Google Scholar] [CrossRef]
  69. Kabata-Pendias, A. Trace Elements in Soils and Plants, 4th ed.; CRC Press: Boca Raton, FL, USA, 2011; p. 548. [Google Scholar]
  70. Grzegorczyk, S.; Olszewska, M.; Alberski, J. Accumulation of copper, zinc, manganese and iron by selected species of grassland legumes and herbs. J. Elem. 2014, 19, 109–118. [Google Scholar] [CrossRef]
  71. Abaturov, B.D. Variability of grassland forage resources and their division by a complex of herbivorous mammals in the case of joint grazing. Arid. Ecosyst. 2024, 14, 202–208. [Google Scholar] [CrossRef]
Figure 1. Botanical composition of sward (%) depending on management intensity regardless of the silicon application in the years 2023–2024: (a) 2-cuts, 2023 (b) 2-cuts, 2024 (c) 3-cuts, 2023 (d) 3-cuts, 2024.
Sustainability 17 06717 g001
Figure 2. Number of species depending on management intensity (2-cuts, 3-cuts) and silicon application (0Si, Si) in the years 2023–2024.
Sustainability 17 06717 g002
Figure 3. Dry matter yield (Mg ha −1) depending on the influence of the main effects: year (a), management intensity (b), Si application (c), as well as the interactions: frequency of cutting and years (d), and frequency of mowing and Si application (e). Data marked with the same lowercase letters do not differ significantly according to Tukeys test (p ≤ 0.05).
Sustainability 17 06717 g003
Table 1. Sum of precipitation (mm) and mean temperature (°C) in the experiment site over 2023–2024.
YearMonth
IIIIIIIVVVIVIIVIIIIXXXIXIIMean
IV-IX
Mean
I-XII
Temperature (°C)
20233.41.34.48.513.118.420.620.517.410.74.02.016.410.4
2024−0.16.16.611.116.519.421.720.416.89.53.42.517.711.2
Precipitation (mm)
202342.538.147.447.936.843.244.0106.48.668.762.662.1286.9608.3
202456.547.331.031.442.756.937.067.837.626.127.915.0273.4477.2
Table 2. Results of ANOVA (p-values) presenting the main effects and interactions for analyzed variables: years (A), frequency of mowing (B), Si application (C), and regrowth (D).
YieldCrude ProteinPKNaCaMg
Main effects
Year (A)0.0000.9410.5050.0170.0130.0030.176
Frequency of mowing (B)0.0250.0000.0380.4140.0180.0000.031
Si application (C)0.0010.3450.5090.4080.7460.9910.207
Regrowh (D)0.0000.0000.0000.0000.0030.0000.000
Interactions
A × B0.0240.0110.0390.0120.0080.0010.041
A × C0.5170.3460.8260.0270.0070.0300.420
A × D0.7300.0020.0440.3330.1180.0750.864
B × C0.0480.0210.0430.2680.0090.0240.009
C × D0.2160.0490.0450.0250.0090.0220.009
SFeMnCuZnBSi
Main effects
Year (A)0.0000.4300.5060.0070.2450.0020.000
Frequency of mowing (B)0.0000.0280.0000.0020.0300.0000.377
Si application (C)0.5790.8340.0190.5090.1570.9490.408
Regrowh (D)0.0000.0000.0000.0000.0000.0000.000
Interactions
A × B0.0450.0300.0200.0000.0180.0010.028
A × C0.0090.5210.0380.0080.0440.0230.046
A × D0.0010.0000.1320.0010.1270.0390.386
B × C0.0060.0280.0060.0280.0240.0100.878
C × D0.0070.0060.0300.0070.0450.0050.007
Table 3. Influence of main effects (year, management intensity, Si application, and regrowth) on crude protein and macronutrient content in the sward (g kg−1).
EffectCrude ProteinPKNaCaMg
Year (A)
2023134.16 a2.93 a27.05 b0.25 a10.56 a2.32 a
2024140.82 a2.91 a22.55 a0.59 b12.26 b2.53 a
Frequency of mowing (B)
2-cuts113.10 a2.70 a23.34 a0.24 a9.50 a2.14 a
3-cuts153.75 b3.07 b25.78 a0.53 b12.69 b2.61 b
Si application (C)
0Si138.40 a2.96 a25.41 a0.41 a11.21 a2.47 a
Si136.58 a2.88 a24.19 a0.42 a11.62 a2.37 a
Regrowh (D)
1st86.00 a2.27 a19.79 a0.19 a6.78 a1.55 a
2nd171.38 b3.25 b25.47 b0.54 b14.43 b2.86 b
3rd172.68 b3.56 b33.49 c0.63 b14.65 b3.29 c
Data in the row marked with the same lowercase letters do not differ significantly according to Tukey’s test (p ≤ 0.05).
Table 4. Interactions between main effects (year, frequency of cutting, Si application, and regrowth) in relation to the crude protein and macronutrient content in the sward (g kg−1).
Crude ProteinPKNaCaMg
Interaction A × B
2023 × 2-cuts115.09 a2.75 ab23.69 a0.15 a10.07 ab2.09 a
2023 × 3-cuts146.87 b3.05 ab29.29 b0.31 a10.90 b2.47 ab
2024 × 2-cuts111.10 a2.64 a22.99 a0.33 a8.93 a2.19 a
2024 × 3-cuts160.64 b3.08 b22.27 a0.76 b14.48 c2.75 b
Interaction A × C
2023 × 0Si133.97 a2.96 a26.82 b0.25 a10.16 a2.32 a
2023 × Si134.35 a2.91 a27.27 b0.25 a10.97 ab2.32 a
2024 × 0Si142.84 a2.96 a24.00 ab0.57 ab12.26 b2.62 a
2024 × Si138.81 a2.85 a21.11 a0.60 b12.27 b2.43 a
Interaction B × C
2-cuts × 0Si116.70 a2.76 ab25.23 a0.24 a9.47 a2.31 ab
2-cuts × Si109.49 a2.63 a21.44 a0.24 a9.53 a1.97 a
3-cuts × 0Si152.88 b3.10 b25.53 a0.52 b12.37 b2.58 b
3-cuts × Si154.63 b3.04 ab26.02 a0.55 b13.01 b2.64 b
Interaction C × D
0Si × 1st84.91 a2.26 a20.07 a0.20 a6.23 a1.59 a
0Si × 2nd172.83 b3.34 b27.04 bc0.54 b14.27 b2.93 b
0Si × 3rd176.54 b3.60 b32.83 c0.57 b15.04 b3.31 b
Si × 1st87.10 a2.27 a19.51 a0.18 a7.33 a1.51 a
Si × 2nd169.93 b3.16 b23.89 ab0.54 b14.60 b2.79 b
Si × 3rd168.81 b3.52 b34.15 c0.68 b14.25 b3.27 b
Interaction B × D
2-cuts × 1st72.17 a1.97 a17.31 a0.12 a6.33 a1.48 a
2-cuts × 2nd154.02 c3.42 c29.36 b0.36 abc12.68 b2.80 b
3-cuts × 1st99.84 b2.57 b22.27 a0.26 ab7.23 a1.62 a
3-cuts × 2nd188.74 d3.08 c21.57 a0.72 c16.19 c2.92 b
3-cuts × 3rd172.68 cd3.56 c33.49 b0.63 bc14.65 bc3.29 b
A—Year, B—frequency of mowing, C—Si application, D—regrowth. Data in the row marked with the same lowercase letters do not differ significantly according to Tukey’s test (p ≤ 0.05).
Table 5. Influence of main effects (year, frequency of mowing, Si application, and regrowth) on micronutrient content in the sward (mg kg−1).
SFeMnCuZnBSi
Year (A)
20231.16 a167.7 a103.5 a7.19 a23.67 a13.43 a4924 a
20241.77 b169.3 a101.4 a8.68 b25.91 a19.55 b7052 b
Frequency of mowing (B)
2-cuts1.23 a148.3 a118.0 b6.59 a22.45 a12.34 a5883 a
3-cuts1.62 b181.9 b92.1 a8.83 b26.35 b19.26 b6058 a
Si application (C)
0Si1.48 a173.0 a109.3 b8.00 a25.93 a16.30 a6147 a
Si1.44 a163.9 a95.6 a7.86 a23.65 a16.68 a5829 a
Regrowth (D)
1st0.96 a113.2 a113.7 b4.89 a18.83 a9.97 a5140 a
2nd1.76 b185.4 b91.1 a9.76 b27.95 b20.73 b5805 a
3rd1.87 b245.1 c102.7 ab10.37 b30.42 b21.04 b8049 b
Data in the row marked with the same lowercase letters do not differ significantly according to Tukey’s test (p ≤ 0.05).
Table 6. Interactions between main effects (year, frequency of mowing, Si application, and regrowth) in relation to the micronutrient content in the sward (mg kg−1).
SFeMnCuZnBSi
Interaction A × B
2023 × 2-cuts1.00 a168.1 b112.2 bc6.67 a22.14 a12.21 a5178 a
2023 × 3-cuts1.27 b167.4 b97.7 ab7.54 a24.70 ab14.25 a4755 a
2024 × 2-cuts1.46 b128.5 a123.8 c6.51 a22.76 a12.47 a6587 b
2024 × 3-cuts1.97 c196.5 b86.5 a10.12 b28.01 b24.26 b7362 b
Interaction A × C
2023 × 0Si1.18 a173.7 a108.8 ab7.31 a24.57 ab12.37 a5012 a
2023 × Si1.13 a161.6 a98.2 ab7.07 a22.77 a14.50 ab4836 a
2024 × 0 Si1.79 b172.3 a109.9 b8.70 b27.29 c20.23 c7281 b
2024 × Si1.75 b166.3 a93.0 a8.66 b24.54 ab18.87 bc6823 b
Interaction B × C
2-cuts × 0Si1.28 a151.2 a126.8 c6.90 a24.28 ab11.91 a6084 a
2-cuts × Si1.17 a145.4 a109.2 bc6.27 a20.62 a12.77 a5681 a
3-cuts × 0Si1.62 b187.5 b97.6 ab8.74 b27.03 b19.22 b6189 a
3-cuts × Si1.62 b176.3 ab86.6 a8.92 b25.68 b19.29 b5928 a
Interaction C × D
0Si × 1st0.98 a113.4 a120.1 c4.81 a19.22 a8.88 a5156 a
0Si × 2nd1.81 b180.5 b99.5 ab9.99 b29.66 b20.99 b6134 ab
0Si × 3rd1.84 b277.3 c107.2 bc10.42 b31.90 b21.75 b8154 c
Si × 1st0.94 a113.1 a107.3 bc4.96 a18.45 a11.06 a5125 a
Si × 2nd1.70 b190.3 b82.7 a9.54 b26.23 b20.48 b5476 a
Si × 3rd1.91 b213.0 b98.1 ab10.32 b28.93 b20.33 b7944 bc
Interaction B × D
2-cuts × 1st0.89 a110.7 a120.2 b4.30 a17.24 a7.75 a5644 ab
2-cuts × 2nd1.56 b185.9 b115.8 b8.87 b27.67 b16.93 bc6121 b
3-cuts × 1st1.03 a115.7 a107.3 b5.47 a20.43 a12.19 ab4636 a
3-cuts × 2nd1.95 c184.9 b66.4 a10.65 c28.22 b24.54 c5489 ab
3-cuts × 3rd1.87 c245.1 c102.7 b10.37 c30.42 b21.04 cd8049 c
A—Year, B—frequency of mowing, C—Si application, D—regrowth. Data in the row marked with the same lowercase letters do not differ significantly according to Tukey’s test (p ≤ 0.05).
Disclaimer/Publisher’s Note: The statements, opinions and data contained in all publications are solely those of the individual author(s) and contributor(s) and not of MDPI and/or the editor(s). MDPI and/or the editor(s) disclaim responsibility for any injury to people or property resulting from any ideas, methods, instructions or products referred to in the content.

