Abstract
Unconventional food plants (UFPs) are increasingly valued for their nutritional composition and bioactive potential. This study proposes a comprehensive characterization of the chemical and bioactive properties of Pereskia aculeata Miller (Cactaceae) (PA); Xanthosoma sagittifolium (L.) Schott (Araceae) (XS); Stachys byzantina K. Koch (Lamiaceae) (SB); and inflorescences from three cultivars of Musa acuminata (Musaceae) var. Dwarf Cavendish, var. BRS Platina, and var. BRS Conquista (MAD, MAP, and MAC), including the assessment of physical, nutritional, phytochemical, and biological parameters. Notably, detailed phenolic profiles were established for these species, many of which are poorly documented in the literature. XS was characterized by a unique abundance of C-glycosylated flavones, especially apigenin and luteolin derivatives, rarely described for this species. SB exhibited high levels of phenylethanoid glycosides, particularly verbascoside and its isomers (up to 21.32 mg/g extract), while PA was rich in O-glycosylated flavonols such as quercetin, kaempferol, and isorhamnetin derivatives. Nutritionally, XS had the highest protein content (16.3 g/100 g dw), while SB showed remarkable dietary fiber content (59.8 g/100 g). Banana inflorescences presented high fiber (up to 66.5 g/100 g) and lipid levels (up to 7.35 g/100 g). Regarding bioactivity, PA showed the highest DPPH radical scavenging activity (95.21%) and SB the highest reducing power in the FRAP assay (4085.90 µM TE/g). Cellular antioxidant activity exceeded 2000% in most samples, except for SB. Cytotoxic and anti-inflammatory activities were generally low, with only SB showing moderate effects against Caco-2 and AGS cell lines. SB and PA demonstrated the strongest antimicrobial activity, particularly against Yersinia enterocolitica, methicillin-resistant Staphylococcus aureus (MRSA), and Enterococcus faecalis, with minimum inhibitory concentrations ranging from 0.156 to 0.625 mg/mL. Linear discriminant analysis revealed distinctive chemical patterns among the species, with organic acids (e.g., oxalic up to 7.53 g/100 g) and fatty acids (e.g., linolenic acid up to 52.38%) as key discriminant variables. Overall, the study underscores the nutritional and functional relevance of these underutilized plants and contributes rare quantitative data to the scientific literature regarding their phenolic signatures.
1. Introduction
A diverse group of nutrient-rich vegetables that remain relatively unfamiliar to the general public is commonly referred to as PANCs (Plants with Alternative Nutritional Components) or unconventional food plants (UFPs) [1]. This designation also encompasses species that are either marketed on a very limited scale or lack commercial value, as well as those that are processed using less common methods [2]. In recent years, there has been a growing scientific and consumer interest in UFPs because they can deliver a broad spectrum of nutrients, including proteins, carbohydrates, minerals, vitamins, dietary fiber, and phenolic compounds [3]. Typically excluded from the “traditional” diet due to limited awareness or culinary customs, UFPs can have one or more edible parts—such as leaves, roots, fruits, or flowers—whether they grow spontaneously or are cultivated, native, or introduced [4]. Numerous studies have described the widespread use of UFPs in traditional medicine for both the prevention and treatment of various diseases, including neurodegenerative, renal, and cardiovascular disorders. These plants have been reported to demonstrate antioxidant, anti-inflammatory, and anticancer properties [5], making them of considerable interest for food and pharmaceutical innovation [2].
The genus Pereskia, belonging to the Cactaceae family and the Pereskioideae subfamily, has been investigated regarding its chemical composition and biological activities [6]. Species of this genus are known to be rich in phytochemicals such as phenolic compounds, carotenoids, and terpenes, which contribute to their antioxidant, antimicrobial, and anti-inflammatory potential [7,8]. The leaves of Pereskia aculeata have been traditionally used to treat inflammatory disorders, support wound healing, and as an adjunct therapy in cancer [9]. Notably, the high mucilage content of P. aculeata confers stabilizing, emulsifying, and thickening properties, positioning it as a natural hydrocolloid of interest in the development of food and pharmaceutical products as a replacement for synthetic emulsifiers [10].
Another example is Xanthosoma sagittifolium (L.) Schott (Araceae), locally referred to as “tannia,” which contains syringic acid; caffeic acid; quercetin [11]; and a range of minerals such as iron, calcium, potassium, and zinc. The leaves of this species are recognized for their nutritional richness, especially their contributions of vitamins A and C [1]. Araújo et al. [12] strongly recommended the inclusion of X. sagittifolium in human diets as an important source of calcium, potentially helping to prevent conditions like osteoporosis. Furthermore, its content of carotenoids and chlorophyll has been linked to notable antioxidant and anticarcinogenic activity [1].
Unconventional plants from the Lamiaceae family have also been investigated, including Stachys byzantina K. Koch, which shows remarkable antioxidant potential. This species is notable for its abundance of nutraceutical compounds, high mineral levels, and elevated concentrations of vitamins C and K. It also contains significant amounts of fiber, protein, carbohydrates, and essential amino acids [13]. Extracts of S. byzantina are rich in phenolic compounds with diverse biological activities, such as caffeic, chlorogenic, and ferulic acids, as well as rutin, apigenin, verbascoside, stigmasterol, β-sitosterol, and lawsaritol [14].
The banana inflorescence (Musa acuminata Colla, Musaceae) represents an edible by-product of banana cultivation [15]. Commonly referred to as banana flower or banana blossom, it consists of a dark reddish floral structure attached to the end of the peduncle, including the stalk, bracts, and flowers [16]. Despite its high potential for the development of value-added foods and functional products, this botanical part remains underutilized [17]. Banana inflorescences are particularly valued for their pronounced antioxidant activity, which helps neutralize free radicals and reduce the risk of chronic diseases. They are rich in a variety of phytochemicals, including alkaloids, glycosides, steroids, saponins, and terpenoids, as well as phenolic compounds such as tannins and flavonoids [18].
The growing interest in the use of underutilized and unconventional food plants has stimulated research aimed at identifying sustainable and nutritionally valuable alternatives for food and pharmaceutical applications. Species such as Pereskia aculeata Miller, known as ora-pro-nobis, are notable for their richness in proteins, dietary fibers, and bioactive compounds with antioxidant and antimicrobial properties, making them promising candidates for the development of functional ingredients and edible coatings [19]. Likewise, crops such as cocoyam (Xanthosoma sagittifolium) play a strategic role in food security in tropical regions, although they remain underexplored in terms of technological research and product innovation [20]. The incorporation of plant extracts with bioactive properties into films and edible coatings offers a sustainable approach that helps reduce postharvest losses, enhances the stability of sensitive compounds, and meets consumer demand for natural and environmentally responsible solutions [21]. Additionally, Stachys byzantina has attracted attention for its high content of fiber, vitamins, and minerals, combined with culinary versatility and the potential for cultivation with low input requirements and significant contributions to agroecological systems, reinforcing its value as an unconventional food plant and a promising source of functional ingredients [22].
Despite the recognized nutritional and functional potential of UFPs, their incorporation into industrial food products remains limited. In recent years, some progress has been made with the development of functional flours, natural colorants, and antioxidant additives derived from unconventional plants, as well as their incorporation into biodegradable edible films and coatings to extend shelf life and reduce synthetic additives. However, several challenges continue to hinder large-scale applications. These include limited agronomic standardization and supply chains, variability in phytochemical composition due to environmental factors, and scarce toxicological and allergenicity assessments required for regulatory approval. Additionally, the sensory characteristics of many UFP-based products, such as bitter taste or atypical aromas, can restrict consumer acceptance. Addressing these limitations through targeted technological innovation and interdisciplinary research is essential to unlock the potential of UFPs as sustainable alternatives in the food industry.
This research aims to show UFPs or PANCs as alternative sources of nutrients as well as bioactive properties, namely in the leaves of Pereskia aculeata; Xanthosoma sagittifolium; Stachys byzantina K. Koch; and three varieties of Musa acuminata, i.e., var. Dwarf Cavendish, BRS Platina, and BRS Conquista.
2. Materials and Methods
2.1. Materials
Acetonitrile (99.9% purity, HPLC grade) was supplied by Lab-Scan (Lisbon, Portugal). The radical scavenging reagent 2,2-diphenyl-1-picrylhydrazyl (DPPH) was sourced from Alfa Aesar (Ward Hill, MA, USA). Standards for phenolic compounds and Trolox (6-hydroxy-2,5,7,8-tetramethylchroman-2-carboxylic acid) were obtained from Sigma (St. Louis, MO, USA). The reagents necessary for the FRAP (Ferric Reducing Antioxidant Power) assay, including sodium acetate trihydrate, glacial acetic acid (analytical grade), hydrochloric acid (analytical grade), ferric chloride hexahydrate, ferrous sulfate heptahydrate, and TPTZ (2,4,6-Tris(2-pyridyl)-s-triazine, molecular weight 312.34 g/mol), were purchased from Sigma Aldrich (product code T1253 or equivalent). The Folin–Ciocalteu reagent was also obtained from Sigma Aldrich (St. Louis, MO, USA). Sodium carbonate, along with monobasic and dibasic potassium phosphate salts, was provided by Merck Millipore (Darmstadt, Germany). Sodium acetate and potassium chloride were purchased from Thermo Scientific (Waltham, MA, USA). Ethanol and all other ancillary reagents were acquired from Sigma Chemical Co. (St. Louis, MO, USA). Ultrapure water used throughout the experimental procedures was produced by a Milli-Q system (TGI Pure Water Systems, Greenville, SC, USA). Bacterial and fungal strains used in this study were obtained from Frilabo (Porto, Portugal). All cell lines, with the exception of macrophages, were sourced from the Leibniz Institute DSMZ—German Collection of Microorganisms and Cell Cultures GmbH (Inhoffenstraße 7B, 38124 Braunschweig, Germany). Macrophage cells were provided by the European Collection of Authenticated Cell Cultures (ECACC), Culture Collections, UK Health Security Agency (Porton Down, Salisbury, SP4 0JG, UK).
2.2. Sampling
The banana inflorescence of Musa acuminata var. “Dwarf Cavendish” was sourced from Madeira Island in Portugal (32°45′24.6″ N 17°01′01.9″ W). The varieties BRS Platina and BRS Conquista were obtained from the São Manuel Experimental Farm of the São Paulo State University (UNESP) in São Paulo, Brazil (22°46′09″ S 48°34′18″ W). Stachys byzantina K. Koch, Xanthosoma sagittifolium, and Pereskia aculeata were also from the UNESP, but from the Faculty of Agricultural Sciences, Botucatu (22°51′07.0″ S 48°25′55.0″ W). In the Brazilian context, Pereskia aculeata, Xanthosoma sagittifolium, and Stachys byzantina are considered non-conventional food plants (PANC), while the banana inflorescences are regarded as agricultural by-products with emerging potential for food applications. This classification is provided solely to describe their origin and does not imply any difference in processing. Following collection, all the plant materials were thoroughly rinsed with distilled water to eliminate surface residues and subsequently dried in a forced-air oven at 40 °C for 12 h to preserve their bioactive constituents [23,24,25]. After drying, most samples were ground to a fine powder (20 mesh) using a knife mill (Grindomix GM 300, Haan, Germany), and the samples were kept in their dried, unground form for specific analyses.
The identification details of all the studied species were documented in the Materials and Methods Section. Voucher specimens of Pereskia aculeata (BOTU 35880) and Stachys byzantina (BOTU 40945) were deposited in the Irina Delanova De Gemtchujnicov Herbarium (BOTU), Botucatu, Brazil. Leaves of Xanthosoma sagittifolium and inflorescences of Musa acuminata var. BRS Platina and BRS Conquista were also identified at the same institution, although voucher numbers for these samples are pending confirmation. The inflorescences of Musa acuminata var. Dwarf Cavendish were authenticated based on reference material held by the Instituto Politécnico de Bragança, Portugal.
2.3. Nutritional Analysis
To determine the centesimal composition of Pereskia aculeata, Xanthosoma sagittifolium, Stachys byzantina, Musa acuminata Dwarf Cavendish leaves, and Musa acuminata Conquista and Platina inflorescences, standard methods were applied (AOAC, 2016) [26].
2.3.1. Protein Content
The protein content was quantified according to the AOAC protocol [26], employing the Macro-Kjeldahl technique and applying a nitrogen-to-protein conversion factor of 6.25 (N × 6.25). For each analysis, 0.100 g of dried sample was accurately weighed into digestion tubes and treated with 15 mL of concentrated sulfuric acid in the presence of a catalyst mixture (K2SO4/CuSO4). The digestion process was carried out at 400 °C for 70 min. After the digestion was complete and the samples cooled, the contents were transferred to a Kjeldahl distillation apparatus (Pro-Nitro-A model, JP Selecta, Barcelona, Spain). An automated alkaline distillation followed by titration was performed within the instrument to determine the total nitrogen content.
2.3.2. Crude Fat
The crude fat content was assessed following the AOAC 920.85 method [26], employing Soxhlet extraction with petroleum ether selected as the solvent for its non-polar characteristics. During the procedure, the solvent was continuously recirculated through each sample for 30 extraction cycles to ensure complete recovery of the lipid fraction. Upon the completion of the extraction, the petroleum ether was evaporated, and the residual fat was dried and accurately weighed to determine the crude fat content.
2.3.3. Ash
The ash content was determined according to the AOAC 923.03 method [26], which entails the incineration of organic material at elevated temperatures. For each analysis, 0.25 g of sample was accurately weighed and placed in crucibles. The samples were subjected to incineration in a muffle furnace (Optic Ivymen System, N-8L, Barcelona, Spain) at 550 °C for 5 h. The resulting ash was then cooled in a desiccator and weighed to quantify the inorganic residue.
2.3.4. Carbohydrate and Fiber Content
Digestible carbohydrates were calculated as the difference between 100 and the sum of all other components (including dietary fiber).
The total energy value was determined according to the formula established by European Regulation (EU) Nº. 1169/2011 of the European Parliament and the Council (2011):
Energy (kcal) = 4 × (gproteins + gcarbohydrates) + 9 × (glipids)
The results were expressed in Kcal and KJ, as shown in Table 1.

Table 1.
Nutritional composition of the different PANCS 1.
The total dietary fiber (TDF) content was measured in accordance with the AOAC 985.29 method [26], utilizing a combination of enzymatic digestion and gravimetric analysis with the TDF-100A assay kit (Sigma-Aldrich Chemie GmbH, Buchs, Switzerland). For each determination, 0.25 g of sample was weighed in quadruplicate. The procedure consisted of three sequential enzymatic steps: gelatinization with α-amylase at 95 °C, proteolytic digestion with protease at 60 °C to remove protein, and hydrolysis of residual starch using amyloglucosidase at 60 °C. Following enzymatic treatment, dietary fiber was precipitated by the addition of ethanol, and the mixture was allowed to stand at room temperature overnight. The precipitated fiber was then collected by filtration under vacuum using glass crucibles, thoroughly washed with 78% and 95% ethanol followed by acetone, and dried at 105 °C overnight. The dried residue was subsequently weighed to determine the total dietary fiber content.
2.4. Physical Parameters
2.4.1. Water Activity (aw)
Water activity was assessed using a Dew Point Water Activity Meter 4TE (AquaLab, METER Group, Pullman, WA, USA). This instrument provides high-precision measurements by determining the dew point temperature of the air in equilibrium with the sample [27].
2.4.2. Moisture
Moisture content was determined by the oven-drying method in accordance with AOAC Official Method 925.09. Approximately 1 g of each sample was accurately weighed and placed in a drying oven set at 105 °C for 24 h. The moisture percentage was calculated using the equation: % moisture = [(mi − mf)/mi] × 100%, where mi represents the initial weight of the sample and mf corresponds to the weight after drying to a constant mass.
2.5. Chemical Parameters
2.5.1. pH
The pH was measured using a titrator equipped with a potentiometric probe (Hanna Instruments HI 902). Prior to analysis, the samples were homogenized in distilled water to ensure uniform dispersion. The pH electrode was then immersed in the prepared suspension for measurement. Calibration of the instrument was performed using standard buffer solutions with pH values of 4.01 and 7.00 to guarantee the accuracy and reliability of the readings.
2.5.2. Total Acidity
The total acidity was determined according to the procedure described in [28]. For each analysis, one gram of the sample was accurately weighed and diluted in 100 mL of distilled water. The pH of the resulting solution was recorded prior to titration. Titration was carried out using 0.1 M sodium hydroxide until the pH reached between 8.2 and 8.4. The acidity was calculated using the following equation:
where V represents the volume of 0.1 M sodium hydroxide used, f is the correction factor for the standard sodium hydroxide solution, M is its molarity, and A denotes the sample mass in grams.
Acidity (molar solution per 100 mL) = (V × f × M × 100)/A
2.5.3. Total Solids
The determination of total soluble solids was conducted according to the methodology described in [29]. A 1 g portion of the sample was weighed and diluted in 20 mL of distilled water. The mixture was stirred for 15 min to promote the dispersion of soluble components. Following agitation, the suspension was filtered to remove any insoluble residues, thereby ensuring that only the dissolved fraction was subjected to analysis. The clarified solution was then evaluated using a digital Brix refractometer (Handheld Electronic Saccharimeter), which measured the °Brix value. This parameter reflects the percentage of total soluble solids—predominantly sugars—present in the aqueous extract.
2.5.4. Fatty Acids
Fatty acids extracted from crude fat were converted to their methyl esters by reacting with a mixture of methanol, sulfuric acid, and toluene (2:1:1 v/v/v) for at least 12 h at 50 °C under agitation (160 rpm). After methylation, 3 mL of deionized water and 3 mL of ethyl ether were added to separate the phases. The organic layer was collected and dried over anhydrous sodium sulfate. Prior to analysis, the samples were filtered through 0.2 μm nylon syringe filters (Whatman, Phenomenex, Torrance, CA, USA) into HPLC vials. Gas chromatography was performed using a YOUNG IN Chromass 6500 GC system (Gyeonggi, Republic of Korea) equipped with a split/splitless injector (250 °C, split ratio 1:50), a flame ionization detector (260 °C), and a Zebron-Fame capillary column (30 m × 0.25 mm ID × 0.20 µm film thickness, Phenomenex, Lisbon, Portugal). The oven temperature program started at 100 °C (2 min), increased at 10 °C/min to 140 °C, then ramped at 3 °C/min to 190 °C, followed by 30 °C/min to a final temperature of 260 °C. Hydrogen was used as the carrier gas at a flow rate of 1.2 mL/min (measured at 250 °C). Fatty acid methyl esters were identified and quantified by comparing retention times with those of a certified standard mixture (47885-U, Sigma, St. Louis, MO, USA). Data acquisition and processing were carried out using the Clarity DataApex 4.0 software (Prague, Czech Republic). The results were expressed as the relative percentage of each fatty acid present in the samples [29].
2.5.5. Organic Acids
The profile of organic acids was analyzed by ultra-fast liquid chromatography (UFLC) coupled with a photodiode array detector (PDA) using a Shimadzu 20A series system (Shimadzu Corporation, Kyoto, Japan). Separations were carried out on a reverse-phase C18 SphereClone column (250 mm × 4.6 mm, 5 μm particle size; Phenomenex, Torrance, CA, USA). An isocratic elution was employed with 3.6 mM sulfuric acid as the mobile phase, maintained at a flow rate of 0.8 mL/min and a column temperature of 35 °C. For extraction, approximately 1.0 g of the freeze-dried sample was weighed (exact mass recorded) into a beaker covered with aluminum foil. Twenty-five milliliters of 4.5% (w/v) metaphosphoric acid were added, and the mixture was stirred magnetically for 20 min at ambient temperature to ensure the complete extraction of soluble acids. The solution was then filtered through qualitative filter paper into a 20 mL test tube and subsequently transferred to an amber vial (1.5 mL) for chromatographic analysis. Quantification was based on calibration curves prepared with commercial standards, and the results were expressed as grams per 100 g of dry weight [30]. The final analysis was performed using UFLC-DAD. The following calibration curves were used to quantify the detected organic acids: Oxalic: y = 1 × 10⁷x + 432.019; Quinic: y = 629,770x + 4980.2; Malic: y = 930,178x + 62.016; Ascorbic: y = 6 × 10⁷x + 793,159; Citric: y = 1 × 10⁶x + 65.994; Succinic: y = 642,286x − 6828.9; Fumaric: y = 4 × 10⁷x + 119.019.
2.5.6. Phenolic Compounds
For the analysis of bioactive compounds, extracts were prepared by maceration following the method described by Oliveira et al. (2024) [31]. Briefly, 1 g of powdered sample was weighed and diluted in 30 mL of a hydroethanolic solvent consisting of 70% ethanol and 30% distilled water. The mixture was homogenized on a microplate shaker (Multimatic-9N, Selecta, Abrera, Barcelona, Spain) for 2 h at 100 rpm and subsequently centrifuged (Thermo Fisher Scientific, Osterode am Harz, Germany) at 1500 rpm for 10 min. The resulting supernatant was collected and filtered through no. 4 filter paper (Chmlab Group, Barcelona, Spain). The filtrate was then lyophilized using a freeze dryer (Coolvacuum Technologies, Triepic-55 model, Granollers, Barcelona, Spain) to obtain a dry extract powder. For phenolic compound profiling, the lyophilized extracts were reconstituted in an EtOH/H2O solution (20:80, v/v) to a final concentration of 10 mg/mL and filtered through a 25 mm Clarify-Ny syringe filter (Phenomenex, Torrance, CA, USA) [32]. The analyses were performed using an LC-DAD-ESI/MSn system (Dionex Ultimate 3000 UPLC, Thermo Scientific, San Jose, CA, USA) equipped with a diode array detector set at 280, 330, and 370 nm, coupled to a linear ion trap electrospray ionization mass spectrometer (LTQ XL, Thermo Finnigan, San Jose, CA, USA) operating in negative ionization mode. Compound identification was achieved by comparing the chromatographic retention times and spectral data with literature references and, when available, with authentic commercial standards. Calibration curves were established using peak areas detected at each wavelength for representative standards of different phenolic classes. The following calibration curves were used: luteolin-7-O-glucoside: y = 13,848x – 10,349; chlorogenic acid: y = 312,503x – 199,432; verbascoside: y = 124,233x – 18,873; protocatechuic acid: y = 214,168x + 27,102; p-coumaric acid: y = 504,847x – 45,869; sinapic acid: y = 543,305x – 25,202; quercetin-3-O-glucoside (rutin): y = 9617.8x − 4374.7. The results were expressed in mg/g of extract.
2.6. Bioactive Parameters
2.6.1. Preparation of the Extracts
For the bioactivity assessments, extracts were prepared following the procedure described in [32] with slight modifications. Briefly, 5 g of the sample was weighed and combined with 40 mL of a hydroethanolic solution composed of 70% ethanol in water. The mixture was homogenized for 12 h at 100 rpm in an incubator shaker (Edmund Bühler GmbH, Schindäckerstraße 8, 72411 Bodelshausen, Germany). After incubation, the suspension was centrifuged (Thermo Fisher Scientific, Osterode am Harz, Germany) at 1500 rpm for 15 min. The supernatant was carefully collected, filtered through Whatman No. 4 filter paper, and subsequently lyophilized to yield a dry powdered extract.
2.6.2. Total Phenols
The total phenolic content in the ethanolic extracts was quantified using a colorimetric assay adapted from the method of Singleton and Rossi with some modifications [33]. In brief, 1 mL of the extract was combined with 1 mL of Folin–Ciocalteu reagent. After allowing the mixture to react for 3 min, 1 mL of saturated sodium carbonate solution was added, and the volume was brought to 10 mL with distilled water. The reaction mixture was incubated in the dark for 90 min. Subsequently, absorbance was measured at 725 nm using a spectrophotometer (model 4255/50, Beriango, Spain). Quantification was performed using a gallic acid calibration curve prepared in 70% ethanol (y = 5.8096x − 0.0508; R2 = 0.999). All the measurements were carried out in triplicate. The results are presented as mean values ± standard deviations and expressed in milligrams of gallic acid equivalents (GAEs) per gram of extract.
2.6.3. DPPH
The antioxidant capacity of the extracts was assessed using the DPPH (2,2-diphenyl-1-picrylhydrazyl) radical scavenging assay, following the protocol described by [34]. Extract aliquots prepared as specified in Section 2.6.1, with volumes ranging from 20 to 150 µL, were mixed with the DPPH working solution to achieve final concentrations between 13.33 and 100 µg/mL in a total volume of 3.0 mL. For the negative control, 150 µL of distilled water was added to 2750 µL of the DPPH solution. To validate the assay performance, a positive control containing 150 µL of butylated hydroxytoluene (BHT) was prepared under the same conditions. All the samples were incubated in the dark at ambient temperature for 60 min. Absorbance readings were recorded at 517 nm to determine the radical scavenging activity. The results were expressed as %AA (percentage of antioxidant activity), calculated using the following formula:
The antioxidant activity was assessed using the DPPH radical scavenging assay. The results were expressed as %AA (percentage of antioxidant activity), calculated using the following formula:
where A1 is the sample absorbance, A2 is the blank absorbance, and Ac is the negative control absorbance. A higher %AA value indicates a greater ability of the sample to neutralize free radicals.
%AA = (1 − (A1 − A2)Ac) × 100
2.6.4. FRAP
The FRAP (Ferric Reducing Antioxidant Power) assay was carried out based on the method described by [34]. For the preparation of the reagents, a 40 mM hydrochloric acid solution, a 300 mM acetate buffer (pH 3.6), a 10 mM TPTZ solution, and a 20 mM ferric chloride solution were freshly prepared each day. The FRAP working solution was obtained by combining the acetate buffer, TPTZ, and ferric chloride solutions in a 10:1:1 ratio. A 1000 µM Trolox solution was used to generate a calibration curve (y = 0.0458x − 0.1446; R2 = 0.999). For each determination, 100 µL of the extract, 3 mL of the FRAP reagent, and 300 µL of distilled water were mixed in triplicate. A blank was prepared by replacing the extract with 100 µL of solvent. The mixtures were homogenized and incubated at 37 °C for 30 min. Absorbance was then measured at 593 nm using a spectrophotometer. This assay quantifies antioxidant capacity by monitoring the reduction of ferric (Fe3+) to ferrous ions (Fe2+), which results in an increase in absorbance. The FRAP values were expressed as milligrams of Trolox equivalents per gram of extract (mg TE/g).
2.6.5. Cellular Antioxidant Activity
The cellular antioxidant activity (CAA) assay was conducted according to the procedure described by [35]. The extracts were initially dissolved in water at a concentration of 8 mg/mL, and serial dilutions were prepared using 2′,7′-dichlorodihydrofluorescein (DCFH) and HBSS (50 μM) to obtain final concentrations ranging from 500 to 2000 μM. The RAW 264.7 murine macrophage cell line was employed for the assay. The cells were cultured in DMEM supplemented with L-glutamine, penicillin, streptomycin, fetal bovine serum, and non-essential amino acids, maintained at 37 °C in a humidified atmosphere containing 5% CO2. Following detachment and centrifugation, the cells were resuspended to yield a density of 70,000 cells/mL. Aliquots of 300 μL were seeded into black-walled, clear-bottom microplates and incubated for 48 h. After incubation, the medium was removed, and the cells were washed with HBSS. Subsequently, 200 μL of the extract solutions at concentrations between 32.5 and 2000 μM were added and incubated for 1 h. After a second wash with HBSS, the cells were treated with 100 μL of 600 μM AAPH solution. Fluorescence readings were recorded every 5 min over a 60 min period (excitation wavelength 485 nm and emission wavelength 538 nm) using a Biotek FLx800 microplate reader (Santa Clara, CA, USA). Quercetin was used as a positive control, while wells containing only DCFH and culture medium served as negative controls [30].
2.6.6. Cytotoxicity and Anti-Inflammatory Activity
The extracts were tested for cytotoxic activity against three human tumor cell lines: gastric adenocarcinoma (AGS), breast carcinoma (MCF-7), and cervical carcinoma (HeLa), as well as one non-tumor primary cell line (VERO), derived from the kidney of the African green monkey (Chlorocebus aethiops). Tumor cell lines were obtained from the Leibniz-Institut DSMZ (Braunschweig, Germany). The cells were seeded into 96-well microplates and exposed to various concentrations of the extracts, up to a maximum of 400 μg/mL. Cell viability was assessed using the sulforhodamine B assay (Sigma-Aldrich, St. Louis, MO, USA). Absorbance readings were recorded at 540 nm, and ellipticin was employed as a positive control. The results were reported as GI50 values (µg/mL), representing the concentration required to inhibit 50% of cell proliferation [36]. For anti-inflammatory evaluation, the murine RAW 264.7 macrophage cell line was cultured in Dulbecco’s Modified Eagle’s Medium (DMEM), supplemented as described by [31]. The inhibitory effect on nitric oxide (NO) production was measured, and results were expressed as EC50 values (µg/mL), indicating the concentration necessary to achieve 50% inhibition. Dexamethasone (50 µM) was used as the reference positive control.
2.6.7. Antimicrobial Activity
The antibacterial and antifungal properties of the extracts were evaluated using a serial microdilution assay, following the protocol described by [31]. Extract concentrations ranged from 0.0078 to 10 mg/mL. For antibacterial screening against foodborne pathogens, the extracts were tested against five Gram-negative bacteria—Enterobacter cloacae (ATCC 49741), Escherichia coli (ATCC 25922), Pseudomonas aeruginosa (ATCC 9027), Salmonella enterica (ATCC 13076), and Yersinia enterocolitica (ATCC 8610)—and three Gram-positive bacteria—Bacillus cereus (ATCC 11778), Listeria monocytogenes (ATCC 19111), and Staphylococcus aureus (ATCC 25923). In addition, antibacterial activity was assessed against clinically relevant strains, including five Gram-negative bacteria—Escherichia coli (VRU12881), Proteus mirabilis (VRI7884), Klebsiella pneumoniae (VRI17214), Pseudomonas aeruginosa (VRU14123), and Morganella morganii (VRU14272)—and three Gram-positive bacteria—Enterococcus faecalis (VRU14041), Listeria monocytogenes (VRU17684), and methicillin-resistant Staphylococcus aureus (MRSA, VRI17654). Antifungal activity was also examined against Aspergillus fumigatus (ATCC 204305) and Aspergillus brasiliensis (ATCC 16404). Minimum inhibitory concentrations (MICs) were determined for all the tested microorganisms. Ampicillin (0.078–20 mg/mL) served as the positive control for antibacterial assays, while ketoconazole (0.039–10 mg/mL) was used as the reference antifungal agent.
2.7. Statistical Analysis
In this study, all the experiments were conducted in triplicate, and the results were expressed as means with corresponding standard deviations. Prior to analysis of variance (ANOVA), the data were assessed for homoscedasticity and homogeneity of variances using Levene’s test. When the assumption of homogeneity was met, Tukey’s post hoc test was applied to identify significant differences between groups. In cases where variance homogeneity was not confirmed, the Tamhane T2 test was employed instead. To enhance discrimination among the samples, linear discriminant analysis (LDA) was performed. The stepwise method was applied for variable selection using Wilks’ λ test with F-to-enter and F-to-remove thresholds set at 3.84 and 2.71, respectively. The leave-one-out cross-validation procedure was used to validate the model.
3. Results
3.1. Nutritional Composition
Table 1 presents the centesimal composition content of the different studied species, expressed in grams per 100 g of dry matter (g/100 g dw). The statistical analysis revealed significant differences among the species for the main evaluated parameters (p < 0.05).
The lower than the average of 20% commonly described in the literature (Cruz et al., 2021) [37]. This variation may be related to factors such as cultivation conditions and the developmental stage of the leaves.
SB stood out due to its high fiber content (59.8 g/100 g), surpassing the values previously reported for PA (39.01 g/100 g) by Takeiti et al. (2009) [35] and approaching those found in sweet potato leaves (45.9 g/100 g), as indicated by Silva et al. (2022) [38]. The protein content (12.7 g/100 g) was also considerable, although slightly lower than the 14.33 g/100 g reported by Silva (2022) [38] for freeze-dried leaves. In a study conducted by Botrel et al. (2020) [39], SB cultivated in the Brazilian Cerrado showed higher values for protein and fiber than those found in ora-pro-nóbis, reinforcing its high nutritional value. Additionally, the low total sugar content (2 g/100 g) observed in this study supports the recommendation of SB as a suitable ingredient for glycemic control diets [40].
XS showed outstanding nutritional performance in Table 1, with the highest protein content among the samples (16.3 g/100 g), confirming its potential as a high-quality plant-based protein source, in line with global trends in the search for sustainable and nutritious ingredients [41]. The predominance of insoluble dietary fibers, already reported for this species [25,42,43], contributes to beneficial physiological effects, such as improved intestinal transit and cholesterol reduction [44].
The banana inflorescences from the MAD, MAC, and MAP cultivars presented a proximate composition consistent with data from the literature, which highlights their still underutilized nutritional potential [17]. As shown in Table 1, the main components were carbohydrates and dietary fiber. These values support previous studies that describe banana inflorescences as relevant sources of these nutrients [45,46]. Although the protein content was moderate (ranging from 6.4 ± 0.2 to 7.5 ± 0.2 g/100 g), it contributes to the overall nutritional profile of the inflorescences, reinforcing their potential as a versatile plant-based ingredient. The application this plants in meat products as a fat substitute, contributing to improved oxidative stability, moisture retention, and reduced cooking losses [47,48,49]. However, the literature emphasizes that genetic variations between cultivars and environmental growing conditions can influence the final composition of the inflorescences, and thus, it is recommended to focus on general nutritional trends rather than direct comparisons between studies [50]. Such similarities are likely related to comparable maturity stages and similar climatic conditions during cultivation, which are known to strongly influence macronutrient profiles. Additionally, methodological differences in moisture correction and analytical protocols may account for minor discrepancies among studies.
3.2. Physical and Chemical Parameters
Table 2 presents the physical and chemical parameters of the different analyzed species. The statistical analysis revealed significant differences among the species for the main evaluated parameters (p < 0.05). The predominant values presented in Table 2 indicate that MAC exhibited the highest water activity (0.44 ± 0.01), whereas MAP showed the lowest (0.32 ± 0.01). Regarding the moisture content, XS (11.35 ± 0.48%) and MAC (11.27 ± 0.51%) recorded the highest values, while PA presented the lowest (3.82 ± 0.12%). These findings are consistent in terms of pH trends with the data reported by Pérez et al. (2007) [51], who observed moisture (11.04 ± 0.09%), pH (6.5), and water activity (0.67 ± 0.01) in fresh leaves. However, it should be noted that given the present study analyzed dried samples, the moisture and water activity values are not directly comparable and should be interpreted only in relative terms. Similarly, the moisture contents reported by Silva et al. (2023) (83.3–91.1%) [19], correspond to fresh leaves, whereas the current values were obtained after controlled drying, resulting in reduced water content. The observed consistency in pH and water activity values may be attributed to the intrinsic physiological properties of each species and the standardized drying process applied, which tends to reduce variability in residual moisture content. Environmental factors during plant growth could also contribute to these results. With respect to pH, SB showed the highest value (6.33 ± 0.03), whereas MAP displayed the lowest (5.88 ± 0.03), highlighting interspecies variability. Total acidity was highest in XS (4.25 ± 0.05 M/100 mL), followed by MAC (3.72 ± 0.45 M/100 mL), while PA exhibited the lowest value (1.70 ± 0.11 M/100 mL). These results reflect the presence of organic acids, such as oxalic and citric acids, as previously described by Cruz et al. (2021) [37]. The total soluble solids content ranged from 0.90 ± 0.01 °Brix in SB to 2.00 ± 0.10 °Brix in MAP, which may be associated with a higher concentration of soluble compounds. For banana inflorescences, the observed moisture (7.8–11.3%), pH (5.88–6.14), and water activity (0.32–0.44) values are in agreement with those reported by Ramu (2017) [52] and Swe et al. (2012) [53], who described moisture contents between 7.36% and 9.37% in different Musa sp. varieties, supporting the reliability of the present findings. The quality of biological materials after drying can be preserved by monitoring parameters such as residual moisture content and appropriate storage conditions. Information on the equilibrium moisture characteristics of dehydrated matrices is essential, as it determines their stability, susceptibility to moisture uptake during storage, and overall shelf life [54].
Table 2.
Physical and chemical parameters of the PANCS 1.
Table 3 presents the individual profiles of fatty acids and organic acids across the analyzed species, revealing significant differences among them (p < 0.05). Palmitic acid (C16:0) was predominant in MAD, while linoleic acid (C18:2n6c) was more abundant in MAP and MAC. α-Linolenic acid (C18:3n3) stood out among the polyunsaturated fatty acids, especially in PA and XS. Succinic acid was the major organic acid in MAC and MAD, whereas oxalic acid was more concentrated in XS. These findings indicate that banana inflorescences are rich in both saturated and unsaturated fatty acids, particularly linoleic and α-linolenic acids, which are known for their cardiovascular benefits [52,55]. The presence of organic acids such as succinic, malic, and citric may also contribute to the antioxidant and technological potential of these matrices [52]. The high oxalic acid content observed in XS, as previously reported [1], may influence its mineral bioavailability and industrial applicability. In PA, the detection of citric, malic, lactic, and tartaric acids is consistent with the known acidity profile of green leafy vegetables [37]. Although some studies have reported different proportions of fatty acid classes [56], the general predominance of unsaturated fatty acids across banana inflorescences reinforces their nutritional relevance.
Table 3.
Profile of the individual fatty and organic acids, expressed in relative percentage and g/100g of dry weight, respectively 1.
Phenolic Compounds
The identification parameters and the quantification of the detected phenolic compounds are presented in Table 4. Phenolic compounds in the extracts were identified by comparing their characteristics with commercial standards, including retention times, λmax, molecular ion, and major fragment ions, as shown in Table 4.
Table 4.
Identification and quantification (mg/g extract) of individual phenolic compounds in the analyzed PANCs (mean ± SD) 1.
In the XS sample, 21 phenolic compounds were tentatively identified (Figure S1, Supplementary Materials), all belonging to the flavonoid class. Among them, flavones were predominant, with a broad representation of apigenin and luteolin derivatives, mainly in the form of C-glycosides and O-C-glycosides. Flavonols, such as quercetin and isorhamnetin derivatives, as well as a methoxylated derivative of the flavone diosmetin, were also detected. This alignment with previous research likely reflects the stability of the phenolic composition in these taxa, influenced primarily by genetic background and post-harvest handling practices. However, variations in extraction solvents, chromatographic conditions, and sample preparation can also contribute to differences in quantitative results.
The major flavonoid compounds tentatively identified were apigenin-C-hexoside-C-pentoside in peaks 7, 6, and 9, and apigenin-di-C-hexoside in peak 3. Other relevant flavonoids included apigenin-C-(ρ-coumaroyl)-hexoside-C-pentoside (peak 14) and apigenin-6-C-glucoside (peak 12). In lower concentrations, there were isorhamnetin-O-deoxyhexosyl-hexoside (peak 19) and trihydroxy-dimethoxyflavones. Peaks 6, 7, 3, and 9, all derived from apigenin, showed a deprotonated molecule [M–H]− with m/z 563 (peaks 6, 7, and 9) and m/z 593 (peak 3). These compounds exhibited fragmentation patterns characteristic of C-glycosylated flavonoids. Peaks 3, 6, 7, and 9 displayed neutral losses of 60 Da, 90 Da, and 120 Da, corresponding to internal sugar moiety (pentose and hexose) fragmentation [57,58]. Main phenolic constituents in XS are consistent with those reported in the specialized literature [57,58,59,60]. Ntengna et al. (2019) [61], also reported high levels of apigenin-pentosyl-hexoside and lutein derivatives in cocoyam leaves, which belong to the same species but may correspond to a different cultivar. Despite differences in environmental conditions and plant treatment, both studies confirm the predominance of flavones as key phenolics in this species.
In the SB sample, 15 compounds were tentatively identified, distributed among different chemical classes (Figure S2, Supplementary Materials). The phenolic profile was largely dominated by phenylethanoid glycosides, with verbascoside and its structural derivatives standing out [62,63]. Additionally, smaller amounts of phenolic acids, such as 5-O-caffeoylquinic acid [62,64], and flavonoids, including luteolin and hypolaetin derivatives [63,65,66,67], were also detected. The major compounds tentatively identified were a verbascoside derivative (peak 6) [62,63,68,69], followed by 5-O-caffeoylquinic acid (peak 1) [68,69,70,71] and 2′-O-arabinosyl verbascoside (peak 4). In lower concentrations, verbascoside isomer III (peak 8; 1.712 ± 0.003 mg/g extract), verbascoside isomer II (peak 7) [62,63], and leonoside A or allysonoside (peak 9; 1.101 ± 0.003 mg/g extract) were identified [67]. Other compounds, such as eukovoside, malonyl-verbascoside, and luteolin and hypolaetin derivatives, were found in even smaller amounts [62,67]. The most abundant compound, verbascoside (peak 6), exhibited a deprotonated molecule [M–H]− with m/z 623, and characteristic fragments at m/z 461, 315, 297, and 161, resulting from successive losses of caffeoyl (162 Da) and glycosidic residues (162 Da) [62,63]. 5-O-Caffeoylquinic acid (peak 1) showed [M–H]− at m/z 353, with a typical fragment at m/z 191, resulting from cleavage of the quinic acid core and loss of the caffeoyl group (Rijke et al. 2006) [57,63]. This result is in agreement with recent studies reporting the majority content of chlorogenic acid in plants of the Stachys genus [72]. 2′-O-Arabinosyl verbascoside (peak 4) presented [M–H]− at m/z 755, with fragments at m/z 593, 461, and 315, indicating sequential losses of pentose (132 Da) and hexose moieties (162 Da), confirming its diglycosylated structure. The verbascoside isomers (peaks 7 and 8), both with [M–H]− at m/z 623, displayed fragmentation behavior similar to the main verbascoside compound, including losses at m/z 461, 315, 297, and 161 [62,63]. Peak 9, tentatively identified as leonoside A or allysonoside, showed [M–H]− at m/z 769 and main fragments at m/z 593, 637, 461, with a loss of 176 Da in MS2, suggesting the presence of a glucuronyl moiety [67,73,74].
In the PA sample, 16 phenolic compounds were tentatively identified (Figure S3, Supplementary Materials), predominantly belonging to the flavonol subclass of flavonoids. The phenolic profile was primarily composed of O-glycosylated derivatives of quercetin, isorhamnetin, and kaempferol [7]. A small number of phenolic acids, such as protocatechuic, p-coumaric, and sinapic acid derivatives, were also present in trace amounts [75,76,77]. Among the quercetin derivatives, quercetin-O-pentoside-O-deoxyhexosyl-hexoside (peak 5) and quercetin-3-O-rutinoside (rutin) (peak 9) were the most abundant. Peak 5 exhibited [M–H]− at m/z 741, with MS2 fragments at m/z 723 (−18 Da, H2O), 609 (−132 Da, pentose), 591 (−150 Da, deoxyhexose), and 301 (−162 Da, hexose), indicating sequential losses of neutral sugar moieties. Rutin (peak 9) showed [M–H]− at m/z 609 and a major fragment at m/z 301, attributed to quercetin, after the neutral loss of rutinose (308 Da) [7,37,77,78]. Among the isorhamnetin derivatives, isorhamnetin-O-deoxyhexoside-hexoside-pentoside (peak) and isorhamnetin-O-deoxyhexosyl-hexoside (peak 15) were tentatively identified. Both compounds showed [M–H]− ions at m/z 755 and 623, respectively, with fragment ions at m/z 315, corresponding to the isorhamnetin aglycone [37,57,59,78]. Kaempferol-O-deoxyhexosyl-hexoside (peak 12) was identified with [M–H]− at m/z 593 and a key fragment at m/z 285, corresponding to the kaempferol aglycone. According to studies, PA are phenolic-rich foods, and their leaves present quercetin, caffeic, ferulic, gallic, chlorogenic, and protocatechuic acids; rutin; isorhamnetin; catechin; kaempferol; and some glycosylated derivatives of these compounds [7,8,9,37,79]. In those studies, kaempferol and quercetin were identified in PA using LC-DAD-ESI/MSn [7,11,37].
In the inflorescences of the three Musa acuminata varieties: Dwarf Cavendish (MAD), Platina (MAP), and Conquista (MAC), a total of 22 phenolic compounds were tentatively identified (Figures S4–S6, respectively, Supplementary Materials), mainly belonging to the classes of sucrose phenylpropanoid esters (11 compounds), O-glycosylated flavonoids (8 compounds), and phenolic acids (3 compounds) [80,81]. Among them, sucrose esters derived primarily from p-coumaric acid were predominant [46,80,81]. These compounds exhibited characteristic fragmentation patterns, such as neutral losses of 42 and 162 Da, associated with the cleavage of acetyl groups [81] and the formation of base fragment ions at m/z 307 (sucrose moieties) and m/z 163 (free p-coumaric acid ion) [81]. These dissociation pathways are well-documented in the literature, as discussed by Maier et al. (2015) [82].
In the MAD variety, the main phenolic constituents were three isomers of p-coumaroyl-di-acetyl-sucrose (peaks 3, 5, and 6) [46,81], with peak 6 being the most abundant, followed by the triacetylated isomers peaks 9 and 10. These compounds showed deprotonated molecular ions [M–H]− at m/z 571 or 613, and underwent sequential losses of 42 Da (acetyl group), indicating multiple substitutions on the sucrose core. In the MAP variety, acetylated derivatives of p-coumaroyl-sucrose were also identified, with p-coumaroyl-di-acetyl-sucrose (peak 4) [81] being the most abundant among the phenolic esters. More structurally complex esters, such as tri-, tetra-, and penta-acetylated derivatives (peaks 7 to 10), were also detected. These compounds also exhibited fragmentation profiles involving sequential losses of 42 Da [83]. In the MAC variety, p-coumaroyl-di-acetyl-sucrose (peak 5) was also the predominant constituent, followed by tri- and tetra-acetylated derivatives (peaks 8 to 10).
In addition to the major phenolic esters, O-glycosylated flavonoids such as quercetin-3-O-rutinoside (rutin) and glycosylated derivatives of kaempferol and isorhamnetin were detected [80,81,84,85], especially in the MAP a and MAC varieties, although at lower concentrations. Furthermore, 5-O-caffeoylquinic acid (chlorogenic acid) was identified in the MAC variety (peak 12), along with minor luteolin derivatives [64,80,81]. These findings highlight the potential of banana inflorescences as a rich source of phenolic compounds [57,82,83].
3.3. Bioactivity Measurements
Table 5 presents the bioactivities of the PANCs extracts, including their antioxidant, cytotoxic, and anti-inflammatory properties. The total phenol content determined with the Folin–Ciocalteu reagent varied significantly among the samples (p < 0.05).
Table 5.
Antioxidant, cytotoxic and anti-inflammatory activiy of the different PANCS 1.
Table 5 reveals a significant antioxidant activity of the extracts from the analyzed PANCs, especially Pereskia aculeata (PA), which showed the highest DPPH activity, while Stachys byzantina (SB) stood out in the FRAP assay. These results are in agreement with the literature, which highlights the high antioxidant capacity of PA leaf extract, including activity superior to the Trolox standard in DPPH assays (72.9 ± 3 µg/mL) [77], as well as values of 774 µmol TE/g for aqueous fruit extract [8]. The banana inflorescence also demonstrated relevant activity, supported by the presence of polyphenols and dietary fibers, which, according to Lau et al. (2020) [46], are closely associated with its antioxidant potential. Most samples exceeded values of 2000% in the cellular antioxidant activity (CAA%). Only SB (510.84 ± 20.61%) showed moderate effects against the Caco-2 and AGS cell lines, which may be attributed to its significant phenolic content (48.24 mg GAE/g). XS with 24.15 mg GAE/g [36] is also recognized for containing flavonoids, condensed tannins, and phenolic acids, which contribute to its antioxidant activity. However, the antiproliferative effects of these species still require further investigation for potential pharmaceutical applications. It is known that the values obtained by this method do not necessarily reflect the phenolic content but rather the total reducing compounds in the samples, so they can be considered more of a measure of antioxidant activity. Nevertheless, no significant anti-inflammatory activity was found in the banana inflorescence samples analyzed in the present study.
In Table 6, the potent antimicrobial activity of the extracts SB and PA stands out, showing low MIC values against clinically and food-relevant bacteria such as MRSA, Enterococcus faecalis, and Yersinia enterocolitica. These findings are supported by previous studies that demonstrated the broad-spectrum antimicrobial action of PA against both Gram-positive and Gram-negative strains, including Staphylococcus aureus, Bacillus cereus, E. coli, and P. aeruginosa [7,8]. Such effects are attributed to the presence of a diverse set of phytochemicals with natural antibiotic properties. In the case of XS, the literature also recognizes its ability to inhibit a variety of pathogenic microorganisms, including fungi such as Candida albicans and foodborne bacteria like Salmonella and Staphylococcus [86], which supports its antimicrobial potential. On the other hand, the banana inflorescence extracts (MAD, MAP, and MAC) showed moderate activity (MIC between 5 and 10 mg/mL), consistent with their lower total phenolic contents [87], which limits their effectiveness against more resistant microorganisms.
Table 6.
Antimicrobial activity of the different PANCs 1.
Nevertheless, previous studies reinforce their bioactive potential; for instance, Mostafa (2021) [49] reported MIC values between 5.62 and 31.58 μg/mL against fungal strains, and ethanol extracts of Musa paradisiaca exhibited bactericidal effects against Bacillus cereus (2.14 mg/mL), Staphylococcus aureus (1.49 mg/mL), and Escherichia coli (1.38 mg/mL), whereas aqueous extracts were significantly less effective [88]. Additionally, hydroethanolic extracts of banana inflorescence were successfully used by Schmidt et al. (2016) [89], to preserve the sensory quality of pork burgers and extend shelf stability up to 120 days by reducing lipid oxidation. These findings suggest that SB and PA are promising sources of bioactive compounds with potential for use in natural preservatives and sustainable antimicrobial formulations.
3.4. Innovative Food Applications of Bioactive Compounds from PANCs
Based on the compositional and functional findings obtained in this study, the selected unconventional food plants (PANCs) show significant promise not only as sources of bioactive compounds but also as functional ingredients for innovative food systems. The following discussion explores the documented potential food applications of each species evaluated.
In addition to its nutritional composition and bioactive profile, Pereskia aculeata (PA) demonstrates significant potential for innovative food applications. Several studies support its use as a functional ingredient in a variety of food products. According to Almeida (2012) [90], PA can be incorporated into formulations such as yogurts, cocoa cookies, craft beers, green juices, tapioca, cooked rice, homemade soft drinks, orange jams, and banana-based confections, highlighting its role as an affordable alternative with high nutritional value. Furthermore, its elevated protein content renders it a promising candidate for the development of dietary supplements aimed at physically active individuals. Araújo (2024) [91] emphasized the social relevance of reviving the consumption of PA, particularly in low-income urban and rural communities, where it contributes to addressing iron-deficiency anemia, osteoporosis, and intestinal constipation, in addition to strengthening regional food security. From a technological standpoint, the mucilage present in PA leaves has been recognized for its potential as a natural emulsifier, thickening, and gelling agent in food systems. Porto (2022) [92] described its applicability in the encapsulation of bioactive compounds and the development of functional films and edible packaging. Silva (2023) [19] further highlighted that due to its high levels of protein (23% dry basis), carbohydrates (31%), and soluble fibers, along with the presence of phenolic compounds, carotenoids, and flavonoids, PA represents a strategic raw material for the formulation of novel functional ingredients and health-promoting food products. Complementarily, Ferreira (2024) [93] noted that the dissemination of the nutritional benefits associated with PA not only positively impacts consumer health but also contributes to the valorization of Brazilian biodiversity and the promotion of family farming by integrating this species into emerging sustainable agri-food systems.
Xanthosoma sagittifolium (XS), commonly known as taioba, also stands out as a plant with significant potential for food and industrial applications. According to Santos (2022) [94], the production of freeze-dried powder from XS leaves resulted in an ingredient with a high concentration of bioactive compounds, such as flavonoids, ascorbic acid, and total polyphenols, along with considerable antioxidant activity, indicating its applicability as a source of functional substances for diverse food formulations. The study by Duarte (2024) [42] further highlights that XS leaves and tubers are rich in proteins, vitamins, and minerals, while the tubers exhibit a high starch content, positioning the species as a promising alternative to traditional starch sources at an industrial scale. Moreover, the utilization of this plant contributes to the valorization of Amazonian resources and the reduction in raw material import costs. The potential of XS in ready-to-consume products was also demonstrated by Mendes (2024) [95], who incorporated the plant into mixed juice formulations, resulting in products with suitable physicochemical, microbiological, and sensory characteristics and high consumer acceptance. Additionally, Siqueira (2023) [96] emphasized the importance of XS in combating food insecurity, particularly in tropical regions where its cultivation is traditional and can be expanded to promote nutrient-rich dietary alternatives. Finally, Benevides (2022) [97] showed that the concentration of phenolic compounds in taioba varies depending on the processing method and the plant part used, with fresh leaves presenting the highest antioxidant content, reinforcing its functional value for the development of natural antioxidant foods.
Stachys byzantina (SB) exhibits strong potential as a functional ingredient and natural preservative in food products. Recent studies have demonstrated that its extracts and essential oils possess significant antioxidant and antimicrobial activities, particularly against foodborne pathogens such as Listeria monocytogenes and Staphylococcus aureus, supporting its application in the development of food products with extended shelf life and reduced reliance on synthetic additives [98,99]. The review by Pashova (2024) [100] further underscores the technological potential of the Stachys genus, highlighting its bioactive properties—namely antioxidant, anti-inflammatory, and antimicrobial—and its feasibility for use in dietary supplements and controlled-release systems. Tomou (2020) [63] adds that Stachys species, traditionally employed in folk medicine, present complex phytochemical profiles that support their use in the formulation of health-promoting functional foods. Although the study by Santi (2015) [101] focused on the use of mushrooms as natural antioxidants in meat products, it illustrates the broader trend toward replacing synthetic preservatives with plant-derived compounds, a context in which S. byzantina emerges as a strategic and promising option.
The banana inflorescence (Musa spp.), traditionally regarded as an agricultural by-product, holds significant potential for food and nutraceutical applications due to its high content of bioactive compounds, dietary fibers, and essential micronutrients. Rodrigues (2020) [87] demonstrated that extracts from male banana flowers, rich in phenolics and flavonoids, exhibit strong antioxidant activity and can be employed as natural antioxidants in meat products without compromising their sensory attributes. Furthermore, Padam (2012) [102] highlighted the sustainable potential of banana by-products, including the inflorescence, for use as thickeners, natural colorants, nutritional supplements, and sources of bioactive compounds. Studies conducted by Lau (2020) [46] and Senevirathna (2024) [15] reinforced the relevance of the diverse range of phenolics, flavonoids, saponins, and phytosterols found in banana inflorescences, supporting their incorporation into the development of functional and nutraceutical foods. Panyayong (2022) [18] and Chowdary (2022) [103] reported the culinary use of banana inflorescences in a variety of traditional dishes in Thailand and India—including curries, salads, fried preparations, and pickles—where their antioxidant properties were retained after cooking. Additionally, banana inflorescences have been identified as a promising source of fibers and antioxidants capable of mitigating oxidative stress and modulating key metabolic parameters, as evidenced by Noé Aguilar (2019) [104], Amornlerdpison (2020) [105], Archana Ravindran and Jenny Ann John (2024) [106], and Silva (2024) [107]. The valorization of these by-products contributes to the diversification of food sources and promotes circular economy practices in the agricultural sector. The phytochemical composition and antioxidant potential of banana inflorescence were further detailed by Münir Öztürk (2023) [108], who reported high levels of phenolic compounds, flavonoids, terpenoids, and vitamin C—confirmed in analyses of local banana cultivars. These findings were complemented by Fingolo (2012) [109], who demonstrated high potassium content and dietary fiber concentration in dehydrated inflorescences of Musa acuminata cultivar “ouro”, indicating their value as a nutritional complement.
These applications align with the growing consumer trends towards natural, functional, and sustainable foods, establishing themselves as sustainable alternatives that enhance the value of alternative production chains.
3.5. Linear Discriminant Analysis
A linear discriminant analysis (LDA) was used to classify observations into predefined groups based on a set of predictor variables. In this case, all the analyses performed on the various plants were added to the LDA, which should define the assays that are most relevant to each plant and scatter them in a plot. Figure 1 shows the LDA plot, in which the banana inflorescences (MAD and MAP) are grouped (clustered) together near the origin (0), while the other plants are scattered. Within the inflorescences, MAD and MAP are very close together, meaning a much more similar profile than with MAC, which is farther. The most different plant profile was found for PA, which, on the horizontal plane (Function 1, with the highest variance accounted for), is farthest from the others. Overall, considering the analysis in the model, MAP and MAD show very similar profiles, while MAC, even though being from the same species, is quite different. The banana’s profile is also somewhat related to XS, being very different from SB. The two species that most differ are PA and SB.
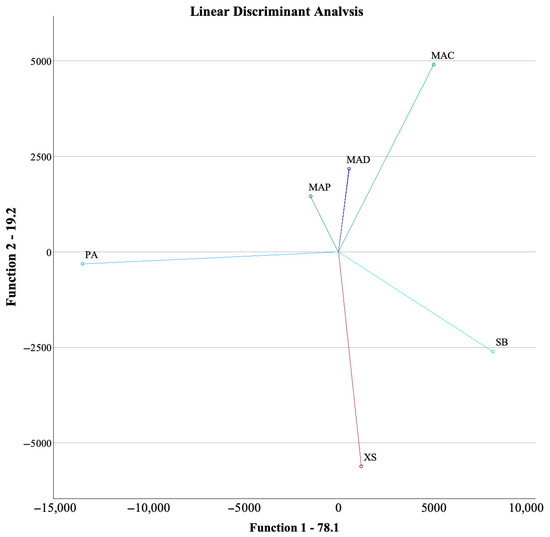
Figure 1.
LDA plot for the different plants. X. sagittifolium (Taioba)—XS; S. byzantina (Peixinho-da-horta)—SB; P. aculeata (Ora-pro-nóbis)—PA; M. acuminata var. Dwarf Cavendish (banana inflorescence)—MAD; M. acuminata var. Platina (banana inflorescence)—MAP; M. acuminata var. Conquista (banana inflorescence)—MAC.
The LDA model accounted for 100% of the variance using four functions, with the first two accounting for 97.3%, being 78.1% for the first function and 19.2% for the second. The third and fourth functions accounted for 2.6 and 0.1%, respectively. Of the 57 analyses included in the LDA, to obtain the discriminant function, the model only included 8, excluding 49, which had the least discriminant capability. The eight assays with the highest discriminant function were C18:3 (fatty acid), Raw264.7 (anti-inflammatory assay); oxalic, citric, and succinic acids (organic acid); AGS (breast tumor assay); total energy (nutritional profile); and C14:0 (fatty acid). Overall, the assays with the best discriminant ability were quite varied, namely three organic acids and two individual fatty acids.
The observed antioxidant and antimicrobial activities are likely related to the presence of multiple phenolic compounds identified in the extracts. In particular, caffeic acid derivatives and phenylethanoid glycosides have been widely reported to contribute to radical scavenging capacity and the inhibition of microbial growth through membrane disruption and enzyme inhibition mechanisms. The high levels of rutin and apigenin detected in Stachys byzantina extracts may also explain the pronounced antioxidant activity observed in the FRAP and CAA assays. Furthermore, C-glycosylated flavones and chlorogenic acid derivatives are known to modulate oxidative stress pathways and may synergistically enhance the overall bioactivity of the samples. These considerations suggest that the phytochemical composition directly contributes to the functional properties demonstrated in this study.
While this work provided a detailed comparative assessment of compositional and bioactive characteristics, it is important to acknowledge that a comprehensive elucidation of all the biochemical mechanisms and ecological factors underlying these differences was beyond the scope of this study. Future research should aim to explore these aspects in greater depth to strengthen the interpretation of consistency and divergence among studies.
4. Conclusions
The potential of unconventional food plants (UFPs) as alternative sources of nutrients and bioactive compounds is underscored by the findings of this study. The analyses revealed substantial differences in centesimal composition, with Xanthosoma sagittifolium and Stachys byzantine exhibiting high protein content, and Musa acuminata var. Conquista being distinguished by its high fiber content. The presence of flavonoids and phenolic acids with pertinent antioxidant and anti-inflammatory properties was indicated by the analysis of fatty acids and phenolic compounds. This approach reinforces the nutritional and functional value of UFPs for applications in the food and pharmaceutical industries, thereby promoting the valorization of these constituents in the development of sustainable and innovative products. A linear discriminant analysis (LDA) was conducted to classify the samples based on their chemical and bioactive profiles. The results revealed that Musa Acuminata var. Platina (MAP) and Musa Acuminata var. Dwarf Cavendish (MAD) exhibited very similar profiles, whereas Musa Acuminata var. Conquista (MAC), despite being from the same species, was markedly different. The banana inflorescences shared some similarities with Xanthosoma sagittifolium but were significantly different from Stachys byzantina. The two most distinct species were Pereskia aculeata (PA) and Stachys byzantine (SB). The LDA model highlighted that the most relevant assays for differentiation included three organic acids and two individual fatty acids, demonstrating their importance in distinguishing the species. The development of food from sustainable sources is one strategy to meet new consumption trends and fulfill the population’s nutritional demands. The potential to expand the food chain with minimal environmental impact is high in the pursuit of unconventional plant-based food sources. This study focused on gathering information on UFPs with potential applications in food products. Additionally, UFPs contain significant quantities of bioactive compounds that contribute to health benefits. Their incorporation into food formulations can provide nutritional, sensory, and textural advantages, meeting market demands, particularly among vegan and vegetarian consumers. Additionally, while this work provided a comprehensive comparative analysis of the nutritional composition, phenolic profiles, and bioactive properties of the studied UFPs, it did not aim to elucidate the underlying molecular mechanisms responsible for the observed antioxidant, antimicrobial, and cytotoxic effects. Future research should prioritize in-depth mechanistic studies—such as transcriptomic and proteomic analyses, enzyme inhibition assays, and in vivo models—to clarify the specific biochemical pathways involved in these activities. Moreover, targeted investigations into the optimization of extraction techniques, sensory profiling, safety evaluation, and strategies for the integration of UFP-derived ingredients into food matrices will be critical to advance their industrial application and consumer acceptance.
Supplementary Materials
The following supporting information can be downloaded at: https://www.mdpi.com/article/10.3390/su17156718/s1, Figure S1: Phenolic profile of Xanthosoma sagittifolium (L.) Schott (Araceae) (XS) leaf extract recorded at 330 nm. Non-anthocyanic phenolic compounds: 1—Luteolin-di-C-hexoside; 2—Apigenin-di-C-hexoside; 3—Apigenin-di-C-hexoside; 4—Luteolin-C-hexoside-C-pentoside; 5—Apigenin-C-hexoside-C-(acetyl)pentoside; 6—Apigenin-C-hexoside-C-pentoside; 7—Apigenin-C-hexoside-C-pentoside; 8—Quercetin-O-dideoxyhexosyl-hexoside; 9—Apigenin-C-hexoside-C-pentoside; 10—Apigenin-C-deoxyhexoside-C-glucoside; 11—Apigenin-C-deoxyhexoside-C-glucoside; 12—Apigenin-6-C-glucoside; 13 and 14—Apigenin-C-(ρ-coumaroyl)-hexoside-C-pentoside; 15—Apigenin-C-(feruloyl)-hexoside-C-pentoside; 16—Apigenin-C-(shikimic acid)-hexoside-C-pentoside; 18—Apigenin-C-(ρ-coumaroyl)-hexoside-C-pentoside; 19—Isorhamnetin-O-deoxyhexosyl-hexoside; 20—Trihydroxy-dimethoxyflavone- deoxyhexosyl-hexoside-deoxyhexoside; 21—Diosmetin-O-deoxyhexosyl-hexoside. Figure S2: Phenolic profile of Stachys byzantina K. Koch (Lamiaceae) (SB) leaf extract recorded at 330 nm. Non-anthocyanic phenolic compounds: 1—5-O-Caffeoylquinic acid; 2—β-Hydroxyverbascoside I; 3—β-Hydroxyisoverbascoside II; 4—2’-O-Arabinosyl verbascoside; 5—Verbascoside; 6—Verbascoside derivative; 7—Verbascoside isomer II; 8—Verbascoside isomer III; 9—Leonoside A or Allysonoside; 10—Malonyl-verbascoside; 11—Luteolin-O-acetyl-dihexoside; 12—Hypolaetin -O-acetyl-allosyl-hexoside; 13—Eukovoside; 14—Luteolin-O-acetyl-hexosyl-glucoronide; 15—Hypolaetin -O-acetyl-allosyl-hexoside. Figure S3: Phenolic profile of Pereskia aculeata Miller (Cactaceae) (PA) leaf extract recorded at 330 nm. Non-anthocyanic phenolic compounds: 1—Protocatechuic acid pentoside; 2—p-Coumaric acid-pentoside-hexoside; 3—Sinapic acid hexoside; 4—p-Coumaroyl hexaric acid; 5—Quercetin-O-pentoside-O-deoxyhexosyl-hexoside; 6 and 7—Quercetin-O-hexosyl-pentoside; 8—Quercetin-O-deoxyhexosyl-hexoside; 9—Quercetin-3-O-rutinoside (rutin); 10—Isorhamnetin-O-deoxyhexoside-hexoside-pentoside; 11—Kaempferol-O-hexoside-pentoside; 12—Kaempferol-O-deoxyhexosyl-hexoside; 13—Isorhamnetin-O-hexoside-pentoside; 14—Kaempferol-3-O-rutinoside; 15 and 16—Isorhamnetin-O-deoxyhexosyl-hexoside. Figure S4: Phenolic profile of Musa acuminata (Musaceae) var. Dwarf Cavendish (MAD) banana inflorescence recorded at 330 nm. Non-anthocyanic phenolic compounds: 1— p-Coumaric acid dihexoside; 2—p-Coumaroyl-acetyl-sucrose; 3—p-Coumaroyl-di-acetyl-sucrose isómer; 4—Quercetin-O-deoxyhexosyl-deoxyhexosyl-hexoside; 5 and 6—p-Coumaroyl-di-acetyl-sucrose isómer; 7—Quercetin-3-O-rutinoside (rutin); 8, 9 and 10—p-Coumaroyl-tri-acetyl-sucrose isómer; 11 and 12—p-Coumaroyl-tetra-acetyl-sucrose isómer; 13—p-Coumaroyl-penta-acetyl-sucrose isómer. Figure S5: Phenolic profile of Musa acuminata (Musaceae) var. BRS Platina (MAP) banana inflorescence recorded at 330 nm. Non-anthocyanic phenolic compounds 1—p-Coumaric acid dihexoside; 2—Luteolin derivative; 3—Quercetin-O-deoxyhexosyl-deoxyhexosyl-hexoside; 4—p-Coumaroyl-di-acetyl-sucrose isómer; 5—Quercetin-3-O-rutinoside (rutin); 6—Kaempferol-3-O-rutinoside; 7—p-Coumaroyl-tri-acetyl-sucrose; 8 and 9—p-Coumaroyl-tetra-acetyl-sucrose; 10—p-Coumaroyl-penta-acetyl-sucrose isómer. Figure S6: Phenolic profile of Musa acuminata (Musaceae) var. BRS Conquista (MAC) banana inflorescence recorded at 330 nm. Non-anthocyanic phenolic compounds: 1—p-Coumaric acid dihexoside; 2—Luteolin derivative; 3—5-O-Caffeoylquinic acid; 4—Quercetin-O-deoxyhexosyl-deoxyhexosyl-hexoside; 5—p-Coumaroyl-di-acetyl-sucrose; 6—Quercetin-3-O-rutinoside (rutin); 7—Kaempferol-3-O-rutinoside; 8—p-Coumaroyl-tri-acetyl-sucrose; 9 and 10—p-Coumaroyl-tetra-acetyl-sucrose; 11—p-Coumaroyl-penta-acetyl-sucrose; 12—p-Coumaroyl-penta-acetyl-sucrose isómer.
Author Contributions
Investigation and writing—original draft preparation: I.d.O. and J.K.L.; formal analysis J.M.R.T.S., R.C.C. and M.C.; conceptualization T.F.F.d.S. and V.A.d.S.G.; writing—review and editing C.S.-B., L.B., S.A.H. and M.C.; supervision, C.S.-B., L.B. and S.A.H.; project administration, L.B. and S.A.H. All authors have read and agreed to the published version of the manuscript.
Funding
This research was funded by national funds through FCT/MCTES (PIDDAC): CIMO, UIDB/00690/2020 (https://doi.org/10.54499/UIDB/00690/2020) and UIDP/00690/2020 (https://doi.org/10.54499/UIDP/00690/2020) and SusTEC, LA/P/0007/2020 (https://doi.org/10.54499/LA/P/0007/2020), National funding by FCT- Foundation for Science and Technology, through the institutional and individual scientific employment program-contract for Sandrina A. Heleno, Lillian Barros (DOI: 10.54499/CEECINST/00107/2021/CP2793/CT0002); and the contract of Márcio Carocho (CEEC-IND/00831/2018); through the individual research grant of Izamara de Oliveira BD/06017/2020 (https://doi.org/10.54499/2020.06017.BD). Vitor Augusto dos Santos Garcia and Giuseppina Pace Pereira Lima would like to acknowledge the São Paulo Research Foundation (FAPESP, Process number: 2023/06134-0) for providing financial support. The GIP-USAL is financially supported by Consejería de Educación-Junta de Castilla y León (Spain) through the Grant SA093P20.
Institutional Review Board Statement
Not applicable.
Informed Consent Statement
Not applicable.
Data Availability Statement
Data is contained within the article or Supplementary Materials.
Conflicts of Interest
The authors declare that they have no conflict of interest..
References
- Duarte-Casar, R.; González-Jaramillo, N.; Bailon-Moscoso, N.; Rojas-Le-Fort, M.; Romero-Benavides, J.C. Five Underutilized Ecuadorian Fruits and Their Bioactive Potential as Functional Foods and in Metabolic Syndrome: A Review. Molecules 2024, 29, 2904. [Google Scholar] [CrossRef]
- Leal, M.L.; Alves, R.P.; Hanazaki, N. Knowledge, Use, and Disuse of Unconventional Food Plants. J. Ethnobiol. Ethnomed. 2018, 14, 6. [Google Scholar] [CrossRef]
- Moura, I.O.; Santana, C.C.; Lourenço, Y.R.F.; Souza, M.F.; Silva, A.R.S.T.; Dolabella, S.S.; de Oliveira e Silva, A.M.; Oliveira, T.B.; Duarte, M.C.; Faraoni, A.S. Chemical Characterization, Antioxidant Activity and Cytotoxicity of the Unconventional Food Plants: Sweet Potato (Ipomoea batatas (L.) Lam.) Leaf, Major Gomes (Talinum paniculatum (Jacq.) Gaertn.) and Caruru (Amaranthus deflexus L.). Waste Biomass Valorization 2021, 12, 2407–2431. [Google Scholar] [CrossRef]
- Milião, G.L.; de Oliveira, A.P.H.; Soares, L.d.S.; Arruda, T.R.; Vieira, É.N.R.; Leite Junior, B.R.d.C. Unconventional Food Plants: Nutritional Aspects and Perspectives for Industrial Applications. Future Foods 2022, 5, 100124. [Google Scholar] [CrossRef]
- Torres-Fuentes, C.; Suárez, M.; Aragonès, G.; Mulero, M.; Ávila-Román, J.; Arola-Arnal, A.; Salvadó, M.J.; Arola, L.; Bravo, F.I.; Muguerza, B. Cardioprotective Properties of Phenolic Compounds: A Role for Biological Rhythms. Mol. Nutr. Food Res. 2022, 66, e2100990. [Google Scholar] [CrossRef]
- de Castro Campos Pinto, N.; Scio, E. The Biological Activities and Chemical Composition of Pereskia Species (Cactaceae)—A Review. Plant Foods Hum. Nutr. 2014, 69, 189–195. [Google Scholar] [CrossRef]
- Garcia, J.A.A.; Corrêa, R.C.G.; Barros, L.; Pereira, C.; Abreu, R.M.V.; Alves, M.J.; Calhelha, R.C.; Bracht, A.; Peralta, R.M.; Ferreira, I.C.F.R. Phytochemical Profile and Biological Activities of “Ora-pro-Nobis” Leaves (Pereskia aculeata Miller), an Underexploited Superfood from the Brazilian Atlantic Forest. Food Chem. 2019, 294, 302–308. [Google Scholar] [CrossRef]
- Souza, L.; Caputo, L.; Inchausti De Barros, I.; Fratianni, F.; Nazzaro, F.; De Feo, V. Pereskia aculeata Muller (Cactaceae) Leaves: Chemical Composition and Biological Activities. Int. J. Mol. Sci. 2016, 17, 1478. [Google Scholar] [CrossRef]
- Pinto, N.d.C.C.; Machado, D.C.; da Silva, J.M.; Conegundes, J.L.M.; Gualberto, A.C.M.; Gameiro, J.; Moreira Chedier, L.; Castañon, M.C.M.N.; Scio, E. Pereskia aculeata Miller Leaves Present In Vivo Topical Anti-Inflammatory Activity in Models of Acute and Chronic Dermatitis. J. Ethnopharmacol. 2015, 173, 330–337. [Google Scholar] [CrossRef]
- Mazon, S.; Menin, D.; Cella, B.M.; Lise, C.C.; Vargas, T.d.O.; Daltoé, M.L.M. Exploring Consumers’ Knowledge and Perceptions of Unconventional Food Plants: Case Study of Addition of Pereskia aculeata Miller to Ice Cream. Food Sci. Technol. 2020, 40, 215–221. [Google Scholar] [CrossRef]
- Ferreira, C.P.; de Lima, M.d.C.; da Silva, J.G.; Peixoto Araujo, N.M. Nutritional Composition, Phenolic Compounds and Biological Activities of Selected Unconventional Food Plants. Food Res. Int. 2024, 191, 114643. [Google Scholar] [CrossRef]
- Araújo, S.d.S.; Giunco, A.J.; Argandoña, J.S.; Bromatology, S.M.S.E. Food Chemistry and Antioxidant Activity of Xanthosoma sagittifolium (L.) Schott. Emir. J. Food Agric. 2019, 31, 188. [Google Scholar] [CrossRef]
- da Silva, C.F.B.; Cardoso, F.A.R.; Casarin, P.; Droval, A.A.; Fuchs, R.H.B.; Marques, L.L.M. In Vitro Evaluation of Goldfish (Stachys byzantina K. Koch) Extracts Obtained Using Natural Deep Eutectic Solvents (NADES). Ind. Crops Prod. 2024, 208, 117851. [Google Scholar] [CrossRef]
- Lima, J.A.d.S.; Leite, V.C.; Silva, J.P.; Ferrarez, M.A.; Bahia, G.D.; Rezende, L.V.N.; Guedes, M.C.M.R.; Macedo, G.C.; Silva, N.P.d.; Tavares, G.D.; et al. Stachys Byzantina K. Koch in the Treatment of Skin Inflammation: A Comprehensive Evaluation of its Therapeutic Properties. ACS Omega 2024, 9, 49899–49912. [Google Scholar] [CrossRef] [PubMed]
- Senevirathna, N.; Karim, A. Banana Inflorescence as a New Source of Bioactive and Pharmacological Ingredients for Food Industry. Food Chem. Adv. 2024, 5, 100814. [Google Scholar] [CrossRef]
- Muchahary, S.; Nickhil, C.; Deka, S.C. An Artificial Intelligence Approach for Modeling Nachos Developed from Bhimkol Banana (Musa Balbisiana) Blossom. J. Food Process Eng. 2023, 46, e14227. [Google Scholar] [CrossRef]
- Choudhury, N.; Nickhil, C.; Deka, S.C. Comprehensive Review on the Nutritional and Therapeutic Value of Banana By-Products and Their Applications in Food and Non-Food Sectors. Food Biosci. 2023, 56, 103416. [Google Scholar] [CrossRef]
- Panyayong, C.; Srikaeo, K. Foods from Banana Inflorescences and Their Antioxidant Properties: An Exploratory Case in Thailand. Int. J. Gastron. Food Sci. 2022, 28, 100436. [Google Scholar] [CrossRef]
- Nogueira Silva, N.; Silva, S.; Baron, D.; Oliveira Neves, I.; Casanova, F. Pereskia aculeata Miller as a Novel Food Source: A Review. Foods 2023, 12, 2092. [Google Scholar] [CrossRef]
- Boakye, A.A.; Wireko-Manu, F.D.; Oduro, I.; Ellis, W.O.; Gudjónsdóttir, M.; Chronakis, I.S. Utilizing Cocoyam (Xanthosoma Sagittifolium) for Food and Nutrition Security: A Review. Food Sci. Nutr. 2018, 6, 703–713. [Google Scholar] [CrossRef]
- de Oliveira, I.; da Silveira, T.F.F.; dos Santos Garcia, V.A.; Veiga-Santos, P.; Lima, G.P.P.; Lima, L.A.; Santos-Buelga, C.; Barros, L.; Heleno, S.A.; Carocho, M. Development of Bioactive Edible Coatings Enriched with Extracts of Celery and Banana Inflorescence for the Preservation of Persimmons. Food Res. Int. 2025, 213, 116608. [Google Scholar] [CrossRef] [PubMed]
- Rossi, P.H.S. de Stachys byzantina: Nutritional Value, Culinary Potential, and Sustainability of an Unconventional Food Plant. Asian J. Biotechnol. Bioresour. Technol. 2024, 10, 60–64. [Google Scholar] [CrossRef]
- Babaei Rad, S.; Mumivand, H.; Mollaei, S.; Khadivi, A. Effect of Drying Methods on Phenolic Compounds and Antioxidant Activity of Capparis spinosa L. Fruits. BMC Plant Biol. 2025, 25, 133. [Google Scholar] [CrossRef] [PubMed]
- Dhakal, S.; Pandey, D.; van der Heide, M.E.; Nørgaard, J.V.; Vrhovsek, U.; Khanal, P. Effect of Different Drying Methods on the Nutritional Composition and Phenolic Compounds of the Brown Macroalga, Fucus vesiculosus (Fucales, Phaeophyceae). J. Appl. Phycol. 2024, 36, 3649–3663. [Google Scholar] [CrossRef]
- Jordan, R.A.; Sanjinez-Argandoña, E.J.; Ferreira, O.M.; Quequeto, W.D.; Siqueira, V.C.; Mendoza, V.d.S.; Flozino, G.K.M.; Sanches, Í.S.; Sanches, É.S.; Antunes, B.M. Efeito de Sistemas e Condições de Secagem Sobre o Consumo Específico de Energia e os Compostos Bioativos da Taioba (Xanthosoma sagittifolium Schott). Res. Soc. Dev. 2021, 10, e21610716512. [Google Scholar] [CrossRef]
- AOAC International. Official Methods of Analysis of AOAC International, 20th ed.; AOAC International: Rockville, MD, USA, 2016; ISBN 978-0-935584-87-5. [Google Scholar]
- Yao, S.; LiBrizzi, B.R.; Chen, H. Heating Temperature and Water Activity of Alfalfa Seeds Affect Thermal Inactivation of Salmonella and Maintaining Seed Viability. Int. J. Food Microbiol. 2023, 384, 109975. [Google Scholar] [CrossRef]
- Sadler, G.D.; Murphy, P.A. PH and Titratable Acidity. In Food Analysis; Springer: Berlin, Germany, 2010; pp. 219–238. [Google Scholar]
- Albuquerque, B.R.; Finimundy, T.C.; Pinela, J.; Pires, T.C.S.P.; Mandim, F.; Vaz, J.; Corrêa, R.C.G.; Oliveira, M.B.P.P.; Barros, L. Brazilian Berry Waste as a Source of Bioactive Compounds: Grumixama (Eugenia brasiliensis Lam.) as a Case Study. Food Funct. 2023, 14, 3994–4005. [Google Scholar] [CrossRef]
- de Oliveira, I.; Chrysargyris, A.; Heleno, S.A.; Carocho, M.; Calhelha, R.C.; Dias, M.I.; Petrović, J.; Soković, M.; Petropoulos, S.A.; Santos-Buelga, C.; et al. Effects of the Extraction Techniques on the Chemical Composition and Bioactive Properties of Lemon Balm (Melissa officinalis L.) Plants Grown under Different Cropping and Irrigation Regimes. Food Res. Int. 2023, 170, 113044. [Google Scholar] [CrossRef]
- de Oliveira, I.; Chrysargyris, A.; Finimundy, T.C.; Carocho, M.; Santos-Buelga, C.; Calhelha, R.C.; Tzortzakis, N.; Barros, L.; Heleno, S.A. The Influence of Magnesium and Manganese Cations on the Chemical and Bioactive Properties of Purple and Green Basil. Food Funct. 2024, 15, 10644–10662. [Google Scholar] [CrossRef]
- Ciríaco, A.C.d.A.; Mendes, R.d.M.; Carvalho, V.S. Antioxidant Activity and Bioactive Compounds in Ora-pro-Nóbis Flour (Pereskia aculeata Miller). Braz. J. Food Technol. 2023, 26, e2022054. [Google Scholar] [CrossRef]
- Singleton, V.L.; Rossi, J.A. Colorimetry of Total Phenolics with Phosphomolybdic-Phosphotungstic Acid Reagents. Am. J. Enol. Vitic. 1965, 16, 144–158. [Google Scholar] [CrossRef]
- Benzie, I.F.F.; Strain, J.J. The Ferric Reducing Ability of Plasma (FRAP) as a Measure of “Antioxidant Power”: The FRAP Assay. Anal. Biochem. 1996, 239, 70–76. [Google Scholar] [CrossRef]
- Takeiti, C.Y.; Antonio, G.C.; Motta, E.M.P.; Collares-Queiroz, F.P.; Park, K.J. Nutritive Evaluation of a Non-Conventional Leafy Vegetable (Pereskia Aculeata Miller). Int. J. Food Sci. Nutr. 2009, 60, 148–160. [Google Scholar] [CrossRef]
- Fernandes Serra Moura, H.; de Souza Dias, F.; Beatriz Souza e Souza, L.; Magalhães, B.E.A.d.; de Aragão Tannus, C.; Correia de Carvalho, W.; Cardoso Brandão, G.; dos Santos, W.N.L.; Graças Andrade Korn, M.; Cristina Muniz Batista dos Santos, D.; et al. Evaluation of Multielement/Proximate Composition and Bioactive Phenolics Contents of Unconventional Edible Plants from Brazil Using Multivariate Analysis Techniques. Food Chem. 2021, 363, 129995. [Google Scholar] [CrossRef] [PubMed]
- Cruz, T.M.; Santos, J.S.; do Carmo, M.A.V.; Hellström, J.; Pihlava, J.-M.; Azevedo, L.; Granato, D.; Marques, M.B. Extraction Optimization of Bioactive Compounds from Ora-pro-Nobis (Pereskia aculeata Miller) Leaves and Their In Vitro Antioxidant and Antihemolytic Activities. Food Chem. 2021, 361, 130078. [Google Scholar] [CrossRef] [PubMed]
- Teixeira da Silva, G. Caracterização Fisico-Quimica, Digestibilidade de Compostos Bioativos e Análise Fitoquímica das Folhas do Peixinho da Horta (Stachys byzantina K. Koch); Universidade Federal do Paraná: Curitiba, Brazil, 2022. [Google Scholar]
- Botrel, N.; Freitas, S.; Fonseca, M.J.d.O.; Melo, R.A.d.C.e.; Madeira, N. Valor Nutricional de Hortaliças Folhosas Não Convencionais Cultivadas no Bioma Cerrado. Braz. J. Food Technol. 2020, 23, e2018174. [Google Scholar] [CrossRef]
- Bahadori, M.B.; Kirkan, B.; Sarikurkcu, C. Phenolic Ingredients and Therapeutic Potential of Stachys cretica Subsp. Smyrnaea for the Management of Oxidative Stress, Alzheimer’s Disease, Hyperglycemia, and Melasma. Ind. Crops Prod. 2019, 127, 82–87. [Google Scholar] [CrossRef]
- Miranda, C.T.C.d.S.; Soares, S.D.; de Oliveira, W.Q.; Lima, A.d.S.; Neri Numa, I.A.; Pastore, G.M. Unconventional Edible Plants of the Amazon: Bioactive Compounds, Health Benefits, Challenges, and Future Trends. Foods 2024, 13, 2925. [Google Scholar] [CrossRef]
- de Paula de Almeida Duarte, S.; Teixeira-Costa, B.E.; do Rosário, R.C.; Amante, E.R.; Pires, M.B.; dos Santos, O.V. Valorization of Taioba Products and By-Products: Focusing on Starch. Foods 2024, 13, 2415. [Google Scholar] [CrossRef]
- Fioroto, A.M.; Toniazzo, T.; Giuntini, E.B.; Oliveira, P.V.; Purgatto, E. Mineral Nutrients and Protein Composition of Non-Conventional Food Plants (Pereskia aculeata Miller, Sonchus Oleraceus L. and Xanthosoma sagittifolium (L.) Schott). J. Food Compos. Anal. 2024, 136, 106825. [Google Scholar] [CrossRef]
- Khalid, W.; Arshad, M.S.; Jabeen, A.; Muhammad Anjum, F.; Qaisrani, T.B.; Suleria, H.A.R. Fiber-enriched Botanicals: A Therapeutic Tool against Certain Metabolic Ailments. Food Sci. Nutr. 2022, 10, 3203–3218. [Google Scholar] [CrossRef]
- Aiemcharoen, P.; Wichienchot, S.; Sermwittayawong, D. Antioxidant and Anti-Diabetic Activities of Crude Ethanolic Extract from the Banana Inflorescence of Musa (ABB Group) Namwa Maliong. Funct. Foods Health Dis. 2022, 12, 161. [Google Scholar] [CrossRef]
- Lau, B.F.; Kong, K.W.; Leong, K.H.; Sun, J.; He, X.; Wang, Z.; Mustafa, M.R.; Ling, T.C.; Ismail, A. Banana Inflorescence: Its Bio-Prospects as an Ingredient for Functional Foods. Trends Food Sci. Technol. 2020, 97, 14–28. [Google Scholar] [CrossRef]
- da Cruz Alves, T.; Kinupp, V.F.; de Mendonça, B.A.F.; Breier, T.B. Non-Conventional Food Plants (Plantas alimentícias Não Convencionais (PANC)) of the Petrópolis–Teresópolis Crossing, Serra Dos Órgãos National Park, Rio de Janeiro, Brazil. Wild 2024, 1, 17–29. [Google Scholar] [CrossRef]
- Pereira, J.; Brohi, S.A.; Malairaj, S.; Zhang, W.; Zhou, G.H. Quality of Fat-Reduced Frankfurter Formulated with Unripe Banana by-Products and Pre-Emulsified Sunflower Oil. Int. J. Food Prop. 2020, 23, 420–433. [Google Scholar] [CrossRef]
- Mostafa, H.S. Banana Plant as a Source of Valuable Antimicrobial Compounds and its Current Applications in the Food Sector. J. Food Sci. 2021, 86, 3778–3797. [Google Scholar] [CrossRef]
- Krishnan, A.; Deepakraj, G.; Nishanth, N.; Anandkumar, K.M. Autonomous Walking Stick for the Blind Using Echolocation and Image Processing. In Proceedings of the 2016 2nd International Conference on Contemporary Computing and Informatics (IC3I), Noida, India, 14–17 December 2016; IEEE: New York, NY, USA, 2016; pp. 13–16. [Google Scholar]
- Pérez, E.E.; Gutiérrez, M.E.; De Delahaye, E.P.; Tovar, J.; Lares, M. Production and Characterization of Xanthosoma sagittifolium and Colocasia esculenta Flours. J. Food Sci. 2007, 72, S367–S372. [Google Scholar] [CrossRef]
- Ramu, R.; Shirahatti, P.; Anilakumar, K.; Nayakavadi, S.; Zameer, F.; Dhananjaya, B.; Nagendra Prasad, M. Assessment of Nutritional Quality and Global Antioxidant Response of Banana (Musa Sp. CV. Nanjangud Rasa Bale) Pseudostem and Flower. Pharmacogn. Res. 2017, 9, 74. [Google Scholar] [CrossRef] [PubMed]
- Swe, K.N.N. Study on Phytochemicals and Nutritional Composition of Banana Flowers of Two Cultivars (Phee Kyan and Thee Hmwe). Univ. Res. J. 2012, 5, 1–7. [Google Scholar]
- Borges-Machado, A.L.; Neves-Martins, M.J.; Ribeiro-Sanches, M.A.; Pereira, L.S.; dos Santos, P.A.; Telis-Romero, J. Desorption Properties of Taioba (Xanthosoma taioba E.G. Gonç.) Leaves: A Non-Conventional Edible Plant. Food Biosci. 2024, 59, 104093. [Google Scholar] [CrossRef]
- Sheng, Z.; Dai, H.; Pan, S.; Ai, B.; Zheng, L.; Zheng, X.; Prinyawiwatkul, W.; Xu, Z. Phytosterols in Banana (Musa spp.) Flower Inhibit A-glucosidase and A-amylase Hydrolysations and Glycation Reaction. Int. J. Food Sci. Technol. 2017, 52, 171–179. [Google Scholar] [CrossRef]
- Ramírez-Bolaños, S.; Pérez-Jiménez, J.; Díaz, S.; Robaina, L. A Potential of Banana Flower and Pseudo-Stem as Novel Ingredients Rich in Phenolic Compounds. Int. J. Food Sci. Technol. 2021, 56, 5601–5608. [Google Scholar] [CrossRef]
- de Rijke, E.; Out, P.; Niessen, W.M.A.; Ariese, F.; Gooijer, C.; Brinkman, U.A.T. Analytical Separation and Detection Methods for Flavonoids. J. Chromatogr. A 2006, 1112, 31–63. [Google Scholar] [CrossRef]
- Picerno, P.; Mencherini, T.; Lauro, M.R.; Barbato, F.; Aquino, R. Phenolic Constituents and Antioxidant Properties of Xanthosoma Violaceum Leaves. J. Agric. Food Chem. 2003, 51, 6423–6428. [Google Scholar] [CrossRef]
- Vukics, V.; Guttman, A. Structural Characterization of Flavonoid Glycosides by Multi-stage Mass Spectrometry. Mass. Spectrom. Rev. 2010, 29, 1–16. [Google Scholar] [CrossRef]
- Ferreres, F.; Gil-Izquierdo, A.; Andrade, P.B.; Valentão, P.; Tomás-Barberán, F.A. Characterization of C-Glycosyl Flavones O-Glycosylated by Liquid Chromatography–Tandem Mass Spectrometry. J. Chromatogr. A 2007, 1161, 214–223. [Google Scholar] [CrossRef]
- Ntengna, Y.F.; Tchameni, N.S.; Fokom, R.; Sameza, M.L.; Minyaka, E.; Ngonkeu, M.E.L.; Wakam, N.L.; Wakam Etoa, F.X. Effects of Arbuscular Mycorrhiza Fungi on Stimulation of Nutrient Content and Induction of Biochemical Defense Response in Xanthosoma sagittifolium Plants against Root Rot Disease Caused by Pythium Myriotylum. IJAAR 2019, 7, 98–107. [Google Scholar] [CrossRef]
- Xue, Z.; Yang, B. Phenylethanoid Glycosides: Research Advances in Their Phytochemistry, Pharmacological Activity and Pharmacokinetics. Molecules 2016, 21, 991. [Google Scholar] [CrossRef] [PubMed]
- Tomou, E.-M.; Barda, C.; Skaltsa, H. Genus Stachys: A Review of Traditional Uses, Phytochemistry and Bioactivity. Medicines 2020, 7, 63. [Google Scholar] [CrossRef] [PubMed]
- Alcázar Magaña, A.; Kamimura, N.; Soumyanath, A.; Stevens, J.F.; Maier, C.S. Caffeoylquinic Acids: Chemistry, Biosynthesis, Occurrence, Analytical Challenges, and Bioactivity. Plant J. 2021, 107, 1299–1319. [Google Scholar] [CrossRef]
- Kirkan, B. Antioxidant Potential, Enzyme Inhibition Activity, and Phenolic Profile of Extracts from Stachys cretica Subsp. Vacillans. Ind. Crops Prod. 2019, 140, 111639. [Google Scholar] [CrossRef]
- El-Ansari, M.A.; Nawwar, M.A.; Saleh, N.A.M. Stachysetin, a Diapigenin-7-Glucoside-p,p’-Dihydroxy-Truxinate from Stachys Aegyptiaca. Phytochemistry 1995, 40, 1543–1548. [Google Scholar] [CrossRef]
- Mróz, M.; Malinowska-Pańczyk, E.; Bartoszek, A.; Kusznierewicz, B. Comparative Study on Assisted Solvent Extraction Techniques for the Extraction of Biologically Active Compounds from Sideritis Raeseri and Sideritis Scardica. Molecules 2023, 28, 4207. [Google Scholar] [CrossRef] [PubMed]
- Asnaashari, S.; Delazar, A.; Alipour, S.; Nahar, L.; Williams, A.; Pasdaran, A.; Mojarab, M.; Azad, F.; Sarker, S.D. Chemical Composition, Free-Radical-Scavenging and Insecticidal Activities of the Aerial Parts of Stachys byzantina. Arch. Biol. Sci. 2010, 62, 653–662. [Google Scholar] [CrossRef]
- Andary, C.; Ibrahim, R.K. Biosynthetic Capacity of Stachys Seedlings for Verbascoside and Related Caffeoyl Derivatives. Z. Für Naturforschung C 1986, 41, 18–21. [Google Scholar] [CrossRef]
- Karioti, A.; Bolognesi, L.; Vincieri, F.F.; Bilia, A.R. Analysis of the Constituents of Aqueous Preparations of Stachys Recta by HPLC–DAD and HPLC–ESI-MS. J. Pharm. Biomed. Anal. 2010, 53, 15–23. [Google Scholar] [CrossRef]
- Sarikurkcu, C.; Ceylan, O.; Benabdallah, A.; Tepe, B. Stachys germanica Subsp. Heldreichii (Boiss.) Hayek: Phytochemical Analysis, Antioxidant and Enzyme Inhibitory Activities. South. Afr. J. Bot. 2021, 143, 291–300. [Google Scholar] [CrossRef]
- Elfalleh, W.; Kirkan, B.; Sarikurkcu, C. Antioxidant Potential and Phenolic Composition of Extracts from Stachys Tmolea: An Endemic Plant from Turkey. Ind. Crops Prod. 2019, 127, 212–216. [Google Scholar] [CrossRef]
- Axiotis, E.; Petrakis, E.A.; Halabalaki, M.; Mitakou, S. Phytochemical Profile and Biological Activity of Endemic Sideritis sipylea Boiss. in North Aegean Greek Islands. Molecules 2020, 25, 2022. [Google Scholar] [CrossRef]
- Dimaki, V.D.; Zeliou, K.; Nakka, F.; Stavreli, M.; Bakratsas, I.; Papaioannou, L.; Iatrou, G.; Lamari, F.N. Characterization of Sideritis Clandestina Subsp. Peloponnesiaca Polar Glycosides and Phytochemical Comparison to Other Mountain Tea Populations. Molecules 2022, 27, 7613. [Google Scholar] [CrossRef]
- de Souza, A.H.; Mendonça, H.d.O.P.; de Paula, A.C.C.F.F.; Augusti, R.; Fante, C.A.; Melo, J.O.F.; Carlos, L. de A. Influence of Harvest Time on the Chemical Profile of Pereskia aculeate Mill. Using Paper Spray Mass Spectrometry. Molecules 2022, 27, 4276. [Google Scholar] [CrossRef] [PubMed]
- Cabañas-García, E.; Areche, C.; Jáuregui-Rincón, J.; Cruz-Sosa, F.; Pérez-Molphe Balch, E. Phytochemical Profiling of Coryphantha macromeris (Cactaceae) Growing in Greenhouse Conditions Using Ultra-High-Performance Liquid Chromatography–Tandem Mass Spectrometry. Molecules 2019, 24, 705. [Google Scholar] [CrossRef] [PubMed]
- Moraes, T.V.d.; Montenegro, J.; Marques, T.S.; Evangelista, L.M.; Rocha, C.B.; Teodoro, A.J.; Kato, L.; Moreira, R.F.A. Perfil Fitoquímico e Atividade Antioxidante de Flores e Frutos de Pereskia aculeata Miller. Sci. Plena 2021, 17, 2021. [Google Scholar] [CrossRef]
- Hoff, R.; Daguer, H.; Deolindo, C.T.P.; de Melo, A.P.Z.; Durigon, J. Phenolic Compounds Profile and Main Nutrients Parameters of Two Underestimated Non-Conventional Edible Plants: Pereskia aculeata Mill. (Ora-pro-Nóbis) and Vitex Megapotamica (Spreng.) Moldenke (Tarumã) Fruits. Food Res. Int. 2022, 162, 112042. [Google Scholar] [CrossRef]
- Cruz, T.M.; Lima, A.d.S.; Zhou, F.; Zhang, L.; Azevedo, L.; Marques, M.B.; Granato, D. Bioactive Compounds from Ora-Pro-Nobis (Pereskia aculeata Mill.) Leaves and Fruits: Bioaccessibility After In Vitro Digestion, Cytotoxicity, and Oxidative Stress Attenuation in Human Plasma and Erythrocytes. Food Chem. 2024, 1, 460. [Google Scholar] [CrossRef]
- Bashmil, Y.M.; Ali, A.; BK, A.; Dunshea, F.R.; Suleria, H.A.R. Screening and Characterization of Phenolic Compounds from Australian Grown Bananas and Their Antioxidant Capacity. Antioxidants 2021, 10, 1521. [Google Scholar] [CrossRef]
- Sandjo, L.P.; dos Santos Nascimento, M.V.P.; Moraes, M.d.H.; Rodrigues, L.M.; Dalmarco, E.M.; Biavatti, M.W.; Steindel, M. NOx-, IL-1β-, TNF-α-, and IL-6-Inhibiting Effects and Trypanocidal Activity of Banana (Musa Acuminata) Bracts and Flowers: UPLC-HRESI-MS Detection of Phenylpropanoid Sucrose Esters. Molecules 2019, 24, 4564. [Google Scholar] [CrossRef]
- Maier, C.; Conrad, J.; Steingass, C.B.; Beifuss, U.; Carle, R.; Schweiggert, R.M. Quillajasides A and B: New Phenylpropanoid Sucrose Esters from the Inner Bark of Quillaja Saponaria Molina. J. Agric. Food Chem. 2015, 63, 8905–8911. [Google Scholar] [CrossRef]
- Van Kiem, P.; Nhiem, N.X.; Cuong, N.X.; Hoa, T.Q.; Huong, H.T.; Huong, L.M.; Van Minh, C.; Kim, Y.H. New Phenylpropanoid Esters of Sucrose from Polygonum Hydropiper and Their Antioxidant Activity. Arch. Pharm. Res. 2008, 31, 1477–1482. [Google Scholar] [CrossRef]
- Rebello, L.P.G.; Ramos, A.M.; Pertuzatti, P.B.; Barcia, M.T.; Castillo-Muñoz, N.; Hermosín-Gutiérrez, I. Flour of Banana (Musa AAA) Peel as a Source of Antioxidant Phenolic Compounds. Food Res. Int. 2014, 55, 397–403. [Google Scholar] [CrossRef]
- Oresanya, I.O.; Sonibare, M.A.; Gueye, B.; Balogun, F.O.; Adebayo, S.; Ashafa, A.O.T.; Morlock, G. Isolation of Flavonoids from Musa Acuminata Colla (Simili Radjah, ABB) and the In Vitro Inhibitory Effects of Its Leaf and Fruit Fractions on Free Radicals, Acetylcholinesterase, 15-Lipoxygenase, and Carbohydrate Hydrolyzing Enzymes. J. Food Biochem. 2020, 44, e13137. [Google Scholar] [CrossRef] [PubMed]
- Mba, C.J.; Agu, H.O. Developments on the Bioactive Compounds and Food Uses of the Tubers: Colocasia esculenta (L) Schott (Taro) and Xanthosoma sagittifolium (L) Schott (Tannia). Asian Food Sci. J. 2021, 20, 101–112. [Google Scholar] [CrossRef]
- Rodrigues, A.S.; Kubota, E.H.; da Silva, C.G.; dos Santos Alves, J.; Hautrive, T.P.; Rodrigues, G.S.; Campagnol, P.C.B. Banana Inflorescences: A Cheap Raw Material with Great Potential to be Used as a Natural Antioxidant in Meat Products. Meat Sci. 2020, 161, 107991. [Google Scholar] [CrossRef] [PubMed]
- Article, O.; Ramu, R.; Shirahatti, S.; Zameer, F.; Lakkapa, D.B.; Nagendra Prasad, M.N. Evaluation of Banana (Musa SP. Var. Nanjangud Rasa Bale) Flower and Pseudostem Extracts on Antimicrobial, Cytotoxicity and Thrombolytic Activities. Int. J. Pharm. Pharm. Sci. 2015, 7, 136–140. [Google Scholar]
- Schmidt, M.M.; Kubota, E.H.; Prestes, R.C.; Mello, R.O.; Rosa, C.S.; Scapin, G.; Ferreira, S. Development and Evaluation of Pork Burger with Added Natural Antioxidant Based on Extract of Banana Inflorescence (Musa Cavendishii). CYTA-J. Food 2016, 14, 280–288. [Google Scholar] [CrossRef]
- Almeida, M.E.F.d.; Corrêa, A.D. Utilização de Cactáceas do Gênero Pereskia na Alimentação Humana em um Município de Minas Gerais. Ciência Rural. 2012, 42, 751–756. [Google Scholar] [CrossRef]
- Araújo, N.F.d.; Barbosa, R.A.; Lima, L.T.d.; Figueiredo, R.O. Benefícios Nutricionais da Utilização de Ora-pro-Nobis (Pereskia aculeata MILLER) como Ingrediente em Produtos e Preparos Alimentícios. Rev. Foco 2024, 17, e6573. [Google Scholar] [CrossRef]
- da Silva Porto, F.G.; Campos, Â.D.; Carreño, N.L.V.; Garcia, I.T.S. Pereskia aculeata Leaves: Properties and Potentialities for the Development of New Products. Nat. Prod. Res. 2022, 36, 4821–4832. [Google Scholar] [CrossRef]
- Ferreira, R.d.S.; Lucia, C.M.D.; Minim, V.P.R.; Vieira, É.N.R.; Gomes, J.M.G.; Vidigal, M.C.T.R. Ora-Pro-Nobis (Pereskia aculeata) and Its Technological Applications in Foods: A Review. Obs. De La Econ. Latinoam. 2024, 22, e3961. [Google Scholar] [CrossRef]
- Dos Santos, O.V.; da Cunha, N.S.R.; Duarte, S. de P. de A.; Soares, S.D.; da COSTA, R.S.; Mendes, P.M.; Martins, M.G.; Do Nascimento, F.D.C.A.; Figueira, M. de S.; Duarte, S. de P. de A.; et al. Determination of Bioactive Compounds Obtained by the Green Extraction of Taioba Leaves (Xanthosoma taioba) on Hydrothermal Processing. Food Sci. Technol. 2022, 42, e22422. [Google Scholar] [CrossRef]
- Mendes, F.D.; Uliana, D.S.; Silva, A.I.d.S.; de São José, J.F.B. Unconventional Food Plants in Mixed Juices: Evaluation of the Nutritional, Physical-Chemical, Microbiological, and Sensory Quality of Orange Juice with Sorrel (Rumex Acetosa) and Taioba (Xanthosoma Sagittifolium). CyTA-J. Food 2024, 22, 2387716. [Google Scholar] [CrossRef]
- Siqueira, M.V.B.M.; do Nascimento, W.F.; Pedrosa, M.W.; Veasey, E.A. Agronomic Characteristics (Varieties or Landraces) and Potential of Xanthosoma sagittifolium as Food and Starch Source. In Varieties and Landraces; Elsevier: Amsterdam, The Netherlands, 2023; pp. 261–272. [Google Scholar]
- de Jesus Benevides, C.M.; da Silva, H.B.M.; Lopes, M.V.; Montes, S.d.S.; da Silva, A.S.L.; Matos, R.A.; de Freitas Santos Júnior, A.; dos Santos Souza, A.C.; de Almeida Bezerra, M. Multivariate Analysis for the Quantitative Characterization of Bioactive Compounds in “Taioba” (Xanthosoma sagittifolium) from Brazil. J. Food Meas. Charact. 2022, 16, 1901–1910. [Google Scholar] [CrossRef]
- Farfus, A.P.; Teixeira, S.D.; Pereira, E.A.; Santos, V.A.Q.; Tomazini, V.B.; Zanoelo, T.A.; Sartor, J.F. Avaliação da Cinética de Secagem e Atividade Antimicrobiana do Óleo Essencial e Hidrolato da Parte Aérea da Panc Stachys byzantina. Res. Soc. Dev. 2021, 10, e84101724265. [Google Scholar] [CrossRef]
- Gülsoy Toplan, G.; Taşkın, T.; Mataracı Kara, E.; Ecevit Genç, G. Antioxidant and Antimicrobial Activities of Various Extracts from Stachys cretica Subsp. Bulgarica Rech.f., Stachys byzantina K. Koch and Stachys Thirkei K. Koch. İstanbul J. Pharm. 2021, 51, 341–347. [Google Scholar] [CrossRef]
- Pashova, S.; Karcheva-Bahchevanska, D.; Ivanov, K.; Ivanova, S. Genus Stachys—Phytochemistry, Traditional Medicinal Uses, and Future Perspectives. Molecules 2024, 29, 5345. [Google Scholar] [CrossRef]
- Stefanello, F.S.; Cavalheiro, C.P.; Ludtke, F.L.; Silva, M. dos S. da; Fries, L.L.M.; Kubota, E.H. Oxidative and Microbiological Stability of Fresh Pork Sausage with Added Sun Mushroom Powder. Ciência E Agrotecnol. 2015, 39, 381–389. [Google Scholar] [CrossRef]
- Padam, B.S.; Tin, H.S.; Chye, F.Y.; Abdullah, M.I. Banana By-Products: An under-Utilized Renewable Food Biomass with Great Potential. J. Food Sci. Technol. 2014, 51, 3527–3545. [Google Scholar] [CrossRef]
- Chowdary, M.Y.; Rana, S.S.; Ghosh, P. Banana Inflorescence and Their Potential Health Benefits as Future Food. Qual. Assur. Saf. Crops Foods 2022, 14, 131–136. [Google Scholar] [CrossRef]
- Aguilar, C.N.; Carvajal-Millan, E. Applied Food Science and Engineering with Industrial Applications; Aguilar, C.N., Carvajal-Millan, E., Eds.; Apple Academic Press: Toronto, NJ, USA, 2019; ISBN 9781351048644. [Google Scholar]
- Amornlerdpison, D.; Choommongkol, V.; Narkprasom, K.; Yimyam, S. Bioactive Compounds and Antioxidant Properties of Banana Inflorescence in a Beverage for Maternal Breastfeeding. Appl. Sci. 2020, 11, 343. [Google Scholar] [CrossRef]
- John, J. Nutritional, Functional and Shelf-Life Assessment of Processed Banana Inflorescence (Musa Paradisiaca). J. Postharvest Technol. 2024, 9, 58–70. [Google Scholar]
- Da Silva, J.P.S.S.; Fernandes, M.B.; De Jesus, J.H.; Tristão, T.C. Valorization of Banana Flower Residues: Potential Therapeutic and Antioxidant Applications. Lumen Et Virtus 2024, 15, 5173–5187. [Google Scholar] [CrossRef]
- Öztürk, M.; Sridhar, K.R.; Sarwat, M.; Altay, V.; Huerta-Martínez, F.M. Ethnic Knowledge and Perspectives of Medicinal Plants; Apple Academic Press: New York, NY, USA, 2023; ISBN 9781003353089. [Google Scholar]
- Fingolo, C.E.; Braga, J.M.A.; Vieira, A.C.M.; Moura, M.R.L.; Kaplan, M.A.C. The Natural Impact of Banana Inflorescences (Musa Acuminata) on Human Nutrition. An. Acad. Bras. Cienc. 2012, 84, 891–898. [Google Scholar] [CrossRef]
Disclaimer/Publisher’s Note: The statements, opinions and data contained in all publications are solely those of the individual author(s) and contributor(s) and not of MDPI and/or the editor(s). MDPI and/or the editor(s) disclaim responsibility for any injury to people or property resulting from any ideas, methods, instructions or products referred to in the content. |
© 2025 by the authors. Licensee MDPI, Basel, Switzerland. This article is an open access article distributed under the terms and conditions of the Creative Commons Attribution (CC BY) license (https://creativecommons.org/licenses/by/4.0/).