1. Introduction
Cobalt, due to its critical role in materials such as power battery cathodes, hard alloys, and magnetic alloys [
1,
2], is widely used in high-tech industries and has become a focal point of competition among countries. However, due to the US-led ‘Mineral Security Partnership’ (MSP) and other ‘de-sinicization’ policies in the mineral supply chain, export bans on cobalt concentrate by resource countries, and pandemic-related shutdowns of mines and ports, the international trade of cobalt faces significant uncertainty [
3,
4,
5]. This significantly increases the risk of supply chain disruptions for major clean energy countries like China, which heavily rely on cobalt imports.
Despite the global mineral trade, the availability of cobalt has significantly increased. Countries with low reserves but high demand can benefit from international trade, which helps alleviate domestic supply and demand imbalances and reduces the risk of supply disruptions caused by emergencies [
6,
7]. However, interconnected markets can also facilitate the transmission and spread of shocks, increasing the vulnerability of countries to disruptions in foreign export supplies, thus posing a risk of cobalt supply interruptions [
7,
8]. Therefore, it is essential to thoroughly understand the impact of declining export supplies on the international cobalt ore trade network.
With the rise of network science, network analysis has become an important perspective for understanding international trade relations and a significant means for quantitative analysis. The core lies in quantifying the system characteristics by constructing trade networks among countries and using complex network indicators [
9,
10]. Commonly used topological indicators include: Node centrality reveals the status of key countries; network density and average path length reflect the overall connectivity efficiency. The clustering coefficient measures the degree of trade groupization; and modular analysis identifies the structure of trade communities [
11,
12]. Moreover, by integrating gravity models, seepage models, infectious disease models, cascading failure models, etc., researchers can systematically analyze the complexity and vulnerability of the global trade network from three dimensions: static structural features, dynamic evolution laws, and risk transmission mechanisms. In recent years, these methods have been fully applied in resources, energy, food, weapons, products, and other aspects [
13,
14,
15,
16,
17]. At present, scholars have conducted simulation studies on how risks from single-country risks, bilateral friction, geopolitical risks, and technological risks affect the decline in cobalt resource trade exports and supply. Li et al. [
18] and Shi et al. [
19] developed a trade network model based on the cobalt industry chain and used gravity models to study the impact of national risks (economic and political) on cobalt trade. Sun et al. [
20] used cascading failure models to simulate the risk propagation of a sharp decline in supply from key cobalt-exporting countries. Li et al. [
21] constructed a multi-level network trade risk transmission model for cobalt trade, considering the transmission of export restrictions from single countries and bilateral frictions, to simulate the impact of risk transmission on the cobalt industry chain. Guo et al. [
22] used the QAP method and ERGM to investigate the influence of geopolitical relations on the cobalt trade network, delving into the heterogeneous effects of geopolitical cooperation and conflict. Shao et al. [
23] built a global cobalt-lithium trade network based on the trade interlinkages between cobalt and lithium, exploring the correlation between the cobalt trade network and the lithium trade network, and simulating the risk propagation of technological shocks between the cobalt and lithium trade networks. However, in the context of increasingly intense international competition for resources and energy, the risk of export supply decline often exhibits high uncertainty [
24,
25,
26,
27,
28]. Although the probability of a certain risk occurring in a specific country might be higher, the high uncertainty of risks makes the findings of the aforementioned studies relatively one-sided. Therefore, simulations can be conducted for each country to assess the impact of a decline in cobalt resource exports and supply on the network, identifying which countries will experience more severe disruptions and which will suffer greater damage.
The contribution of this paper is twofold. Firstly, unlike previous studies that focused on specific risk types (such as geopolitical, economic, or technological risks) and the impact of specific risks on cobalt trade networks in one or a few countries, this paper adopts a comprehensive sample simulation approach. It incorporates the supply decline scenarios of each exporting country into the analysis framework to comprehensively assess the criticality and vulnerability of each country within the network. This method not only identifies which countries’ supply disruptions could severely impact the global cobalt trade network but also quantifies the extent to which each country is affected by supply contractions from other countries. Consequently, it provides a more systematic and intuitive reflection of the true vulnerability of the global cobalt supply chain.
Secondly, this paper introduces a trade network shock diffusion model, using actual cobalt resource production data as a key parameter for assessing a country’s resilience to shocks. By integrating network structure and interdependencies, the study comprehensively analyzes the direct and indirect impacts on global demand countries under two scenarios: a 100% supply disruption and a 50% supply reduction in exporting countries. This approach allows for more targeted recommendations on supply chain security and risk management for different types of countries, such as resource-dependent countries, hub countries, and highly dependent countries. It also provides a more scientific theoretical and quantitative basis for ensuring raw material security in the context of global energy transition.
2. Shock-Diffusion Model
Although the types of risks vary across countries, supply disruptions are typically triggered by sudden events such as natural disasters, trade policy adjustments, international public health emergencies, or geopolitical conflicts. These events often result in partial or complete loss of export capacity [
29,
30,
31,
32,
33,
34,
35]. Therefore, a 50% and 100% shock represent two typical scenarios of moderate and complete disruption, respectively. This paper considers export supply disruptions as the initial risk source, examining the extent of network damage and demand losses in different countries. It also highlights the impact of key node countries on the network. To achieve this, we model the international cobalt trade network as a directed weighted network and use the improved shock-diffusion model by Marco Grassia [
36] to simulate the propagation of the decline in export supply.
In summary, the export shock from a specific country in a given year will spread through a directed weighted network, thereby affecting other countries’ ability to obtain cobalt resources. Here, (the total number of networks involved in cobalt trade in a given year) represents a set of nodes, a set of directed edges between these nodes, and a collection of weights associated with these edges. To formally introduce this model, we first define the internal demand of the countries involved in the cobalt trade network.
The internal demand of
countries that have experienced shocks is:
Among them
, domestic production
is
indicated, import is indicated, export is indicated, and tons are used.
Using Formula (1), the initial internal demand
of each country at a given time can be
calculated
. If a specific
country is
hit by an impact, the demand loss is. The country can mitigate this impact by reducing exports (assuming domestic demand is met) and/or increasing imports to compensate for the decline in domestic supply [
37,
38]. Theoretically, two scenarios can occur:
The proportion of exports reduced and imports increased is used for allocation. In the actual study, it is set to 0.8, which means that 80% of the impact is compensated by reducing exports, while 20% of the impact is compensated by increasing imports.
The demand
compensation of a country has a cascading effect on the directly connected countries in the trade network. After
the initial
step, the shock spreads through the network, and the demand loss generated by the country is:
If the import and export remain unchanged, the loss of demand is 0. According to Formula (2)
and Formula (3)
, the change of and can be realized by changing the weight of the trade side. Finally, the risk diffusion process as shown in
Figure 1 was formed.
We assume that two different dynamic adjustments are made through imports and exports. Any
increase in imports
and exports is calculated based on the trade volume provided to the country in the baseline scenario. Due to the network’s loops, a country may be affected multiple times during the cascading process
. A decrease in a country’s exports can lead to another decrease in its imports. If a country without demand loss can further reduce its exports, the final step at any time will always be less than one year [
39].
To assess the impact of cobalt export supply disruptions on countries, we conducted simulations of a 100% and 50% annual decrease in cobalt exports for each country. At the end of each simulation, record the number of failed countries , the proportion of failed countries , and the demand loss of the impacted countries caused by the export shock of country . Then, the total number of failed countries caused by the export shock of the country from 2000 to 2023 is , and the average failure rate is .
This study focuses on upstream products in the cobalt industry chain, including metallic cobalt, cobalt powder, cobalt concentrate, and cobalt ore [
40,
41]. Based on customs codes, two categories were identified: ‘cobalt powder, metallic cobalt, and electrolytic cobalt’ (HS code: 8105) and ‘cobalt concentrate and cobalt ore’ (HS code: 2605). Trade data from 155 countries (regions) between 2000 and 2023 were obtained from the United Nations Comtrade database. The production data for each country was sourced from the Mineral Products Summary published by the US Geological Survey (USGS) and the S&P Mining Report. Only 37 countries reported production figures, while the cobalt resource production of the remaining countries was set to zero.
3. Results
3.1. Impact Analysis of Risk Sources
This section examines the extent of disruption caused by countries acting as risk sources to the global cobalt trade network. The total number of failed countries and their average failure rate from 2000 to 2023 are used to illustrate this. The table below presents statistics on the top 10 most severely affected countries, with complete export supply disruptions (
Table 1) and a 50% reduction in supply (
Table 2).
The African continent is the primary risk zone for the global cobalt trade. Congo (DRC) stands out as the most destructive risk source in the global cobalt trade network. As shown in
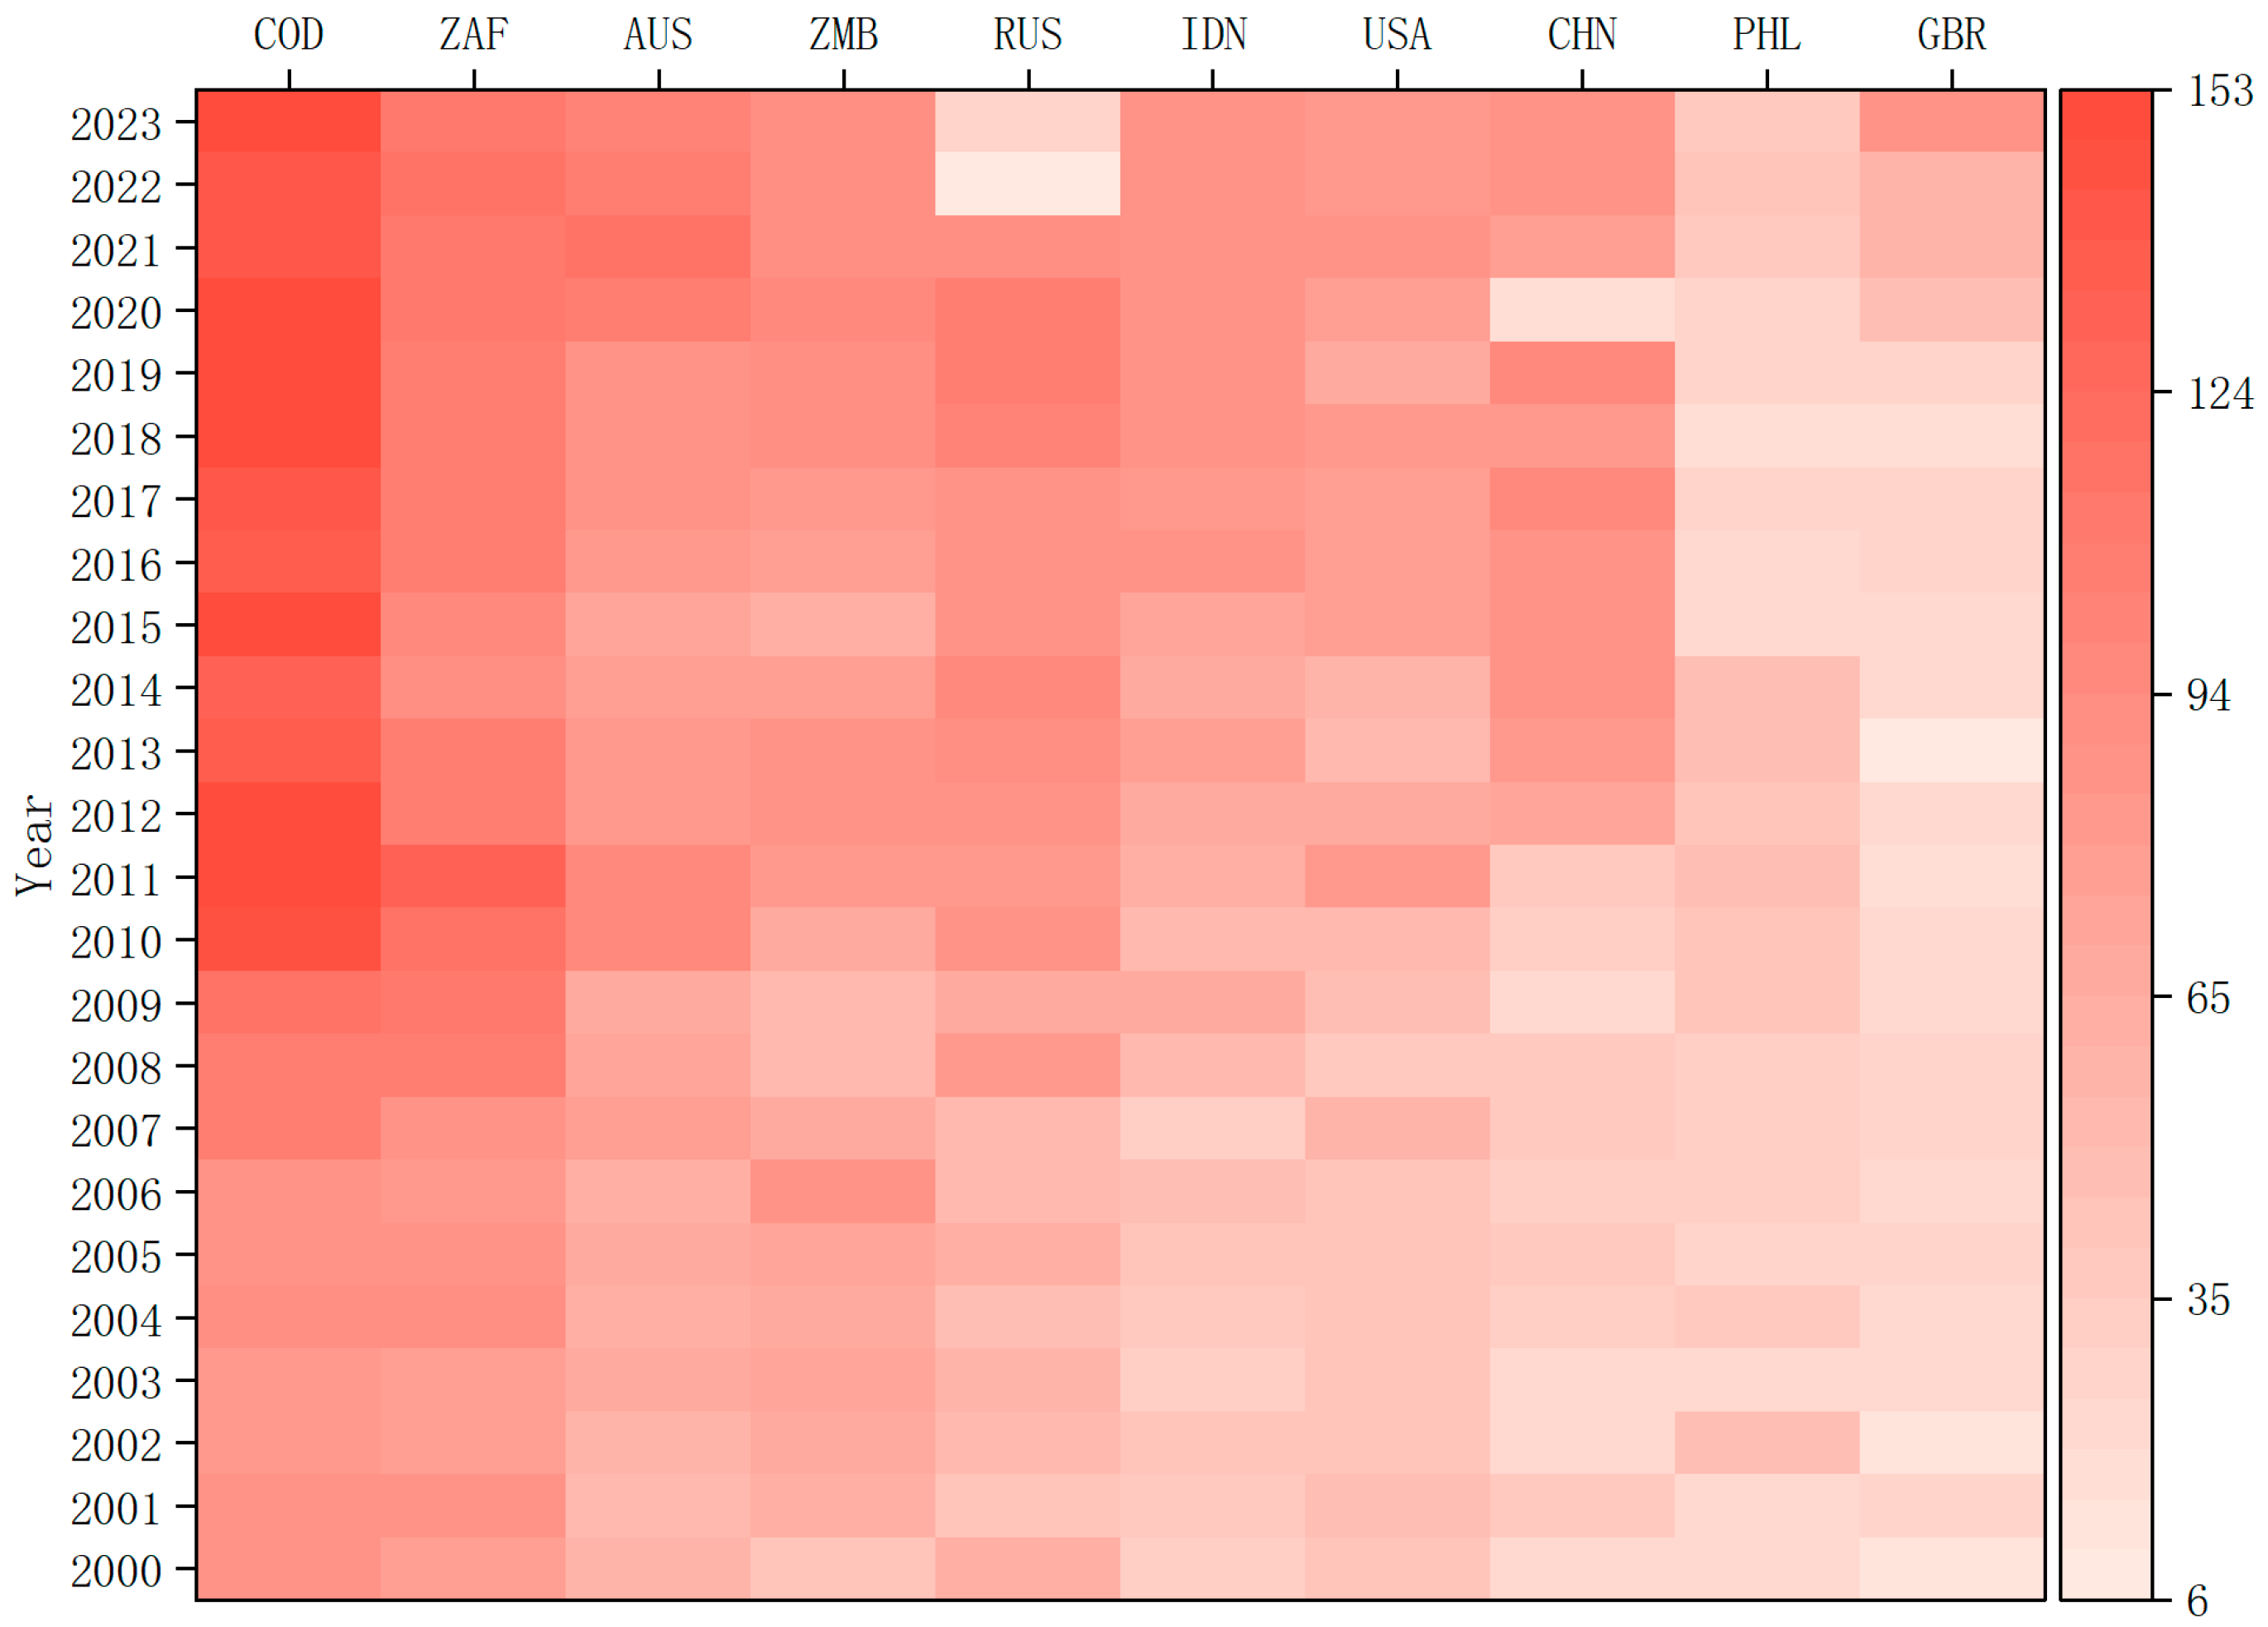
Table 1, the total number of countries affected by failures is 2952, with an average failure rate of 0.79. This highlights the global reliance on Congo (DRC) for cobalt supply. According to
Figure 2, from 2008 to 2023, the number of affected countries has consistently remained above 140. This high concentration is closely linked to Congo (DRC) accounting for approximately 70% of the global cobalt ore supply. The country’s issues, such as inadequate infrastructure, civil war, and changes in trade policies, could significantly impact the global cobalt trade network. For instance, during the 2008–2009 international financial crisis, Congo (DRC)’ s mining investment sharply declined, leading to significant market volatility. South Africa followed closely behind, ranking second with a total of 2386 affected countries, an average failure rate of 0.64.
Figure 2 also shows that South Africa’s influence has gradually increased from 2000 to 2023, with minimal fluctuations. South Africa’s destructive impact peaked in 2008 and 2020. Although South Africa is not a major cobalt resource country or smelting power, its ports, especially Durban Port, and infrastructure provide crucial support for cobalt transportation and export. Therefore, its influence surpasses that of other resource countries. Zambia’s complete disruption of exports led to 1797 affected countries, with an average failure rate of 0.48, ranking fourth. Although Zambia has fewer cobalt reserves than Congo (DRC), it has stronger smelting capacity and a more mature local smelting industry, which can process copper and cobalt into high value-added products for export to countries such as China.
Australia, Indonesia, and the Philippines form another significant risk area in the global cobalt trade. Australia accounts for about 3% of global cobalt exports, with a relatively stable global impact. Indonesia, however, has shown a growing destructive potential, particularly in 2021 when the number of countries affected reached a new high. This may be due to the government’s efforts to establish a domestic electric vehicle supply chain, along with substantial investments in nickel and cobalt processing industries supported by China, which have gradually made Indonesia a key node in the cobalt import and export trade.
Russia, the United States, China, and the United Kingdom form the primary risk areas for global cobalt trade consumption. Russia, a resource-rich country and consumer, faces significant risks. If its exports were to be completely halted, 1734 countries would be affected, with an average failure rate of 0.47. As shown in
Figure 2, Russia’s destructive power has been on the rise since 2008 but has seen a sharp decline since 2021, closely tied to the global demand for cobalt and international sanctions. The United States, China, and the United Kingdom also rank among the top ten in terms of destructive power, owing to their strong cobalt smelting capabilities. For instance, since 2010, China has accounted for half of the world’s cobalt smelting capacity, and any disruption in its exports would have a significant impact.
In the scenario of a 50% export disruption, the top ten affected countries still exhibit the characteristic of ‘one superpower and multiple strong players’: Congo (DRC) remains the dominant player, while South Africa, as a crucial link in cobalt transportation and production, continues to play a significant role in disrupting the supply chain. As shown in
Figure 3, Congo (DRC) has consistently maintained a high level of disruption from 2000 to 2023, with over 45 countries experiencing disruptions annually, highlighting the global reliance on its cobalt supply. In contrast, the disruption levels of countries like Russia and Australia have fluctuated, possibly due to differences in their trading partners. The disruption capabilities of the United States, China, and Indonesia have also changed. However, when 50% of exports are disrupted, the disruption levels of these three countries have shown a gradual increase over time. Additionally, the Philippines and the UK have dropped out of the top ten, while Malaysia and New Caledonia have risen to the top ten. A 50% export disruption by Malaysia led to the failure of 508 countries, with an average failure rate of 5.15%. Despite being a country with limited cobalt resources and lacking significant production data, Malaysia has become a key trade transit country due to its well-developed port facilities and logistics network along the important international shipping route of the Malacca Strait. New Caledonia, a significant producer of nickel and cobalt, is included in the international supply chain through its associated ore and high-grade nickel-cobalt ore exports. In terms of industrial layout, New Caledonia does not have large smelting or processing capacity, and most cobalt resources are exported to smelting centers (such as China and Japan).
3.2. Demand Loss Analysis
After the shocks of a 100% and 50% decline in exports from any initial risk country spread, this paper calculates the demand loss for each country when it is the initial risk country for other countries. The map below shows the average demand loss (in tons) for each country when the initial risk country experiences a 100% (
Figure 4) or 50% (
Figure 5) decline in exports.
As shown in
Figure 4 and
Figure 5, China is particularly affected by a complete export disruption. The average demand loss is as high as 204,460.38 tons, far exceeding that of other countries. This loss is primarily due to China’s critical role in the global industrial division of labor. As a major manufacturing country, China has a significant demand for cobalt. Given China’s relatively poor cobalt resource endowment, a complete supply disruption from cobalt-producing countries would be devastating, as low production levels cannot withstand such a massive impact, leading to a very high demand loss. The United States also shows some vulnerability when facing export disruptions. In the case of a 100% export disruption, its average loss is 31,382.80 tons, significantly lower than China, but it still highlights the U.S.’s dependence on specific raw material supplies.
The industrial structures of European and American countries are more diverse. While they can mitigate some impacts through diversified supply chains, they still face challenges from rising production costs and supply instability. Particularly for high-tech industries and the automotive sector, supply chain disruptions can lead to delayed product deliveries, further impacting market competitiveness. Within Europe, the losses in Switzerland and the Netherlands during a 100% export disruption are noteworthy. Switzerland suffered a loss of 39,447.19 tons, while the Netherlands lost 35,819.37 tons. This indicates that despite their relatively smaller economies, these countries play crucial roles in the global supply chain. Switzerland is renowned for its high-tech manufacturing and financial services, whereas the Netherlands excels in logistics and distribution. The export disruption not only affects the economic well-being of these countries but also triggers a ripple effect on their international partners.
For African countries, the impact of export disruptions is equally significant. For instance, in Zambia, a complete export disruption results in an average loss of 52,626.53 tons, highlighting the heavy reliance on mineral resources. African countries typically depend on mineral resource exports to sustain their economies, making supply chain disruptions highly impactful. Particularly, disruptions in the export of minerals like copper and cobalt can directly affect these countries’ economic income and lead to higher prices for mineral resources in the global market. South Africa, another key economy in Africa, suffered a loss of 49,334.51 tons, underscoring its critical role in mineral resource supply. As a crucial transit point in the global cobalt trade, South Africa’s export disruptions have a profound effect on related industries worldwide. In contrast, other African countries like Morocco and Zimbabwe experienced relatively smaller losses.
Overall, the impact of export disruptions varies significantly across countries and regions. This analysis reveals the vulnerability of global supply chains and the complex roles of different regions in the global economic system, while also reminding countries to adopt more robust supply chain management strategies in the future to reduce potential economic risks.
3.3. Impact of Export Interruption at Important Nodes
In recent years, the competition for global resources has intensified, and trade conflicts have become more frequent. China and the United States are significant consumers in the global cobalt trade network and have heightened their focus on the security of cobalt supply chains due to the trade war. As one of the key resource countries in the global cobalt trade, French New Caledonia saw a significant increase in its cobalt concentrate trade volume in 2014, which had a significant impact on the global cobalt trade network. Many scholars have conducted detailed studies on the core country, the Democratic Republic of Congo [
20,
42,
43,
44,
45,
46]. Therefore, this article selects China, the United States and French New Caledonia as the objects for analyzing the nodes of export supply disruptions. China and the United States are two of the major consumers of resources in the global resource competition. The country of New Caledonia is an important node for resource supply. The study examines the impact of complete and 50% disruptions on the global cobalt trade network. For the timing of the analysis, China chose 2019, before the impact of the COVID-19 pandemic. The United States, less affected by various emergencies, chose 2023, the most recent year. French New Caledonia selected 2014, when the cobalt concentrate trade volume saw a significant increase, for its analysis.
Figure 6 shows the global primary cobalt trade network in 2014 (left). The global cobalt trade network after a 50% interruption of export supply (middle) and a complete interruption of export supply (right) in French New Caledonia.
In terms of the change in the weight of traded goods, there was a significant reduction in the global cobalt trade network when the export supply from French New Caledonia was interrupted by 50% and 100%. This reflects the importance of French New Caledonia in the global cobalt market, and its reduced exports directly led to a decline in global cobalt trade.
From the perspective of changes in trade side numbers, the export supply disruptions in French New Caledonia also led to a significant reduction in trade side numbers. The reduction in trade side numbers means that the connectivity and diversity of global cobalt trade has been affected, and more countries and regions may face the risk of trade disruptions due to the lack of adequate cobalt supply.
Considering the changes in the weight of traded goods and the number of trade sides, it is evident that the export supply disruptions from French New Caledonia have had a profound impact on the global cobalt trade network. However, it is noteworthy that French New Caledonia only exported a significant amount of cobalt concentrate to Japan in 2014, between 2000 and 2023. It was a brief presence in the cobalt trade network. This situation highlights the need for countries and regions that rely on cobalt imports to closely monitor the dynamics of the global cobalt market. In particular, changes in export policies from regions like French New Caledonia should be carefully considered to develop more robust trade strategies to address potential market risks.
Comparing
Figure 7 with
Figure 1 and
Figure 2, it is evident that while China’s complete interruption of exports in 2019 resulted in the highest number of failed countries, the extent of disruption was not significant. The global cobalt trade network with a 50% and full interruption of China’s exports in 2019 was not much different from the original network. Network topology analysis revealed that the average path lengths (the smaller the average path length, the closer the cobalt trade relationship among countries before) of the trade networks after a 50% and full interruption of China’s exports in 2019 were similar to those of the original global cobalt trade network in 2019, at 2.285, 2.89, and 2.27, respectively. This suggests that the overall connectivity of the global cobalt trade network remained largely intact after the interruption of China’s exports, maintaining high trade efficiency. This stability may be attributed to the diversity of China’s export destinations, which effectively dispersed the risk of shocks. Additionally, the three networks in
Figure 7 showed relatively high average clustering coefficients (The larger the clustering coefficient is, the stronger the local risk resistance capacity of regional trade groups that rely on internal circulation), ranging from 0.514 to 0.524. This indicates that the trade relationships among countries in the global cobalt trade network are relatively tight, forming multiple clusters. Such tight trade relationships enable countries to adjust their trade strategies in response to external shocks, thereby maintaining the stability of the trade network. Considering the similarity between the trade network after a 50% interruption of China’s exports and the original trade network, we can conclude that, despite China’s significant role in the global cobalt trade, the interruption of its exports did not have a disruptive impact on the global trade network.
Figure 7 shows the global primary cobalt trade network in 2019 (left). The global cobalt trade network after a 50% interruption of China’s export supply (center) and a complete interruption of China’s export supply (right).
As shown in
Figure 8, the global cobalt trade network in 2023 was not much different from the network after the initial risk country, the United States, faced a supply disruption. The average clustering coefficient of the global cobalt trade network is 0.574, indicating that under normal conditions, the connections between global cobalt trading partners are relatively tight, forming multiple clusters. However, when considering the supply disruption of the United States, a key exporting country, we observed some notable changes. Specifically, when the cobalt export supply from the United States was disrupted by 50%, the average clustering coefficient of the trade network dropped to 0.556, and when the supply was completely disrupted, it further decreased to 0.554. Although these changes may seem minor, they actually highlight the sensitivity and adjustment capabilities of the trade network in response to supply shocks. The impact of the United States’ supply disruption was less severe than that of China, possibly due to the strong bilateral political, economic, and cultural ties between its exporting countries and the United States, which can help disperse the shock more effectively [
47]. Therefore, when analyzing the global cobalt trade network, it is essential to consider not only the network structure indicators, such as the average clustering coefficient, but also the multifaceted impacts of supply disruptions on trade flows, prices, partner behavior, and supply chain resilience [
40]. This will provide a more comprehensive and accurate assessment of the true impact of supply disruptions on the global cobalt trade landscape, as well as more valuable insights for policymakers and market participants.
Figure 8 shows the global primary cobalt trade network in 2023 (left). The global cobalt trade network after a 50% interruption of US export supply (middle) and a complete interruption of US export supply (right).
4. Conclusions
(1) From a national perspective, in scenarios of complete or 50% export disruptions, the global cobalt trade network exhibits a ‘one dominant, multiple strong’ pattern. Congo (DRC), as the absolute leading core supplier, has a far greater impact than other countries. Zambia, Australia, Russia, Indonesia, the Philippines, China, the United States, the United Kingdom, and New Caledonia, due to their strong storage or smelting capabilities, also play significant roles in disrupting the trade network. Additionally, South Africa and Malaysia, as key transit countries, play crucial roles in the global trade network.
(2) In terms of geographical location, the global cobalt trade network faces three primary risk areas under scenarios of complete or 50% export disruptions. The African continent is the most significant risk area for global cobalt trade. Southeast Asia, including the Philippines and Indonesia, and Oceania, including Australia, form another major risk area. The Eurasian continent and North America, including Russia, the United States, China, and the United Kingdom, constitute the main consumer risk areas for global cobalt trade.
(3) Some countries are increasingly playing a more significant role in the global cobalt trade network. Indonesia is showing signs of rising as a risk source, particularly in 2021, when the number of countries affected by export disruptions reached a new high. This highlights its growing importance in the trade network. Malaysia, a key transit hub, plays a pivotal role in the global trade network due to its strategic location at the Strait of Malacca. Both China and the United States have shown increasing destructive power over the trade network under two scenarios of export disruptions.
(4) Diversified trade can reduce the impact of disruptions on the network. China and the United States are major consumers of cobalt concentrate and ore, as well as primary producers of metallic cobalt and cobalt powder. In the event of an export supply disruption, although these two countries significantly influence the global cobalt trade network, their extensive trade networks ensure that the overall connectivity and stability of the global cobalt trade network remain intact. Countries with fewer trade links and unique supply roles, such as New Caledonia, exert a greater influence on the global trade network due to their strategic positions.
(5) In terms of demand loss, the majority of affected countries are in Asia, particularly those experiencing complete or 50% export disruptions. The countries with the highest average demand losses are primarily China, the United States, South Africa, and Zambia. These countries are major consumers of cobalt or have economies heavily dependent on cobalt imports and exports, and they often engage in significant cobalt trade with a few other countries.
The core viewpoints of this article are roughly the same as those of other related studies and are basically consistent with the core resource countries and consumer countries that affect the trade network. However, the differences in the models, methods, and data used and the inconsistent research goals led to slight discrepancies in some of the results. In addition, this article also has certain limitations. Trade data is measured on an annual basis, making it difficult to capture the short-term impact of sudden events (such as public health emergencies and natural disasters) on the supply chain. The shock propagation model assumes that trade relations are static networks and does not take into account the dynamic adjustments at the enterprise level (such as supplier switching and inventory buffering), which may overestimate the actual impact of disruptions. The quantitative results of demand losses are relatively conservative due to the failure to incorporate price mechanisms and market substitution effects (such as the increase in cobalt prices prompting battery enterprises to shift to high-nickel and low-cobalt technologies). Therefore, future research needs to construct a systematic analysis framework featuring “macro-micro collaboration, full industrial chain coupling, and multi-source data integration”, promoting the transformation of critical mineral research from a “static structure analysis” paradigm to a “multi-level-multi-dimensional-dynamic response” one, and providing more precise decision support for supply chain risk management.
Based on the above conclusions, this paper puts forward suggestions for enhancing the global sustainable utilization of cobalt resources:
- (1)
Explore the overseas cobalt resource reserve system and improve the supply chain resilience
Actively explore the establishment of an overseas reserve system for cobalt resources. Establish overseas reserve stations in resource-exporting countries such as the Democratic Republic of the Congo to directly participate in mineral exploitation and raw material reserves, ensuring the controllability of the supply source. In addition, regional cobalt resource regulation centers can be established in combination with the country’s strategic planning. For instance, China has cooperated with countries along the Belt and Road Initiative (such as Malaysia, Singapore, Indonesia, etc.) to build stable regional supply chain nodes. The United States and the European Union can rely on international mining companies such as Glencore and the EU’s key raw materials alliance ERMA to build sustainable overseas reserve stations.
- (2)
Strengthen the linkage with domestic enterprises to jointly build a market-oriented reserve and recovery system
Based on the national reserves, efforts should be made to promote the major domestic cobalt resource-consuming enterprises jointly build an enterprise reserve system (such as: China-CATL, BYD, Huayou Cobalt; The United States-Tesla, GM; Belgium-Umicore; Sweden-Northvolt). Promote enterprises to voluntarily reserve cobalt resources through policy support, complementing the national strategic reserves. Increase support for the research and development of cobalt alternative materials and the formulation of industry standards through policy guidance and accelerate the development and industrialization of high-nickel low-cobalt batteries and cobalt free batteries. Further accelerate the layout of the cobalt recycling industrial chain, promote the recycling and utilization of cobalt-containing products such as used power batteries and electric vehicles through policy incentives, achieve closed-loop utilization of cobalt resources, and reduce the import demand for cobalt primary minerals.
- (3)
Build a big data monitoring platform to strengthen the stability of the logistics network
On the one hand, it is necessary to establish a domestic leading cobalt resource trade tracking and monitoring platform. At the same time, develop an intelligent supply chain monitoring platform and closely cooperate with major cobalt raw material countries to monitor the import and export of cobalt resources in real time. On the other hand, it is necessary to further strengthen the construction of the logistics network for cobalt resource imports. Especially at the logistics nodes connecting Southeast Asia and the southern and northern parts of Africa, enhance the stability and reliability of the transportation channels. For instance, invest in renovating the port facilities of the trade route from Africa to Southeast Asia, and improve the layout of cross-border logistics channels in combination with the “Belt and Road” projects.
- (4)
Build an independent trade system and enhance the international pricing power of cobalt resources
At the enterprise level, domestic mining companies are encouraged to bypass international middlemen and directly sign long-term procurement agreements with resource countries to ensure supply stability and price advantages. Meanwhile, efforts should be made to encourage domestic futures exchanges to launch cobalt futures trading varieties as soon as possible to strengthen the initiative in pricing. At the industrial level, domestic mining enterprises, smelters and battery manufacturing enterprises should be integrated to form a metal trade alliance. This will enable the alliance and group-based approach to counter the monopolistic pattern of international resource trade and enhance the bargaining power in international negotiations. In addition, it is necessary to actively promote the formulation of multilateral agreements and regional cobalt price standards, enhance collaboration with major resource and consumer countries, and ensure the stability of the cobalt resource supply chain and the fairness of the price mechanism through regional alliances.


