Article

Calculation of Greenhouse Gas Emissions from Tourist Vehicles Using Mathematical Methods: A Case Study in Altai Tavan Bogd National Park

by
Yerbakhyt Badyelgajy
1,
Yerlan Doszhanov
2,
Bauyrzhan Kapsalyamov
1,
Gulzhaina Onerkhan
3,
Aitugan Sabitov
4,
Arman Zhumazhanov
2 and
Ospan Doszhanov
5,*
1
Department of Environmental Management and Engineering, L. N. Gumilyov Eurasian National University, Satpayev 2, Astana 010000, Kazakhstan
2
UNESCO Chair in Sustainable Development, Al-Farabi Kazakh National University, Al-Farabi Ave. 71, Almaty 050040, Kazakhstan
3
Department of Chemistry, Chemical Technology and Ecology, Kazakh University of Technology and Business, Yesil District, Kayym Mukhamedkhanov str. 37 A, Astana 010000, Kazakhstan
4
Department of Analytical, Colloid Chemistry and Technology of Rare Elements, Al-Farabi Kazakh National University, Al-Farabi Ave. 71, Almaty 050040, Kazakhstan
5
Department of Automation and Robotics, Almaty Technological University, Tole bi st. 100, Almaty 050012, Kazakhstan
*
Author to whom correspondence should be addressed.
Sustainability 2025, 17(15), 6702; https://doi.org/10.3390/su17156702
Submission received: 23 June 2025 / Revised: 14 July 2025 / Accepted: 16 July 2025 / Published: 23 July 2025

Abstract

The transportation sector significantly contributes to greenhouse gas (GHG) emissions and remains a key research focus on emission quantification and mitigation. Although numerous models exist for estimating vehicle-based emissions, most lack accuracy at regional scales, particularly in remote or underdeveloped areas, including backcountry national parks and mountainous regions lacking basic infrastructure. This study addresses that gap by developing and applying a terrain-adjusted, segment-based methodology to estimate GHG emissions from tourist vehicles in Altai Tavan Bogd National Park, one of Mongolia’s most remote protected areas. The proposed method uses Tier 1 IPCC emission factors but incorporates field-segmented route analysis, vehicle categorization, and terrain-based fuel adjustments to achieve a spatially disaggregated Tier 1 approach. Results show that carbon dioxide (CO2) emissions increased from 118.7 tons in 2018 to 2239 tons in 2024. Tourist vehicle entries increased from 712 in 2018 to 13,192 in 2024, with 99.1% of entries occurring between May and October. Over the same period, cumulative methane (CH4) and nitrous oxide (N2O) emissions were estimated at 300.9 kg and 45.75 kg, respectively. This modular approach is especially suitable for high-altitude, infrastructure-limited regions where real-time emissions monitoring is not feasible. By integrating localized travel patterns with global frameworks such as the IPCC 2006 Guidelines, this model enables more precise and context-sensitive GHG estimates from vehicles in national parks and similar environments.

1. Introduction

Tourist vehicles operating in ecologically sensitive areas can exert significant pressure on local ecosystems through both direct and indirect greenhouse gas emissions [1,2,3]. In regions with limited infrastructure and fragile biodiversity, such as national parks and mountainous regions, even seasonal increases in traffic can result in measurable ecological changes, including vegetation stress and habitat fragmentation. The impact of such anthropogenic activity on protected natural landscapes has been increasingly examined in recent ecological research. In similar studies, greenhouse gas emissions related to tourism have been assessed using various methods, from scenario modeling and qualitative environmental impact assessments to life cycle analysis in well-researched national parks [4,5,6,7,8,9,10,11].
The Altai Mountains form a vast mountain system in Central Asia, stretching approximately 2000 km across the borders of Russia, China, Kazakhstan, and Mongolia. Within Mongolia, the Altai range is subdivided into the Mongolian Altai and the Gobi Altai, extending over 1000 km [12]. Nearly half of the Altai Mountain range lies within Mongolian territory and supports more than ten distinct ecotourism types due to its dramatic landscapes and rich biodiversity [13,14].
Among these, Altai Tavan Bogd National Park stands out for its exceptional diversity of natural attractions and ecological value. Altai Tavan Bogd National Park covers 636,200 hectares (6362 km2) in the western Mongolian Altai and is one of twelve national parks in the region. It stretches 186 km along Mongolia’s western border and is a hub for diverse ecotourism activities such as mountaineering, trekking, horseback and camel riding, and wilderness exploration. The park has no mining or industrial operations; however, vehicle traffic from tourism has become the primary source of environmental pressure [15,16].
Tourist activity in the park has grown significantly in recent years. In 2022, as domestic tourism rebounded following the COVID-19 pandemic, the park recorded over 56,000 tourist visits and 13,000 vehicle entries. Many vehicles travel through unpaved and mountainous terrain, often passing near sensitive glacier systems, conditions that significantly increase fuel use and emissions. The unexpected surge in visitation to the national park during the COVID-19 pandemic may be interpreted in the context of shifting domestic tourism dynamics in Mongolia. In recent years, a discernible trend has emerged in which domestic tourists increasingly gravitate toward well-known and scenically attractive destinations. Given that the park is home to Mongolia’s highest peak and its largest glacier, it had already established a strong presence in the national tourism landscape. The closure of international borders during the pandemic further reinforced this tendency, as domestic travelers sought out remote and less-populated areas, resulting in increased pressure on protected areas such as this national park.
Building upon this framework, the present study specifically aims to (1) quantify greenhouse gas emissions from tourist vehicles in a national park with limited infrastructure and limited data registration systems, and (2) demonstrate the applicability of internationally recognized methodologies in remote, data-scarce environments. The overall objective is to better understand the environmental pressures associated with increasing tourism activity in such protected areas, particularly in ecologically sensitive zones near glacier systems.
The literature review is structured in three main parts: (1) global methodologies for calculating GHG emissions from vehicles, (2) the limitations of these methods in remote and infrastructure-poor regions, and (3) empirical studies on emissions and tourism impacts in Altai Tavan Bogd National Park.

1.1. International Approaches to Estimating GHG Emissions from Vehicles

The increase in GHG, particularly carbon dioxide (CO2), has significantly contributed to global warming. In response, many countries have developed models and tools to estimate vehicle GHG emissions. Notable examples include the IPCC 2006 Guidelines for National Greenhouse Gas Inventories [17,18] and the U.S. Environmental Protection Agency (EPA) vehicle emission standards [19].
Each country typically adopts a method aligned with its development level. According to the International Council on Clean Transportation, each country uses a method that suits its level of development. According to the ICCT methodology [20], it is important to consider not only the GHG emissions from electric vehicles and internal combustion engine (ICE) vehicles, but also emissions generated during fuel production, transportation, and distribution. The ICCT methodology emphasizes a life-cycle assessment approach, covering emissions from vehicle manufacturing, operational use, and disposal. This comprehensive approach provides a more accurate assessment of total GHG impacts from different vehicle technologies.
One such tool, the Fuel and Emissions Calculator (FEC) Version 2.0, estimates emissions based on vehicle operating modes, engine load, and service characteristics introduced [21]. Other studies have examined emissions from heavy-duty vehicles [22] and life-cycle emissions from electric vehicles [23,24].
In Japan, studies have explored using low-emission vehicles such as battery electric vehicles (BEVs), fuel cell vehicles (FCVs), and natural gas vehicles (NGVs) to reduce transportation-related emissions [25]. Using full life-cycle data, the UniSyD_JP partial equilibrium system dynamics model was used to estimate vehicle emissions in different Japanese regions. In China, IPCC Tier 2 methods were adapted using logarithmic trip-distance transformations and gamma-distributed travel patterns [26].
Advanced models have been developed to capture real-world driving conditions using complex variables such as driving behavior, environmental factors, and vehicle dynamics. For instance, Ehsani et al. (2016) incorporated variables such as engine specs, driving style, ambient temperature, wind, and road surface [27]. Tsokolis et al. (2016) used WLTP (Worldwide Harmonized Light Vehicles Test Procedure) for standardized testing [28], while Burgess and Choi (2003) highlighted how wind exposure impacts fuel use in UK intercity vehicles [29]. Pérez-Martínez et al. (2011) considered aerodynamic drag, rolling resistance, and gradients [30], and Hayashi (2001) studied Japan’s green vehicle tax incentives and their CO2 reduction impacts in urban environments [31].
However, these advanced approaches depend on consistent infrastructure and vehicle data, which are rarely available in protected or mountainous regions like Altai Tavan Bogd.

1.2. Limitations of Existing Methods for Remote Regions

Most models were developed for countries with reliable data systems, infrastructure, and minimal natural barriers. They typically estimate total GHG emissions rather than per unit area and are not well-suited to evaluate emissions in rural tourism zones. Peeters (2007) noted that no standardized approach exists for tourism-related GHG emissions [32]. Becken et al. (2003) proposed possible approaches: the top-down approach, which allocates emissions based on national or regional averages, and the bottom-up approach, which calculates emissions based on specific tourist behavior, such as transport mode, distance, and duration [33].
The IPCC 2006 Guidelines, widely adopted globally, provide 22 formulas under three tiers:
-
Tier 1: Estimates based on total national fuel use;
-
Tier 2: accounts for fuel/vehicle types and technology;
-
Tier 3: uses highly detailed operational data.
In regions like Mongolia, Tier 2 and 3 are rarely feasible due to the absence of vehicle testing systems, telemetry, and reliable maintenance records [34,35].
In the mining and tourism transport sectors, missing records on engine condition, maintenance frequency, and operational intensity further reduce reliability [36]. Moreover, Mongolia’s mountainous regions lack centralized vehicle databases, emissions testing systems, and enforcement of fuel efficiency standards. As a result, Tier 2 and Tier 3 methodologies are impractical here, and even Tier 1 estimates carry significant error, especially in high-altitude zones with steep terrain, unpaved roads, and seasonal tourism surges. Even Tier 1 results may carry significant uncertainty when applied to mountainous zones with unpaved roads and seasonal surges in tourist traffic.

1.3. Field-Based Studies on GHG Emissions and Tourism in Altai Tavan Bogd National Park

Altai Tavan Bogd National Park is situated in a remote, high-altitude area of western Mongolia, approximately 220 km from the nearest town. As noted in the Introduction section, this protected area was selected for the present study due to the marked increase in domestic tourism over the past decade, particularly during and after the COVID-19 pandemic. Although tourism activity near glacier areas has increased, linking vehicle traffic to long-term environmental damage directly remains challenging. Accordingly, this study aims to (1) develop a methodology for estimating GHG emissions from tourist vehicles in infrastructure-limited regions and (2) assess the environmental impact of increased tourist traffic within the national park.
A Scopus database search yielded approximately 900 results for the keyword “Altai.” Among these, 190 abstracts were reviewed in detail based on their relevance to emissions, tourism, and environmental conservation. Despite the regional coverage, few studies directly addressed GHG emissions, and none focused specifically on Altai Tavan Bogd National Park.
Field-based studies conducted jointly by Mongolian and Kazakh scientists [37,38] have identified several measurable tourism-related environmental impacts across the Altai region. Soil samples from high-traffic tourist zones revealed heavy metal contamination, including elevated lead, nickel, and zinc levels measured at 2 to 4 times higher than natural background concentrations. Land degradation affected by tourism was estimated at approximately 705.7 hectares in the Kazakh section of the Altai and 182.7 hectares on the Mongolian side of the park. Moreover, waste generation per tourist was reported at 612 g in the Kazakh Altai and 441 g in the Mongolian zone.
These findings highlight the need for a regionally adapted emissions estimation method to capture environmental impacts in ecologically sensitive, high-elevation protected areas like Altai Tavan Bogd.
Existing Tier 2 and Tier 3 approaches require data infrastructures, such as onboard diagnostics, vehicle telemetry, and maintenance records unavailable in most protected or high-altitude regions. Moreover, there is little technical guidance for adapting Tier 1 methods to unpaved terrain and segment-specific road conditions. This study addresses that methodological gap by proposing a modular, terrain-corrected estimation approach for infrastructure-limited national parks.

2. Materials and Methods

The methods used in this study were developed based on multi-year fieldwork conducted in Altai Tavan Bogd National Park and through consultation with relevant environmental authorities. The overall approach integrates data collection, vehicle classification, route segmentation, terrain-based fuel correction, and GHG emissions estimation. It is designed as a modular, stepwise framework suitable for protected areas with limited infrastructure and monitoring systems. The full process is visualized in Figure 1.

2.1. Research Data Collection

Altai Tavan Bogd National Park is located in a border region of Mongolia, where all visitors must obtain a “border area permit” from the General Authority for Border Protection. As a result, the number of tourists and vehicles entering the park is systematically recorded.
On 16 December 2023, the research team presented the study’s objectives and preliminary findings to the Ministry of Environment and Tourism. This engagement helped establish formal access channels. Nearly a year later, the General Authority for Border Protection granted official access to visitor data through Letter No. 2a/2518 [39]. All estimates in this study are based on that correspondence.

2.2. Field Research Expeditions

Since 2018, the research team has conducted annual expeditions to Altai Tavan Bogd National Park. Four main expeditions were carried out on the most commonly used tourist route. Table 1 summarizes the basic attributes of this route, including segment layout and elevation characteristics. During these field visits, driving times and speeds were recorded using GPS-based mobile apps, while road surface types, slopes, and obstacles were logged for each section. These data were used to assign terrain-based fuel adjustments.

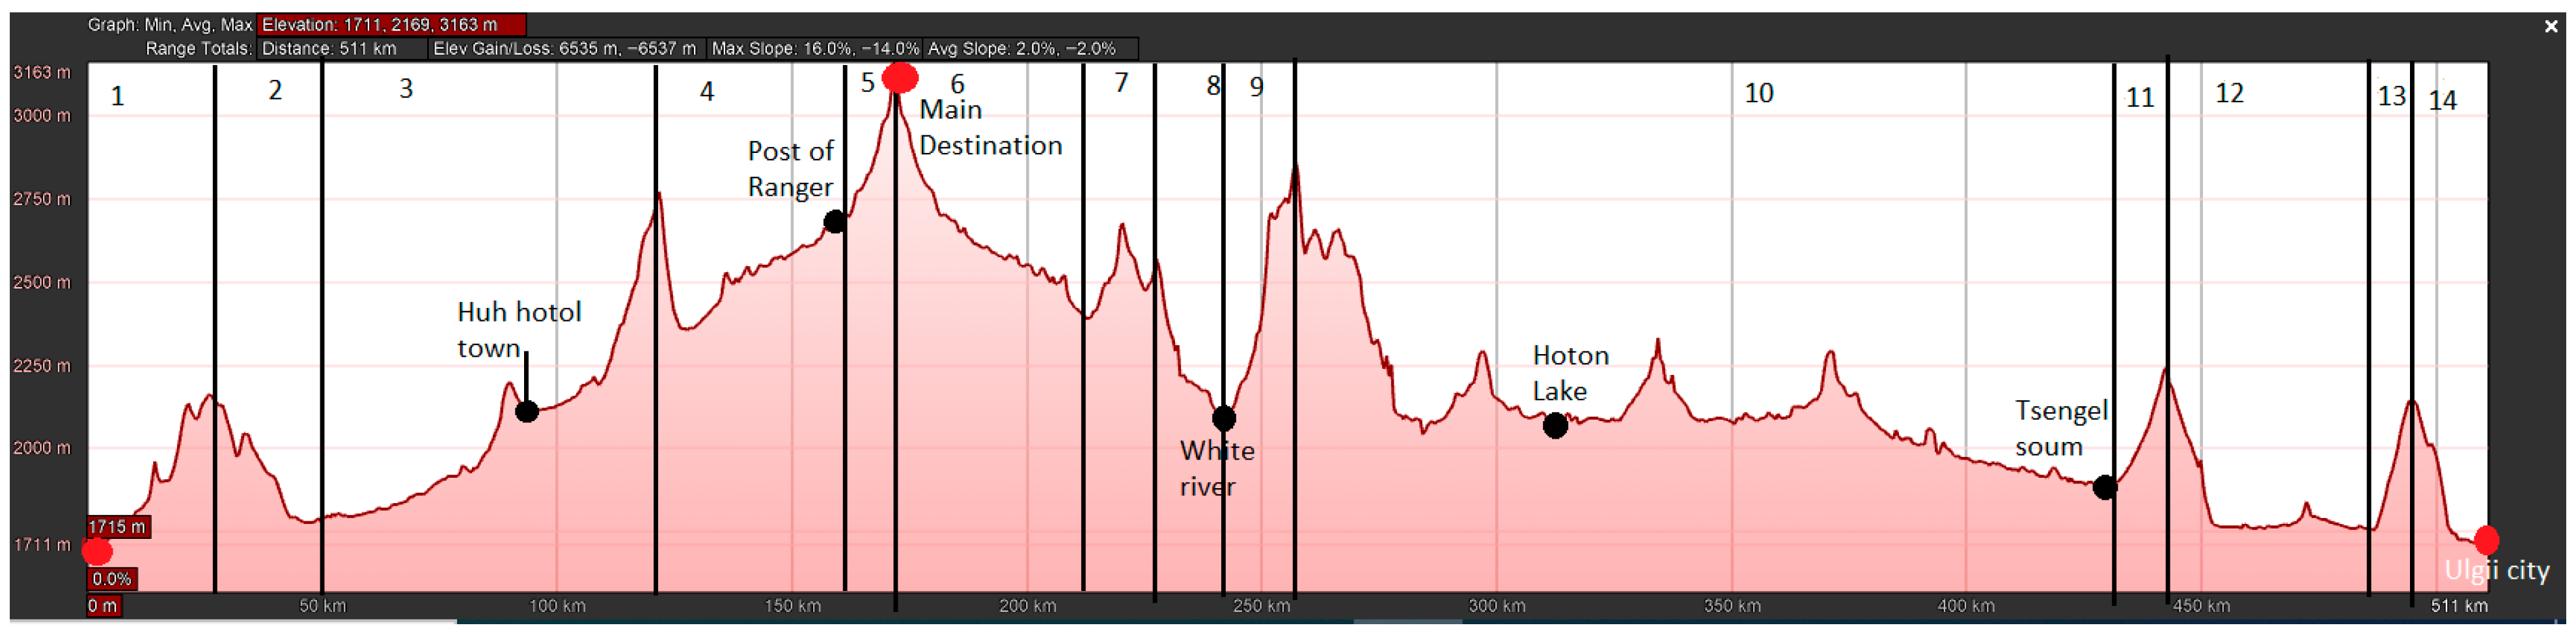
2.3. Route Segmentation and Elevation Profiling

The tourist route was divided into 14 sections according to changes in elevation and road conditions. Each section was marked as either uphill, downhill, or relatively flat. Speed and road surface quality were also considered. These divisions helped estimate how driving conditions affected fuel use and were the foundation for later adjustments in emissions calculations. Sections were visually assessed and grouped into flat, moderate, and steep categories, to which corresponding correction coefficients from Order No. 390 were assigned [40]. This order legislates the standardized fuel consumption norms per 100 km for vehicles across various regions of Mongolia. Due to climatic conditions and altitude in mountainous areas, any vehicle is expected to consume approximately 15% more fuel than the standard norm. Additionally, fuel consumption is adjusted upward by, for example, 5% in cases of rough or difficult road conditions. The annex of this law provides detailed standard norms for all types of vehicles by make and model, clearly specifying how these norms vary according to temperature, altitude, and vehicle types.

2.4. Vehicle Categories

Tourist vehicles entering the park between 2018 and 2024 were grouped into five types. The classification is based on engine size and the most common vehicles used during this period:
-
UAZ-3909 (44.5%);
-
UAZ-315108 (7.4%);
-
Medium-sized SUVs (44.1%, with 70% being the Toyota Land Cruiser 200);
-
Sedans (2.2–3.6 L), mostly Toyota Prius 30 (78%);
-
Large trucks, mostly ZIL-131.
These vehicles were selected as the standard types for the calculation of emissions.

2.5. Fuel Consumption Estimation

Fuel use was calculated based on the standard consumption per 100 km for each vehicle type. Adjustments were made depending on the condition of each route section, especially where the terrain was steep or rough. The adjustment percentages are based on Mongolia’s official road transport guideline, Order No. 390 (2019) [40]. In the roughest areas, fuel consumption increased by up to 25%. In downhill segments or smooth tracks, reductions of up to 5% were applied.

2.6. Methodology Development for Emission Estimation

Once route conditions and vehicle categories were determined, a localized methodology for emissions estimation was developed. This method combined field-measured travel data, terrain-based fuel correction factors, and segment-specific vehicle activity. It was specifically designed to address the lack of route and vehicle-specific emissions tools for Mongolia’s off-road, high-altitude regions. Although not explicitly labeled in Figure 1, this estimation logic occurs between route profiling and GHG computation and is a critical innovation of the study. The complete logic is summarized in Table 2.
This hybrid approach maintains Tier 1 emission factor compliance while achieving Tier 2-style disaggregation, making it suitable for remote, infrastructure-poor areas.

2.7. GHG Emissions Calculation

GHG emissions were estimated by applying Tier 1 emission factors from the 2006 IPCC Guidelines for National Greenhouse Gas Inventories and the U.S. EPA. These standardized factors convert fuel consumption into carbon dioxide (CO2), methane (CH4), and nitrous oxide (N2O) emissions based on fuel type:
-
Gasoline: 2.33969 kg CO2 per liter, CH4 = 0.38 g, N2O = 0.08 g;
-
Diesel: 2.70553 kg CO2 per liter.
These values were multiplied by the estimated total fuel consumption per vehicle category and route segment, as determined through the methodology described in Section 2.6. The resulting emissions were aggregated by gas type and vehicle class to obtain the total GHG footprint for the study area.
Although real-time GPS or onboard diagnostics data were unavailable for direct validation, the methodology’s robustness was considered through terrain-specific segmentation and correction factors established in Mongolia’s Order No. 390 [40]. Future sensitivity analyses using ±10–15% variation in key correction coefficients will help assess how such adjustments affect total emissions. These steps will support model validation as more detailed driving and fuel tracking data become accessible.

3. Results

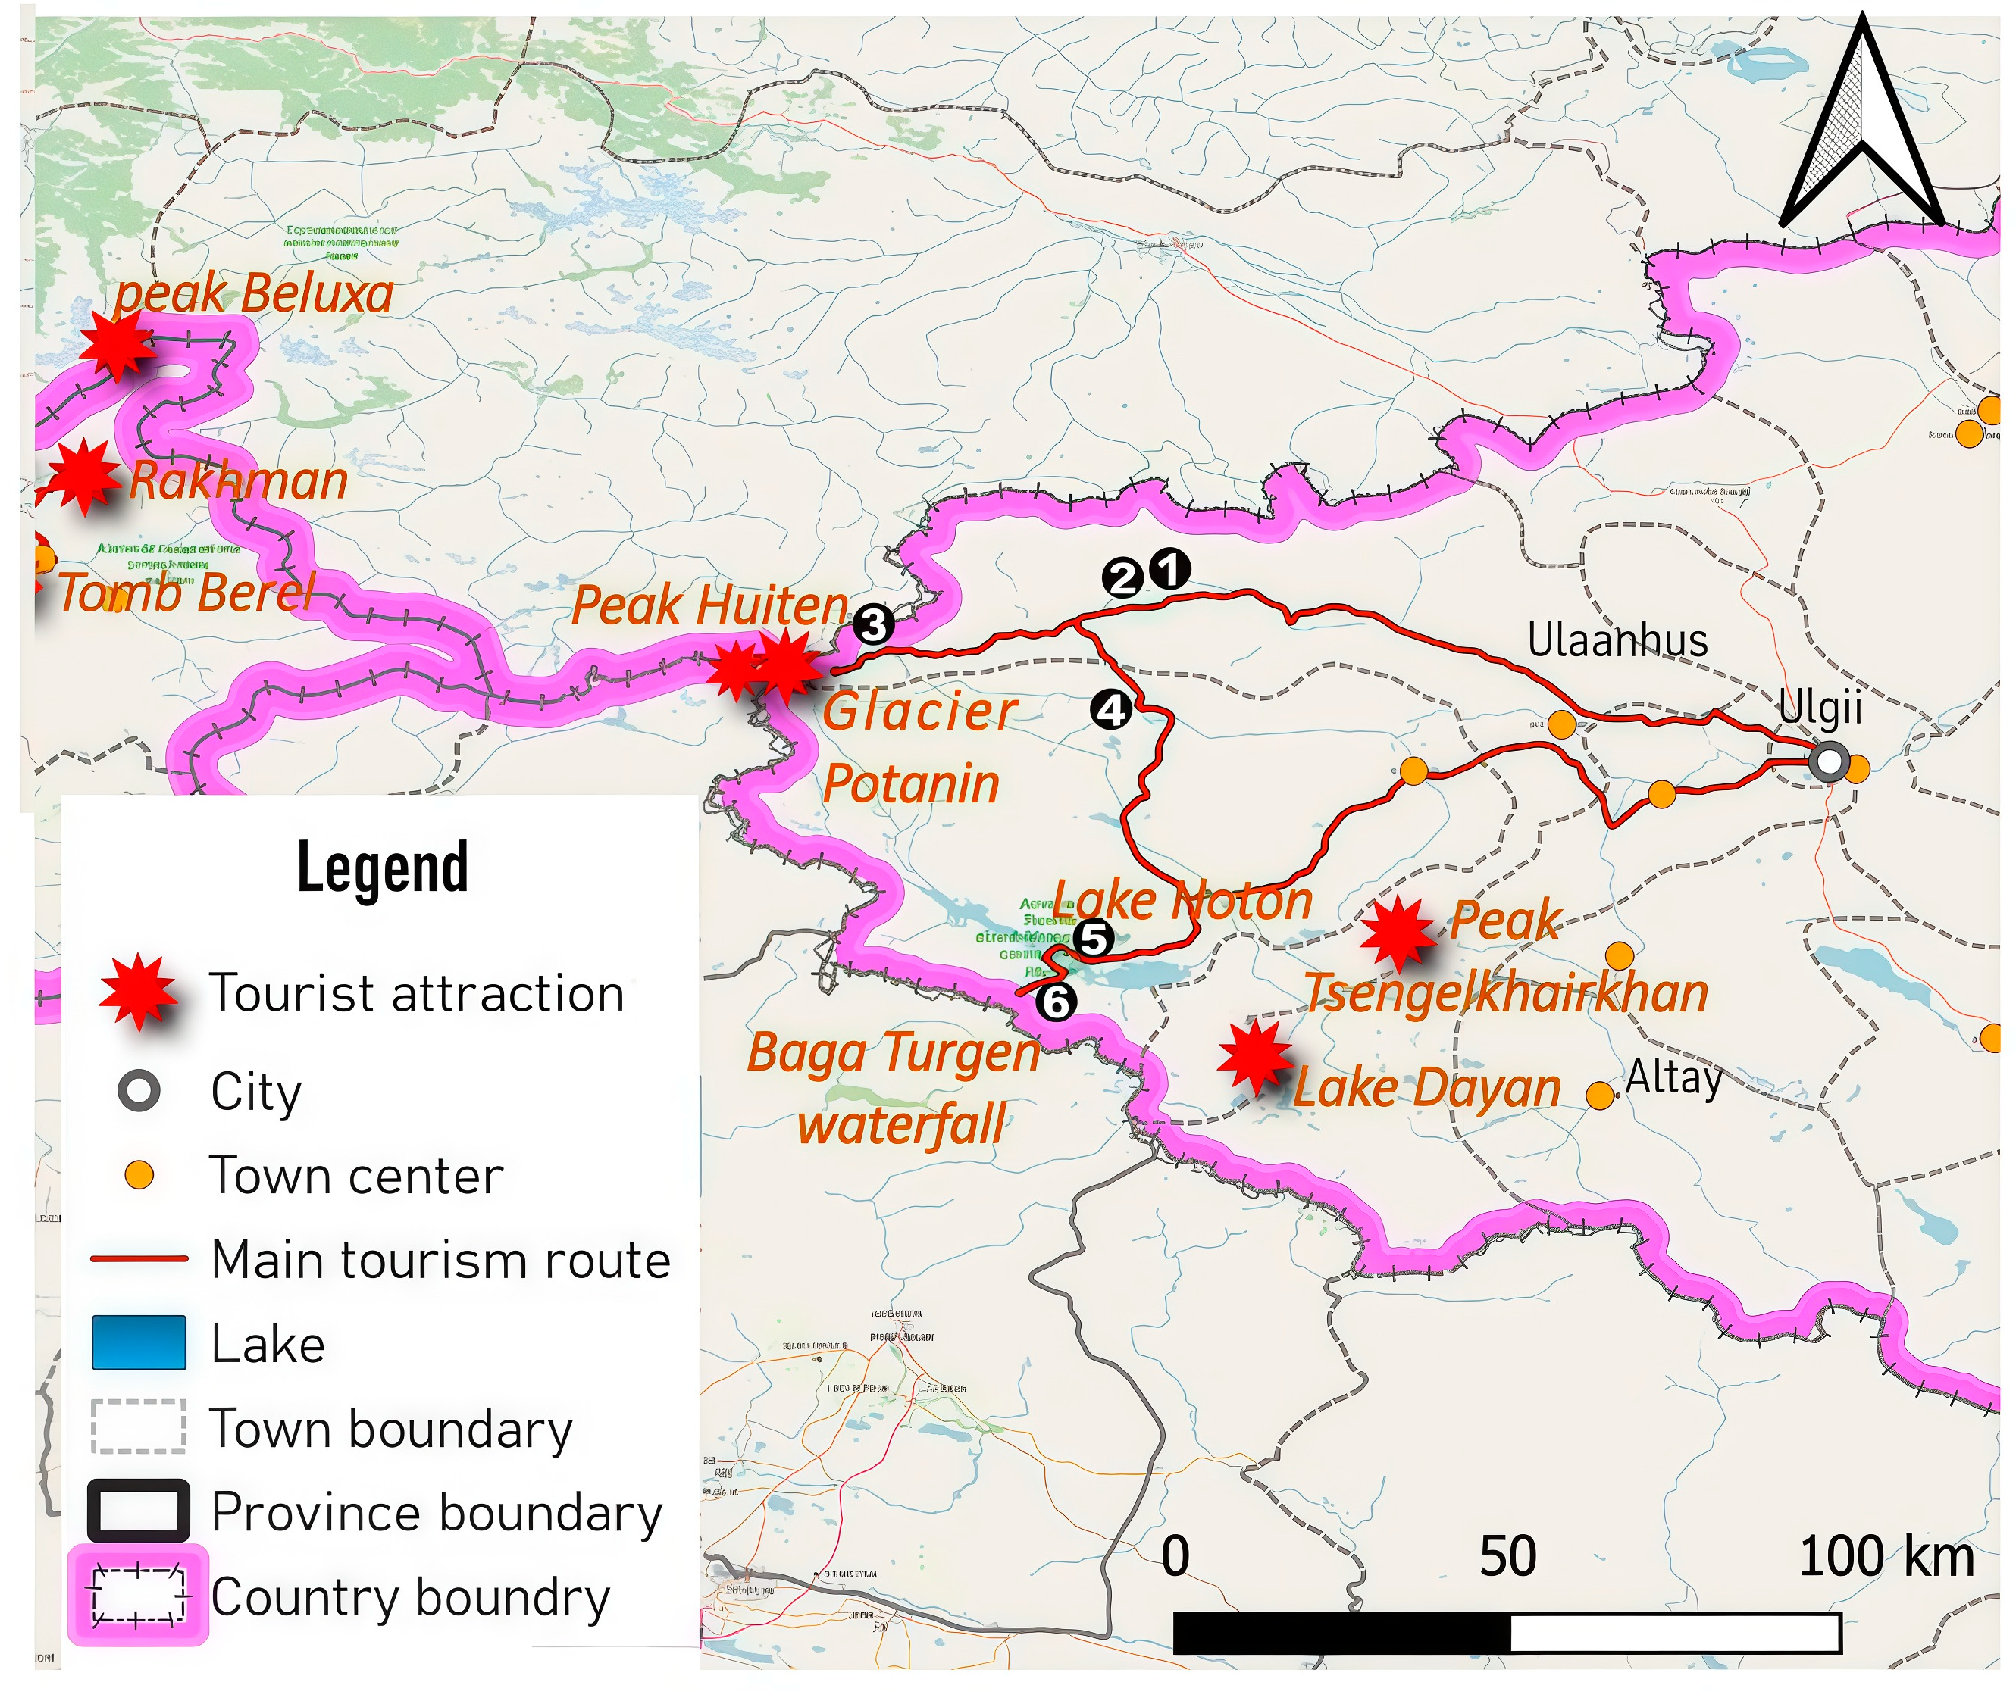
3.1. Tourism and Route Features in Altai Tavan Bogd National Park

This section presents the study’s results following the methodological steps outlined in Figure 1. It includes route segmentation, vehicle categorization, terrain-adjusted fuel consumption estimates, and GHG emissions analysis from 2018 to 2024.

3.2. Route Overview and Elevation Profile

The tourist route within Altai Tavan Bogd National Park was analyzed using data collected during expeditions in 2020, 2021, 2022, and 2023. The route spans 580 km and is unpaved, traversing rugged terrain, mountain passes, and river crossings.
Based on elevation, road surface quality, and vehicle speed changes, the route was divided into 14 distinct sections. Data on road slope, terrain type, and navigability were used to estimate fuel consumption adjustments ranging from −5% to +25% by Mongolia’s Road Transport Development Order No. 390 (2019).
Figure 2 presents a map of the main tourist route used in the analysis. While two shorter alternate routes also exist within the park, they do not provide access to key natural landmarks and thus were not included in this study. During the expedition, the route was recorded using GPS and subsequently processed in QGIS 3.28 to produce Figure 3. Locations where elevation changes were likely to influence vehicle speed were marked using GPS. A cross-sectional analysis of the main route was then performed, and based on the marked GPS points, the route was divided into 14 segments.
A general overview of the route is summarized in Table 1 (see Method Section), while detailed road characteristics and segment-level conditions—including elevation change, road type, and average travel speed—are presented in Table 3. An elevation profile of the entire route was generated and divided into 14 sections.
During the field expedition, vehicle speed and road roughness were measured for each section, including on the return trip, using direct observations and notes recorded on site. The assigned roughness scores were subsequently used to estimate the increased fuel consumption per segment. Among the segments, the most challenging is the 14 km stretch from the ranger’s post to the ‘President’s Hill’ worship site. Section 9 features the steepest ascent (51.7 m/km) but lacks washboard surfaces, while Section 10, covering 180 km from the pass to Baga Turgen, Hoton Lake, and Tsengel soum, presents difficulties due to steep inclines, ravines, and sharp turns on washboard roads.”

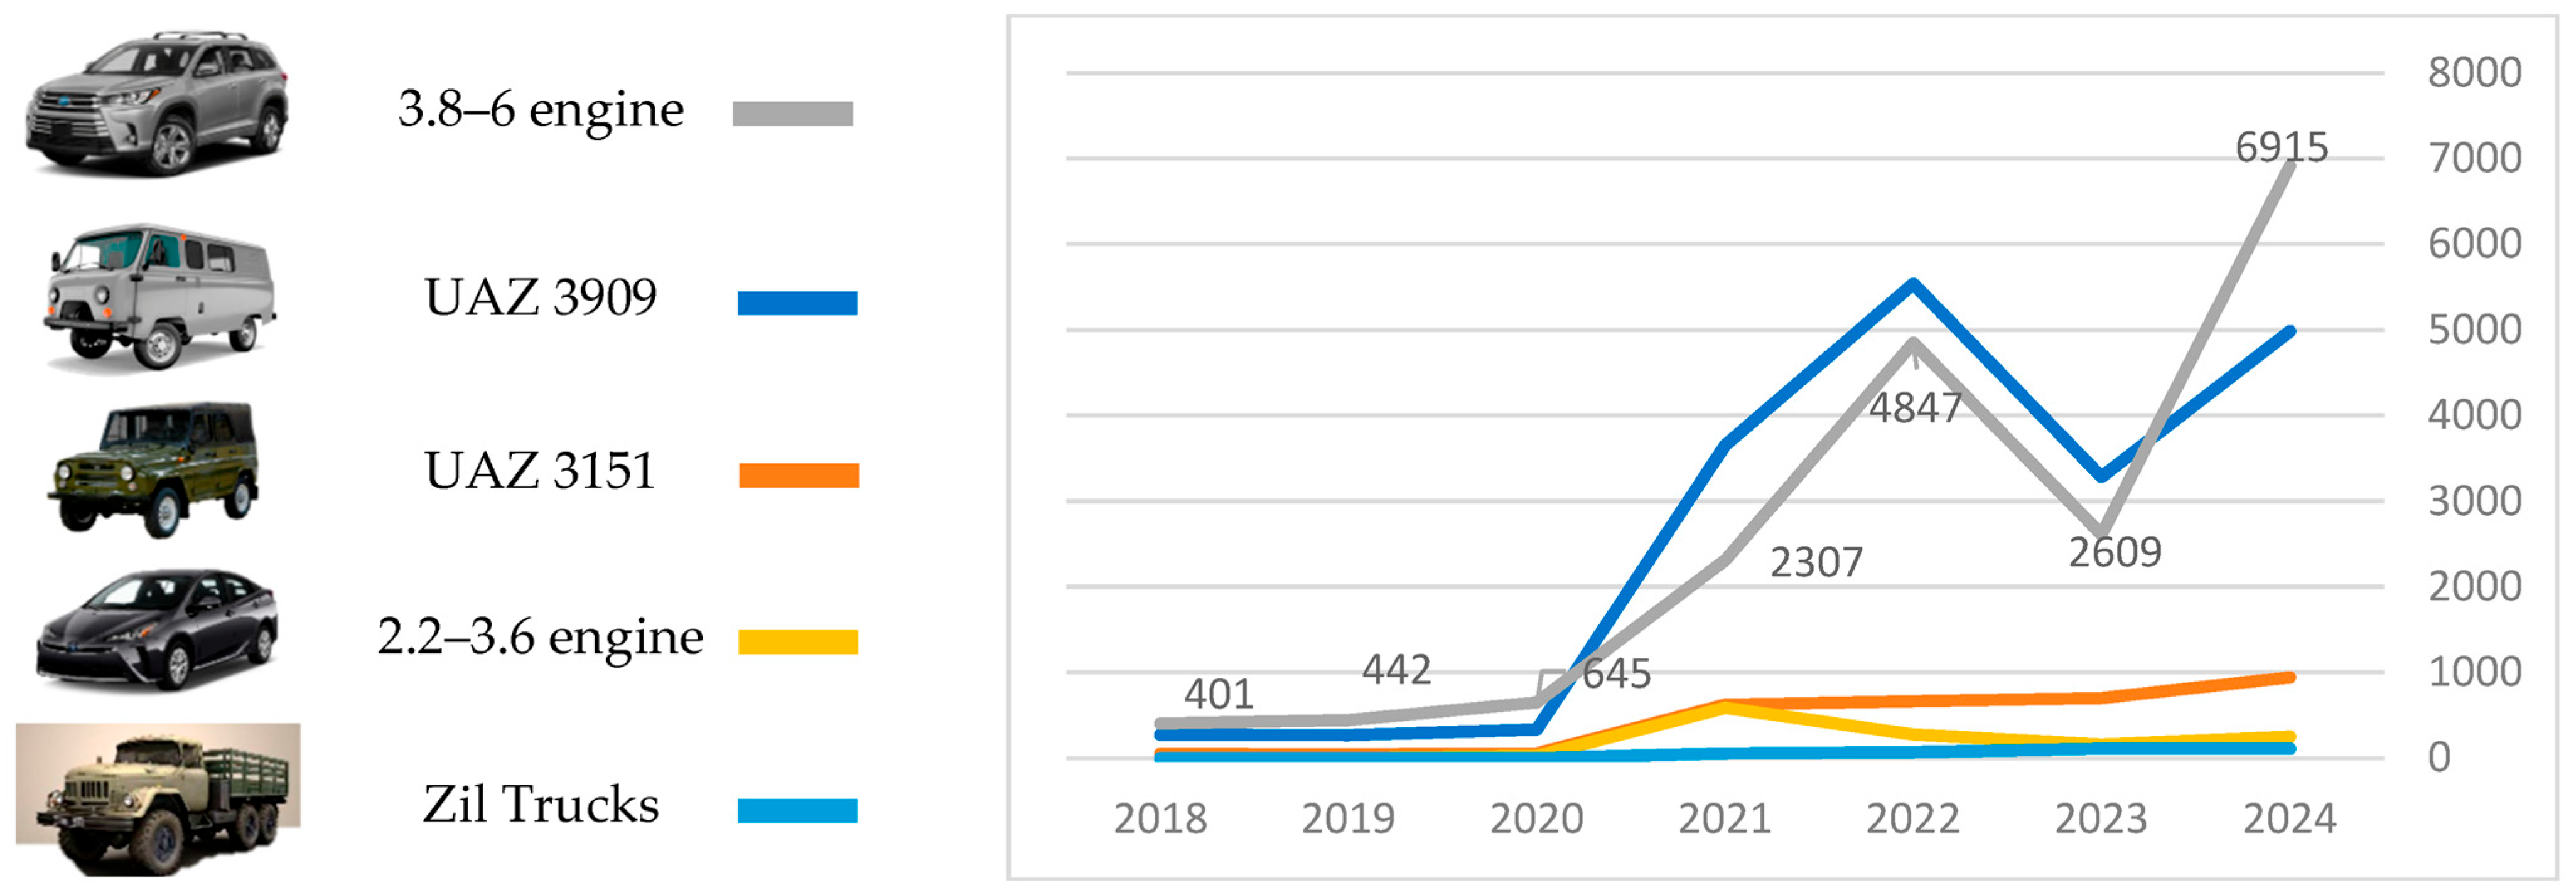
3.3. Vehicle Share and Type Distribution

Tourist vehicles entering Altai Tavan Bogd National Park were analyzed based on engine type and usage frequency across 2018–2024. In 2018, 712 vehicles entered the park. This number increased sharply, peaking at 13,192 in 2024, an 18.5-fold increase. As shown in Figure 4, vehicle entries were highly seasonal: 99.1% occurred between May and October, with peak traffic observed in July (45.2%) and August (32.7%).
This trend can be explained by the seasonal patterns of domestic tourism in Mongolia. The month of July coincides with the nationwide Naadam Festival, during which most citizens take an extended public holiday of 8 to 10 days—an ideal period for travel. In recent years, the study area has emerged as a popular destination among domestic tourists, resulting in a peak in visitor numbers during the warm months of July and August.
The vehicles were categorized into five groups based on engine capacity and usage:
-
UAZ-3909 vans—44.5%;
-
Medium-sized SUVs, primarily Land Cruiser 200—44.1% (reaching 6915 vehicles in 2022; 52.4% share that year);
-
UAZ-315108—7.4% (declining in recent years);
-
Sedans, mostly Toyota Prius (2.2–3.6 L)—~3.0%;
-
ZIL-131 trucks, typically used for supply transport—~1.0%.
Figure 5 presents the changing vehicle type distribution from 2018 to 2024, highlighting the rise in SUVs and the steady presence of UAZ models.
A polynomial regression analysis was conducted on annual data, revealing a time-dependent relationship in the change in the number of vehicles entering the park (R2 = 0.3394). Although the overall trend suggests a potential decline in the number of vehicles visiting the national park in the coming years, the seasonal pattern remains unchanged, with the majority of tourists continuing to arrive during the warmer months of July and August.

3.4. Fuel Consumption Estimations

Fuel consumption was estimated using representative values for each vehicle category, adjusted for terrain ruggedness based on the Mongolian Road Transport Development Order No. 390 (2019). The route-specific fuel use (per 580 km) was calculated using per-100 km fuel rates, then adjusted using coefficients ranging from +5% to +25%, depending on segment difficulty.
Before 2020, the route was primarily accessed by UAZ vehicles. From 2020 onward, sedans and ZIL-131 trucks were introduced, introducing both vehicle-type diversity and diesel fuel use to the area.
The estimated fuel use for the whole route was as follows:
-
Land Cruiser-200: 62.6 L (gasoline);
-
UAZ-3909: 68.5 L (gasoline);
-
UAZ-315108: 82.2 L (gasoline);
-
Prius 20: 26.1 L (gasoline);
-
ZIL-131 truck: 332.6 L (diesel).
-
Total fuel usage (2016–2022):
-
Gasoline: 2,886,493 L;
-
Diesel: 111,088 L.
Fuel use increased significantly after 2020, especially for SUVs and vans, peaking in 2024 with 913,416 L of gasoline. Diesel use reached its highest level in 2023 at 36,586 L, following the increased use of ZIL trucks. These totals reflect fuel consumption calculated for each vehicle type and year based on route-specific estimates and terrain adjustments.
Table 4 presents the detailed breakdown of fuel consumption by vehicle category, fuel type, and year, including route-level and annual values in liters and tons.

3.5. GHG Emissions from Fuel Use

GHG emissions were estimated using Tier 1 emission factors from the IPCC 2006 Guidelines and the U.S. EPA, applied to the fuel consumption values in Table 4. The factors used were as follows:
-
Gasoline: 2.33969 kg CO2 per liter;
-
Diesel: 2.70553 kg CO2 per liter.
Based on these coefficients, Figure 6 shows that annual CO2 emissions rose from 118.3 tons in 2018 to 2232.5 tons in 2024, reflecting the sharp increase in fuel use.
Emissions of CH4 and N2O were also estimated using Tier 1 values per liter of fuel. While smaller in volume, both gases have a higher global warming potential and are especially relevant in high-altitude, vegetation-poor regions like Altai Tavan Bogd.
-
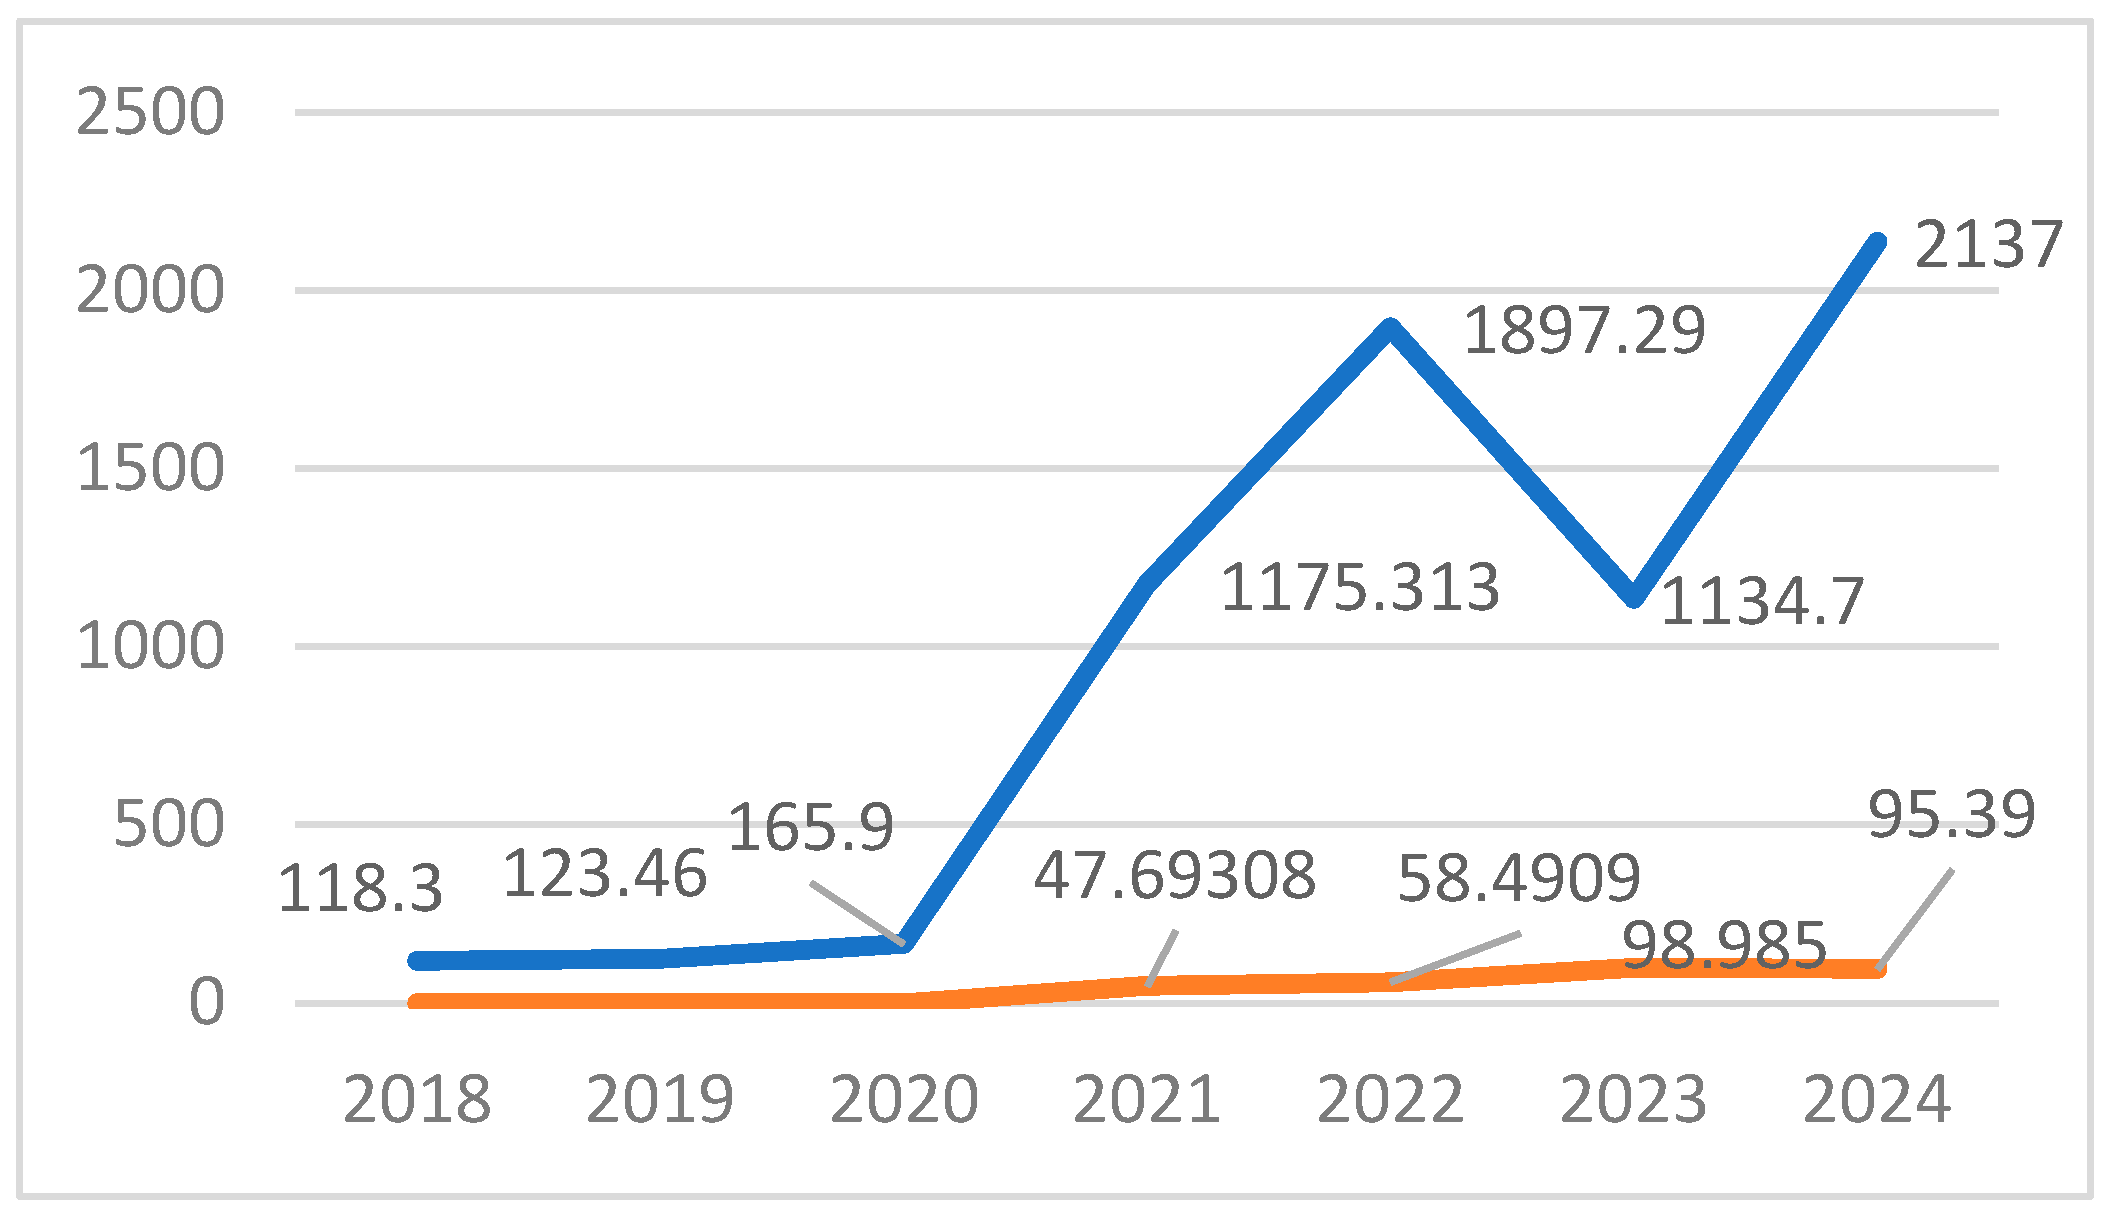
In 2024: CH4 = 43.5 kg (SUVs), 41.1 kg (UAZ-3909), and N2O = 20.0 kg.
-
Seven-year totals (2018–2024): CH4 = 300.9 kg and N2O = 45.75 kg.
These estimates are summarized in Table 5, which presents annual values of CH4 and N2O by gas type and year.

3.6. Summary of Key Environmental Findings

UAZ-3909 vans and medium-sized SUVs produced the most GHG emissions across the 580 km tourist route, especially the Toyota Land Cruiser 200. These vehicle types accounted for nearly 90% of all tourist traffic and had the highest fuel use per trip. Road slope, surface condition, and route segmentation were critical in shaping fuel use and emissions. Segments with steep gradients and washboard surfaces, particularly Sections 9 and 10 (Table 3), showed the highest fuel consumption and GHG output. These areas required prolonged engine load and experienced frequent idling due to rough conditions and narrow trails.
CH4 and N2O emissions, though smaller in volume than CO2, were more concentrated in remote, slow-driving zones. These gases carry greater global warming potential and are especially relevant in alpine regions with low natural absorption capacity.
These findings support the need for park-specific mitigation strategies such as the following:
-
Adjusting tourist transport policies to reduce reliance on high-consumption vehicles;
-
Introducing fuel or entry restrictions in the most emission-intensive segments;
-
Prioritizing infrastructure upgrades in steep or degraded road sections.
The results also provide a replicable model for other data-limited, high-altitude parks facing similar ecological and logistical constraints.
Although statistical trend testing was not applied, vehicle entries and estimated emissions showed a consistent year-on-year increase between 2018 and 2024. These patterns reflect the combined effects of post-pandemic tourism growth and increased use of high-consumption vehicle types. Future studies may quantify these trends’ strength and statistical significance using regression-based methods.

4. Discussion

This study presents a localized estimation of GHG emissions from tourist vehicles in Altai Tavan Bogd National Park, using actual vehicle entry data, route-specific road segmentation, and terrain-adjusted fuel consumption models. The results provide critical insight into how vehicle type, elevation, and surface conditions affect emission levels in remote, infrastructure-poor environments.

4.1. Significance of Findings

Fuel consumption along the 580 km route regularly exceeded national reference values, particularly in segments with steep gradients, rough surfaces, and swampy terrain. Sections 9 and 10 showed the highest adjusted fuel use and GHG output due to the terrain’s difficulty and prolonged engine load. This confirms the need for terrain-informed adjustment rather than flat, national fuel assumptions.
Emissions were strongly influenced by vehicle category. UAZ-3909 and Land Cruiser-200 types, which dominate the route, showed the highest fuel use per 100 km. In 2024, SUVs made up over 50% of all entries, marking a clear shift in tourist transport. While CO2 emissions accounted for the majority of total output, CH4 and N2O emissions, though smaller, are notable due to their high warming potential and the limited natural absorption capacity of alpine zones.
Although an attempt was made to calculate emissions per vehicle per kilometer during the study, it was observed that fuel consumption and emission levels varied significantly at each kilometer along the route. No consistent pattern was identified, except that fuel consumption and emission levels tended to increase with steeper gradients. Therefore, calculating greenhouse gas emissions based on the total fuel consumption over the entire route, rather than per kilometer, appears to provide a more accurate and reliable result.

4.2. Contributions and Methodological Value

This study applies a route-based estimation approach that aligns with Tier 2 of the IPCC 2006 Guidelines. The method was developed specifically for protected areas where real-time vehicle tracking and centralized emission records are unavailable. It relies on three core components:
-
Dividing the 580 km tourist route into sections based on slope, surface type, and elevation;
-
Applying fuel adjustment coefficients to each segment, using terrain characteristics and local travel conditions;
-
Estimating fuel use by vehicle category using official park entry records and observed vehicle shares.
The approach was developed using fieldwork conditions and local administrative data. It avoids dependency on satellite or real-time monitoring and can be applied to similar areas where detailed inventories or automated traffic records are not available.
The complete methodological process is described in the Methods section, where each step is laid out for replication.

4.3. Methodological Innovation

The method represents a novel adaptation of IPCC Tier 1 practices, applying them to a terrain-segmented framework without requiring GPS logs or vehicle diagnostics. This modular, field-calibrated approach supports accurate emissions estimation in similarly remote or under-monitored parks globally.

4.4. Theoretical Contribution

This study also makes a theoretical contribution by showing that Tier 1 emission factors, typically used for national-scale inventories, can be adapted for spatially specific emissions modeling using field-based segmentation and vehicle entry data. This demonstrates that emissions estimates can be geographically disaggregated and locally tailored even without high-resolution monitoring, filling a conceptual gap between basic and advanced emissions modeling frameworks.

4.5. Policy Recommendations

For example, based on segment-specific capacity, the park may consider setting seasonal entry limits of 100–120 vehicles per day during peak months (July–August). In addition, the ZIL-131 trucks, using more than 330 L per trip, could be restricted from Sections 9 and 10 due to their high emissions intensity.

4.6. Implications and Applications

The findings support several policy and operational measures:
-
Introducing vehicle limits or fuel restrictions on high-impact;
-
Prioritizing infrastructure upgrades or rerouting in swampy or steep areas;
-
Adjusting tourism transport guidelines to reduce the dominance of high-consumption vehicles;
-
Incorporating terrain-adjusted emission coefficients into national inventories for remote parks.
Given the modular nature of the method, it can be adapted for use in other remote or high-altitude protected areas globally, such as in the Andes, Central Asian mountain ranges, or Sub-Saharan desert parks, by adjusting emission factors and terrain-specific coefficients.
While no directly comparable studies using terrain-segmented Tier 1 methods were identified in the Andes or Tibetan Plateau. But there are similar methodological challenges, and modeling approaches have been documented in other mountainous and remote tourism regions. For instance, in an Alpine setting (Alpbach, Austria), a GIS-based, segment-level estimation of tourist transport emissions was used to derive detailed CO2 patterns associated with slope and route variability [41]. A model developed for the Geiranger Fjord (Norway) also incorporated segment-specific transport emissions and policy scenario simulations to address tourism-driven congestion in a remote heritage site [42]. In southern Africa, an assessment of vehicle-based emissions in national parks demonstrated how vehicle categorization and odometer-based data can inform sustainable park management policies [43]. In comparison, our terrain-adjusted, segment-based Tier 1 methodology provides a modular and adaptable framework that is particularly suitable for high-altitude, infrastructure-poor environments. These parallels underscore the universal applicability and transferability of our model across diverse mountain-based protected areas. The model fills a methodological gap by offering a practical tool for spatial GHG analysis in under-monitored mountain parks lacking telemetry or satellite tracking systems.
Moreover, the proposed methodology is designed to be modular and adaptable, allowing it to integrate various emission factor sets beyond the Tier 1 IPCC defaults. Depending on the availability of data and national reporting standards, the model can incorporate more detailed Tier 2 or Tier 3 emission factors from country-specific inventories, the European Monitoring and Evaluation Program (EMEP), or the United States Environmental Protection Agency (EPA). This flexibility enhances the method’s relevance across diverse regulatory and geographical contexts, enabling its application in regions with established emission databases as well as in areas where only basic estimations are possible.

4.7. Limitations and Future Work

Due to the lack of onboard diagnostics or real-time tracking, fuel use was estimated using national average values corrected for terrain. This approach does not capture variability in driver behavior, vehicle load, or seasonal effects. Vehicle entry data were based on administrative records, which may contain reporting gaps.
Future research could address these limitations by
-
Conducting sensitivity analyses with ±10–15% variation in key assumptions;
-
Comparing modeled fuel use with GPS-based vehicle data, if available;
-
Integrating seasonal and behavioral variability into correction factors.
Despite these constraints, the method provides a practical and transferable solution for estimating GHG emissions in protected areas where conventional tools are not applicable.

5. Conclusions

This study estimated GHG emissions from tourist vehicles traveling the primary route in Altai Tavan Bogd National Park using a route-segmented, terrain-adjusted modeling approach tailored to local topography and infrastructure constraints.
The 580 km route consists entirely of dirt and off-road segments, with elevation ranging from 1711 to 3164 m above sea level. Average fuel use along the route was about 15% higher than national standards due to road slope and surface conditions. In some parts, elevation increased by more than 51 m per kilometer, and muddy or uneven terrain caused further increases in fuel use and emissions.
Vehicle entry records from the General Authority for Border Protection were grouped by engine type and model. From 2018 to 2024, the number of vehicles increased quickly, from 719 in 2018 to 13,192 in 2024, with daily peaks reaching 150–160 vehicles. Among these, 44.5% were UAZ-3909 vans, and 44.1% were medium-sized SUVs.
Over the seven years, tourist vehicles consumed approximately 2.89 million liters (2164 tons) of gasoline and 111,000 L (83.3 tons) of diesel. This fuel use resulted in estimated emissions of 300.9 kg of CH4 and 45.75 kg of N2O. Annual CO2 emissions increased from 118.7 tons in 2018 to 2239 tons in 2024.
This study provides the first detailed calculation of GHG emissions from tourist transport in a Mongolian national park. The results show that using international methods such as IPCC 2006 and EPA factors without adjusting for local road and driving conditions may give lower or inaccurate results. Using real entry data, slope values, and regional fuel adjustments gives more reliable results in mountainous areas with no paved roads and no complete vehicle registration system.
The method used in this study matches Tier 2 IPCC Guidelines and can be applied in other protected areas that have similar data limitations. It offers a practical and transferable tool for improving GHG inventories and supporting low-carbon tourism planning in under-monitored environments.

Author Contributions

Conceptualization, Y.B. and O.D.; methodology, Y.B.; software, O.D.; validation, Y.B., Y.D., B.K., G.O., A.S., A.Z. and O.D.; formal analysis, Y.B., Y.D., B.K., A.Z. and O.D.; investigation, Y.B.; resources, Y.B., Y.D., A.Z. and O.D.; data curation, O.D.; writing—original draft preparation, Y.B. and O.D.; writing—review and editing, Y.B., Y.D., B.K., G.O., A.S., A.Z. and O.D.; visualization, Y.B. and O.D.; supervision, B.K. and O.D.; project administration, Y.B. All authors have read and agreed to the published version of the manuscript.

Funding

This research received no external funding.

Institutional Review Board Statement

Not applicable.

Informed Consent Statement

Not applicable.

Data Availability Statement

The original contributions presented in this study are included in the article. Further inquiries can be directed to the corresponding author.

Conflicts of Interest

The authors declare no conflicts of interest.

Abbreviations

The following abbreviations are used in this manuscript:
GHGGreenhouse Gas
FECFuel and Emissions Calculator
BEVsBattery Electric Vehicles
FCVsFuel Cell Vehicles
NGVsNatural Gas Vehicles
SUVsSport Utility Vehicle

References

  1. Konečný, V.; Zuzaniak, M.; Jonasíková, D. Greenhouse Gas Emissions from Road Transport and Their Economic Value in the Assessment of Transport Projects Using a Cost–Benefit Analysis: Approaches Implemented in the Slovak Republic and Selected Central European Countries. Appl. Sci. 2025, 15, 1283. [Google Scholar] [CrossRef]
  2. Chocholac, J.; Hruska, R.; Machalik, S.; Sommerauerova, D.; Sohajek, P. Framework for Greenhouse Gas Emissions Calculations in the Context of Road Freight Transport for the Automotive Industry. Sustainability 2021, 13, 4068. [Google Scholar] [CrossRef]
  3. Solaymani, S.; Botero, J. Reducing Carbon Emissions from Transport Sector: Experience and Policy Design Considerations. Sustainability 2025, 17, 3762. [Google Scholar] [CrossRef]
  4. Yessimova, D.; Faurat, A.; Belyi, A.; Yessim, A.; Sadykov, Z. Environmental Sustainability and Carbon Footprint of Tourism: A Study of a Natural Park in Northeastern Kazakhstan. Sustainability 2025, 17, 1723. [Google Scholar] [CrossRef]
  5. Susanty, A.; Puspitasari, N.B.; Saptadi, S.; Siregar, S.D. Using system dynamics approach to build policy scenario for reducing CO2; emission resulted from tourism travel to Karimunjawa. Emerald Insides 2021, 50, 1277–1302. [Google Scholar] [CrossRef]
  6. Baysan, S. The attitudes of tourism establishments toward the development of tourism and toward tourism’s impact on the environment in Ören (Milas), Türkiye. In Natural Environment and Culture in the Mediterranean Culture; Cambridge Scholars Publishing: Newcastle upon Tyne, UK, 2008; Available online: https://www.researchgate.net/publication/364315777_The_attitudes_of_toursim_establishments_toward_the_development_of_tourism_and_toward_tourism’s_impact_on_the_environment_in_Oren_Milas_Turkiye (accessed on 23 May 2025).
  7. Belsoy, J.; Korir, J.; Yego, J. Environmental impacts of tourism in protected areas. J. Environ. Earth Sci. 2012, 2, 64–73. [Google Scholar]
  8. Charlie, T.C.; Sawina, J.P. The Carbon Footprint of Tourist Transportation in Gettysburg National Military Park; Student Publications, Gettysburg College: Gettysburg, PA, USA, 2023; Available online: https://cupola.gettysburg.edu/student_scholarship/1103 (accessed on 23 May 2025).
  9. Gara, V.; Tarnay, L.; Campbell, E.; Gabarrell, X. A life-cycle carbon footprint of Yosemite National Park. Energy Policy 2013, 62, 1336–1343. [Google Scholar] [CrossRef]
  10. Giampiero, G.; Vitali, A.; Bernabucci, U.; Lacetera, N.; Nardone, A. Greenhouse Gas Emissions and Carbon Sinks of an Italian Natural Park. Front. Environ. Sci. 2021, 9, 706880. [Google Scholar] [CrossRef]
  11. Godwell, N.; Dube, K.; Chapungua, L.; Chikodzi, D. Quest for NetZero emissions in South African national parks: A tourism perspective. Heliyon 2023, 9, e16410. [Google Scholar] [CrossRef] [PubMed]
  12. Yembuu, B. The Physical Geography of Mongolia; Springer: Cham, Switzerland, 2021; Available online: https://link.springer.com/book/10.1007/978-3-030-61434-8 (accessed on 22 June 2025).
  13. Parliament of Mongolia. Concept of Sustainable Development of Mongolia–2030. No. 19 of 2016; Ulaanbaatar. Available online: https://legalinfo.mn/mn/detail?lawId=207105&showType=1 (accessed on 23 May 2025).
  14. Parliament of Mongolia. “Vision-2050” Long Term Development Policy of Mongolia; No. 52 of 2020; Great Khural of Mongolia: Ulaanbaatar, Mongolia, 2020. Available online: https://www.vision2050.gov.mn/ (accessed on 23 May 2025).
  15. UNDP (United Nations Development Programme); MNR (Ministry of Natural Resources of the Russian Federation). Biodiversity Conservation in the Russian Portion of the Altai-Sayan Ecoregion; UNDP MNR of the Russian Federation: Moscow, Russia, 2011. [Google Scholar]
  16. Chlachula, J.; Zhensikbayeva, N.Z.; Yegorina, A.V.; Kabdrakhmanova, N.K.; Czerniawska, J.; Kumarbekuly, S. Territorial assessment of the East Kazakhstan geo/ecotourism: Sustainable travel prospects in the Southern Altai area. Geosciences 2021, 11, 156. [Google Scholar] [CrossRef]
  17. IPCC (Intergovernmental Panel on Climate Change). 2006 IPCC Guidelines for National Greenhouse Gas Inventories, Chapter 3, Mobile Combustion. Available online: https://www.ipcc-nggip.iges.or.jp/public/2006gl/pdf/2_Volume2/V2_3_Ch3_Mobile_Combustion.pdf (accessed on 23 May 2025).
  18. Eggleston, S.; Michael, W. Good Practice Guidance and Uncertainty Management in National Greenhouse Gas Inventories. IPCC. 2006. Available online: https://www.ipcc-nggip.iges.or.jp/public/gp/bgp/2_3_Road_Transport.pdf (accessed on 23 May 2025).
  19. USEPA (U.S. Environmental Protection Agency). Greenhouse Gas Emissions from a Typical Passenger Vehicle. 2011. Available online: https://www.epa.gov/greenvehicles/greenhouse-gas-emissions-typical-passenger-vehicle (accessed on 23 May 2025).
  20. ICCT (International Council on Clean Transportation). Calculating Electric Drive Vehicle Greenhouse Gas Emissions; ICCT: Washington, DC, USA, 2012; Available online: https://theicct.org/sites/default/files/publications/ICCT_CalculatingEdriveGHG_082012.pdf (accessed on 23 May 2025).
  21. Xu, X.; Xu, Y.; Zhao, Y.; Liu, H.; Cheng, H.; Rodgers, M.O.; Guensler, R. Fuel and Emissions Calculator (FEC) Version 2.0. Available online: https://escholarship.org/uc/item/4qg1s2jq (accessed on 23 May 2025).
  22. Graham, L.A.; Rideout, G.; Rosenblatt, D.; Hendren, J. Greenhouse gas emissions from heavy-duty vehicles. Atmos. Environ. 2008, 42, 4665–4681. [Google Scholar] [CrossRef]
  23. Nealer, R.; Nealer, R.; Hendrickson, T.P. Review of Recent Lifecycle Assessments of Energy and Greenhouse Gas Emissions for Electric Vehicles. Transportation 2015, 2, 66–73. [Google Scholar] [CrossRef]
  24. Ellingsen, L.A.W.; Singh, B.; Strømman, A.H. The size and range effect: Lifecycle greenhouse gas emissions of electric vehicles. Environ. Res. Lett. 2016, 11, 54010. [Google Scholar] [CrossRef]
  25. Akihiro, W.; Leaver, J.; Ishida, H.; Shafiei, E. Impact of low emissions vehicles on reducing greenhouse gas emissions in Japan. Energy Policy 2019, 130, 227–242. [Google Scholar] [CrossRef]
  26. Li, W.; Wang, M.; Cheng, X.; Cui, K.; Li, Q.; Chen, S. Travel intensity of private electric vehicles and implications for GHG emission reduction in China. Environ. Impact Assess. Rev. 2025, 112, 107770. [Google Scholar] [CrossRef]
  27. Ehsani, M.; Ahmadi, A.; Fadai, D. Modeling of vehicle fuel consumption and carbon dioxide emission in road transport. Renew. Sustain. Energy Rev. 2016, 53, 1638–1648. [Google Scholar] [CrossRef]
  28. Tsokolis, D.; Tsiakmakis, S.; Dimaratos, A.; Fontaras, G.; Pistikopoulos, P.; Ciuffo, B.; Samaras, Z. Fuel consumption and CO2 emissions of passenger cars over the New Worldwide Harmonized Test Protocol. Appl. Energy 2016, 179, 1152–1165. [Google Scholar] [CrossRef]
  29. Burgess, S.C.; Choi, J.M.J. A parametric study of the energy demands of car transportation: A case study of two competing commuter routes in the UK. Transp. Res. Part D Transp. Environ. 2003, 8, 21–36. [Google Scholar] [CrossRef]
  30. Pérez-Martínez, P.J.; Ming, D.; Dell’Asin, G.; Monzón , A. Evaluation of the influence of toll systems on energy consumption and CO2 emissions: A case study of a Spanish highway. J. King Saud Univ. Sci. 2011, 23, 301–310. [Google Scholar] [CrossRef]
  31. Hayashi, Y.; Kato, H. A model system for the assessment of the effects of car and fuel green taxes on CO2 emission. Transp. Res. Part D Transp. Environ. 2001, 6, 123–139. [Google Scholar] [CrossRef]
  32. Peeters, P.; Szimba, E.; Duijnisveld, M. Major environmental impacts of European tourist transport. J. Transp. Geogr. 2007, 15, 83–93. [Google Scholar] [CrossRef]
  33. Becken, S.; Simmons, D.G.; Frampton, C. Energy use associated with different travel choices. Tour. Manag. 2003, 24, 267–277. [Google Scholar] [CrossRef]
  34. Guo, S.; He, P.; Bayaraa, M.; Li, J. Greenhouse gas emissions embodied in the Mongolian economy and their driving forces. Sci. Total Environ. 2020, 714, 136378. [Google Scholar] [CrossRef] [PubMed]
  35. Namkhainyam, T.; Ovgor, B.; Jargal, D.; Malley, C. Modelling long-term greenhouse gas mitigation pathways for Mongolia. Environ. Res. Commun. 2024, 6, 125010. [Google Scholar] [CrossRef]
  36. Namkhainyam, B.; Tsolmon, N. Improvement of estimates of GHG emissions from mobile sources in Mongolia. In Proceedings of the 2008 Third International Forum on Strategic Technologies, Novosibirsk, Russia, 23–29 June 2008; pp. 542–544. [Google Scholar] [CrossRef]
  37. Yerbakhyt, B.; Onerkhan, G.; Kapsalyamov, B.A.; Saspugayeva, G.Y.; Durmekbayeva, S.N. Damage of Soil Cover Due to the Impact of Tourism in the Altai Mountains. Eurasian J. Ecol. 2022, 73, 37–49. [Google Scholar] [CrossRef]
  38. Yerbakhyt, B.; Kapsalyamov, B.A.; Yusupova, Z.B. Heavy metal pollution from tourism in the Altai Mountains. NNC RK Bull. 2022, 1, 15–24. [Google Scholar] [CrossRef]
  39. Mongolian Border Department. Monthly Report of Border Zone, Report of Tourist, Transport to Travel to the Border Altai Besbogda Nature Reserve; By letter. No 2a/2518 of 12 December 2022; Mongolian Border Department: Ulaanbaatar city, Mongolia, 2022.
  40. Order of the Minister of Transport Development of Mongolia. Standard Norm of Fuel Consumption for a 100 km Run per Car. Mongolian Unified Legal Information System. 2019. Available online: https://legalinfo.mn/mn/detail/14976 (accessed on 23 May 2025).
  41. Unger, R.; Abegg, B.; Mailer, M.; Stampfl, P. Energy consumption and greenhouse gas emissions resulting from tourism travel in an alpine setting. Mt. Res. Dev. 2016, 36, 475–483. [Google Scholar] [CrossRef]
  42. Babri, S.; Díez-Gutiérrez, M.; Aspen, D.M.; Johansen, B.H. A simulation model to assess emission reduction policies in tourism transport: Case study of the Geiranger fjord UNESCO world heritage site in Norway. Int. J. Sustain. Transp. 2023, 17, 1006–1019. [Google Scholar] [CrossRef]
  43. Phophe, P.A.; Masubelele, M.L. Carbon footprint assessment in nature-based conservation management estates using South African national parks as a case study. Sustainability 2021, 13, 13969. [Google Scholar] [CrossRef]
Figure 1. Stepwise structure of the emissions estimation model, showing input parameters, correction factors, and output GHG values. (Note: Though not labeled in the diagram, the emissions estimation step occurred between route analysis and GHG calculation. It combined field-based data, terrain-based fuel correction, and vehicle categorization).
Sustainability 17 06702 g001
Figure 2. Map of the selected tourist route in Altai Tavan Bogd National Park.
Sustainability 17 06702 g002
Figure 3. Elevation profile of the 580 km route, segmented into 14 sections based on slope and terrain.
Sustainability 17 06702 g003
Figure 4. Seasonal distribution of tourist vehicle entries to Altai Tavan Bogd National Park (2018–2024).
Sustainability 17 06702 g004
Figure 5. Distribution of tourist vehicles by type from 2018 to 2024.
Sustainability 17 06702 g005
Figure 6. Annual GHG emissions (tons) from gasoline and diesel vehicles (2018–2024).
Sustainability 17 06702 g006
Table 1. Basic attributes of the Altai Tavan Bogd tourist route.
IndicatorAltai Tavan Bogd Route
ReasonA popular domestic tourism route since 2021
LocationWestern Mongolia, Bayan-Ulgii Province
Route and DestinationsUlgii → Khokhhotol → Tavanbogd Peak → Potanin Glacier → Hoton-Hurgan Lakes → Baga Turgen Waterfall → Tsengel soum → Ulgii
Route Length580 km
Typical Duration3–4 days
Road TypeUnpaved, bumpy roads; accessible only by high-engine or UAZ vehicles;
reaches elevations up to 3200 m
Route TypeNature sightseeing; cultural pilgrimage to the Tavanbogd peaks
Main AttractionsKhüiten Peak (highest in Mongolia), Potanin Glacier, Hoton-Hurgan Lakes, Baga Turgen Waterfall
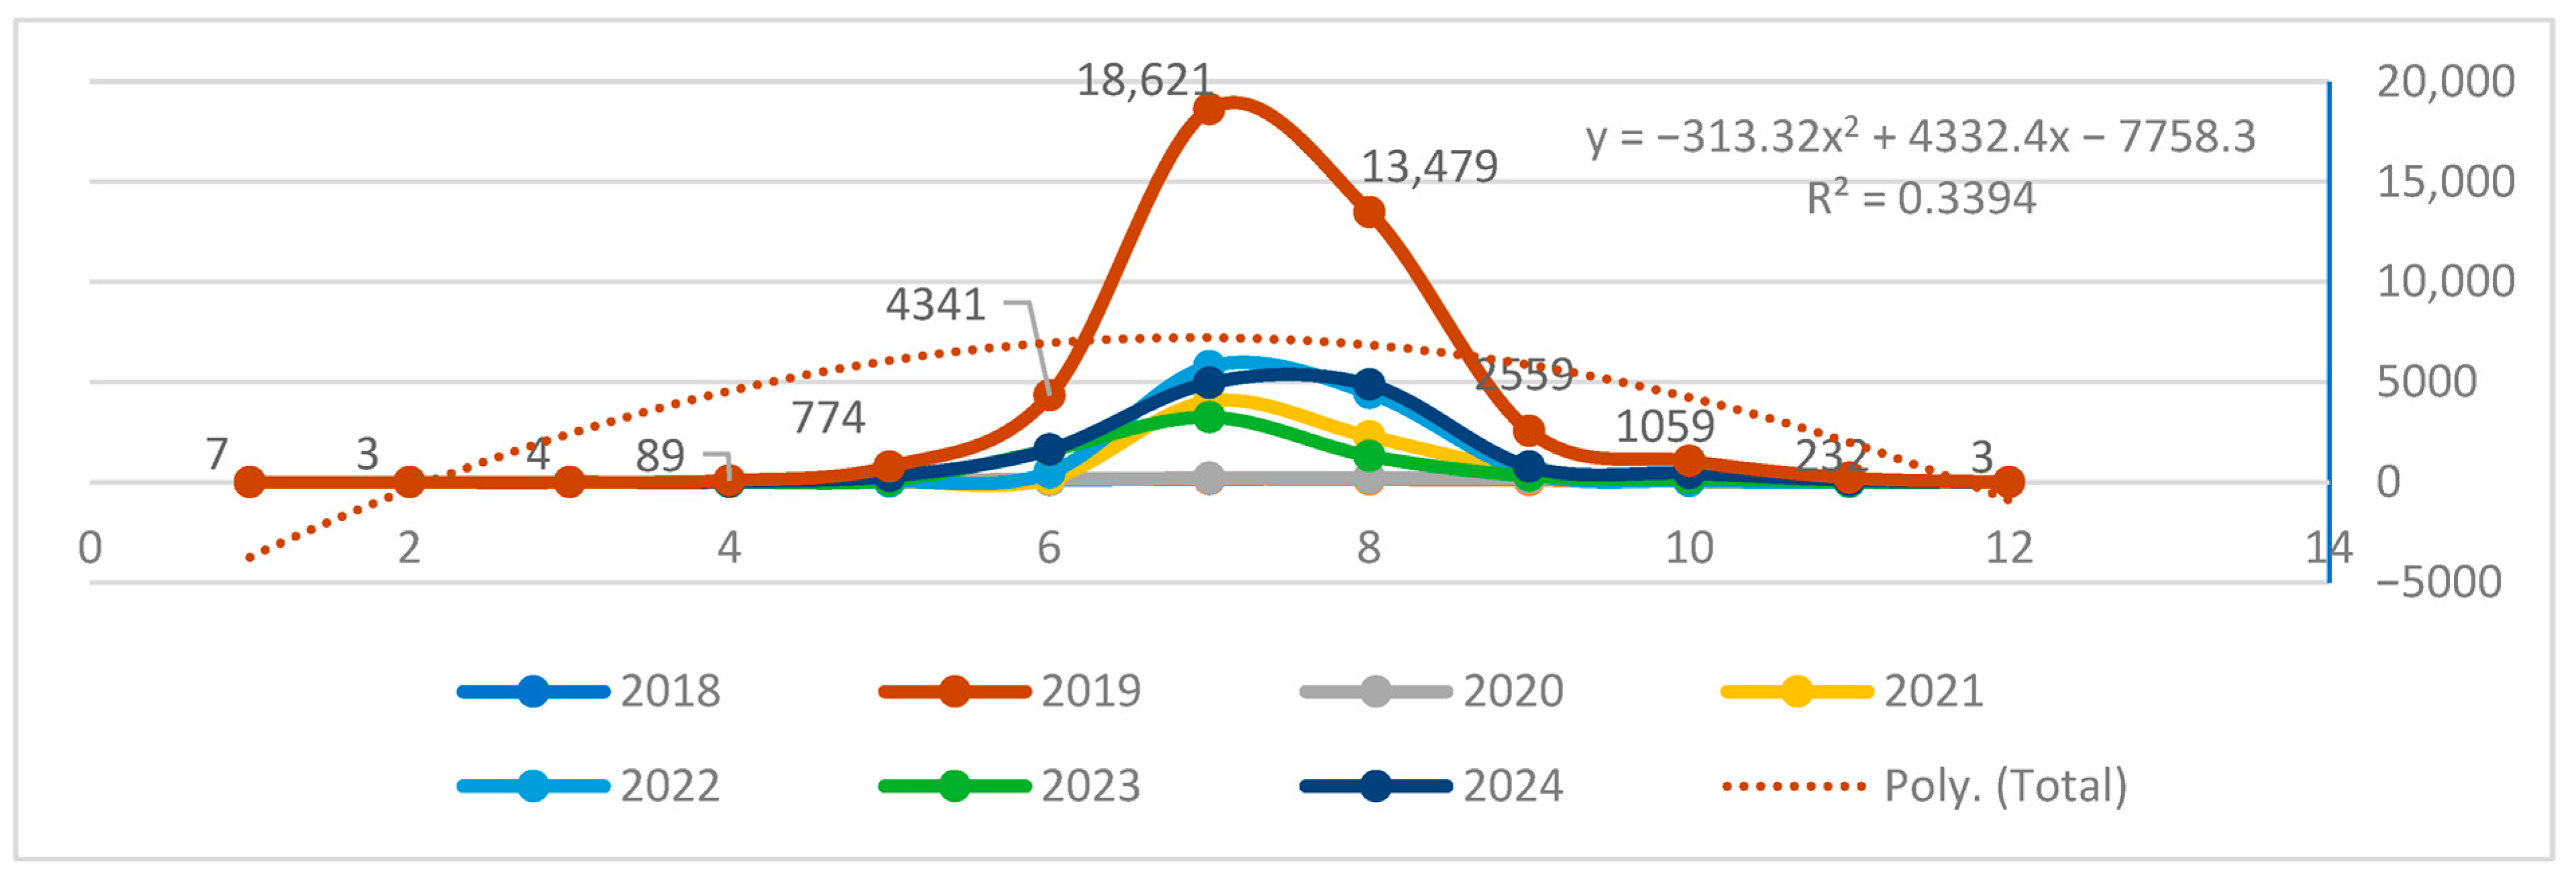
Annual Domestic Tourists2020—4071; 2021—44,653; 2022—51,183; 2023—29,683; 2024—56,096
Travel Season10 June to 25 July
Common TransportUAZ and other high-engine vehicles only
Table 2. Stepwise fuel estimation method for segment-based emission modeling.
StepDescription
Map roads and gather elevation dataCompiling road network information and associated elevation profiles to define the study route.
Segment roads by terrain difficultyDividing the route into segments based on elevation, slope, and road surface. Classify each as flat, ascending, or descending.
Estimate fuel consumption per segmentCalculating fuel use for each segment and vehicle type using terrain correction factors (from Order No. 390) and standard fuel rates. *
Aggregate total fuel useSumming up terrain-adjusted fuel use across all segments to obtain total consumption per vehicle type.
Scale by vehicle entry volumeMultiplying per-vehicle segment fuel use by recorded entries for each vehicle type to estimate fleet-level totals.
Convert to GHG emissionsApplying IPCC Tier 1 emission factors and U.S. EPA coefficients to convert total fuel into CO2, CH4, and N2O emissions by vehicle class and fuel type.
* Fuel use per segment is calculated using the formula: Fuel_segment = ((Correction% × (Fuel_rate × Segment_length)/100)/100) + (Fuel_rate × Segment_length/100). Where Fuel_rate is in L/100 km and Correction% is assigned based on terrain classification (e.g., flat, uphill, downhill) as defined by Mongolia’s Order No. 390 (2019).
Table 3. Detailed road conditions by section in Altai Tavan Bogd National Park.
Name of the SectionLength,
Km
Road Difficulty and Off-Road Levels
(1–10 Points)
Height DifferenceElevation Change, m/kmPossible Max Speed, km/hAverage Speed, km/hPercentage Increase in the Standard Norm [40]
1Ulgii City–First Pass26Unpaved, washboard road, steep uphill,
(3 points)
(449 m)
1715 m–164 m
↑ 17.2 m per 1 km5030The first zone, +15%
2First Pass–Ulaankhus Soum45Unpaved, washboard road, (1 point)(−381 m) 2164 m–1783 m↓ 20.0 m per 1 km8050Road difficulty −5%
3Ulaankhus Soum–Khukh Khotol Town–Songinot Pass130Unpaved, washboard road, long uphill,
(2 points)
(991 m)
1783 m–2774 m
↑ 11.7 m per 1 km8060The first zone, +15%
4Songinot–Ranger Post180Washboard road, all-terrain road
(2 points)
(−65 m)
2774 m–2709 m
↓ 20.0 m per 1 km70550%
5Ranger Post–President’s Ovoo Worship Site194Muddy roads with steep uphill, some swampy roads
(10 points)
(454 m)
2709 m–3163 m
↑ 32.4 m per 1 km3015The first zone, +15%
Road difficulty +10%
6President’s Ovoo Worship Site–Bridge of Oigor River244Muddy roads with downhill, all-terrain road
(6 points)
(−769 m)
3163 m–2394 m
↓ 15.4 m per 1 km6035The first zone, +15%
7Bridge of Oigor River–Taldag Pass270Uphill steep roads, washboard road,
(6 points)
(180 m)
2394 m–2574 m
↑ 7 m per 1 km5030The first zone, +15%
Road difficulty +5%
8Taldag Pass–Bridge of Tsagaan River300Downhill road with short turns, rocky road
(4 points)
(−471 m)
2574 m–2103 m
↓ 15.7 m per 1 km6045The first zone, +15%
9Bridge of Tsagaan River–Pass315Uphill steep roads,
straight road without bumps, (8 points)
(776 m)
2103 m–2879 m
↑ 51.7 m per 1 km3515The first zone, +15%
Road difficulty +5%
10Pass–Baga Turgen–Tsengel Soum495All-terrain roads,
(5 points)
(−991 m)
2879 m–1888 m
↓ 5.5 m per 1 km6040The first zone, +15%
11Tsengel Soum–Mushgiraa Pass508Washboard road, long uphill
(4 points)
(356 m)
1888 m–2244 m
↑ 27.4 m per 1 km5035First zone, +15%
12Mushgiraa Pass– Sagsai Soum558Washboard road,
(4 points)
(−484 m)
2244 m–1760 m
↓ 20.0 m per 1 km7050Road difficulty +5%
13Sagsai Soum–Pass566Washboard road, long uphill,
(4 points)
(389 m)
1760 m–2149 m
↑ 48.6 m per 1 km6040Road difficulty +5%
14Pass–Ulgii city580Washboard road, graded road
(4 points)
(−434 m)
2149 m–1715 m
↓ 31 m per 1 km60500%
Estimated using information documented in the expedition records.
Table 4. Vehicle fuel consumption (liters).
Types of CarsRepresented Car TypeFuel Consumption per
100 km, Liters
Gasoline to be Spent at the Route, Liters2018 (Liters)2019 (Liters)2020 (Liters)2021 (Liters)2022 (Liters)2023 (Liters)2024 (Liters)Total
3.8–6 engineLand Cruiser-2009.662.625,10327,66940,377144,418303,422163,323432,8791,137,191
UAZ-3909UAZ-390910.568.522,11221,94727,044300,112455,224269,698409,5201,505,657
UAZ-3151UAZ-31510812.682.233573151349442,53945,14247,88264,596210,161
1.8–3.2 engine Prius 204.0 26.10060015,26971254072642133,487
ZIL trucksZIL-13151332.600017,62821,61936,58635,256111,089
TotalGasoline(l)50,57252,76771,515502,338810,913484,975913,4162,886,493
Diesel(l)00017,62821,61936,58635,256111,088
Table 5. Estimated emissions of CH4 and N2O (kg) by year Emissions Distribution by Route Segment.
Gases2018201920202021202220232024Total
CH45.05.37.252.283.652.395.3300.9
N2O1.11.11.511.017.611.020.045.7
Disclaimer/Publisher’s Note: The statements, opinions and data contained in all publications are solely those of the individual author(s) and contributor(s) and not of MDPI and/or the editor(s). MDPI and/or the editor(s) disclaim responsibility for any injury to people or property resulting from any ideas, methods, instructions or products referred to in the content.

