1. Introduction
In a rapidly globalizing world, the ways in which people spend and save money are no longer driven by economic factors alone. Cultural influences now play a growing role in shaping financial decisions. In this context, consumption behavior reflects how individuals allocate their income between current spending and saving, largely shaped by “intertemporal preferences”—how much a person values present versus future consumption. Individuals with a high time preference tend to prioritize immediate consumption, resulting in a higher consumption-to-savings ratio, while those with a low time preference are more inclined to save for future consumption [
1].
In recent decades, globalization has led to increasing cultural openness, influencing various aspects of social and economic life. Through cross-border cultural flows, such as media, tourism, trade, and digital interactions, individuals are exposed to global consumption behavior. These flows have introduced new consumption norms and values, particularly in emerging economies undergoing social and economic transformation. In culturally open societies, individuals are often exposed to Western-style consumerism, luxury lifestyles, and credit-driven spending, which may shift their intertemporal preferences toward more present-oriented consumption. Conversely, in more traditional societies, savings may continue to dominate financial behavior, reflecting deeply rooted cultural norms.
While previous studies by Fedotova Fedotova [
2], Rachwal-Mueller and Fedotova Rachwal-Mueller and Fedotova [
3], Shavitt and Cho Shavitt and Cho [
4], and Xing and Jin Xing and Jin [
5] demonstrate how cultural values influence brand perception, product choices, and purchase intentions, and Paredes Paredes [
6] and Richards and Wilson Richards and Wilson [
7] have explored how lifestyle and experiential preferences shift in response to global cultural exposure and cultural openness to reshape consumer preferences—such as product choices or lifestyle patterns—this study takes a different approach by emphasizing a structural and intertemporal dimension: the trade-off between present consumption and future savings. Rather than focusing on what people consume, this research examines how and when they choose to consume. To capture this dynamic, the consumption-to-savings ratio (CESR) is used as a proxy for intertemporal consumption behavior, while cultural openness is proxied by the Cultural Globalization General Index (CGGI).
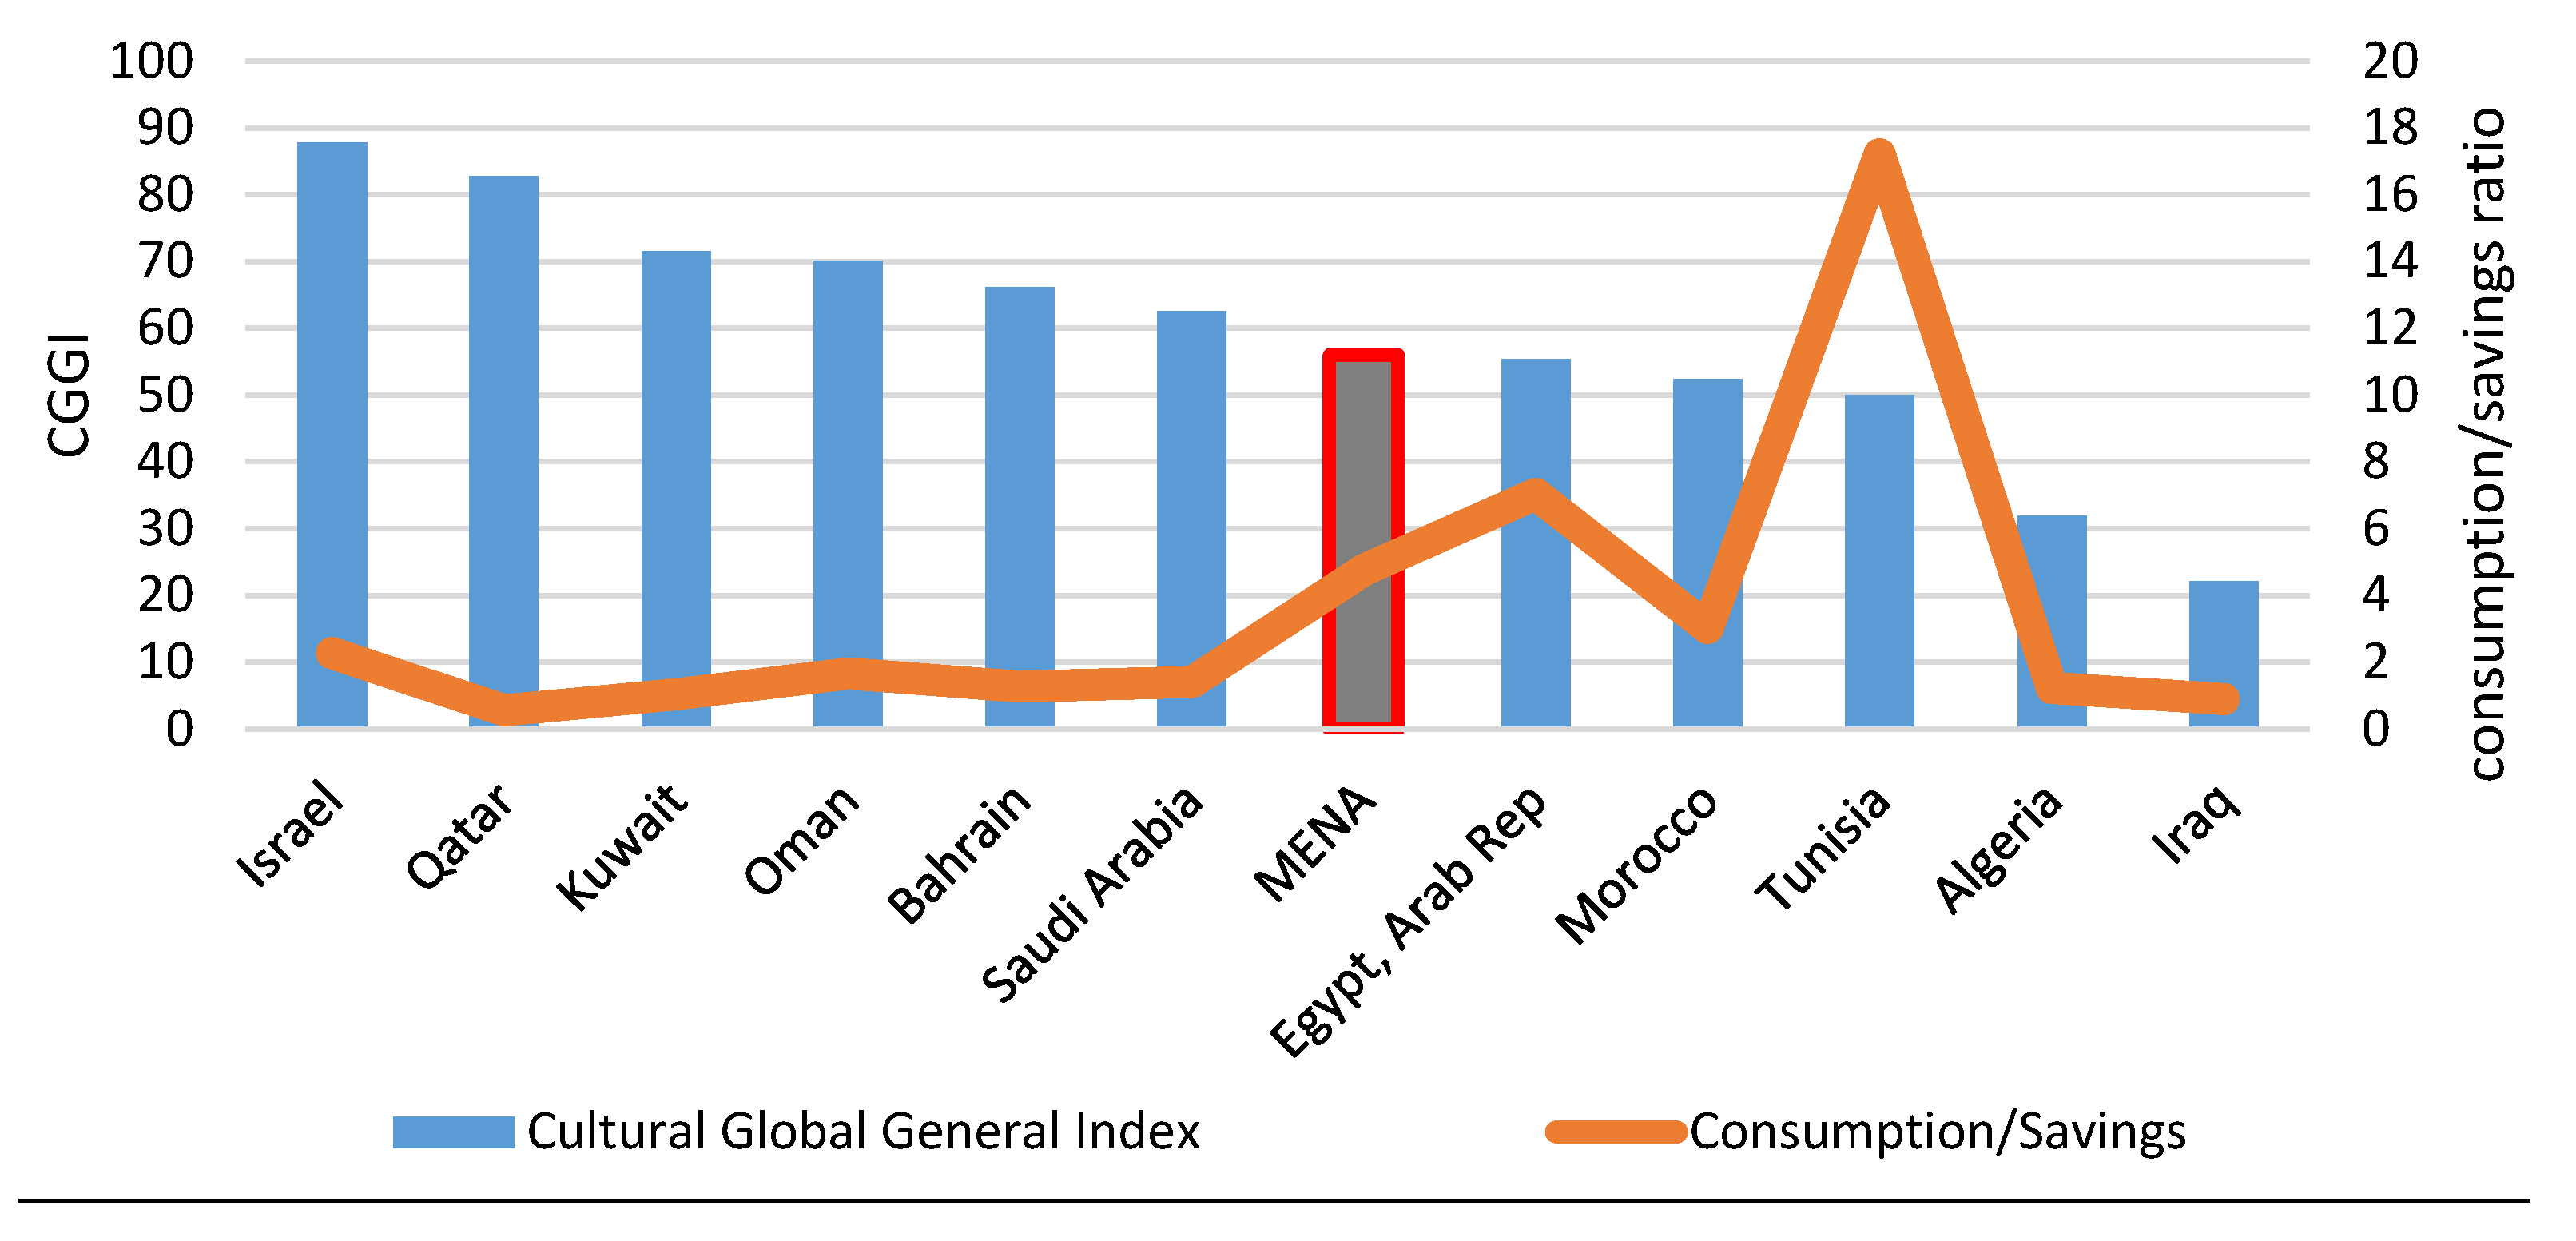
The consumption-to-savings ratio (CESR) differs among the Middle East and North Africa (MENA) countries, as shown in
Figure 1 for some selected MENA countries. It is evident that the consumption-to-savings ratio is significantly lower in higher-income countries like Saudi Arabia, Kuwait, and Qatar than it is in lower-income countries such as Egypt, Tunisia, and Jordan. While the average ratio for the mentioned lower-income countries is around 7, it is only about 1.4 in the selected higher-income countries [
8].
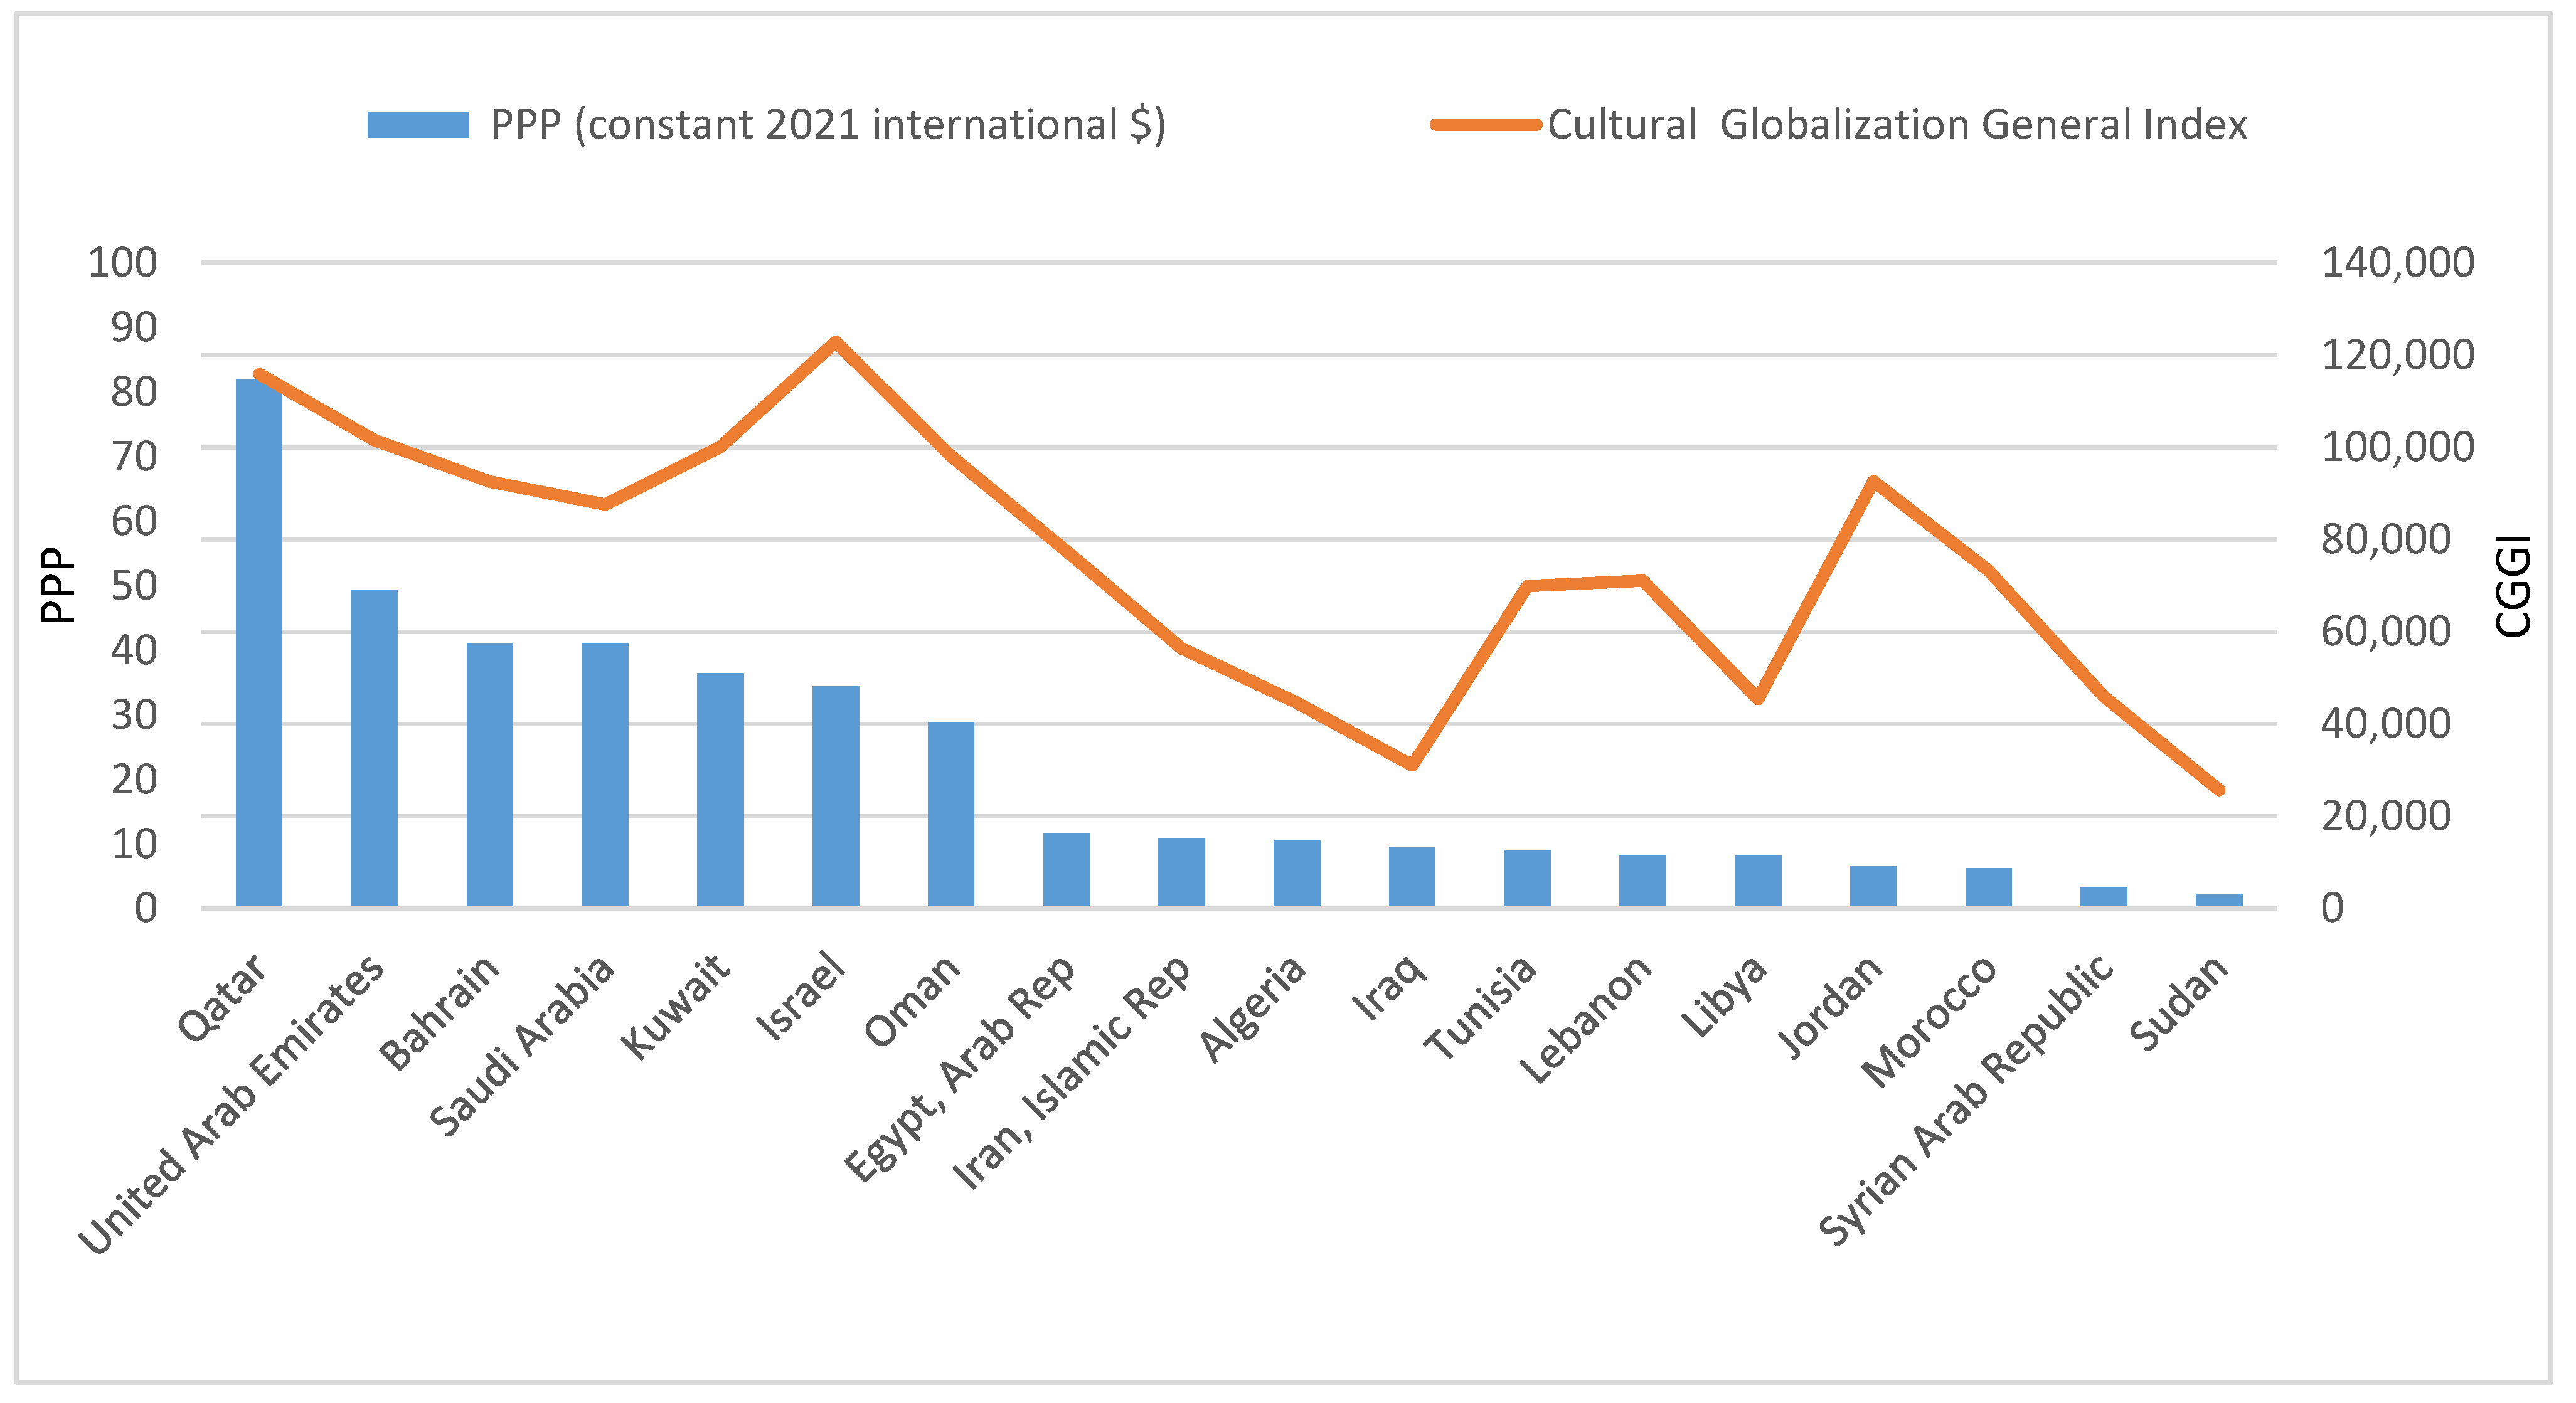
When examining
Figure 2, one could infer that a higher CGGI is associated with a lower consumption-to-savings ratio.
Based on the above, this study aims to assess whether increased cultural openness systematically alters intertemporal consumption patterns in the MENA region. Specifically, it investigates whether exposure to global cultural flows leads to higher consumption relative to savings, and whether this relationship persists after controlling for economic variables such as income, inflation, and Internet access. These questions are especially relevant for the Gulf Cooperation Council (GCC) and broader MENA economies, where cultural integration and economic diversification are ongoing policy priorities. Aligning with the aims of this study, the research problem can be framed as follows:
Does increased cultural openness lead to higher consumption relative to savings?
To what extent do cultural exposure and global influences drive consumer preferences in the MENA region?
Are changes in consumption behavior a result of cultural factors, or are they primarily driven by economic variables?
By addressing these questions, this study contributes to a more nuanced understanding of the relationship between cultural dynamics and economic decision-making. Despite extensive research on globalization and consumer behavior [
2,
3,
4,
5,
6], a clear research gap remains regarding the causal influence of cultural openness—conceptualized as a distinct and measurable construct—on intertemporal financial behavior. Much of the existing work either conflates cultural openness with general cultural traits or focuses predominantly on income-based determinants. This study addresses that gap by integrating insights from cultural economics and behavioral finance, and by employing a quantitative, cross-country panel approach.
A key contribution of this study lies in its methodological framework. Using panel data from 14 MENA countries, covering the period 2010–2022, this study employs the system Generalized Method of Moments (GMM) estimator to capture the dynamic and potentially endogenous relationship between cultural openness and the CESR. To ensure the robustness and credibility of the estimates, this study calculates long-run elasticities based on the dynamic model and employs additional estimation techniques, including the Sequential Linear Panel Data Model (SELPDM) and Ordinary Least Squares (OLS), as complementary robustness checks. The methodology also includes internal consistency diagnostics and checks for instrument validity and specification accuracy, providing a reliable foundation for analyzing both short-term dynamics and long-run effects. This integrative approach offers a behavioral lens for understanding the macroeconomic impact of cultural openness, with relevance extending beyond the MENA region to other culturally dynamic emerging economies.
The remainder of this study is structured as follows: The next section presents a review of the relevant literature on cultural globalization and consumption behavior. This is followed by the methodology section, which outlines the data sources, variable selection, and econometric techniques employed. The study then moves to the results and discussion section, where empirical findings are presented and analyzed in relation to the stated hypotheses. Finally, this study concludes with a summary of the key findings, policy implications, limitations, and suggestions for future research.
3. The Cultural Dimensions of the MENA Region
MENA, an acronym for countries in the Middle East and North Africa region, has no unique definition, as different organizations define the region differently according to their purpose or specific studies. While not standardized, the MENA region covers a geographic region stretching from Morocco in the west to Iran in the east and typically consists of the following 20 countries: Algeria, Bahrain, Egypt, Iraq, Iran, Israel, Jordan, Kuwait, Lebanon, Libya, Morocco, Oman, the West Bank and Gaza, Qatar, Saudi Arabia, Sudan, Syria, Tunisia, the United Arab Emirates, and Yemen.
3.1. The Cultural Significance of the MENA Region
The MENA region is of worldwide importance and an interesting area of research for various reasons. First, its strategic location is of geopolitical importance, not only because it links Europe, Africa, and Asia but also because it controls major important waterways such as the Suez Canal and the Strait of Hormuz. Secondly, by the end of 2019, over 42% of the world’s proven gas reserves and 52% of its proven oil reserves were located in the MENA area, which adds to its geopolitical significance. Although not distributed evenly among the MENA countries, employment migration from oil-poor MENA countries to oil-rich MENA countries contributes to slightly mitigating the intraregional income gap among the MENA countries [
9]. Third, the MENA area has experienced a significant rise in its population, from 77 million people in 1950 to 425.8 million people in 2019, and is expected to reach 613.3 million people by 2050, with an estimated annual growth rate of 1.1% (compared to an estimated annual growth rate of 0.7% worldwide), which puts tremendous pressure on governments to create jobs, as the MENA region already has one of the highest youth unemployment rates in the world [
9].
To lower the region’s existing adverse impacts of climate change, and to create much-needed jobs in the MENA region, both exporters and importers of carbon energy have committed to reducing their carbon energy consumption by diversifying into more sustainable economic activities. One of the possible promising activities is related to their common rich cultural heritage.
The countries of the MENA region share a lot of cultural similarities, for several reasons: first, they are predominantly Muslim, except for Israel; secondly, Arabic is the most spoken language, while Farsi and Hebrew are only spoken in Iran and Israel, respectively; and third, they share a similar history and colonial past. Culture is more than old historical buildings and monuments that are kept in museums and displayed in exhibition rooms. Culture is a system of learned and shared values, practices, behaviors, rituals, beliefs, attitudes, art, films, books, and music that are shared or overlapping and can be revived and reinvented into many economic activities. Preserving cultural heritage sites and blending traditional arts and crafts with modern ideas and concepts makes them more appealing to consumers, whether locals or tourists. This usually leads to diversification into sustainable economic activities, creating jobs for local communities while strengthening their cultural identity and pride.
This study focuses on cultural openness, which is very different from and often mistaken for cultural assimilation. While cultural assimilation usually leads to losing elements of one culture to adopt the norms, values, and behaviors of another culture, cultural openness values, appreciates, and tolerates diverse cultures, resulting in a more inclusive, creative, and vibrant society.
Economic behavior is likely to be influenced by culture, since it shapes people’s values and beliefs and influences their preferences, actions, and decisions [
8]. Consumption is a key element of economic behavior and affects demand, output, employment, and income levels, all of which are crucial for policymakers. Therefore, a solid understanding of consumer behavior and trends and the detection of potential shifts in consumer patterns brought about by accepting diverse cultural values are vital for making sound economic policy decisions and for achieving economic progress and stability.
3.2. The KOF Cultural Globalization Index
To measure cultural openness, this study makes use of the KOF globalization index, a composite index that contains 42 variables that consists of economic, social, and political globalization indices. The social globalization index is further subdivided into interpersonal, information, and CGI. While
Table 1 shows the main structure of the KOF globalization index,
Table 2 indicates the variables used in calculating the CGI [
28].
The KOF globalization index covers 43 variables in total. Data have been calculated and released annually for nearly all countries of the world since 1970. The updated version of the KOF globalization index makes a clear distinction between de facto and de jure measures of globalization for each dimension and sub-dimension of the index. As shown in
Table 2, the actual flows and activities of the KOF cultural globalization index are captured by the variables of the de facto measures. Policies, resources, or institutions that enable or facilitate these flows and activities are captured by the variables of the de jure measures. The effectiveness of the formal de jure policies affects the ability to comprehend, appreciate, and accept foreign cultural values, enhancing cultural openness [
23].
3.3. Cultural Dimensions and Consumption Behavior in the MENA Region
Despite these similarities, the countries in the MENA region suffer from intraregional income disparities due to the unequal endowment of oil reserves on the one hand and regional disputes and conflicts on the other hand. As can be seen from
Figure 3, the high-income countries include all six GCC (the Gulf Cooperation Council, consisting of Bahrain, Kuwait, Oman, Qatar, Saudi Arabia, and the United Arab Emirates) countries and Israel, whereas the remaining countries range from middle-income to low-income countries.
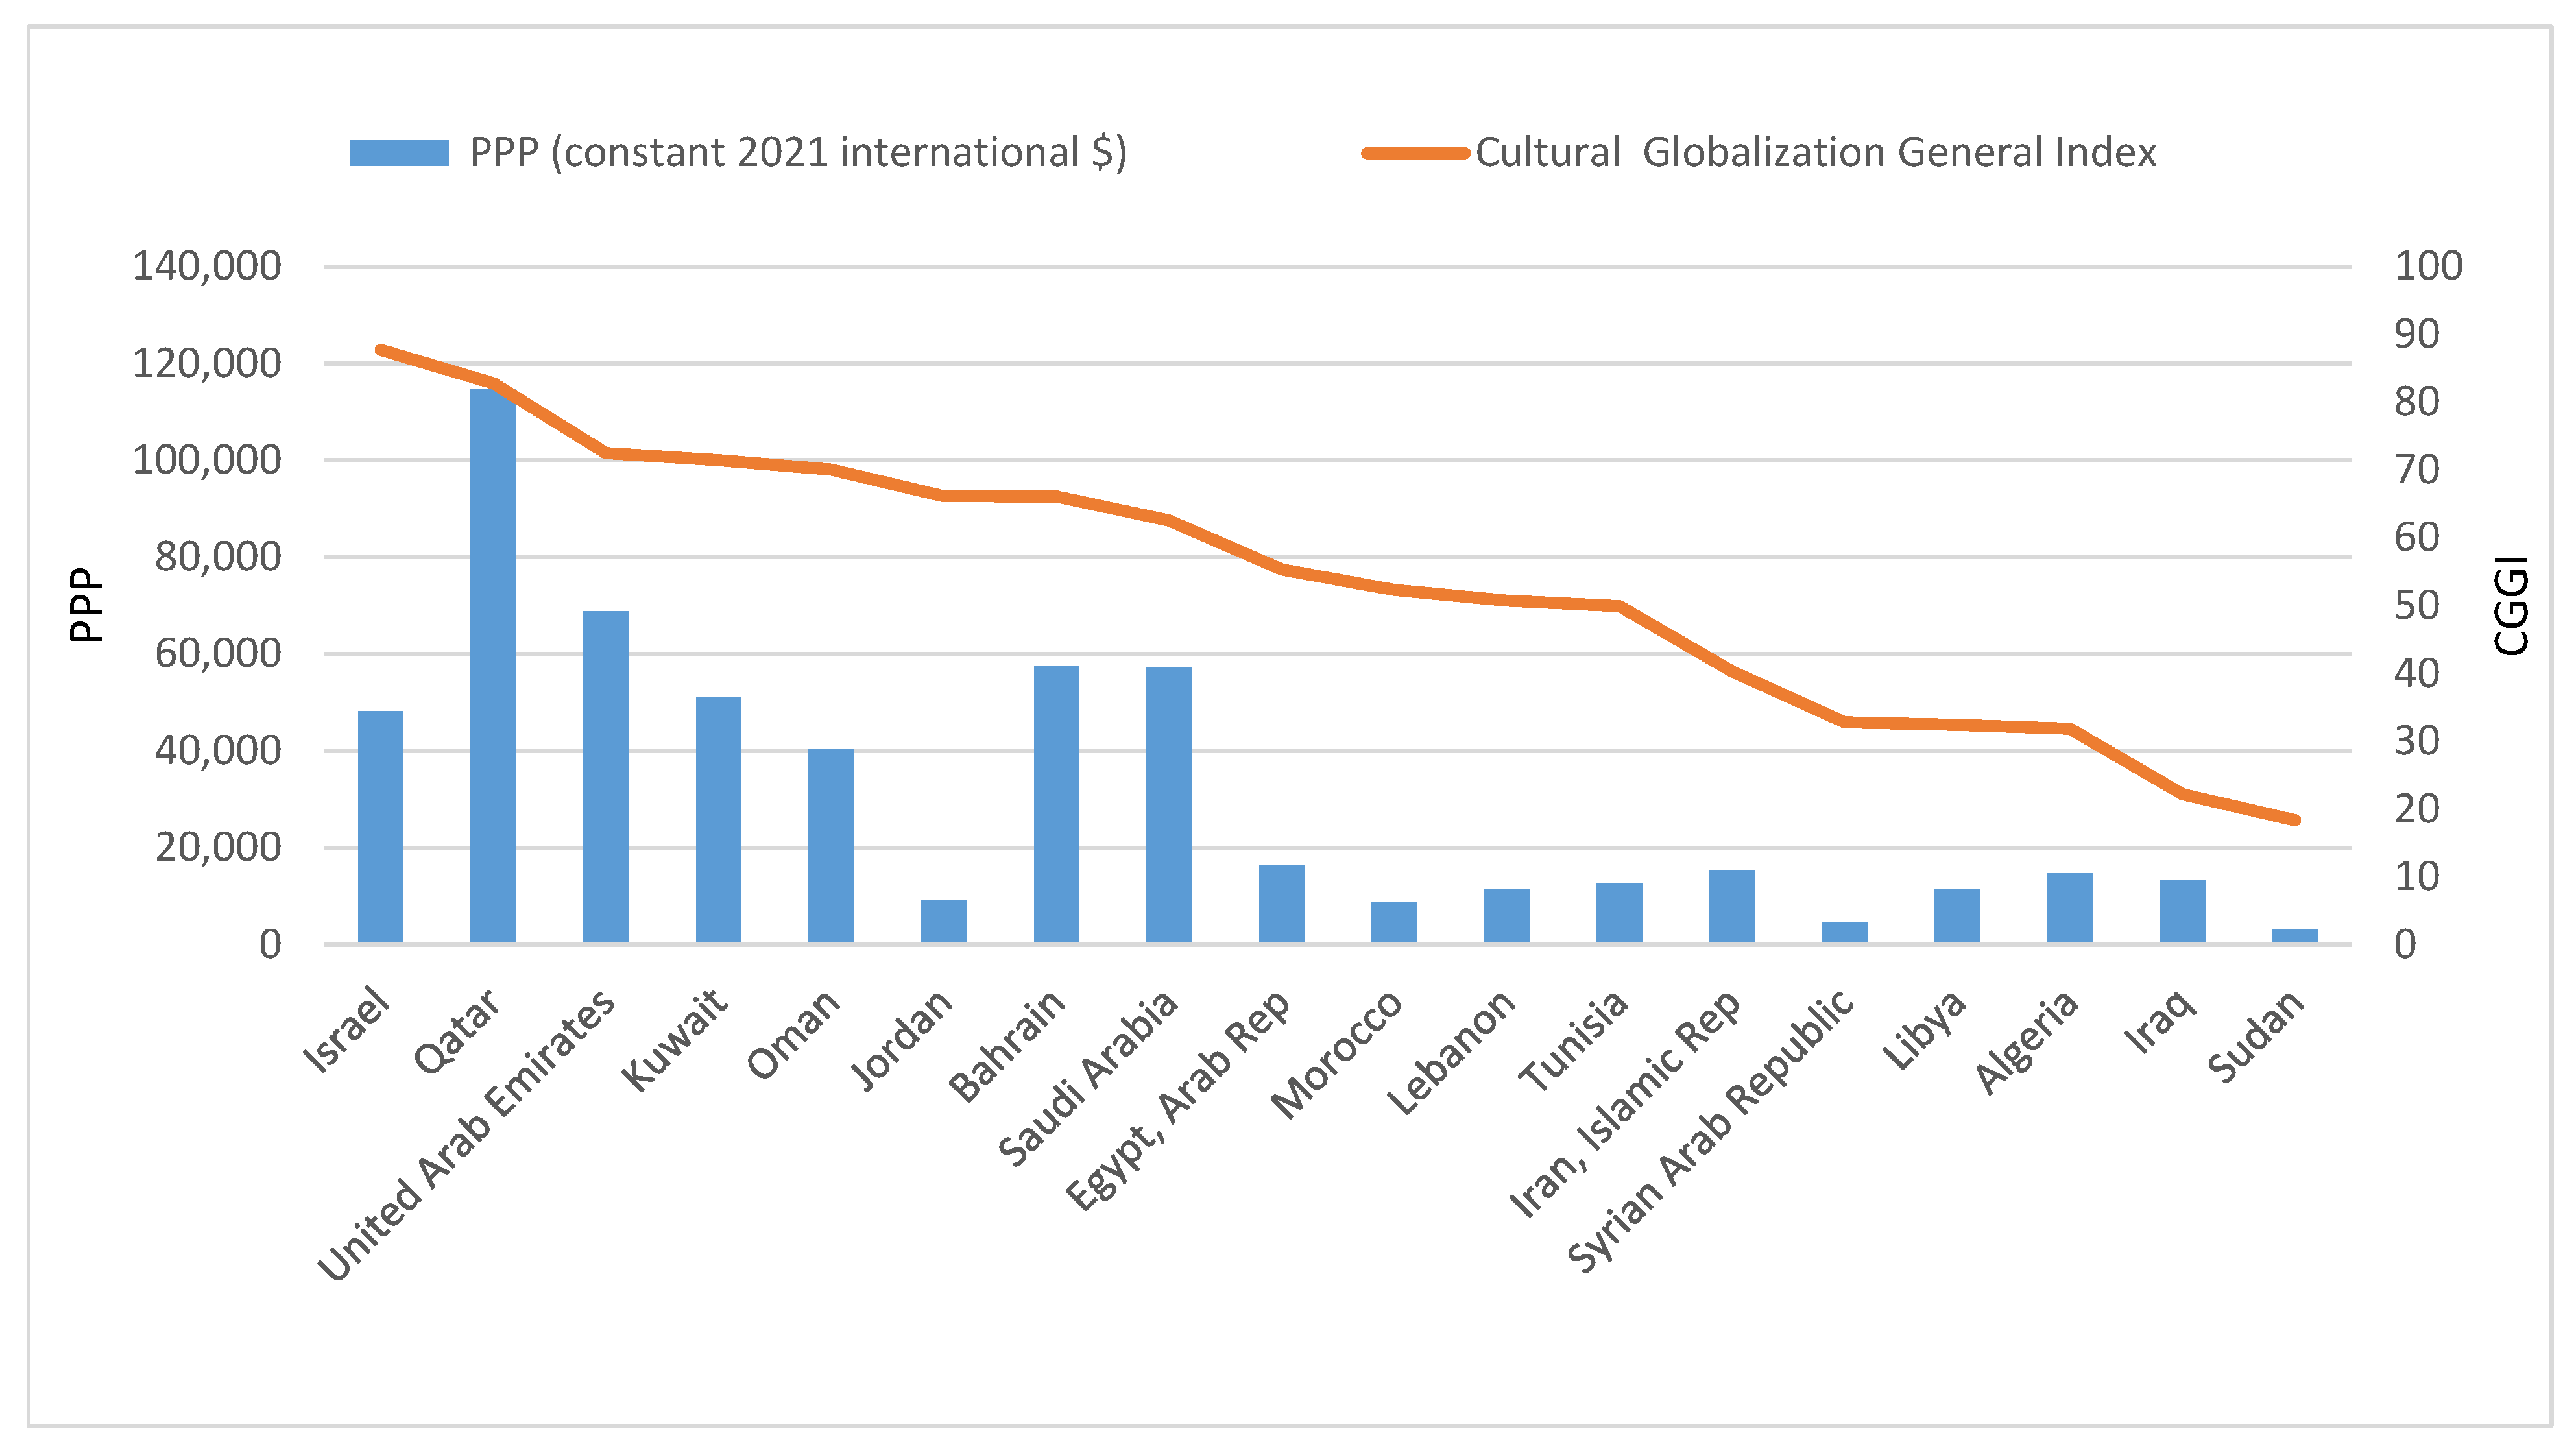
The higher-income countries in the MENA region have generally higher values of the Cultural Globalization General Index, except for Jordan, which has a remarkably high value despite its generally low per capita income.
Figure 4 shows that the countries with Cultural Globalization General Index values over 60, except for Jordan, are high-income countries, closely followed by countries that have Cultural Globalization General Index values between 50 and 60, which are mainly established tourist destinations (Egypt, Morocco, and Tunisia), except for Lebanon. The countries with Cultural Globalization General Index values below 50 are mostly countries affected by regional conflicts (Syria, Libya, Iraq, Sudan, Yemen, and the West Bank and Gaza). The values for the Cultural Globalization General Index for countries in the MENA region are consistent with the values of income groups around the world, as shown in
Table 1, where the higher the income group, the higher the value of the Cultural Globalization General Index.
Table 3 also shows that higher values of the Cultural Globalization General Index are associated with a higher percentage of the population using the Internet.
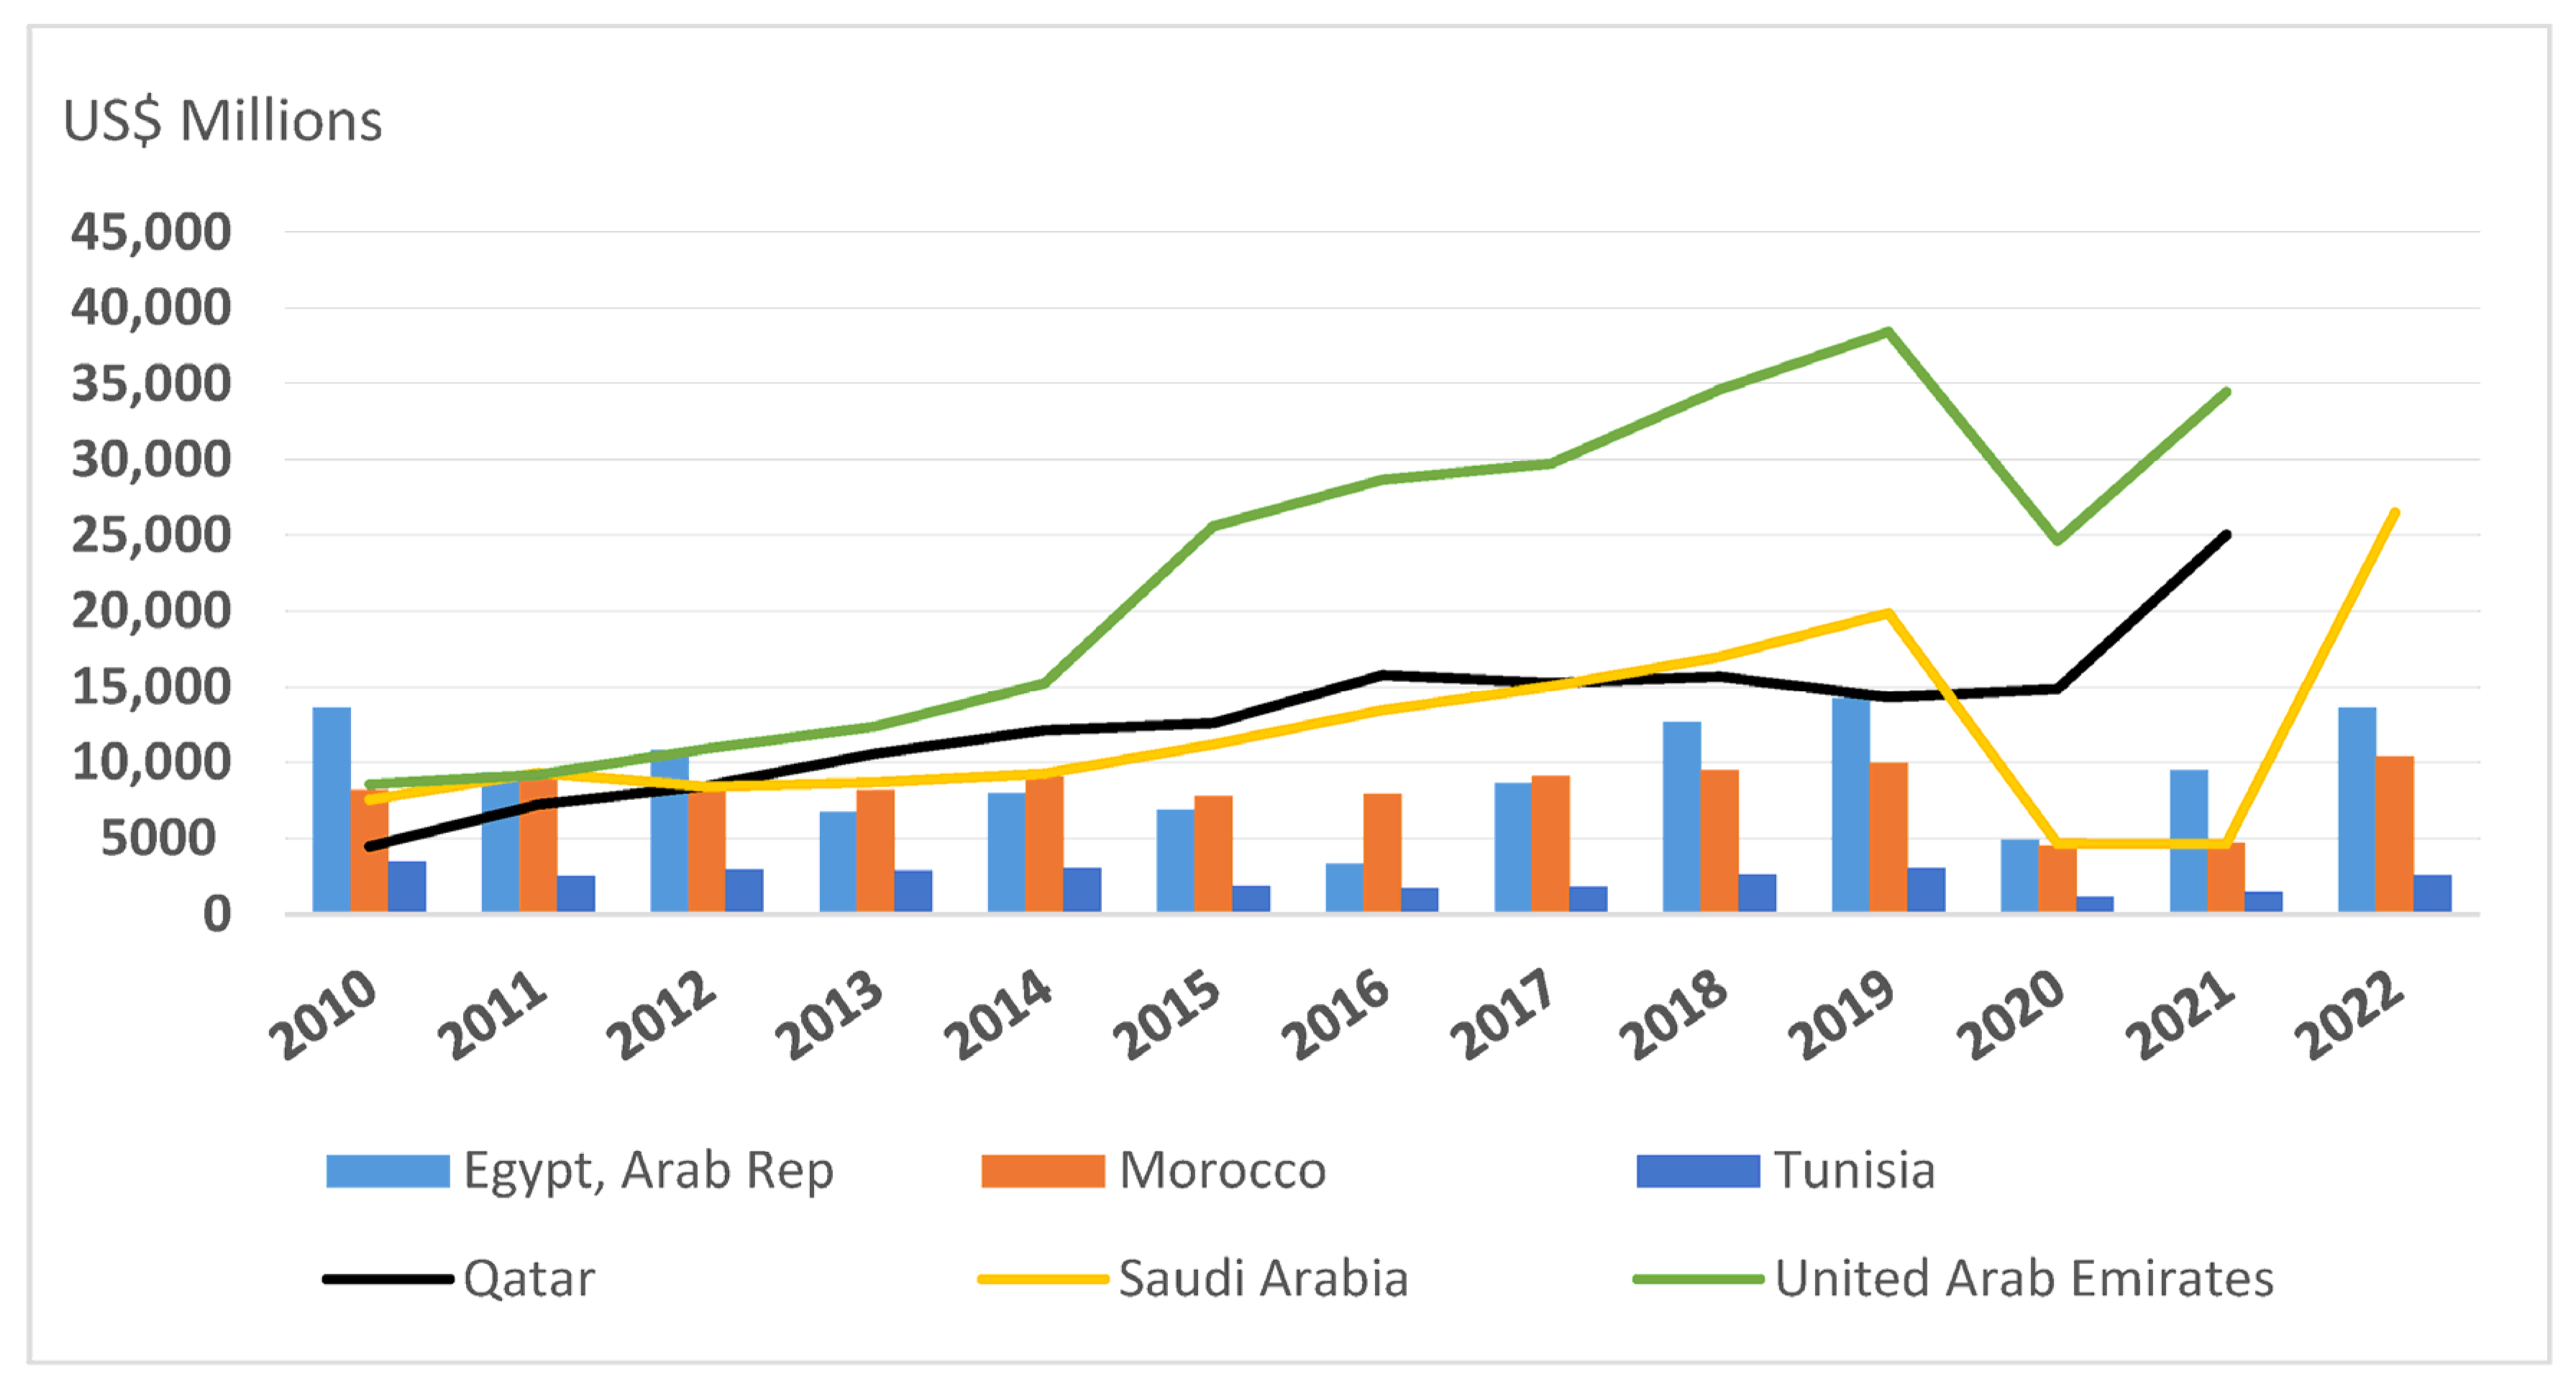
Emerging tourist destinations in the GCC countries have grown faster than established tourist destinations, in terms of numbers of inbound tourists and tourist expenditures.
Figure 5 shows that Qatar, Saudi Arabia, and the United Arab Emirates have surpassed Egypt, Morocco, and Tunisia in tourism expenditures.
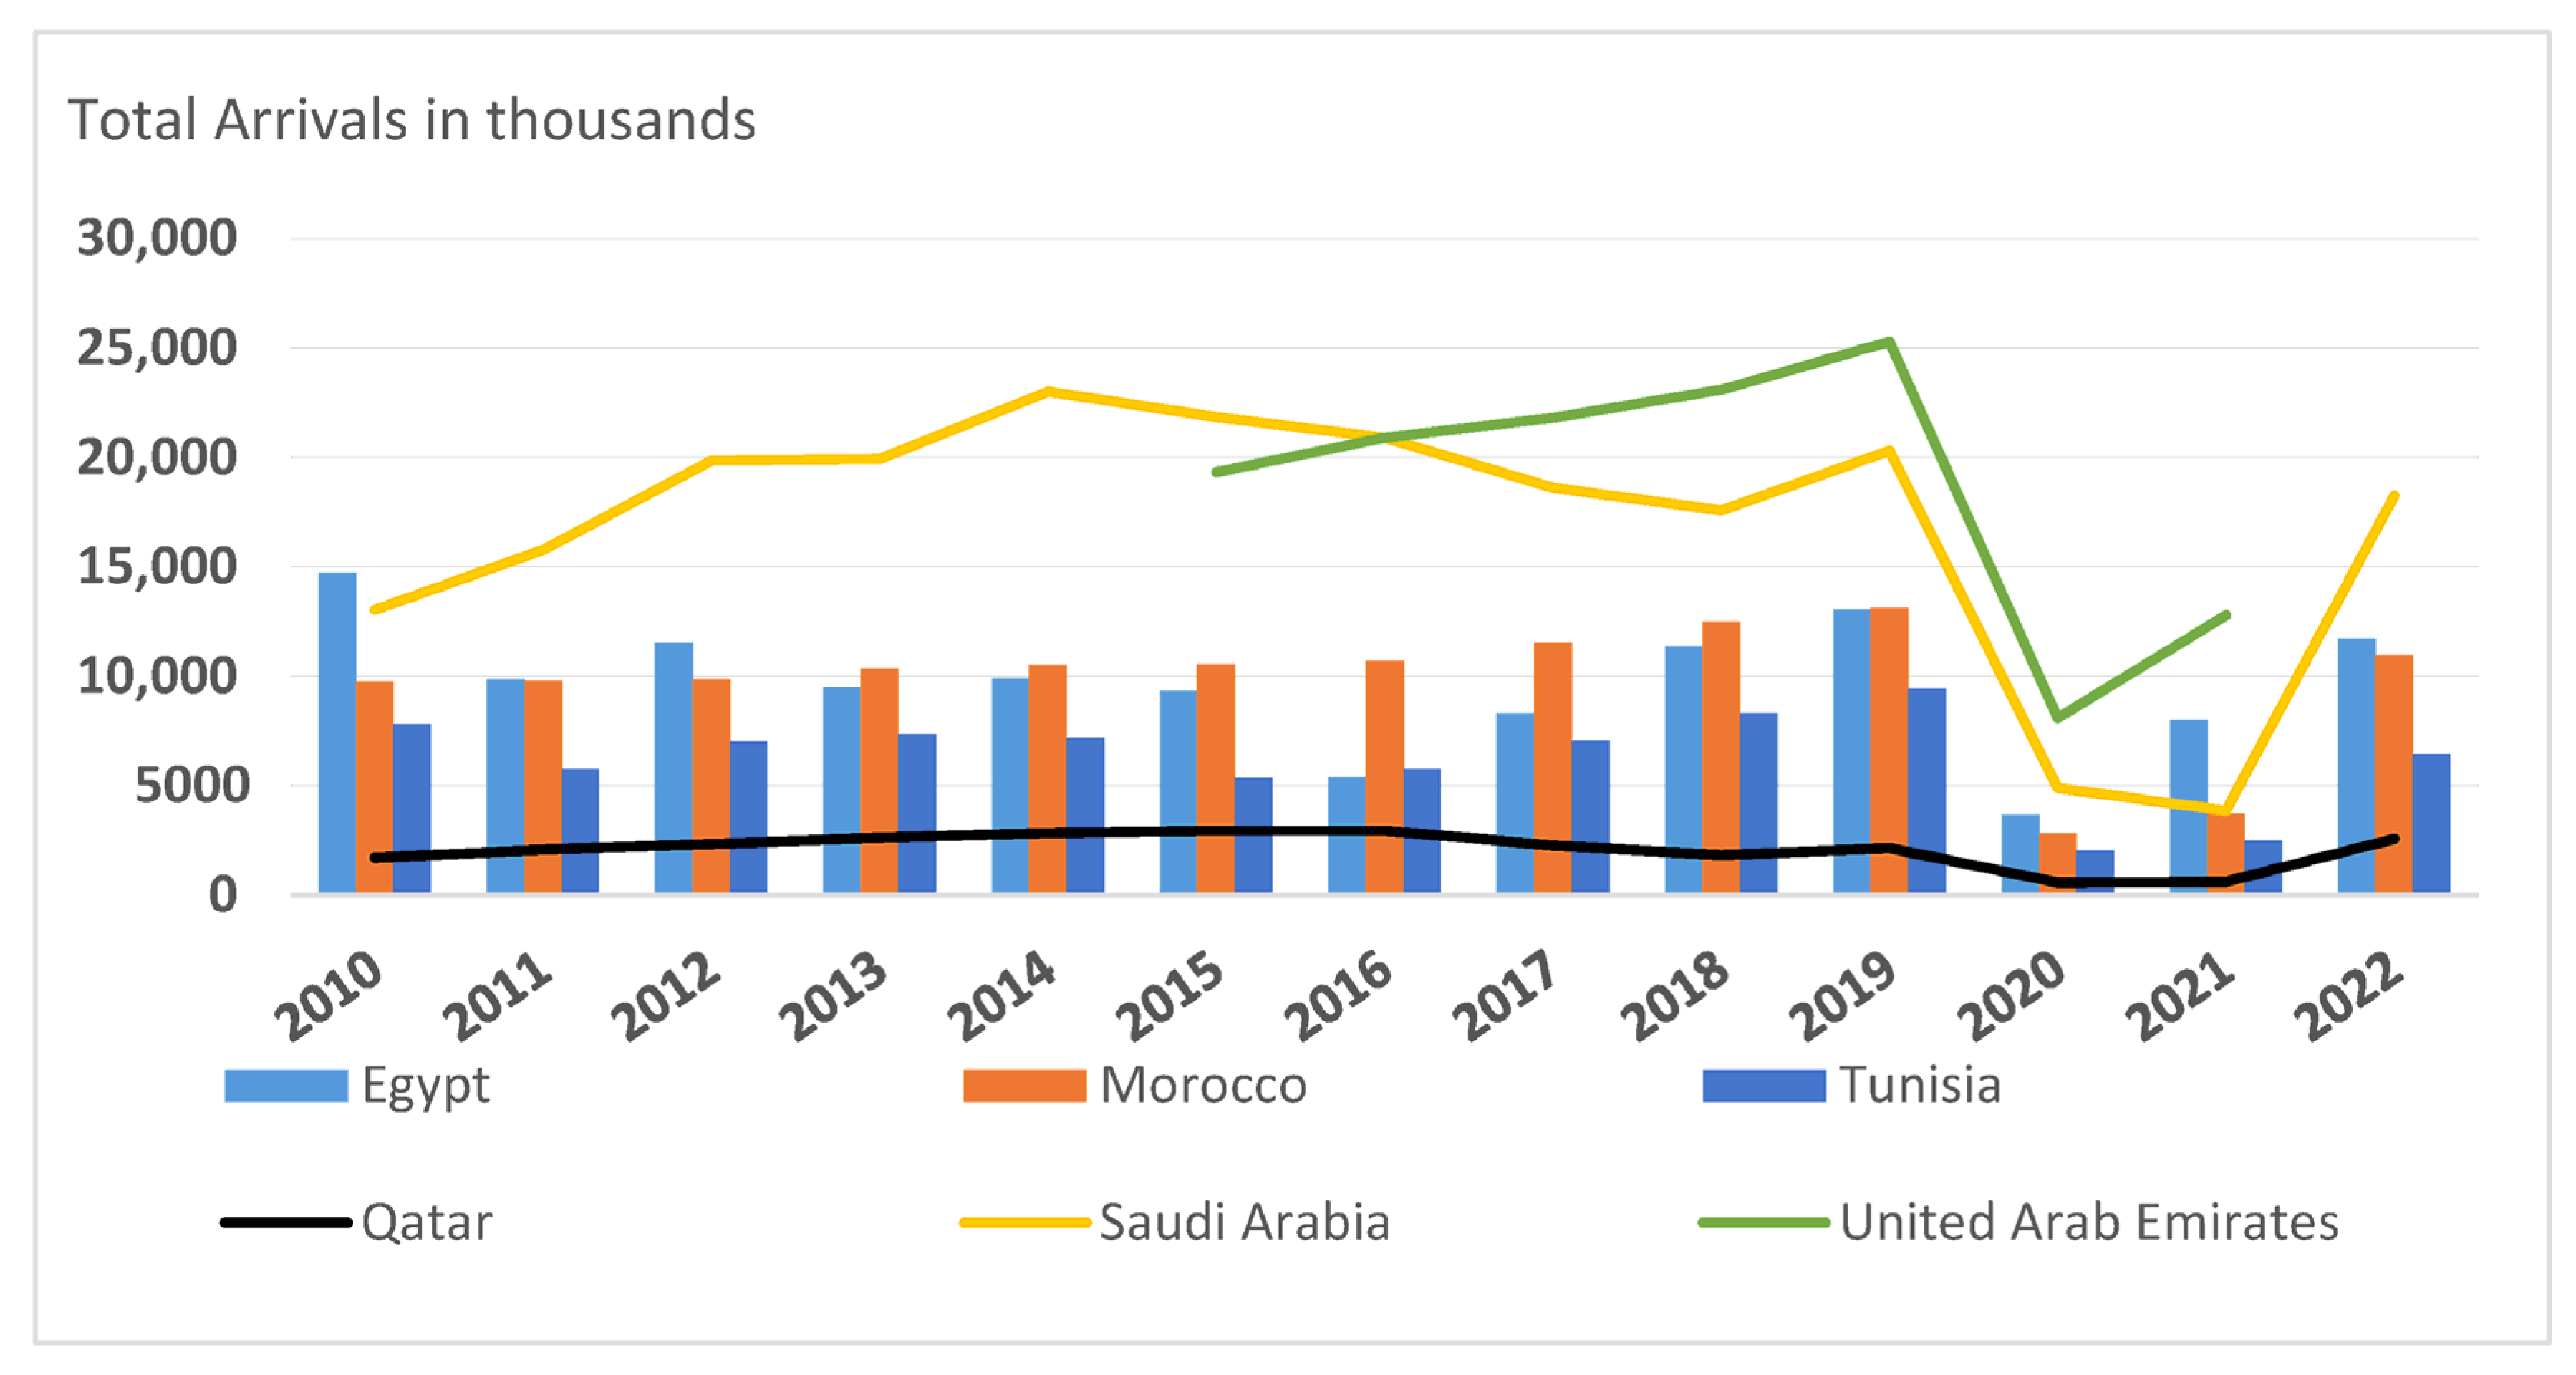
By looking at the number of tourist arrivals, as shown
Figure 6, Qatar seems to have a low number of tourists compared to its high tourism expenditures. This is because large numbers of tourist arrivals do not necessarily coincide with high tourism expenditures, as shown in
Figure 7. While Qatar has lower numbers of tourist arrivals than Bahrain, tourists in Qatar have higher expenditures than in Bahrain.
National consumption and savings can give some indication of a country’s time preferences. As disposable income is either consumed or saved, a tendency to save provides the necessary funds for investment, which, in turn, leads to higher productivity and long-term economic growth in the future. While higher savings might reflect a sense of security, lower savings might reflect a general feeling of high uncertainty. On the other hand, high savings rates can lead to a decline in consumer spending, which, in turn, may have a negative impact on the overall growth of the economy.
Figure 8 presents the consumption/savings ratio for selected countries of the MENA region. While a high ratio indicates relatively low savings compared to consumer spending, a lower ratio indicates relatively high savings compared to consumer spending). Except for Iraq and Algeria, the consumption/savings ratio is lower in higher-income countries and higher in lower-income countries.
4. Data and Methodology
4.1. Data
To test the proposed hypotheses, this study employs panel data covering 14 countries in the Middle East and North Africa (MENA) region over the period 2010 to 2022. This timeframe was deliberately selected to incorporate the most recent and relevant data for the analysis. The dataset was compiled from reputable international sources, including the World Bank’s National Accounts Data and World Development Indicators, the KOF globalization index (ETH Zurich), the United Nations World Tourism Organization (UNWTO), the International Telecommunication Union (ITU), and the International Monetary Fund’s World Economic Outlook.
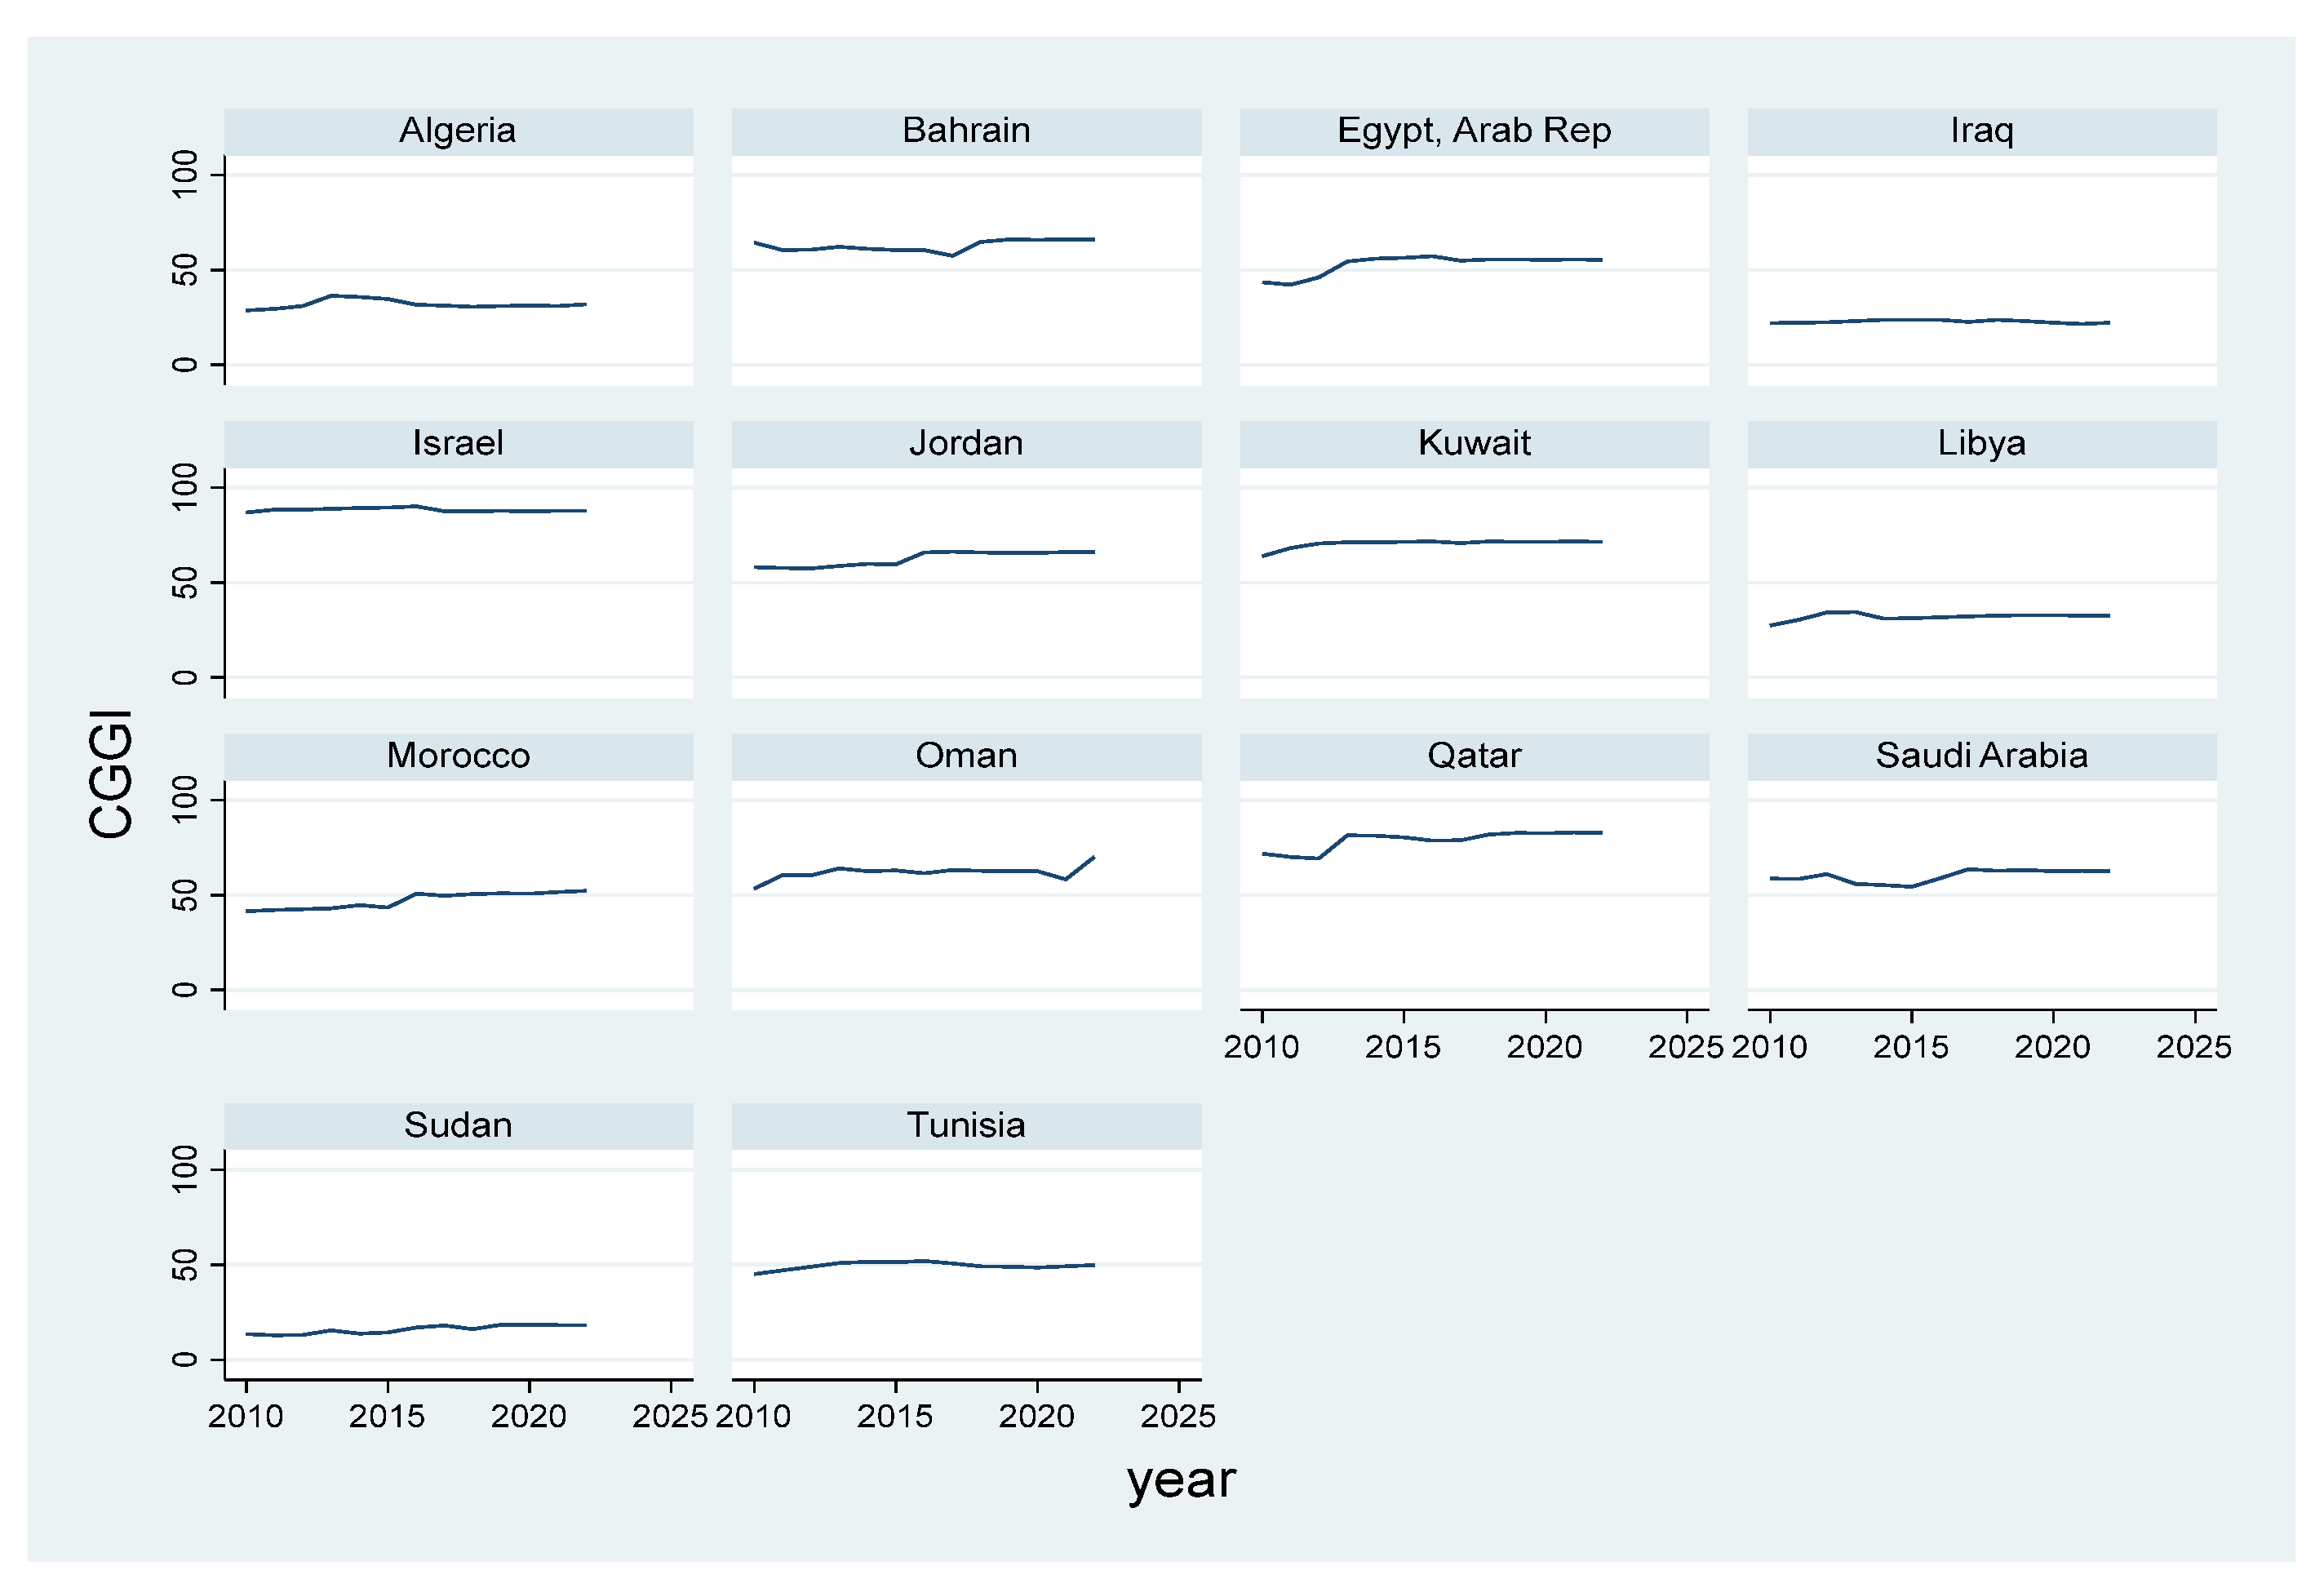
The MENA region exhibits distinct variations in CGGI trends from 2010 to 2022, indicative of structural disparities and differing policy directions among countries. Israel (86–90) and Qatar (69–83) consistently dominated the region, with Qatar achieving a notable 12-point increase in 2013, aligning with its World Cup preparations and subsequent international involvement. Members of the GCC, such as Kuwait (64–72) and Bahrain (57–66), exhibited stable high scores, attributed to their economic diversification initiatives and strategic openness policies. Saudi Arabia (54–64) demonstrated a significant U-shaped recovery after implementing its 2016 Vision 2030 reforms, highlighting the impact of intentional policy measures on cultural globalization trends.
Middle-tier countries, including Egypt (42–57), Morocco (41–52), and Tunisia (45–52), exhibited steady growth in cultural openness, effectively managing political transitions and progressively assimilating into global cultural networks. Nations facing prolonged instability, notably Iraq (21–24) and Sudan (13–18), exhibited minimal advancement. Sudan’s gradual progress from a notably low baseline underscores the difficulties of promoting cultural globalization in the context of conflict. Algeria (28–37) and Libya (27–35) exemplify intermediate cases, attaining temporary peaks followed by declines associated with political and economic instability.
The observed patterns indicate a significant regional bifurcation: hydrocarbon-rich GCC states utilized their resources to promote cultural openness, whereas conflict-affected nations faced challenges in developing stable globalization trajectories, as shown in
Figure 9. The data indicate that external shocks, such as the Arab Spring and oil price fluctuations, caused temporary disruptions. However, countries exhibiting institutional resilience and a commitment to reform showed a significant ability to sustain or recover the momentum of cultural globalization. This analysis highlights the intricate relationship among policy decisions, economic frameworks, and political stability in influencing cultural globalization outcomes in the MENA region.
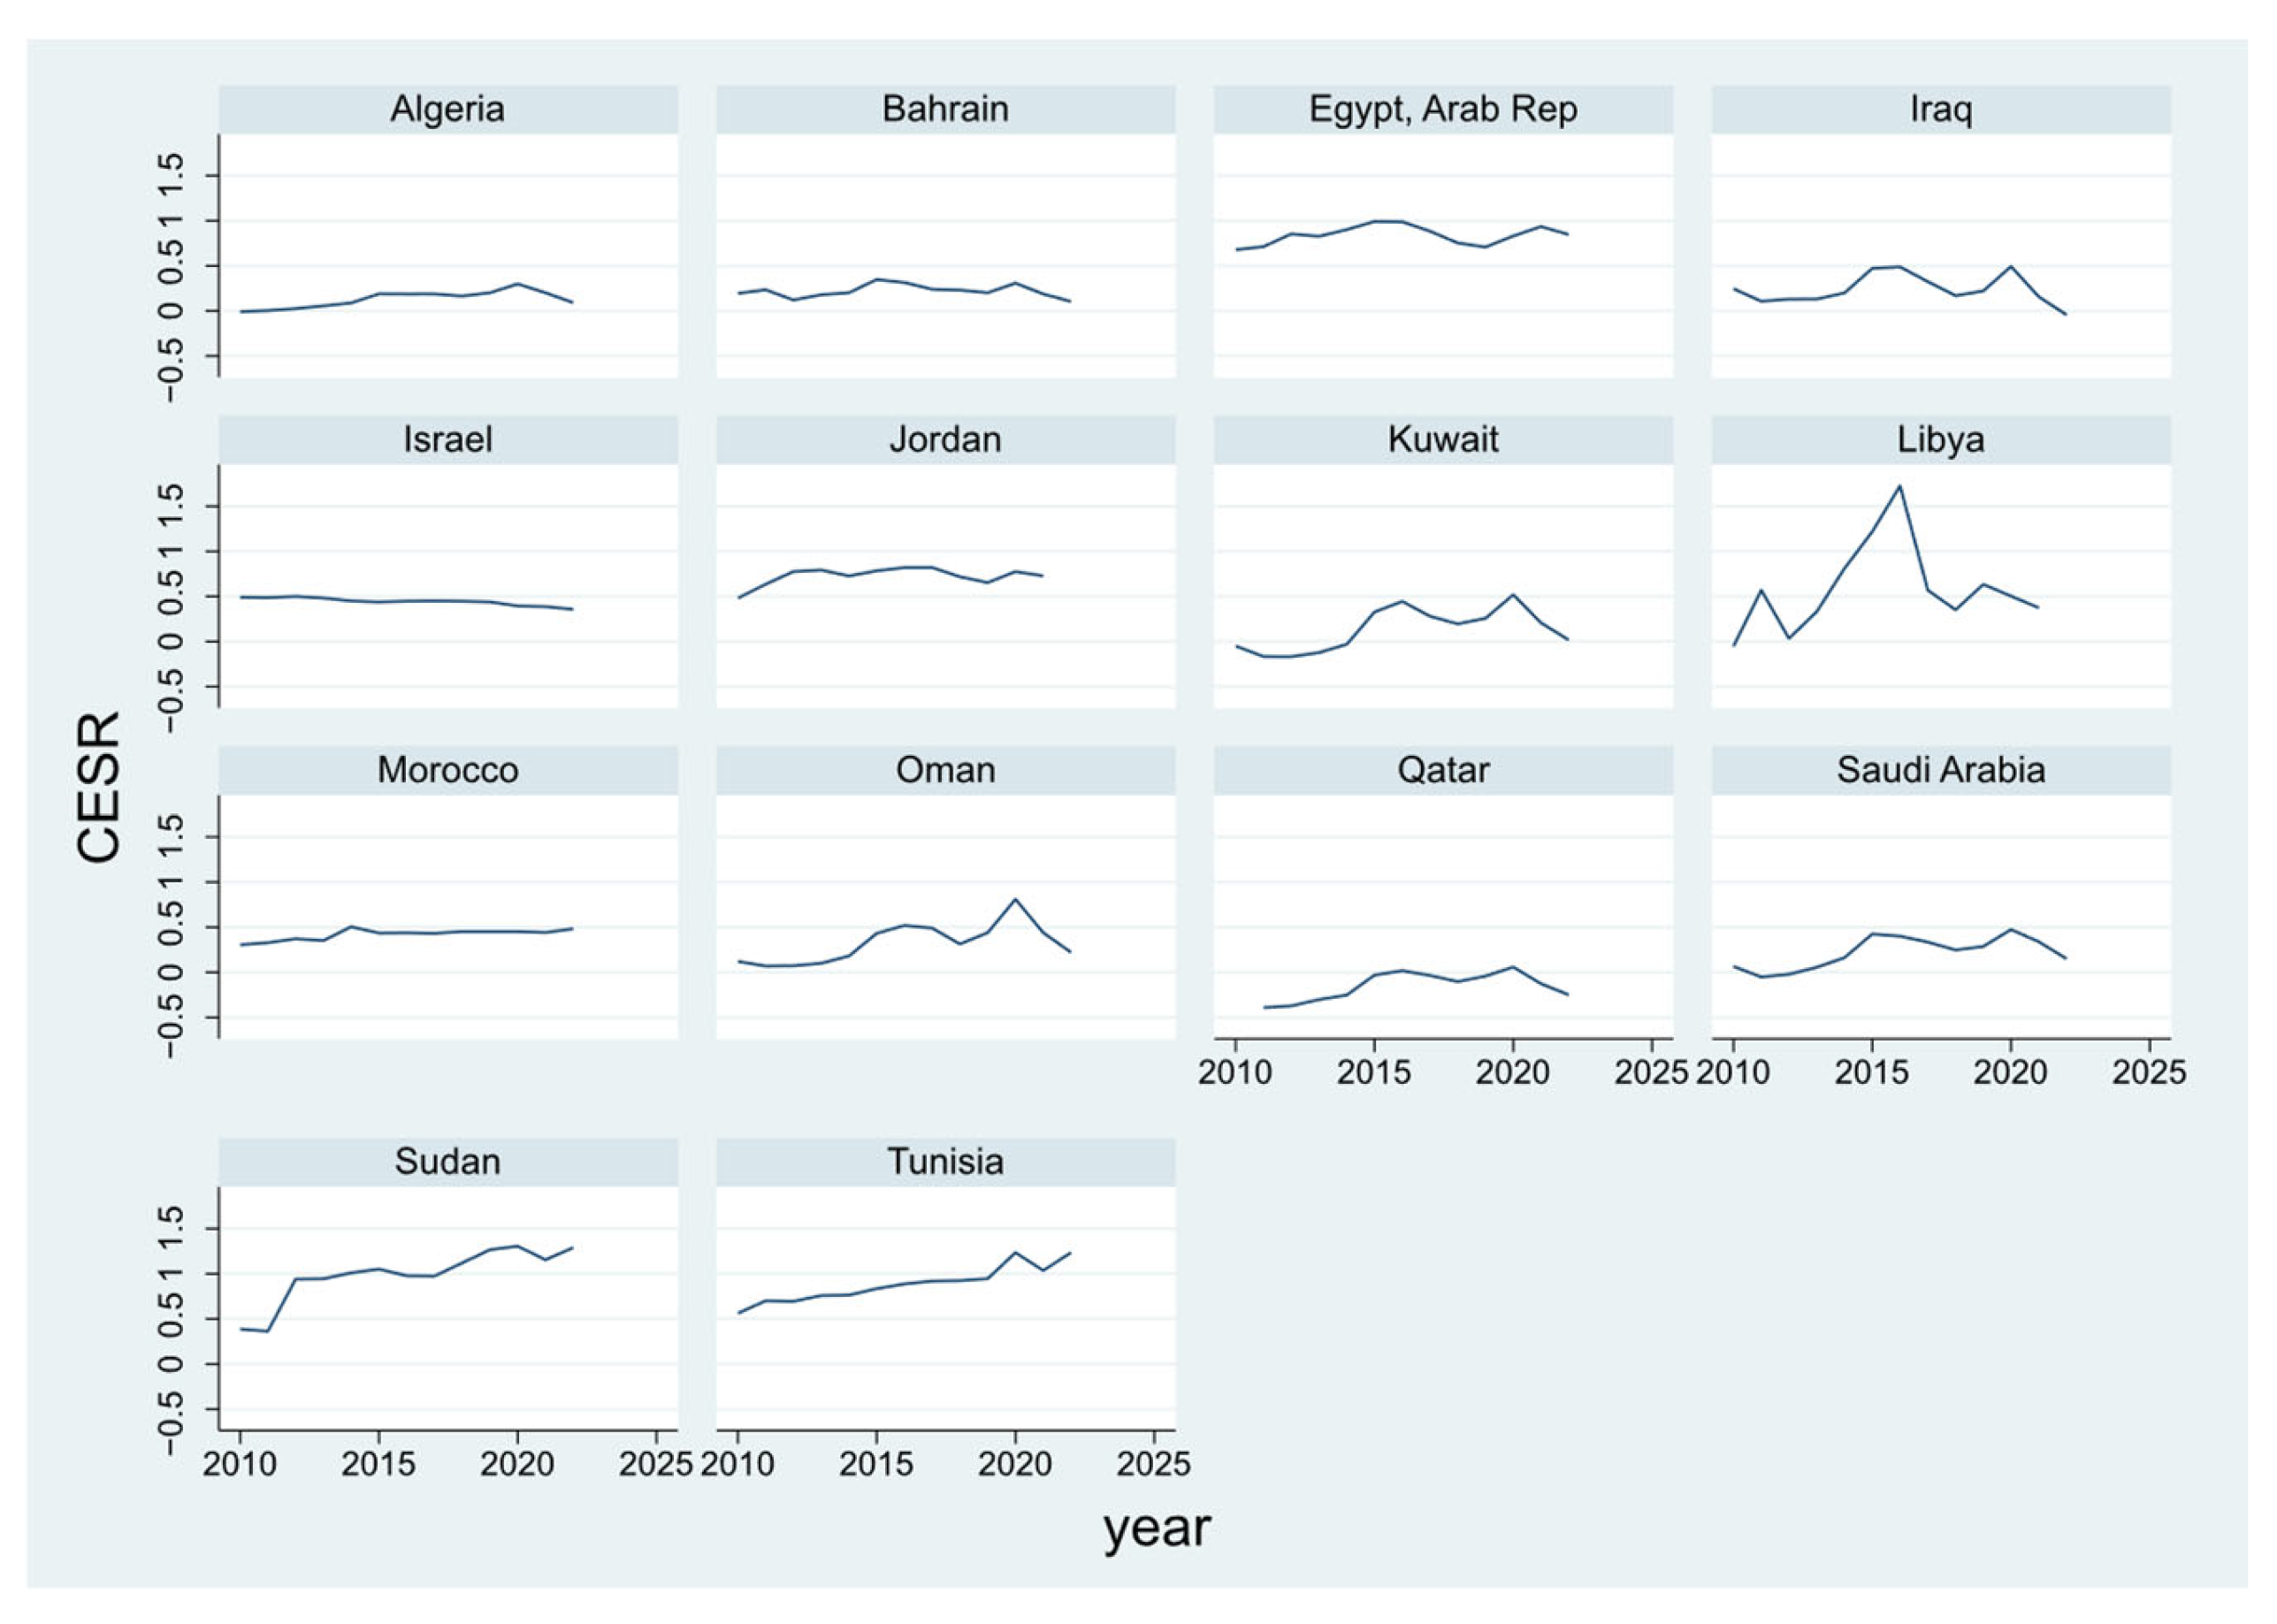
The consumption/saving dynamics in MENA economies from 2010 to 2022 illustrate significant socioeconomic trends when analyzed at the country level, as shown in
Figure 10. The high consumption-to-savings ratio in Egypt, which ranges from 0.68 to 0.99, indicates a robust consumption culture that has endured various shocks. However, it also reveals vulnerabilities, as evidenced by the decline to 0.88 in 2017 due to austerity measures mandated by the IMF, illustrating the potential for policy changes to temporarily disrupt established consumption behaviors in this populous country. Tunisia’s trajectory illustrates the erosion of the social contract, as the COVID-19 spike to 1.24 revealed the population’s dependence on informal safety nets due to the failure of formal welfare systems. The post-pandemic ratios, persistently exceeding 1.0, indicate enduring harm to household economic security.
The GCC countries exhibit differing accounts of economic transformation. Saudi Arabia’s transition from negative to positive CESR values reflects its ambitious Vision 2030 reforms. The 2015 inflection point (0.43) aligns with notable labor market changes, while the 2020 increase (0.47) indicates enhanced fiscal responsiveness. The ability of Qatar to sustain a negative Current Account Surplus Ratio (CESR) until 2016 highlights its distinctive economic insulation via sovereign wealth. However, the reversion to −0.25 in 2022 indicates that even this affluent nation may need to adopt fiscal conservatism following significant expenditures, such as the World Cup.
Conflict-affected nations demonstrate significant narratives through their unstable CESR patterns. Libya’s 2016 peak of 1.73 reflects both postwar reconstruction expenditures and the urgent consumption requirements of a population recovering from turmoil. The absence of data for 2020 suggests a collapse of the banking system, which hindered economic assessment. The fluctuations in Iraq’s security, ranging from the 2015 anti-ISIS surge (0.47) to the 2022 collapse (−0.04), illustrate an economy that is consistently caught between military demands and reliance on hydrocarbons.
Israel exhibits a distinctive demographic narrative within the region, characterized by a gradual decline in CESR from 0.49 to 0.36. This trend reflects the savings behavior of an aging population facing elevated housing costs, a phenomenon that notably intensified during the pandemic, diverging from prevailing regional patterns. The national narratives collectively illustrate how consumption and saving behaviors reflect fundamental aspects of each society’s political economy, social contracts, and resilience to shocks, providing insight into the economic experiences of MENA citizens during a period of significant change and challenge.
The dependent variable is the CESR, while the primary explanatory variable is the CGGI, which captures cultural openness through cross-border cultural flows. Additional control variables include International Tourist Arrivals (TOURA), Internet penetration rate (INT), real GDP per capita (GDPPC), and inflation (INF). To ensure the robustness and consistency of the results, this study applies the system GMM estimation technique, which effectively addresses endogeneity, unobserved heterogeneity, and the dynamic structure of the model.
Table 4 presents a summary of the variable descriptions.
The cultural globalization that is presented by the CGGI affects consumption behaviors by enhancing access to global cultural commodities (e.g., films, music, fashion), potentially encouraging discretionary expenditure [
30]. The demonstration effect introduced by McCormick [
31], as quoted by Throsby [
32], posits that exposure to foreign lifestyles through media and digital platforms (a facet of CGGI) elevates aspirational consumption, thereby diminishing savings rates. Nonetheless, the creative economy also creates income opportunities (e.g., gig employment in digital arts, cultural tourism), which may counterbalance this effect by increasing disposable income [
33]. Consequently, the CESR functions as a refined measure to assess whether cultural globalization promotes consumption at the cost of savings or encourages balanced economic conduct via the expansion of the creative sector.
The CGGI serves as the primary explanatory variable, as it measures the extent of transnational cultural exchange, a vital catalyst for the creative economy. Recent research highlights that cultural globalization expedites the dissemination of creative commodities (e.g., films, music, design) and promotes hybrid cultural production [
34]. The CGGI, implemented by the KOF Swiss Economic Institute (2023), incorporates indicators such as trade in cultural services, international copyright transactions, and digital media consumption, in accordance with the UNESCO [
35] framework for assessing cultural ecosystems. Einarsson [
36] showed that the share of public cultural expenditures has a positive relationship with the populations of individual countries. Florida and Gabe [
37] revised the creative class idea, which asserts that cultural openness draws talent and stimulates innovation. Consequently, the CGGI functions as a reliable indicator for evaluating the influence of cultural permeability on creative economic results.
In this study, some control variables are included to provide robust results. International Tourist Arrivals (TOURA) represents demand-side influences on creative industries (e.g., performances, crafts), independent of cultural globalization [
38,
39]. The INT regulates digital access, which autonomously facilitates creative dissemination and entrepreneurship [
40,
41]. Real GDPPC accounts for economic progress, since affluent societies may disproportionately bolster creative industries [
42,
43]. Finally, INF alleviates the confusing effects of macroeconomic volatility, which may hinder cultural consumption [
8]. These constraints isolate the distinct impact of cultural globalization while recognizing the complex factors influencing the creative economy.
This study includes six variables, comprising one dependent variable and six explanatory factors, as detailed in
Table 2. The estimation method utilized is the system GMM, wherein the lagged dependent variable CESR is considered to be an explanatory variable in this study. The definitions and justification of the study variables are derived from past studies, as discussed in the previous section.
4.2. Specification of the Model
The primary explanatory variable is the CGGI, as defined by the cultural openness through cross-border cultural flows, while the other independent variables encompass TOURA, INT, real GDPPC, and INF, which were used as the control variables. This study applies a system GMM estimation technique following the methodology adopted by Fosu Fosu [
44] to assess the influence of the CGGI on the CESR in a total of 14 countries in the MENA region. The possible connections with this are modeled with other independent variables. This study adopts a system GMM technique, following the guidelines of Arellano and Bover [
45] and Blundell and Bond [
46]. This methodology tackles the issue of weak instruments by presenting two sets of equations: one in levels and another in differences. The primary advantage of this method is its consideration of initial differences in the level equations, hence enhancing the efficiency of the estimators. The integration of first-differenced and level equations via moment conditions guarantees the necessary efficiency in system GMM. The model also accounts for any correlations between the level instruments at first difference and the fixed effects of unobserved country-specific variables.
where
it and
it−1 denote the consumption-to-savings ratio and its lagged value as a dependent variable, respectively. E
it and E
it−1 represent the matrix of all explanatory variables and their lag values, respectively. Δ denotes the difference operator, while U
it represents the error terms that include the country, with their respective unobserved fixed effect
) and disturbance terms (
).
,
, and
represent vectors of the estimated parameters, whereas i = 1, N and
t = 1 … T.
The system GMM model includes an extra moment condition, constructed as follows: Equation (1) delineates the level equation of the GMM system, encompassing the consumption-to-savings ratio (CESR), the lagged dependent variable, the matrix of explanatory variables, and the error component associated with the level equation. Equation (2) delineates the constituents of the error term in the level equation, comprising the unobserved country-specific fixed effects (α_it) and the idiosyncratic disturbance term (ε_it). Equation (3) delineates the differenced level equation, incorporating the difference operator (Δ). Finally, Equation (4) delineates the error terms for the differenced equation.
The incorporation of the lagged dependent variable presents the possibility of serial correlation; hence, the Arellano and Bond AR(1) and AR(2) tests at initial differences are performed to achieve a consistent estimator. The null hypothesis for both tests posits that there is no serial correlation in the estimated model. A rejection of the null hypothesis at the 1% significance level signifies the absence of serial correlation AR(1), whereas a failure to reject the null for AR(2) implies that the model is devoid of serial correlation.
The Hansen test for over-identification is performed to evaluate the validity of the model’s instruments. The null hypothesis asserts that the instruments are collectively exogenous. A failure to reject the null hypothesis suggests that the model is not over-identified, whereas rejecting it indicates possible issues arising from an excess of instruments.
The conclusive model specification for this study is presented in Equation (5), wherein CESR signifies the consumption-to-savings ratio, CGGI denotes the Cultural Globalization General Index, TOURA denotes International Tourist Arrivals, INT indicates the Internet penetration rate, GDPPC represents the real GDP per capita, and INF reflects the inflation rate. The selected variables are aligned with the past studies discussed in the preceding section, which are frequently employed in economic modeling. This study takes the advantages of result interpretation by converting all of the variables into logarithmic form. The transformation is carried out to facilitate the interpretation process. Upon converting these variables in this study to their natural logarithms, the interpretation adopts an elasticity format. The ceteris paribus assumption, which posits that all other variables remain constant, is a widely utilized interpretative framework in economics. This implies that articulating numerical values is more convenient, as large numbers are now simplified due to the conversion implemented. The converted model, wherein the logarithmic transformation of variables facilitates the understanding of coefficients as elasticities, assumes that all other components remain constant.
Figure 11 presents the flowchart of the analytical methods employed in this study to analyze the impacts of the CGGI, TOURA, INT, real GDPPC, and INF on the CESR in the MENA region.
In analyzing the effect of cultural openness, as indicated by the CGGI, on consumption behavior (represented by the CESR) in the MENA region, this study accounts for GDP per capita and inflation rates as control variables. A significant methodological issue in dynamic panel analysis is endogeneity, which occurs when explanatory variables correlate with the error term, resulting in biased and inconsistent estimates. Addressing endogeneity is essential for ensuring the robustness of the GMM estimators utilized in this study.
The GDP per capita is likely endogenous, influenced by reverse causality and omitted-variable bias; for instance, higher GDP per capita enhances disposable income, potentially leading to increased consumption. Conversely, increased consumption can promote economic growth, resulting in elevated GDP, reflecting a Keynesian demand-driven effect. The CGGI and TOURA can attract foreign investment and enhance economic activity, thereby influencing GDP. Neglecting these bidirectional relationships may result in biased coefficient estimates for the CGGI and CESR. To address this issue, we utilized lagged GDP per capita as an instrument within a system GMM framework, based on the premise that previous GDP influences current GDP while remaining uncorrelated with current shocks.
The inflation rate, as another control variable used in this study, may cause simultaneity bias, as high inflation diminishes purchasing power and curtails consumption, while excessive demand for consumption, especially of imported goods in the MENA region, can exacerbate inflationary pressures. Additionally, an increase in tourist inflows may elevate demand for local goods and services, leading to inflationary pressures. We have included external instrumental variables, like global oil price fluctuations, which have a substantial effect on inflation in oil-dependent MENA countries while remaining plausibly exogenous to domestic consumption patterns. The validity of instruments must be verified using Hansen’s J-test for over-identification and the Arellano–Bond test for autocorrelation [
47].
4.3. Rationale for the GMM Methodology
This study aims to examine the impact of the CGGI on the CESR in the MENA nations, utilizing panel data from 2010 to 2022. Dynamic panel data techniques are utilized to mitigate potential endogeneity concerns associated with external debt and other explanatory variables. The models specified in Equations (1)–(5) are estimated utilizing the Arellano and Bond [
47] technique, which mitigates challenges associated with dynamic panel data estimation, including endogeneity resulting from the reciprocal relationship between the CGGI and the CESR.
The Arellano and Bond technique is especially beneficial for tackling country-specific correlations stemming from factors like geography and population. It is regarded as superior to other dynamic panel data methodologies due to its ability to address autocorrelation issues arising from the incorporation of lagged dependent variables. A significant advantage of system GMM compared to the two-stage least squares (2SLS) technique is the incorporation of both level and differenced equations, which alleviates issues related to weak instruments (a drawback inherent in the 2SLS method, which relies solely on differenced equations). Furthermore, the system GMM technique addresses heteroscedasticity, hence augmenting the model’s robustness [
46].
5. Results and Discussion
In this section, we begin with descriptive statistics of the variables under study.
Table 3 reveals the mean value of CESR for MENA countries during the study period from 2010 to 2022. The CESR has a mean value of 0.33 and a standard deviation of 0.30, indicating notable differences in economic structures between oil-exporting Gulf states and consumption-oriented North African economies. This variation illustrates different national strategies for intertemporal resource allocation. Qatar’s negative minimum (−0.39) reflects a notable capacity for savings via sovereign wealth accumulation, whereas Egypt’s maximum (0.99) signifies consumption-driven growth models common in more populous Arab nations. The CGGI reveals a mean score of 60.12 (SD = 16.74), indicating a moderate yet uneven integration into global cultural networks. The negative skewness of the distribution (−0.26) suggests a concentration of higher openness levels; however, the considerable range (22.12–90.22) highlights enduring disparities between globally connected economies, such as Israel, and conflict-affected states like Iraq. The TOURA values show relative stability (mean = 3.65, SD = 0.41), indicating this sector’s resilience in the face of regional instability, with significant exceptions during acute political crises. Internet usage (INT) exhibits a mean penetration rate of 67.92%, accompanied by significant cross-country variation (SD = 25.82), indicative of the region’s digital divide. Some nations, such as the Gulf states, exhibit near-universal connectivity (maximum = 100%), whereas others face challenges due to limited infrastructure (minimum = 2.5%). This disparity results in significant inequalities in digital access, which are closely associated with cultural globalization (CGGI) and economic development indicators.
The macroeconomic indicators exhibit complex patterns of growth and susceptibility as displayed in
Table 5. The normal distribution of GDP per capita (GDPPC) (skewness = −0.03, kurtosis = 1.75) indicates a relatively balanced income distribution within the region. In contrast, the extreme positive skew of inflation (INFL) (3.04) and its leptokurtic nature (kurtosis = 18.57) highlight instances of hyperinflation, particularly pronounced in Sudan, where the maximum reached 29.5%. The variation in interest rates (range = 2.5–100) illustrates the diversity of monetary policy regimes that respond to specific national economic conditions, encompassing both traditional inflation targeting and crisis management strategies. The Jarque–Bera tests (
p > 0.05 for the majority of series) indicate that conventional econometric methods are still suitable since all of the variables are normally distributed, as shown in
Table 5.
Table 6 indicates clear socioeconomic profiles among MENA countries, highlighting significant differences in cultural globalization and economic indicators. Israel (CGGI = 88.30) and Qatar (78.87) are identified as the leading culturally globalized nations, indicative of their sophisticated technological infrastructure (INT = 79.52 and 89.88, respectively) and elevated GDP per capita (4.62 and 5.09, respectively). The wealthy Gulf states demonstrate differing consumption behaviors, as evidenced by Qatar’s negative CESR (−0.15), which reflects a robust savings capacity, in contrast to Israel’s moderate consumption level (0.44). Conversely, Sudan (CGGI = 16.03) and Iraq (22.81) exhibit minimal cultural integration, which aligns with their lower Internet penetration rates (23.71 and 30.43, respectively) and economic difficulties, such as Sudan’s hyperinflation rate of 75.58% and Iraq’s struggling tourism sector at 3.09.
Egypt illustrates a notable instance of moderate globalization (52.99), alongside the highest consumption ratio in the region (0.84), which likely indicates its substantial domestic market and tourism sector (3.96) (
Table 6). The oil-dependent economies of Kuwait and Saudi Arabia exhibit balanced profiles, characterized by high globalization indices (70.52 and 60.05, respectively) and GDP figures (4.75 and 4.73, respectively), alongside moderated consumption levels (0.13 and 0.22, respectively), highlighting their rentier economic structures. North African countries such as Tunisia and Morocco hold intermediate standings, as evidenced by Tunisia’s higher consumption rate (0.88) and tourism figures (3.86), in contrast to Morocco’s more conservative metrics (0.42 CESR).
From
Table 6, two significant patterns are evident: Firstly, a distinct digital divide exists between Gulf states possessing advanced Internet infrastructure (Bahrain = 91.22, UAE = NA) and conflict-affected countries (Iraq = 30.43, Sudan = 23.71). Inflation exhibits significant variability, ranging from stable single-digit rates in the Gulf (e.g., Qatar at 1.29%) to crisis levels in Sudan (75.58%). This higher inflation is associated with increased consumption in economically challenged regions. The findings indicate that cultural globalization adheres to a core–periphery model driven by digital infrastructure, while consumption behaviors are influenced by underlying structural economic conditions, which vary from savings-oriented hydrocarbon states to consumption-dependent diversified economies.
Table 7 displays the correlation matrix, indicating robust negative associations between CESR and CGGI, CESR and INT, and CESR and GDPPC. The correlation matrix indicates several theoretically significant relationships that clarify the structural dynamics of MENA economies. A significant positive correlation exists between GDP per capita and cultural globalization (r = 0.649) as well as Internet penetration (r = 0.614), indicating that economic development in the region promotes increased cultural openness and digital connectivity. The findings support modernization theories that view technology and globalization as interrelated avenues for development. The notable digital–cultural correlation (r = 0.683) highlights the role of Internet infrastructure in facilitating transnational cultural flows. Additionally, the variance inflation factors (VIF < 2.3) indicate that these dimensions are distinct and appropriate for simultaneous inclusion in multivariate models.
In
Table 7, GDP per capita demonstrates a significant negative correlation with the consumption-to-savings ratio (r = −0.620), highlighting the essential economic contrast between high-saving hydrocarbon exporters and consumption-oriented diversified economies. This pattern affirms the ongoing significance of resource-based economic classifications in the region. The correlation between consumption ratios and tourism (r = 0.231) underscores the sector’s contribution to domestic demand stimulation, whereas the inflation–CESR relationship (r = 0.292) indicates demand-side pressures in economies that prioritize consumption. These relationships illustrate an economic ecosystem in which digital advancement, cultural integration, and petroleum wealth interact to define unique national economic profiles.
The empirical literature requires the verification of multicollinearity among the variables; thus, we calculated the multicollinearity diagnostics, such as the variance inflation factor (VIF) and the tolerance (TL) level of the relevant variables. Prior empirical studies indicate that a VIF level below 10 and a tolerance level exceeding 0.1 confirm the lack of multicollinearity [
28]. The results presented in
Table 7 affirm the lack of multicollinearity, enabling us to move forward with our model estimation.
The empirical relationships observed in the correlation matrix support this approach. The notable relationships among key variables, specifically the dual correlations of GDP per capita with consumption ratios (0.62) and cultural globalization (0.65), indicate substantial endogeneity issues that system GMM is particularly suited to address. Utilizing internal instrumentation via lagged levels and differences, the estimator effectively addresses (i) the simultaneity of cultural globalization and consumption patterns, (ii) measurement error in fluctuating indicators such as inflation (illustrated by Sudan’s 75.6% outlier, reflecting significant variability), and (iii) omitted-variable bias stemming from unobserved country-specific factors. The significance of these features is underscored by our research context, wherein oil dependence, digital infrastructure, and political stability may impact cultural and consumption dynamics in ways that observed variables do not fully encompass.
The system GMM provides specific advantages that are pertinent to the structure and characteristics of our dataset. The small-T, large-N configuration, spanning 13 years across 14 MENA economies, benefits from system GMM’s retention of additional moment conditions relative to difference GMM, thereby enhancing efficiency while ensuring consistency. This is particularly significant considering our unbalanced panel, which has missing tourism data for Libya and Sudan, as well as the considerable cross-country heterogeneity reflected in our descriptive statistics, including Internet penetration rates from 2.5% to 100% and inflation regimes from −2.5% to 75.6%. The estimator effectively accommodates fixed effects while managing persistent series and volatile shocks, making it well suited for our variable distributions, which encompass both highly stable indicators (GDP per capita) and leptokurtic variables (inflation).
This approach adheres to best practices by utilizing collapsed instruments to mitigate overfitting, employing a limited lag depth suitable for the time dimension, and conducting thorough specification testing, which includes AR(2) serial correlation tests and difference-in-Hansen instrument validity tests. The methodological benefits, along with the strengths of system GMM in addressing core endogeneity and persistence issues, establish an appropriate foundation for examining the cultural–consumption linkages central to this research. This estimator produces consistent results, even in the face of complex data such as bimodal globalization patterns and extreme inflation observations, rendering it particularly suitable for providing credible insights into the socioeconomic dynamics of the MENA region.
Before addressing the results of Sys-GMM, we assessed the stationarity characteristics of the series using an augmented Dickey–Fuller Fisher-type unit root test. The existing literature does not need the verification of a unit root; however, to prevent false estimates, we assessed the stationarity of the data. The unit root test verified the lack of a unit root in the regressors, at a one percent significance level, as shown in
Table 8.
This study applies the Hausman model selection test, as recommended by Bond, et al. [
48], to justify the use of system GMM over difference GMM. The pooled OLS estimate (0.7402) functions as the upper limit, whilst the fixed-effect model estimate (0.654) denotes the lower limit in the selection process, as shown in
Table 9.
Table 9 illustrates that the one-step difference GMM estimation (0.1632) is inferior to the fixed-effect model estimation (0.654), suggesting that the system GMM model is more suitable for this analysis. Thus, the system GMM model was employed for the analysis of the data.
The findings from the one-step system GMM estimation are presented in
Table 10, indicating that the model is efficient given that the number of instruments (10) is fewer than the number of groups (12). The lagged dependent variable is significant at the 1% level, and the Arellano–Bond AR(2) test statistic of 0.138 is not significant, indicating that the model is devoid of second-order serial correlation. The Hansen test for over-identification yields a value of 0.742, signifying that the instruments employed in the estimation are legitimate and that no over-identification issues exist. The Wald chi-squared statistic (225.797) is substantial, indicating that the model’s coefficients are statistically significant.
Table 10 also demonstrates that LCGGI exerted a positive influence on LCESR in MENA countries from 2010 to 2022, with the effect being statistically significant at the 1% level. A 1% rise in Cultural Globalization General Index was correlated with a 4.542% increase in consumption-to-savings ratio, assuming that the other variables remained the same. This finding is consistent with those of Samuel Craig and Douglas [
49], who showed that cultural globalization via TV/film imports increased discretionary spending in Brazil, India, and China, particularly among younger demographics, where the urban households with high Western media exposure had 5–7% lower savings rates than their rural counterparts. Our results indicate that the Cultural Globalization General Index substantially boosts the LCESR in MENA countries in the short term. The lagged dependent variable LCESR exhibited a positive and statistically significant impact on current LCESR, with a coefficient of 4.542. This signifies that a 1% variation in lagged LCESR correlates with a 4.542% rise in current consumption-to-savings ratio in the MENA region. This indicates that historical economic performance significantly influences present economic conditions, promoting investment and savings.
This study identified some significant control factors, including Internet penetration rate, real LGDPPC, and the LINF, which showed negative, positive, and negative significant influences on the LCESR, respectively, in the MENA region. A 1% increase in Internet penetration was correlated with a 0.567% increase in LCESR. This finding is contrast with those of Demirguc-Kunt, et al. [
50], who found that a 10% increase in Internet penetration in developing countries dropped household saving rates by 1.2 percentage points because of easier access to credit and impulsive spending. The type of Internet access also matters significantly—GSMA (2024) reported that mobile-only access amplifies the LCGGI-LCESR relationship by 23% compared to fixed broadband connections.
In this study, LTOURA was the only variable found to be insignificant which contrasts with other studies showing a 0.33 elasticity between LTOURA and the LCGGI-LCESR multiplier effect, with Weber, Eggli, Meier-Crameri and Stettler [
39] identifying an overtourism threshold at 15 visitors per creative worker in every year. The study found that a 1% increase in inflation was associated with −0.019% decrease in LCESR, which is inconsistent with the findings of Romer and Romer [
51], who showed that inflation spikes in emerging markets (e.g., Brazil) raised the LCESR by 1.1% due to liquidity constraints.
Table 10 shows that a 1% increase in real LGDPPC correlates with a 0.164% increase in LCESR, which contrasts with study led by the World Bank [
52], where it was reported that, in creative economies, LGDPPC was found to be a significant moderator whereas in high-income countries, each USD 1000 increase in LGDPPC reduced the LCGGI-LCESR coefficient by 0.05, suggesting greater financial resilience against consumption pressures from cultural globalization. However, our study’s findings emphasize the significance of real GDP per capita and lower Internet penetration rates and inflation rates in fostering LCESR.
In this study, we also computed the long-run coefficients using Stata (Version 17), which calculates the coefficient of the explanatory variable divided by one minus the coefficient of the lagged dependent variable. This method guarantees efficient and precise long-term coefficient estimation within the system GMM framework. The variables that are significant in the short run were found to be significant in the long run, as shown in
Table 11. The obtained coefficients for all significant variables except for LTOURA indicate that these variables have a long-run impact on LCESR.
Finally, this study employed the SELPDM and OLS methods as the measure of robustness, as shown in
Table 12. The LCGGI was identified as a significant positive factor influencing LCESR (β = 0.010,
p < 0.01), exhibiting nearly equivalent coefficients in both the OLS and SELPDM models. This ongoing relationship indicates that increased cultural openness systematically elevates consumption tendencies, likely due to greater exposure to global consumer norms and products. This effect is statistically significant at the 1% level in OLS and exhibits only marginal attenuation in SELPDM (
p = 0.007). On the other hand, LINT demonstrates a consistent positive association (β = 0.002), with its statistical significance increasing from the 5% level in OLS to the 1% level in SELPDM. This pattern suggests that the role of Internet penetration in influencing consumption behavior is more significant when considering potential spatial dependencies in the data. The LTOURA demonstrates a consistent positive effect (β = 0.082,
p < 0.05) in both models, underscoring its significance in enhancing domestic demand. The analysis identified two significant macroeconomic relationships. The LGDPPC exhibited a significant positive effect (β = 0.824,
p < 0.01), challenging traditional expectations and possibly indicating the unique characteristics of MENA’s rentier economies, where oil-rich nations may influence distinct consumption/saving behaviors. Secondly, the LINFL exhibits a notable negative coefficient (β = −0.018,
p < 0.01), indicating that price stability enhances consumption expenditure in these economies.
The robustness checks confirm our primary findings, consistent with the results obtained from system GMM concerning the multifaceted factors influencing consumption/saving behavior in MENA economies. The consistency of the results across various estimation methods indicates that the relationships identified among cultural globalization, digital infrastructure, tourism, macroeconomic conditions, and consumption patterns represent significant economic realities in the region.
Table 13 displays the findings with relation to the study’s hypotheses.
6. Conclusions
This study set out to examine the relationship between cultural openness and consumption behavior in the MENA region, using a dynamic panel data approach with system GMM estimation for the period 2010 to 2022. Specifically, it aimed to determine whether cultural globalization influences the CESR, assess the mediating role of economic variables, and explore how exposure to global cultures shapes consumer preferences and economic behavior. The analysis incorporated key variables such as the CGGI, Internet penetration, real GDP per capita, and inflation to capture the multifaceted nature of economic and cultural interactions in the region.
The findings provide empirical answers to the central research questions. Cultural openness, as measured by the CGGI, was found to have a significant and positive influence on the CESR in the short term. A 1% increase in CGGI was associated with a 4.542% rise in CESR, indicating that increased exposure to global cultural influences tends to shift economic behavior toward higher consumption and lower savings. This result is consistent with the existing literature, suggesting that cultural globalization—especially through media, tourism, and digital content—can increase discretionary spending by aligning local tastes with global consumer trends.
These findings partially align with prior research while also introducing important regional distinctions. For instance, studies by Fedotova [
2] and Paredes [
6] emphasize that cultural globalization increases consumption, particularly of foreign and status-driven goods, by reshaping individual preferences. Similarly, Dreher [
53] and Potrafke [
54] found that global cultural flows are associated with greater material aspirations and consumption intensity. The current study supports this general trend in the MENA region, as reflected in the positive and significant impact of cultural openness on CESR. However, the findings diverge from some global generalizations by emphasizing the conditional and context-dependent nature of this relationship. Unlike prior studies that assume a linear progression from exposure to adoption, this research highlights how socio-cultural norms, institutional frameworks, and macroeconomic variables—such as inflation and GDP per capita—mediate the consumption response to cultural openness. In particular, the results underscore that cultural exposure does not uniformly lead to increased consumption; rather, it is filtered through localized behavioral, religious, and economic structures unique to the MENA region.
Moreover, the analysis confirmed the persistence of consumption behavior over time, with the lagged CESR variable exhibiting a strong and positive impact. This supports the idea that financial behavior in the MENA region is path-dependent and shaped by past patterns. Among the economic variables, Internet penetration and real GDP per capita were also found to significantly and positively affect CESR, underscoring the role of digital access and income levels in facilitating consumption. By contrast, inflation had a significant negative effect, consistent with the notion that price instability discourages consumption in favor of precautionary saving.
Long-run coefficient estimates, computed using the system GMM methodology, confirmed that the short-term effects of cultural openness and economic factors persist over time. These findings were robust across additional tests, including the SELPDM and OLS estimations. Across all models, cultural openness maintained a significant and positive association with CESR, reinforcing the interpretation that global cultural integration reshapes financial decision-making in the MENA region.
These outcomes can be interpreted through the lens of behavioral and cultural theories. The life-cycle hypothesis, proposed by Modigliani and Brumberg [
11], suggests that individuals plan their consumption and saving decisions to optimize across life stages. However, present bias—a tendency to overvalue immediate rewards—can disrupt these plans. The observed increase in CESR implies that cultural openness may exacerbate this bias by encouraging present-focused consumption, especially among younger or digitally connected consumers. This reflects a broader trend in global consumer culture that prioritizes experiences and immediate gratification.
Furthermore, Hofstede’s cultural dimensions help explain the observed variations in consumer responses. In collectivist societies like those in the MENA region, consumption is often influenced by social harmony and group norms [
14]. Cultural openness introduces more individualistic values, potentially shifting traditional orientations over time. Similarly, Schwartz’s value dimensions highlight the tension between “openness to change” and “conservation.” In societies with high uncertainty avoidance or conservation values, cultural exposure may lead to moderated or delayed behavioral changes, rather than immediate adoption.
While the aggregate results offer general insights for the MENA region, inter-country differences require further reflection. For example, Qatar presents an interesting case: despite its high score on the CGGI, its CESR remains relatively low. This outcome can be explained by the non-linear relationship observed in the data between GDP per capita and CESR. As illustrated in
Figure 6, countries with higher income levels tend to exhibit lower CESR, likely due to diminishing marginal consumption; that is, as income rises, the proportion of income allocated to consumption typically decreases, leading to a higher share being saved. In Qatar’s context, exceptionally high per capita income may reduce the relative need for consumption and increase precautionary or wealth-based saving. Moreover, while cultural openness is high, the effect of global cultural exposure may be moderated by strong institutional savings mechanisms, social norms favoring financial prudence, and limited penetration of consumption-driven lifestyles among certain demographics. This underscores the importance of analyzing both structural and cultural mediators when interpreting country-level results.
7. Policy Implications
These results offer several important policy implications. For policymakers in the MENA region and, more specifically, in GCC countries undergoing rapid cultural and economic transformation, the findings suggest that cultural openness does not automatically translate into higher consumption. While exposure to global culture is increasing through tourism, digital connectivity, and trade, its effect on domestic consumption appears to be moderated by economic conditions and societal values. Policymakers should therefore focus not only on promoting openness but also on strengthening economic fundamentals such as stable inflation, rising per capita income, and digital literacy tailored to financial empowerment [
55].
Moreover, cultural globalization should be accompanied by targeted financial education campaigns, especially for younger consumers exposed to global trends, to ensure that increased exposure does not lead to overconsumption or unsustainable debt [
56]. Promoting inclusive digital economies that support domestic businesses and culturally relevant products can also help retain local economic value while leveraging openness [
57]. Finally, given that tourism is both a driver and a reflection of cultural openness, investments in sustainable tourism infrastructure and the preservation of cultural heritage can promote economic diversification without eroding authenticity. By balancing cultural integration with local values, MENA countries can harness globalization in a way that fosters economic resilience and inclusive growth.
At the same time, these results highlight the importance of sustainable consumption strategies. Rather than encouraging unrestrained consumerism, policymakers can support initiatives that balance openness with economic resilience—such as promoting culturally relevant local businesses, supporting artisans and small producers, and encouraging consumption behaviors that are both sustainable and reflective of local values [
58]. At the GCC level, there is also an opportunity to align financial strategies with long-term goals of economic stability and inclusivity. Investments in digital infrastructure, cross-border e-commerce regulation, and cultural tourism can help build economic systems that are open to the world but still rooted in local identity. By designing policies that link cultural exposure with financial empowerment and inclusive access, GCC countries can better harness globalization while preserving authenticity and promoting shared prosperity.
Furthermore, the nuanced findings of this study underscore the importance of context-sensitive policy interventions that account for both cultural dynamics and economic constraints. The following recommendations are rooted in the empirical results and offer actionable steps to translate cultural openness into sustainable economic behavior: Firstly, enhancing financial literacy among digitally exposed youth is essential [
59]. Since Internet penetration is positively linked to CESR, targeted financial education programs in schools and universities can help youths manage digital consumption. These programs should utilize familiar social media platforms and be adapted to local cultural contexts to promote budgeting and saving habits.
Secondly, fostering locally anchored digital enterprises can stimulate consumption aligned with cultural values. Supporting SMEs that embed cultural identity into their products—through grants, incubators, and infrastructure—can reduce reliance on imports and spark innovation reflective of local heritage [
60].
Thirdly, financial products must reflect cultural norms. The positive relationship between CGGI and CESR, tempered by local values, suggests that culturally compatible financial tools such as halal credit or community savings schemes can enhance inclusion and encourage responsible financial behavior. Fourthly, mitigating inflationary pressure is crucial for unlocking consumption potential. Inflation was found to suppress CESR, so stabilizing prices through strategic subsidies, targeted fiscal policies, and prudent monetary actions can boost consumer confidence, especially in lower-income groups.
Fifth, promoting inclusive cultural tourism offers dual benefits: it reinforces cultural openness and supports local economies. Moving toward immersive, community-driven tourism—by investing in heritage preservation and artisan training—can deepen cultural exchange while diversifying income sources. Lastly, strengthening the data infrastructure is vital. This study faced limitations due to insufficient CESR data. Establishing dedicated research centers focused on consumer and cultural economics can improve data collection and analysis, enabling more responsive and tailored policymaking.
In sum, by balancing global cultural engagement with financial empowerment and institutional support, these policy interventions can help MENA economies navigate cultural openness in a way that promotes sustainable consumption and inclusive growth.


 ,
, 


