
Preparation and Application of Wetland-Plant-Derived Biochar for Tetracycline Antibiotic Adsorption in Water

Abstract
1. Introduction
2. Materials and Methods
2.1. Experimental Materials
2.2. Preparation of Biochar
2.2.1. Labeling of Biochar
2.2.2. Preparation of Primitive Biochar
2.2.3. Preparation of KOH-Modified Biochar with Different Proportions
2.2.4. Preparation of Biochar at Different Pyrolysis Temperatures
2.3. Analysis and Testing Methods
2.3.1. Antibiotic Adsorption Experiment
2.3.2. Detection Methods for Antibiotics
2.3.3. Microscopic Testing Methods
2.3.4. Common Salts and Recycling Experiments
2.3.5. Adsorption Kinetics
2.3.6. Adsorption Isotherm
3. Results and Discussion
3.1. Optimization of Preparation Conditions for Biochar
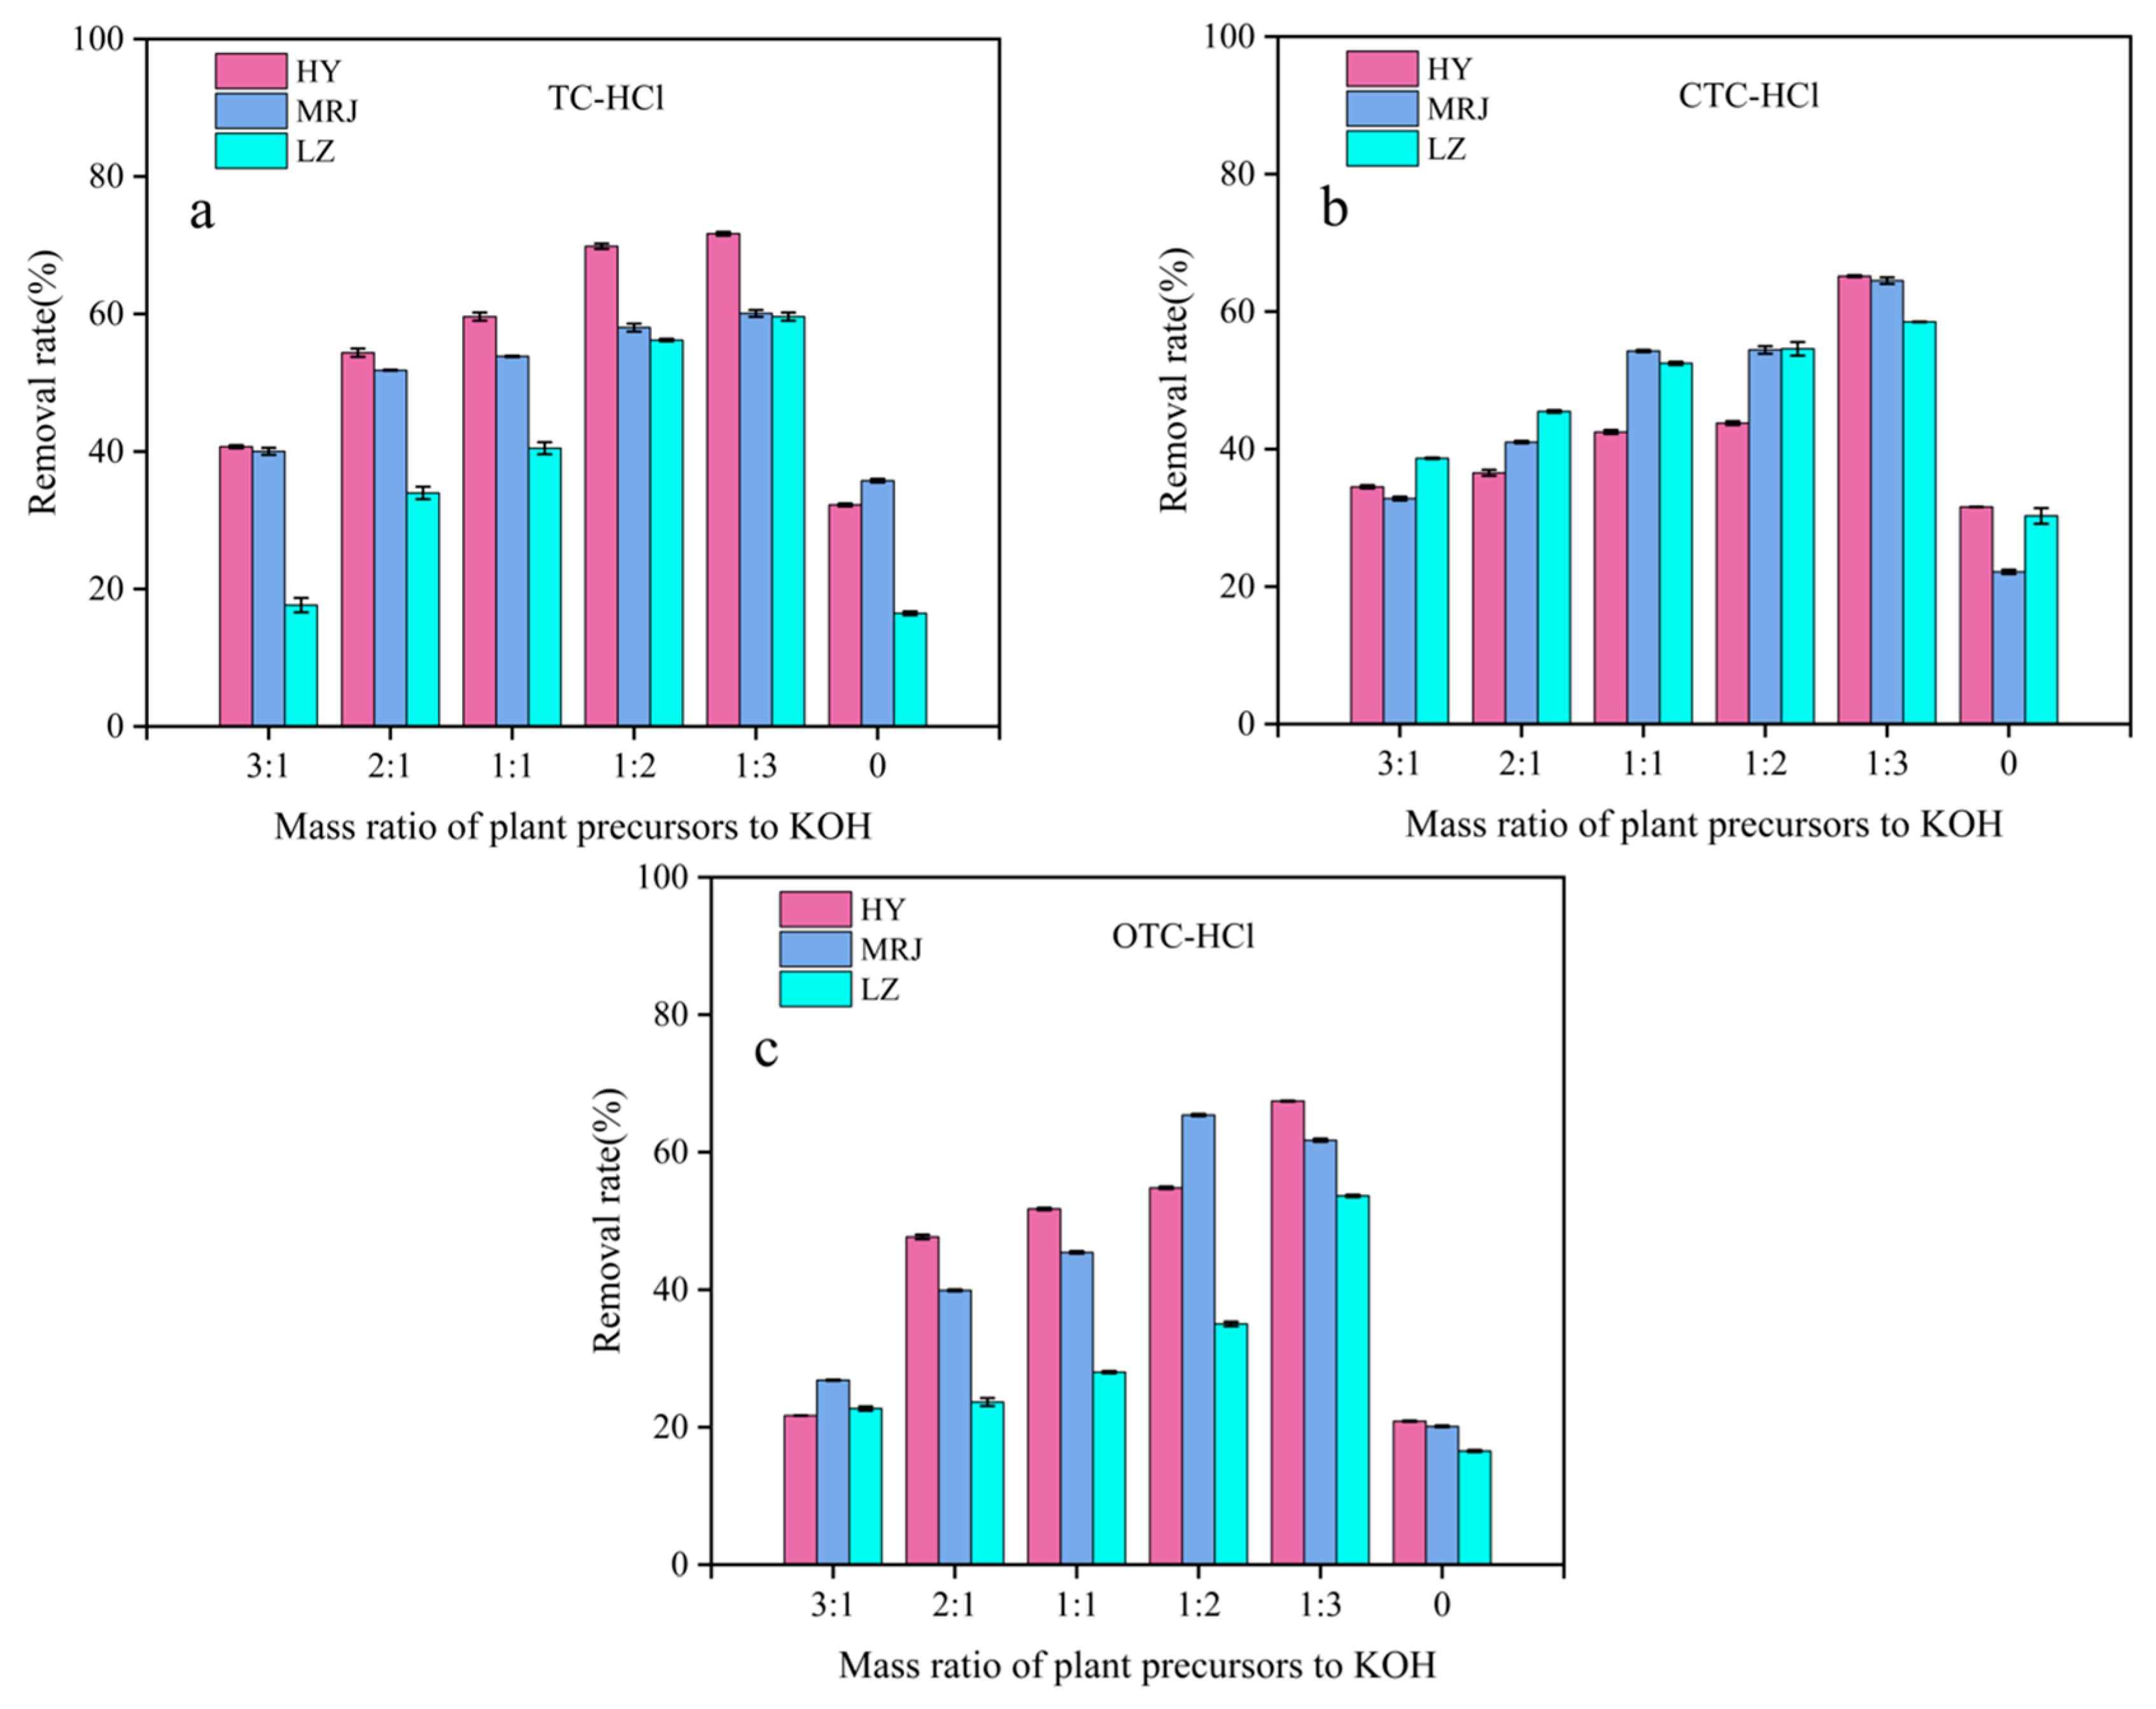
3.1.1. Impact of the KOH Proportion on the Adsorption Effectiveness of Modified Biochar
3.1.2. Influence of Pyrolysis Temperature on the Adsorption Effectiveness of Modified Biochar
3.2. Microscopic Characterization of Biochar Properties
3.2.1. SEM
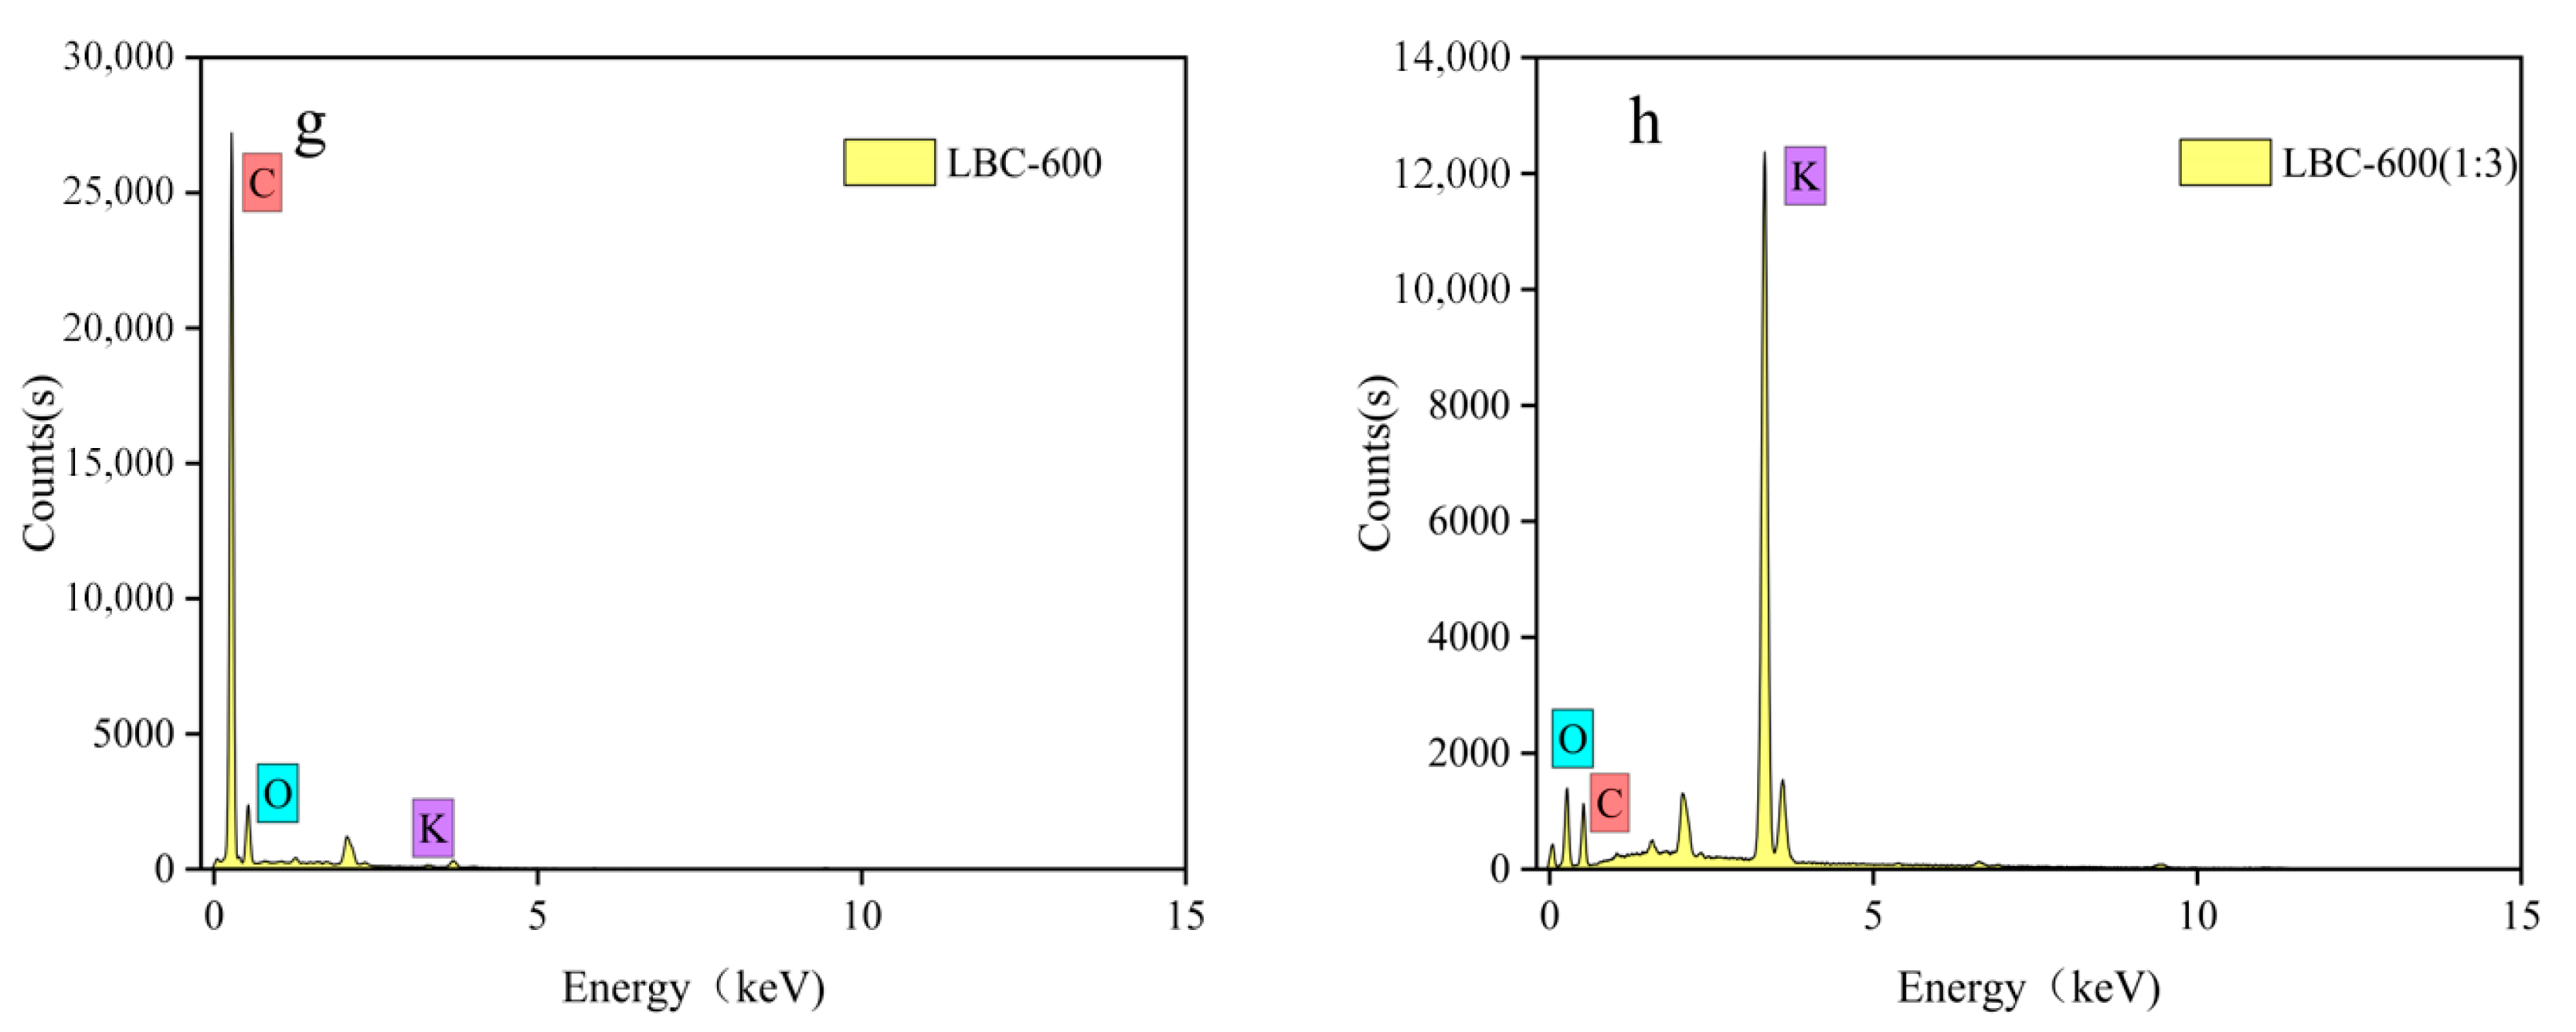
3.2.2. XPS
3.2.3. FTIR
3.2.4. XRD
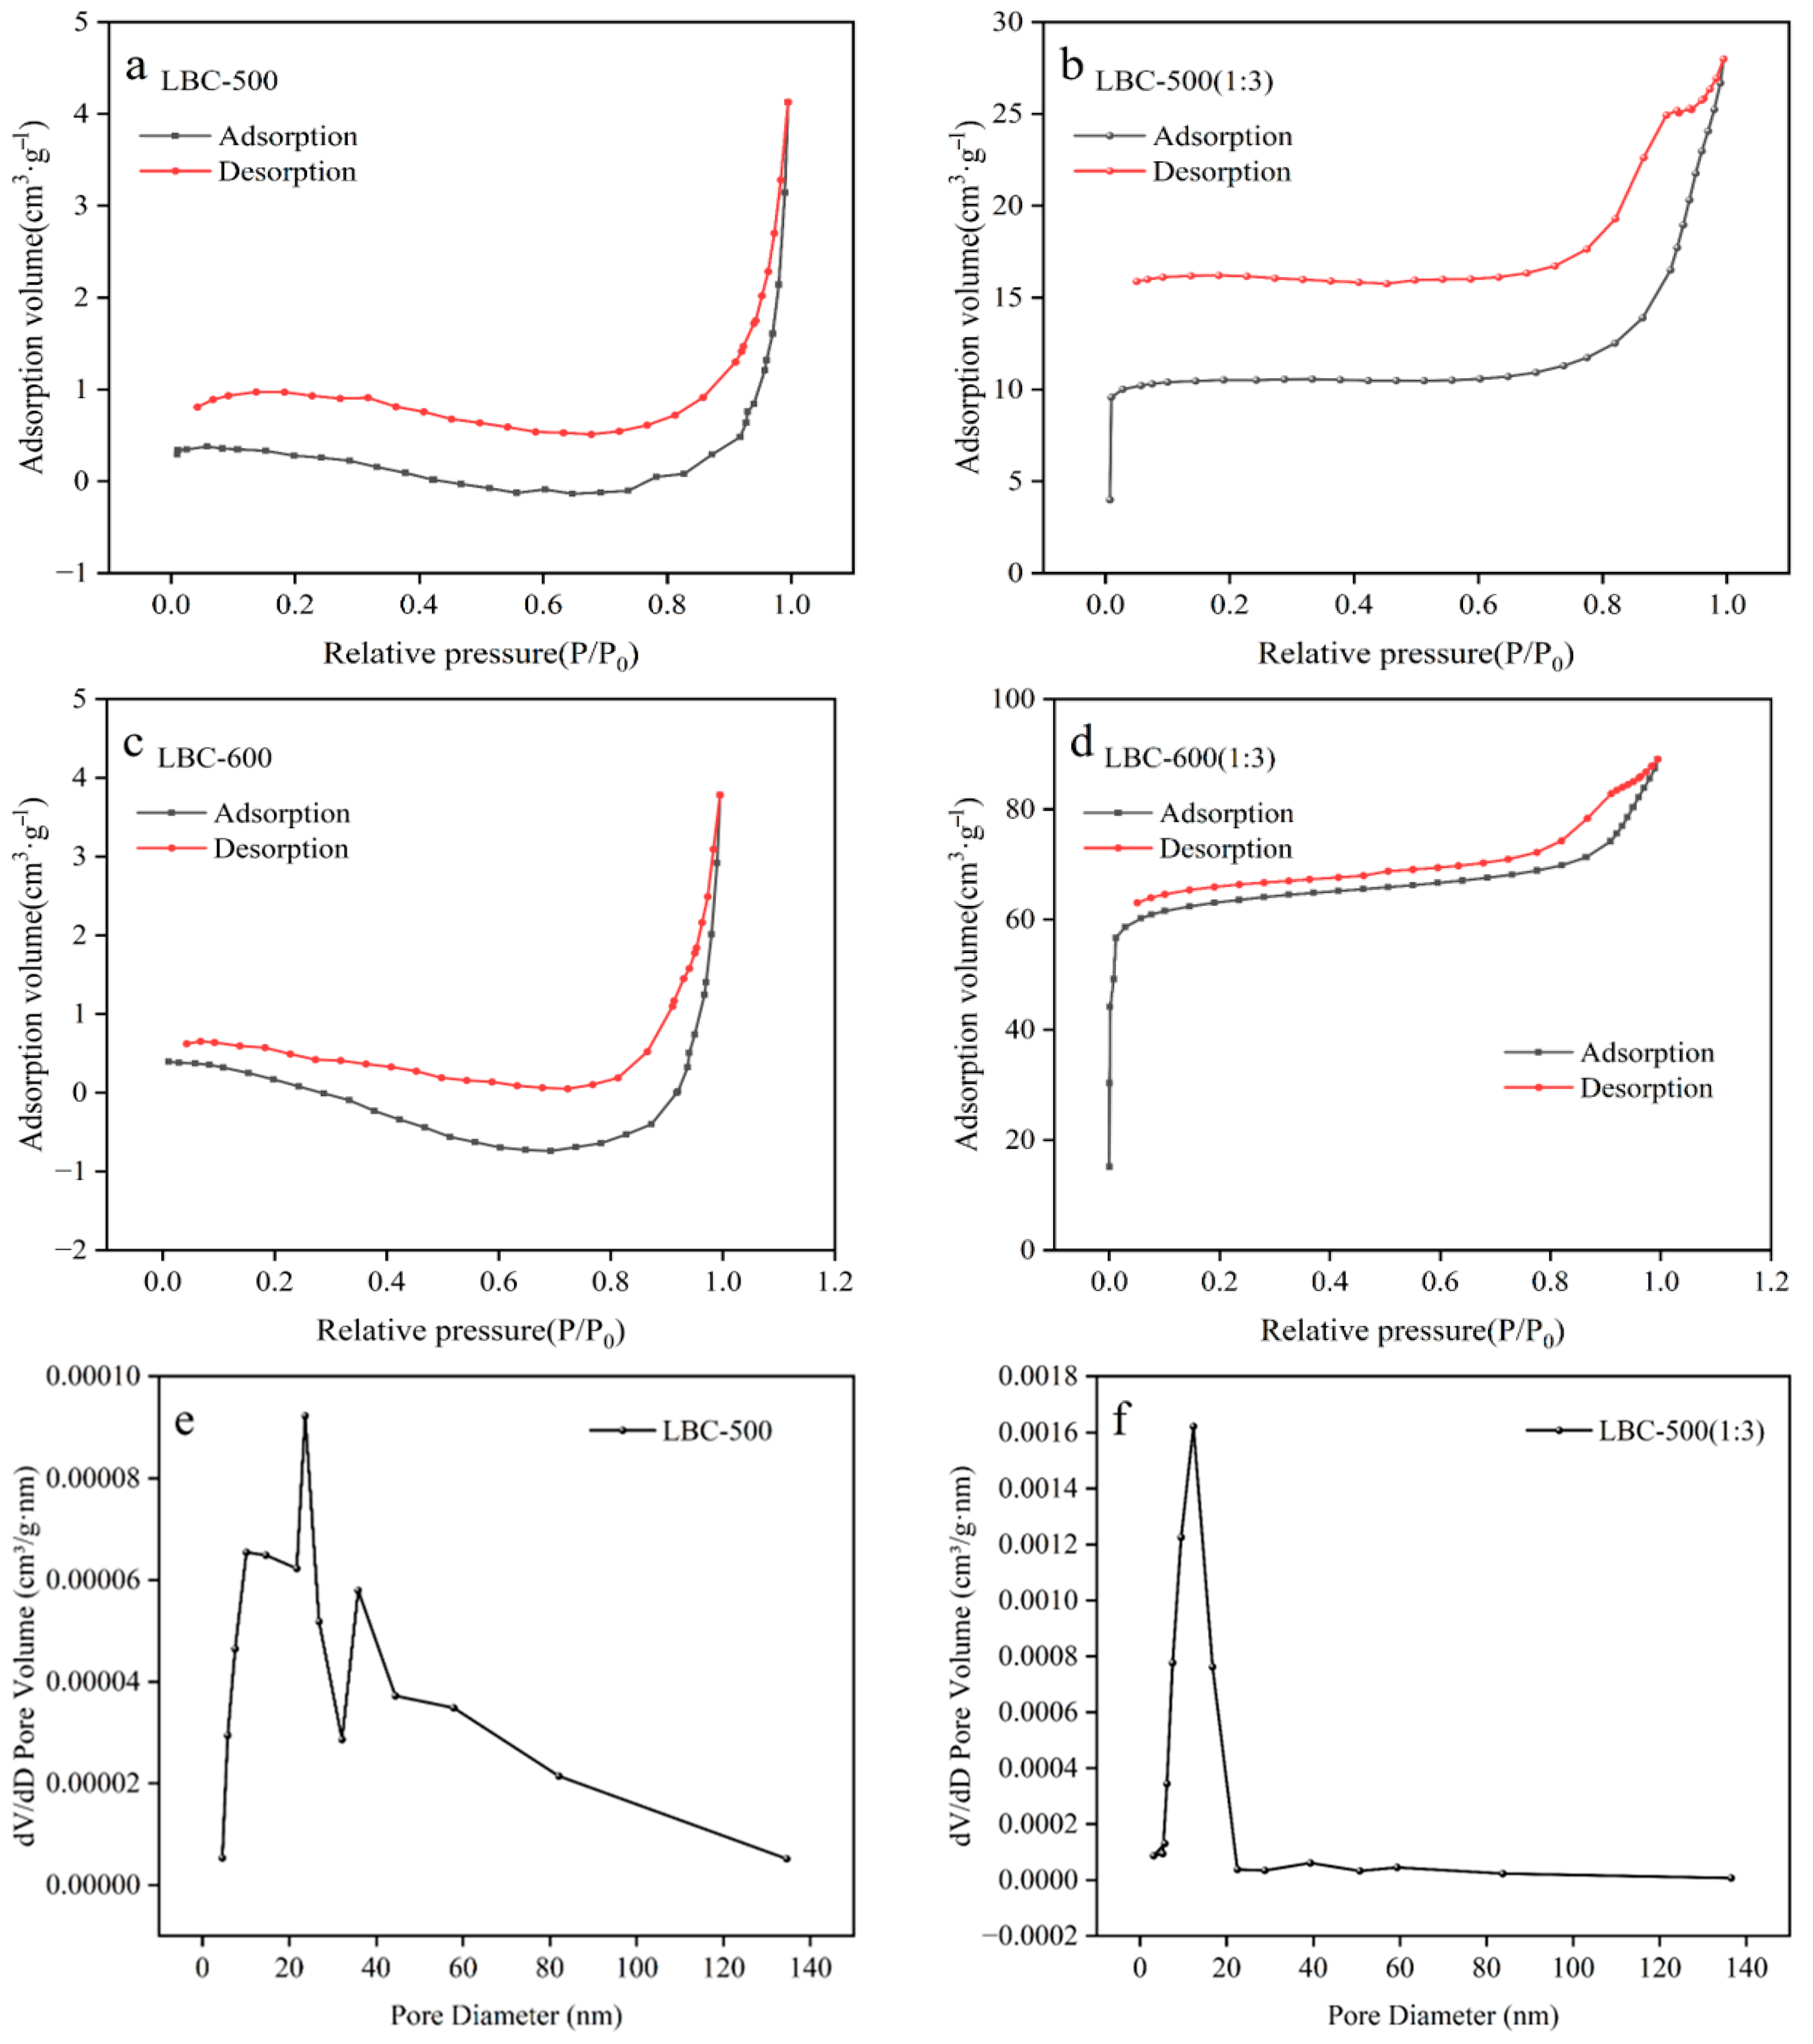
3.2.5. BET
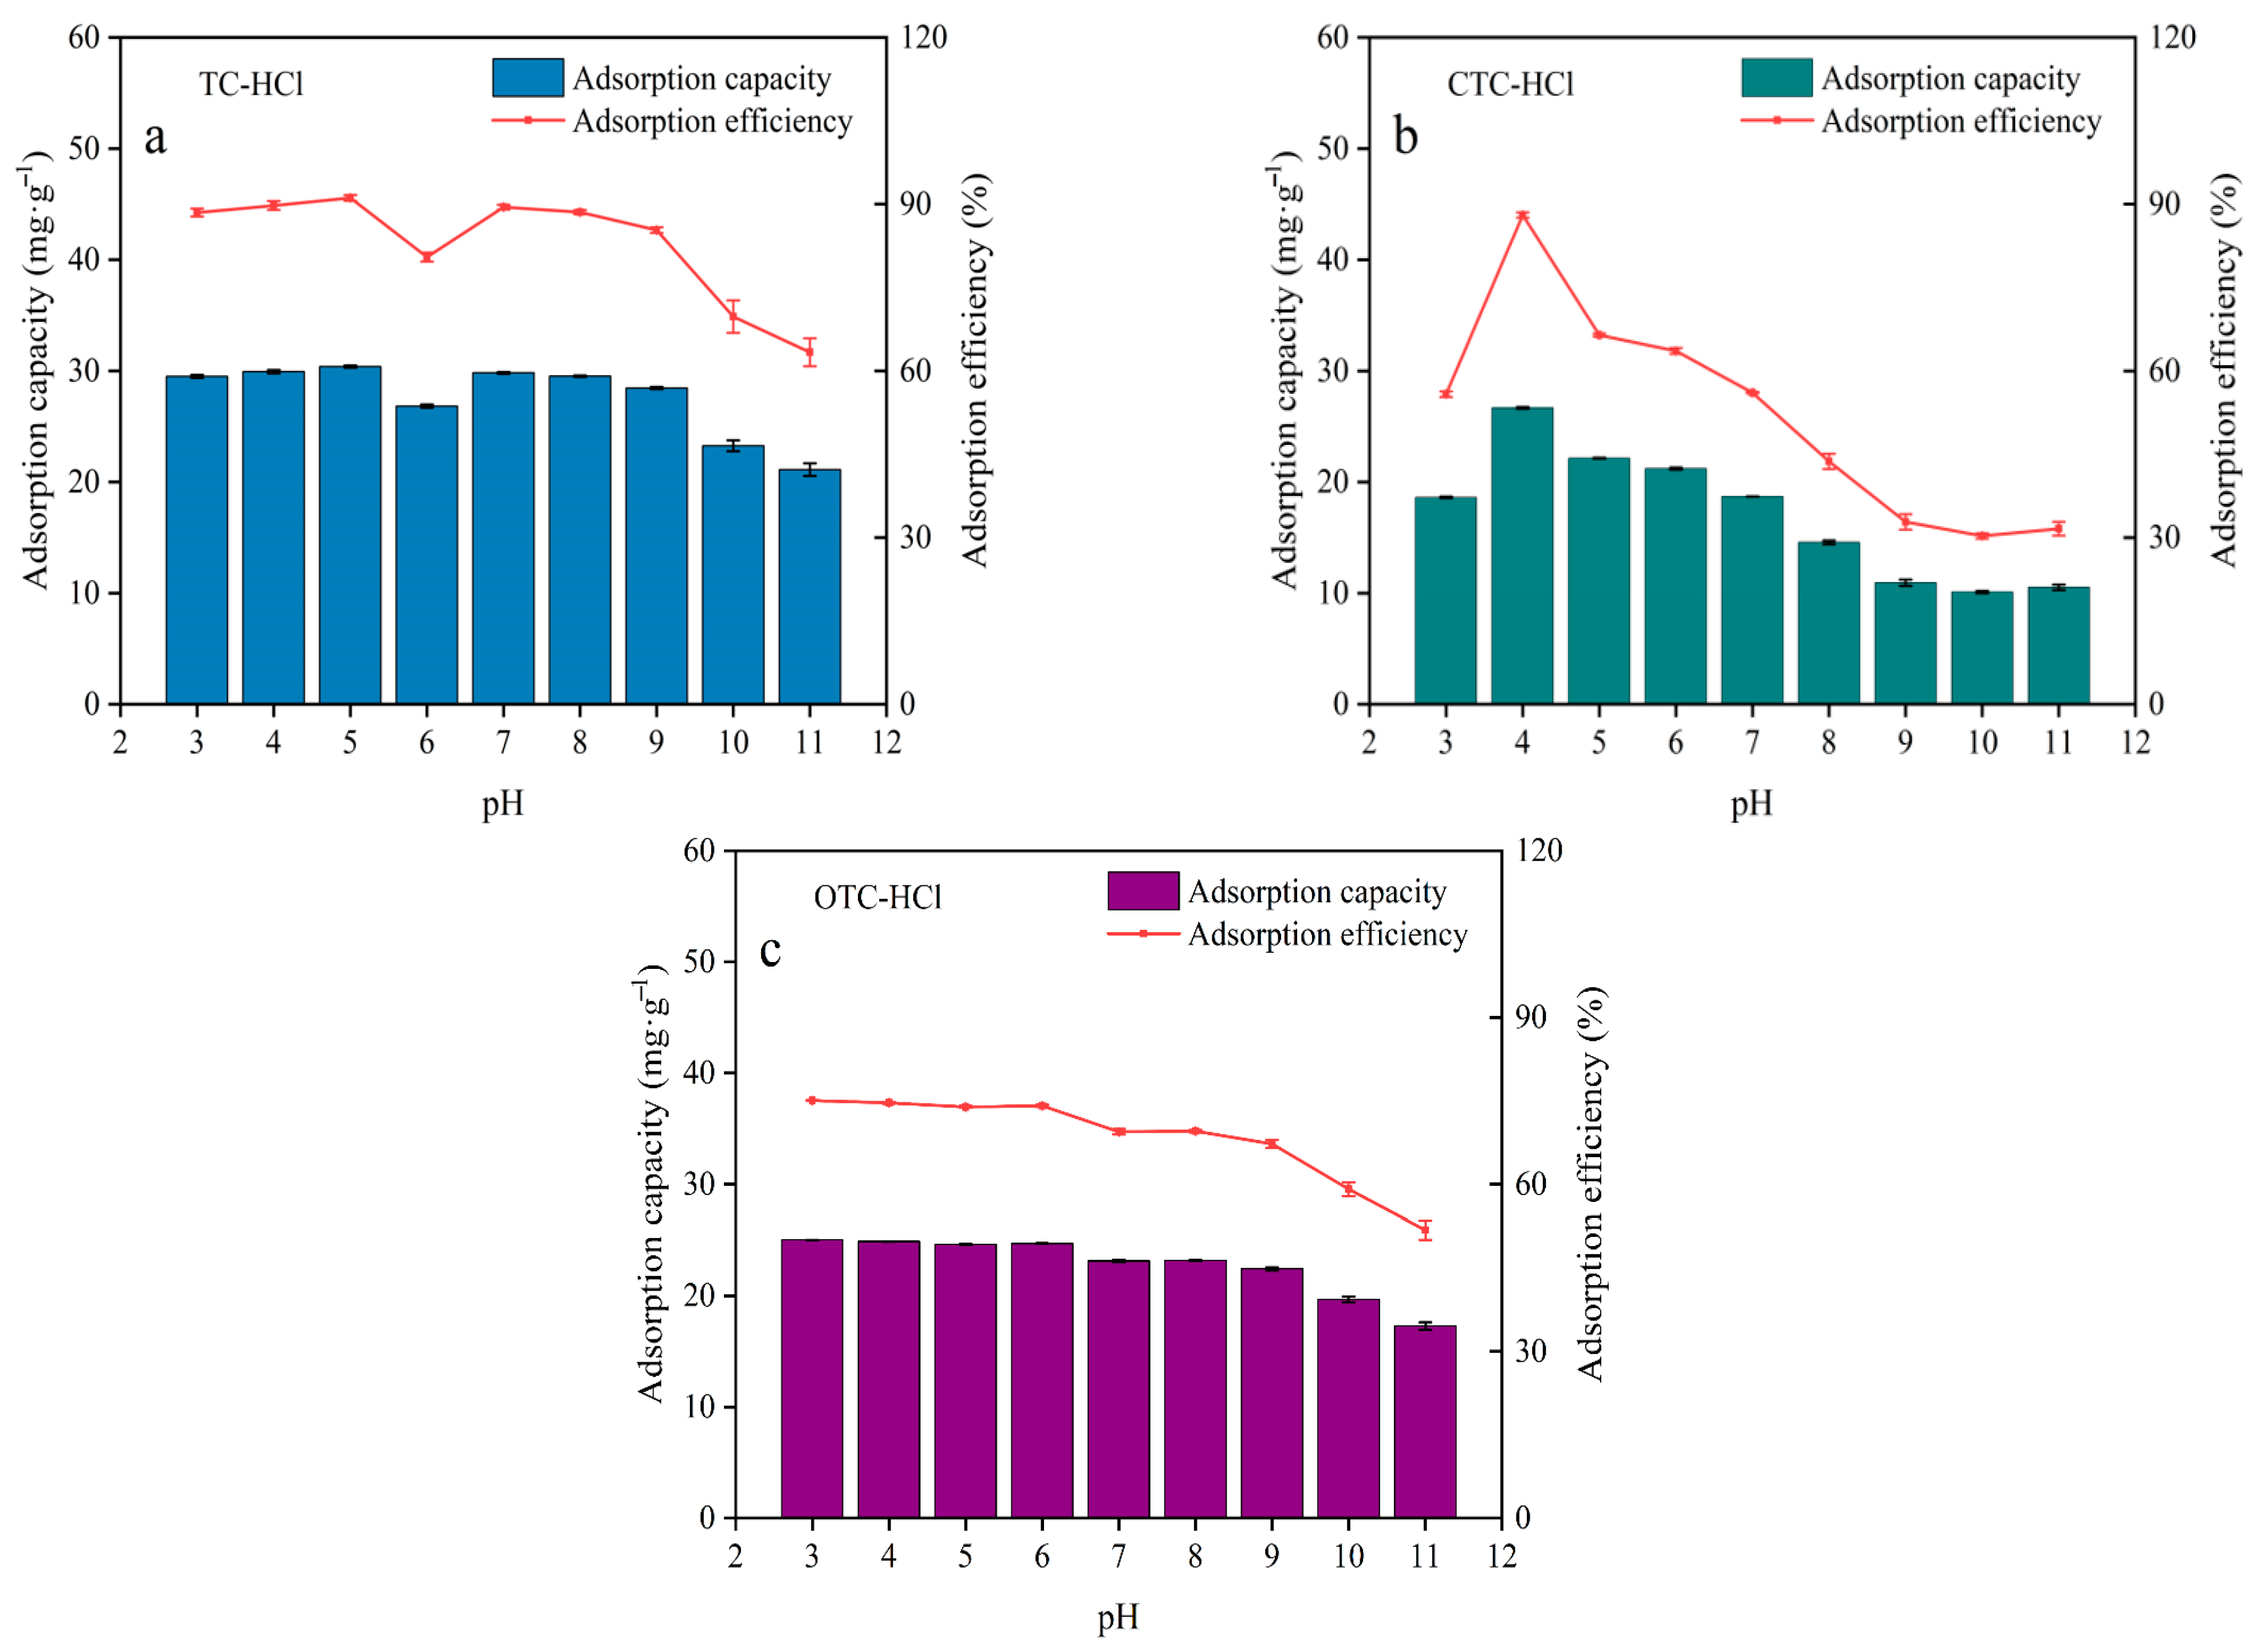
3.3. Influence of pH
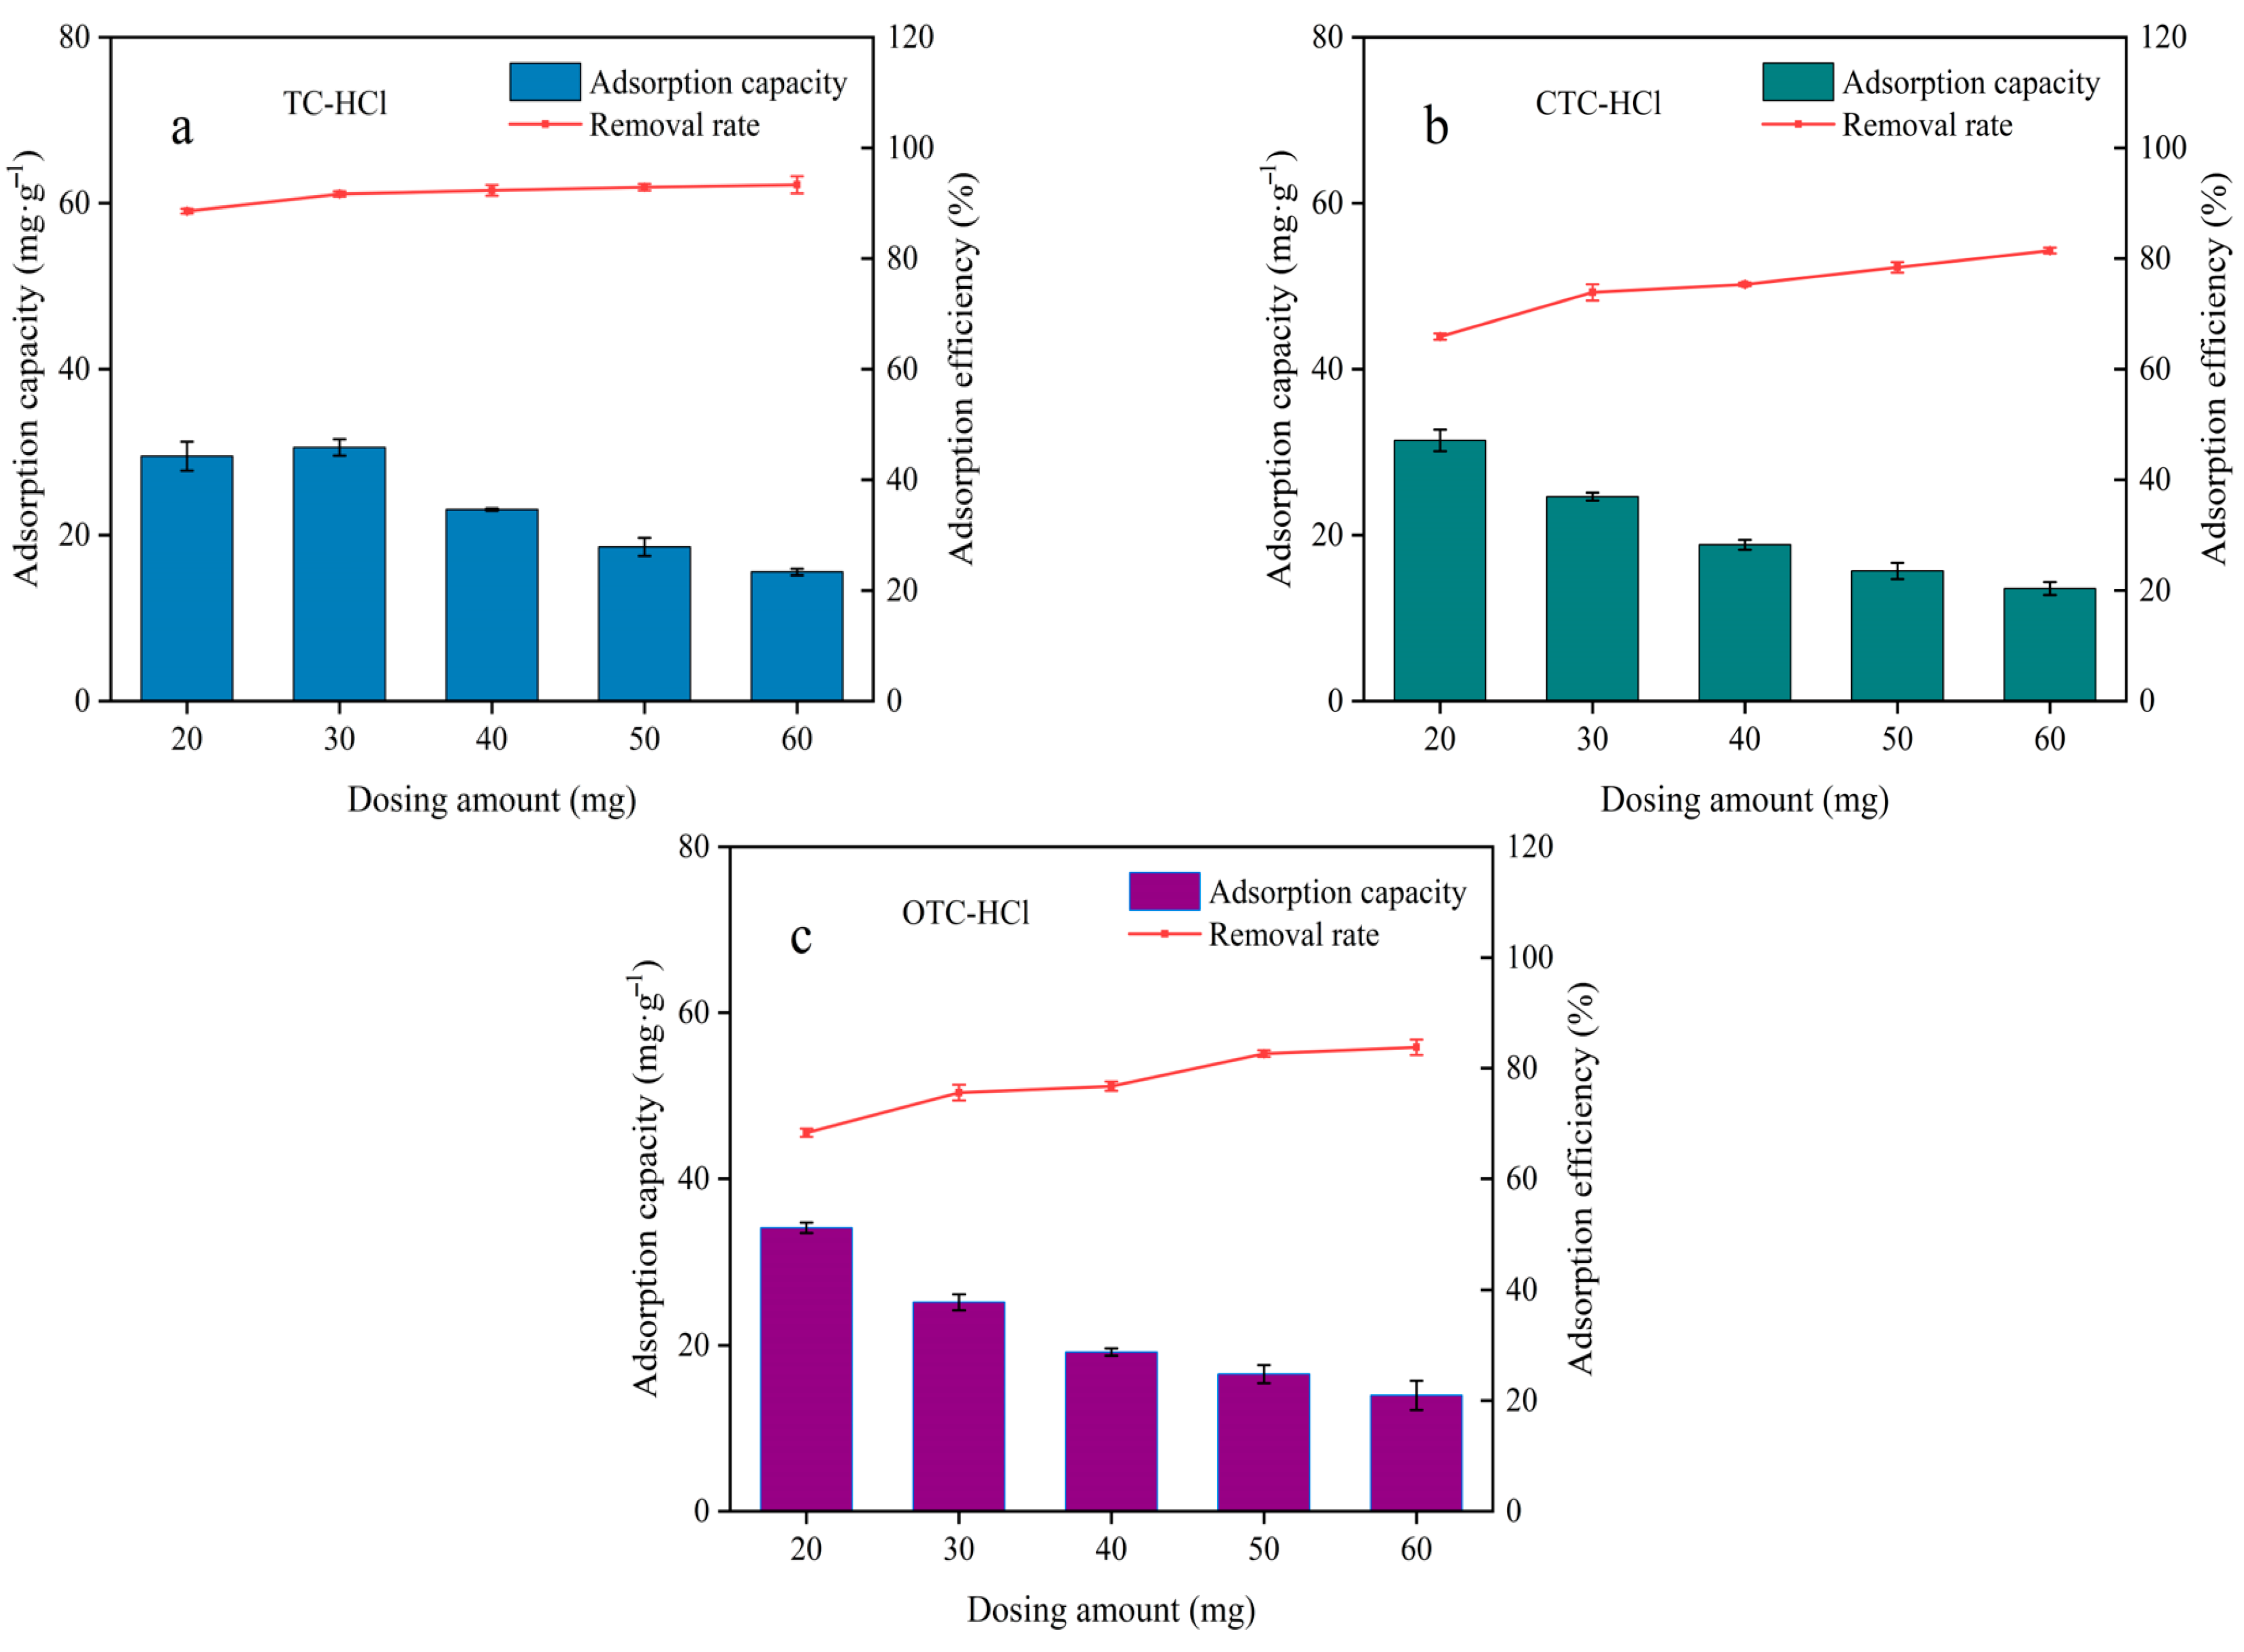
3.4. Influence of Adsorbent Dosage
3.5. Effect of Initial Concentration of Antibiotics
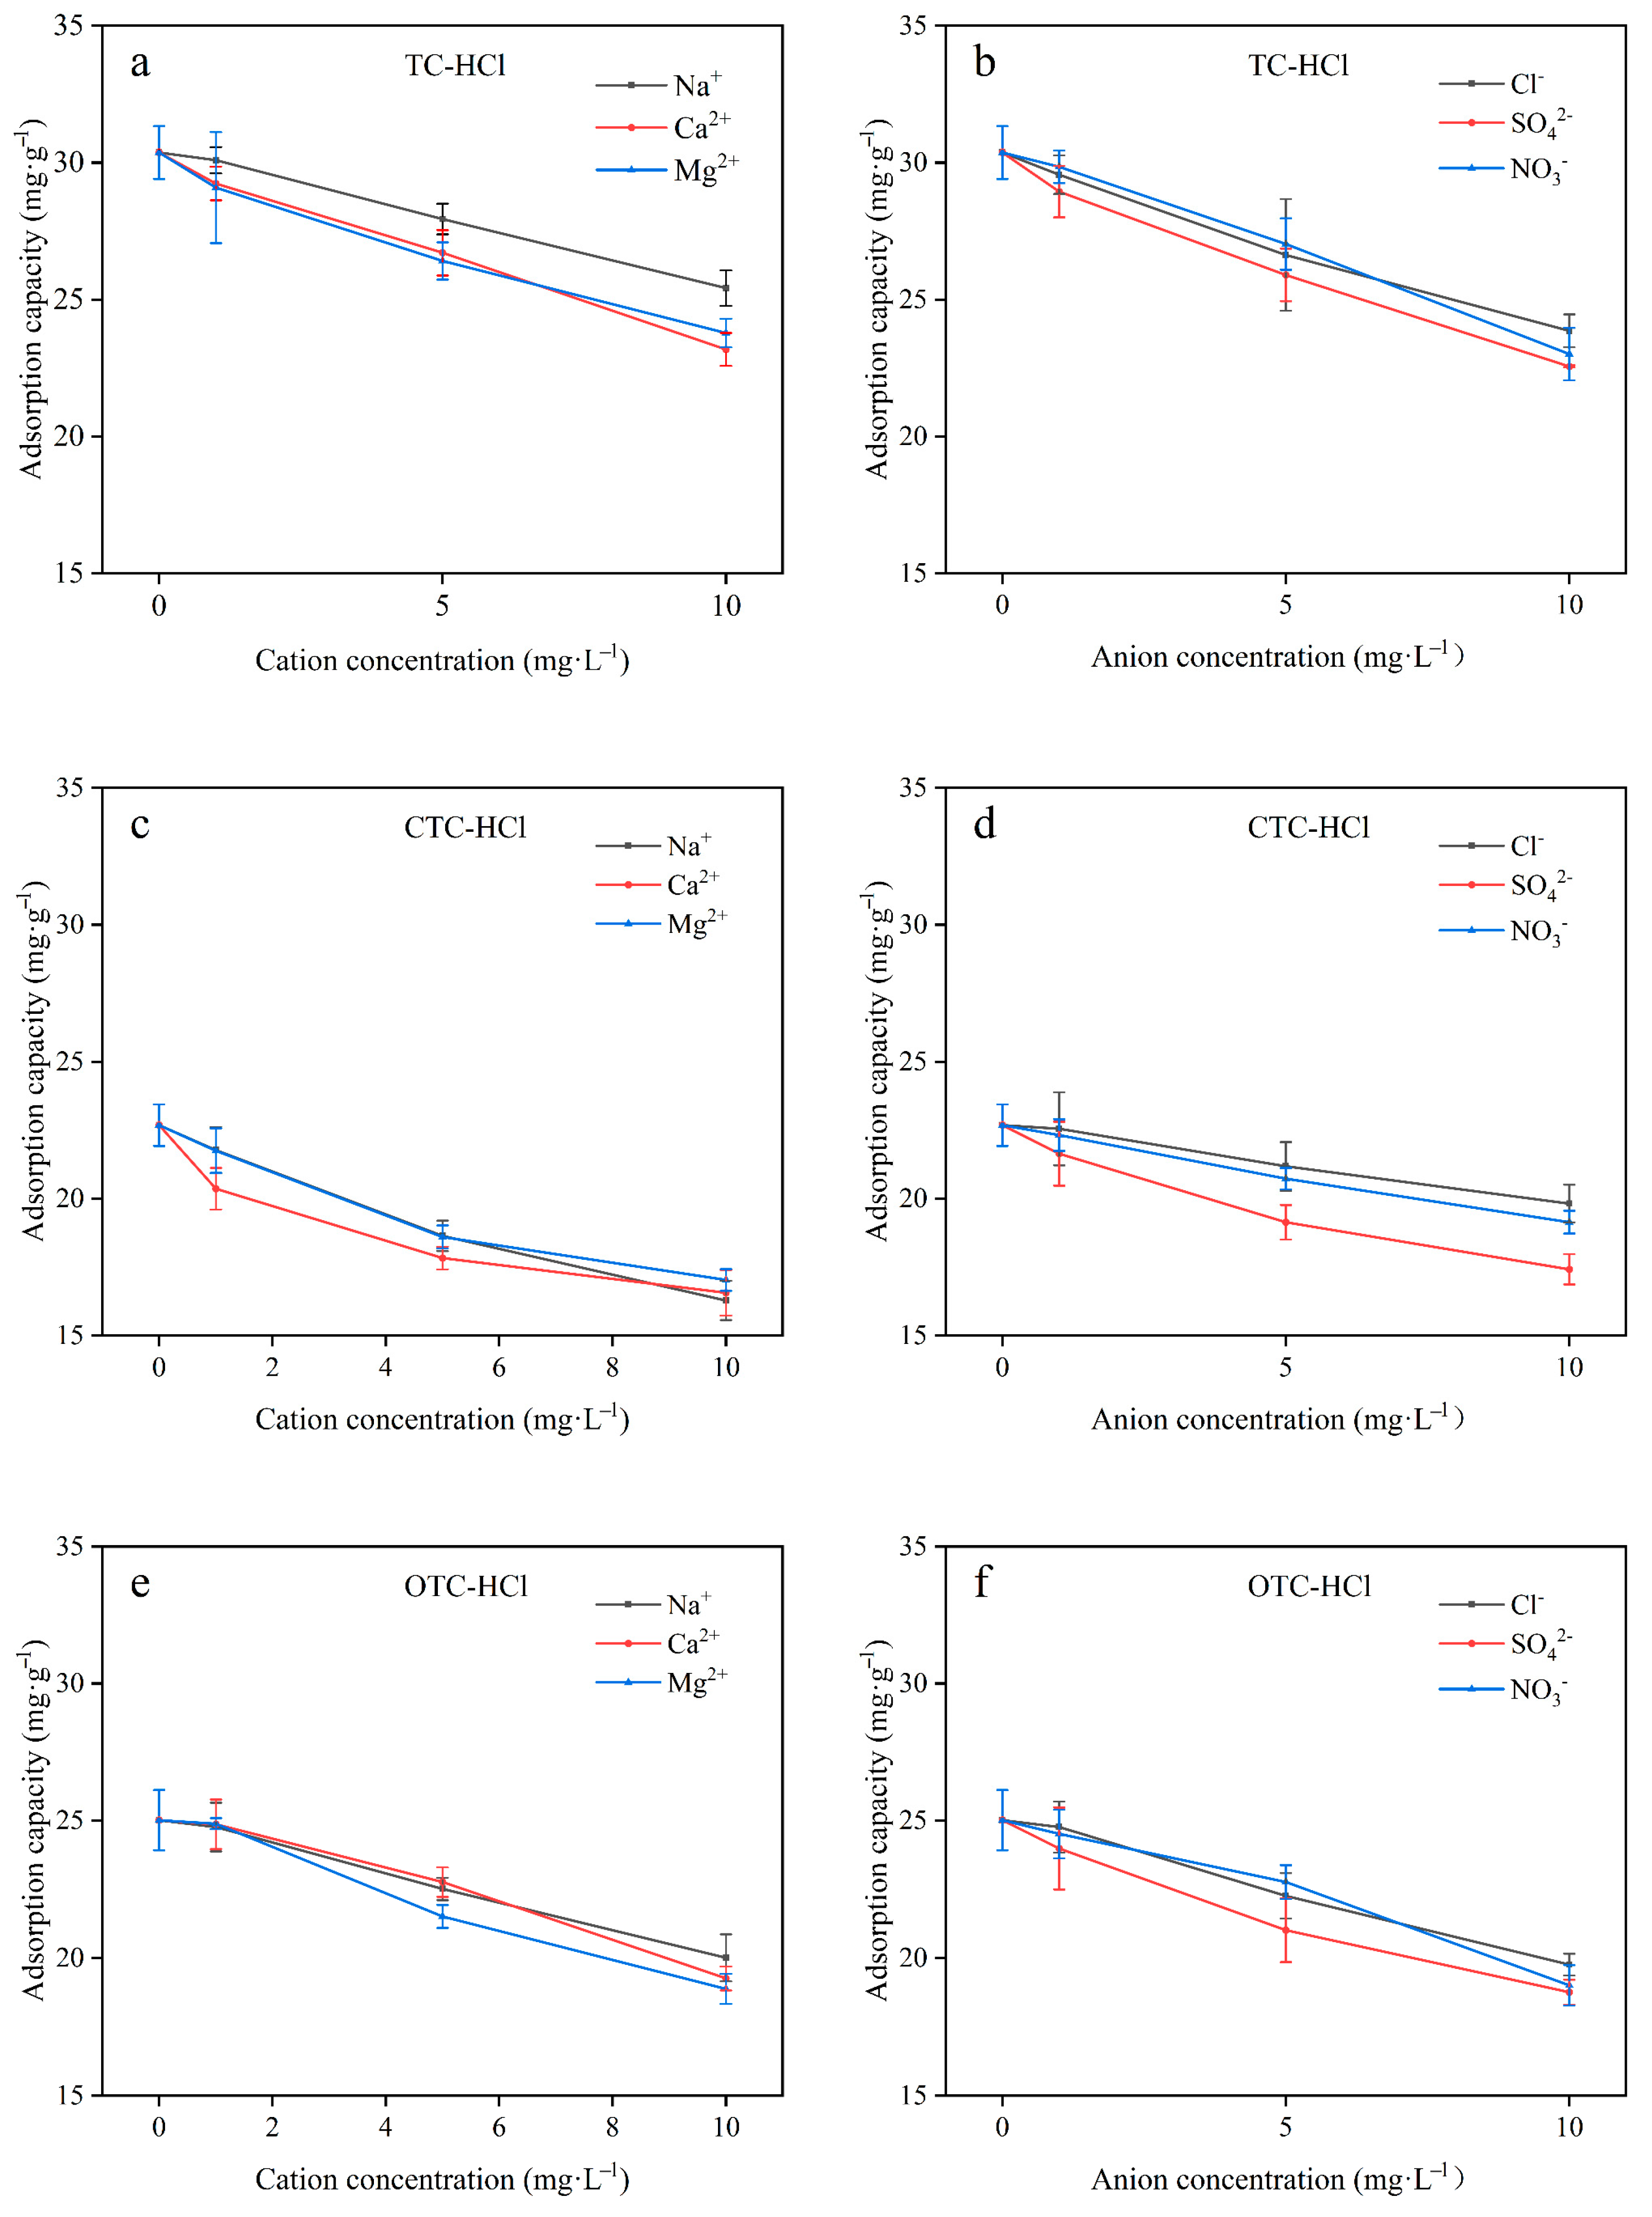
3.6. Effect of Common Salts in Water
3.7. Assessment of Adsorbent Recycling Utilization
3.8. Adsorption Kinetics Analysis
3.9. Adsorption Isotherm Experiments
3.10. Comparison of Adsorption Effect with Other Biochar Materials
4. Conclusions
Author Contributions
Funding
Institutional Review Board Statement
Informed Consent Statement
Data Availability Statement
Acknowledgments
Conflicts of Interest
References
- Hadiya, V.; Popat, K.; Vyas, S.; Varjani, S.; Vithanage, M.; Kumar Gupta, V.; Núñez Delgado, A.; Zhou, Y.; Loke Show, P.; Bilal, M.; et al. Biochar Production with Amelioration of Microwave-Assisted Pyrolysis: Current Scenario, Drawbacks and Perspectives. Bioresour. Technol. 2022, 355, 127303. [Google Scholar] [CrossRef] [PubMed]
- Krysanova, K.; Krylova, A.; Zaichenko, V. Properties of Biochar Obtained by Hydrothermal Carbonization and Torrefaction of Peat. Fuel 2019, 256, 115929. [Google Scholar] [CrossRef]
- Yang, X.; Zhang, S.; Ju, M.; Liu, L. Preparation and Modification of Biochar Materials and Their Application in Soil Remediation. Appl. Sci. 2019, 9, 1365. [Google Scholar] [CrossRef]
- Zhang, W.; Zhu, X.; Jin, X.; Meng, X.; Tang, W.; Shan, B. Evidence for Organic Phosphorus Activation and Transformation at the Sediment–Water Interface During Plant Debris Decomposition. Sci. Total Environ. 2017, 583, 458–465. [Google Scholar] [CrossRef] [PubMed]
- Akhter, S.; Bhat, M.A.; Ahmed, S.; Siddiqui, W.A. Antibiotic Residue Contamination in the Aquatic Environment, Sources and Associated Potential Health Risks. Environ. Geochem. Health 2024, 46, 387. [Google Scholar] [CrossRef] [PubMed]
- Jafari Ozumchelouei, E.; Hamidian, A.H.; Zhang, Y.; Yang, M. Physicochemical Properties of Antibiotics: A Review with an Emphasis on Detection in the Aquatic Environment. Water Environ. Res. 2020, 92, 177–188. [Google Scholar] [CrossRef] [PubMed]
- Xiao, W.; Zhao, X.; Teng, Y.; Wu, J.; Zhang, T. Review on Biogeochemical Characteristics of Typical Antibiotics in Groundwater in China. Sustainability 2023, 15, 6985. [Google Scholar] [CrossRef]
- Dar, A.A.; Pan, B.; Qin, J.; Zhu, Q.; Lichtfouse, E.; Usman, M.; Wang, C. Sustainable Ferrate Oxidation: Reaction Chemistry, Mechanisms and Removal of Pollutants in Wastewater. Environ. Pollut. 2021, 290, 117957. [Google Scholar] [CrossRef] [PubMed]
- Wang, Z.; Guo, S.; Zhang, B.; Zhu, L. Hydrophilic Polymers of Intrinsic Microporosity as Water Transport Nanochannels of Highly Permeable Thin-Film Nanocomposite Membranes Used for Antibiotic Desalination. J. Membr. Sci. 2019, 592, 117375. [Google Scholar] [CrossRef]
- Zong, Y.; Su, S.; Zhang, R.; Sun, Y.; Tian, J.; Van der Bruggen, B. Promoting the Efficiency of Tetracycline Removal from Tap Water with Commercial Nf Membranes via a Facile Post-Treatment. Process Saf. Environ. 2023, 179, 941–950. [Google Scholar] [CrossRef]
- Qasem, N.A.A.; Mohammed, R.H.; Lawal, D.U. Removal of Heavy Metal Ions from Wastewater: A Comprehensive and Critical Review. npj Clean Water 2021, 4, 36. [Google Scholar] [CrossRef]
- Ajala, O.A.; Akinnawo, S.O.; Bamisaye, A.; Adedipe, D.T.; Adesina, M.O.; Okon-Akan, O.A.; Adebusuyi, T.A.; Ojedokun, A.T.; Adegoke, K.A.; Bello, O.S. Adsorptive Removal of Antibiotic Pollutants from Wastewater Using Biomass/Biochar-Based Adsorbents. RSC Adv. 2023, 13, 4678–4712. [Google Scholar] [CrossRef] [PubMed]
- Chen, Y.; Wang, F.; Duan, L.; Yang, H.; Gao, J. Tetracycline Adsorption onto Rice Husk Ash, an Agricultural Waste: Its Kinetic and Thermodynamic Studies. J. Mol. Liq. 2016, 222, 487–494. [Google Scholar] [CrossRef]
- Xu, X.; Weng, Y.; Zhuang, J.; Pei, H.; Wu, B.; Wu, W.; Yang, J.; Wang, B.; Huang, T. Enhanced Adsorption Capacity of Antibiotics by Calamus-Biochar with Phosphoric Acid Modification: Performance Assessment and Mechanism Analysis. J. Taiwan Inst. Chem. Eng. 2024, 161, 105541. [Google Scholar] [CrossRef]
- Thairattananon, P.; Le, G.T.T.; Matsumura, Y.; Wu, K.C.W.; Charinpanitkul, T. Effect of Pyrolysis Temperature on Characteristics of Tunable Magnetic Biochar Synthesized from Watermelon Rind and Its Tetracycline Adsorption Performance. J. Taiwan Inst. Chem. Eng. 2024, 160, 105345. [Google Scholar] [CrossRef]
- Huang, H.; Tang, J.C.; Gao, K.; He, R.Z.; Zhao, H.; Werner, D. Characterization of KOH modified biochars from different pyrolysis temperatures and enhanced adsorption of antibiotics. RSC Adv. 2017, 7, 14640–14648. [Google Scholar] [CrossRef]
- Zhang, X.X.; Zhang, P.Z.; Yuan, X.R.; Li, Y.F.; Hang, L.J. Effect of pyrolysis temperature and correlation analysis on the yield and physicochemical properties of crop residue biochar. Bioresour. Technol. 2020, 296, 122318. [Google Scholar] [CrossRef] [PubMed]
- Greczynski, G.; Hultman, L. X-Ray Photoelectron Spectroscopy: Towards Reliable Binding Energy Referencing. Prog. Mater. Sci. 2020, 107, 100591. [Google Scholar] [CrossRef]
- Janu, R.; Mrlik, V.; Ribitsch, D.; Hofman, J.; Sedláček, P.; Bielská, L.; Soja, G. Biochar Surface Functional Groups as Affected by Biomass Feedstock, Biochar Composition and Pyrolysis Temperature. Carbon Resour. Convers. 2021, 4, 36–46. [Google Scholar] [CrossRef]
- Sawyer, R.; Nesbitt, H.W.; Secco, R.A. High Resolution X-Ray Photoelectron Spectroscopy (Xps) Study of K2O–SiO2 Glasses: Evidence for Three Types of O and at Least Two Types of Si. J. Non-Cryst. Solids 2012, 358, 290–302. [Google Scholar] [CrossRef]
- Rablen, P.R.; Yett, A. The Relative Favorability of Placing Substituents Ortho or Para in the Cationic Intermediate for Electrophilic Aromatic Substitution. J. Phys. Org. Chem. 2023, 36, e4457. [Google Scholar] [CrossRef]
- Nolte, L.; Nowaczyk, M.; Brandenbusch, C. Monitoring and Investigating Reactive Extraction of (Di−) Carboxylic Acids Using Online Ftir—Part I: Characterization of the Complex Formed Between Itaconic Acid and Tri-N-Octylamine. J. Mol. Liq. 2022, 352, 118721. [Google Scholar] [CrossRef]
- Wu, L.M.; Tong, D.S.; Zhao, L.Z.; Yu, W.H.; Zhou, C.H.; Wang, H. Fourier Transform Infrared Spectroscopy Analysis for Hydrothermal Transformation of Microcrystalline Cellulose on Montmorillonite. Appl. Clay Sci. 2014, 95, 74–82. [Google Scholar] [CrossRef]
- Xue, H.; Deng, L.; Kang, D.; Zhao, Y.; Zhang, X.; Liu, Y.; Chen, H.; Ngo, H.H.; Guo, W. Advanced Biochar-Based Materials for Specific Antibiotics Removal from Hospital Wastewater via Adsorption and Oxidative Degradation. J. Environ. Chem. Eng. 2024, 12, 114275. [Google Scholar] [CrossRef]
- Phillips, R.; Jolley, K.; Zhou, Y.; Smith, R. Influence of Temperature and Point Defects on the X-Ray Diffraction Pattern of Graphite. Carbon Trends 2021, 5, 100124. [Google Scholar] [CrossRef]
- Xu, X.; Zhao, Y.; Sima, J.; Zhao, L.; Mašek, O.; Cao, X. Indispensable Role of Biochar-Inherent Mineral Constituents in Its Environmental Applications: A Review. Bioresour. Technol. 2017, 241, 887–899. [Google Scholar] [CrossRef] [PubMed]
- Liu, X.; Shao, Z.; Wang, Y.; Liu, Y.; Wang, S.; Gao, F.; Dai, Y. New Use for Lentinus Edodes Bran Biochar for Tetracycline Removal. Env. Pollut. 2023, 216, 114651. [Google Scholar] [CrossRef] [PubMed]
- Xu, J.; Zhang, Y.; Li, B.; Fan, S.; Xu, H.; Guan, D. Improved Adsorption Properties of Tetracycline on KOH/KMnO4 Modified Biochar Derived from Wheat Straw. Chemosphere 2022, 296, 133981. [Google Scholar] [CrossRef] [PubMed]
- Peiris, C.; Gunatilake, S.R.; Mlsna, T.E.; Mohan, D.; Vithanage, M. Biochar Based Removal of Antibiotic Sulfonamides and Tetracyclines in Aquatic Environments: A Critical Review. Bioresour. Technol. 2017, 246, 150–159. [Google Scholar] [CrossRef] [PubMed]
- Chen, W.; Huang, C. Transformation Kinetics and Pathways of Tetracycline Antibiotics with Manganese Oxide. Env. Pollut. 2011, 159, 1092–1100. [Google Scholar] [CrossRef] [PubMed]
- Ahmed, M.B.; Zhou, J.L.; Ngo, H.H.; Guo, W. Adsorptive Removal of Antibiotics from Water and Wastewater: Progress and Challenges. Sci. Total Environ. 2015, 532, 112–126. [Google Scholar] [CrossRef] [PubMed]
- Zhang, P.; Li, Y.; Cao, Y.; Han, L. Characteristics of Tetracycline Adsorption by Cow Manure Biochar Prepared at Different Pyrolysis Temperatures. Bioresour. Technol. 2019, 285, 121348. [Google Scholar] [CrossRef] [PubMed]
- Ding, J.; Liang, J.; Wang, Q.; Tan, X.; Xie, W.; Chen, C.; Li, C.; Li, D.; Li, J.; Chen, X. Enhanced Tetracycline Adsorption Using Koh-Modified Biochar Derived from Waste Activated Sludge in Aqueous Solutions. Toxics 2024, 12, 691. [Google Scholar] [CrossRef] [PubMed]
- Wang, K.; Yao, R.; Zhang, D.; Peng, N.; Zhao, P.; Zhong, Y.; Zhou, H.; Huang, J.; Liu, C. Tetracycline Adsorption Performance and Mechanism Using Calcium Hydroxide-Modified Biochars. Toxics 2023, 11, 841. [Google Scholar] [CrossRef] [PubMed]


| Name of Biochar | C (wt %) | N (wt %) | O (wt %) | K (wt %) | Cr (wt %) |
|---|---|---|---|---|---|
| LBC-500 | 83.04 | 0.03 | 16.45 | 0.44 | 0.03 |
| LBC-500 (1:3) | 13.60 | 0.77 | 32.29 | 46.14 | 0.21 |
| LBC-600 | 79.82 | 3.29 | 16.69 | 0.19 | 0.01 |
| LBC-600 (1:3) | 6.78 | 1.65 | 13.85 | 77.44 | 0.28 |
| Name | Specific Surface Area (m2·g−1) | Pore Volume (cm3·g−1) | Average Pore Diameter (nm) |
|---|---|---|---|
| LBC-500 | 1.58 | 0.0064 | 51.76 |
| LBC-500 (1:3) | 41.98 | 0.0290 | 24.06 |
| LBC-600 | 1.49 | 0.0058 | 63.92 |
| LBC-600 (1:3) | 247.70 | 0.0488 | 19.11 |
| Model Adsorbate | Quasi-First-Order Dynamic Model | Quasi-Second-Order Dynamic Model | ||||
|---|---|---|---|---|---|---|
| K1 (h−1) | Qe (mg·g−1) | R2 | K2 (g·mg−1·h−1) | Qe (mg·g−1) | R2 | |
| TC-HCl | 0.62 | 27.88 | 0.975 | 0.02 | 30.98 | 0.990 |
| CTC-HCl | 0.73 | 20.10 | 0.972 | 0.04 | 23.34 | 0.982 |
| OTC-HCl | 0.53 | 22.47 | 0.967 | 0.03 | 25.05 | 0.989 |
| Phase 1 | Phase 2 | Phase 3 | |||||||
|---|---|---|---|---|---|---|---|---|---|
| ki1 | Ci1 | R2 | Ki2 | Ci2 | R2 | Ki3 | Ci3 | R2 | |
| TC-HCl | 2.13 | −1.60 | 0.99 | 0.56 | 15.54 | 0.91 | 0.12 | 24.83 | 0.94 |
| CTC-HCl | 1.59 | −1.21 | 0.96 | 0.31 | 13.31 | 0.85 | 0.06 | 19.42 | 0.98 |
| OTC-HCl | 1.74 | −1.41 | 0.98 | 0.36 | 14.61 | 0.96 | 0.07 | 21.31 | 0.97 |
| Model Temperature | Langmuir | Freundlich | |||||
|---|---|---|---|---|---|---|---|
| Qm (mg·g−1) | R2 | Kf | 1/n | R2 | |||
| TC-HCl | 20 °C | 37.7 | 0.0562 | 0.993 | 5.77 | 0.409 | 0.952 |
| 30 °C | 41.1 | 0.0635 | 0.994 | 7.45 | 0.375 | 0.936 | |
| 40 °C | 46.2 | 0.0868 | 0.987 | 9.71 | 0.340 | 0.930 | |
| CTC-HCl | 20 °C | 27.5 | 0.0642 | 0.988 | 6.31 | 0.335 | 0.897 |
| 30 °C | 29.4 | 0.0645 | 0.990 | 6.56 | 0.340 | 0.901 | |
| 40 °C | 31.0 | 0.0651 | 0.993 | 6.80 | 0.342 | 0.904 | |
| OTC-HCl | 20 °C | 25.4 | 0.125 | 0.995 | 7.19 | 0.283 | 0.920 |
| 30 °C | 28.0 | 0.156 | 0.989 | 8.68 | 0.261 | 0.915 | |
| 40 °C | 32.3 | 0.208 | 0.984 | 9.75 | 0.249 | 0.939 | |
| Biochar Precursor | Preparation Method | Charcoal Dosage | Initial Concentration (mg·L−1) | Adsorption Capacity (mg·g−1) | Reference |
|---|---|---|---|---|---|
| Cow dung | 700 °C pyrolysis | 1.25 g·L−1 | 50 | 11.79 | [32] |
| Sludge | 600 °C, KOH modified | 25 mg | 100 | 154.16 | [33] |
| Straw | 600 °C, 30%(w/w) Ca(OH)2 modified | 0.1 g | 50 | 40 | [34] |
| Xianggu | 700 °C pyrolysis | 1.6 g·L−1 | 10 | 17.68 | [27] |
| Lotus leaf | Preparation by pyrolysis at 600 °C and modification with KOH mass ratio of 1:3 | 30 mg | 20 | 29.26 (TC-HCl) 21.84 (CTC-HCl) 24.07 (OTC-HCl) | This study |
Disclaimer/Publisher’s Note: The statements, opinions and data contained in all publications are solely those of the individual author(s) and contributor(s) and not of MDPI and/or the editor(s). MDPI and/or the editor(s) disclaim responsibility for any injury to people or property resulting from any ideas, methods, instructions or products referred to in the content. |
© 2025 by the authors. Licensee MDPI, Basel, Switzerland. This article is an open access article distributed under the terms and conditions of the Creative Commons Attribution (CC BY) license (https://creativecommons.org/licenses/by/4.0/).
Share and Cite
Chen, Q.; Tong, H.; Gao, X.; Li, P.; Li, J.; Zhuang, H.; Wu, S. Preparation and Application of Wetland-Plant-Derived Biochar for Tetracycline Antibiotic Adsorption in Water. Sustainability 2025, 17, 6625. https://doi.org/10.3390/su17146625
Chen Q, Tong H, Gao X, Li P, Li J, Zhuang H, Wu S. Preparation and Application of Wetland-Plant-Derived Biochar for Tetracycline Antibiotic Adsorption in Water. Sustainability. 2025; 17(14):6625. https://doi.org/10.3390/su17146625
Chicago/Turabian StyleChen, Qingyun, Hao Tong, Xing Gao, Peng Li, Jiaqi Li, Haifeng Zhuang, and Suqing Wu. 2025. "Preparation and Application of Wetland-Plant-Derived Biochar for Tetracycline Antibiotic Adsorption in Water" Sustainability 17, no. 14: 6625. https://doi.org/10.3390/su17146625
APA StyleChen, Q., Tong, H., Gao, X., Li, P., Li, J., Zhuang, H., & Wu, S. (2025). Preparation and Application of Wetland-Plant-Derived Biochar for Tetracycline Antibiotic Adsorption in Water. Sustainability, 17(14), 6625. https://doi.org/10.3390/su17146625