Article

Material Demand and Contributions of Solar PV End-of-Life Management to the Circular Economy: The Case of Italy

1
Department of Engineering, University of Palermo, Viale delle Scienze Bld. 9, 90128 Palermo, Italy
2
Institute of Science and Technology for Energy and Environment, Vietnam Academy of Science and Technology, A30 Building, 18 Hoang Quoc Viet, Cau Giay District, Hanoi 10072, Vietnam
3
Hanoi School of Business and Management, Vietnam National University, 144 Xuan Thuy Street, Cau Giay District, Hanoi 11310, Vietnam
4
Department of Civil Engineering and Architecture, University of Catania, via Santa Sofia 64, 95123 Catania, Italy
5
Centre for Sustainability and Ecological Transition, University of Palermo, Complesso Monumentale dello Steri, Piazza Marina 61, 90133 Palermo, Italy
*
Author to whom correspondence should be addressed.
Sustainability 2025, 17(14), 6592; https://doi.org/10.3390/su17146592 (registering DOI)
Submission received: 3 June 2025 / Revised: 11 July 2025 / Accepted: 17 July 2025 / Published: 19 July 2025
(This article belongs to the Special Issue Circularity Approach to Solving Resource and Climate Problems)

Abstract

Circular economy is a crucial strategy for achieving sustainable development. The use of solar PV, which is a renewable energy source, has been considered a popular indicator to measure and evaluate the circularity of an economy and enterprises. The recycling of solar PV panels optimises resource use and reduces the need for virgin materials. However, it does not automatically indicate an environmental advantage if the recovering and recycling processes are energy- or emission-intensive. The paper applies life cycle assessment to quantify the material demand for the Italian solar PV sector and contributions of solar PV end-of-life strategies to the enhancement of the circular economy. It is identified that the material intensity of the Italian solar PV sector increases from 4.67 g Sb eq to 5.20 g Sb eq per MWh by 2040 due to the change in technology mix. At the same time, the total material demand, as well as demand for specific materials, increases over the years, from 2008 to 2040. The strategy on recovery, recycling and reintegration of materials slightly reduces the material demand, from 816 tonnes Sb eq to 814 tonnes Sb eq in 2040. It also brings the benefits of reducing all the life cycle impacts, such as greenhouse gas emissions, energy demand, etc.

1. Introduction

Circular economy (CE) is a crucial strategy for achieving sustainable development. Unlike the traditional linear economic model of “take, make, use and dispose”, CE is based on the concept of recreating natural systems, aiming at maximising resource efficiency and minimising waste and pollution [1,2]. It replaces the “disposal” of materials with the various end-of-life (EoL) management strategies such as energy recovery and material recycling. Furthermore, it encourages the use of renewable energy and the application of circular business models [1]. By promoting the use of renewable and clean energy, minimising waste and bringing the opportunities for reusing and recycling materials, CE supports environmental sustainability [3,4]. It is expected to contribute to economic and social sustainability by creating jobs and increasing the gross domestic product (GDP) [5,6].
The use of solar photovoltaics (PV), which is a renewable energy source, has been considered as a popular measure to support the circularity of an economy and enterprises [5,7,8]. Compared to fossil fuel-based energy systems, solar PV generates clean electricity and significantly lowers greenhouse gas (GHG) emissions, by up to 90% [9]. It is identified as the top contributor to the decarbonisation of the energy sector and the economy globally as well as regionally [10,11]. Considering the life cycle perspective, solar PV does generate a modest amount of GHG emissions and other environmental impacts during the operation stage [12]. More than half its emission comes from manufacturing stages [13]; however, with the development of solar panel manufacturing technology, the GHG emissions of solar PV have been significantly reduced throughout the entire life cycle [14]. These benefits align with CE principles in minimising the use of exhaustible energy resources, reducing GHG emissions and pollution and supporting long-term environmental sustainability.
In addition to the benefit of emission reductions, solar PV systems also offer significant material recovery opportunities through proper EoL management strategies. Solar panels are composed of materials such as silicon, aluminium, glass, and silver, which can be recycled. Current solar PV panel recycling technologies are increasingly developing, helping to recover and recycle valuable materials and reduce e-waste. The recycling of materials from decommissioned solar PV panels and reintegrating them into secondary panels would close the loop of the solar PV life cycle and improve the circularity of solar PV technology, the energy sector and the economy [15].
Several recent studies emphasised the importance of improving EoL management of solar PV panels. Oteng et al. analysed research trends on solar panel waste management from 1974 to 2019, showing that the field has been growing but lacking policies on recycling, recovery, and waste management. They suggested future research directions towards CE [16]. Building on this, Oteng et al. [17] conducted a life cycle assessment (LCA) to evaluate environmental impacts of various policy scenarios for managing EoL solar PV modules in Australia. The results showed that mandatory product stewardship significantly reduces global warming potential compared to no-policy scenarios and highlighted that transportation logistics play a critical role in the environmental footprint of PV recycling systems. In addition, the importance of solar PV waste transportation was pointed out in [18]. The study projected that there would be more than 109,000 tonnes of PV waste in South Australia by 2050. Using emission modelling and route optimisation, it is found out that an optimised network of transfer stations and recycling facilities could reduce pollutant emissions by more than 34%, highlighting the need for supportive policies in planning for EoL logistics. Daljit Singh et al. compared landfill and two recycling pathways for EoL PV panels in Australia and suggested the consideration of recycling steps and technologies before implementation [19]. In India, Khankhoje et al. studied three EoL management strategies of landfill, incineration and recycling of solar PV and found that recycling offers the lowest environmental footprint, promoting resource recovery and emissions reduction [20]. These works highlighted the growing global concern over the EoL management of solar PV and the need for region-specific solutions.
Other literature has further emphasised the role of CE strategies in solar PV deployment. For an example, Heath et al. (2020) identified recycling of crystalline silicon modules as a key component of the circular economy, requiring technological improvements to reduce costs and environmental impact [21]. Heath and Drahi further emphasised that although full circularity has not yet been achieved, broader strategies beyond recycling—including policy, economic, and digital innovations—are essential to accelerate progress in the PV and battery sectors [22]. Leung et al. introduced refined circularity indicators to assess sustainability trade-offs [23], and Contreras Lisperguer et al. demonstrated how closed-loop material cycles can significantly reduce environmental impacts, though current recycling technologies and policies remain insufficient [24].
Considering that CE closely relates to resource efficiency and material use, it is expected that this aspect should be studied. However, the number of studies related to material use is limited. Mirletz et al. quantified the mass and energy impacts of reducing, reusing and recycling solar PV manufacturing and deployment [25]. Granata et al. conducted a techno-economic assessment of PV panel recycling, showing that economic viability is highly dependent on silver content, material recycling, and fees [26]. Their results emphasised that early investment and recovery of high-value materials such as silver are key to achieving profitability.
Due to the crucial role of solar PV in advancing the CE and the need for region-specific solutions, as well as the lack of study on the material aspect of CE in the solar PV sector, this paper comprehensively analyses the contributions of solar PV in transitioning from the linear economy to the CE. Considering that CE closely relates to material consumption and waste generation, the paper will focus on material demand of solar PV and contributions of solar PV EoL management to CE. The analysis will be performed by applying LCA to (1) estimate the material demand of the Italian solar PV supply chain by 2040 and (2) identify the reductions in material consumption and other environmental impacts such as energy savings and GHG emission reduction, thanks to recovery, recycling and reintegration of solar PV systems. Italy has been chosen as the case study due to its prominent role in solar PV adoption within Europe. The current solar PV installations of Italy account for 10% of the European capacity [27]. Moreover, Italy has set the ambitious 2030 and 2040 energy national targets under the EU Green Deal and the National Recovery and Resilience Plan, aiming for significant solar PV expansion by 2030 and beyond [28,29,30]. By quantifying the material demand and environmental benefits of the recovery and recycling scenario of the Italian solar PV sector, the paper offers an integrated approach, providing a data-informed assessment of solar PV’s contribution to the circular economy, being specific to a country. This CE-LCA integrated approach applied in this study can also be extended to other countries and upscaled to the global scale.
The next section explains the link between CE and LCA. In addition, the LCA method and the required data are described. The obtained results cover two main points: (1) material demand and (2) material, energy, GHG emission reductions and other life cycle environmental impacts of solar PV EoL management. The paper ends with a summary of the main results and insights into future research on the solar energy technology to support CE transition.

2. CE Indicators and LCA Methodology

The core meaning of CE is to mimic the natural system so that the product life cycle is extended. This can be performed by applying ‘R’ strategies such as recover, reuse, recycle, etc., at the EoL of the product system, using renewable energy and encouraging circular business models [31]. In this study, circularity is considered on the material scale, e.g., the material demand, the minimisation of virgin material input consumption, the reuse and reintegration of recovered materials, and reducing waste through improved material recovery. In the context of solar PV, this includes demand on virgin material for solar panels, designing for reuse, increasing recycling rates, and enhancing the reintegration of recovered materials into new solar panels.
To assess the contribution of these circular strategies, the European Commission has suggested several methods such as material flow analysis, LCA, and Product Environmental Footprint [32]. Other methods are also considered to assess circular strategies, such as environmentally extended input–output analysis, system dynamics, agent-based modelling, etc. [33]. Among these methods, LCA is the most popular method to assess the contributions of circular strategies [34]. This is mainly because of the shared principle of LCA and CE, which is based on a life cycle perspective and their common focus on the environmental dimension. Figure 1 illustrates the links between CE and LCA.
In the last few years, the shift to a CE in the solar PV sector has attracted much attention. The industry-level circularity measures typically combine material flow indicators with quantitative measures reflecting resource reuse, recycling, or repeated use. For the solar PV case, various metrics such as the circular material use rate [35], material circularity indicator [36], and EoL recycling and recovery rates are applied to measure the effectiveness of material reuse in production [37,38]. These methods tend to apply material flow analysis to determine the percentage of secondary materials, recycling rates, and product longevity. Their focus is to assess how well the industry closes material loops and lowers dependence on virgin materials, measured in terms of quantifying the proportion of recycled material utilised, product lifespan, and waste diverted from landfilling [37,38,39,40].
While these metrics provide a valuable insight into circular performance, they have several limitations when applied at a sector level. Firstly, they necessitate detailed, high-quality data on product lifetimes, reuse rates, and recycling efficiencies, which are often lacking, inconsistent, or outdated, especially for innovative technologies like advanced PV panels [41,42]. Moreover, most circularity metrics emphasise mass flows or material loops and overlook the broader environmental consequences of circular strategies, such as reuse, remanufacturing, or recycling. For example, an increase in material recovery does not automatically indicate an environmental advantage if the recovery process is energy- or emission-intensive. A recycling operation may seem to be circular, but it may consume high amounts of energy or produce toxic emissions that negate its environmental benefits [43,44].
Recent LCA-based studies on PV panel recycling and reuse underscore the importance of a thorough environmental performance evaluation to comprehend material circularity results [43,44]. The disconnect between material circularity and environmental sustainability has fostered a growing consensus in the literature regarding the importance of incorporating LCA into evaluations of circularity [41,45]. While LCA was not initially developed to assess circularity, it enhances material flow metrics by situating them within larger environmental objectives like emissions reduction, energy efficiency, and resource conservation [38,44]. LCA offers a comprehensive view of environmental impacts over a product’s life cycle from raw material extraction to EoL management. Its indicators can be used as complementary metrics in fostering more circular and sustainable decisions [46]. In addition, the databases for LCA are diverse and well-built, such as Ecoinvent [47], Environmental Footprint dataset [48], and many other databases [49], making it a strong tool, especially when detailed material flow data is lacking or unreliable [46,50].
This study utilises LCA to quantify the material demand and evaluate the contribution of solar PV EoL management to the CE. This approach is driven by the ongoing absence of comprehensive circularity datasets, the drawback of standalone circularity indicators and the growing recognition in academia that LCA is crucial for understanding the environmental aspects of circularity. By situating circular economy performance within an LCA framework, the paper aims to provide a more detailed and credible assessment of solar PV in the transition to a circular economy. The findings of this study seek to inform both policy development and industrial decision-making in the transition towards a CE within the renewable energy landscape.

3. Data and Method

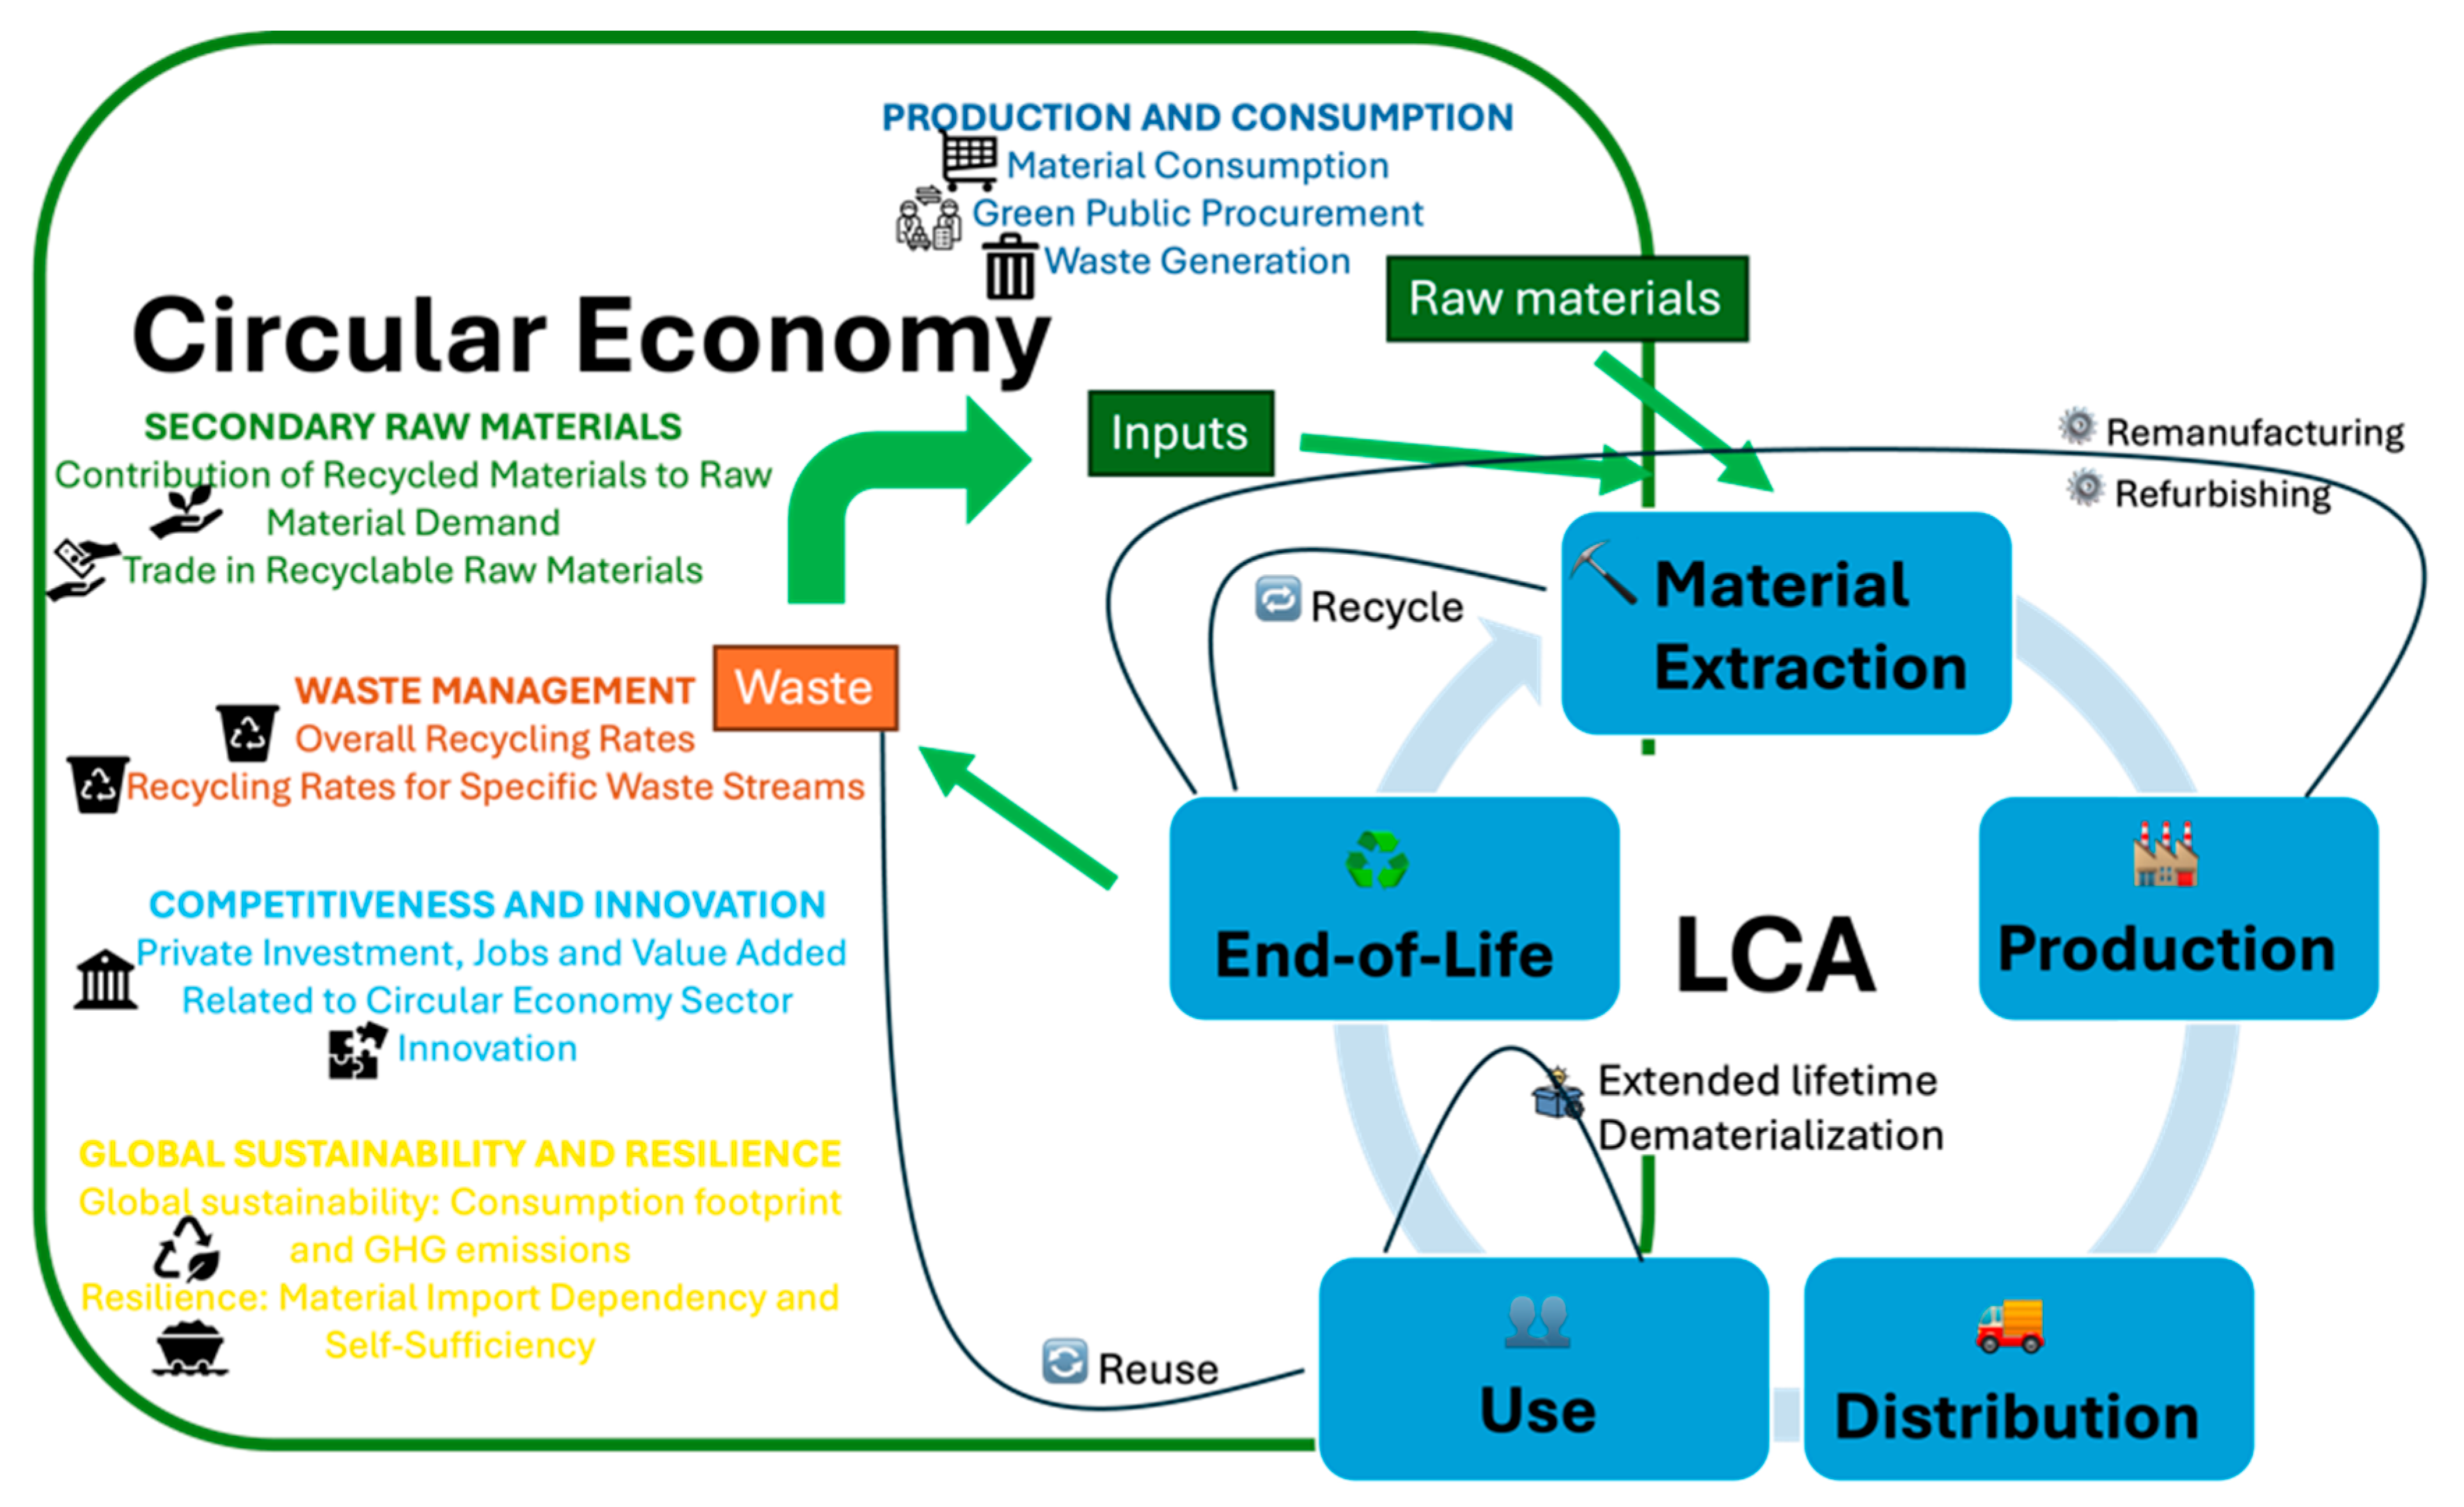
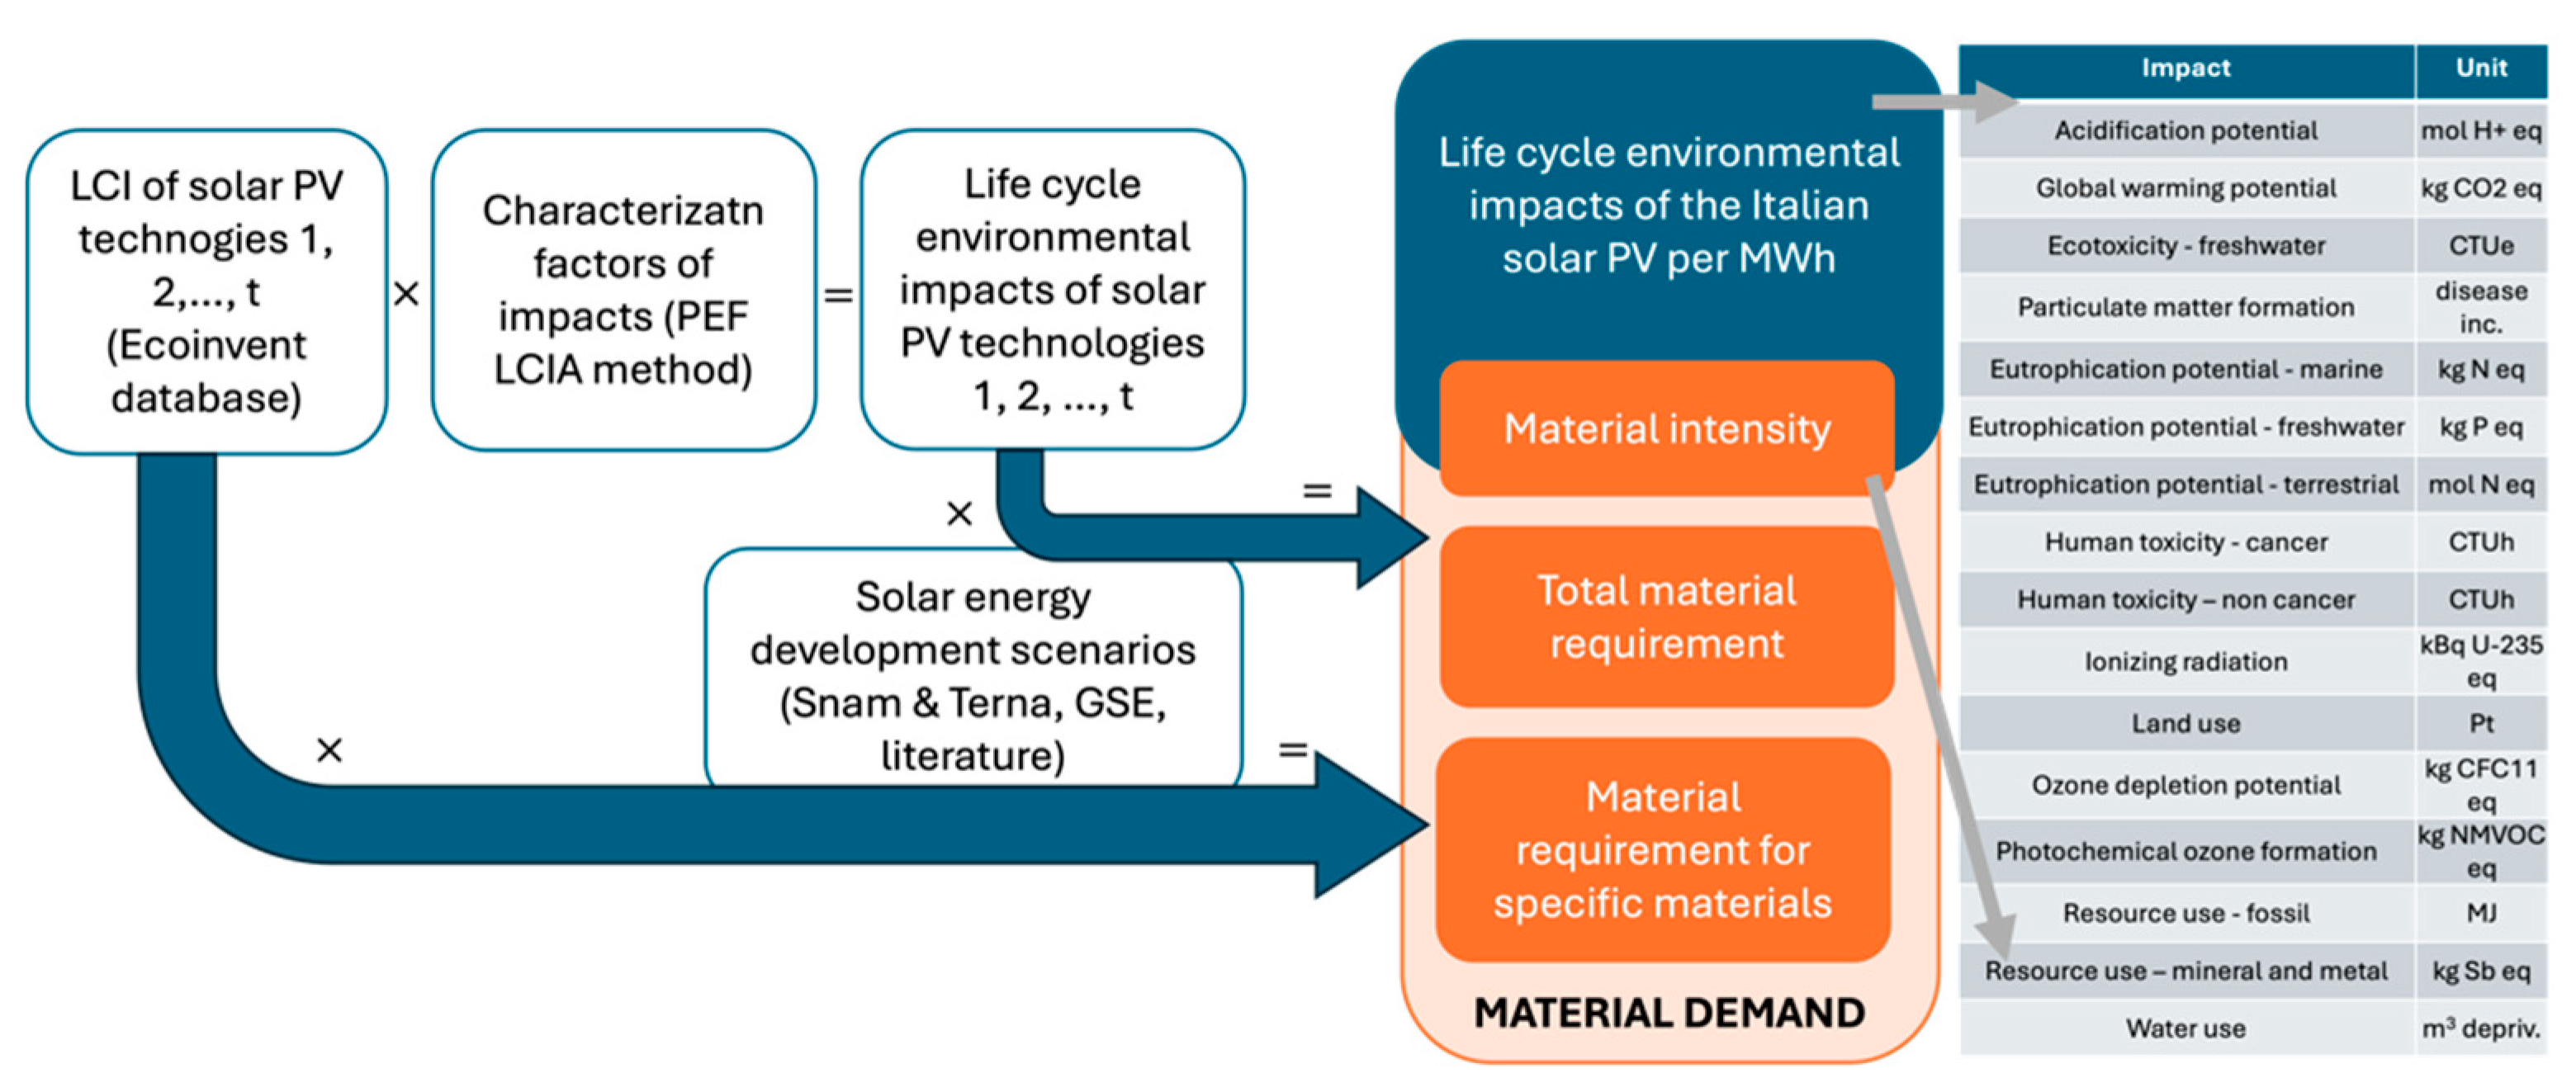
3.1. LCA Method and CE Integrated Approach

LCA is a holistic methodology to quantify and evaluate the environmental impacts of a product or service. It considers all impacts from the raw material extraction to make the product or service till the end of its life, which avoids the neglect of impacts or transfers the impacts from one stage during the life cycle to another stage [51]. In the CE context, LCA helps to identify and avoid strategies that may increase circularity while causing some unintended externalities or lead to burden shifting. There are several international standards guiding the application of LCA, such as the ISO 14040 and ISO 14044 standards [52,53] for conducting the LCA study, the guidelines of the IEA for LCA on solar PV [54,55,56] and the Product Environmental Footprint Category Rules (PEFCR) of the European Commission [57] for LCA of products in the EU context. This study will apply LCA according to the ISO 1404X standards, with reference to IEA guidelines and the PEFCR method.
The ISO1404X standards require four steps of LCA, including the goal and scope definition, life cycle inventory analysis, life cycle impact assessment and interpretation. In the goal and scope definition step, the goal and intended applications of the study, the functional unit, system boundary, data quality, assumptions, and life cycle impact assessment methods need to be clarified. The life cycle inventory analysis step concerns the data collection and quantifying all the environmental inputs and outputs. These inputs and outputs are then classified and converted into life cycle impacts by applying characterisation factors in the life cycle impact assessment step. The quantification of characterised results, which are also called midpoint results, is compulsory. While the endpoint results, which are quantified by applying normalisation and weighting factors, are optional. The last step, interpretation, aims at reporting and explaining the obtained results. During this last step, dominance, sensitivity, uncertainty and other analyses can be conducted to further understand the results [52,53].
Related to circularity aspects, LCA tools estimate the life cycle material consumption, e.g., the amounts of materials required for the product or service over their life cycle, and identify whether material consumption is a critical impact among various life cycle impacts. In addition, by applying comparative LCA, the material consumption for similar products can be compared, and the best-performing product from a material efficiency point of view can be identified. The LCA methodology measures the material consumption in different indicators, depending on the specific life cycle impact assessment methods. The ReCiPe method measures the consumption of minerals and metals (expressed in kg of copper equivalent (kg Cu eq), based on surplus ore potential, e.g., the average amount of ore produced from the amount of mineral and metal resources being extracted) [58]. The PEFCR method expresses the resource use of minerals and metals in kg Sb eq [59,60], meaning that all the extracted resources are converted into antimony. Although various life cycle impact assessment methods express the material consumption in different units of measurement, the scientific backgrounds for the quantification are very similar, e.g., based on the concept of abiotic resource depletion and the potential to extract the resources in the future. Figure 2 illustrates the CE-LCA integrated framework applied in this study.
The paper will report the life cycle inventory on raw materials, e.g., the consumption of main materials and metals for solar PV, being measured in tonnes of corresponding materials. The life cycle impact results include the resource use of minerals and metals (RU-m), and other critical life cycle impacts of solar PV, such as global warming potential (GWP) and resource use of fossil fuels (RU-f). Other life cycle impacts are reported but not deeply analysed. All these environmental impacts are quantified by applying the Product Environmental Footprint (PEF) method (life cycle impact assessment method). The quantification of 16 life cycle environmental indicators according to PEF and material demand can be seen in Figure 2. As indicated in Figure 2, material demand is studied in three indicators of material intensity (or RU-m), total material requirement and material requirement for specific minerals and metals. These indicators are quantified according to the following equations:
R U m = T M R 1 n E l e t ,
where
RUm is the material intensity of the Italian solar PV sector (g Sb eq per MWh, or tonne Sb eq per TWh).
TMR is the total material requirement of the Italian solar PV sector (tonne Sb eq).
Elet is the amount of electricity generated by solar PV technology t (TWh), and n is the number of technologies.
T M R = 1 n ( R U m t × E l e t )   ,
where
TMR is the total material requirement in the Italian solar PV sector (tonne Sb eq).
RUmt is the resource use, minerals and metals of technology t (tonne Sb eq per TWh).
Elet is the amount of electricity generated by solar PV technology t (TWh), and n is the number of technologies.
R U m t = L C I t × C F ,
where
RUmt is the resource use, minerals and metals of technology t (kg per kWh or 106 g Sb eq per MWh).
LCIt is the life cycle inventory of mineral and metal m for 1 kWh of electricity generated from technology t (kg).
CF is the characterisation factor of metals and minerals for the RU-m indicator (kg Sb eq per kg).
M R m = 1 n ( L C I t × E l e t )
where
MRm is the material requirement for specific minerals and metals m (kg for total kWh or ktonne for total TWh).
LCIt is the life cycle inventory of mineral and metal m for 1 kWh of electricity generated from technology t (kg).
Elet is the amount of electricity generated by solar PV technology t (kWh), and n is the number of technologies.
Table 1 provides the characterisation factors of some metals and minerals for the RU-m indicator. Further characterisation factors of other PEF indicators can be seen in the EU platform on LCA [60] and Simapro software [61].
All the results will be calculated per MWh of electricity from solar PV and for the Italian solar PV sector (functional unit). The system boundary is cradle to grave with two EoL management scenarios: business as usual (BAU) and recycling, reuse and reintegration (3R).
The collected data includes the background and foreground data. The foreground data are those of the processes which directly relate to the product system, e.g., electricity generated from the Italian solar PV panels and the EoL management strategies, while the foreground data belong to the processes being indirectly related to the product system, for example, material extraction, cell production, module installation, etc. In this study, the background data is derived from Ecoinvent [62] and the most updated IEA’s LCI data on solar PV [54]. The foreground data, which includes the Italy-specific solar development and its projections by technologies, are taken from GSE [63] and Snam and Terna [64] and described in Section 3.2. The EoL data of solar PV is taken from IEA [65,66] and elaborated in Section 3.3.

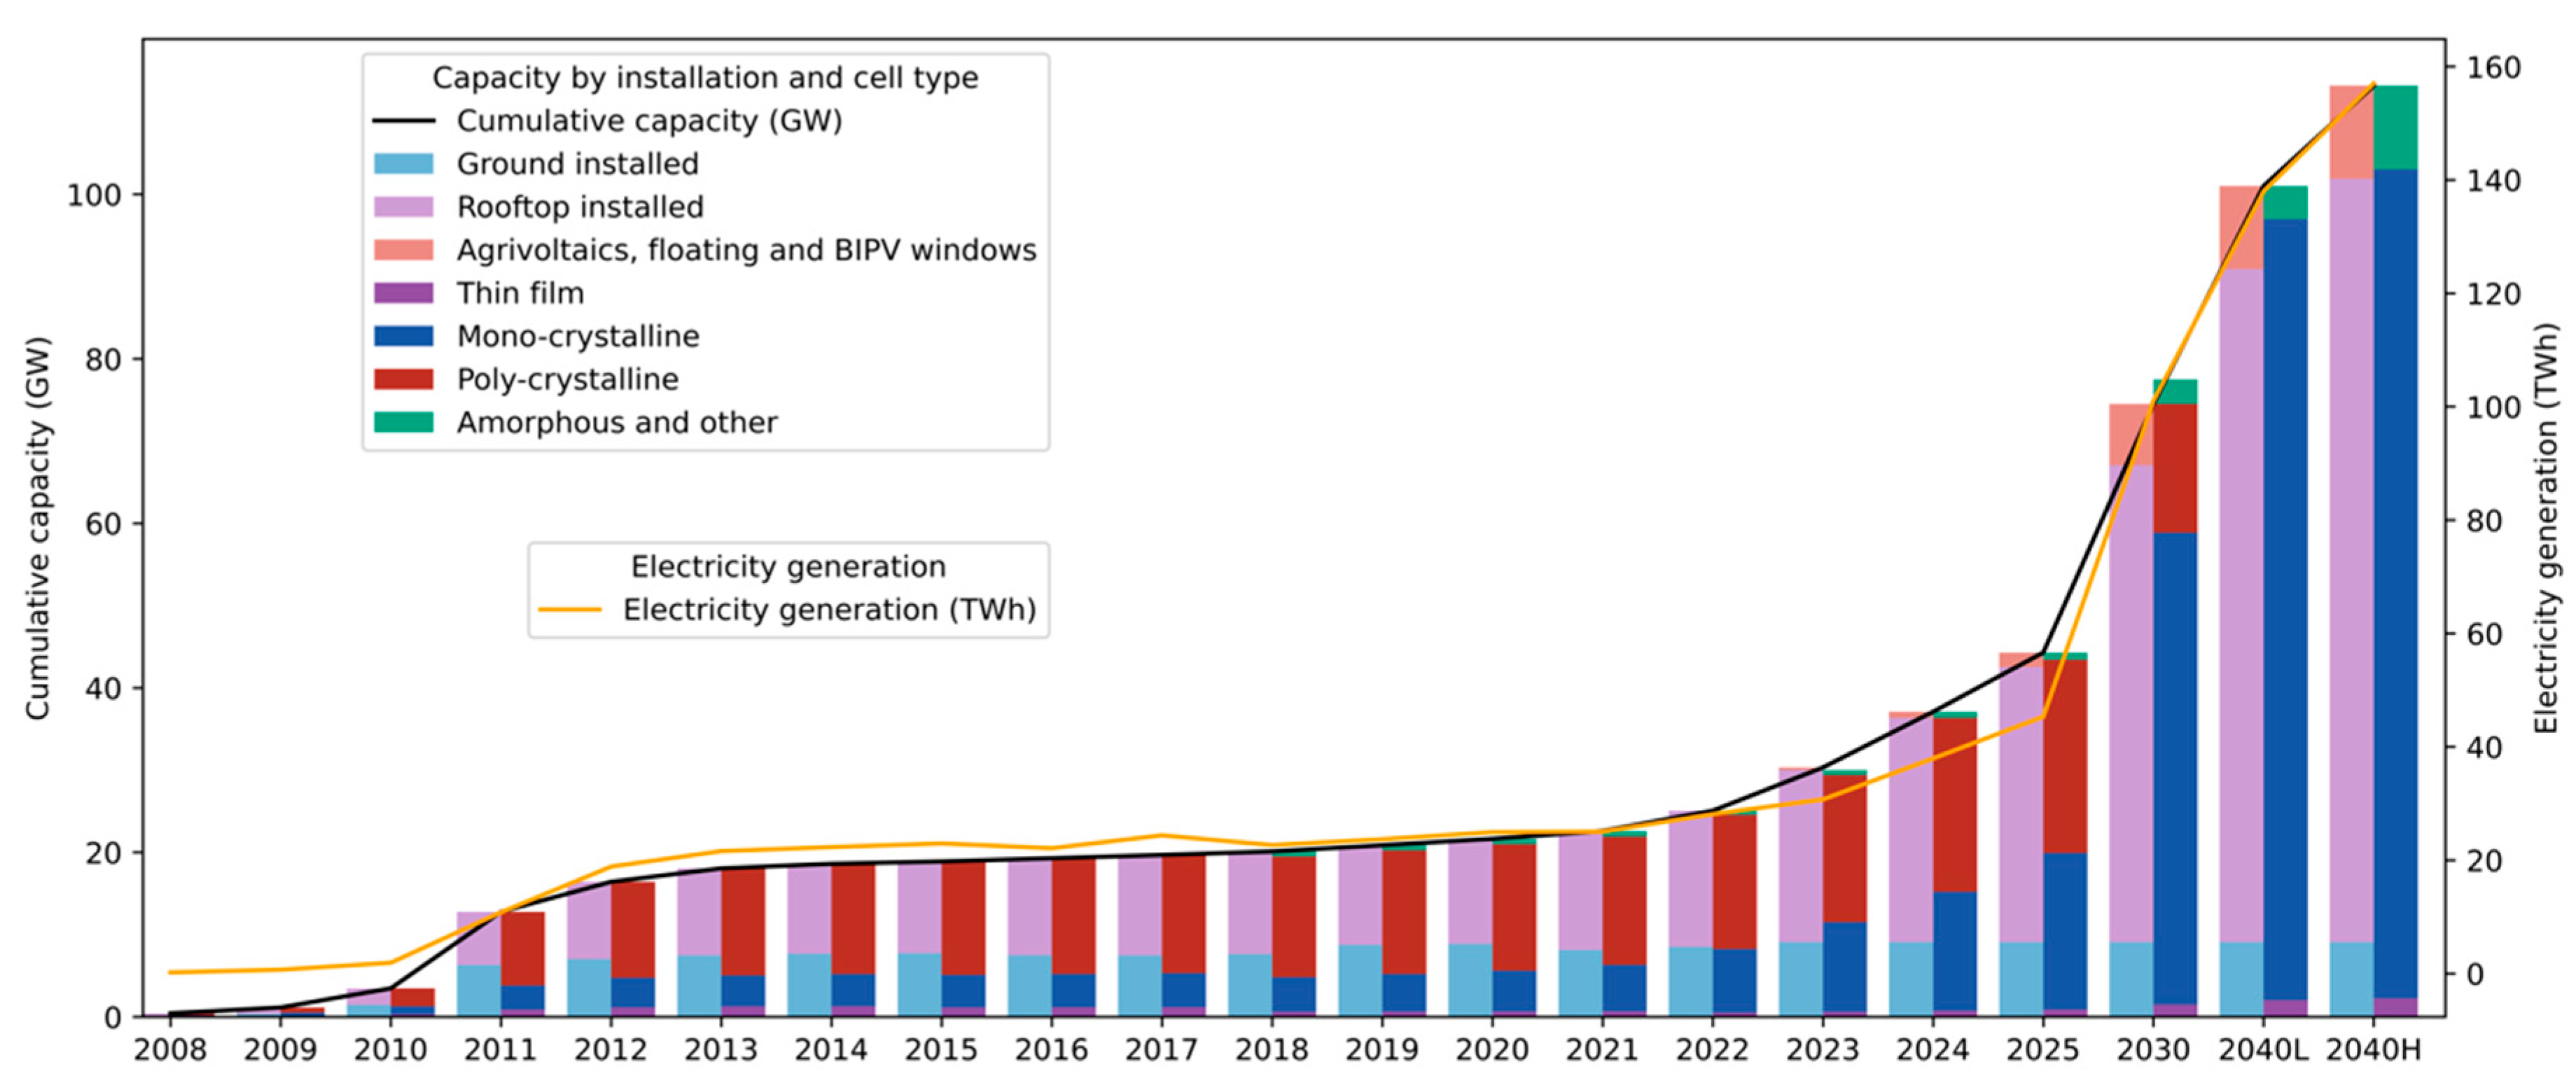
3.2. Life Cycle Inventory Data: Solar Energy Development

Solar PV provided 30.7 TWh of electricity in Italy in 2023, increasing 9.2% annually in the period of 2008–2023 [63,67]. The installed capacity also experiences a sharp increase from 0.5 GW in 2008 to 30.3 GW in 2023 [67,68]. It is expected that by 2030, the installed capacity of solar PV will reach 74.5 GW, providing 101 TWh of electricity [64]. By 2040, in order to meet the net-zero requirement, two scenarios have been proposed, with installed capacity of solar PV mounted to 101 GW in a low solar penetration scenario and 113.2 GW in a high solar penetration scenario [64]. The development pathway of the Italian solar PV sector from 2008 to 2040 is presented in Figure 3, with data compiled from GSE’s annual statistical reports on solar PV [63] and the Italian power development scenario of Snam and Terna [64]. The two scenarios of low and high solar penetrations are presented as 2040L and 2040H, respectively.
Regarding the types of installation, the ground installation accounted for 21% to 49.4% in the period of 2008–2023, or 38% on average. Until 2023, the first agrivoltaics and floating solar PV were introduced with 0.3 GW of installed capacity. Within the last five years, the percentage share of ground installation reduced by 2% annually, indicating the full exploitation of the land budget for solar PV. Therefore, it is expected that in the future, the share of ground installation in absolute value will remain the same as it is in 2023, making its share in percentage reduce from 30% in 2023 to 20.5% in 2025 and 12.2% by 2030. By 2040, ground installation will contribute to 9% in a low solar penetration scenario and 8% in a high solar penetration scenario. The increase in installed capacity in the future will be met by building integrated solar PV (BIPV) panels, mainly rooftop, and an increasing contribution of BIPV windows, at 5% by 2040. The share of agrivoltaics increases from 1% in 2023 to 5% by 2040.
In terms of materials for solar PV panels, within a decade, from 2010 to 2020, multi-crystalline (mc-Si) solar PV panels hold the largest share, around 70 to 73% of the total installation. However, the share of mc-Si solar PV panels has gradually decreased recently and is being replaced by single-crystalline (sc-Si) solar PV panels. Thin films, amorphous and other materials contributed a small percentage, from 4% to 6%, over the last 10 years. It is expected that the share of mc-Si panels will continue to decrease, contributing a negligible part of the total installation by 2040. The increasing installed capacity will be met by sc-Si solar PV panels such as silicon heterojunction and TOPcon [69]. Innovative thin films such as perovskite solar PV and other types of panels, such as tandem solar PV based on perovskite and (or) silicon, will be introduced into the market, causing an increase in the share of thin films, amorphous and other types of panels from 4% in 2023 to 6% in 2040L and 11% in 2040H.

3.3. Life Cycle Inventory Data: Recovery, Recycling, and Reintegrate of Materials

Two scenarios of solar PV EoL, namely BAU and 3R, are considered. BAU is quantified from 2008 to 2040, while the 3R only concerns the future years of 2030 and 2040. This assumption aligns with the actual situation and literature [70], in which currently only damaged PV modules are disposed of and the PV waste streams are minor (as the operation lifetime of PV is more than 25 years). In the BAU scenario, the cut-off approach has been applied. In this approach, the efforts of module recycling are allocated to waste treatment, glass cullet, aluminium and copper scrap by using economic allocation [66]. In such a case, the modelling of EoL of solar PV in the BAU scenario only includes the impacts from waste treatment. In the 3R scenario, the solar PV panels will be taken back and recycled. The recycled materials, including silica sand, aluminium and copper, will be reintegrated into the economy. This is performed by applying the EoL approach, and avoided burdens due to recovered materials are included in the modelling. The mounting structure and inverter are not included in the assessment. Table 2 presents the energy and material use and recovery from recycling 1 kg of solar PV panel in the 3R scenario [65,66].
In both scenarios, all the modules will be recycled when they reach their EoL. This assumption is very close to the actual situation of recycling solar PV in Italy, in which up to 97% of the module mass is recycled [65].

4. Results

There are two pieces of results being reported in this paper, including (1) the materials demand for solar development and (2) the material requirement and other environmental benefits of 3R. The first piece of results on material demand, which comprises material intensity or RU-m (g Sb eq/MWh), total material requirement (tonne Sb eq), and consumption of main minerals and metals (ktonne of specific minerals and metals) of the Italian solar PV sector, focuses on the circularity aspects. While the second piece of results covers the material reductions and benefits on life cycle environmental impacts of the 3R strategy applied in the Italian solar PV sector. The quantification of material demand is conducted annually for 30 years from 2008 to 2040 (BAU scenarios), while the material and environmental benefits of the 3R scenario are quantified for the future years only (2030 and 2040) to indicate the impact of the current change in EoL management strategies on the future material requirement. By 2040, two scenarios of low and high solar PV penetrations will be explored, being marked as 2040L and 2040H, respectively.

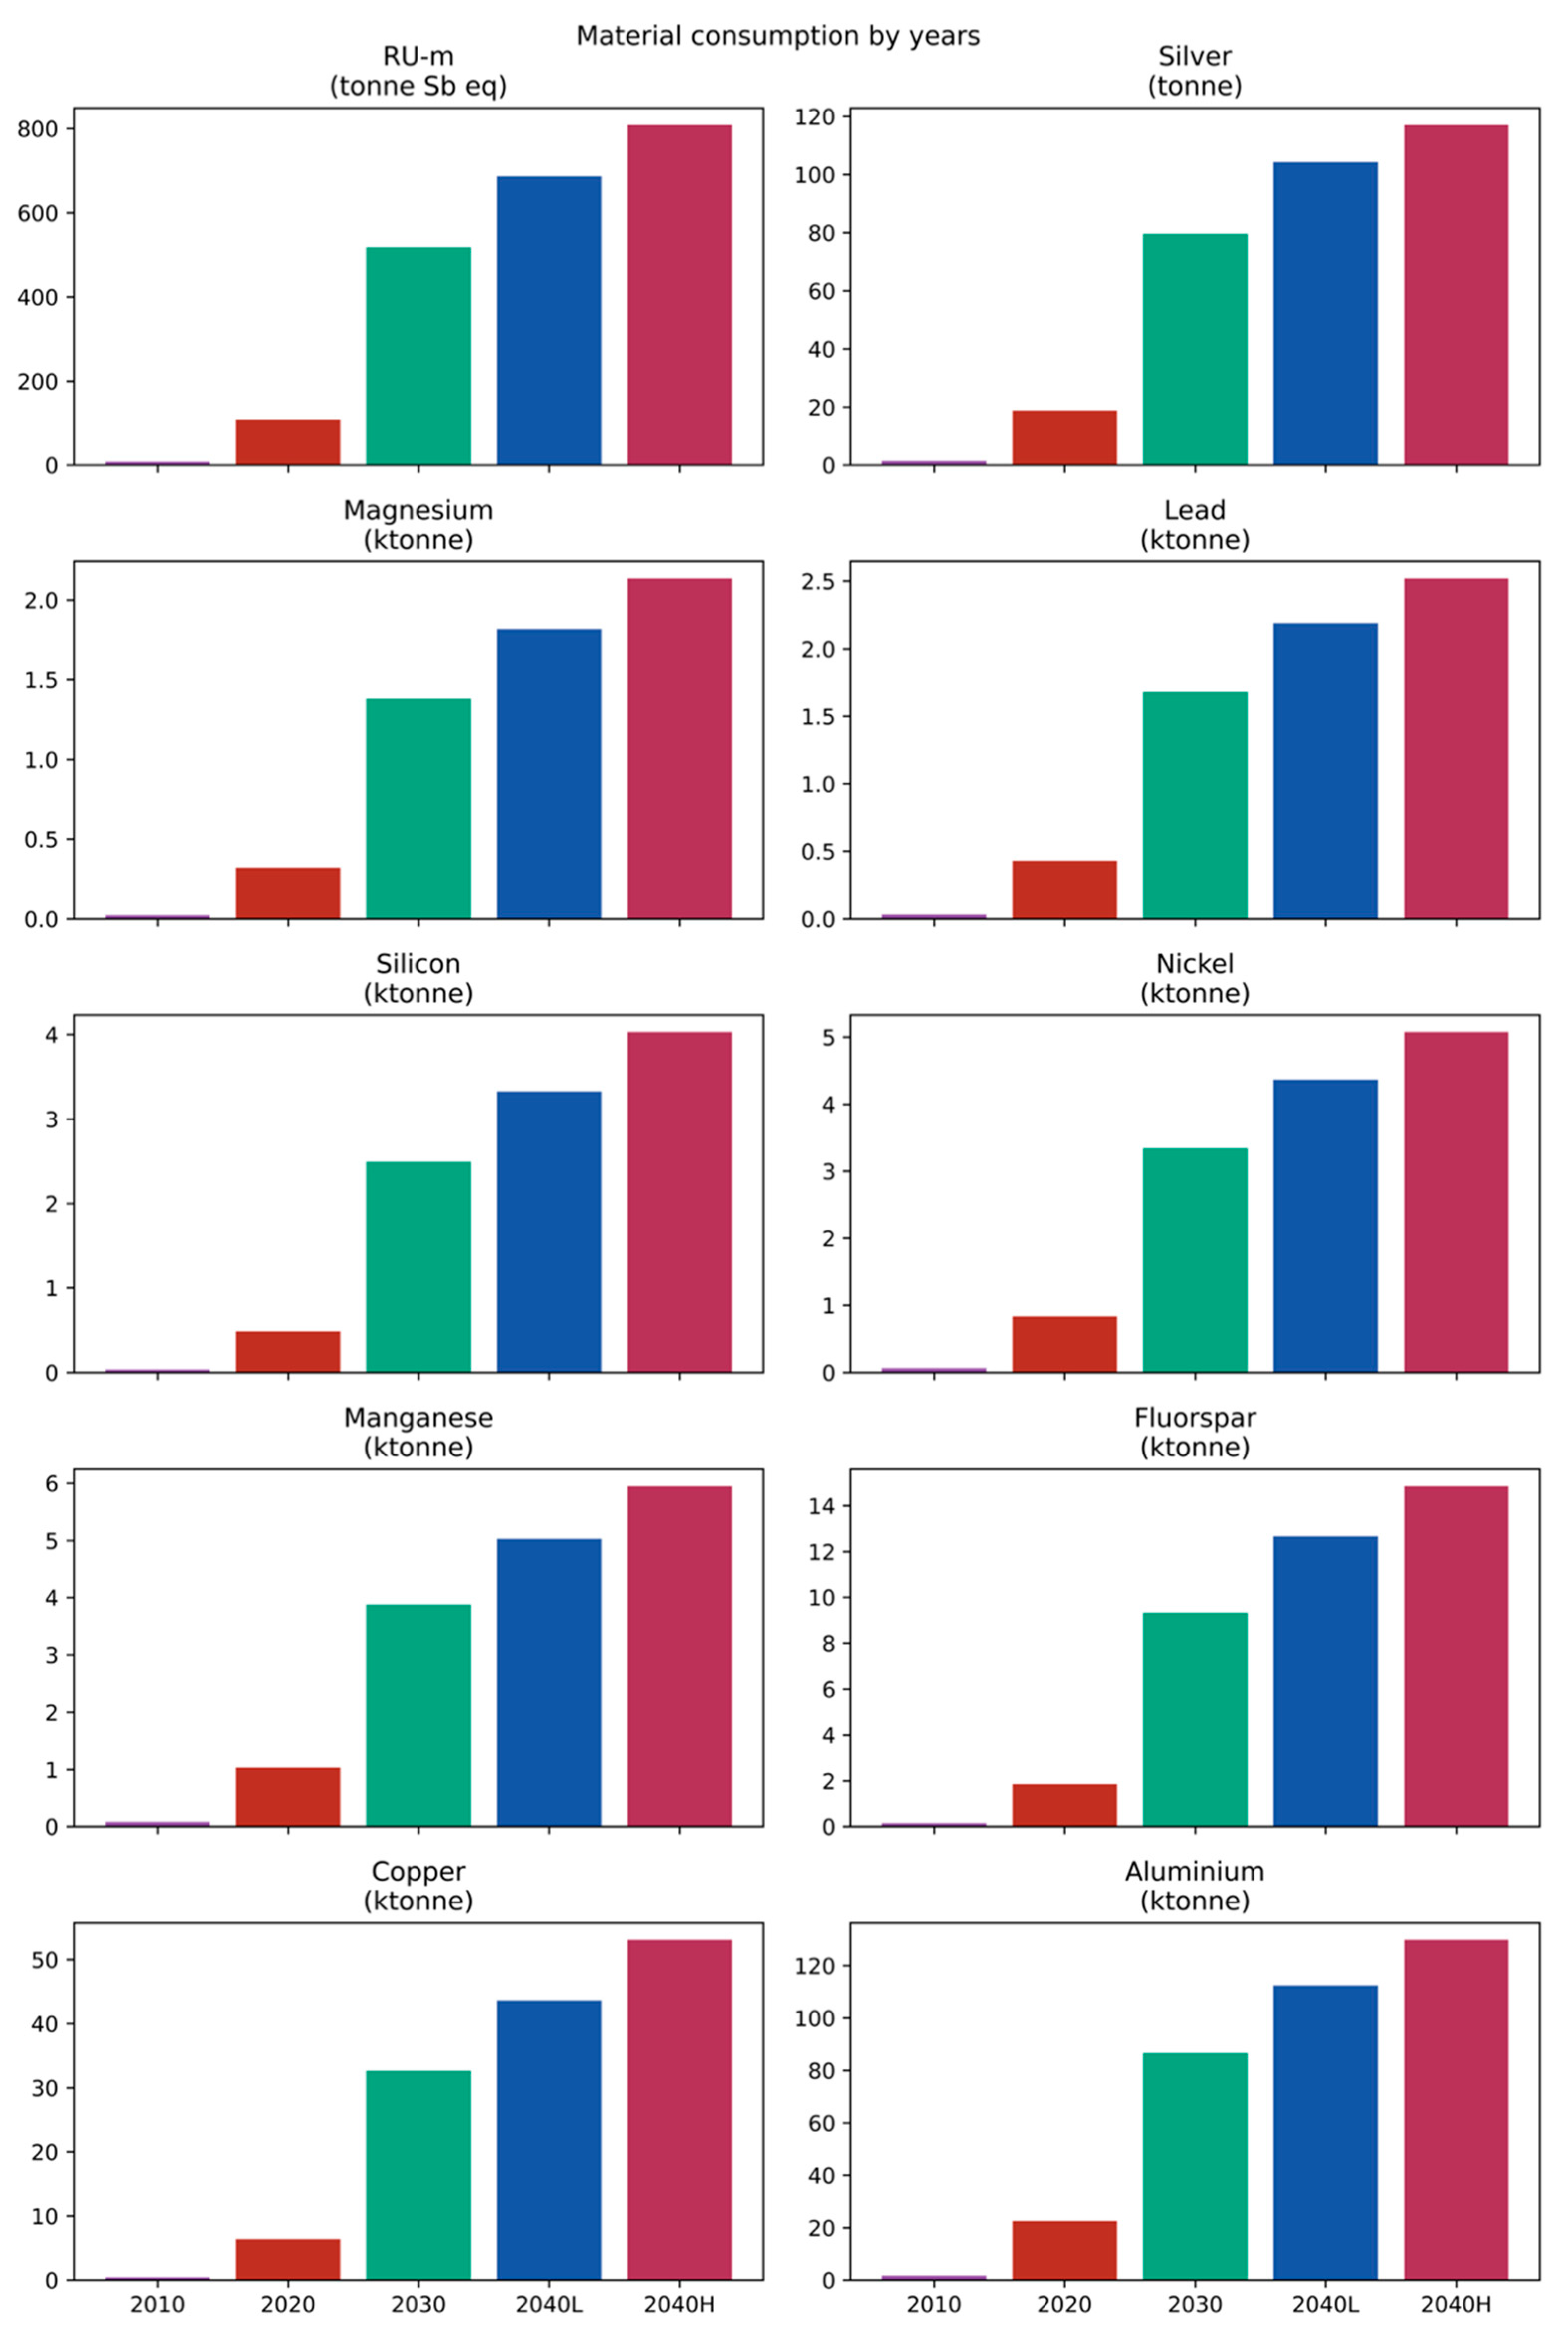
4.1. Material Demand for Solar PV Development

Figure 4 illustrates the fluctuation of RU-m of the Italian solar PV sector, measured in g Sb eq per MWh within 30 years between 2008 and 2040. The RU-m slightly reduces from 2008 to 2011, then gradually increases from 4.11 g Sb eq/MWh in 2011 to 5.12 g Sb eq/MWh in 2030. By 2040, the RU-m will be around 5.19 g Sb eq/MWh. The change in RU-m of electricity from solar PV corresponds to the change in the technology mix. PV deployments have historically been dominated by ground-mounted mc-Si panels, which are characterised by relatively low material requirements (at 3.11 g Sb eq/MWh). These panels benefit from simpler mounting structures and do not require a battery energy storage system, resulting in a reduced need for materials. Thanks to the increasing share of ground-mounted mc-Si panels in the system, the RU-m per MWh decreases in the period before 2011, even though the cumulatively installed capacity increased.
After 2011, solar PV is increasingly integrated into urban infrastructure, and more resource-intensive technologies such as rooftop installations are being adopted. Due to the complexity of integrating panels into roofs, as well as the additional framing, support, and interface components required compared to ground-mounted panels, the RU-m of the solar PV, in general, gradually increases from 2011 to the present. The rooftop panels require 5.04 and 5.16 g Sb eq/MWh for sc-Si and mc-Si panels, respectively. At the same time, the share of sc-Si, with more intensive RU-m, has been increasing, replacing the mc-Si, which also contributes to the increasing trend in the Italian solar PV sector.
In the future years, the system will be more diverse with an increasing share of agrivoltaics, floating PV and BIPV windows. These systems, especially BIPV panels, require the inclusion of a battery energy storage system and therefore have a higher material demand of 8.14 g Sb eq/MWh. The change in the share of technology causes an increase in the RU-m of the whole solar PV sector in the future, from around 4.67 g Sb eq/MWh in 2024 to 5.12 g Sb eq/MWh by 2030 and 5.18 g Sb eq and 5.20 g Sb eq/MWh by 2040 in the low and high solar penetration scenarios, respectively.
The moderate but steady increase in RU-m illustrates the trade-off between energy transition goals and resource sustainability. While solar PV remains a clean and low-emission energy source, its widespread deployment in more complex applications raises concerns about material availability and long-term environmental impacts. This trend, therefore, highlights the importance of promoting material-efficient PV technologies, improving recycling infrastructure, and encouraging circular economy strategies to mitigate future resource constraints.
Similarly to the material intensity, the total material requirement (in tonne Sb eq and tonne of corresponding materials) of the Italian solar PV sector experiences a steady increase over the decades, highlighting the environmental intensity of scaling up solar PV. From about eight tonnes Sb eq in 2010, RU-m increases significantly to 714 tonnes Sb eq by 2040 in the low solar penetration scenario and exceeds 816 tonnes Sb eq under the high solar deployment scenario. This increase is closely related to the increasing adoption of more material-intensive PV systems, such as building-integrated PV (BIPV) and advanced rooftop panels, which require higher structural and integration materials. Figure 5 illustrates the evolution of metal and mineral use in the Italian solar PV sector in tonnes of Sb eq and tonnes of main metals and critical raw materials from 2008 to 2040. Figure 6 compares the contribution of materials to various components of solar PV systems in 2010 and 2040.
One of the most notable aspects of this trend is the increasing use of aluminium and copper, two of the most consumed metals in the PV supply chain (see Figure 5). Aluminium is widely used in mounting structures, frames and racks for PV panels (see Figure 6) due to its light weight, strength and corrosion resistance. As solar PV installations expand, particularly in rooftop and BIPV, the demand for aluminium continues to increase steadily. By 2040, aluminium consumption is expected to reach 130 kilotonnes (ktonnes), reflecting continued reliance on the material for infrastructure support.
Copper, on the other hand, plays a key role in electrical and electronic components of solar PV systems, including wiring, interconnections and inverters. Although the total mass consumption of copper is lower than aluminium (reaching over 53.9 ktonnes by 2040), it contributes significantly more to resource use as measured by the Sb equation. This is due to the higher environmental and resource pressures associated with copper mining and processing. This emphasises the need for more efficient utilisation strategies, such as optimising system design to reduce copper intensity and investing in recycling processes to recover copper from decommissioned systems.
Silicon, the foundation material for photovoltaic panels, also shows a steady upward trend in consumption. From 478 tonnes in 2020, silicon demand will increase to around 4.1 kilotonnes by 2040. This increase reflects the dominance of silicon-based technologies, especially sc-Si and mc-Si panels in the global and Italian solar PV market. The improved efficiency of these panels, coupled with their falling costs, has made silicon the preferred material for most PV applications. However, this also requires continuous attention to the environmental impact of silicon production, especially regarding energy-intensive refining processes.
In addition to these key materials, some critical, strategic, and precious raw materials, such as silver, nickel, lead, manganese, magnesium and fluorspar, also saw an increase over the study period. For example, silver, an essential component of electrical contacts in PV panels, increased sharply from 18.8 tonnes in 2020 to 117 tonnes in 2040. The importance and high cost of silver make it a prime target for material substitution and efficiency improvements in PV panel manufacturing. Likewise, lead, manganese, magnesium and nickel, which are used in solder, frames, and panels, also saw significant growth, highlighting the need for sustainable design options and alternatives in PV system manufacturing.
As it is shown in Figure 6, there is a small change in the contribution of materials to various components between 2010 and 2040. In 2010, the Italian solar PV sector is made up of a relatively balanced mix of ground-mounted and rooftop systems. By 2040, the share of ground-mounted systems will reduce, being replaced by rooftop and BIPV systems. The rooftop and BIPV systems require more complex electrical installation, which causes an increase in copper demand at a noticeable rate compared to other remaining materials. At the same time, solar home PV systems such as rooftop and BIPV require a battery energy storage system, which makes the contribution of the battery to the total material requirement visible by 2040.
While solar PV offers clear benefits in decarbonising the energy sector, its material demands pose emerging sustainability challenges. Strategic interventions are needed to address increasing material intensity, including (1) promoting circular economy models to recover energy and recycle critical materials, (2) investing in low-impact material alternatives, and (3) improving system design and implementation efficiencies. These efforts will be essential to ensure that the environmental benefits of solar PV are not outweighed by the amount of material demand.

4.2. Material Requirement and Other Environmental Benefits of 3R

Thanks to the energy recovery and material recycling, the resource use intensity slightly reduces. The reduction is clearly shown in ground-mounted and BIPV systems. The ground-mounted PV reduces from 3.11 to 3.08 g Sb eq per MWh. BIPV reduces from 8.14 to 8.03 g Sb eq per MWh. Meanwhile the material consumptions of roof installation for both mc-Si and sc-Si have no noticeable decrease. The reduction in each of the technologies leads to the reduction in the average material consumption intensity of the Italian solar PV sector. Specifically, by 2030 the material consumption will reduce from 5.12 to 5.11 g Sb eq per MWh. Similarly, the material consumption by 2040 reduces by 0.02 g Sb eq per MWh, from 5.18 g Sb eq in the 3R scenario to 5.16 g Sb eq per MWh in the BAU scenario with the low solar penetration and from 5.20 g Sb eq to 5.18 g Sb eq under the high solar penetration.
At the same time, the total material consumption for the Italian solar PV sector in the 3R scenario reduces accordingly compared to the BAU scenario. Specifically, the total material consumption in the 3R scenario by 2030 will be 518 tonnes Sb eq, reducing two tonnes Sb eq compared to the BAU scenario. By 2040, the total material consumption will reduce two tonnes Sb eq for both cases of solar penetrations in the 3R scenario, from 816 tonnes Sb eq in the BAU scenario to 814 tonnes Sb eq in the case of high solar penetration. Figure 7 presents the reduction in total material consumption in the 3R scenario.
In detail, the reductions in the total material consumption are highest among sand, calcite, and aluminium, which are the materials for making solar glass and panel frames (as presented in Figure 7). Specifically, the sand and calcite amounts reduce by 7.17 ktonnes and 20.8 ktonnes by 2030, respectively. By 2040, in the high solar penetration scenarios, recycling helps to reduce 10.5 ktonnes of sand and 27.2 ktonnes of calcite, compared to the BAU scenario. The aluminium amount reduces by 4.4 ktonnes from 85.1 ktonnes to 80.7 ktonnes by 2030 and by 6.3 ktonnes from 130 ktonnes to 124 ktonnes by 2040 in the high solar penetration scenario. These materials are obtained by mechanical recycling of solar PV panels, which does not require auxiliary material but only consumes electricity for operating the machines [65]. The process is relatively simple; therefore, the recycling rates of these materials are high, reaching 98% for glass and 100% for aluminium [71]. This is the main reason for the relatively large amount of reduction in this material consumption, thanks to the recycling of the solar PV panel.
It is interesting that the amount of copper does not reduce in the 3R scenario, although copper has a high recycling rate of 95% [71]. In fact, the amount of copper slightly increases by 1.15 tonnes by 2030 and 1.48 tonnes by 2040. This is likely caused by the fact that the use of copper for electricity production (used for the recycling process) outweighs the amount of copper obtained from the recycling process of the solar PV panel.
Other materials which have a low recycling rate and are assumed to be unrecycled in this study, such as magnesium, manganese, nickel, silicon and silver, experience a slight increase in the 3R scenario. For an example, the amount of silver increases by 2.91 kg by 2030 and 3.81 kg by 2040 in the high solar penetration scenario. By 2030, the amounts of manganese, magnesium and nickel increase by 337 kg, 458 kg and 613 kg, respectively. By 2040, in the high solar penetration scenario, they increase by 361 kg, 598 kg and 800 kg, respectively.
Notably, the amount of lead reduces in the 3R scenarios, although there is no direct benefit of lead recycling. By 2030 and 2040, the amount of lead reduces by 857 kg and 126 kg, respectively. This reduction likely comes from the energy recovery benefit of the 3R scenario.
The GWP and RU-f of the 3R scenario are slightly smaller than those of the BAU scenario (as illustrated in Figure 8). Specifically, the GWP of the Italian solar PV sector in future years in the 3R scenario is 75.9 kg CO2 eq per MWh on average, reducing about 0.2 kg CO2 eq compared to the BAU scenario. In 2030, the GWP will reduce by about 0.4 kg CO2 eq in the 3R and less than 0.05 kg CO2 eq in 2040 for both cases of solar penetration. Similarly, the RU-f reduces accordingly, from 945 MJ in the BAU scenario to 943 MJ in the 3R scenario, on average. By 2030, the RU-f reduces by 5.13 MJ and less than 1 MJ in 2040 for both cases of solar penetration. The reductions in all life cycle environmental impacts in 2030 and 2040 with high solar penetration are presented in Table 3. As being indicated in Table 3, the environmental impacts in the 3R scenario reduce for all impact categories, with various scales of change. By 2030, the changes are small for most impact categories, at less than 1% reduction, except for the case of freshwater eutrophication and ionising radiation, which reduce by 1.9% and 1.4%, respectively. The reductions by 2040 are even unnoticeable. Notably, the 3R strategies bring the significant benefit in terms of water use, in which water has been produced from the recycling process, from 36 m3 to 442 m3 per MWh.

4.3. Sensitivity Analysis

Due to the fact that the material demand of the Italian solar PV sector depends on the technology mix, a sensitivity analysis is conducted on the share of the technology mix. Specifically, the share of agrivoltaics, floating and BIPV windows increases from 10% to 12% in 2030 and 2040, and the shares of ground-mounted and rooftop installations reduce by 1% each in these years. In this case, the increase in the share of agrivoltaics, floating and BIPV windows leads to a 1.6% increase in the material intensity of the Italian solar PV sector, from 5.12 to 5.21 g Sb eq/MWh by 2030 and from 5.20 to 5.28 g Sb eq/MWh by 2040 in the high solar deployment scenario. Except for silver and sand, the requirements of specific minerals and metals increase to a marginal extent. The silver and sand requirements see negligible reductions, being less than 0.5% for the case of silver and 0.15% for the case of sand by 2040. The material intensity and the requirements of specific materials are highly sensitive to the technology mix, particularly BIPV windows due to their battery integration, structural complexity and slightly lower silver and sand consumptions. This analysis confirms the importance of promoting dematerialisation of solar PV designs and efficient recycling systems to ensure resource resilience among materials. Figure 9 illustrates the changes in RU-m per MWh of electricity from the Italian solar PV sector and the material requirement for specific minerals and metals by 2030 and 2040.

5. Discussion

With the increasing PV technology development globally, material consumption patterns for production are crucial to understand for projecting future resource requirements and planning for sustainability. The current work focuses on the metal and mineral use within the Italian solar PV sector during the period 2008–2040, considering the life cycle perspective. It is identified that the RU-m intensity increases from 4.67 g Sb eq per MWh in 2008 to 5.12 g Sb eq in 2030 and 5.20 g Sb eq in 2040. The increase in RU-m per MWh implies that as solar PV technologies become more material intensive. The RU-m intensity in the Italian solar PV sector is in the range of obtained results for solar PV technologies from 2.9 to 6.8 g Sb eq per MWh [42]. However, it is seven times higher than those obtained for silicon-based solar PV technologies in China, from 0.37 to 0.77 g Sb eq per MWh [72]. The lower RU-m of solar PV in China (compared to those of Italy in this study) likely originates from the difference in the studied technologies, e.g., the mixture of solar PV technology in this study and mono-facial and bi-facial passivated emitter and rear cell (PERC) in [72], and the transportation distance. The majority of solar PV being installed in Italy historically comes from China, which causes a long distance of transportation, inevitably leading to metal and mineral resource use for transoceanic transportation fuels and infrastructure. This urges the need to localise the production of solar PV components and the recycling of decommissioned PV panels, for example, in the EU or even in Italy, to reduce the transportation distance of the new or recycled solar PV.
The increase in RU-m intensity, together with the increasing demand for solar electricity, leads to the increase in the total amount of resource use for the Italian solar PV sector and the amounts of specific and critical materials, including aluminium, copper, nickel, magnesium, manganese, fluorspar, and silver. The increase is highest in aluminium and copper, due to the large share of these metals in solar PV panels. The requirement for aluminium rises from 9.8 ktonnes in 2010 to 130 ktonnes in 2040, and copper demand increases from 462 tonnes in 2010 to 53.9 ktonnes in 2040. Apart from common materials for a PV system, such as aluminium, copper, glass, and silicon, the solar PV sector also requires a large amount of other critical and strategic raw materials, such as silver, nickel, and fluorspar. The dependence on these materials becomes heavier in the future, suggesting the future of resource scarcity and the need for resource-efficient solar PV panels.
By applying recovery energy, recycling materials and reintegrating these recycled materials into the economy, the resources needed for solar PV panels over their life cycle might be reduced. The resource use intensity reduces from 5.12 g Sb eq to 5.11 g Sb eq per MWh in 2030 and from 5.20 g Sb eq to 5.18 g Sb eq per MWh in 2040. For the Italian solar PV sector, the resource use also reduces from 518 tonnes Sb eq to 516 tonnes Sb eq by 2030 and from 816 tonnes Sb eq to 814 tonnes Sb eq by 2040. The reduction is most obvious in sand and calcite for solar glass and aluminium for wiring, in which demand for sand reduces from 159 ktonnes to 152 ktonnes by 2030 and from 247 ktonnes to 236 ktonnes by 2040. These findings are consistent with the work of [73], who demonstrated how CE interventions such as recycling and EoL silicon recovery can significantly reduce primary consumption of material, from 9.61 ktonnes to 4.08 ktonnes of quartz per GWp.
In addition, comparing these findings to the global resource demand for solar PV [69], the Italian solar PV sector demand for metals and minerals is slightly less than 0.36% of the global silver demand and less than 0.01% of the global indium demand by 2030. These proportions will reduce marginally by 2040 as a result of the CE initiatives described above. Xu et al. further noted that the global resource requirements are sensitive to the solar PV technology choices [69]. For instance, in case silicon-based technologies such as PERC and TOPCon are utilised to their fullest, the silver demand remains the same while the indium demand is zero. However, the next-generation technologies, such as tandem perovskite–silicon solar PV, would significantly increase the silver demand from 144 ktonnes to 1121 ktonnes and the indium demand from 0 to 209 ktonnes. Consequently, it should be noted that while the CE interventions, such as recycling and recovery, bring marginal gains, the technology choice will be the determining factor for the resource demand in the future. This urges the need for eco-design of solar PV technologies to bring the innovative technologies from the laboratory to the market. These innovative technologies would deliver similar performance while consuming fewer resources and causing less environmental impact for long-term environmental sustainability.
Apart from the material demand, other environmental impacts are reduced thanks to the recycling. The reductions in environmental impacts come from both the use of virgin materials to a lesser extent and the recovery of energy from recycling. Considering the life cycle perspective, the 3R strategies not only bring the benefits of using less virgin materials and energy for the panels themselves but also reduce the impacts from background processes to provide electricity, energy, materials and intermediate products required for manufacturing panels and their components.
Under the 3R scenario, this study reports a GWP of approximately 75.9 kg CO2 eq per MWh by 2040, which aligns with the GWP values reported in several studies globally. For example, Tan et al. highlighted the range of CO2 emissions from solar PV from 26.76 to 93.79 kg CO2 eq per MWh, depending on the technologies and installation locations [74], while Muteri et al. reported a higher range of 83 to 130 kg CO2 eq per MWh [42]. In the case of recycling, the GWP of solar PV in Australia may reduce from 59 kg CO2 eq in a landfilling scenario to 54 and 46 kg CO2 eq per MWh under the glass recycling and full recycling scenarios, respectively [19]. Sun et al. further reinforced the environmental benefits of recycling by estimating that recycling electrical and electronic equipment plastic waste can reduce carbon emissions by 13% to 77% depending on the applied technology, and potentially contribute up to 10.33 million tonnes of CO2 emission reduction by 2050 under the high-efficiency recycling conditions [75].
In addition to the environmental benefits, recycling and reuse of solar PV systems also brings significant social and economic benefits. On the economic side, developing a robust PV recycling industry could create new green jobs in disassembly, material recovery, logistics and remanufacturing. A study by IRENA estimates that solar PV recycling could generate billions of dollars in recovered materials and support thousands of jobs by 2050 [76,77]. On the social side, local recycling infrastructure can reduce dependence on imported materials, increase energy resilience and contribute to regional development, especially in regions transitioning from traditional energy sectors [78]. Furthermore, adopting circular business models such as “PV as a Service” not only reduces waste but also reduces upfront costs for consumers, promoting broader access to clean energy [79]. These socio-economic results strengthen the argument for integrating CE principles into national PV deployment strategies.
While the findings highlight the environmental and material benefits of CE interventions, a number of practical challenges remain in the collection and recycling of old solar panels. First, logistical barriers exist due to the distributed nature of PV systems, particularly rooftop systems, which make large-scale collection costly and time-consuming [80]. Second, technical difficulties arise from the complex multilayer structure of the panels, in which valuable materials such as silicon, silver and indium are embedded in small quantities and require specialised equipment to separate them [81]. Third, the economic viability of recycling remains limited, as the market value of recovered materials often does not justify the high costs of disposal, especially in the absence of supportive policy frameworks or extended producer responsibility schemes [82]. Furthermore, policy and regulatory fragmentation slows the establishment of comprehensive EoL management systems across regions [83]. Finally, data availability and traceability of installed PV systems are often inadequate, hindering efforts to forecast volumes and plan effective EoL management [84].
Addressing these issues requires collaborative efforts of government, industry, and academia to support infrastructure development, technological innovation, enforceable EoL regulations and a supportive framework for the adoption of circular strategies. Future research should focus on comprehensive assessments of PV’s contributions to CE, including economic feasibility, policy frameworks, and life cycle sustainability. Strengthening these areas will enhance the role of solar PV in creating a more resilient, resource-efficient, and sustainable global energy system.
To improve the effectiveness of recycling and reuse of solar PV panels in practice, several concrete steps are suggested as follows: (1) promoting eco-design strategies for easy disassembly and material separation [85], (2) developing dedicated recycling infrastructure to handle composite PV components [86], (3) implementing extended producer responsibility schemes to drive collection and material recovery [87,88], (4) standardising labelling and material databases to support sorting and processing [89,90], (5) encouraging business models such as repair and second-life reuse of panels [91], and (6) integrating national PV tracking systems to support EoL planning [92]. These recommendations provide a practical foundation for translating circular economy strategies into real-world PV system management.
Furthermore, solar PV systems can be exploited as a service. This circular business model allows customers to pay for solar energy only, instead of buying the solar PV panels. When the panels reach their EoL, the company will be responsible for repairing the broken components, reusing the good ones and remanufacturing the whole panels, creating a second life for the solar PV systems. This helps minimise resources and waste, reduce production costs, and create additional economic value, consequently making solar energy accessible for more households and businesses.
This study provides practical value for policy, industry and academia. For the government, the research results are an important basis for developing a strategy to ensure resource security, promote domestic solar equipment production and establish an effective PV battery recovery and recycling system towards a circular economy. For businesses, the “PV as a Service” model can be applied, allowing the reuse or refurbishment of equipment at the end of its life cycle, reducing costs and waste generation. In the academic field, it is necessary to continue researching advanced PV technologies with the aim of improving environmental performance, recyclability and developing circular economic models in the renewable energy industry.
One limitation of the study is the uncertainty of the projections of solar energy development by technologies up to 2040. The installed capacity of solar PV by 2040 is based on robust data sources and well-established assumptions [64]; however, the forecast in the technology mix of the Italian solar PV sector is unavailable. As a result, this technology mix has developed on the historical trend of Italy [63] and the literature of the global trends [69]. Each technology has its unique material composition, especially for the cases of emerging solar PV technologies such as perovskite solar cells, perovskite–silicon tandem solar cells, and building-integrated solar PV; therefore, any change in the technology mix will cause corresponding material demand. In addition, the uncertainties remain in the market dynamics and policy shifts that may alter the pace of solar PV deployment and the technology uptake. To address this, the scenario-based approach was adopted, using both low and high solar penetration trajectories to bracket potential outcomes. In addition, the sensitivity analysis supports the understanding of technology mix’s contributions to the material demand. While absolute values may vary over time, the relative trends and insights into material hotspots and circular opportunities remain reliable and policy relevant. Incorporating ongoing improvements in PV efficiency, recycling technologies, and material substitution into future assessments will further enhance forecasting accuracy.

6. Conclusions

This research provides a comprehensive life cycle assessment of material and environmental impacts associated with the Italian solar PV sector from 2008 to 2040. The increasing demand for critical and strategic raw materials—such as aluminium, copper, and silver—alongside growing deployment scales, highlights the urgency of integrating CE principles into national energy planning.
The study demonstrates that CE interventions like recycling and material recovery can modestly reduce both resource use intensity and carbon emissions. However, the results also underscore that these strategies alone are insufficient; future technological choices will play a more decisive role in determining long-term sustainability. For instance, next-generation solar technologies could dramatically shift material demands, requiring proactive eco-design and innovation policies.
This work contributes to academia by extending the understanding of PV life cycle impacts, providing a methodological basis for future studies, and identifying material bottlenecks. It supports government policy-making by informing strategies for resource security and circular infrastructure. For industry, the findings encourage the adoption of eco-design strategies, circular business models and reuse and remanufacturing measures. Ultimately, this research fills a crucial gap by connecting material demands with circular innovations, paving the way for a more resilient and sustainable energy future.

Author Contributions

Conceptualization, L.Q.L., M.C. and N.H.N.; methodology, L.Q.L., T.Q.N. and S.K.; software, L.Q.L. and N.H.B.; formal analysis, L.Q.L., T.Q.N., S.K. and F.N.; investigation, L.Q.L., T.Q.N., S.K. and F.N.; data curation, L.Q.L., T.Q.N. and S.K.; writing—original draft preparation, all authors; writing—review and editing, L.Q.L., T.Q.N., M.C. and N.H.N.; visualization, L.Q.L.; supervision, M.C. and F.N.; funding acquisition, M.C. All authors have read and agreed to the published version of the manuscript.

Funding

This research and the APC were funded by the European Union—NextGenerationEU, under the project PNRR NEST code PE0000021, CUP B73C22001280006.

Institutional Review Board Statement

Not applicable.

Informed Consent Statement

Not applicable.

Data Availability Statement

The original contributions presented in this study are included in the article. Further inquiries can be directed to the corresponding author.

Acknowledgments

This work has been developed in the framework of the project “Network 4 Energy Sustainable Transition—NEST”, code PE0000021, CUP B73C22001280006, Spoke 1, funded under the National Recovery and Resilience Plan (PNRR), Mission 4, by the European Union—NextGenerationEU.

Conflicts of Interest

The authors declare no conflicts of interest. The funders had no role in the design of the study; in the collection, analyses, or interpretation of data; in the writing of the manuscript; or in the decision to publish the results.

References

  1. Ellen MacArthur Foundation. Towards the Circular Economy Vol. 1: An Economic and Business Rationale for an Accelerated Transition. Available online: https://ellenmacarthurfoundation.org/towards-the-circular-economy-vol-1-an-economic-and-business-rationale-for-an (accessed on 14 May 2025).
  2. Kirchherr, J.; Yang, N.-H.N.; Schulze-Spüntrup, F.; Heerink, M.J.; Hartley, K. Conceptualizing the Circular Economy (Revisited): An Analysis of 221 Definitions. Resour. Conserv. Recycl. 2023, 194, 107001. [Google Scholar] [CrossRef]
  3. Geissdoerfer, M.; Savaget, P.; Bocken, N.M.P.; Hultink, E.J. The Circular Economy—A New Sustainability Paradigm? J. Clean. Prod. 2017, 143, 757–768. [Google Scholar] [CrossRef]
  4. Kristia, K.; Rabbi, M.F. Exploring the Synergy of Renewable Energy in the Circular Economy Framework: A Bibliometric Study. Sustainability 2023, 15, 13165. [Google Scholar] [CrossRef]
  5. EC Communication from the European Commission. A New Circular Economy Action Plan for a Cleaner and More Competitive Europe. Available online: https://eur-lex.europa.eu/resource.html?uri=cellar:9903b325-6388-11ea-b735-01aa75ed71a1.0017.02/DOC_1&format=PDF (accessed on 14 May 2025).
  6. Kalmykova, Y.; Sadagopan, M.; Rosado, L. Circular Economy—From Review of Theories and Practices to Development of Implementation Tools. Resour. Conserv. Recycl. 2018, 135, 190–201. [Google Scholar] [CrossRef]
  7. Moraga, G.; Huysveld, S.; Mathieux, F.; Blengini, G.A.; Alaerts, L.; Van Acker, K.; De Meester, S.; Dewulf, J. Circular Economy Indicators: What Do They Measure? Resour. Conserv. Recycl. 2019, 146, 452–461. [Google Scholar] [CrossRef] [PubMed]
  8. Rincón-Moreno, J.; Ormazábal, M.; Álvarez, M.J.; Jaca, C. Advancing Circular Economy Performance Indicators and Their Application in Spanish Companies. J. Clean. Prod. 2021, 279, 123605. [Google Scholar] [CrossRef]
  9. Yu, J.; Tang, Y.M.; Chau, K.Y.; Nazar, R.; Ali, S.; Iqbal, W. Role of Solar-Based Renewable Energy in Mitigating CO2 Emissions: Evidence from Quantile-on-Quantile Estimation. Renew. Energy 2022, 182, 216–226. [Google Scholar] [CrossRef]
  10. Jäger-Waldau, A.; Kougias, I.; Taylor, N.; Thiel, C. How Photovoltaics Can Contribute to GHG Emission Reductions of 55% in the EU by 2030. Renew. Sustain. Energy Rev. 2020, 126, 109836. [Google Scholar] [CrossRef]
  11. Rabaia, M.K.H.; Shehata, N.; Olabi, V.; Abdelkareem, M.A.; Semeraro, C.; Chae, K.-J.; Sayed, E.T. Enabling the Circular Economy of Solar PV through the 10Rs of Sustainability: Critical Review, Conceptualization, Barriers, and Role in Achieving SDGs. Sustain. Horiz. 2024, 11, 100106. [Google Scholar] [CrossRef]
  12. Paraschiv, L.S.; Paraschiv, S. Contribution of Renewable Energy (Hydro, Wind, Solar and Biomass) to Decarbonization and Transformation of the Electricity Generation Sector for Sustainable Development. Energy Rep. 2023, 9, 535–544. [Google Scholar] [CrossRef]
  13. Mehedi, T.H.; Gemechu, E.; Kumar, A. Life Cycle Greenhouse Gas Emissions and Energy Footprints of Utility-Scale Solar Energy Systems. Appl. Energy 2022, 314, 118918. [Google Scholar] [CrossRef]
  14. Cellura, M.; Luu, L.Q.; Guarino, F.; Longo, S. A Review on Life Cycle Environmental Impacts of Emerging Solar Cells. Sci. Total Environ. 2024, 908, 168019. [Google Scholar] [CrossRef] [PubMed]
  15. Abdirahman, A.A.; Asif, M.; Mohsen, O. Circular Economy in the Renewable Energy Sector: A Review of Growth Trends, Gaps and Future Directions. Energy Nexus 2025, 17, 100395. [Google Scholar] [CrossRef]
  16. Oteng, D.; Zuo, J.; Sharifi, E. A Scientometric Review of Trends in Solar Photovoltaic Waste Management Research. Sol. Energy 2021, 224, 545–562. [Google Scholar] [CrossRef]
  17. Oteng, D.; Zuo, J.; Sharifi, E. An Evaluation of the Impact Framework for Product Stewardship on End-of-Life Solar Photovoltaic Modules: An Environmental Lifecycle Assessment. J. Clean. Prod. 2023, 411, 137357. [Google Scholar] [CrossRef]
  18. Oteng, D.; Zuo, J.; Sharifi, E. Environmental Emissions Influencing Solar Photovoltaic Waste Management in Australia: An Optimised System Network of Waste Collection Facilities. J. Environ. Manag. 2022, 314, 115007. [Google Scholar] [CrossRef] [PubMed]
  19. Daljit Singh, J.K.; Molinari, G.; Bui, J.; Soltani, B.; Rajarathnam, G.P.; Abbas, A. Life Cycle Assessment of Disposed and Recycled End-of-Life Photovoltaic Panels in Australia. Sustainability 2021, 13, 11025. [Google Scholar] [CrossRef]
  20. Khankhoje, O.; Bherwani, H.; Biniwale, R. Assessing Life Cycle Environmental Impacts of Solar Photovoltaics in India with a Focus on End-of-Life Disposal. Environ. Sci. Pollut. Res. 2025, 1–22. [Google Scholar] [CrossRef] [PubMed]
  21. Heath, G.A.; Silverman, T.J.; Kempe, M.; Deceglie, M.; Ravikumar, D.; Remo, T.; Cui, H.; Sinha, P.; Libby, C.; Shaw, S.; et al. Research and Development Priorities for Silicon Photovoltaic Module Recycling to Support a Circular Economy. Nat. Energy 2020, 5, 502–510. [Google Scholar] [CrossRef]
  22. Heath, G.; Drahi, E. Circular Economy in Photovoltaics; IEA PVPS, 2024. Available online: https://iea-pvps.org/wp-content/uploads/2024/03/IEA-PVPS-T12-02-2024-FACT-SHEET-Circular-Economy.pdf (accessed on 14 May 2025).
  23. Leung, T.L.; Willson, G.K.; Fimbres-Weihs, G.; Deng, R.; Chang, N.; Tan, V.; Abbas, A.; Ho-Baillie, A. A New Perspective for Evaluating Circularity of Photovoltaic Module Recycling and Technology Developments. Cell Rep. Phys. Sci. 2025, 6, 102547. [Google Scholar] [CrossRef]
  24. Contreras Lisperguer, R.; Muñoz Cerón, E.; de la Casa Higueras, J.; Martín, R.D. Environmental Impact Assessment of Crystalline Solar Photovoltaic Panels’ End-of-Life Phase: Open and Closed-Loop Material Flow Scenarios. Sustain. Prod. Consum. 2020, 23, 157–173. [Google Scholar] [CrossRef]
  25. Mirletz, H.; Ovaitt, S.; Sridhar, S.; Barnes, T.M. Prioritizing Circular Economy Strategies for Sustainable PV Deployment at the TW Scale. EPJ Photovolt. 2024, 15, 18. [Google Scholar] [CrossRef]
  26. Granata, G.; Altimari, P.; Pagnanelli, F.; De Greef, J. Recycling of Solar Photovoltaic Panels: Techno-Economic Assessment in Waste Management Perspective. J. Clean. Prod. 2022, 363, 132384. [Google Scholar] [CrossRef]
  27. Pourasl, H.H.; Barenji, R.V.; Khojastehnezhad, V.M. Solar Energy Status in the World: A Comprehensive Review. Energy Rep. 2023, 10, 3474–3493. [Google Scholar] [CrossRef]
  28. MISE; MEIT; MIT. Integrated National Energy and Climate Plan (NECP), Ministry of Economic Development, Ministry of the Environment and Protection of Natural Resources and the Sea, Ministry of Infrastructure and Transport: Rome, Italy. 2019. Available online: https://energy.ec.europa.eu/system/files/2020-02/it_final_necp_main_en_0.pdf (accessed on 14 May 2025).
  29. EC. Assessment of National Energy and Climate Plan Italy; European Commission: Brussels, Belgium. Available online: https://energy.ec.europa.eu/document/download/47c8139a-1500-4837-ba66-f1aa5483e47e_en#:~:text=The%20EU%20has%20committed%20itself,by%20the%20end%20of%202019 (accessed on 14 May 2025).
  30. IEA. Italy 2023 Energy Policy Review; IEA Energy Policy Reviews; OECD Publishing: Paris, France, 2023; ISBN 978-92-64-43946-7. [Google Scholar] [CrossRef]
  31. European Parliament. Circular Economy: Definition, Importance and Benefits; European Parliament: Strasbourg, France, 2023. [Google Scholar]
  32. Bobba, S.; Coelho, F.; Mathieux, F. Circular Economy: Indicators, Tools and Methods; 2023. Available online: https://rmis.jrc.ec.europa.eu/CE (accessed on 14 May 2025).
  33. Walzberg, J.; Lonca, G.; Hanes, R.J.; Eberle, A.L.; Carpenter, A.; Heath, G.A. Do We Need a New Sustainability Assessment Method for the Circular Economy? A Critical Literature Review. Front. Sustain. 2021, 1, 620047. [Google Scholar] [CrossRef]
  34. Sassanelli, C.; Rosa, P.; Rocca, R.; Terzi, S. Circular Economy Performance Assessment Methods: A Systematic Literature Review. J. Clean. Prod. 2019, 229, 440–453. [Google Scholar] [CrossRef]
  35. EC. Circular Economy Monitoring Framework. Available online: https://ec.europa.eu/eurostat/web/circular-economy/monitoring-framework (accessed on 13 May 2025).
  36. Ellen MacArthur Foundation. Material Circularity Indicator. Available online: https://www.ellenmacarthurfoundation.org/material-circularity-indicator (accessed on 14 May 2025).
  37. D’Adamo, I.; Ferella, F.; Gastaldi, M.; Ippolito, N.M.; Rosa, P. Circular Solar: Evaluating the Profitability of a Photovoltaic Panel Recycling Plant. Waste Manag. Res. 2023, 41, 1144–1154. [Google Scholar] [CrossRef] [PubMed]
  38. Zubas, A.R.; Fischer, M.; Gervais, E.; Herceg, S.; Nold, S. Combining Circularity and Environmental Metrics to Assess Material Flows of PV Silicon. EPJ Photovolt. 2023, 14, 10. [Google Scholar] [CrossRef]
  39. Bracquené, E.; Dewulf, W.; Duflou, J.R. Measuring the Performance of More Circular Complex Product Supply Chains. Resour. Conserv. Recycl. 2020, 154, 104608. [Google Scholar] [CrossRef]
  40. Luthin, A.; Traverso, M.; Crawford, R.H. Circular Life Cycle Sustainability Assessment: An Integrated Framework. J. Ind. Ecol. 2024, 28, 41–58. [Google Scholar] [CrossRef]
  41. Corona, B.; Shen, L.; Reike, D.; Rosales Carreón, J.; Worrell, E. Towards Sustainable Development through the Circular Economy—A Review and Critical Assessment on Current Circularity Metrics. Resour. Conserv. Recycl. 2019, 151, 104498. [Google Scholar] [CrossRef]
  42. Muteri, V.; Cellura, M.; Curto, D.; Franzitta, V.; Longo, S.; Mistretta, M.; Parisi, M.L. Review on Life Cycle Assessment of Solar Photovoltaic Panels. Energies 2020, 13, 252. [Google Scholar] [CrossRef]
  43. Fan, H.-H.; Salas-Redondo, C.; Chalaux, A. Life Cycle Assessment of an Innovative High-Value-Recovery Crystalline Silicon Photovoltaic Recycling Process—The Environmental Impacts and Benefits. EPJ Photovolt. 2024, 15, 35. [Google Scholar] [CrossRef]
  44. Wang, L.; Oberbeck, L.; Marchand Lasserre, M.; Perez-Lopez, P. Modelling Recycling for the Life Cycle Assessment of Perovskite/Silicon Tandem Modules. EPJ Photovolt. 2024, 15, 14. [Google Scholar] [CrossRef]
  45. Gong, T.; Yi, Y. The Effect of Service Quality on Customer Satisfaction, Loyalty, and Happiness in Five Asian Countries. Psychol. Mark. 2018, 35, 427–442. [Google Scholar] [CrossRef]
  46. Samani, P. Synergies and Gaps between Circularity Assessment and Life Cycle Assessment (LCA). Sci. Total Environ. 2023, 903, 166611. [Google Scholar] [CrossRef] [PubMed]
  47. Ecoinvent. Ecoinvent Database. Available online: https://ecoinvent.org/the-ecoinvent-database/ (accessed on 13 May 2025).
  48. EC. EPLCA. Available online: https://eplca.jrc.ec.europa.eu/EFpilot.html (accessed on 13 May 2025).
  49. OpenLCA. OpenLCA Nexus Databases. Available online: https://nexus.openlca.org/databases (accessed on 13 May 2025).
  50. Cilleruelo Palomero, J.; Freboeuf, L.; Ciroth, A.; Sonnemann, G. Integrating Circularity into Life Cycle Assessment: Circularity with a Life Cycle Perspective. Clean. Environ. Syst. 2024, 12, 100175. [Google Scholar] [CrossRef]
  51. Horne, R. Life Cycle Assessment: Origins, Principles and Context. In Life Cycle Assessment—Principles, Practice and Prospects; CSIRO Publishing: Collingwood, Australia, 2009; pp. 1–8. [Google Scholar]
  52. ISO 14040:2006; ISO Environmental Management—Life Cycle Assessment—Principles and Framework. International Organization for Standardization: Geneva, Switzerland, 2006.
  53. ISO 14044:2006; ISO Environmental Management—Life Cycle Assessment—Requirements and Guidelines. International Organization for Standardization: Geneva, Switzerland, 2006.
  54. Frischknecht, R.; Itten, R.; Sinha, P.; De Wild-Scholten, M.; Zhang, J.; Heath, G.A.; Olson, C. Life Cycle Inventories and Life Cycle Assessments of Photovoltaic Systems; International Energy Agency (IEA) PVPS Task 12, Report T12-19:2020; ISBN 978-3-907281-14-7. p. 1–88. NREL/TP-6A20-73853, 1561526; Available online: https://iea-pvps.org/wp-content/uploads/2020/12/IEA-PVPS-LCI-report-2020.pdf (accessed on 14 May 2025).
  55. Frischknecht, R.; Heath, G.; Raugei, M.; Sinha, P.; de Wild-Scholten, M. Methodology Guidelines on Life Cycle Assessment of Photovoltaic Electricity; International Energy Agency: Paris, France, 2016; Available online: https://iea-pvps.org/wp-content/uploads/2020/01/Task_12_-_Methodology_Guidelines_on_Life_Cycle_Assessment_of_Photovoltaic_Electricity_3rd_Edition.pdf (accessed on 14 May 2025).
  56. Raugei, M.; Frischknecht, R.; Olson, C.; Sinha, P.; Heath, G. Methodological Guidelines on Net Energy Analysis of Photovoltaic Electricity; International Energy Agency: Paris, France, 2016; Available online: https://iea-pvps.org/wp-content/uploads/2020/01/Task12_-_Methodological_Guidelines_on_Net_Energy_Analysis_of_Photovoltaic_Electricity.pdf (accessed on 14 May 2025).
  57. EC. Commission Recommendation of 16.12.2021 on the Use of the Environmental Footprint Methods to Measure and Com-municate the Life Cycle Environmental Performance of Products and Organisations. 2021. Available online: https://eur-lex.europa.eu/resource.html?uri=cellar:75e0de0f-5e6d-11ec-9c6c-01aa75ed71a1.0019.02/DOC_1&format=PDF (accessed on 14 May 2025).
  58. Huijbregts, M.A.J.; Steinmann, Z.J.N.; Elshout, P.M.F.; Stam, G.; Verones, F.; Vieira, M.; Zijp, M.; Hollander, A.; van Zelm, R. ReCiPe2016: A Harmonised Life Cycle Impact Assessment Method at Midpoint and Endpoint Level. Int. J. Life Cycle Assess. 2017, 22, 138–147. [Google Scholar] [CrossRef]
  59. Damiani, M.; Ferrara, N.; Ardente, F. Understanding Product Environmental Footprint and Organisation Environmental Footprint Methods, EUR 31236 EN, Publications Office of the European Union, Luxembourg, 2022, ISBN 978-92-76-57214-5, JRC129907. Available online: https://publications.jrc.ec.europa.eu/repository/handle/JRC129907 (accessed on 13 May 2025).
  60. EPLCA. Environmental Footprint (EF) Impact Assessment. Available online: https://eplca.jrc.ec.europa.eu/EFVersioning.html (accessed on 14 May 2025).
  61. SimaPro; PRé Sustainability. 2021. Available online: https://simapro.com/about/ (accessed on 14 May 2025).
  62. Ecoinvent. Ecoinvent Database Version 3.7.1. 2023. Available online: https://support.ecoinvent.org/ecoinvent-version-3.7 (accessed on 13 May 2025).
  63. GSE. Rapporto Statistico Solare Fotovoltaico. Available online: https://www.gse.it/dati-e-scenari/statistiche (accessed on 13 May 2025).
  64. Snam; Terna Documento Di Descrizione Degli Scenari. Available online: https://download.terna.it/terna/Documento_Descrizione_Scenari_2022_8da74044f6ee28d.pdf (accessed on 11 June 2022).
  65. IEA. Advances in Photovoltaic Module Recycling Literature Review and Update to Empirical Life Cycle Inventory Data and Patent Review. International Energy Agency, 2024, Report IEA-PVPS T12-28:2024. Available online: https://iea-pvps.org/wp-content/uploads/2024/06/IEA-PVPS-T12-28-2024-Report-PV-Recycling-LCI_EPRI.pdf (accessed on 14 May 2025).
  66. Stolz, P.; Frischknecht, R. Life Cycle Assessment of Current Photovoltaic Module Recycling; IEA, France. 2018. Report IEA-PVPS T12-13:2018. Available online: https://iea-pvps.org/wp-content/uploads/2020/01/Life_Cycle_Assesment_of_Current_Photovoltaic_Module_Recycling_by_Task_12.pdf (accessed on 14 May 2025).
  67. GSE. Rapporto Statistico Solare Fotovoltaico. 2023. Available online: https://www.gse.it/documenti_site/Documenti%20GSE/Rapporti%20statistici/Solare%20Fotovoltaico%20-%20Rapporto%20Statistico%202023.pdf (accessed on 13 May 2025).
  68. GSE. Rapporto Statistico Solare Fotovoltaico. 2008. Available online: https://www.gse.it/documenti_site/Documenti%20GSE/Rapporti%20statistici/IL%20FOTOVOLTAICO-2008.pdf (accessed on 13 May 2025).
  69. Xu, C.; Isabella, O.; Vogt, M.R. Future Material Demand for Global Silicon-Based PV Modules under Net-Zero Emissions Target until 2050. Resour. Conserv. Recycl. 2024, 210, 107824. [Google Scholar] [CrossRef]
  70. Paiano, A. Photovoltaic Waste Assessment in Italy. Renew. Sustain. Energy Rev. 2015, 41, 99–112. [Google Scholar] [CrossRef]
  71. Khakpour, S.; Luu, L.Q.; Nocera, F.; Latteri, A.; Cellura, M. The Solar Waste Challenge: Estimating and Managing End-of-Life Photovoltaic Panels in Italy. Energies 2025, 18, 2219. [Google Scholar] [CrossRef]
  72. Jia, X.; Zhou, C.; Tang, Y.; Wang, W. Life Cycle Assessment on PERC Solar Modules. Sol. Energy Mater. Sol. Cells 2021, 227, 111112. [Google Scholar] [CrossRef]
  73. Bartie, N.J.; Cobos-Becerra, Y.L.; Fröhling, M.; Schlatmann, R.; Reuter, M.A. The Resources, Exergetic and Environmental Footprint of the Silicon Photovoltaic Circular Economy: Assessment and Opportunities. Resour. Conserv. Recycl. 2021, 169, 105516. [Google Scholar] [CrossRef]
  74. Tan, D.; Wu, Y.; Zhang, Z.; Jiao, Y.; Zeng, L.; Meng, Y. Assessing the Life Cycle Sustainability of Solar Energy Production Systems: A Toolkit Review in the Context of Ensuring Environmental Performance Improvements. Sustainability 2023, 15, 11724. [Google Scholar] [CrossRef]
  75. Sun, L.; Dong, H.; Dai, Y.; Dong, J.; Fujii, M.; Geng, Y.; Lou, Z.; Liu, X. Environmental Benefit of Recycling Plastics from Waste Electrical & Electronic Equipment. Resour. Conserv. Recycl. 2024, 211, 107855. [Google Scholar] [CrossRef]
  76. Weckend, S.; Wade, A.; Heath, G. End of Life Management: Solar Photovoltaic Panels; National Renewable Energy Laboratory (NREL): Golden, CO, USA, 2016. [Google Scholar]
  77. IRENA. Global Energy Transformation: A Roadmap to 2050; IRENA: Abu Dhabi, United Arab Emirates, 2018; ISBN 978-92-9260-059-4. Available online: https://www.irena.org/-/media/Files/IRENA/Agency/Publication/2018/Apr/IRENA_Report_GET_2018.pdf (accessed on 14 May 2025).
  78. Tashtamirov, M. The Circular Economy and Regional Economic Development. E3S Web Conf. 2023, 431, 07003. [Google Scholar] [CrossRef]
  79. Strupeit, L.; Bocken, N.; Van Opstal, W. Towards a Circular Solar Power Sector: Experience with a Support Framework for Business Model Innovation. Circ. Econ. Sust. 2024, 4, 2093–2118. [Google Scholar] [CrossRef]
  80. Preet, S.; Smith, S.T. A Comprehensive Review on the Recycling Technology of Silicon Based Photovoltaic Solar Panels: Challenges and Future Outlook. J. Clean. Prod. 2024, 448, 141661. [Google Scholar] [CrossRef]
  81. Diez-Suarez, A.-M.; Martínez-Benavides, M.; Manteca Donado, C.; Blanes-Peiró, J.-J.; Martínez Torres, E.J. Recycling of Silicon-Based Photovoltaic Modules: Mediterranean Region Insight. Energies 2024, 17, 6015. [Google Scholar] [CrossRef]
  82. Hammoud, R.; Massoud, M.A.; Chalak, A.; Abiad, M.G. Exploring the Feasibility of Extended Producer Responsibility for Efficient Waste Management in Lebanon. Sci. Rep. 2025, 15, 15444. [Google Scholar] [CrossRef] [PubMed]
  83. Ali, A.; Islam, M.T.; Rehman, S.; Qadir, S.A.; Shahid, M.; Khan, M.W.; Zahir, M.H.; Islam, A.; Khalid, M. Solar Photovoltaic Module End-of-Life Waste Management Regulations: International Practices and Implications for the Kingdom of Saudi Arabia. Sustainability 2024, 16, 7215. [Google Scholar] [CrossRef]
  84. Iakovou, E. Next-Generation Reverse Logistics Networks of Photovoltaic Recycling: Perspectives and Challenges. Sol. Energy 2024, 271, 112329. [Google Scholar] [CrossRef]
  85. Vanegas, P.; Peeters, J.R.; Cattrysse, D.; Tecchio, P.; Ardente, F.; Mathieux, F.; Dewulf, W.; Duflou, J.R. Ease of Disassembly of Products to Support Circular Economy Strategies. Resour. Conserv. Recycl. 2018, 135, 323–334. [Google Scholar] [CrossRef] [PubMed]
  86. Akhter, M.; Al Mansur, A.; Islam, M.I.; Lipu, M.S.H.; Karim, T.F.; Abdolrasol, M.G.M.; Alghamdi, T.A.H. Sustainable Strategies for Crystalline Solar Cell Recycling: A Review on Recycling Techniques, Companies, and Environmental Impact Analysis. Sustainability 2024, 16, 5785. [Google Scholar] [CrossRef]
  87. Mallick, P.K.; Salling, K.B.; Pigosso, D.C.A.; McAloone, T.C. Designing and Operationalising Extended Producer Responsibility under the EU Green Deal. Environ. Chall. 2024, 16, 100977. [Google Scholar] [CrossRef]
  88. OECD. Extended Producer Responsibility: Basic Facts and Key Principles. OECD Environment Policy Papers; Organisation for Economic Co-Operation and Development (OECD). 2024. Available online: https://www.oecd-ilibrary.org/environment/extended-producer-responsibility_67587b0b-en (accessed on 14 May 2025).
  89. Dreger, M.; Malek, K.; Eikerling, M. Large Language Models for Knowledge Graph Extraction from Tables in Materials Science. Digit. Discov. 2025, 4, 1221–1231. [Google Scholar] [CrossRef]
  90. Pessanha Santos, N. The Expansion of Data Science: Dataset Standardization. Standards 2023, 3, 400–410. [Google Scholar] [CrossRef]
  91. Marinna, P.; Laís, V.; Fernando, O.R.P.; Ricardo, R. Circular Solar Economy: PV Modules Decision-Making Framework for Reuse. J. Clean. Prod. 2025, 493, 144941. [Google Scholar] [CrossRef]
  92. Amrollahi Biyouki, Z.; Zaman, A.; Marinova, D.; Minunno, R.; Askari Shayegan, M. Solar Photovoltaics Value Chain and End-of-Life Management Practices: A Systematic Literature Review. Sustainability 2024, 16, 7038. [Google Scholar] [CrossRef]
Figure 1. Links between CE and LCA. Explanations: The green block indicates circular economy indicators (adapted from [35]). Black texts are circularity measures being implemented among various life cycle stages.
Sustainability 17 06592 g001
Figure 2. CE and LCA integrated framework.
Sustainability 17 06592 g002
Figure 3. Trends of solar PV installation in Italy in the past, present and future.
Sustainability 17 06592 g003
Figure 4. Resource use—metals and minerals (g Sb eq per MWh) in the Italian solar PV sector, 2008–2040.
Sustainability 17 06592 g004
Figure 5. Material consumption for solar PV (by main minerals and metals) from 2010 to 2040.
Sustainability 17 06592 g005
Figure 6. Change in the share of material use by components of the Italian solar sector.
Sustainability 17 06592 g006
Figure 7. Changes in material consumption in the 3R scenario.
Sustainability 17 06592 g007
Figure 8. Changes in GWP and RU-f in the 3R scenario.
Sustainability 17 06592 g008
Figure 9. Sensitivity analysis of material demand in the Italian solar PV sector.
Sustainability 17 06592 g009
Table 1. Characterisation factors for some metals and mineral of RU-m indicator.
MaterialApplication in PVCharacterisation Factor (kg Sb eq/kg)
AluminiumFrames, mounting structures1.09 × 10−9
CopperElectrical cabling1.37 × 10−3
SilverConductive layers in cells1.18 × 100
SiliconPV cells1.40 × 10−11
NickelCoatings, contacts6.53 × 10−5
MagnesiumAlloying agent2.02 × 10−9
ManganeseAlloying agent2.54 × 10−6
LeadSolder6.34 × 10−3
Table 2. Energy and material use and recovery from recycling solar PV panels.
Input/OutputUnitAmount
ElectricitykWh1.11 × 10−1
Dieselkg6.48 × 10−2
Natural gasMJ−8.15 × 10⁻¹
Heavy fuel oilMJ−5.28 × 10⁻¹
Silica sandkg−3.44 × 10⁻¹
Soda, powerkg−1.36 × 10⁻¹
Limestonekg−2.38 × 10⁻¹
Copperkg−2.48 × 10⁻²
Aluminiumkg−5.34 × 10⁻²
Table 3. Comparison of life cycle impacts per MWh in the Italian solar PV sector in BAU and 3R scenarios by 2030 and 2040.
ImpactUnit20302040 with High Solar Penetration
BAU3RBAU3R
APmol H+ eq6.14 × 10−16.09 × 10−15.51 × 10−15.50 × 10⁻¹
GWPkg CO2 eq7.93 × 1017.89 × 1017.45 × 1017.44 × 101
ET-fwCTUe7.99 × 1027.96 × 1026.96 × 1026.96 × 102
PMFdisease inc.5.52 × 10−65.48 × 10−65.09 × 10−65.08 × 10⁻⁶
EP-mkg N eq9.85 × 10−29.82 × 10−28.51 × 10−28.50 × 10⁻²
EP-fwkg P eq5.00 × 10−24.91 × 10−24.50 × 10−24.48 × 10⁻²
EP-tmol N eq9.73 × 10−19.68 × 10−18.92 × 10−18.91 × 10⁻¹
HT-cCTUh1.03 × 10−71.02 × 10−79.04 × 10−89.02 × 10⁻⁸
HT-ncCTUh4.49 × 10−64.46 × 10−63.92 × 10−63.91 × 10⁻⁶
IRkBq U-235 eq7.15 × 1007.05 × 1006.65 × 1006.63 × 100
LUPt1.65 × 1031.65 × 1031.16 × 1031.16 × 103
ODPkg CFC11 eq5.05 × 10−65.01 × 10−64.73 × 10−64.72 × 10⁻⁶
PCOFkg NMVOC eq3.43 × 10−13.42 × 10−13.17 × 10−13.17 × 10⁻¹
RU-fMJ9.86E × 1029.81 × 1029.26 × 1029.25 × 102
RU-mkg Sb eq5.03 × 10−35.01 × 10−34.38× 10−34.38 × 10⁻³
WUm3 depriv.6.18 × 101−4.42 × 1025.48 × 101−3.65 × 101
Notes: AP: acidification potential, GWP: global warming potential, ET-fw: ecotoxicity freshwater, PMF: particulate matter formation, EP-m: eutrophication potential marine, EP-fw: eutrophication potential freshwater, EP-t: eutrophication potential terrestrial, HT-c: human toxicity cancer, HT-nc: human toxicity non-cancer, IR: ionising radiation, LU: land use, ODP: ozone depletion potential, PCOF: photochemical ozone formation, RU-f: resource use fossil, RU-m: resource use of metal and mineral, WU: water use.
Disclaimer/Publisher’s Note: The statements, opinions and data contained in all publications are solely those of the individual author(s) and contributor(s) and not of MDPI and/or the editor(s). MDPI and/or the editor(s) disclaim responsibility for any injury to people or property resulting from any ideas, methods, instructions or products referred to in the content.

