Article

A Multi-Faceted Approach to Air Quality: Visibility Prediction and Public Health Risk Assessment Using Machine Learning and Dust Monitoring Data

1
Department of Biology, Chemistry and Environmental Sciences, American University of Sharjah, Sharjah P.O. Box 26666, United Arab Emirates
2
Energy, Water and Sustainable Environments Research Center (EWSERC), American University of Sharjah, Sharjah P.O. Box 26666, United Arab Emirates
3
Department of Civil Engineering, American University of Sharjah, Sharjah P.O. Box 26666, United Arab Emirates
*
Authors to whom correspondence should be addressed.
Sustainability 2025, 17(14), 6581; https://doi.org/10.3390/su17146581
Submission received: 6 May 2025 / Revised: 13 June 2025 / Accepted: 25 June 2025 / Published: 18 July 2025
(This article belongs to the Special Issue Impact of AI on Business Sustainability and Efficiency)

Abstract

Clean and safe air quality is essential for public health, yet particulate matter (PM) significantly degrades air quality and poses serious health risks. The Gulf Cooperation Council (GCC) countries are particularly vulnerable to frequent and intense dust storms due to their vast desert landscapes. This study presents the first health risk assessment of carcinogenic and non-carcinogenic risks associated with exposure to PM2.5 and PM10 bound heavy metals and polycyclic aromatic hydrocarbons (PAHs) based on air quality data collected during the years of 2016–2018 near Dubai International Airport and Abu Dhabi International Airport. The results reveal no significant carcinogenic risks for lead (Pb), cobalt (Co), nickel (Ni), and chromium (Cr). Additionally, AI-based regression analysis was applied to time-series dust monitoring data to enhance predictive capabilities in environmental monitoring systems. The estimated incremental lifetime cancer risk (ILCR) from PAH exposure exceeded the acceptable threshold (10−6) in several samples at both locations. The relationship between visibility and key environmental variables—PM1, PM2.5, PM10, total suspended particles (TSPs), wind speed, air pressure, and air temperature—was modeled using three machine learning algorithms: linear regression, support vector machine (SVM) with a radial basis function (RBF) kernel, and artificial neural networks (ANNs). Among these, SVM with an RBF kernel showed the highest accuracy in predicting visibility, effectively integrating meteorological data and particulate matter variables. These findings highlight the potential of machine learning models for environmental monitoring and the need for continued assessments of air quality and its health implications in the region.

1. Introduction

Clean and safe air quality is crucial for public health. Particulate matter (PM) is a major factor that reduces air quality and poses significant health risks to the population. PM is defined as microscopic particles of solid and/or liquid matter suspended in air. PMs are classified by their aerodynamic diameters: PM2.5 includes particles with diameters less than 2.5 µm and PM10 includes particles with diameters between 2.5 and 10 µm [1] whereas, total suspended particulate matter (TSP) includes particles with diameters greater than 10 µm [2]. Extensive research has demonstrated a correlation between exposure to PM2.5 and PM10 and increased morbidity and mortality from cardiovascular and respiratory diseases [3]. PM10 exposure has also been linked to adverse outcomes such as preterm birth, low birth weight, and DNA damage [4]. The smaller size of PM2.5 allows it to penetrate deeper into tissues, causing severe damage especially when they have tendency to effectively bind to toxic heavy metals, organic pollutants, and pathogens [5]. In addition to adverse health impacts, air pollution also negatively affects the environment by contributing to acid rain, reducing visibility, damaging crops, and accelerating climate change [6].
The Gulf Cooperation Council (GCC) countries, located in Southwest Asia, are predominantly covered by vast desert landscapes, making them highly susceptible to frequent and intense dust storms. These dust storms, driven by aeolian processes, play a significant role in shaping the air quality across the region [7]. Dust storms introduce large amounts of particulate matter into the atmosphere, posing substantial risks to public health, safety, and economic activities. Research by Al-Dousari et al. [8] has shown that these airborne dust particles exacerbate respiratory issues, contribute to cardiovascular problems, and increase hospital admissions, particularly among vulnerable populations.
In regions like the Middle East, dust storms carry high concentrations of both PM2.5 and PM10, exacerbating these health risks [9]. Certain populations are more vulnerable to the effects of PM exposure, including the elderly, young children, and individuals with chronic cardiac conditions [10]. In the UAE, the primary sources of PM10 are natural events such as dust storms, while PM2.5 is primarily associated with anthropogenic emissions and natural sources [11]. The occurrence of dust storms and the resulting air pollution appear to be increasing [12,13], with PM2.5 concentrations peaking during the summer months due to higher electricity usage and increased dust activity [14,15]. Al-taani et al. [14] have reported that the annual average PM2.5 levels in the UAE from 1980 to 2016 exceeded both EPA and WHO guidelines, with a rising trend in concentration. The toxic nature of PM is heightened when it contains heavy metals, which can pose carcinogenic risks. According to the International Agency for Research on Cancer (IARC), heavy metals such as arsenic, nickel, and cadmium are classified as Group 1 carcinogens [16]. Essential metals like iron, copper, and zinc, though necessary in small amounts, can lead to health issues if present in excess, including neuropathies, kidney and liver disorders, and anemia [17]. Furthermore, polycyclic aromatic hydrocarbons (PAHs) are stable, multi-ring compounds commonly found in the environment. Prolonged exposure to high atmospheric levels of PAHs can cause various health issues, including respiratory and cardiovascular problems, and they are known for their carcinogenic, teratogenic, and mutagenic properties. The U.S. EPA has identified 16 priority PAHs, with 7 classified as potentially carcinogenic [18].
Given that PM not only serves as a carrier for toxic substances such as heavy metals and PAHs, contributing to adverse human health effects, but also plays a key role in atmospheric light scattering and absorption, it represents a critical factor in both health risk assessments and visibility degradation studies. Machine learning techniques have become crucial for predicting visibility, as they can effectively model the intricate relationships between environmental factors and visibility levels. Various regression methods, including linear regression [19], regression trees [20], random forests [21], extreme learning machines [22], and deep neural networks [23], have been employed in visibility forecasting. Notably, neural networks, such as multilayer perceptron (MLP), have consistently outperformed other machine learning techniques [22,24,25]. Additionally, the integration of preprocessing algorithms into visibility forecasting models has been recognized as vital for enhancing the efficiency of machine learning-based predictions. These findings highlight the effectiveness of machine learning methods, especially neural networks, in improving the accuracy of visibility forecasts, with gradient boosting algorithms and MLP neural networks emerging as particularly effective approaches [22,24,25]. In the present study, an AI-based regression analysis on time-series dust monitoring data was applied to enhance the predictive capabilities of our environmental monitoring system. This analysis modeled the relationship between visibility and six key independent variables: PM1, PM2.5, PM10, total suspended particles (TSPs), wind speed (WS), air pressure, and air temperature, selected for their significant influence on visibility. To achieve this, three supervised machine learning algorithms were utilized: linear regression, non-linear regression with a radial basis function (RBF) kernel, and an artificial neural network (ANN), which is a deep learning method. This study builds on the existing literature, advancing the application of machine learning techniques for accurate visibility prediction.
While the health risk assessment and visibility modeling are distinct analyses, both are derived from the same PM and meteorological dataset, providing a holistic picture of air quality impacts. Integration of a health risk assessment with a visibility simulation supports a dual-purpose air monitoring framework: (a) assessing public health risk due to metal-laden PM and PAHs and (b) predicting visibility degradation to aid in operational and safety planning.
Given the health risks associated with PM exposure, particularly from heavy metals and PAHs, it is critical to conduct comprehensive human health risk assessments in the UAE. This study aims to (1) evaluate the health risks posed by heavy metal concentrations in PM2.5 and PM10 during 2016–2017 and PAHs in TSP during 2017, (2) explore correlations between heavy metal concentrations and various environmental parameters, and (3) develop machine learning models to predict visibility.

2. Materials and Methods

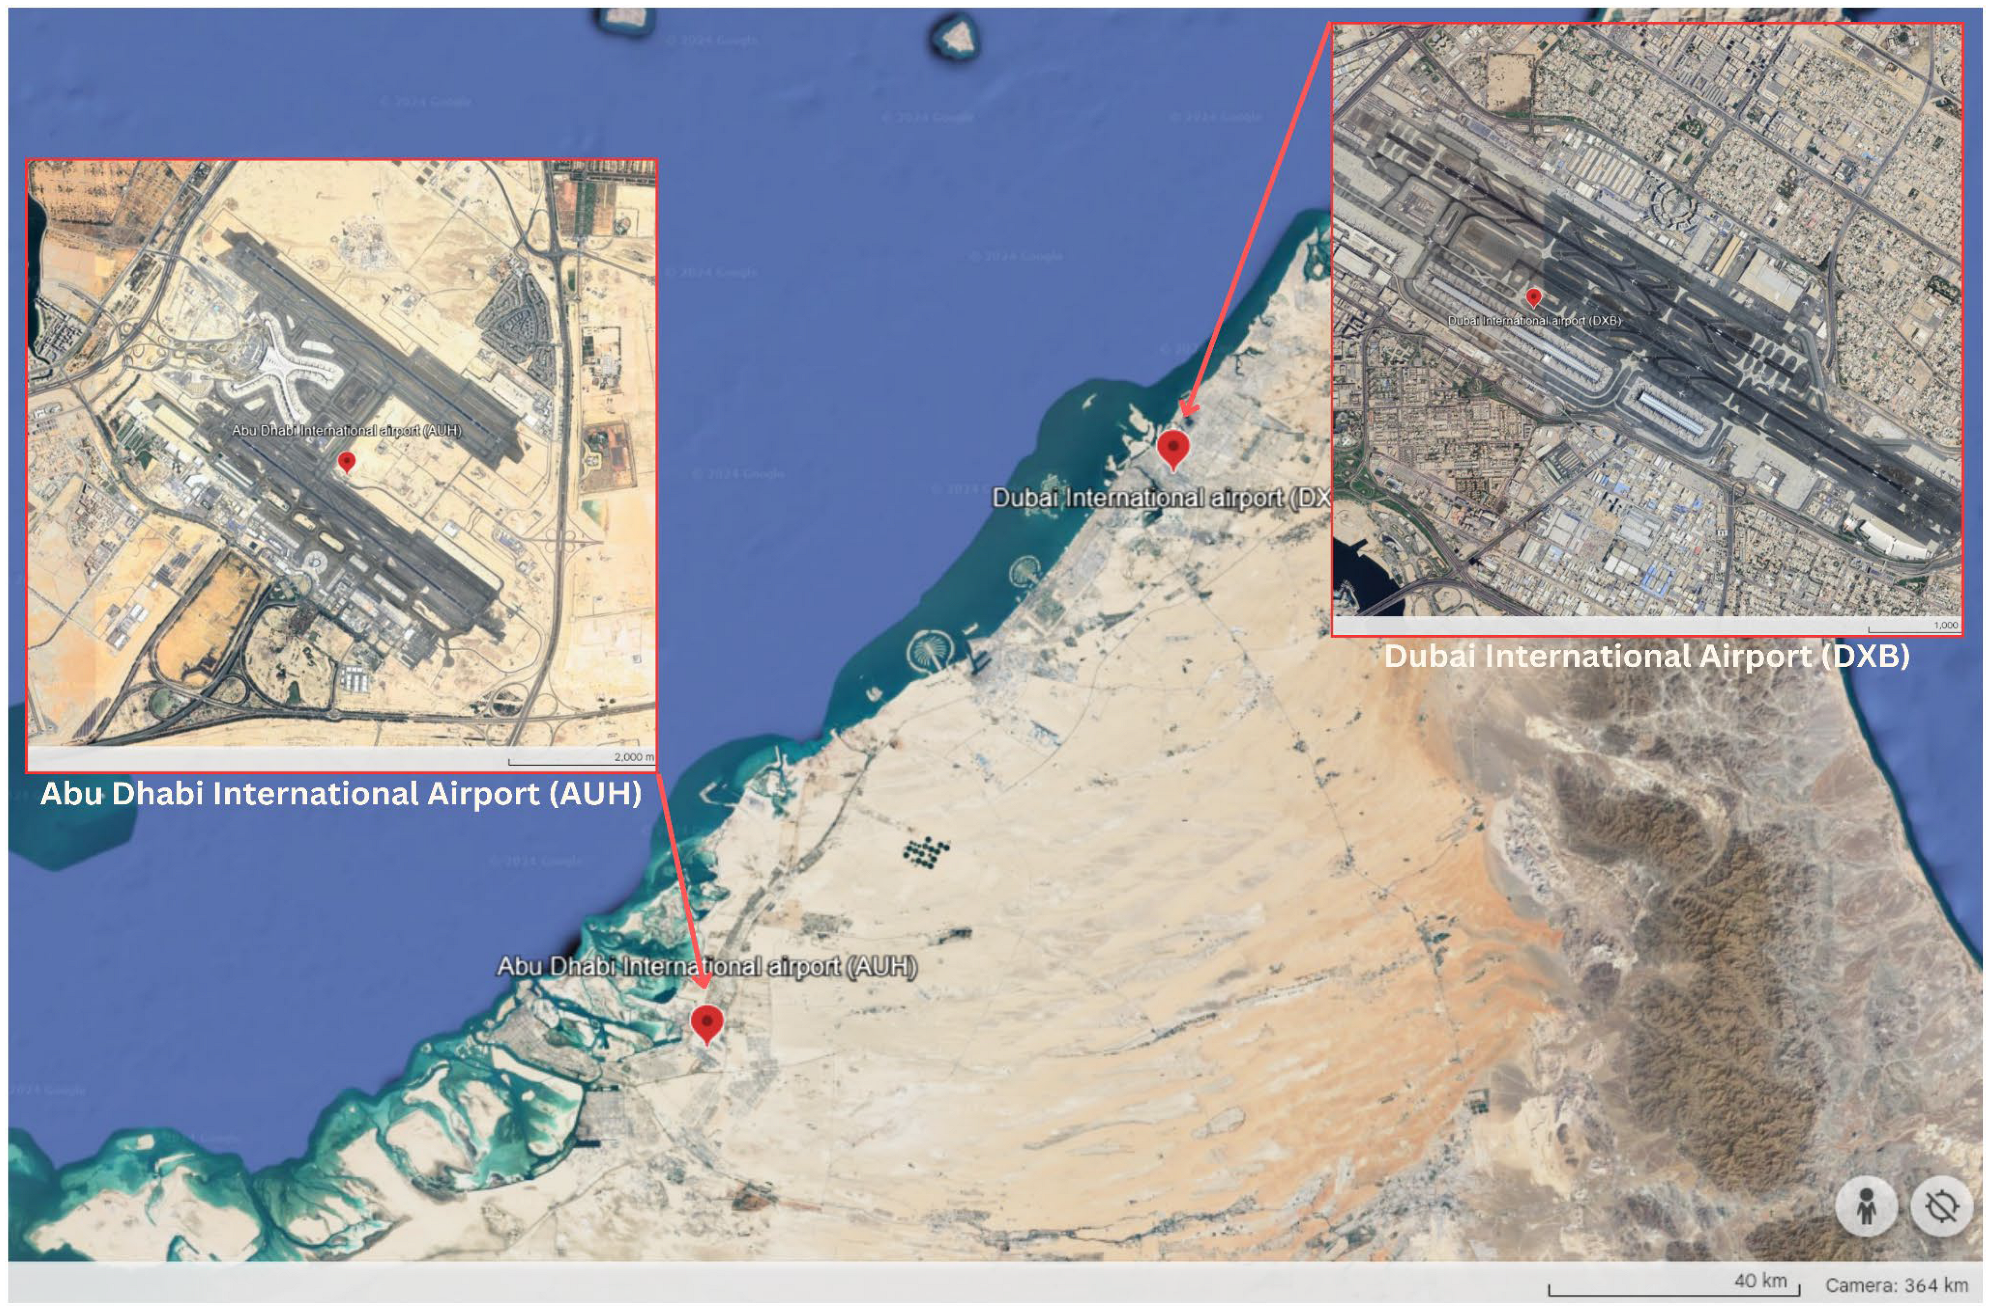
2.1. Sampling Collection

Dubai International Airport (DXB) and Abu Dhabi International Airport (AUH) were selected as the study sites due to their strategic importance and high air traffic volumes. DXB has consistently ranked as one of the world’s busiest airports for international passenger traffic, handling over 80 million passengers annually prior to the COVID-19 pandemic [26]. The monitoring station was placed in the DAFZA free-zone area which is within 300 m from the major take off/landing runway. The building site is surrounded by industrial offices and warehouses of various industrial sectors. AUH is also a key aviation hub in the Middle East, managing a mix of commercial and cargo flights. The monitoring and sample collection site was allocated within Masdar City which is within 500–1000 m from the runway of AUH airport. Major construction activities took place during the studied period including adding a new runway and building a completely new major terminal. The intense operational activity at both airports contributes significantly to local air pollution levels, particularly in terms of PM emissions from aircraft operations, vehicular traffic, and ground service equipment. Additionally, their geographic location within arid regions makes them highly susceptible to dust storms, providing a unique context for evaluating both anthropogenic and natural influences on particulate pollution and associated health risks [27].
Aeroqual AQM 65 stations (Auckland, New Zealand) were strategically positioned near AUH in Masdar City and DXB in Dafza (Figure 1) to monitor concentrations of TSP, PM10, PM2.5, and PM1, as well as noise levels, rainfall, air temperature, relative humidity, atmospheric pressure, wind speed, and visibility. Data were collected at 1 min intervals in accordance with USEPA (40 CFR Part 53) guidelines. Both monitoring sites were located within residential areas.
Two Tecora stations (PM2.5 and PM10) were placed adjacent to the Aeroqual stations at each site. Air was drawn at a flow rate of 16.7 L/min for 24 h through a size-selective inlet and onto PM2.5 or PM10 filters. Sampling occurred from 15 January 2016 to 31 December 2017. Initially, Teflon and quartz filters were used; subsequently, only Teflon filters were employed. PM2.5 and PM10 filters (quartz and Teflon) were pre-conditioned by drying in a Memmert UM400 oven at 80°C for 2 h. Filter weights were recorded using a Kern ABT 100-5M analytical balance. Every two weeks, two sets of fourteen filters were prepared and installed in the PM Skypost Tecora stations at Dafza (DXB) and Masdar City (AUH). For both PM2.5 and PM10, the sample duration was set to 24 h. Upon completion of each two-week sampling period, filters were removed, re-dried at 80°C for 2 h, and reweighed [15].

2.2. Heavy Metal Analysis

To ensure homogeneity and maximize the volume of dust available for analysis, fourteen Teflon filters for each particle size (PM2.5 and PM10) collected from the sampling stations during a two-week interval were pooled as a single sample. The filters were weighed and placed in the Microwave Digestion System Anton Paar Multiwave 3000 SOLV (Anton Paar GmbH, Dubai, United Arab Emirates). The digestion was carried out using 8 mL of concentrated nitric acid (HNO3, 69% vol, VWR chemicals, Dubai, United Arab Emirates) at 800 Watts for 20 min, followed by a 10 min cooling period. After cooling, 4 mL of concentrated hydrofluoric acid (HF, 40%, Sigma-Aldrich, Dubai, United Arab Emirates) and 4 mL of concentrated hydrochloric acid (HCl, 37%, ApplChem Panreac, Dubai, United Arab Emirates) were added to each tube, and the digestion process was continued. All chemicals were of analytical grade and purchased from Sigma-Aldrich. The samples were then cooled, and 35.5 mL of a 4% boric acid solution was added, followed by further microwave digestion. The resulting solutions were cooled and diluted to 50 mL using deionized water. The solutions were then prepared for analysis using inductively coupled plasma optical emission spectrometry (ICP-OES) VARIAN AX sequential ICP-OES (Shimadzu, UAE supplier from Kyoto, Japan), supported by the VARIAN Sample Preparation System (SPS) 3 and LYTRON cooling system. Calibration curves from external standard solutions were employed to quantify the metal concentrations [15]. The metals tested in this study included the following: aluminum, barium, cadmium, cobalt, copper, iron, manganese, nickel, lead, and zinc. The concentrations of heavy metals were determined using calibration curves of external standard solutions.

2.3. PAH Analysis

PAHs were extracted from filters via solvent extraction. Each filter was placed in a clean 40 mL vial, spiked with 100 µL of a 10 µg/mL PAH surrogate standard (PAH-SR-WS-06-A), and mixed with 20 mL of 3:1 hexane: acetone. Samples were vortexed, sonicated for 30 min, and filtered through anhydrous sodium sulfate into Turbovap tubes. Extracts were concentrated to 1.0 mL and transferred to 2.0 mL GC autosampler vials. A 25 µL internal standard mix (PAH-IS-WS-07) was added to each vial. Target PAHs included the following: Naphthalene, Acenaphthylene, Acenaphthene, Fluorene, Phenanthrene, Anthracene, Fluoranthene, Pyrene, Benzo[a]anthracene, Chrysene, Benzo[b]fluoranthene, Benzo[k]fluoranthene, Benzo[a]pyrene, Indeno[1,2,3-cd]pyrene, Dibenzo[a,h]anthracene, and Benzo[g,h,i]perylene. Quantification was conducted using an Agilent 8890B GC system coupled with a 5977B GC/MSD and an HP-5MS UI column (30 m × 0.250 mm × 0.25 µm). GC conditions were as follows: an initial temperature of 50 °C (1 min hold), ramped at 40 °C/min to 320 °C (held for 4.25 min). The MS ion source was set to 230 °C. Blank filters were processed in parallel, and PAH concentrations detected in blanks were subtracted from sample values. Method accuracy was validated through recovery experiments at 10 ppb and 1000 ppb using a mixed PAH standard. Recoveries ranged from 60% to 122% at 10 ppb and from 99% to 106% at 1000 ppb. Internal standards and their respective recoveries were as follows: Naphthalene-D8 (103% and 101%), Acenaphthene-D10 (103% and 102%), Phenanthrene-D10 (100% and 101%), Chrysene-D12 (96% and 104%), and Perylene-D12 (96% and 101%).

2.4. Health Risk Assessment for Heavy Metals

According to the EPA, a human health risk assessment involves estimating the likelihood of adverse health effects due to chemical exposure, comprising four stages: (1) hazard identification, (2) toxicity (dose-response) assessment, (3) exposure assessment, and (4) risk characterization.
The primary exposure pathways for PM-bound heavy metals include direct inhalation; dermal absorption from particulate matter deposition on exposed skin; and ingestion from PM deposition on surfaces, food, or drinks. Formulas for assessing dermal and ingestion health risks were adapted from Jiang et al.’s [28] study following US EPA 2011 guidelines. The inhalation exposure risk assessment formula was derived from Du et al.’s [29] study in line with US EPA and environmental site assessment guidelines (2009). Table 1 lists the parameters and their values. The Reference Dose (RfDo), Reference Concentration (RfCi), Gastrointestinal Absorption (GIABS), and slope factor (SFo) values were obtained from the US EPA’s regional screening level tables (2020). All values were in accordance with EPA guidelines, except for lifetime year and body weight values (BW), which were specific to UAE adult residents [30]. The exposure assessment equations for the inhaled average daily dose (ADDinh, mg/kg/day), dermal absorbed dose (DADdermal, mg/kg day), and chronic daily intake (CDIingest, mg/kg/day) are as follows:
D A D d e r m a l =   C   ×   S A   ×   A F   ×   A B C B W × E F × E D A T 2 × C F
C D I i n g e s t = C × I n g R B W × E F × E D A T 2 × C F
A D D i n h a l e = C × R i n h × E F × E D P E F × B W × A T
The parameters used in the exposure assessment formulas are as follows: Concentration of contaminant (C) expressed in mg/kg, Surface Area of Skin Contacting PM (SA) in cm2, adherence factor (AF) in mg/cm2/day, Absorption Factor (ABC) as a unitless fraction, exposure frequency (EF) in days/year, exposure duration (ED) in years, Average Time for Carcinogens (AT2) in days, conversion factor (CF) in kg/mg, body weight (BW) in kg, ingestion rate (IngR) in mg/day, inhalation rate (Rinh) in m3/day, and particle emission factor (PEF) in m3/kg.
Carcinogenic and non-carcinogenic effects were evaluated by estimating carcinogenic risks (CRs) and hazard quotients (HQs) for hazardous components in PM2.5 and PM10. The calculations were based on DAD, CDI, and ADD values from the exposure assessment for dermal, ingestion, and inhalation pathways, respectively. The equations for carcinogenic risk (CRs) and non-carcinogenic risks (HQs) for each exposure pathway are as follows:
C R i n h a l e = A D D × S F
C R d e r m a l = D A D × S F o G I A B S
C R i n g e s t = C D I × S F o
H Q i n h a l e = A D D R f D o
H Q d e r m a l = D A D × R f D o G I A B S
H Q i n g e s t = C D I R f D o
H I = Σ H Q
The parameters used in the exposure assessment formulas are as follows: average daily dose (ADD) expressed in mg/kg/day, slope factor (SF) in (mg/kg/day)−1, dermal absorbed dose (DAD) in mg/kg/day, Oral slope factor (SFo) in (mg/kg/day)−1, Gastrointestinal Absorption (GIABS) as a unitless fraction, chronic daily intake (CDI) in mg/kg/day, and reference dose (RfDo) in mg/kg/day. All parameter values, units, and detailed descriptions used in the exposure assessment formulas can be found in the Supplementary Materials.

2.5. PAH Health Risk Assessment

To evaluate the carcinogenic risks from airborne PAHs, Benzo(a)pyrene equivalents (BaP_eq) were calculated using potency equivalency factors (PEFs) based on ATSDR guidelines [31]. The toxic equivalent concentration (TEQ) for each PAH congener was calculated as follows:
TEQ = i n × ( C i × P E F i )
where Ci is the concentration of each PAH congener (ng/m3) and PEF values are provided in Supplementary Table S4. The incremental lifetime cancer risk (ILCR) via inhalation was then estimated as follows:
I L C R = C S F × A D D  
with a cancer slope factor (CSF) of 26.6 [32]. The average daily dose (ADD) was determined using the following:
A D D = C A × I R × E T × E F × E D B W × A T
where the parameters (e.g., inhalation rate, exposure duration, and body weight) for both adults and children are detailed inSupplementary Table S5 [18]. The US EPA classifies cancer risks as acceptable risks (ILCR < 10−6), potential cancer risks (10−6 < ILCR < 10−4), and higher cancer risks (10−4 < ILCR), where an increased ILCR value indicates a greater cancer risk [33].

2.6. AI-Based Models for Visibility Prediction

An AI-based regression analysis was conducted on the time-series dust monitoring data to enhance the predictive capabilities of the environmental monitoring system. This analysis focused on modeling the relationship between visibility, the dependent variable, and six independent variables: PM1, PM2.5, PM10, total suspended particles (TSPs), wind speed (WS), air pressure, and air temperature. The selected variables were chosen due to their significant impact on visibility. Three supervised machine learning algorithms were utilized: linear regression, non-linear regression with a radial basis function (RBF) kernel, and an artificial neural network (ANN), which is a deep learning method. Linear regression was employed as a baseline model to assess the linear relationships between variables, while the RBF kernel and ANN methods were applied to capture non-linear interactions and complex patterns in the data. The models were trained using the collected time-series data, and their performance as evaluated based on standard metrics, including the mean squared error (MSE) and R-squared (R2) values. This approach provides a comprehensive framework for understanding the collective influence of various environmental factors on visibility, facilitating the identification of the most effective model for predictive purposes.
For this study, visibility predictions using PM2.5, PM10, and other meteorological factors were conducted using both ANN and SVM. One layer of input, two layers of hidden nodes, and one output layer made up the feedforward backpropagation architecture. The design consists of 12 neurons in the input layer for 12 input features, and there are 10 neurons in the first hidden layer and 8 in the second layer activated by the ReLU function. The last layer had just one neuron and a linear activation function to create continuous results. The network was optimized using the Adam method, setting its learning rate to 0.001, and the MSE was set in a way to calculate the loss. Using an RBF kernel with the SVM method was useful in the current study. The hyperparameters were tuned using the grid search method. The value of C was chosen as 100, and the gamma coefficient was chosen as 0.01 to give the best result in cross-validation. The models were validated by using 10-fold cross-validation. The provided dataset was sectioned into 10 parts of equal size, and each time, a different fold was put into the test set as the model trained using all the other folds. This process was performed ten times, and the average values of R2, RMSE, and MAE were then gathered. This approach was applied to confirm the study’s results and make them easier to repeat.

2.7. Statistical Analysis

A nonparametric Spearman correlation test was employed to assess the relationships between bacterial concentrations and meteorological parameters, as well as between heavy metal concentrations and PM10 and PM2.5 levels. The p-value was determined using a two-tailed t-test, with statistical significance defined as p < 0.05.

3. Results and Discussion

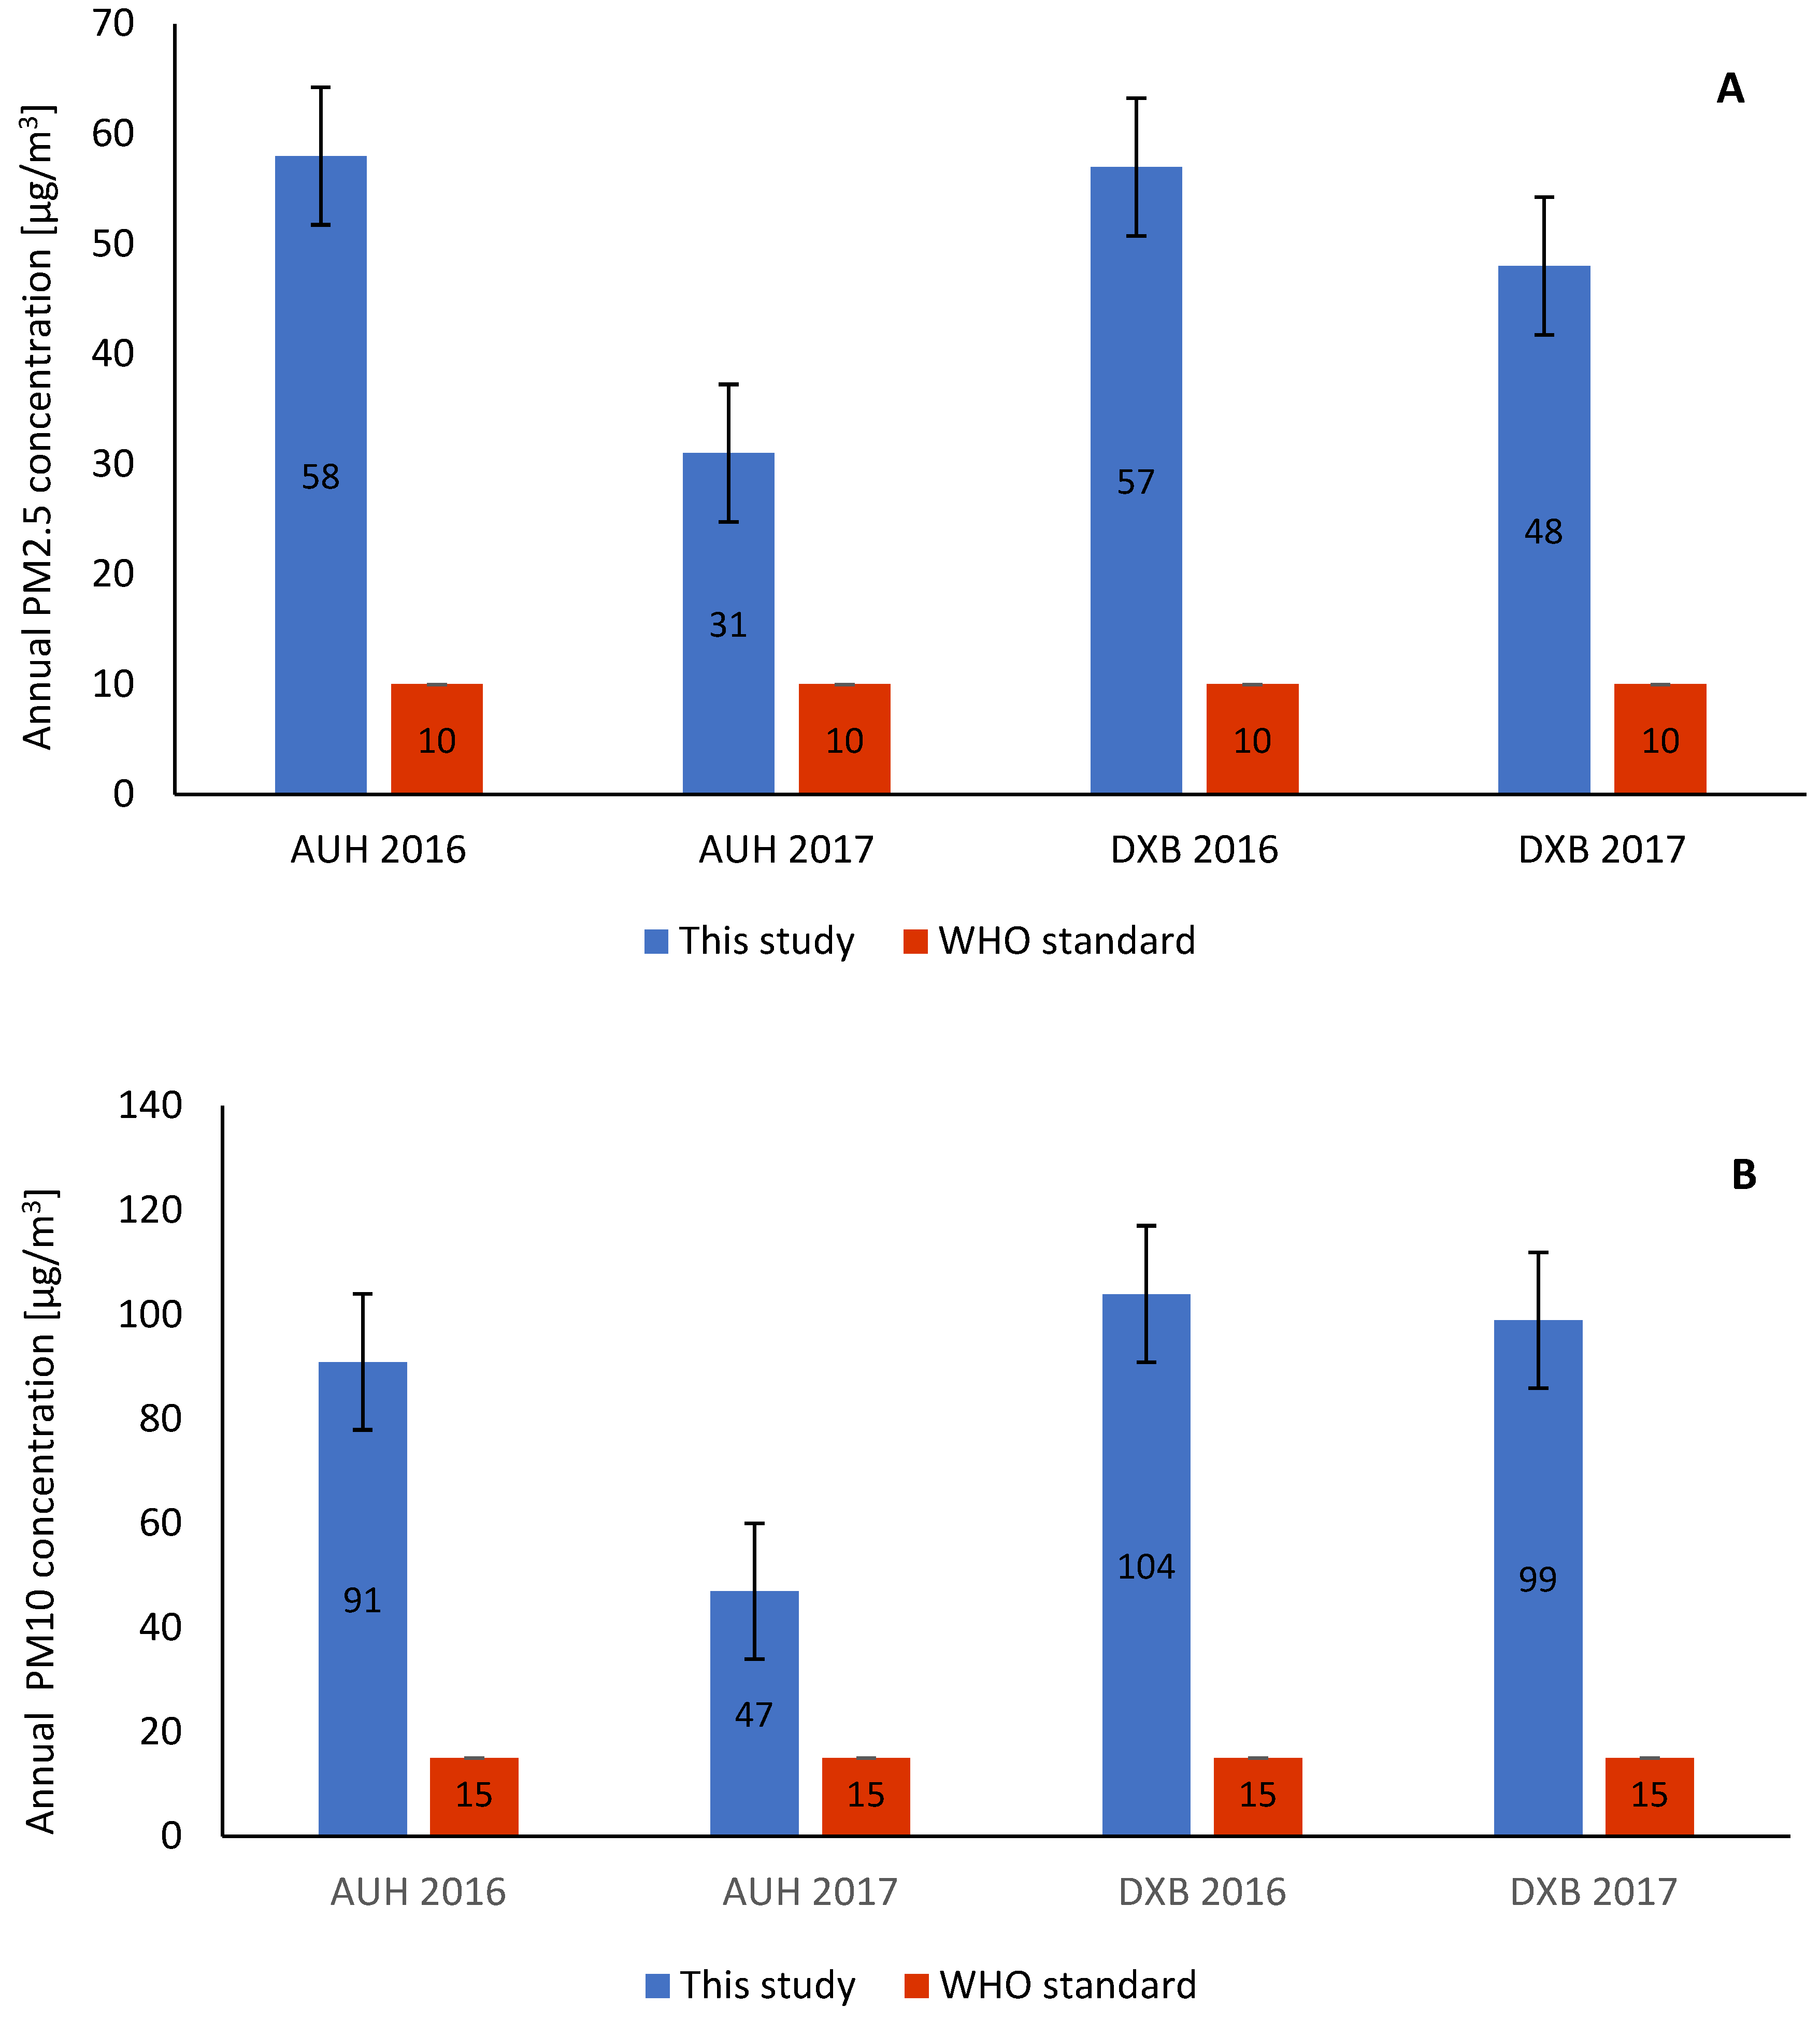
3.1. Particulate Matter (PM) and Heavy Metal Concentrations

Particulate matter (PM2.5 and PM10) was monitored over a two-year period using Tecora stations situated at the Abu Dhabi (AUH) and Dubai (DXB) airport sites. The levels of particulate matter (PM2.5 and PM10) in urban environments are influenced by numerous factors and have critical implications for air quality and public health. PM2.5 and PM10 are considered reliable indicators of air pollution in cities, with their concentrations often exceeding the World Health Organization’s recommended exposure limits [34]. Figure 2. presents the average annual concentrations of PM2.5 and PM10 for 2016 and 2017 at the AUH and DXB sites, compared with the World Health Organization [35] standards. During the two consecutive years of monitoring, both locations consistently exceeded the WHO standards for PM2.5 and PM10. In 2016, the annual mean concentrations of PM2.5 were 5.8 times higher in AUH and 5.7 times higher in DXB than the WHO air quality standards. Similarly, PM10 levels were 6.1 times higher in AUH and 6.9 times higher in DXB. Although the 2017 averages were lower than those of 2016, they still surpassed WHO standards. The annual mean concentrations of PM2.5 were 3.1 times higher in AUH and 4.8 times higher in DXB, while PM10 levels were 3.1 times higher in AUH and 6.6 times higher in DXB. Notably, in 2016, higher PM10 and PM2.5 values were observed during the summer months compared to the winter months, while the opposite trend was observed in 2017. The observed high PM10 and PM2.5 concentrations during the sampling period indicates that UAE is known to be highly industrialized, and the main anthropogenic sources are the metal and mining industries as well as fuel combustion processes in the energy and transport sector [36]. Therefore, although natural sources contribute to PM pollution, it is necessary to control the anthropogenic aspect that contributes to these significantly high PM2.5 and PM10 concentrations.
On the other hand, the European Union has established different PM concentration limits to safeguard human health. For PM2.5, the EU’s annual mean limit is 25 μg/m3 [37]. For PM10, the annual mean limit is 40 μg/m3 [37]. Although the EU limits are less stringent than those set by the WHO, our results exceed even the EU thresholds.
Exposure to PM has been associated with a range of health issues, including damage to tracheal cells, inflammation, impaired lung function, and increased vulnerability to infections [34]. The distribution of PM2.5 is shaped by variables such as traffic density, weather patterns, and land use, and its sources and dispersion vary based on the geographical and spatial characteristics of urban areas [38]. Research on the spatial distribution of PM2.5–10 has identified key sources like residential burning, industrial activities, road dust, and meteorological conditions, all contributing to spatial variability [39]. Additionally, PM10 concentrations typically follow a seasonal trend, with higher levels observed during the winter months, while PM2.5 shows a more pronounced seasonal cycle dominated by fine particulate matter in colder seasons [40]. These findings highlight the complex nature of particulate pollution and its varied impacts across different urban settings.
The analysis of PM2.5 heavy metals (Cd, Cr, Cu, Ni, Pb, and Zn) revealed notable temporal and spatial variations between Dubai and Abu Dhabi in 2016 and 2017. Cd concentrations were highest in AUH 2016 (0.645 mg/kg), while the lowest levels were recorded in DXB 2017 (0.190 mg/kg). Cr showed a decreasing trend over time, with the highest concentration in DXB 2016 (1.898 mg/kg) and the lowest in AUH 2017 (1.530 mg/kg). Cu remained relatively consistent, with a peak in AUH 2017 (3.491 mg/kg) and the lowest level in AUH 2016 (2.987 mg/kg). Ni concentrations were highest in DXB 2016 (8.439 mg/kg) and showed a significant decline in both cities in 2017, with DXB recording the lowest level (4.026 mg/kg). Pb concentrations increased in 2017 for both locations, reaching a maximum in DXB 2017 (22.345 mg/kg), while DXB 2016 had the lowest level (18.312 mg/kg). Zn was most abundant in AUH 2016 (44.259 mg/kg) and experienced a marked decline in 2017, with DXB 2017 showing the lowest concentration (8.095 mg/kg).
The analysis of PM10 heavy metal concentrations in DXB and AUH for 2016 and 2017 demonstrated significant spatial and temporal variations. Cd levels peaked in DXB 2017 (0.756 mg/kg), while the lowest levels were observed in AUH 2017 (0.108 mg/kg). Cr concentrations remained relatively stable, with the highest level in DXB 2017 (2.760 mg/kg) and the lowest in AUH 2017 (2.480 mg/kg). Cu exhibited an increasing trend, reaching its maximum in AUH 2017 (8.410 mg/kg) and its minimum in AUH 2016 (4.583 mg/kg). Ni showed the highest concentration in DXB 2016 (9.532 mg/kg) and declined significantly by 2017, with AUH recording the lowest level (5.049 mg/kg). Pb concentrations were highest in DXB 2017 (30.017 mg/kg) and lowest in DXB 2016 (18.062 mg/kg). Zn showed a notable decline over time, with the highest concentration in DXB 2016 (55.433 mg/kg) and the lowest in AUH 2017 (11.477 mg/kg).
Table 2 presents the correlations between heavy metal concentrations and PM10, PM2.5 levels, as well as temperature and wind speed. The analysis revealed a weak negative correlation between heavy metal concentrations and both PM10 (r = −0.3) and wind speed (r = −0.2), neither of which was statistically significant. Similarly, a weak positive but insignificant correlation was observed with PM2.5 (r = 0.14). In contrast, a significant negative correlation (p < 0.05) was identified between heavy metal concentrations and temperature (r = −0.57).
Another study in the region investigated the concentrations of heavy metals (HMs) in roadside dust samples collected from different area types (residential, commercial, and industrial). The findings highlight substantial variation in metal levels across these environments. The reported concentrations in roadside dust (in mg/kg) for residential areas were Cd: 2.2; Cr: 49.5; Cu: 43.1; Ni: 111.1; Pb: 33.4; and Zn: 72.8, while commercial areas showed slightly lower values for most metals, except Cu (44.9). In contrast, industrial areas exhibited significantly elevated levels of heavy metals, with Cd: 2.9, Cr: 57.2; Cu: 166.9; Ni: 132.6; Pb: 143.2; and Zn: 183.1 [41]. Heavy metal concentrations in PM2.5 and PM10 samples from Dubai and Abu Dhabi (2016–2017) were significantly lower than those in industrial roadside dust; however, a similar profile of metals was observed in both studies. For example, DXB 2016 PM10 levels of Cd, Cr, and Cu were only a fraction of the concentrations found in industrial dust, while PM2.5 samples also showed much lower levels of Cd and Zn, particularly in 2017 DXB. These findings highlight that while the sampling environment and particle size influence concentrations, the types of metals present are consistent, with urban roadside dust, especially in industrial areas, showing stronger accumulation.
Zinc concentrations might likely originate from tire wear caused by heavy traffic [42] and could also be influenced by tire abrasions due to eroded road pavements [43]. Similarly, the presence of lead, and zinc is likely linked to industrial activities and emissions, such as the use of fuels, lubricants, paints, and motor oils. These metals may also be associated with road pavement degradation and the wear of tires and brakes [44,45]. Cr and Ni are likely associated with both traffic and industrial activities, aligning with findings from prior research in Sharjah [46,47,48]. Cr and Ni are particularly linked to traffic sources such as engine wear, brake pads, and tire abrasion, which contribute to their elevated concentrations in urban environments. A limitation of this study is the absence of confidence intervals for the estimated health risks, which could provide a more comprehensive understanding of uncertainty, however, this was not feasible due to the limited sample size and scope of the preliminary assessment.

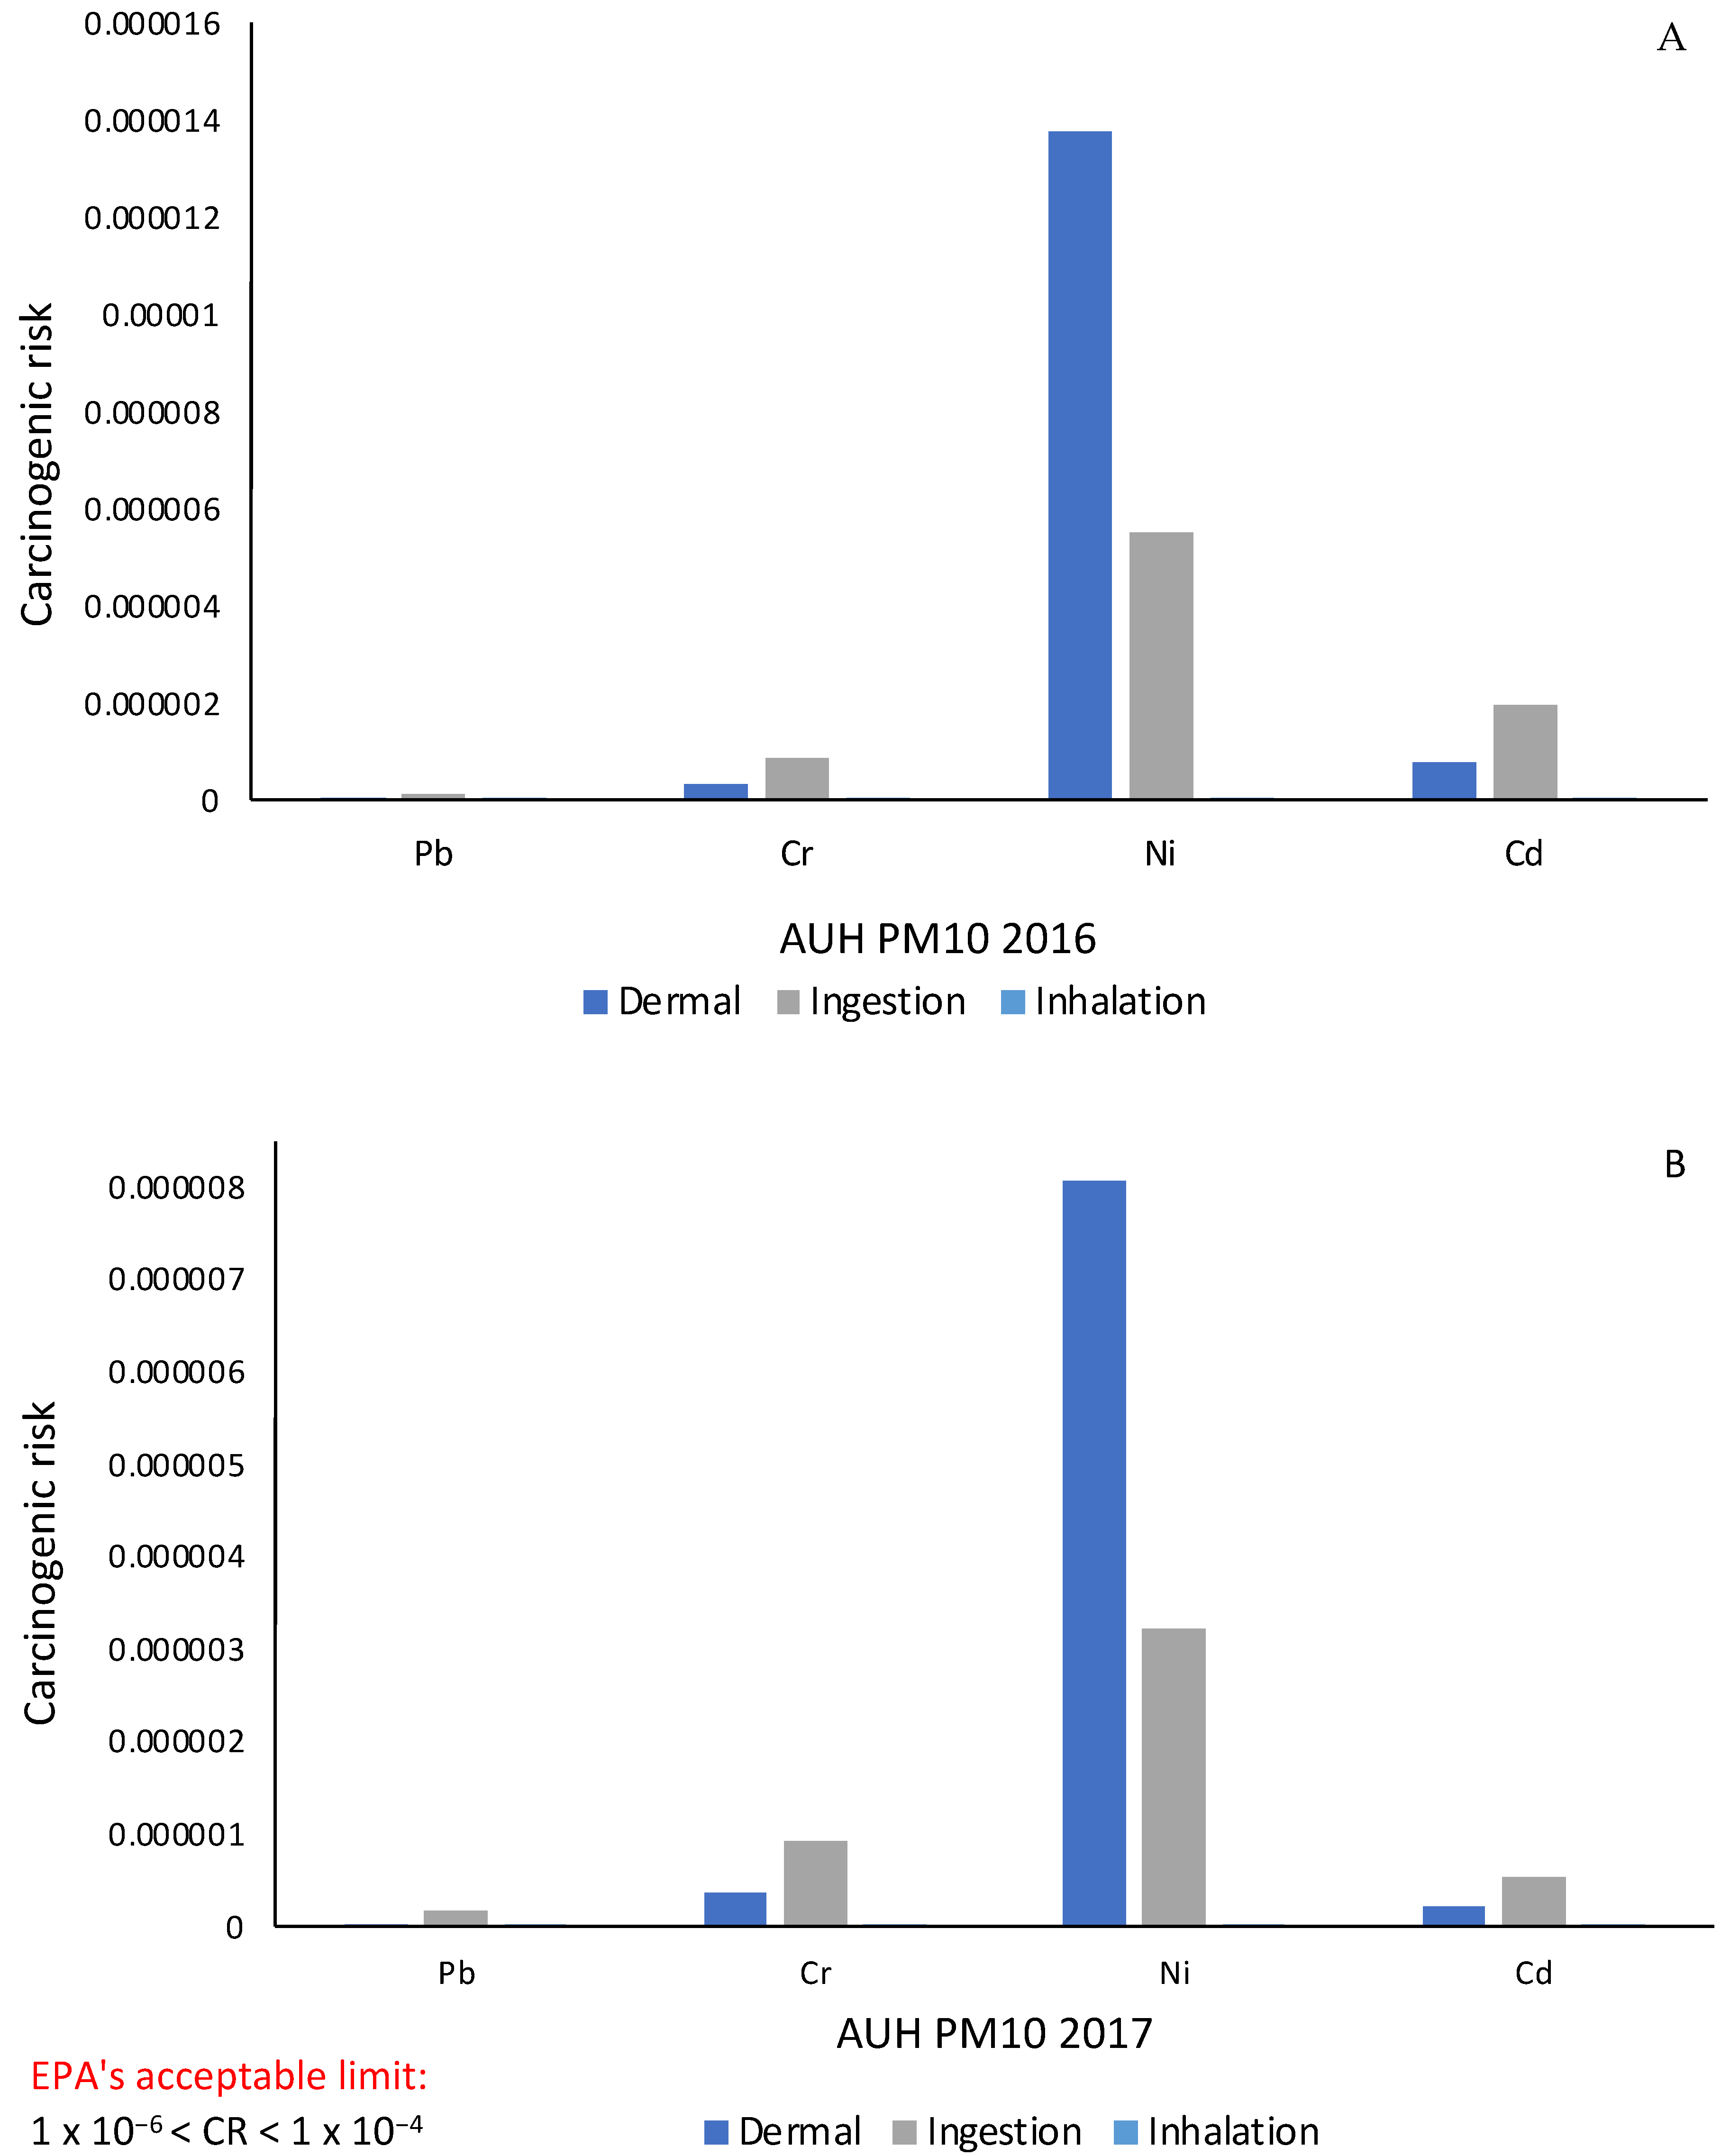
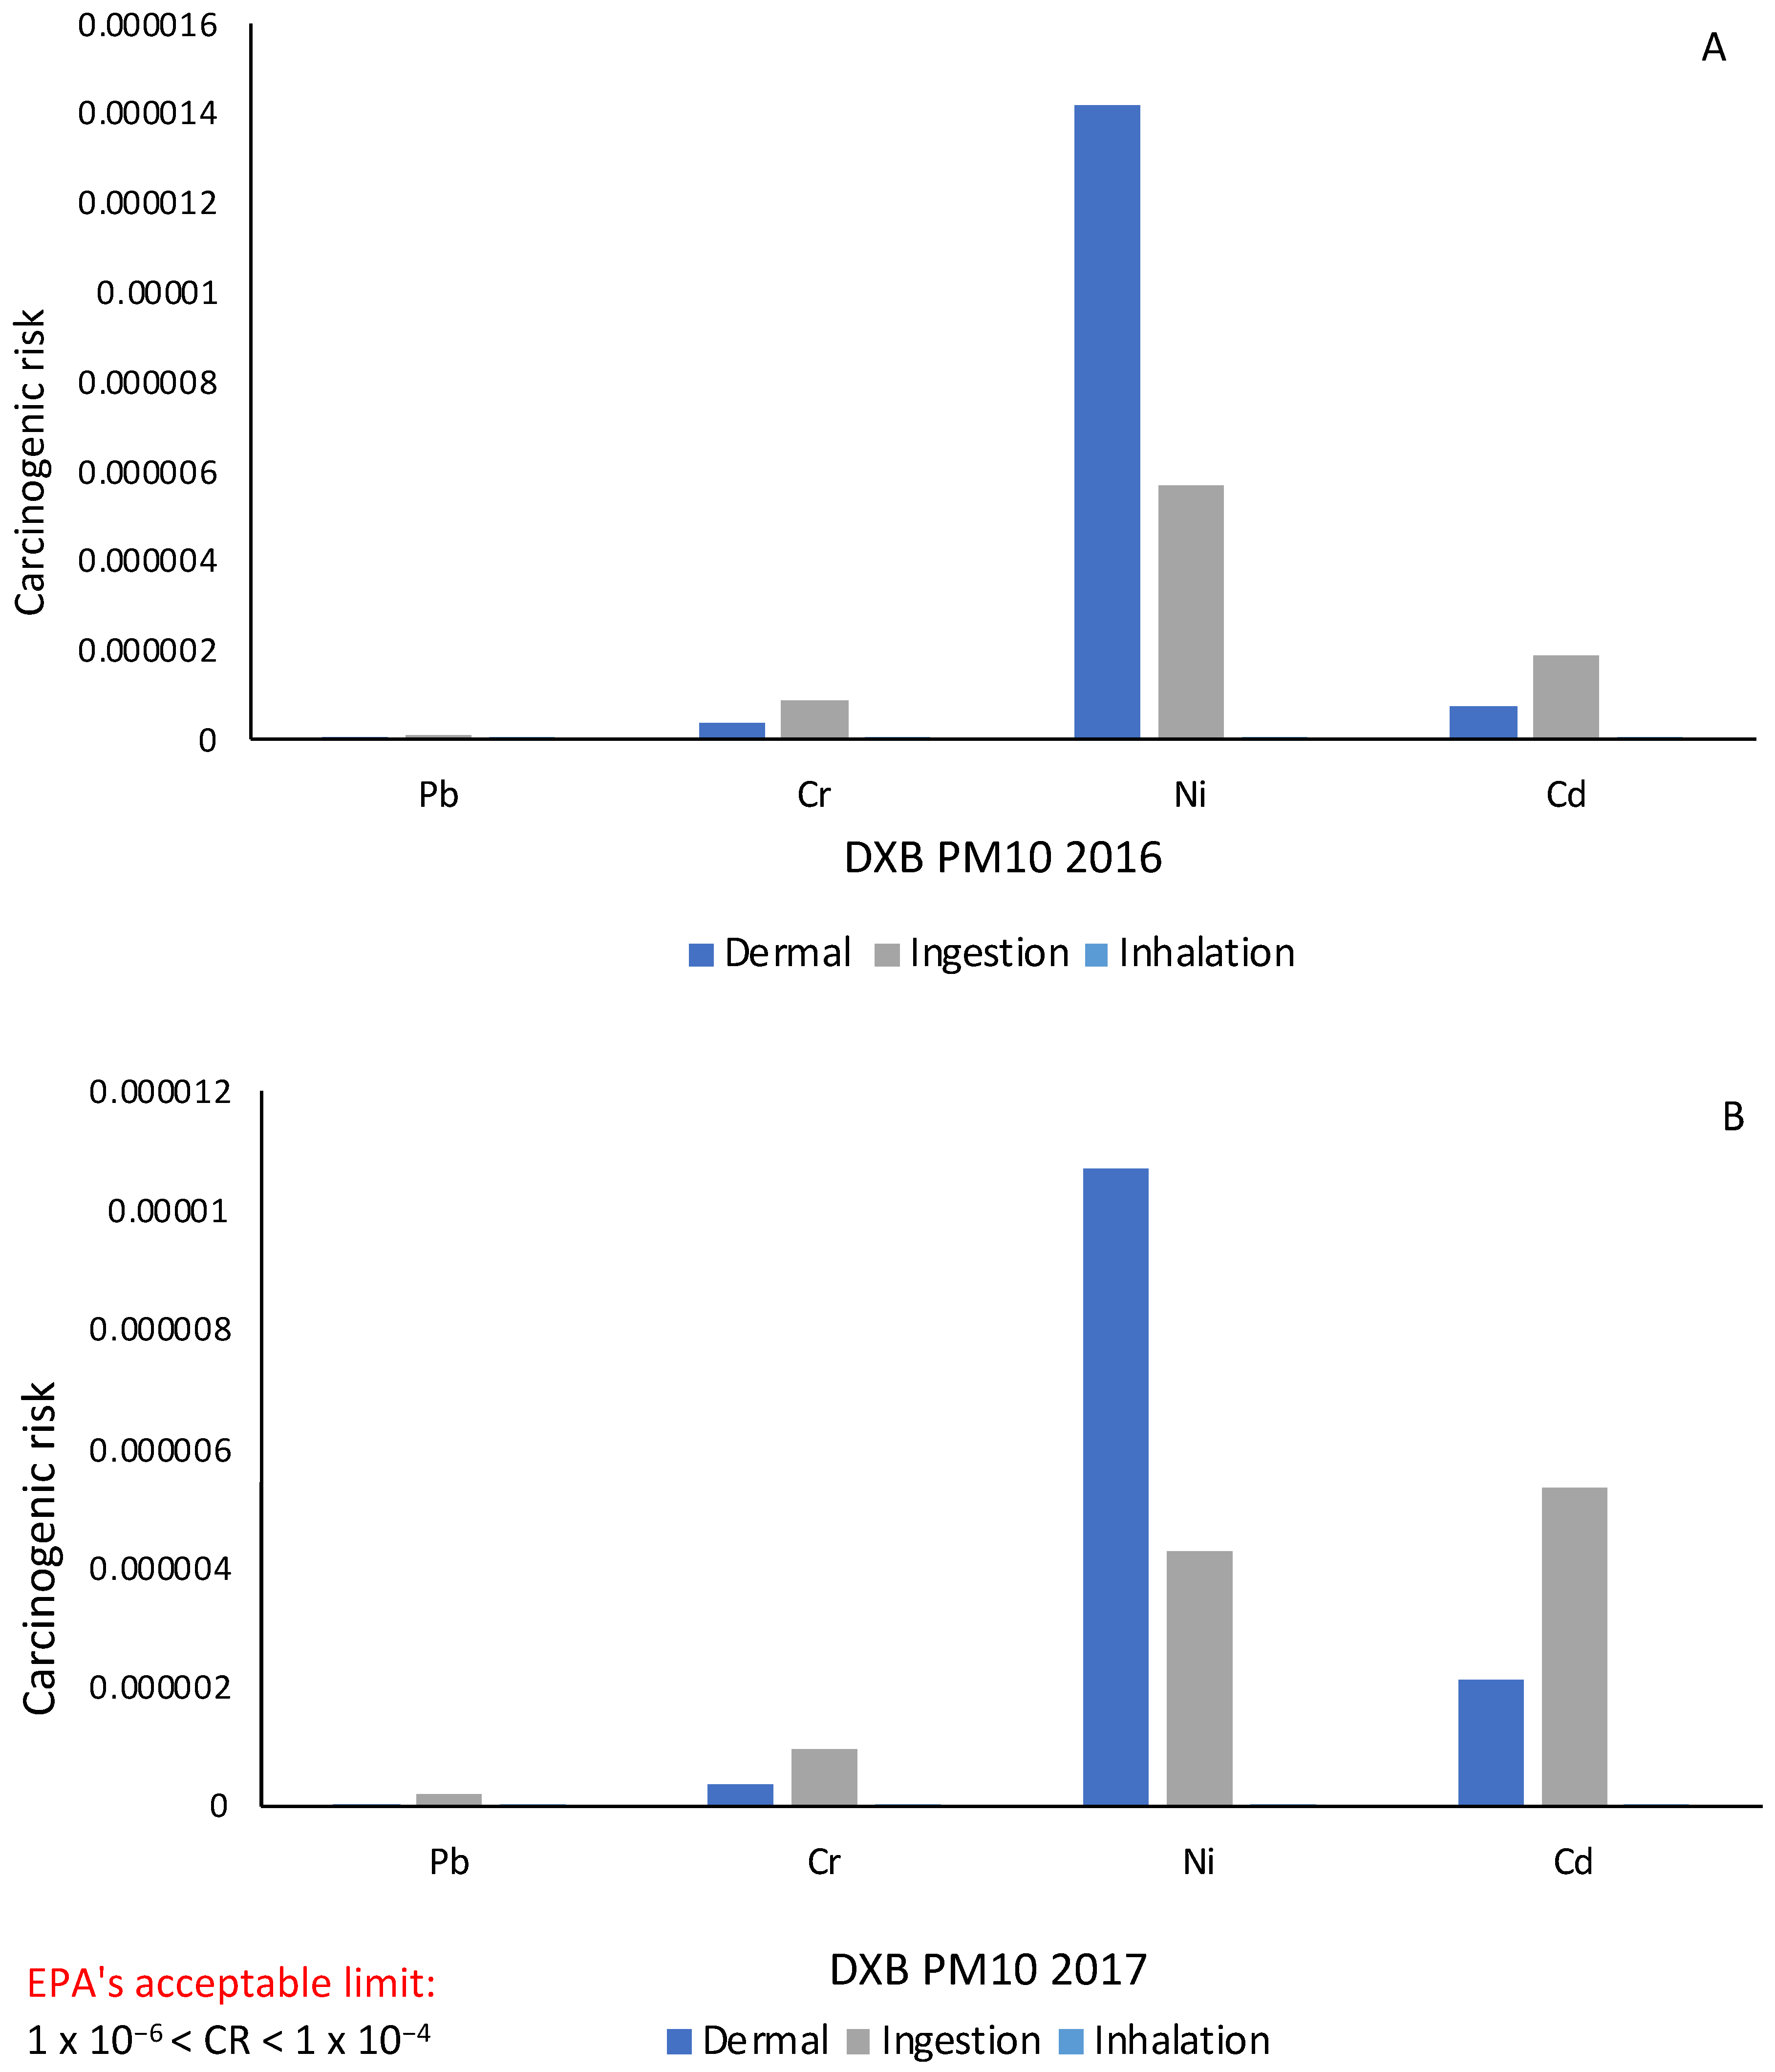
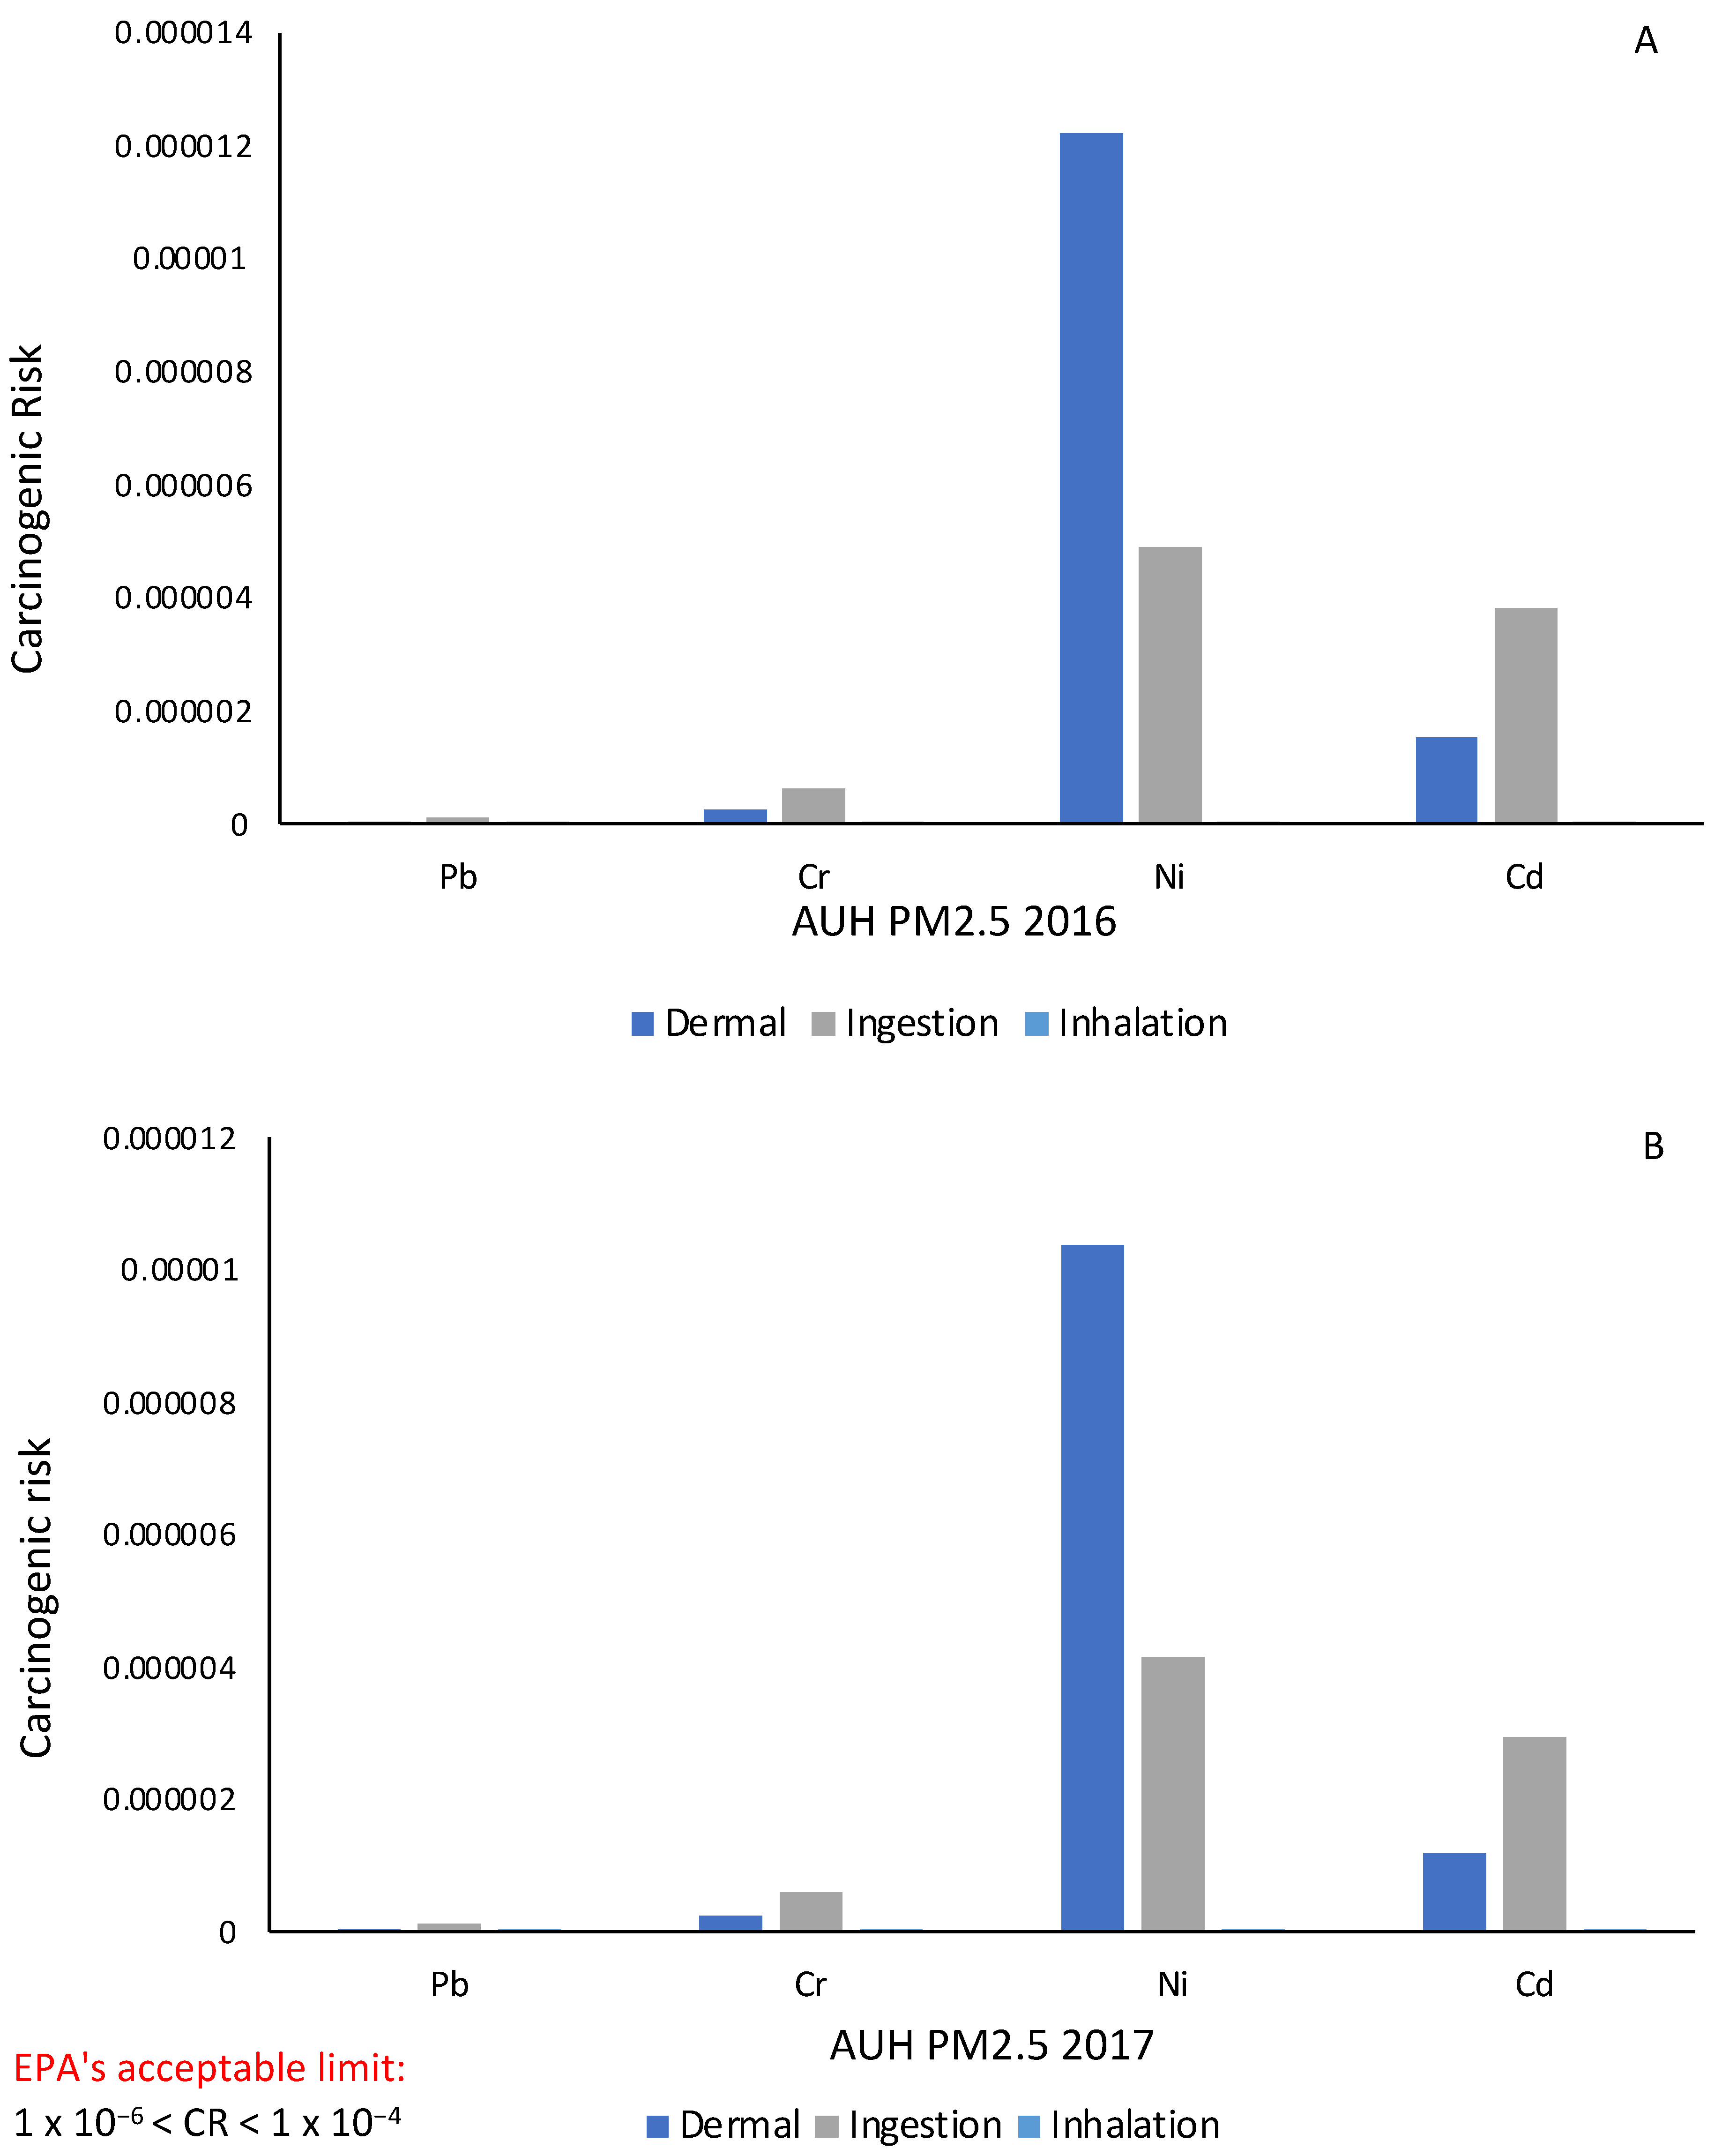
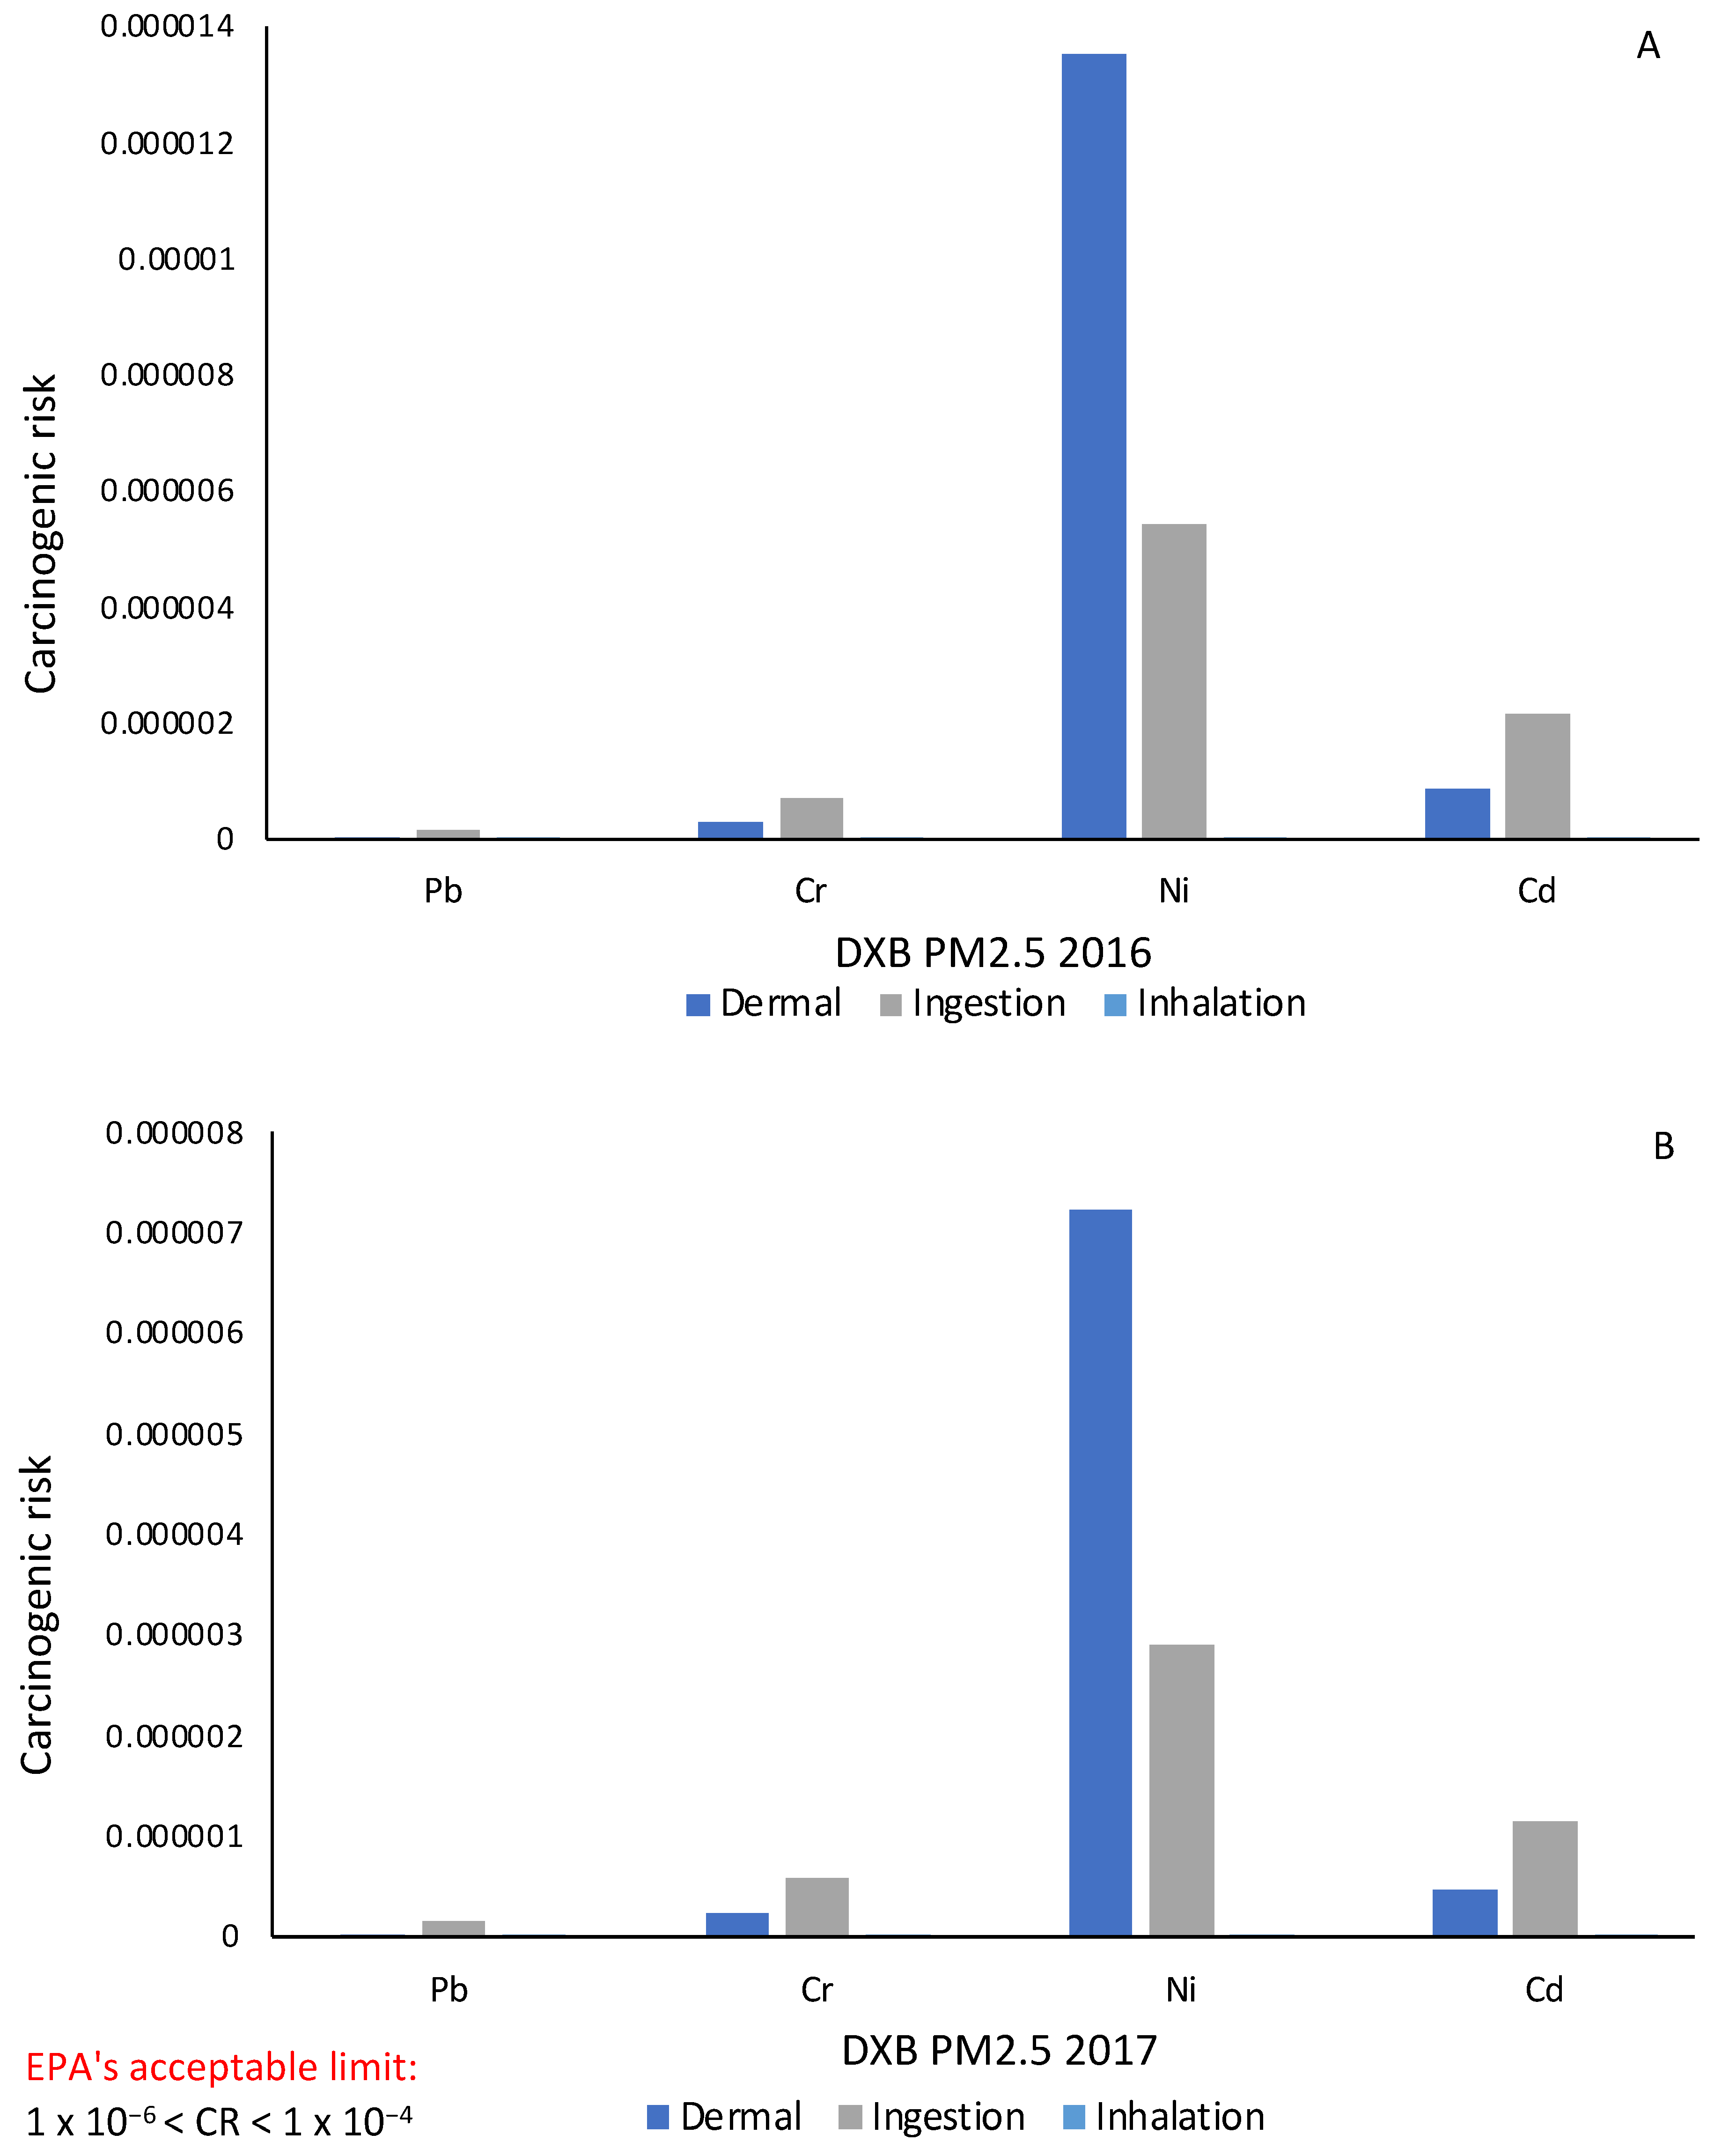
3.2. Health Risk Assessment

In this study, both carcinogenic and non-carcinogenic risk assessments were performed, for the first time, for PM2.5 and PM10 across both sampling years and locations. Figure 3, Figure 4, Figure 5 and Figure 6 (and Tables S2 and S3 in the Supplementary Materials) present the cancer risk (CR) associated with heavy metals through inhalation, dermal contact, and ingestion pathways in AUH and DXB for 2016 and 2017, within PM2.5 and PM10. According to the EPA, the permissible limits for cancer risks are set between 10−6 and 10−4 for individual carcinogens or multi-element carcinogens.
The findings indicate that the cancer risks associated with Pb, Cr, Ni, and Cd in both PM10 and PM2.5, across the three exposure pathways, remained within the acceptable range at both the DXB and AUH monitoring sites for 2016 and 2017. The ranking of cancer risks for heavy metals in PM2.5 and PM10 at AUH and DXB in both years was Ni > Cd > Cr > Pb, except for PM10 heavy metals in AUH 2017, where the order was Ni > Cr > Cd > Pb. Dermal exposure was identified as the primary pathway for nickel-related cancer risks, while ingestion posed the greatest risk for chromium and cobalt. Lead exhibited a negligible risk compared to the other elements, likely due to its classification as a probable carcinogen, whereas the other three heavy metals are known carcinogens.
The non-cancer risk assessment was conducted by calculating the hazard quotient (HQ) for each element, followed by the hazard index (HI). According to the EPA, the acceptable threshold for HI is less than 1 [28]. Table 3. provides the HQ and HI values for the dermal, ingestion, and inhalation exposure pathways at the AUH and DXB sites. The HQ and HI values for all heavy metals measured in PM2.5 and PM10 at both locations were within the acceptable range (HI < 1). In 2016, the highest HQ value for PM2.5 was observed for Co at the AUH site, while in 2017, Pb at the DXB site exhibited the highest HQ value, both primarily due to ingestion. For PM10, the highest HQ values were recorded for Co in 2016 and Pb in 2017 at the DXB site, also through the ingestion pathway.
In this study, the health risk assessment was conducted using monthly analyses of heavy metal concentrations, with the results averaged across the entire year. While this approach provides a general understanding of exposure risks, it may not fully capture the heightened risks during extreme events such as sandstorms. Sandstorms are known to significantly elevate PM concentrations, particularly in regions like the UAE where these events occur frequently. During sandstorms, the levels of PM-bound heavy metals can spike, potentially increasing the health risks associated with their exposure. During dust storm events in 2016 and 2017, particularly in the summer months, the concentrations of PM2.5 and PM10 at the DXB and AUH airports significantly increased, reaching extreme levels. For instance, PM2.5 concentrations spiked to 1280 µg/m3 in early August 2016, indicating the presence of a major dust storm. PM10 levels also rose from typical concentrations below 250 µg/m3 to as high as 750 µg/m3 during dust storms [15]. These dust events are frequent in the GCC region, occurring around 30% of the time during summer and represent a considerable source of particulate pollution [49]. In conjunction with elevated particulate matter, heavy metal concentrations also increased dramatically, with lead (Pb) levels on filters reaching 53 mg/kg in Abu Dhabi and 93 mg/kg in Dubai during dust storms, far exceeding normal concentrations of 10 mg/kg. Furthermore, the presence of major elements such as Ca, Al, Mg, and Mn also spiked, reflecting the geological and anthropogenic origins of dust storms [15].
Future studies should prioritize the targeted analysis of heavy metals during these extreme weather events to determine whether their concentrations increase in tandem with PM levels. By conducting health risk assessments specifically during sandstorm events, researchers can assess whether the exposure risks to harmful metals, including carcinogenic ones, are more severe during such periods. This would provide a more comprehensive view of the potential health impacts of sandstorms and would contribute to more effective mitigation strategies, ensuring that vulnerable populations are protected during times of increased atmospheric pollution. Additionally, it would be beneficial to incorporate real-time monitoring systems during sandstorms to track fluctuations in heavy metal concentrations and assess short-term exposure risks. This approach could also help improve prediction models and inform public health interventions during high-pollution episodes.
Health risk assessments have been conducted in various regions outside the UAE, including Saudi Arabia, China, and India, with each study focusing on different sites [28,50,51]. While some of these studies, like the present one, identified no significant health risks, others have reported potential threats to public health. This variation highlights the site-specific nature of health risk assessments, which can differ significantly based on factors such as industrial activity, meteorological conditions influencing heavy metal concentrations, and variables like life expectancy, body weight, and exposure time that are incorporated into health risk calculations and that vary by location.

3.3. PAH Health Risk Assessment

The TTEQ was calculated based on PEFs following the ATSDR guidance for seven priority PAHs. Out of these, six PAHs were detected in air samples. The TTEQ values in both Dubai and Abu Dhabi remained below the WHO guideline limit of 1 ng/m3 [52] indicating a relatively low carcinogenic potency of airborne PAHs in both cities. Dubai showed generally higher TTEQ values, with a maximum of 0.125 ng/m3 (DXB 08/17), primarily due to elevated concentrations of benzo[a]pyrene (BaP) and dibenzo[a,h]anthracene (DahA). In Abu Dhabi, the highest TTEQ was 0.0639 ng/m3 (AD 07/17).
The lifetime cancer risk posed by exposure to airborne PAHs was estimated for both adults and children at Dubai and Abu Dhabi international airports using the ILCR model recommended by the US EPA. The ILCR values were calculated for six carcinogenic PAHs: Benzo[a]anthracene (BaA), Chrysene (CHR), Benzo[b]fluoranthene (BbF), Benzo[k]fluoranthene (BkF), BaP, and DahA. The results were interpreted based on EPA thresholds, where ILCR values lower than 10−6 indicate negligible risks, values between 10−6 and 10−4 represent potential cancer risks, and values exceeding 10−4 denote high cancer risks.
At DXB, the ILCR values for adults ranged between 1.8 × 10⁻⁷ and 1.1 × 10⁻⁵, with the highest values attributed to BaP and CHR in samples such as DXB 05/17 and DXB 08/17. For children, ILCR values ranged from 8.4 × 10⁻⁸ to 5.2 × 10⁻⁶, with peak risks observed for BbF and BaP. In most cases, adult ILCR values were consistently higher than those for children due to longer exposure durations and higher inhalation rates incorporated into the model. Similarly, for AUH, adult ILCR values ranged from 1.5 × 10⁻⁷ to 5.8 × 10⁻⁶, again highlighting BbF, BkF, and BaP as the dominant contributors to potential cancer risks. The ILCR values for children ranged from 7.4 × 10⁻⁸ to 2.7 × 10⁻⁶, slightly lower than for adults, but still above the acceptable threshold of 10−6 in many cases. Compared to Bengbu City, China, where annual ILCRs for adults and children ranged from 1.4 × 10⁻⁴ to 3.7 × 10⁻³, indicating a high cancer risk, the ILCR values in our study were lower, mostly ranging between 10−7 and 10−5, suggesting a lower but still notable risk, particularly for pollutants like BaP and BbF [18]. The occurrence of different PAHs, along with detailed calculations for TEQ and the health risk assessment, are presented in the Supplementary Materials.

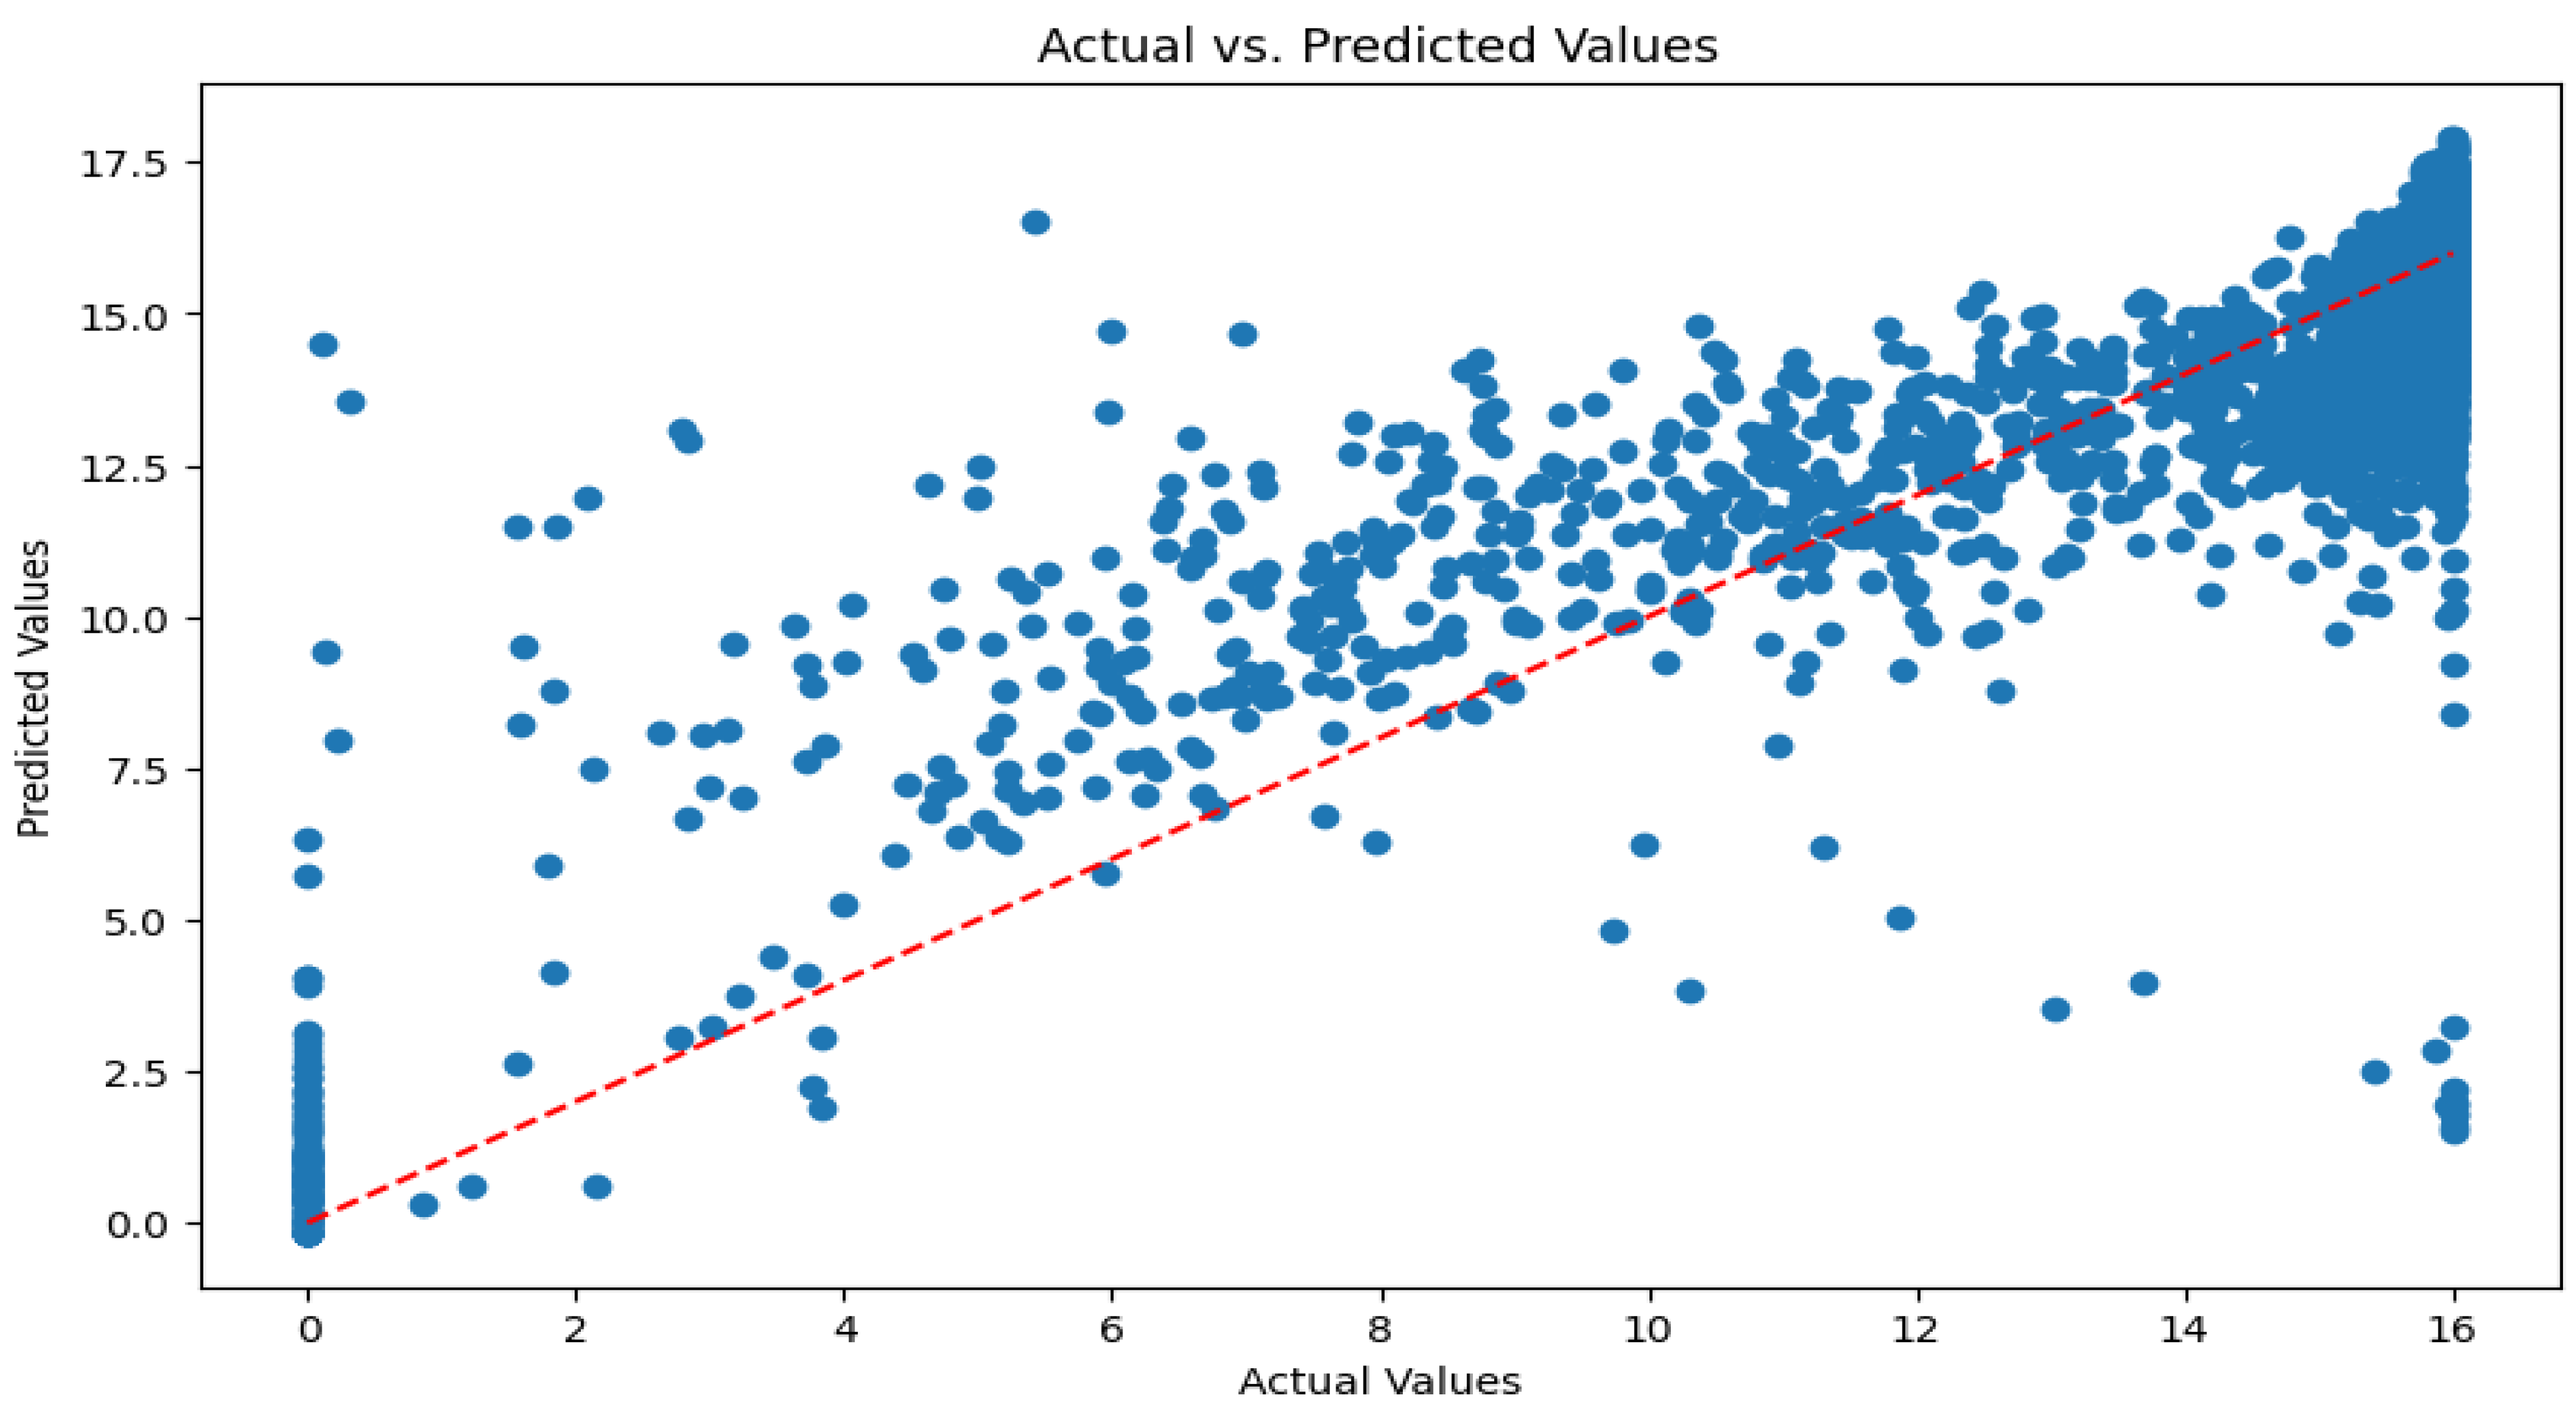
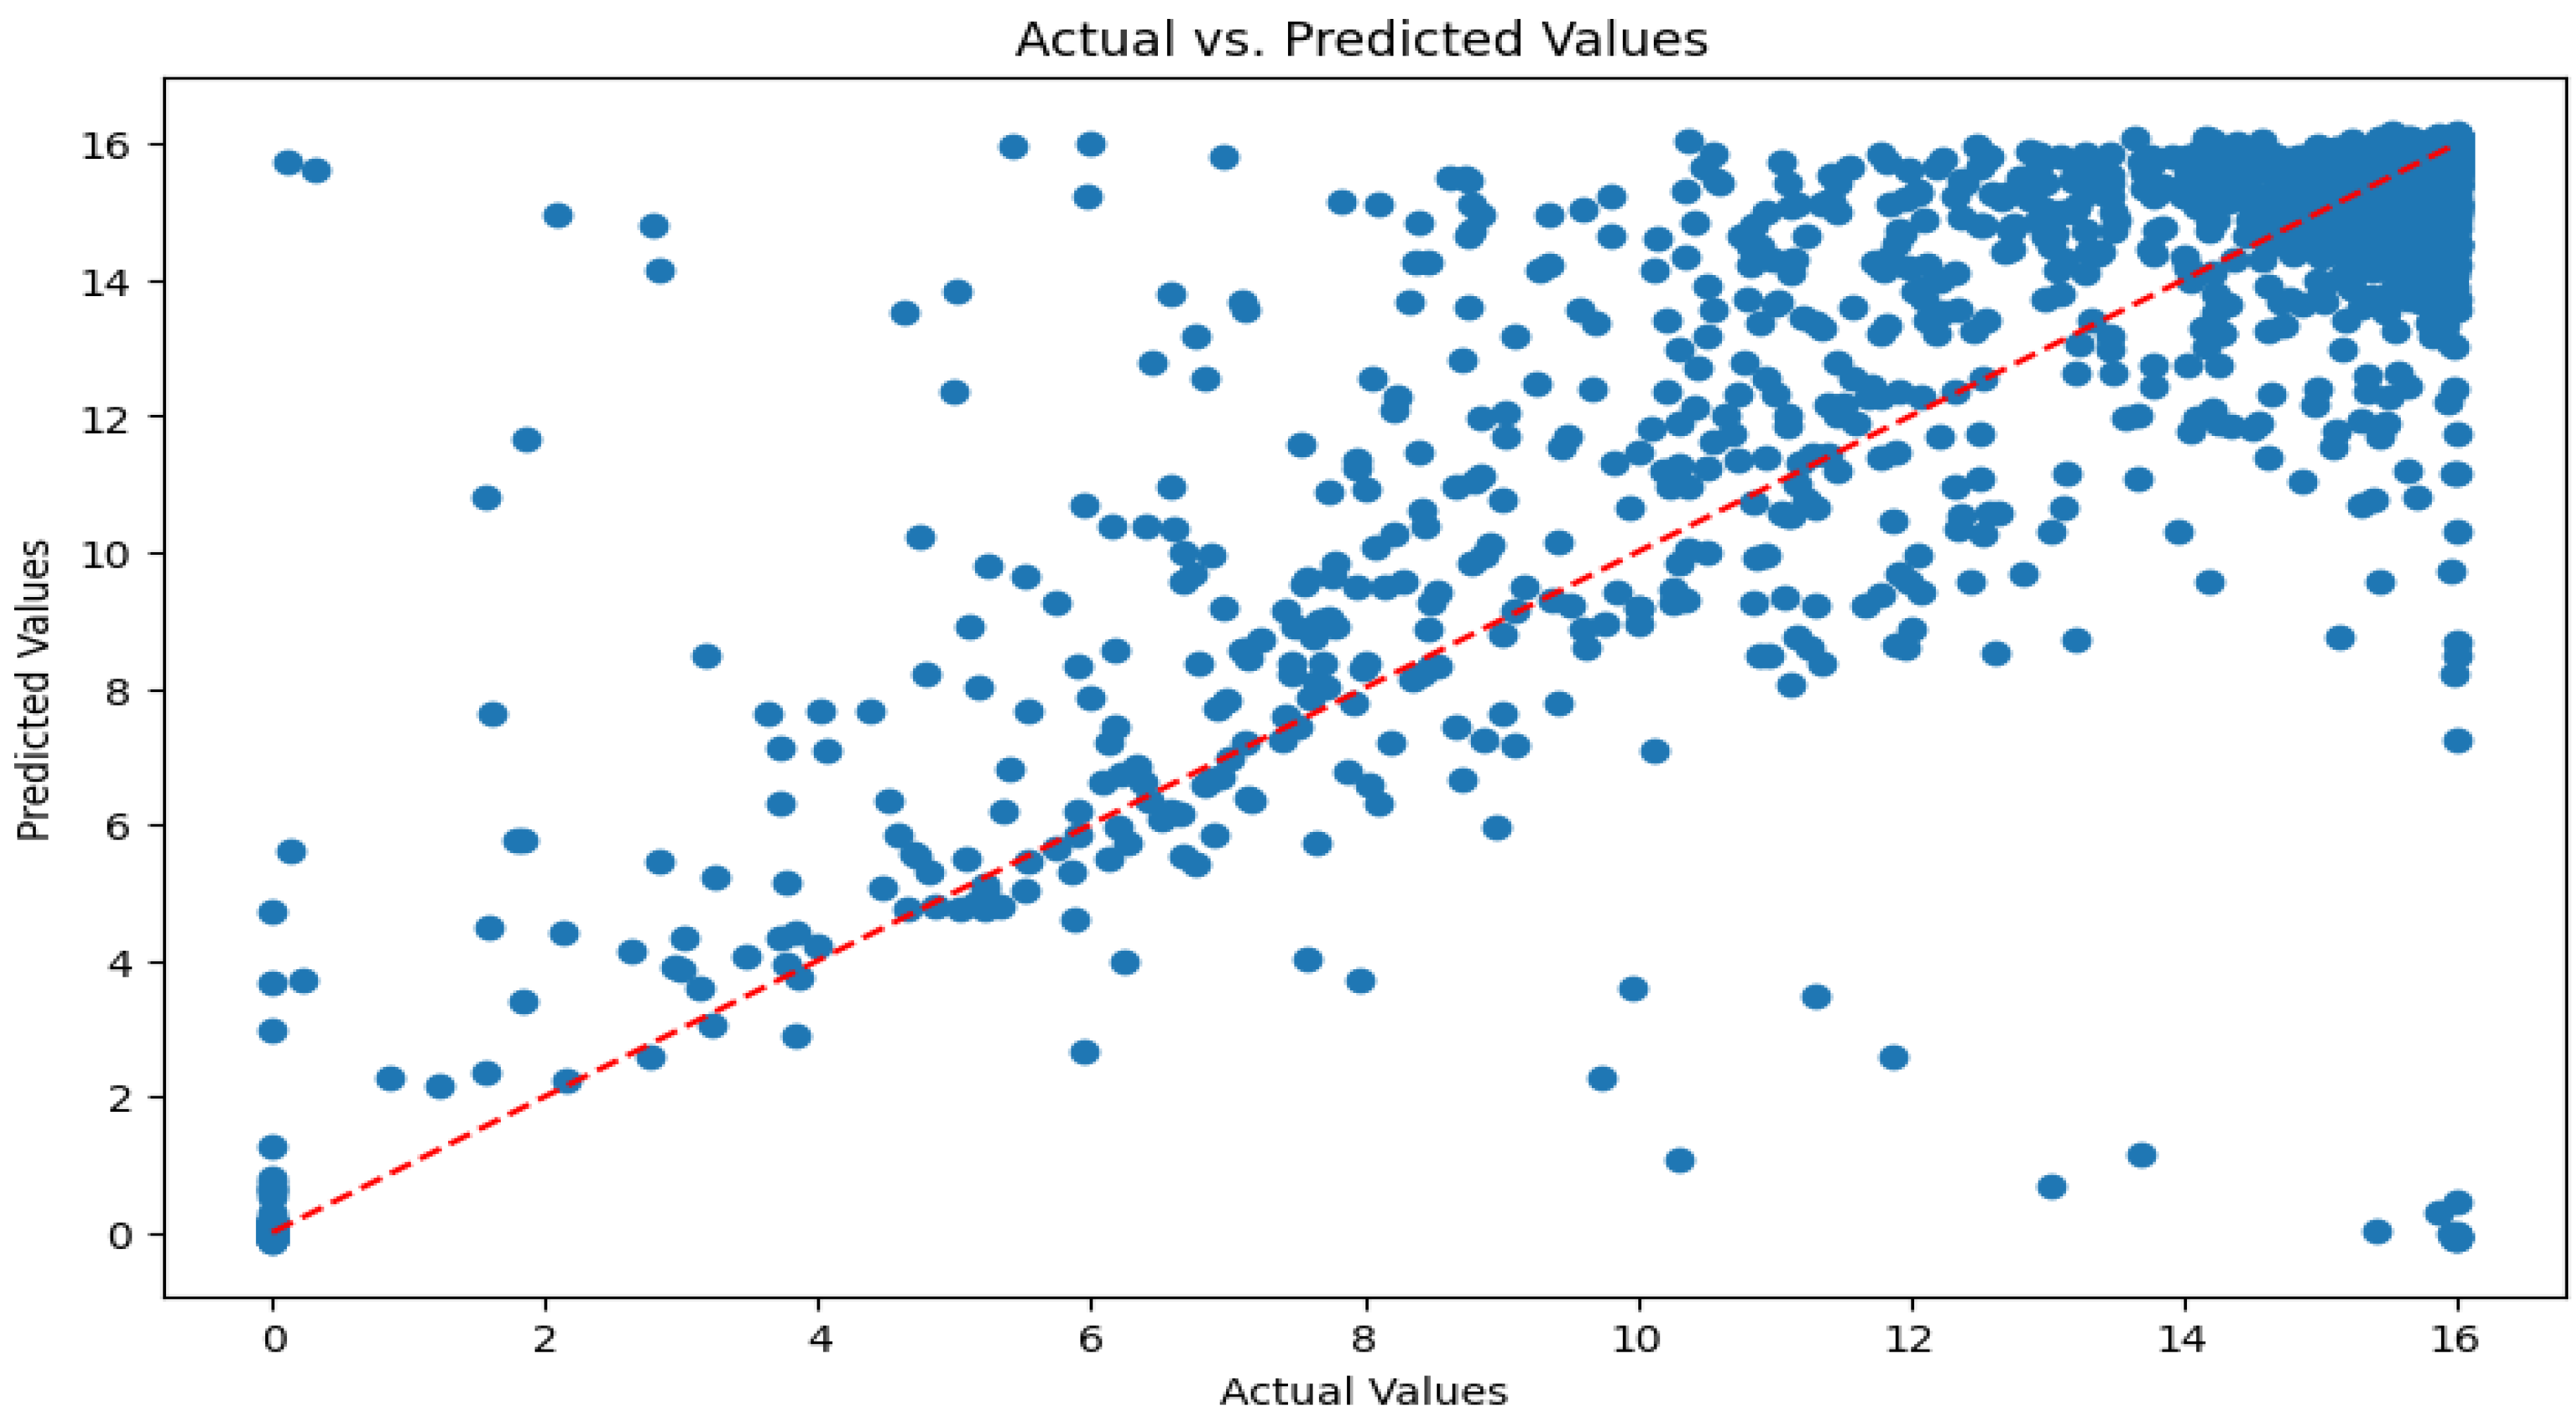
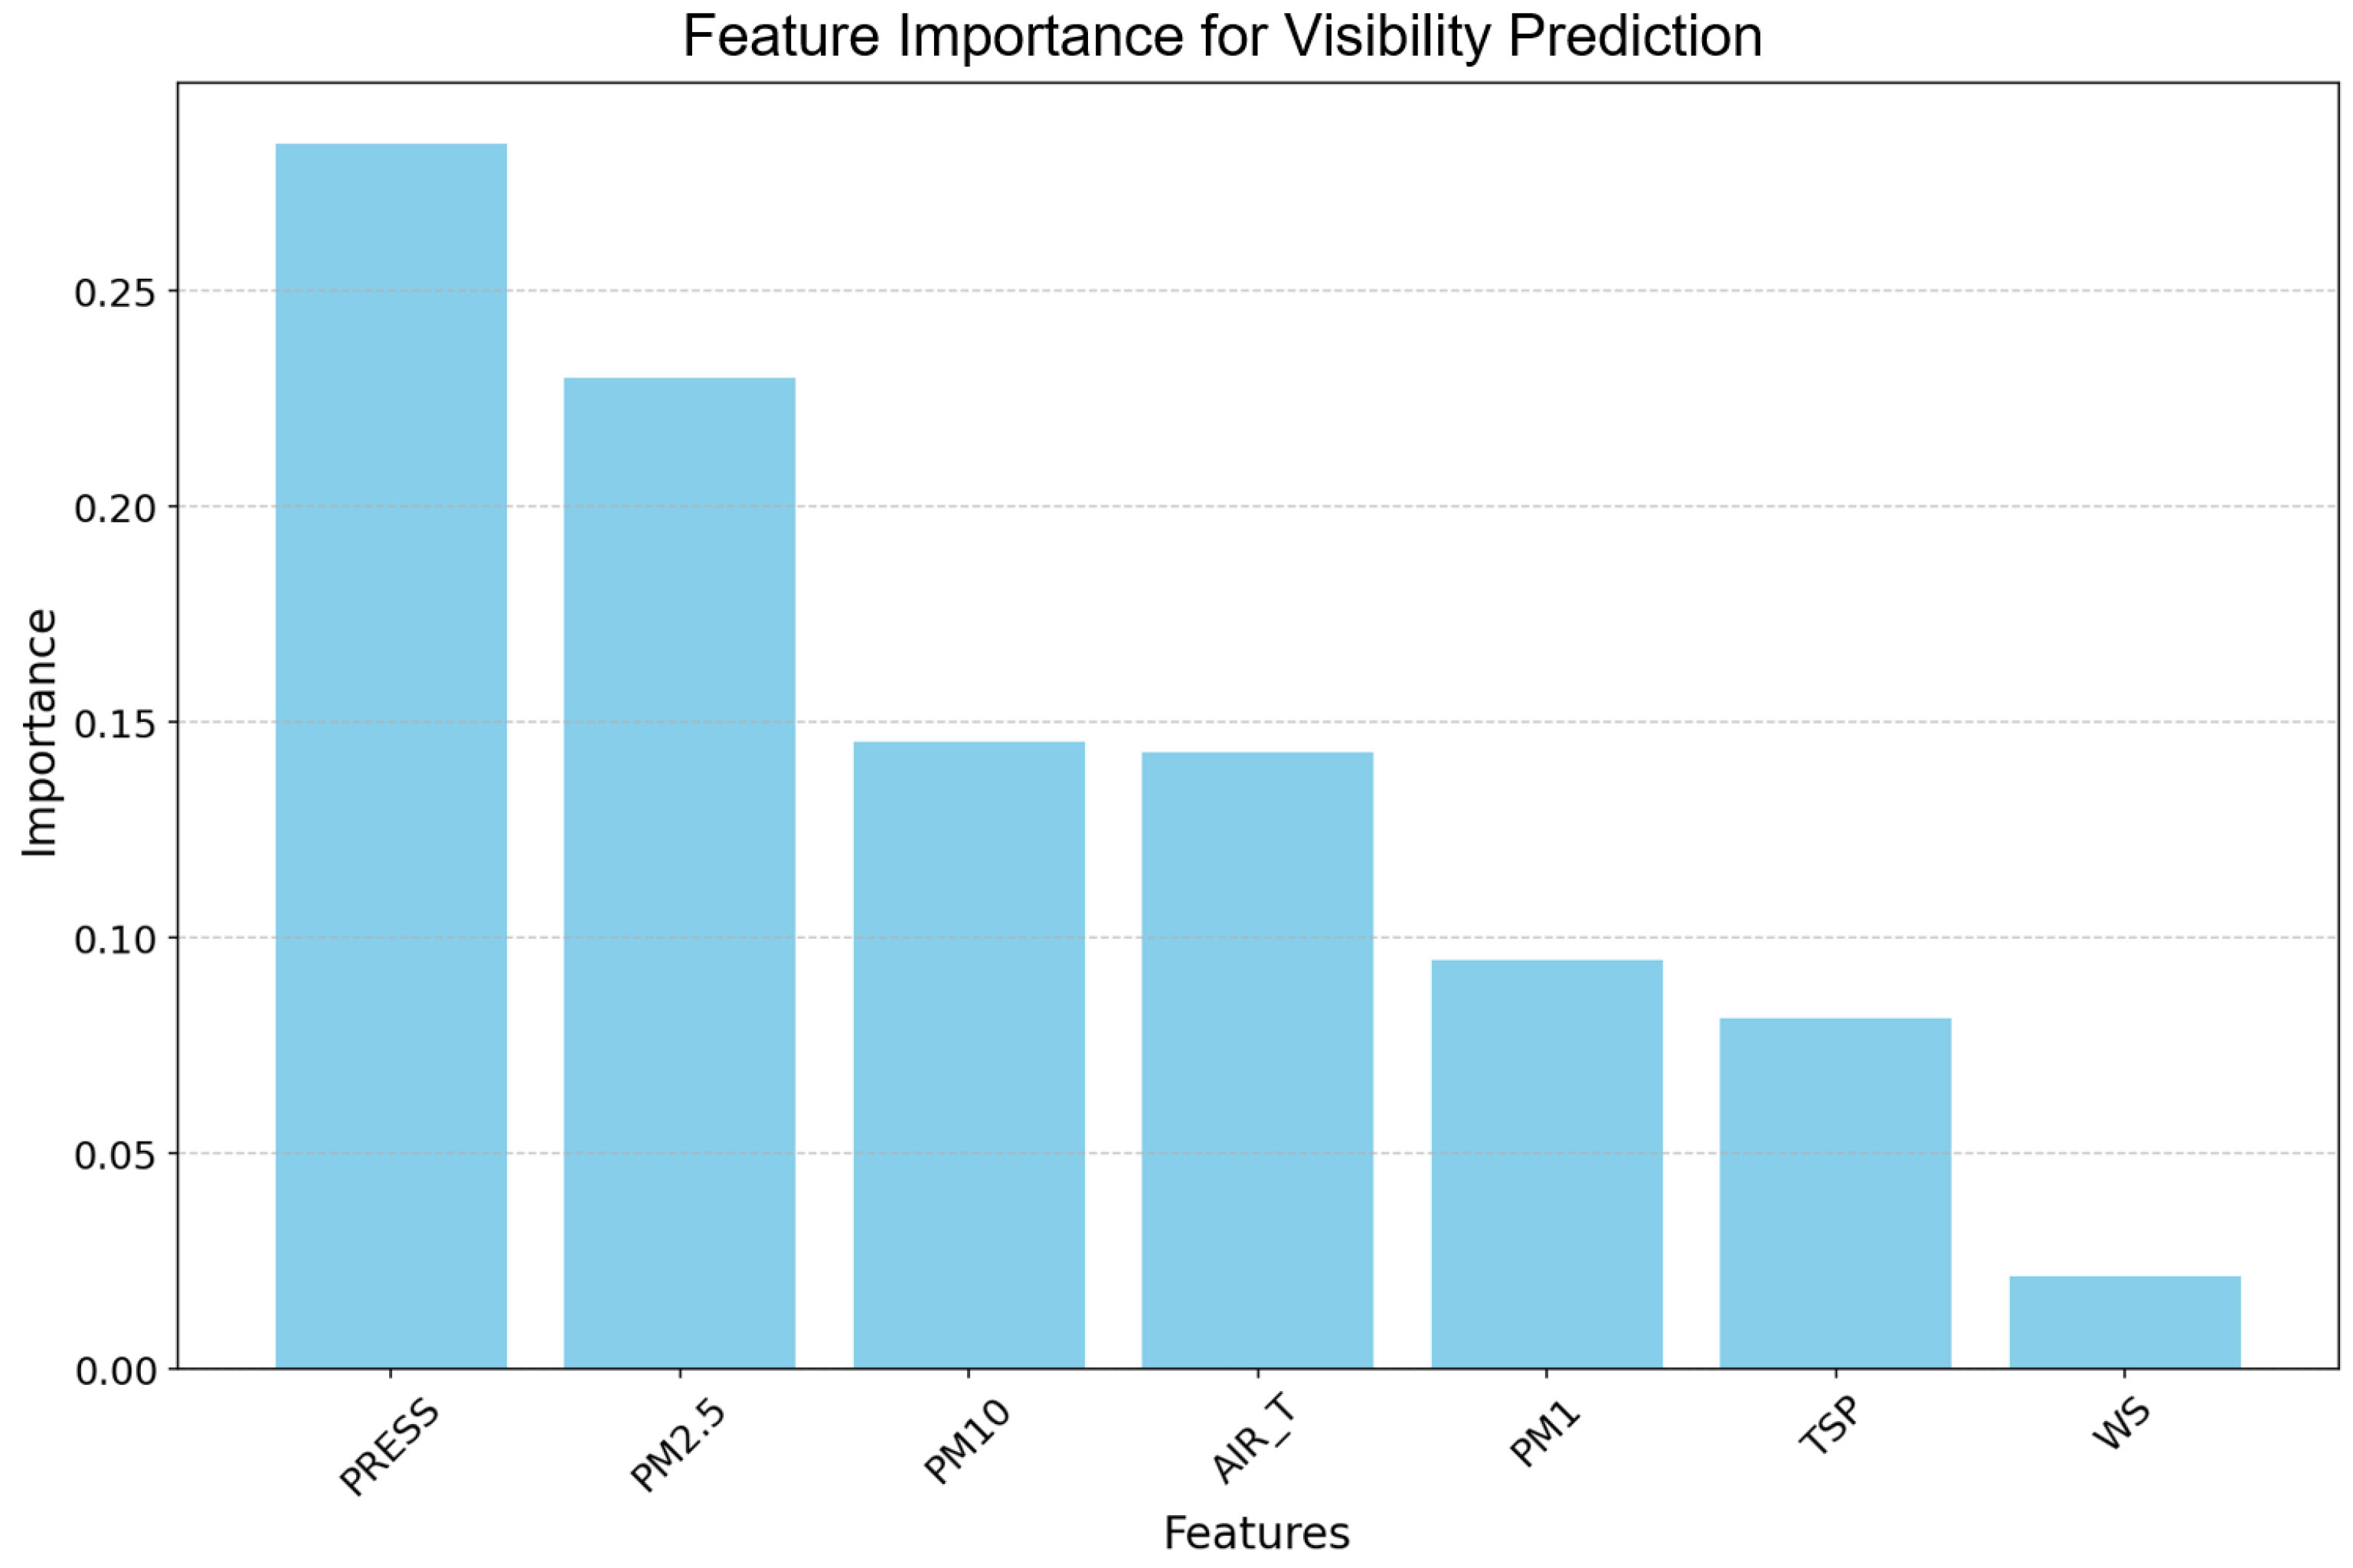
3.4. AI-Based Regression Models for Visibility Prediction

The present study also focused on developing predictive models for visibility based on environmental data collected from Aeroqual stations. The aim was to create models capable of forecasting visibility during dust storms and other weather conditions. By utilizing real-time data from various locations in the GCC, several machine learning models were trained, and their performance is compared to actual on-site measurements. This comparison allowed for the identification of the most effective models in predicting visibility and detecting dust storm patterns.
A regression model was developed to predict visibility as the dependent variable, using seven independent variables: PM1, PM2.5, PM10, total suspended particles (TSPs), wind speed (WS), air pressure, and air temperature. These variables are numbered 0 through 6 in the correlation matrix (Figure 7). These results were collected from Aeroqual stations, with the average monthly and yearly concentrations presented in Table 4.
The correlation matrix (Figure 7) reveals strong positive correlations among PM fractions, including PM1, PM2.5, PM10, and TSP (variables 0 to 3), with coefficients exceeding 0.9. This indicates that these PM fractions are closely linked, likely sharing common emission sources or atmospheric processes. Conversely, air pressure (variable 4) exhibits weak or slightly negative correlations with the PM fractions, suggesting limited direct influence. Wind speed (WS, variable 5) shows a moderate positive correlation with air pressure and air temperature (variable 6), with a notable correlation of 0.7 between WS and air temperature, highlighting potential meteorological interactions.
Three machine learning regression algorithms were employed: linear regression, non-linear regression with a radial basis function kernel, and an artificial neural network (ANN), which is a deep learning method. The correlation matrix remained consistent across all models. To train and evaluate the models, 80% of the dataset was used for model development, while the remaining 20% was reserved for testing. Figure 7, Figure 8 and Figure 9 present scatter plots of actual versus predicted visibility values for the test dataset. The models demonstrated the ability to predict visibility based on the seven independent variables, providing a useful tool for visibility forecasting under varying environmental conditions.

Linear Regression Model

The linear regression model provided an R2 score of approximately 0.735, which indicates a moderate level of explained variance. The mean squared error (MSE) was 4.293, suggesting that the model struggled somewhat in capturing the complexities of the relationships between the independent variables (PM1, PM2.5, PM10, TSP, wind speed, air pressure, and air temperature) and the dependent variable (visibility) (Figure 8). The relatively lower R2 value implies that linear regression may not be the most suitable model for this dataset, potentially due to the non-linear relationships between the variables. For this reason, MLP regression and SVM-RBF models were developed.

3.5. MLP Regressor Model

The MLP neural network produced an R2 score of about 0.779 and an MSE of 3.574 (Figure 9). While the MLP model outperformed the linear regression model, it did not surpass SVM in terms of predictive accuracy. The performance of the neural network suggests that while it is capable of modeling non-linear relationships, it may require more tuning (e.g., adjusting the number of hidden layers or neurons) or more data to improve its predictive capability for this problem.

SVM-RBF Model

The SVM model with an RBF kernel showed improved performance over the linear regression model, achieving an R2 score of approximately 0.815 and a lower MSE of 2.995 (Figure 10). The higher R2 indicates that the SVM model better captured the underlying patterns in the data, particularly the non-linear relationships. This suggests that SVM with an RBF kernel is more effective in modeling the complex interactions among the variables influencing visibility.
To assess the contribution of individual input parameters to the visibility prediction, feature importance analysis was conducted using the random forest algorithm. The model’s built-in mechanism for calculating Gini importance was utilized, whereby each feature’s contribution was evaluated based on its ability to reduce impurity across decision trees. It was found that PM10, TSP, and PM2.5 exhibited the highest relative importance scores, indicating that they strongly influenced visibility outcomes. These parameters are consistent with the known effects of particulate concentration on optical range. In contrast, PM1, wind speed (WS), and atmospheric pressure (PRESS) were identified as having relatively low importance. These features contributed minimally to model performance and could be considered for removal in future simplified models. A graphical representation of feature importances is provided in Figure 11. Features contributing below a significance threshold (e.g., <0.05) have been highlighted for potential exclusion.
To determine the importance of each parameter for visibility with an algorithm called random forest, the model’s system was applied to assign importance to each feature by measuring its effect in reducing how optimal its decision trees are. Here, it was found that PM10, TSP, and PM2.5 had the highest relative importance scores, which means they strongly affected the visibility of the air. They fit with the impact that particulate concentration has on distance visibility. PM1, wind speed (WS), and atmospheric pressure (PRESS) were considered to have minor importance by the findings. Such features played just a minor role in model success and could be dropped in simpler models. The visual representation in Figure 11 shows the feature importances given. Traits that do not reach the level of significance are shown for review, with their possible removal from the model.
Overall, the results highlight that non-linear models, particularly the SVM with an RBF kernel, are more effective in predicting visibility based on the given set of meteorological and particulate matter variables. The low performance of the linear regression model indicates that simple linear relationships are insufficient to capture the complexity of the data. The MLP neural network, while better than linear regression, suggests that neural networks can be a viable option but may need further refinement. These findings underscore the importance of selecting appropriate models based on the data’s characteristics, especially when dealing with environmental and meteorological datasets that often exhibit complex, non-linear interactions. This analysis is crucial in enhancing the understanding of how various environmental factors influence visibility, which can have significant implications for public health, transportation safety, and environmental monitoring.
Numerous studies have utilized different statistical methods, including linear and non-linear regression models, to process large amounts of collected data and estimate pollutant levels based on R2 values [53,54]. These studies frequently focused on a specific group of models to compare and identify the one with the highest predictive accuracy. Such comparisons were carried out to efficiently pinpoint the most effective method among various well-established approaches for accurately estimating pollutant concentrations.
Overall, studies have demonstrated that neural networks are capable of producing better visibility estimations than traditional statistical tools (e.g., linear and logistic regression) [55].
Ortega et al. [56] examined the application of deep learning models for single-step visibility forecasting using time-series climatological data. Their study developed and tested five deep learning models: a multi-layer perceptron (MLP) architecture, three convolutional neural network (CNN) architectures derived from traditional CNNs, and a long short-term memory (LSTM) model, using data from two weather stations in Florida. Additionally, two traditional models—linear regression (LR) and auto-regressive integrated moving average (ARIMA)—were included for comparison. Their study highlighted the suitability of LSTM models, noting their ability to improve performance with larger training datasets and effectively extract time-dependent features from raw input data [56].
This approach offers significant advantages for future weather predictions, reducing the need for continuous dust concentration monitoring while still ensuring accurate forecasts. By determining which predictive models perform best under specific conditions, the ability to forecast visibility disruptions is enhanced, particularly in regions with frequent dust activity. These efforts contribute to improved planning in sectors such as aviation, transportation, and public health, enabling more efficient responses to weather-related challenges in the GCC.
The GCC’s major airports, including those in the UAE and Saudi Arabia, experience frequent disruptions due to reduced visibility caused by dust storms. As noted in studies by AlKheder and AlKandari [57] and Gohel [58] visibility reduction during dust storms not only affects flight schedules but also poses significant mechanical challenges. Dust particles can be ingested by airplane engines, leading to serious technical malfunctions or damage, particularly during takeoff and landing. The high frequency of dust events in the GCC makes this issue especially critical for airport management and aviation safety.
These challenges underscore the need for continuous monitoring of atmospheric dust concentrations and their relationship with local meteorological conditions. Analyzing the variations in dust levels alongside wind speed, humidity, and temperature fluctuations can provide critical insights into managing dust storm events. Such measurements are particularly crucial in densely populated areas and around major airports, where busy flight schedules intersect with hazardous weather conditions. Understanding these dynamics can inform more effective air traffic management and public health strategies, mitigating the adverse effects of dust storms in the region.
In this work, we present a complete air quality-based visibility analysis and prediction pipeline from data collection to time series analysis, and machine learning based regression modeling. Three machine learning based regression algorithms were used air quality and visibility prediction including linear regression, support vector machine (SVM) with radial basis function, and artificial neural network multilayer perceptron regressor. The obtained regression models using these algorithms provided R-squared score and (MSE) of 0.73 (4.29), 0.82 (2.99), and 0.78 (3.57), respectively. This pipeline provides a fast and simple machine-learning-based approach for air quality-based visibility analysis and prediction.

4. Conclusions

This study provides a comprehensive health risk assessment of particulate matter (PM)-bound heavy metals and PAHs in the UAE, focusing on exposure at key airports in Dubai and Abu Dhabi during 2016 and 2017. The analysis revealed no significant carcinogenic risks from the heavy metals assessed (lead, cobalt, nickel, and chromium) during this period. However, PM concentrations consistently exceeded the World Health Organization’s (WHO) recommended limits, which underscores the need for stricter regulatory measures to control anthropogenic emissions and protect public health. On the other hand, the ILCR values for PAHs indicated a potential cancer risk in several samples from DXB and AUH, with Benzo[a]pyrene, Chrysene, and fluoranthene-related compounds emerging as key contributors to the elevated risk. Given that particulate matter is a critical air quality indicator and a health hazard, continued monitoring and assessment of long-term exposure risks remain essential. In addition to the health risk assessment, this study applied advanced machine learning techniques to predict visibility in the UAE, a region frequently affected by sandstorms. The models tested include linear regression, artificial neural networks (ANNs), and a support vector machine (SVM) with a radial basis function (RBF) kernel. SVM with an RBF kernel demonstrated the highest accuracy in predicting visibility by integrating key meteorological variables (wind speed, air pressure, and temperature) and particulate matter data (PM1, PM2.5, PM10, and TSP). The model’s performance was validated against on-site sampling data, confirming its effectiveness in capturing the complex relationship between dust storms, particulate matter, and visibility. This highlights the potential of machine learning algorithms in improving environmental monitoring systems and enhancing our ability to predict and manage the impacts of dust storms on public health and safety. These findings emphasize the need for continued research to develop predictive models for air quality and visibility, as well as the importance of proactive measures to mitigate PM-related health risks in sandstorm-prone regions like the UAE. Future studies should focus on targeted health risk assessments during dust storm events and the implementation of real-time monitoring systems for heavy metals and PAHs in order to improve the understanding of exposure risks and support more effective air quality management and public health policies.

Supplementary Materials

The following supporting information can be downloaded at: https://www.mdpi.com/article/10.3390/su17146581/s1, Table S1: Heavy metals health risk assessment parameters and values; Table S2: Cancer risk values for PM 2.5 and PM 10 heavy metals in DXB and AUH site for 2016 and 2017; Table S3: Cancer risk values for PM 10 heavy metals in DXB and AUH site for 2016 and 2017; Table S4: Potency Equivalency factors; Table S5: The parameters of the exposure factor; Table S6: Detected PAHs in air samples; Table S7: ILCR values for Dubai airport; Table S8: ILCR values for Abu Dhabi airport; Figure S1: ILCR values for Dubai airport; Figure S2: ILCR values for Abu Dhabi airport; Table S9: TEQ values for Dubai and Abu Dhabi airports.

Author Contributions

L.D.: Writing—review and editing, writing—original draft, visualization, and conceptualization; S.K.: writing—review and editing, supervision, methodology, and conceptualization; T.A.: writing—review and editing, supervision, methodology, conceptualization, and formal analysis; R.A.: data curation and formal analysis; F.S.: writing—review and editing, supervision, methodology, and conceptualization. All authors have read and agreed to the published version of the manuscript.

Funding

This work was funded by the Research Office at the American University of Sharjah (FRG24-C-S30(AS1725)) and a Postdoctoral research grant (PS2403).

Institutional Review Board Statement

Not applicable.

Informed Consent Statement

Not applicable.

Data Availability Statement

The data presented in this study are available on request from the corresponding author. The complete Python source code, dataset, and instructions to reproduce the experiments presented in this study are publicly available in the following GitHub repository: https://github.com/tarig-ali/visibility-prediction-air-quality (accessed on 1 June 2025).

Acknowledgments

This paper represents the opinions of the authors and does not mean to represent the position or opinions of the American University of Sharjah.

Conflicts of Interest

The authors declare no conflict of interest.

References

  1. Harrison, R.M.; Yin, J. Particulate matter in the atmosphere: Which particle properties are important for its effects on health? Sci. Total Environ. 2000, 249, 85–101. [Google Scholar] [CrossRef]
  2. Larssen, T.; Hagen, L. 6.4. Suspended particulates (TSP/SPM). In Air Quality in Europe, 1993: A Pilot Report; European Environment Agency: Copenhagen, Denmark, 1996. [Google Scholar]
  3. Russell, A.G.; Brunekreef, B. A focus on particulate matter and health. Environ. Sci. Technol. 2009, 43, 4620–4625. [Google Scholar] [CrossRef] [PubMed]
  4. Mukherjee, A.; Agrawal, M. World air particulate matter: Sources, distribution and health effects. Environ. Chem. Lett. 2017, 15, 283–309. [Google Scholar] [CrossRef]
  5. Zhang, X.; Zhang, X.; Chen, X. Valuing air quality using happiness data: The case of China. Ecol. Econ. 2017, 137, 29–36. [Google Scholar] [CrossRef]
  6. Manisalidis, I.; Stavropoulou, E.; Stavropoulos, A.; Bezirtzoglou, E. Environmental and health impacts of air pollution: A review. Front. Public Health 2020, 8, 14. [Google Scholar] [CrossRef]
  7. Williams, C.G.; Samara, F. Changing particle content of the modern desert dust storm: A climate × health problem. Environ. Monit. Assess. 2023, 195, 706. [Google Scholar] [CrossRef]
  8. Al-Dousari, A.M.; Ibrahim, M.I.; Al-Dousari, N.; Ahmed, M.; Al-Awadhi, S. Pollen in aeolian dust with relation to allergy and asthma in Kuwait. Aerobiologia 2018, 34, 325–336. [Google Scholar] [CrossRef]
  9. Tsiouri, V.; Kakosimos, K.E.; Kumar, P. Concentrations, sources and exposure risks associated with particulate matter in the Middle East Area—A review. Air Qual. Atmos. Health 2015, 8, 67–80. [Google Scholar] [CrossRef]
  10. Schweitzer, M.D.; Calzadilla, A.S.; Salamo, O.; Sharifi, A.; Kumar, N.; Holt, G.; Campos, M.; Mirsaeidi, M. Lung health in the era of climate change and dust storms. Environ. Res. 2018, 163, 36–42. [Google Scholar] [CrossRef]
  11. Hamdan, N.M.; Alawadhi, H.; Jisrawi, N. Elemental and chemical analysis of PM10 and PM2.5 indoor and outdoor pollutants in the UAE. Int. J. Environ. Sci. Dev. 2015, 6, 566–570. [Google Scholar] [CrossRef]
  12. Basha, G.; Ratnam, M.V.; Kumar, K.N.; Ouarda, T.B.M.J.; Kishore, P.; Velicogna, I. Long-term variation of dust episodes over the United Arab Emirates. J. Atmos. Sol.-Terr. Phys. 2019, 187, 33–39. [Google Scholar] [CrossRef]
  13. Nazzal, Y.; Barbulescu, A.; Howari, F.; Yousef, A.; Al-Taani, A.A.; Al Aydaroos, F.; Naseem, M. New insights on sand dust storm from historical records, UAE. Arab. J. Geosci. 2019, 12, 396. [Google Scholar] [CrossRef]
  14. Al-Taani, A.A.; Nazzal, Y.; Howari, F.M.; Yousef, A. Long-term trends in ambient fine particulate matter from 1980 to 2016 in United Arab Emirates. Environ. Monit. Assess. 2019, 191, 143. [Google Scholar] [CrossRef] [PubMed]
  15. Elsayed, Y.; Kanan, S.; Farhat, A. Meteorological patterns, technical validation, and chemical comparison of atmospheric dust depositions and bulk sand in the Arabian Gulf region. Environ. Pollut. 2021, 269, 116190. [Google Scholar] [CrossRef]
  16. International Agency for Research on Cancer (IARC). Arsenic, metals, fibres and dusts. In IARC Monographs on the Evaluation of Carcinogenic Risks to Humans; World Health Organization: Geneva, Switzerland, 2012; Volume 100C. [Google Scholar]
  17. Mahurpawar, M. Effects of heavy metals on human health. Int. J. Res. Granthaalayah 2015, 530, 1–7. [Google Scholar] [CrossRef]
  18. Wu, D.; Chen, L.; Ma, Z.; Zhou, D.; Fu, L.; Liu, M.; Zhang, T.; Yang, J.; Zhen, Q. Source analysis and health risk assessment of polycyclic aromatic hydrocarbon (PAHs) in total suspended particulate matter (TSP) from Bengbu, China. Sci. Rep. 2024, 14, 5080. [Google Scholar] [CrossRef]
  19. Singh, G. Multiple linear regression based analysis of weather data for precipitation and visibility prediction. In International Conference on Advances in Computing and Data Sciences; Springer Nature: Cham, Switzerland, 2023; pp. 60–71. [Google Scholar]
  20. Kim, B.Y.; Belorid, M.; Cha, J.W. Short-term visibility prediction using tree-based machine learning algorithms and numerical weather prediction data. Weather. Forecast. 2022, 37, 2263–2274. [Google Scholar] [CrossRef]
  21. Kim, B.Y.; Cha, J.W.; Chang, K.H.; Lee, C. Visibility prediction over South Korea based on random forest. Atmosphere 2021, 12, 552. [Google Scholar] [CrossRef]
  22. Castillo-Botón, C.; Casillas-Pérez, D.; Casanova-Mateo, C.; Ghimire, S.; Cerro-Prada, E.; Gutierrez, P.A.; Deo, R.; Salcedo-Sanz, S. Machine learning regression and classification methods for fog events prediction. Atmos. Res. 2022, 272, 106157. [Google Scholar] [CrossRef]
  23. Palvanov, A.; Cho, Y.I. Visnet: Deep convolutional neural networks for forecasting atmospheric visibility. Sensors 2019, 19, 1343. [Google Scholar] [CrossRef]
  24. Peláez-Rodríguez, C.; Pérez-Aracil, J.; Casanova-Mateo, C.; Salcedo-Sanz, S. Efficient prediction of fog-related low-visibility events with Machine Learning and evolutionary algorithms. Atmos. Res. 2023, 295, 106991. [Google Scholar] [CrossRef]
  25. Wang, L.; Lu, H.; Qu, G.; Ren, L.; Xu, Z.; Liu, G.; Yan, M.; Liu, Z. Cross-physical field prediction method for smoke field distribution in commercial building fire based on distributed optical fiber sensor. J. Build. Eng. 2024, 87, 109027. [Google Scholar] [CrossRef]
  26. Available online: https://dubaiairports.ae (accessed on 24 June 2025).
  27. Available online: https://www.aaco.org (accessed on 24 June 2025).
  28. Jiang, N.; Yin, S.; Guo, Y.; Li, J.; Kang, P.; Zhang, R.; Tang, X. Characteristics of mass concentration, chemical composition, source apportionment of PM2.5 and PM10 and health risk assessment in the emerging megacity in China. Atmos. Pollut. Res. 2018, 9, 309–321. [Google Scholar] [CrossRef]
  29. Du, Y.; Gao, B.; Zhou, H.; Ju, X.; Hao, H.; Yin, S. Health risk assessment of heavy metals in road dusts in urban parks of Beijing, China. Procedia Environ. Sci. 2013, 18, 299–309. [Google Scholar] [CrossRef]
  30. Nazzal, Y.; Orm, N.B.; Barbulescu, A.; Howari, F.; Sharma, M.; Badawi, A.E.; Al-Taani, A.A.; Iqbal, J.; Ktaibi, F.E.; Xavier, C.M.; et al. Study of atmospheric pollution and health risk assessment: A case study for the Sharjah and Ajman Emirates (UAE). Atmosphere 2021, 12, 1442. [Google Scholar] [CrossRef]
  31. Agency for Toxic Substances and Disease Registry (ATSDR). Guidance for Calculating Benzo(a)pyrene Equivalents for Cancer Evaluations of Polycyclic Aromatic Hydrocarbons; Agency for Toxic Substances and Disease Registry (ATSDR): Atlanta, GA, USA, 2022. [Google Scholar]
  32. Shen, H.; Tao, S.; Liu, J.; Huang, Y.; Chen, H.; Li, W.; Zhang, Y.; Chen, Y.; Su, S.; Lin, N.; et al. Global lung cancer risk from PAH exposure highly depends on emission sources and individual susceptibility. Sci. Rep. 2014, 4, 6561. [Google Scholar] [CrossRef]
  33. Alghamdi, M.A.; Hassan, S.K.; Alzahrani, N.A.; Al Sharif, M.Y.; Khoder, M.I. Classroom dust-bound polycyclic aromatic hydrocarbons in Jeddah primary schools, Saudi Arabia: Level, characteristics and health risk assessment. Int. J. Environ. Res. Public Health 2020, 17, 2779. [Google Scholar] [CrossRef]
  34. Jiang, R.; Xie, C.; Man, Z.; Afshari, A.; Che, S. LCZ method is more effective than traditional LUCC method in interpreting the relationship between urban landscape and atmospheric particles. Sci. Total Environ. 2023, 869, 161677. [Google Scholar] [CrossRef]
  35. World Health Organization. WHO Global Air Quality Guidelines: Particulate Matter (PM2.5 and PM10), Ozone, Nitrogen Dioxide, Sulfur Dioxide and Carbon Monoxide; World Health Organization: Geneva, Switzerland, 2021. [Google Scholar]
  36. MOCCE. UAE National Air Emissions Inventory Project Final Results; MOCCE: Lima, Peru, 2019. [Google Scholar]
  37. European Parliament and Council of the European Union. Directive 2008/50/EC of the European Parliament and of the Council of 21 May 2008 on ambient air quality and cleaner air for Europe. Off. J. Eur. Union 2008, L152, 1–44. [Google Scholar]
  38. Song, B.; Park, K.; Kim, T.; Seo, G. Analysis of spatiotemporal PM2.5 concentration patterns in Changwon, Korea, using low-cost PM2.5 sensors. Urban Clim. 2022, 46, 101292. [Google Scholar] [CrossRef]
  39. Dai, T.; Dai, Q.; Yin, J.; Chen, J.; Liu, B.; Bi, X.; Wu, J.; Zhang, Y.; Feng, Y. Spatial source apportionment of airborne coarse particulate matter using PMF-Bayesian receptor model. Sci. Total Environ. 2024, 917, 170235. [Google Scholar] [CrossRef] [PubMed]
  40. Pültz, J.; Banzhaf, S.; Thürkow, M.; Kranenburg, R.; Schaap, M. Source attribution of particulate matter in Berlin. Atmos. Environ. 2023, 292, 119416. [Google Scholar] [CrossRef]
  41. Alsanad, A.; Alolayan, M. Heavy metals in road-deposited sediments and pollution indices for different land activities. Environ. Nanotechnol. Monit. Manag. 2020, 14, 100374. [Google Scholar] [CrossRef]
  42. Ma, J.; Singhirunnusorn, W. Distribution and health risk assessment of heavy metals in surface dusts of Maha Sarakham municipality. Procedia-Soc. Behav. Sci. 2012, 50, 280–293. [Google Scholar] [CrossRef]
  43. Kamani, H.; Ashrafi, S.D.; Isazadeh, S.; Jaafari, J.; Hoseini, M.; Mostafapour, F.K.; Bazrafshan, E.; Nazmara, S.; Mahvi, A.H. Heavy metal contamination in street dusts with various land uses in Zahedan, Iran. Bull. Environ. Contam. Toxicol. 2015, 94, 382–386. [Google Scholar] [CrossRef]
  44. Trujillo-González, J.M.; Torres-Mora, M.A.; Keesstra, S.; Brevik, E.C.; Jiménez-Ballesta, R. Heavy metal accumulation related to population density in road dust samples taken from urban sites under different land uses. Sci. Total Environ. 2016, 553, 636–642. [Google Scholar] [CrossRef]
  45. Martínez, L.; Poleto, C. Assessment of diffuse pollution associated with metals in urban sediments using the geoaccumulation index (I). J. Soils Sediments Prot. Risk Assess. Remediat. 2014, 14, 1251–1257. [Google Scholar] [CrossRef]
  46. Chen, H.; Wu, D.; Wang, Q.; Fang, L.; Wang, Y.; Zhan, C.; Zhang, J.; Zhang, S.; Cao, J.; Qi, S.; et al. The predominant sources of heavy metals in different types of fugitive dust determined by PCA and PMF modeling in Southeast Hubei. Int. J. Environ. Res. Public Health 2022, 19, 13227. [Google Scholar] [CrossRef]
  47. Saeedi, M.; Li, L.Y.; Salmanzadeh, M. Heavy metals and polycyclic aromatic hydrocarbons: Pollution and ecological risk assessment in street dust of Tehran. J. Hazard. Mater. 2012, 227–228, 9–17. [Google Scholar] [CrossRef]
  48. Soltani, N.; Keshavarzi, B.; Moore, F.; Tavakol, T.; Lahijanzadeh, A.R.; Jaafarzadeh, N.; Kermani, M. Ecological and human health hazards of heavy metals and PAHs in road dust of Isfahan metropolis, Iran. Sci. Total Environ. 2015, 505, 712–723. [Google Scholar] [CrossRef]
  49. Al-Hemoud, A.; Al-Dousari, A.; Al-Dashti, H.; Petrov, P.; Al-Saleh, A.; Al-Khafaji, S.; Behbehani, W.; Li, J.; Koutrakis, P. Sand and dust storm trajectories from Iraq Mesopotamian flood plain to Kuwait. Sci. Total Environ. 2020, 710, 136291. [Google Scholar] [CrossRef] [PubMed]
  50. Abdulaziz, M.; Alshehri, A.; Yadav, I.C. Pollution level and health risk assessment of heavy metals in ambient air and surface dust from Saudi Arabia: A systematic review and meta-analysis. Air Qual. Atmos. Health 2022, 15, 799–810. [Google Scholar] [CrossRef]
  51. Sah, D.; Verma, P.K.; Kandikonda, M.K.; Lakhani, A. Pollution characteristics, human health risk through multiple exposure pathways, and source apportionment of heavy metals in PM10 at Indo-Gangetic site. Urban Clim. 2019, 27, 149–162. [Google Scholar] [CrossRef]
  52. Wei, X.; Ding, C.; Chen, C.; Zhu, L.; Zhang, G.; Sun, Y. Environmental impact and probabilistic health risks of PAHs in dusts surrounding an iron and steel enterprise. Sci. Rep. 2021, 11, 6749. [Google Scholar]
  53. Wang, W.V.; Lung, S.C.; Liu, C.H. Application of machine learning for the in-field correction of a PM2.5 low-cost sensor network. Sensors 2020, 20, 5002. [Google Scholar] [CrossRef]
  54. Zhang, H.; Zhang, S.; Pan, W.; Long, Z. Low-cost sensor system for monitoring the oil mist concentration in a workshop. Environ. Sci. Pollut. Res. Int. 2021, 28, 14943–14956. [Google Scholar] [CrossRef]
  55. Marzban, C.; Leyton, S.; Colman, B. Ceiling and visibility forecasts via neural networks. Weather. Forecast. 2007, 22, 466–479. [Google Scholar] [CrossRef]
  56. Ortega, L.C.; Otero, L.D.; Solomon, M.; Otero, C.E.; Fabregas, A. Deep learning models for visibility forecasting using climatological data. Int. J. Forecast. 2023, 39, 992–1004. [Google Scholar] [CrossRef]
  57. AlKheder, S.; AlKandari, A. The impact of dust on Kuwait International Airport operations: A case study. Int. J. Environ. Sci. Technol. 2020, 17, 3467–3474. [Google Scholar] [CrossRef]
  58. Gohel, H. Conscious study of impact of dust storm on aviation and airport management. J. Manag. Res. Anal. 2016, 4. [Google Scholar]
Figure 1. Location of the AUH (left) and DXB (right) monitoring sites.
Sustainability 17 06581 g001
Figure 2. Comparison of annual PM2.5 (A) and PM10 (B) concentrations against WHO standards.
Sustainability 17 06581 g002
Figure 3. Carcinogenic risk values for PM10 heavy metals in AUH for 2016 (A) and 2017 (B).
Sustainability 17 06581 g003
Figure 4. Carcinogenic risk values for PM10 heavy metals in DXB for 2016 (A) and 2017 (B).
Sustainability 17 06581 g004
Figure 5. Carcinogenic risk values for PM2.5 heavy metals in AUH for 2016 (A) and 2017 (B).
Sustainability 17 06581 g005
Figure 6. Carcinogenic risk values for PM2.5 heavy metals in DXB for 2016 (A) and 2017 (B).
Sustainability 17 06581 g006
Figure 7. Correlation matrix of 7 independent variables including PM1, PM2.5, PM10, TSP, WS, air pressure, and air temperature (which are numbered 0 through 6 respectively).
Sustainability 17 06581 g007
Figure 8. Linear regression model: actual vs. predicted values of visibility.
Sustainability 17 06581 g008
Figure 9. MLP regressor model: actual vs. predicted values of visibility.
Sustainability 17 06581 g009
Figure 10. SVM-RBF model: actual vs. predicted values of visibility.
Sustainability 17 06581 g010
Figure 11. Feature importance ranking for visibility prediction using random forest.
Sustainability 17 06581 g011
Table 1. Annual PM2.5 and PM10 heavy metal concentrations for Dubai and Abu Dhabi in 2016 and 2017 (mg/kg).
Location Year Cd Cr Cu Ni Pb Zn [mg/kg]
DXB20160.391.903.148.4418.3140.85PM2.5
AUH20160.651.672.998.1019.9344.26
DXB20170.191.693.114.0322.358.10
AUH20170.431.533.494.8720.038.31
DXB20160.382.695.999.5318.0655.43PM10
AUH20160.362.604.588.7320.3848.73
DXB20170.762.766.526.4030.0214.97
AUH20170.112.488.415.0526.8411.48
Table 2. Correlations between heavy metals and PM10 levels, PM 2.5 levels, temperature and wind speed.
PM10 ug/m3PM2.5 ug/m3Temp (°C)Wind Speed (m/s)
Correlation coefficient with heavy metals−0.30.14−0.57−0.2
p-value0.650.310.040.5
Table 3. Hazard index values for PM2.5 and PM10 in DXB and AUH for 2016 and 2017.
Hazard Index (HI)
20162017
DermalIngestionInhalationDermalIngestionInhalation
PM2.5DXB0.008640.02704.10 × 10−60.005540.02664.03 × 10−6
AUH0.01150.05778.70 × 10−60.006470.02263.42 × 10−6
PM10DXB0.01260.05738.67 × 10−60.008930.03966.00 × 10−6
AUH0.01260.05658.57 × 10−60.006240.02924.43 × 10−6
EPA’s acceptable limit: HI < 1.
Table 4. Input model parameters such as PM1, PM2.5, PM10, total suspended solids, wind speed, pressure and temperature for each month for two years (2016 and 2017) collected from Aeroqual stations.
2016MonthPM1 (µg/m3)PM2.5 (µg/m3)PM10 (µg/m3)TSP (µg/m3)WS (m/s)PRESS (hPa)AIR T (°C)
147.89763.96781.98982.7821.7451013.63720.538
231.40840.28448.76149.1121.4941013.57821.075
328.85647.33160.76261.4071.8621009.24124.250
426.91440.58751.94352.9281.9551006.65626.694
531.56954.40971.56074.1771.9311001.01432.193
639.79271.494160.333164.8311.942996.64734.024
745.74275.995166.238172.3451.986993.31036.153
844.71170.024154.687161.4241.622995.69737.256
941.48754.649114.058117.3251.710999.98833.793
1043.21454.183111.854114.6001.4081006.28530.522
1144.16555.523115.044117.1421.6371011.55926.469
1238.58750.487104.066106.1941.4841013.12023.243
Average38.69556.578103.441106.1891.7311005.06128.851
2017133.13245.42796.86998.7101.8661012.27621.678
233.89756.798123.633125.818NANANA
335.09457.233124.779128.0881.9141008.64524.731
437.36756.118121.867125.3331.6231005.58729.858
533.98853.292114.014117.4981.8111001.63732.729
632.32244.58792.54994.3871.643995.01635.243
746.86363.737131.422134.8041.695993.24737.724
831.04443.94591.42393.9731.649995.44137.037
945.96453.399106.968108.9521.4201000.94134.481
1032.64939.21178.46880.0551.3311005.65231.354
1123.84828.84058.24660.1521.5461010.78326.770
1230.59637.66676.62479.4641.5081015.18122.237
Average34.73048.354101.405103.9361.6371004.03730.349
Disclaimer/Publisher’s Note: The statements, opinions and data contained in all publications are solely those of the individual author(s) and contributor(s) and not of MDPI and/or the editor(s). MDPI and/or the editor(s) disclaim responsibility for any injury to people or property resulting from any ideas, methods, instructions or products referred to in the content.

