Abstract
In recent years, there has been a growing interest in the frictional anisotropy of snake scale-inspired surfaces, especially its potential applications in enhancing the bearing capacity of foundations (piles, anchor elements, and suction caissons) and reducing materials consumption and installation energy. This study first investigated the frictional properties and surface morphologies of the ventral scales of Cantor’s rat snakes (Ptyas dhumnades). Based on the findings on the snake scales, a novel snakeskin-inspired geosynthetic reinforcement (SIGR) is developed using 3D-printed polylactic acid (PLA). A series of pullout tests under different normal loads (25 kPa, 50 kPa, and 75 kPa) were performed to analyze the pullout behavior of SIGR in sandy soil. Soil deformation and shear band thickness were measured using Particle Image Velocimetry (PIV). The results revealed that the ventral scales of Ptyas dhumnades have distinct thorn-like micro-protrusions pointing towards the tail, which exhibit frictional anisotropy. A SIGR with a unilateral (one-sided) layout scales (each scale 1 mm in height and 12 mm in length) could increase the peak pullout force relative to a smooth-surface reinforcement by 29% to 67%. Moreover, the peak pullout force in the cranial direction (soil moving against the scales) was found to be 13% to 20% greater than that in the caudal direction (soil moving along the scales). The pullout resistance, cohesion, and friction angle of SIGR all showed significant anisotropy. The soil deformation around the SIGR during pullout was more pronounced than that observed with smooth-surface reinforcement, which suggests that SIGR can mobilize a larger volume of soil to resist external loads. This study demonstrates that SIGR is able to enhance the pullout resistance of reinforcements, thereby improving the stability of reinforced soil structures, reducing materials and energy consumption, and is important for the sustainability of geotechnical engineering.
1. Introduction
Bioinspiration has garnered increasing attention in geotechnical applications in recent years, which can be called bio-inspired geotechnics [1]. Current research in bio-inspired geotechnics primarily focuses on three areas: developing bio-inspired subterranean robots [2,3,4,5,6,7,8], enhancing load transfer performance at soil-structure interfaces [9,10,11,12,13,14,15,16,17], and improving the anchoring performance of anchorage systems [18,19,20,21,22,23]. Among these, enhancing load transfer performance at soil-structure interfaces is the most extensively studied field, with some field application explorations already underway [24]. The load transfer mechanism at soil-structure interfaces is a fundamental aspect for many geotechnical problems [25]. Interface roughness is a key parameter that influences the efficiency of load transfer and governs the failure mechanisms at the interface [26,27]. The ventral scales of snakes, the dental morphology of mammals, and the edge shapes of certain tree leaves serve as valuable sources for the inspiration of designing and developing contact surfaces of load transfer systems [1,28]. Specifically, the asymmetric profile of ventral scales located along the underbelly of snakes has attracted great attention from researchers due to their simplicity and effectiveness [24,28,29,30,31]. Artificial surfaces inspired by these scales exhibit great anisotropy in peak and residual strengths and dilation angles in the monotonic and cyclic interface shear tests [14]. In monotonic interface shear tests, snake scale-inspired surfaces mobilized greater peak and residual strengths as well as dilation angles in the cranial direction (soil moving against the scales) compared to those in the caudal direction (soil moving along the scales) [14]. In cyclic interface shear tests, a gradual reduction in the interface friction angle and the shear strength of the snake scale-inspired surfaces was observed with the number of cycles [15,32].
Snake-scale-inspired surfaces have been incorporated into the design of new types of piles, anchor elements, and suction caissons. Their effectiveness over traditional counterparts has been confirmed through laboratory experiments and field trials [9,16,24,29,30,31,33]. These studies have shown that snake scale-inspired surfaces hold significant potential for applications in friction-dependent interface structures and also contribute to the development of sustainable geotechnical engineering. For example, Martinez et al. [14] conducted centrifuge tests on snakeskin-inspired piles and observed that the skin friction mobilized in the cranial direction was between 560% to 845% greater than that of untextured piles, while also introducing beneficial anisotropy under cyclic loading. This may enhance the long-term serviceability of the piles and reduce materials consumption. Similarly, Li et al. [9] and Liang et al. [31] proposed scaled suction caissons (SSC) with snakeskin-inspired scales to reduce installation resistance and improve bearing capacity in dense siliceous sands. These studies revealed that the SSC has lower installation resistance and higher pullout capacity compared to the traditional suction caisson (TSC). Furthermore, SSC can reduce construction period and installation energy consumption, and prevent marine pollution.
Despite these advances, existing research has largely focused on snake-skin-inspired surfaces and cylindrical elements. However, planar geosynthetic reinforcements, which are widely used in slopes, retaining walls, and foundations, rely on pullout resistance and frictional engagement under confined conditions [34,35]. The friction at the interface between the reinforcement and soil effectively limits the lateral movement of soil. Therefore, enhancing the frictional interaction at the reinforcement-soil interface is crucial for improving the load capacity and overall stability of reinforced soil structures [36,37]. Numerous laboratory experiments have been conducted to investigate the interface shear and pullout properties of traditional reinforcements in past studies [38,39,40,41]. With increasing emphasis on sustainable development and resource-efficient infrastructure, the design of planar geosynthetic reinforcements must not only focus on mechanical performance but also on environmental compatibility and long-term durability. Adding the snakeskin-inspired scales to reinforcements may enhance their pullout performance and interface strength, while also reducing materials consumption. However, there are fewer published studies on how to apply the snakeskin-inspired scales geometry to planar geosynthetic reinforcements to enhance their pullout performance and interface strength.
This study utilized a suite of advanced techniques, including friction-wear testing, 3D profilometry, scanning electron microscopy (SEM), and atomic force microscopy (AFM), to characterize the frictional properties and surface morphologies of the ventral scales of Cantor’s rat snake (Ptyas dhumnades). These comprehensive analyses have shed light on the frictional anisotropy of snake ventral scales. Based on these findings, a novel snakeskin-inspired geosynthetic reinforcement (SIGR) was developed by abstracting the snake scale pattern onto the surface of planar geosynthetic reinforcements, which are commonly used in reinforced soil structures like retaining walls and embankments. To elucidate the pullout behavior of the SIGR and its interface shear properties with sandy soil, a series of pullout tests were conducted under varying normal loads (25 kPa, 50 kPa, and 75 kPa). These tests aimed to assess the impact of pullout direction, scale layout, scale height, and scale length on the performance of the SIGR. Particle Image Velocimetry (PIV) was employed to visualize soil deformation and the development of shear bands during the pullout process.
2. Tribological Properties and Surface Topography of Snake Ventral Scales
2.1. Snake Ventral Specimens
Specimens of the ventral scales were sourced from the Cantor’s rat snake (Ptyas dhumnades), a species commonly found in the plains, hilly regions, and low mountainous areas of China. The specimens of the ventral scales were purchased from. These ventral scales enable the snake to move swiftly and effortlessly across diverse terrains [42]. The pretreatment procedures included the following steps:
- A small, undamaged section of ventral scales with a smooth surface was carefully selected from the intact ventral region of the snake;
- The detached ventral scales were first rinsed with a saline solution to remove large impurities from their surface;
- The scales were then submerged in an ultrasonic cleaner to remove any fine impurities;
- Finally, the scales were left to air dry naturally before testing, as shown in Figure 1.
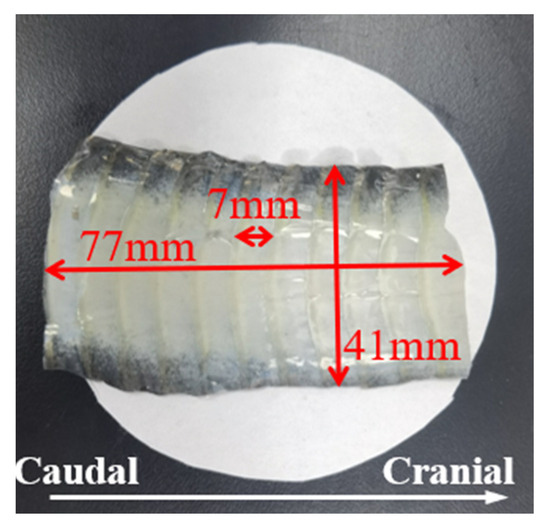 Figure 1. Processed snake ventral specimen of Ptyas dhumnades.
The analysis of the pretreated snake ventral scales revealed a pattern where each scale overlapped with the next one and showed a slight upward curvature towards the tail. The total length of the snake’s belly scale sample was 77 mm, with an individual scale length of around 7 mm and a width of around 41 mm (Figure 1).
2.2. Methods to Assess Tribological Properties and Surface Topography
2.2.1. Friction Measurements
The frictional properties of the snake ventral specimen were assessed using a UMT-3 tribometer. Along the direction of the frictional motion, the snake’s ventral specimen was secured to a metal sample holder using a low-tack double-sided tape. Control tests confirmed no slippage between the tape and holder under applied loads. A 4 mm stainless steel ball was used as the counter-face to simulate the interaction against the ventral scales. Normal loads of 1–2 N, determined through preliminary trials to balance measurement sensitivity and scale integrity, were applied to the specimen with specific forces of 1 N, 1.5 N, and 2 N under tribometer oscillation at 0.5 Hz [43]. Considering that each scale was approximately 7 mm in length, a reciprocating travel distance of 20 mm was set to ensure that the friction surface engaged with three scales throughout the motion. The duration of each test was 60 s.
2.2.2. Surface Profiles
The surface morphologies of the snake ventral specimen were examined using an OLS5000 laser confocal microscope from Olympus Corporation Ltd., Tokyo, Japan. The area designated for scanning was 16,000 μm by 2400 μm, which exceeded the maximum scanning area of the microscope (2400 μm by 2400 μm) [44]. Therefore, it was necessary to divide the entire observation area into several smaller sub-regions for individual scanning, followed by image stitching to reconstruct the full image. Once this process was completed, the elevation data along the longitudinal axis of the specimen were extracted using a measurement software integrated in the microscope. This could profile the contour curve of the scale specimen.
2.2.3. Microscopic Topography
The microscopic analysis was conducted using both scanning electron microscopy (SEM) and atomic force microscopy (AFM) [45]. The 2D microstructure of the snakeskin was observed with the SEM Regulus8100 from Hitachi High-Technologies Corporation, Tokyo, Japan. To further elucidate the 3D microstructure, a Dimension Icon atomic force microscope from BRUKER Ltd., Billerica, MA, USA, was employed. The AFM was utilized in tapping mode to capture the microstructure of the specimen. A silicon nitride probe was used with a force constant of 0.12 N/m, a normal load of 10 nN, and a scan range of 7.5 μm × 7.5 μm × 500 nm. The AFM scans were performed at a scan rate of 1 Hz and under room conditions (temperature 24 °C, relative humidity 41%).
2.3. Results of Frictional Properties and Surface Topography
Figure 2 illustrates the friction coefficient (μ) and the average friction coefficient of the snake ventral specimen under different normal loads of 1 N, 1.5 N, and 2 N in the cranial direction. Due to the undulating nature of the snake scales, μ exhibited significant variations under different normal forces, as shown in Figure 2a–c. The friction coefficient against the scales (μcranial) was consistently higher than the friction coefficient along the scales (μcaudal) across all normal loads, as depicted in Figure 2d. This disparity was attributed to the arrangement and protrusion of the scales from head to tail, which creates greater contact resistance and a more pronounced frictional effect with the friction surface. As the normal load increased, both μcranial and μcaudal showed a slight decrease, as indicated in Figure 2d. However, the ratio of μcranial to μcaudal increased with the load, indicating that the snake ventral scales exhibit enhanced frictional anisotropy under higher loads [45].
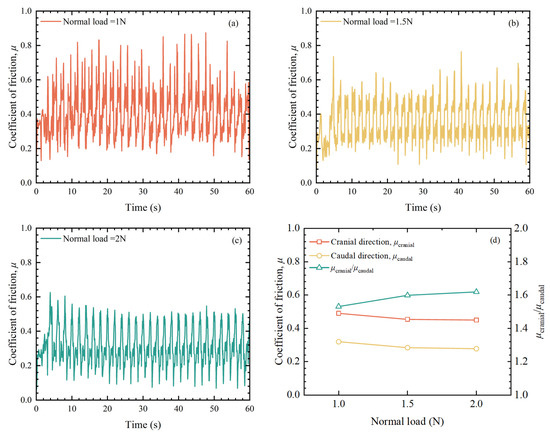
Figure 2.
Friction coefficient (μ) of the snake ventral specimen under different normal loads: (a) 1 N (cranial direction); (b) 1.5 N (cranial direction); (c) 2 N (cranial direction); (d) Average friction coefficient.
Figure 3 displays the surface profiles of the snake ventral specimen. It reveals an orderly undulation of the snake’s ventral scales in cross-section. The cross-sectional elevation at the beginning of each scale was approximately 120 μm, while at the end of each scale, it was around 300 μm (Figure 3c). The cross-sectional elevation at the endpoint was approximately 180 μm higher than at the starting point. It was the difference that contributed significantly to the macroscopic frictional anisotropy observed in the snake ventral scales [28].
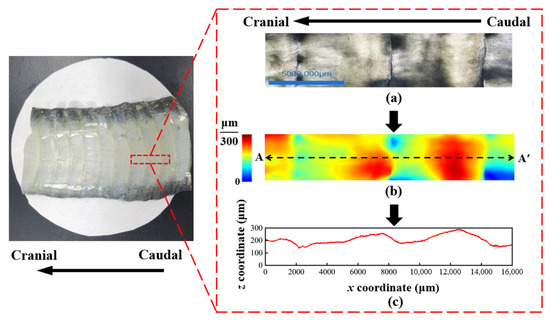
Figure 3.
Surface of snake ventral specimen: (a) Scanned Zone; (b) Surface elevation; (c) Elevation of A–A′.
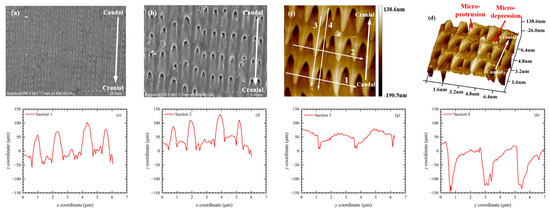
Figure 4 shows the findings from the snake ventral specimen in the SEM and AFM tests. The ventral scales of the snake were composed of uniformly arranged micro-protrusions, as seen in Figure 4a–d. These micro-protrusions exhibited a thorn-like morphology. They were symmetrical in the transversal direction but asymmetrical in the longitudinal direction. The tips of each row of distinct micro-protrusions consistently pointed towards the tail direction. By using the AFM image analysis software Nanoscope Analysis v3.0 [46], we extracted cross-sectional elevation profiles along the directions marked 1 to 4 in Figure 4c, as depicted in Figure 4e–h. The longitudinal cranial elevations of the micro-protrusions and micro-depressions varied, with the elevation in the caudal region being higher than that in the cranial region.
3. Design and Materials of the Snakeskin-Inspired Geosynthetic Reinforcement
3.1. Design Model
Figure 2, Figure 3 and Figure 4 reveal that the cross-section of the ventral scales of Ptyas dhumnades has a wedge-shaped profile, with the head end lower than the tail end. Consequently, the cross-section of the pullout direction for the SIGR was simplified to uniformly arranged right-angled triangular scales [12,14,16,25,32]. The height and length of each scale are denoted by H and L, respectively.
The SIGR used in the pullout test had a total length of 260 mm, which included a 144-mm segment featuring snakeskin-inspired scales, a 36-mm smooth drawing segment, and an 80-mm clamping segment (Figure 5). The width of the reinforcement was 246 mm, which was slightly narrower than the pullout box, which ensured that the reinforcement did not come into direct contact with the sidewalls during pullout. This design minimized the sidewall effect on the test and ensured that the particle image velocimetry (PIV) could accurately capture the displacement of sand particles during the pullout process of the SIGR [47,48,49]. The reinforcement featured two distinct layouts of snakeskin-inspired scales, that is, a unilateral (one-sided) layout and a bilateral (two-sided) layout.
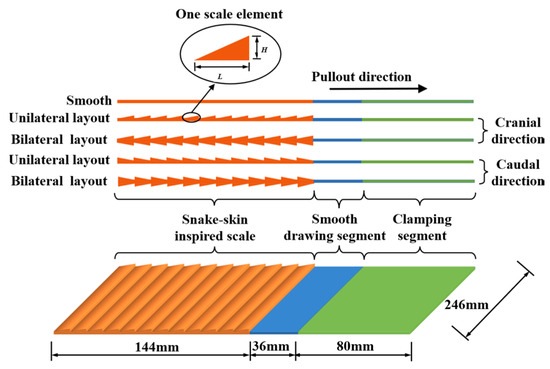
Figure 5.
Design model of snakeskin-inspired geosynthetic reinforcement.
3.2. Selection of 3D Printing Materials
The SIGR used in the pullout tests was fabricated via 3D printing. The tensile strength of the printing material is a critical factor influencing the reinforcing effect of the reinforcements. Tensile tests were conducted per ASTM D638 to select the most suitable material. Three materials were tested: polylactic acid (PLA), resin, and thermoplastic urethane (TPU). Dumbbell-shaped specimens with a thickness of 4 mm were used for testing (Figure 6a) [50]. The tensile region measured 50 mm in length and 10 mm in width, and the total specimen dimensions were 170 mm in length and 20 mm in width. The tensile tests were conducted on a Computer Control Electronic Universal Testing Machine (ETM105D, WE-TESTLAB) at a stretching rate of 1 mm/min.
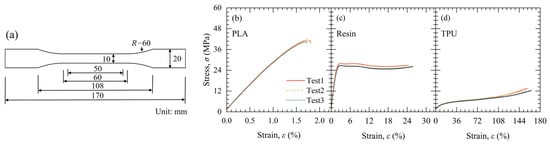
Figure 6.
Tensile test results of 3D printed materials: (a) Tensile test specimen; (b) PLA; (c) Resin; (d) TPU.
Figure 6b–d displays the tensile stress-strain curves for the three printing materials. The tensile stress-strain curve of PLA rose rapidly to its peak under small strain, followed by immediate rupture (Figure 6b). The curve of Resin increased linearly to the peak, with minimal stress fluctuations before rupture under larger strain (Figure 6c). In contrast, the stress of TPU gradually increased with strain and reached its peak at a large strain (Figure 6d). This indicates that TPU underwent extensive deformation and progressive hardening during the tensile loading.
The peak tensile strength of PLA was 41.06 MPa, with a corresponding elongation at break of only 1.78%. It suggests that PLA can quickly and effectively deliver its tensile performance under load. The peak tensile strengths of Resin and TPU were 27.15 MPa and 12.47 MPa, respectively, with elongations at break of 25.37% and 158.83%. These results imply that Resin and TPU experience considerable deformation during the tensile process and do not fully exhibit their tensile performance at relatively small deformations. Based on these findings, PLA was selected for the subsequent experiments.
4. Pullout Tests of the Snakeskin-Inspired Geosynthetic Reinforcement
4.1. Materials and Methods
4.1.1. Testing Soils
Fujian sand was used in the experimental study. The physical properties of the sand are detailed in Table 1, and the particle size distribution is depicted in Figure 7. The relative density Dr = 80% was selected to represent a dense sand condition typically found in compacted backfill for reinforced soil structures.

Table 1.
Fujian sand properties.
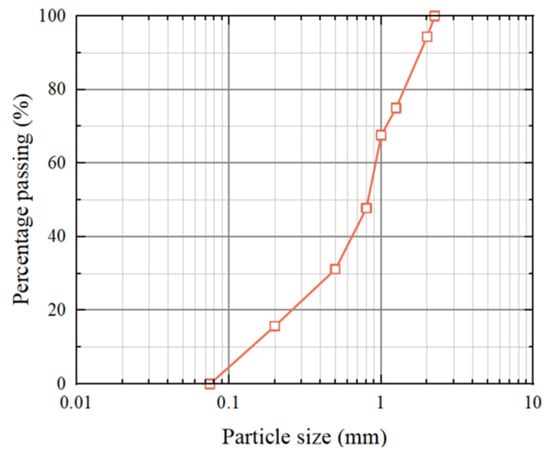
Figure 7.
Particle size distribution of Fujian sand.
4.1.2. Snakeskin-Inspired Surface of SIGR
As shown in Table 2, this research involved the testing of eight SIGRs with snake-skin-inspired surfaces and one reinforcement with a smooth surface. The average surface roughness Ra is defined as the arithmetic mean of the heights of all surface scales. According to the calculation method of Zheng et al. [51], Ra is H/2 and H in unilateral layout SIGR and bilateral layout SIGR without considering the thickness of SIGR, respectively. All SIGRs were fabricated using the G450 printer from MIRACLE 3D, Suzhou, Jiangsu, China. The nozzle of the 3D-printer extrudes molten PLA in layers, which then cool and solidify at a temperature of 50 °C. Each SIGR was created with a 3D-printed layer thickness of 0.2 mm. The surface roughness Ra of 3D-printed PLA with a 0.2 mm layer thickness is generally 8–20 μm, which is much smaller than the scale height H of SIGR (0.5–3 mm). Therefore, the impact of the additional surface roughness from the 3D printed PLA material on the results was disregarded in this study. The PLA used has a specific gravity of 1.3, a Young’s modulus of 3.5 GPa, an ultimate tensile strength of 41.06 MPa, and a Rockwell hardness of R90.3 [52].
Table 2.
Surface of the snakeskin-inspired geosynthetic reinforcements.
The height of the scales, H, varied from 0.50 to 3.00 mm. The length L ranged from 6.00 to 24.00 mm. The scale geometry ratio (L/H) ranged from 4 to 24. This range of L/H was lower than that reported in Martinez et al. [14]. Pullout tests were conducted on reinforcements with varying H, L, and layout types to investigate the impact of scale geometry on the pullout behavior and frictional anisotropy.
4.1.3. Test Apparatus
The pullout test was conducted using a displacement-controlled pullout apparatus designed to pull out reinforcements at a uniform rate, as depicted in Figure 8. The apparatus comprised a transparent pullout box, a horizontal displacement system, a vertical loading system, a clamp, a load cell, an automated data acquisition system, and a potentiometer [36,37].
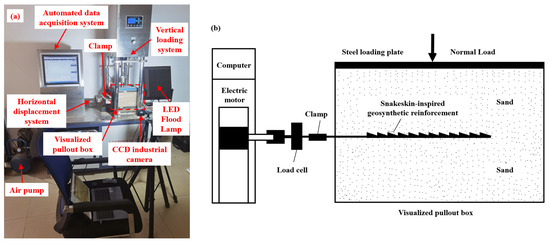
Figure 8.
Pullout test of the snakeskin-inspired geosynthetic reinforcement: (a) Setup; (b) Schematic diagram.
The transparent pullout box was made of Plexiglass reinforced with a steel frame. Its internal dimensions were 300 mm in length, 250 mm in width, and 200 mm in height. The front wall featured a 290 mm × 170 mm visualization window for capturing the images of the sand deformation as the SIGR is pulled out, which were later used for Particle Image Velocimetry (PIV) analysis. A slot of 5 mm in height and 230 mm in width was located at the middle of the front wall of the box to allow the SIGR to be pulled through.
The horizontal movement was driven by an electric motor, and the vertical load was applied using a pneumatic system. The clamp was used to secure the SIGR in place and facilitate its pullout. The load cell and potentiometer recorded the pullout load and displacement of the SIGR during the test, respectively. The tensile end of the potentiometer was attached to the clamp. An automated data acquisition system was employed to gather data from both the potentiometer and the load cell. All instruments were calibrated prior to testing.
4.1.4. Pullout Test
Pullout tests were performed on dry sand specimens with a relative density of 80%, prepared using a layer-wise filling method. The SIGR was placed on the surface of the sand sample after two layers had been filled, followed by the placement of the remaining two layers. During the pullout test, the SIGR was pulled out either in the cranial direction (against the scales) or the caudal direction (along the scales) under different constant normal loads (σn = 25 kPa, 50 kPa, and 75 kPa), as illustrated in Figure 5. The selected normal stress values of σn = 25 kPa, 50 kPa, and 75 kPa are representative of typical overburden pressures encountered in shallow geotechnical structures, such as retaining walls and embankments. A total of 51 pullout tests were carried out.
Preliminary tests confirmed that PLA was suitable for the pullout tests, as it did not experience significant damage under σn ranging from 25 kPa to 75 kPa. The pullout tests were conducted at a constant horizontal displacement rate of 1 mm/min until a displacement of 20 mm was reached.
To verify the reliability of the test setup, separate pullout tests were conducted using Type #2 in Table 2 in both the cranial and caudal directions under a normal stress of 50 kPa. Each test was repeated three times for each direction. The force-displacement curves for Type #2 surface are presented in Figure 9. The variations were found to be within acceptable limits (<5%), indicating that the test apparatus is highly reliable.
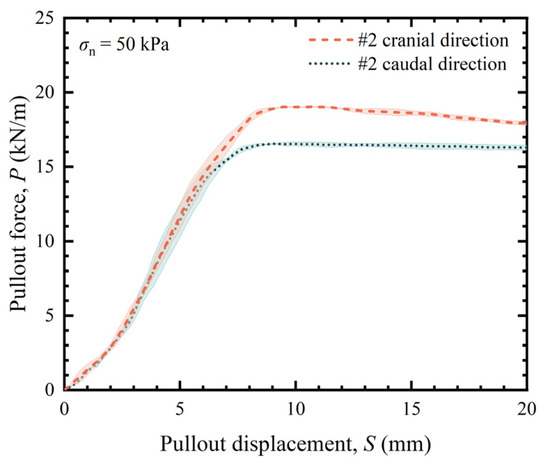
Figure 9.
Pullout force–pullout displacement curve of repeated pullout test on #2 in both the cranial and caudal directions.
4.1.5. Particle Image Velocimetry
The Particle Image Velocimetry (PIV) was employed to capture the deformation between the SIGRS and the soil during the pullout process. A grid of black dots, spaced at 50 mm intervals, was marked on the visualization window for PIV analysis, as shown in Figure 10.
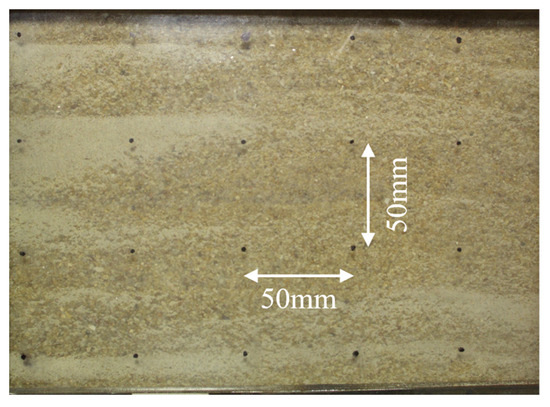
Figure 10.
The equally spaced markings on the surface of the visualization window used for PIV analysis.
PIV is a non-contact, particle-based deformation measurement technique that uses image processing and recognition technologies to capture displacement vectors and generate deformation data. The PIV software PIVview2C v2.4 was used for the analysis. The Speckle Displacement Mode was selected for speckle displacement analysis, with an analysis grid size of 24 px by 24 px and a step size of 16 px. In the image processing stage, the standard Fast Fourier Transform (FFT) algorithm and the least squares Gaussian peak fitting algorithm were applied. To address irregular peak data in the images, the Nyquist filter was used for filtering and correction. The area of the deformation zone and the thickness of the shear band in the soil surrounding the SIGR during the pull-out test were determined using an image post-processing software (Image J v1.53k) [53]. All photographs were taken with a CCD camera with a 12 mm lens (focal length). Images were captured every 3 s, which corresponds to 0.05 mm pullout displacement.
4.2. Results
4.2.1. Pullout Force-Displacement Behavior
The pullout force (P) of the SIGR was determined by dividing the measured horizontal pullout force by the width of the SIGR that was embedded in the soil:
where Td is the measured horizontal pullout force of SIGR, and B is the width of the SIGR buried in the soil.
Figure 11 displays the pullout force (P)—displacement (S) relationships for different layout types of SIGR under σn = 25 kPa, 50 kPa, and 75 kPa. The relationship between the peak pullout force (Pmax) and the layout types is given in Figure 12a. Both the unilateral and bilateral layouts had a scale length (L) of 12 mm and a height (H) of 1 mm. For a given H and L, the P increased with increasing normal loads. The P of SIGR was found to be greater than that of the reinforcements with a smooth surface. In both cranial and caudal pullout directions, the P gradually increased with pullout displacement, and then plateaued and experienced strain-softening (Figure 11a–f). The observed strain-softening behavior may be due to the breakdown of interlocking mechanisms between the soil particles and the scales on the SIGR surface. As the pullout progresses beyond Pmax, the mobilized interfacial shear zone undergoes dilation and particle rearrangement, which leads to a gradual reduction in pullout force. Notably, smooth-surface reinforcements reached Pmax at a smaller critical displacement Dc (approximately 7 mm), but the bilateral layout SIGR achieved Pmax at a larger Dc (around 12 mm). This finding suggests that SIGR provides higher pullout resistance over a broader displacement range. The mechanism behind this phenomenon is that during the pullout of SIGR with a bilateral layout, a larger number of sand particles near the SIGR surface are mobilized to participate in interface shear. This enhances interlocking among sand particles, as well as between the SIGR and sand particles [54].
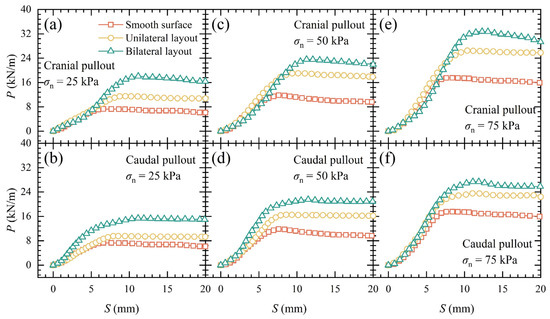
Figure 11.
Pullout force (P) versus displacement (S) curves and peak pullout force (Pmax) of SIGR with different scale layout types: (a) Cranial pullout under σn = 25 kPa; (b) Caudal pullout under σn = 25 kPa; (c) Cranial pullout under σn = 50 kPa; (d) Caudal pullout under σn = 50 kPa; (e) Cranial pullout under σn = 75 kPa; (f) Caudal pullout under σn = 75 kPa.
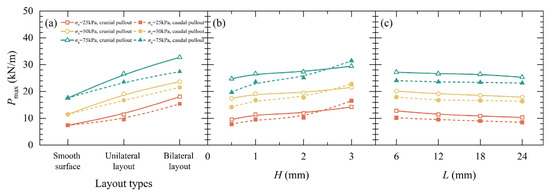
Figure 12.
Peak pullout force (Pmax) of SIGR: (a) layout types; (b) Scale height (H); (c) Scale length (L).
The P of the bilateral layout SIGR was greater than that of the unilateral layout SIGR. The Pmax in the cranial pullout direction was higher than that in the caudal pullout direction for both unilateral and bilateral conditions (Figure 12a), indicating significant frictional anisotropy [12,14,25]. This frictional anisotropy arose because sand particles slide more easily along the scale during caudal pullout, while resisting forward movement during cranial pullout [13,30].
Figure 13 displays the P–S curves for unilateral layout SIGR with a L of 12 mm and H ranging from 0.5 mm to 3 mm under σn = 25 kPa, 50 kPa, and 75 kPa. The relationship between Pmax and H is given in Figure 12b. The Dc increased with H, ranging from 7 mm to 13 mm. The Pmax increased with the increase in H, and a more significant rise was noted for the caudal pullout direction compared to the cranial pullout direction.
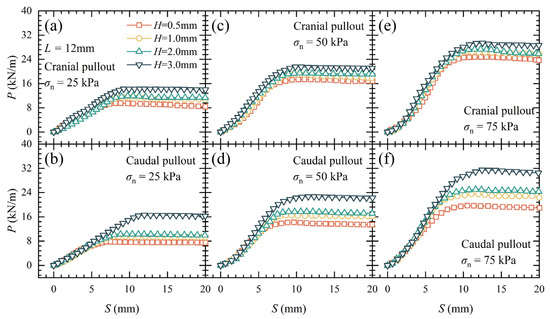
Figure 13.
Pullout force (P) versus displacement (S) curves and peak pullout force (Pmax) of SIGR with different scale height (H): (a) Cranial pullout under σn = 25 kPa; (b) Caudal pullout under σn = 25 kPa; (c) Cranial pullout under σn = 50 kPa; (d) Caudal pullout under σn = 50 kPa; (e) Cranial pullout under σn = 75 kPa; (f) Caudal pullout under σn = 75 kPa.
Under a σn of 50 kPa, increasing H from 0.5 mm to 3 mm raised the peak pullout force from 17.42 kN/m to 21.57 kN/m in the cranial direction (a 23.8% increase) and from 14.21 kN/m to 22.82 kN/m in the caudal direction (a 60.6% increase). This indicates that increasing H substantially enhanced the pullout resistance of the SIGR. Notably, for H between 0.5 mm and 2 mm, the peak pullout force in the cranial direction was greater than that in the caudal direction. However, at H = 3 mm, Pmax in the caudal direction exceeded that in the cranial direction. This reversal might be due to excessive sand particle disturbance caused by cranial pullout at H = 3 mm, which prevented the particles from realigning quickly to form a stable interlocking structure [55].
Figure 14 displays the P–S curves for unilateral layout SIGR with a H of 1 mm and L ranging from 6 mm to 24 mm under σn = 25 kPa, 50 kPa, and 75 kPa. The relationship between Pmax and the arrangement is given in Figure 12c. It is evident that changes in L had a minimal effect on the pullout force-displacement curve. There were only slight variations observed in P. The Dc decreased as L increased. The Pmax slightly decreased with the increase in L, with the overall reduction within 5% (Figure 12c).
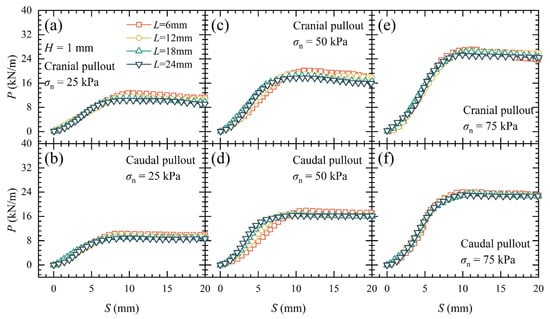
Figure 14.
Pullout force (P) versus displacement (S) curves and peak pullout force (Pmax) of SIGR with different scale length (L): (a) Cranial pullout under σn = 25 kPa; (b) Caudal pullout under σn = 25 kPa; (c) Cranial pullout under σn = 50 kPa; (d) Caudal pullout under σn = 50 kPa; (e) Cranial pullout under σn = 75 kPa; (f) Caudal pullout under σn = 75 kPa.
4.2.2. Interface Shear Strength Parameters of SIGR
The interface shear strength parameters between the soil and reinforcement are crucial for assessing the internal stability of reinforced soil structures. The interface shear stress (τ) is defined as in Equation (2) [36,37].
where Lp is the actual embedment length of the SIGR.
The interface shear strength (τf) and normal loads (σn) were correlated using the Mohr-Coulomb criterion to determine the interface strength parameters, which can be expressed as follows [36,37]:
where c is the cohesion of the interface between SIGR and soil, and φ is the friction angle of the interface between SIGR and soil.
Figure 15 illustrates the interface shear strength parameters of SIGR with different layout types under σn = 25 kPa, 50 kPa, and 75 kPa. For the unilateral layout and bilateral layout, L and H were 12 mm and 1 mm, respectively. Compared to the smooth surface, the SIGR exhibited significant increases in c and φ for both unilateral and bilateral scale arrangements, and for both cranial and caudal pullout conditions. These results indicate that the presence of scales significantly enhanced the interface shear strength between SIGR and soil. Moreover, the SIGR with bilateral layout further increased c compared to the SIGR with unilateral layout, though it slightly reduced φ.
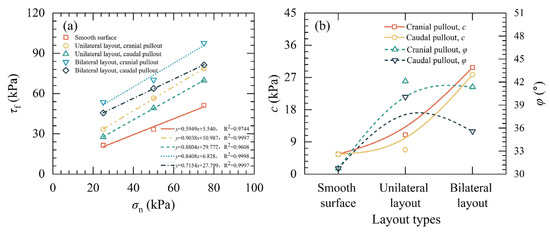
Figure 15.
Interface shear strength parameters of SIGR with different scale layout types: (a) Interface shear strength versus normal pressure curve; (b) Cohesion (c) and friction angle (φ).
Figure 16 displays the interface shear strength parameters of unilateral layout SIGR with a L of 12 mm and H ranging from 0.5 mm to 3 mm under σn = 25 kPa, 50 kPa, and 75 kPa. It is observed that c increased with the increase in H, regardless of pullout direction. During caudal pullout, there was a significant increase in c when H increased from 2 mm to 3 mm (from 7.52 kPa to 25.49 kPa). This increase can be explained by a shift in the soil–scale interaction mechanism. At lower H (0.5–2 mm), the caudal pullout is dominated by sliding along the scale inclination, with limited obstruction. However, at H = 3 mm, the scale becomes large enough to significantly disturb the adjacent soil, even in the caudal direction. The higher scales can induce localized compaction and vertical dilation, leading to the formation of passive resistance zones. These effects introduce substantial resistance against pullout and simulate a form of “passive confinement,” contributing to the apparent increase in c. During cranial pullout, H had minimal impact on φ. In contrast, during caudal pullout, φ increased with the increase in H (from 35.38° to 41.88° as H increased from 0.5 mm to 3 mm). These results highlight the crucial role of H in determining the interface strength between SIGR and soil.
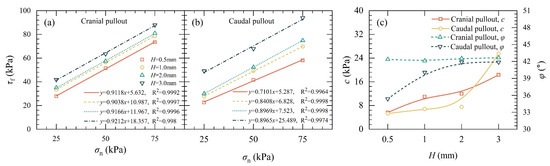
Figure 16.
Interface shear strength parameters of SIGR with different scale height (H): (a) Interface shear strength versus normal pressure curve on cranial pullout; (b) Interface shear strength versus normal pressure curve on caudal pullout; (c) Pseudo-cohesion (c) and friction angle (φ).
Figure 17 illustrates the interface shear strength parameters of unilateral layout SIGR with a H of 1 mm and L ranging from 6 mm to 24 mm under σn = 25 kPa, 50 kPa, and 75 kPa. It is evident that c decreased with increasing L in both cranial and caudal pullout directions. During cranial pullout, c decreased from 16.25 kPa to 8.20 kPa as L increased from 6 mm to 24 mm (a reduction of 49.5%). In caudal pullout, c dropped from 10.19 kPa to 3.69 kPa (a reduction of 63.8%) over the same increase in L. The reason for the decrease might be that longer scales created a smoother reinforcement profile and fewer scale-soil interaction points along the embedded length, which weakened local soil disturbance and reduced mechanical interlocking. In both directions, φ increased slightly with the increase in L, with a total increment of less than 5%.
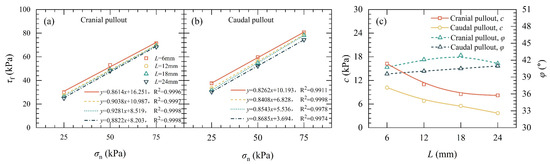
Figure 17.
Interface shear strength parameters of SIGR with different scale height (L): (a) Interface shear strength versus normal pressure curve on cranial pullout; (b) Interface shear strength versus normal pressure curve on caudal pullout; (c) Pseudo-cohesion (c) and friction angle (φ).
4.2.3. Apparent Anisotropic Friction Coefficient at the Interface Between SIGR and Soil
The apparent friction coefficient is a strength parameter that reflects the frictional interaction between SIGR and soil. The traditional friction coefficient is represented solely by the internal friction angle. The apparent friction coefficient (f*) is defined as the ratio of the interface shear strength to the corresponding normal pressure. This can be expressed as [37]:
The following coefficient was defined to quantitatively analyze the interfacial frictional anisotropy between SIGR and soil, as absolute differences may scale nonlinearly with load:
where μfa is the coefficient of friction anisotropy. is the apparent friction coefficient between SIGR and the soil for cranial pullout, and is the apparent friction coefficient between SIGR and the soil for caudal pullout.
Figure 18 displays the results of μfa for SIGR. The μfa of SIGR under all σn was greater than 1, indicating significant frictional anisotropy. Under lower normal loads (σn = 25 and 50 kPa), the frictional anisotropy of SIGR with a bilateral layout was less than that of SIGR with a unilateral layout (Figure 18a). However, under higher normal loads (σn = 75 and 100 kPa), the frictional anisotropy of SIGR with a bilateral layout was greater than that of SIGR with a unilateral layout. μfa of SIGR reduced with the increase of H, indicating that the scale height has a significant influence on the frictional anisotropy (Figure 18b). Under the same normal loads, μfa varied by less than 5% with changes in L (Figure 18c), indicating that the effect of scale length on the frictional anisotropy of SIGR was relatively moderate. When σn > 25 kPa, the variation of μfa with σn became minor under a given H and L. This indicates that when the layout of the scales remains unchanged, there seems to be a critical normal load at which the frictional anisotropy no longer changes.
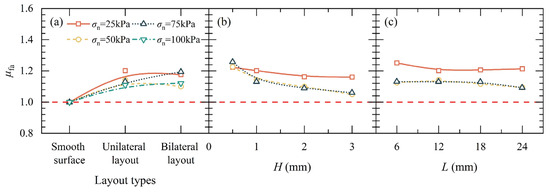
Figure 18.
The coefficient of friction anisotropy (μfa) of SIGR: (a) Layout types; (b) Scale height; (c) Scale length.
4.2.4. PIV Analysis of Soil Deformations
Figure 19 illustrates the typical soil deformation patterns observed during the pullout of SIGR with different scale layouts. The σn was maintained at 50 kPa, with the H and L set to 1 mm and 12 mm, respectively. It is evident that during the pullout of a SIGR with a smooth surface, only the soil particles in close contact with the SIGR were displaced, forming a narrow, band-shaped deformation zone. In contrast, when scales were present on the SIGR, the soil in the direction of pullout formed a significantly wedge-shaped shear zone, with the range expanding upward toward the loading direction.
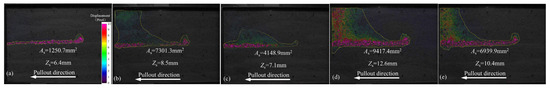
Figure 19.
The soil deformations during the pullout of SIGR with different scale layout types under σn = 50 kPa: (a) Pullout of SIGR without scales; (b) Cranial pullout of SIGR with unilateral layout; (c) Caudal pullout of SIGR with unilateral layout; (d) Cranial pullout of SIGR with bilateral layout; (e) Caudal pullout of SIGR with bilateral layout.
Figure 20 depicts the area of soil deformation, As (mm2), and the thickness of the shear band Zs (mm) during the pullout of SIGR under a σn = 50 kPa. The scales significantly increased As and Zs. The effects were more effective during the cranial pullout compared with the caudal pullout, and more significant for the bilateral layouts compared with the unilateral layouts. Specifically, for SIGR with a unilateral layout, As increased by 483.8% and 231.7% compared to the smooth surface during cranial and caudal pullout, and Zs increased by 32.8% and 10.9%, respectively (Figure 20a,b). For SIGR with a bilateral layout, As further increased by 29.0% and 62.3% compared to the unilateral layout during cranial and caudal pullout, respectively, and Zs increased by an additional 48.2% and 46.5% (Figure 20a,b).
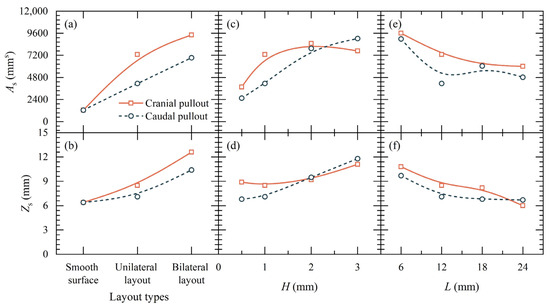
Figure 20.
The area of the soil deformation (As) and the thickness of the shear band (Zs) during the pullout of SIGR under σn = 50 kPa: (a) As with different layout types; (b) Zs with different layout types; (c) As with different scale height (H); (d) Zs with different scale height (L); (e) As with different H; (f) Zs with different L.
As H increased, As and Zs gradually expanded. When H reached 3 mm, As in the cranial pullout direction decreased slightly, the displacement vectors of soil particles within the deformation zone increased significantly, indicating that the impact of increased scale height on surrounding soil deformation was evident. Increasing L led to the reduction in As and Zs. This could be because the increased L reduces the roughness of the reinforcement surface, thereby narrowing the deformation range on the surrounding soil during the pullout process.
4.3. Discussions
4.3.1. Influence of Scale Length to Height (L/H)
The results detailed in the preceding sections demonstrate that tests with SIGRs conducted in the cranial direction resulted in higher peak pullout forces, cohesion, and soil deformations compared to those conducted in the caudal direction. The scale height and length also played an important role in influencing the peak pullout forces and soil deformations. There was a negative correlation between the peak pullout force and the scale length, and a positive correlation with the scale height. To gain a deeper understanding of the interface load-transfer mechanisms, the scale geometry ratio is introduced, which is the ratio of scale length to height (L/H). Current literature suggests that the L/H ratio is a more effective parameter than the roughness Ra for capturing the interface load transfer mechanism [12,14].
The outcomes of all pullout tests for SIGR are depicted as a function of L/H in Figure 21 for peak pullout force Pmax and in Figure 22 for interface shear strength parameters (c, and φ). Figure 21 and Figure 22 highlight the frictional anisotropy in terms of Pmax, c, and φ. Figure 21 shows that Pmax for SIGR with scales was consistently higher than those with smooth surfaces, with Pmax decreasing as L/H increased [25]. For L/H values ranging from 6 to 24, Pmax in the cranial direction was greater than that in the caudal direction. In contrast, when L/H was 4, Pmax in the cranial direction was lower than that in the caudal direction. Figure 22a illustrates that c decreased with increasing L/H. Cohesion c for SIGR was larger than that of the smooth-surface SIGR except at L/H = 24. Figure 22b indicates that, overall, the friction angle slightly decreased with increasing L/H, with larger friction angles mobilized during cranial pullout than during caudal pullout [12]. However, the friction angle exhibited a sharp decrease when L/H = 24.
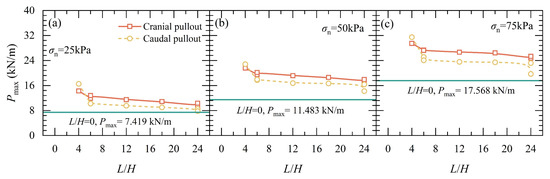
Figure 21.
Peak pullout force (Pmax) of SIGR with different ratios of scale length to height (L/H): (a) σn = 25 kPa; (b) σn = 50 kPa; (c) σn = 75 kPa.
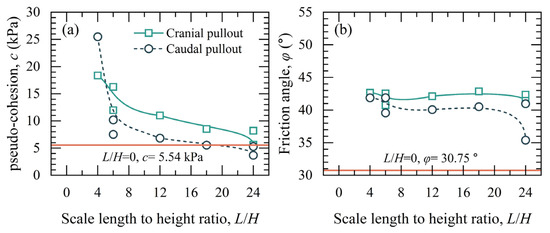
Figure 22.
Pseudo-cohesion (c) and friction angle (φ) of SIGR with different ratios of scale length to height (L/H): (a) c; (b) φ.
4.3.2. Quantitative Analysis of Strain-Softening Behavior
To further elucidate the pullout behaviour of SIGR, this study introduces a dimensionless strain-softening ratio (SSR), defined as:
where Presidual is the pullout force at the final displacement of 20 mm. A higher SSR indicates a more significant drop in resistance after peak, thus capturing the degree of strain-softening at the soil–SIGR interface.
Figure 23 presents the SSR of SIGR. The SSR for SIGR with smooth surface exhibited the highest SSR (1.20–1.25), suggesting a sharp release of accumulated friction once the interface fails. SIGR with unilateral scale layout presented the lowest SSR values (approximately 1.00), indicating a more gradual and stable load transfer and better energy dissipation capacity. The SSR varied non-monotonically with H and L. PIV analysis further corroborated these findings: higher SSR configurations typically corresponded to narrower shear bands and more localized failure, whereas lower SSR exhibited wider deformation zones and progressive grain rearrangement, reflecting better behavior after peak force.
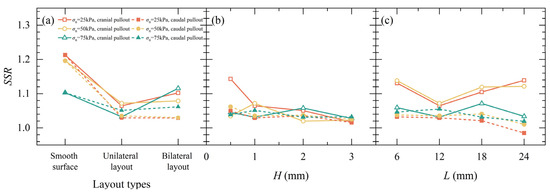
Figure 23.
Strain-softening ratio (SSR) of SIGR: (a) layout types; (b) Scale height (H); (c) Scale length (L).
4.3.3. Relationship Between Pmax and As and Zs
The deformation of soil within reinforced soil structures under external loading significantly influences the pullout performance of the reinforcement. Figure 24 delineates the relationship between the peak pullout force Pmax of SIGR and the soil deformation area As, as well as that and the shear band thickness Zs. It is observable that the changes in peak pullout force are generally positively correlated with both the soil deformation area and shear band thickness. This correlation suggests that the scale arrangement allows the reinforcement to engage a greater volume of surrounding soil to counteract horizontal pullout forces, which is in agreement with previous analysis in the paper.
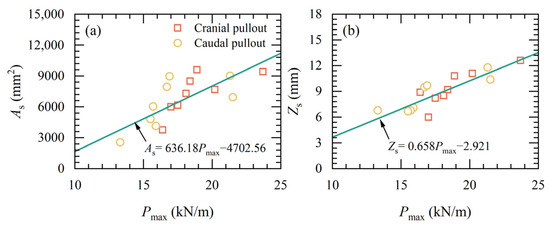
Figure 24.
Peak pullout force (Pmax) of SIGR with the soil deformation area (As) and the shear band thickness (Zs): (a) As; (b) Zs.
Moreover, these laboratory observations demonstrate that SIGR mobilizes larger soil volumes through enhanced frictional interaction, a mechanism that may improve load resistance in reinforced soil. Future field validation is required to confirm stability enhancement. While higher shear stresses indicate improved load transfer, excessive scales may shift failure planes into the soil, reducing efficiency. Optimal scale geometry must balance frictional gains and soil stability.
5. Limitations and Future Work
The pullout tests of SIGR in sand in this study, while revealing the influence of factors such as the scale arrangement, scale height, and length on the pullout force and interfacial strength, are subject to several constraints. First, the soil in this study is a cohesionless sandy soil, whereas there is also a wide range of soil materials in nature that are more complex in terms of structure and properties, such as clays, silts, and calcareous sands. The pull-out performance of SIGR in these soils needs to be tested in the future. Second, in this study, the monotonic pullout behavior of SIGR was tested only under normal loads ranging from 25 kPa to 75 kPa, whereas geosynthetic reinforcements may be subjected to higher loads as well as cyclic pullout conditions during service. The monotonic and cyclic pullout behaviour of SIGR under a wider range of loads needs to be tested. Third, the dimensions of the test box used in this study did not adequately account for scale effects, which may have resulted in higher pullout forces and soil disturbances, and large-scale field tests could be conducted in the future. Fourth, the test showed that when the scale height was increased from 2 mm to 3 mm, the pullout force of SIGR in the cranial direction was rather larger than that in the caudal direction. Numerical simulations can be carried out in the future to further elaborate on the mechanism of this phenomenon.
6. Conclusions
The experimental investigation presented herein includes frictional property assessments and surface morphology of the ventral scales of Cantor’s rat snakes (Ptyas dhumnades), and pullout tests of snakeskin-inspired geosynthetic reinforcement (SIGR) in sand. Particle Image Velocimetry (PIV) was employed to measure the deformation between the reinforcement and soil during the SIGR pullout process. Detailed conclusions are given here:
- (1)
- Ventral scales of Ptyas dhumnades exhibited frictional anisotropy due to asymmetrical thorn-like micro-protrusions, which tilt upward towards the snake’s tail and are approximately 180 μm in height.
- (2)
- The interface properties of the SIGR revealed significant frictional anisotropy. Except for the SIGR with a scale height of 3 mm and length of 12 mm, pullout against the scales (i.e., cranial direction) consistently yielded larger pullout peak forces, cohesions, and friction angles compared to pullout along the scales (i.e., caudal direction).
- (3)
- The scale layout, height (H), and length (L) of SIGR markedly influenced the pullout behavior. Pullout force increases with H but decreases with L. SIGR with bilateral layout scales achieved higher pullout force compared to the SIGR with unilateral layout scales.
- (4)
- PIV confirmed cranial pullout mobilized larger soil volumes compared to caudal pullout. During the pullout process, SIGR formed a distinct wedge-shaped shear zone. SIGR enhances stability by engaging more soil mass to resist loads, and may improve load resistance in reinforced soil.
Author Contributions
Conceptualization, X.H., F.Y., and J.H.; methodology, X.H., F.Y., and J.H.; validation, X.H. and F.Y.; formal analysis, X.H.; investigation, F.Y.; data curation, F.Y.; writing—original draft preparation, X.H.; writing—review and editing, J.H.; visualization, X.H.; supervision, J.H. All authors have read and agreed to the published version of the manuscript.
Funding
This research was funded by the Natural Science Foundation of Jiangsu Province, China (Grant No. BK20221502), and the National Natural Science Foundation of China (Project No. 42477147).
Institutional Review Board Statement
Not applicable.
Informed Consent Statement
Not applicable.
Data Availability Statement
Related data are available upon reasonable request.
Conflicts of Interest
Author Fengyuan Yan was employed by the State Grid Yancheng Power Supply Company. The remaining authors declare that the research was conducted in the absence of any commercial or financial relationships that could be construed as a potential conflict of interest.
References
- Martinez, A.; Dejong, J.; Akin, I.; Aleali, A.; Arson, C.; Atkinson, J.; Bandini, P.; Baser, T.; Borela, R.; Boulanger, R.; et al. Bio-Inspired Geotechnical Engineering: Principles, Current Work, Opportunities and Challenges. Géotechnique 2022, 72, 687–705. [Google Scholar] [CrossRef]
- Naclerio, N.D.; Karsai, A.; Murray-Cooper, M.; Ozkan-Aydin, Y.; Aydin, E.; Goldman, D.I.; Hawkes, E.W. Controlling Subterranean Forces Enables a Fast, Steerable, Burrowing Soft Robot. Sci. Robot. 2021, 6, eabe2922. [Google Scholar] [CrossRef] [PubMed]
- Zhong, Y.; Huang, S.; Tao, J. “Julian” Minimalistic Horizontal Burrowing Robots. J. Geotech. Geoenviron. Eng. 2023, 149, 02823001. [Google Scholar] [CrossRef]
- Bagheri, H.; Stockwell, D.; Bethke, B.; Okwae, N.K.; Aukes, D.; Tao, J.; Marvi, H. A Bio-Inspired Helically Driven Self-Burrowing Robot. Acta Geotech. 2024, 19, 1435–1448. [Google Scholar] [CrossRef]
- Chopra, S.; Vasile, D.; Jadhav, S.; Tolley, M.T.; Gravish, N. Toward Robotic Sensing and Swimming in Granular Environments Using Underactuated Appendages. Adv. Intell. Syst. 2023, 5, 2200404. [Google Scholar] [CrossRef]
- Ortiz, D.; Gravish, N.; Tolley, M.T. Soft Robot Actuation Strategies for Locomotion in Granular Substrates. IEEE Robot. Autom. Lett. 2019, 4, 2630–2636. [Google Scholar] [CrossRef]
- Zhang, L.; Wang, L.; Sun, Q.; Badal, J.; Chen, Q. Multi-Objective Design Optimization of Clam-Inspired Drilling into the Lunar Regolith. Acta Geotech. 2024, 19, 1379–1396. [Google Scholar] [CrossRef]
- Tao, J.; Huang, S.; Tang, Y. SBOR: A Minimalistic Soft Self-Burrowing-out Robot Inspired by Razor Clams. Bioinspir. Biomim. 2020, 15, 055003. [Google Scholar] [CrossRef] [PubMed]
- Li, D.; Zhao, J.; Wu, Y.; Zhang, Y.; Liang, H. An Innovative Bionic Offshore Wind Foundation: Scaled Suction Caisson. Renew. Sust. Energ. Rev. 2024, 191, 114208. [Google Scholar] [CrossRef]
- Liang, H.; Li, D.; Wu, Y.; Zhang, Y. Numerical Investigation into the Yield Envelope of the Scaled Suction Caisson Subjected to Inclined Pull-out Loading in Fine Sand. Ocean Eng. 2024, 296, 116857. [Google Scholar] [CrossRef]
- Li, D.; Ma, Y.; Zhao, J. Response of Bioinspired Scale Arrangement in a Suction Caisson to Penetrating into Clay Reflected by Using Interface Direct Shear Tests. Appl. Ocean Res. 2025, 154, 104322. [Google Scholar] [CrossRef]
- Xiao, Y.; Cui, H.; Shi, J.; Qiao, W.; Stuedlein, A.W. Shear Response of Calcareous Sand-Steel Snake Skin-Inspired Interfaces. Acta Geotech. 2024, 19, 1517–1527. [Google Scholar] [CrossRef]
- Gayathri, V.L.; Vangla, P. Shear Behaviour of Snakeskin-Inspired Ribs and Soil Interfaces. Acta Geotech. 2024, 19, 1397–1419. [Google Scholar] [CrossRef]
- Martinez, A.; Palumbo, S.; Todd, B.D. Bioinspiration for Anisotropic Load Transfer at Soil–Structure Interfaces. J. Geotech. Geoenviron. Eng. 2019, 145, 04019074. [Google Scholar] [CrossRef]
- O’Hara, K.B.; Martinez, A. Monotonic and Cyclic Frictional Resistance Directionality in Snakeskin-Inspired Surfaces and Piles. J. Geotech. Geoenviron. Eng. 2020, 146, 04020116. [Google Scholar] [CrossRef]
- O’Hara, K.B.; Martinez, A. Direction-Dependent Failure Envelopes of Sand-Structure Interfaces with Snakeskin-Inspired Surfaces. Can. Geotech. J. 2024, 61, 2755–2773. [Google Scholar] [CrossRef]
- Zhong, W.; Liu, H.; Wang, Q.; Zhang, W.; Li, Y.; Ding, X.; Chen, L. Investigation of the Penetration Characteristics of Snake Skin-Inspired Pile Using DEM. Acta Geotech. 2021, 16, 1849–1865. [Google Scholar] [CrossRef]
- Zhang, X.; Ciantia, M.O.; Knappett, J.A.; Leung, A.K.; Liang, T. Particle Size Effects on the Axial Pull-out and Push-in Behaviour of Roots. Acta Geotech. 2024, 19, 1461–1476. [Google Scholar] [CrossRef]
- Houette, T.; Dibia, M.; Mahabadi, N.; King, H. Pullout Resistance of Biomimetic Root-Inspired Foundation Systems. Acta Geotech. 2024, 19, 1191–1210. [Google Scholar] [CrossRef]
- Aleali, S.A.; Bandini, P.; Newtson, C.M. Multifaceted Bioinspiration for Improving the Shaft Resistance of Deep Foundations. J. Bionic Eng. 2020, 17, 1059–1074. [Google Scholar] [CrossRef]
- Mondal, S.; Disfani, M.M.; Mehdizadeh, A. Behaviour of Bio-Inspired Grouped Battered Minipiles under Lateral Loading in Clay. Acta Geotech. 2024, 19, 1159–1178. [Google Scholar] [CrossRef]
- Schwarz, M.; Cohen, D.; Or, D. Root-Soil Mechanical Interactions during Pullout and Failure of Root Bundles. J. Geophys. Res. 2010, 115, F04035. [Google Scholar] [CrossRef]
- Zhu, J.; Leung, A.K.; Wang, Y. Modelling Root-Soil Mechanical Interaction Considering Root Pull-out and Breakage Failure Modes. Plant Soil 2022, 480, 675–701. [Google Scholar] [CrossRef]
- Martinez, A.; Zamora, F.; Wilson, D. Field Evaluation of the Installation and Pullout of Snakeskin-Inspired Anchorage Elements. J. Geotech. Geoenviron. Eng. 2024, 150, 04024068. [Google Scholar] [CrossRef]
- Stutz, H.H.; Martinez, A. Directionally Dependent Strength and Dilatancy Behavior of Soil–Structure Interfaces. Acta Geotech. 2021, 16, 2805–2820. [Google Scholar] [CrossRef]
- Uesugi, M.; Kishida, H.; Tsubakihara, Y. Behavior of Sand Particles in Sand-Steel Friction. Soils Found. 1988, 28, 107–118. [Google Scholar] [CrossRef]
- Dove, J.E.; Frost, J.D. Peak Friction Behavior of Smooth Geomembrane-Particle Interfaces. J. Geotech. Geoenviron. Eng. 1999, 125, 544–555. [Google Scholar] [CrossRef]
- Martinez, A.; Nguyen, D.; Basson, M.S.; Medina, J.; Irschick, D.J.; Baeckens, S. Quantifying Surface Topography of Biological Systems from 3D Scans. Methods Ecol. Evol. 2021, 12, 1265–1276. [Google Scholar] [CrossRef]
- O’Hara, K.B.; Martinez, A. Cyclic Axial Response and Stability of Snakeskin-Inspired Piles in Sand. Acta Geotech. 2024, 19, 1139–1158. [Google Scholar] [CrossRef]
- O’Hara, K.B.; Martinez, A. Load Transfer Directionality of Snakeskin-Inspired Piles during Installation and Pullout in Sands. J. Geotech. Geoenviron. Eng. 2022, 148, 04022110. [Google Scholar] [CrossRef]
- Liang, H.; Wu, Y.; Li, D.; Zhao, J. Model Tests on Penetration and Seepage Behaviors of a Scaled Suction Caisson in Sand. Appl. Ocean. Res. 2023, 140, 103751. [Google Scholar] [CrossRef]
- O’Hara, K.; Martinez, A. Cyclic Failure of Interfaces between Sand and Snakeskin-Inspired Surfaces. Géotech. Lett. 2024, 14, 46–56. [Google Scholar] [CrossRef]
- Vangla, P.; Wala, B.A.; Gayathri, V.L.; Frost, J.D. Snakeskin-Inspired Patterns for Frictional Anisotropic Behaviour of Split Set Rock Bolts. Géotech. Lett. 2022, 12, 95–100. [Google Scholar] [CrossRef]
- Sugimoto, M.; Alagiyawanna, A.M.N.; Kadoguchi, K. Influence of Rigid and Flexible Face on Geogrid Pullout Tests. Geotext. Geomembr. 2001, 19, 257–277. [Google Scholar] [CrossRef]
- Yang, S.; Gao, Y.; Leshchinsky, B.; Cui, K.; Zhang, F. Internal Stability Analysis of Reinforced Convex Highway Embankments Considering Seismic Loading. Geotext. Geomembr. 2020, 48, 221–229. [Google Scholar] [CrossRef]
- Hang, L.; Gao, Y.; He, J.; Li, C.; Zhou, Y.; Van Paassen, L.A. Pullout Behavior of Biocement–Geosynthetic Reinforcement System: A Parametric Study. Acta Geotech. 2022, 17, 5429–5439. [Google Scholar] [CrossRef]
- Gao, Y.; Hang, L.; He, J.; Zhang, F.; Van Paassen, L. Pullout Behavior of Geosynthetic Reinforcement in Biocemented Soils. Geotext. Geomembr. 2021, 49, 646–656. [Google Scholar] [CrossRef]
- Chen, X.; Zhang, J.; Li, Z. Shear Behaviour of a Geogrid-Reinforced Coarse-Grained Soil Based on Large-Scale Triaxial Tests. Geotext. Geomembr. 2014, 42, 312–328. [Google Scholar] [CrossRef]
- Alfaro, M.; Miura, N.; Bergado, D. Soil-Geogrid Reinforcement Interaction by Pullout and Direct Shear Tests. Geotech. Test. J. 1995, 18, 157–167. [Google Scholar] [CrossRef]
- Ferreira, J.A.Z.; Zornberg, J.G. A Transparent Pullout Testing Device for 3D Evaluation of Soil–Geogrid Interaction. Geotech. Test. J. 2015, 38, 686–707. [Google Scholar] [CrossRef]
- Liu, F.; Ying, M.; Yuan, G.; Wang, J.; Gao, Z.; Ni, J. Particle Shape Effects on the Cyclic Shear Behaviour of the Soil–Geogrid Interface. Geotext. Geomembr. 2021, 49, 991–1003. [Google Scholar] [CrossRef]
- Gao, Z.; Qian, T.; Jiang, J.; Hou, D.; Deng, X.; Yang, D. Species Diversity and Distribution of Amphibians and Reptiles in Hunan Province, China. Biodivers. Sci. 2022, 30, 21290. [Google Scholar] [CrossRef]
- Chen, P.; Xiang, X.; Shao, T.; La, Y.; Li, J. Effect of Triangular Texture on the Tribological Performance of Die Steel with TiN Coatings under Lubricated Sliding Condition. Appl. Surf. Sci. 2016, 389, 361–368. [Google Scholar] [CrossRef]
- Ballesteros, L.M.; Zuluaga, E.; Cuervo, P.; Rudas, J.S.; Toro, A. Tribological Behavior of Polymeric 3D-Printed Surfaces with Deterministic Patterns Inspired in Snake Skin Morphology. Surf. Topogr. Metrol. Prop. 2021, 9, 014002. [Google Scholar] [CrossRef]
- Baum, M.J.; Kovalev, A.E.; Michels, J.; Gorb, S.N. Anisotropic Friction of the Ventral Scales in the Snake Lampropeltis Getula Californiae. Tribol. Lett. 2014, 54, 139–150. [Google Scholar] [CrossRef]
- Stopar, K.; Drobne, D.; Eler, K.; Bartol, T. Citation Analysis and Mapping of Nanoscience and Nanotechnology: Identifying the Scope and Interdisciplinarity of Research. Scientometrics 2016, 106, 563–581. [Google Scholar] [CrossRef]
- Ates, B.; Sadoglu, E. A Quasi-2D Exploration of Optimum Design Settings for Geotextile-Reinforced Sand in Assistance with PIV Analysis of Failure Mechanism. Geotext. Geomembr. 2023, 51, 418–436. [Google Scholar] [CrossRef]
- Reshma, B.; Viswanadham, B.V.S.; Rajagopal, K. Centrifuge Modeling and Piv Analysis of Geogrid Reinforced Pile Supported Embankments over Soft Clay. Int. J. Geosynth. Ground Eng. 2024, 10, 62. [Google Scholar] [CrossRef]
- Mirzaeifar, H.; Hatami, K.; Abdi, M.R. Pullout Testing and Particle Image Velocimetry (PIV) Analysis of Geogrid Reinforcement Embedded in Granular Drainage Layers. Geotext. Geomembr. 2022, 50, 1083–1109. [Google Scholar] [CrossRef]
- Zuo, Z.; Hao, X.; Li, H.; Wang, W.; Yang, G.; Liu, Y. Experimental Investigations on the Tensile Mechanical Behavior of HDPE Geocell Strip. Sustainability 2023, 15, 7820. [Google Scholar] [CrossRef]
- Zheng, Z.; El Naggar, M.H.; Wang, J.; Yang, Q. Coupling Effect of Roughness and Normal Pressure on Mechanical Characteristics and Failure Mode of Deep-Sea Sediment Interface. Ocean. Eng. 2023, 267, 113255. [Google Scholar] [CrossRef]
- Wittbrodt, B.; Pearce, J.M. The Effects of PLA Color on Material Properties of 3-D Printed Components. Addit. Manuf. 2015, 8, 110–116. [Google Scholar] [CrossRef]
- Schindelin, J.; Rueden, C.T.; Hiner, M.C.; Eliceiri, K.W. The ImageJ Ecosystem: An Open Platform for Biomedical Image Analysis. Mol. Reprod. Dev. 2015, 82, 518–529. [Google Scholar] [CrossRef] [PubMed]
- Rauthause, M.P.; Stuedlein, A.W.; Olsen, M.J. Quantification of Surface Roughness Using Laser Scanning with Application to the Frictional Resistance of Sand-Timber Pile Interfaces. Geotech. Test. J. 2020, 43, 966–984. [Google Scholar] [CrossRef]
- Kou, H.; Diao, W.; Zhang, W.; Zheng, J.; Ni, P.; Jang, B.-A.; Wu, C. Experimental Study of Interface Shearing between Calcareous Sand and Steel Plate Considering Surface Roughness and Particle Size. Appl. Ocean Res. 2021, 107, 102490. [Google Scholar] [CrossRef]
Disclaimer/Publisher’s Note: The statements, opinions and data contained in all publications are solely those of the individual author(s) and contributor(s) and not of MDPI and/or the editor(s). MDPI and/or the editor(s) disclaim responsibility for any injury to people or property resulting from any ideas, methods, instructions or products referred to in the content. |
© 2025 by the authors. Licensee MDPI, Basel, Switzerland. This article is an open access article distributed under the terms and conditions of the Creative Commons Attribution (CC BY) license (https://creativecommons.org/licenses/by/4.0/).