1. Introduction
Against the background of the “double carbon” goal and energy transformation, energy integration has become a key trend in the coordinated development of energy and transportation. Energy integration aims to break through the traditional boundaries of energy and transportation systems, achieving efficient energy utilization and low-carbon, intelligent development of transportation through integrated infrastructure and collaborative operation mechanisms. The rapid development of renewable energy power generation technologies, represented by wind power and photovoltaics, has provided crucial support for energy exchange integration. For instance, offshore wind power generation technology continues to make breakthroughs. New control methods, such as multi-model three-level fuzzy control based on the active rotating inertial actuator (ARID), can effectively address dynamic load challenges in complex marine environments and ensure stable wind power output [
1]. In the transportation sector, the number of electric vehicles as a green travel carrier is steadily increasing. Research on relevant energy management strategies, such as adaptive energy management strategies based on micro-stroke identification for extended-range electric vehicles, has significantly improved fuel economy and energy efficiency [
2]. The development of intelligent transportation systems has also driven the advancement of traffic data processing technologies. The synchronous spatio-temporal graph converter network can effectively model the non-local spatio-temporal relationships of traffic data, offering a novel solution for traffic flow prediction [
3]. The multi-agent reinforcement learning framework provides a novel approach for achieving adaptive collaborative transportation systems [
4]. Additionally, the trajectory prediction model that takes driving style into account enhances the accuracy of predicting target vehicle behavior in intelligent transportation scenarios [
5]. The Hybrid Renewable Energy System (HRES), which combines photovoltaic (PV) systems and battery energy storage systems, is commonly used in remote areas. It significantly improves energy sustainability and reduces carbon dioxide emissions [
6]. However, the high-cost investment and operational maintenance challenges impede its widespread adoption in these regions.
In offshore wind power, harsh natural conditions like ice loads severely threaten wind turbine structural fatigue reliability. Machine learning-based structural fatigue reliability assessment has enhanced efficiency, accuracy, and adaptability [
7], but further exploration is needed for its engineering application. The 6G large-scale antenna system, despite theoretical advantages, faces limits in practical use due to hardware costs, energy use, and compatibility with current communication standards, hindering wide-scale deployment [
8]. In power electronic equipment optimization, the improved modulation strategy of the single-phase three-level neutral-point-clamped converter cuts switching losses [
9], but reliability and thermal management in high-power settings require more study to ensure long-term stable equipment operation. In wind turbine control, the pitch controller with robust cyclic shaping design boosts the wind turbine system’s stability and dynamic performance [
10]. However, there is still room for enhancing adaptive control capabilities under complex wind conditions to further optimize energy capture efficiency and reduce load fluctuations. In target vehicle behavior prediction, the short-term lateral behavior reasoning architecture based on driver preview characteristics has improved prediction accuracy [
11]. Nevertheless, prediction accuracy and real-time performance in multi-vehicle interaction scenarios need enhancement to meet the high safety requirements of autonomous driving systems.
The integration of energy and transportation aims to achieve deep integration and collaborative optimization of the two systems. Viewed from the energy supply side, wind power prediction technology is advancing continuously. The prediction method based on numerical weather prediction correction and adaptive spatio-temporal graph feature information fusion has greatly improved prediction accuracy and thus strongly supports power grid dispatching [
12]. In the energy storage field, the robust energy storage planning method that takes extreme weather impacts into account (e.g., the ESS planning model in hurricane scenarios) enhances the grid’s disaster resistance and wind power integration efficiency [
13]. From the traffic demand perspective, optimizing electric vehicle charging strategies is crucial for integration. By adopting intelligent energy management strategies (such as dynamic charging control based on wind power prediction), electric vehicles can be transformed into flexible grid-regulation resources. While satisfying travel needs, this also promotes renewable energy consumption and stable grid operation. Lidar data processing technology advances have bolstered the environmental perception capabilities of intelligent transportation systems. By leveraging rotating lidar data to jointly optimize scene flow estimation and moving target segmentation, the intelligence of automatic driving and traffic management has been enhanced [
14]. Research on a synchronous information and power transmission system, which relies on magnetron modulation characteristics, offers a novel approach to integrating energy transmission and information communication. Its effectiveness has been confirmed through theoretical and numerical analysis [
15]. In-ahead day power prediction for wind farm clusters, accuracy has been significantly improved by identifying the inherent predictable components of wind power and isolating interference components [
16,
17,
18], introducing a new method for such predictions.
Although the above research has laid a solid technical foundation for the convergence of traffic and energy, there are still gaps in the synergistic optimization of wind power prediction and electric vehicle charging management, the seamlessness of system integration, and the broad practical applicability.
Wind power prediction is a key technology to support the efficient operation of the “transportation-energy integration” system. Its research progress mainly focuses on the physical model method [
19,
20], statistical learning method [
21,
22], and deep learning method [
23,
24]. Although the mechanism of numerical weather prediction (NWP) [
25] is well-defined, its complex calculations make it difficult to respond to local meteorological disturbances in real time. Statistical learning methods, such as the Auto-regressive Moving Average Model (ARMA) [
26] and Support Vector Machine (SVM) [
27], have inherent limitations in capturing the strong non-stationarity and long-term time-series dependencies of wind power. In recent years, deep learning models have become mainstream due to their powerful feature extraction capabilities. For example, recurrent neural networks, represented by Long Short-Term Memory (LSTM) [
28], can effectively model temporal dynamic features through their gating mechanisms. Among them, the Gated Recurrent Unit (GRU) [
29] demonstrates remarkable engineering advantages in wind power time-series dynamic modeling due to its lightweight gating mechanism. In contrast, Convolutional Neural Networks (CNNs) [
30] concentrate on extracting spatial meteorological features and have introduced improved attention-based models, such as Attention-GRU [
31], to enhance short-term prediction accuracy. Furthermore, Transformer [
32], with its self-attention mechanism, has emerged as a new research direction in time-series forecasting due to its growing advantages in handling long-sequence dependencies. Although Transformer overcomes long-term dependency modeling issues via its self-attention mechanism, it is constrained by computational complexity and local feature capture ability. To boost prediction robustness, ensemble learning methods like Extreme Gradient Boosting (XGBoost) [
33] and Light Gradient Boosting Machine (LightGBM) [
34] are widely applied. At the same time, probabilistic prediction models, such as NGBoost (Natural Gradient Boosting) [
35], have drawn much attention due to their ability to quantify prediction uncertainty. However, existing research on integrating deep time-series models with probabilistic prediction methods still has notable deficiencies. Moreover, these studies also need to better address the rapid distribution drift of wind power data [
36].
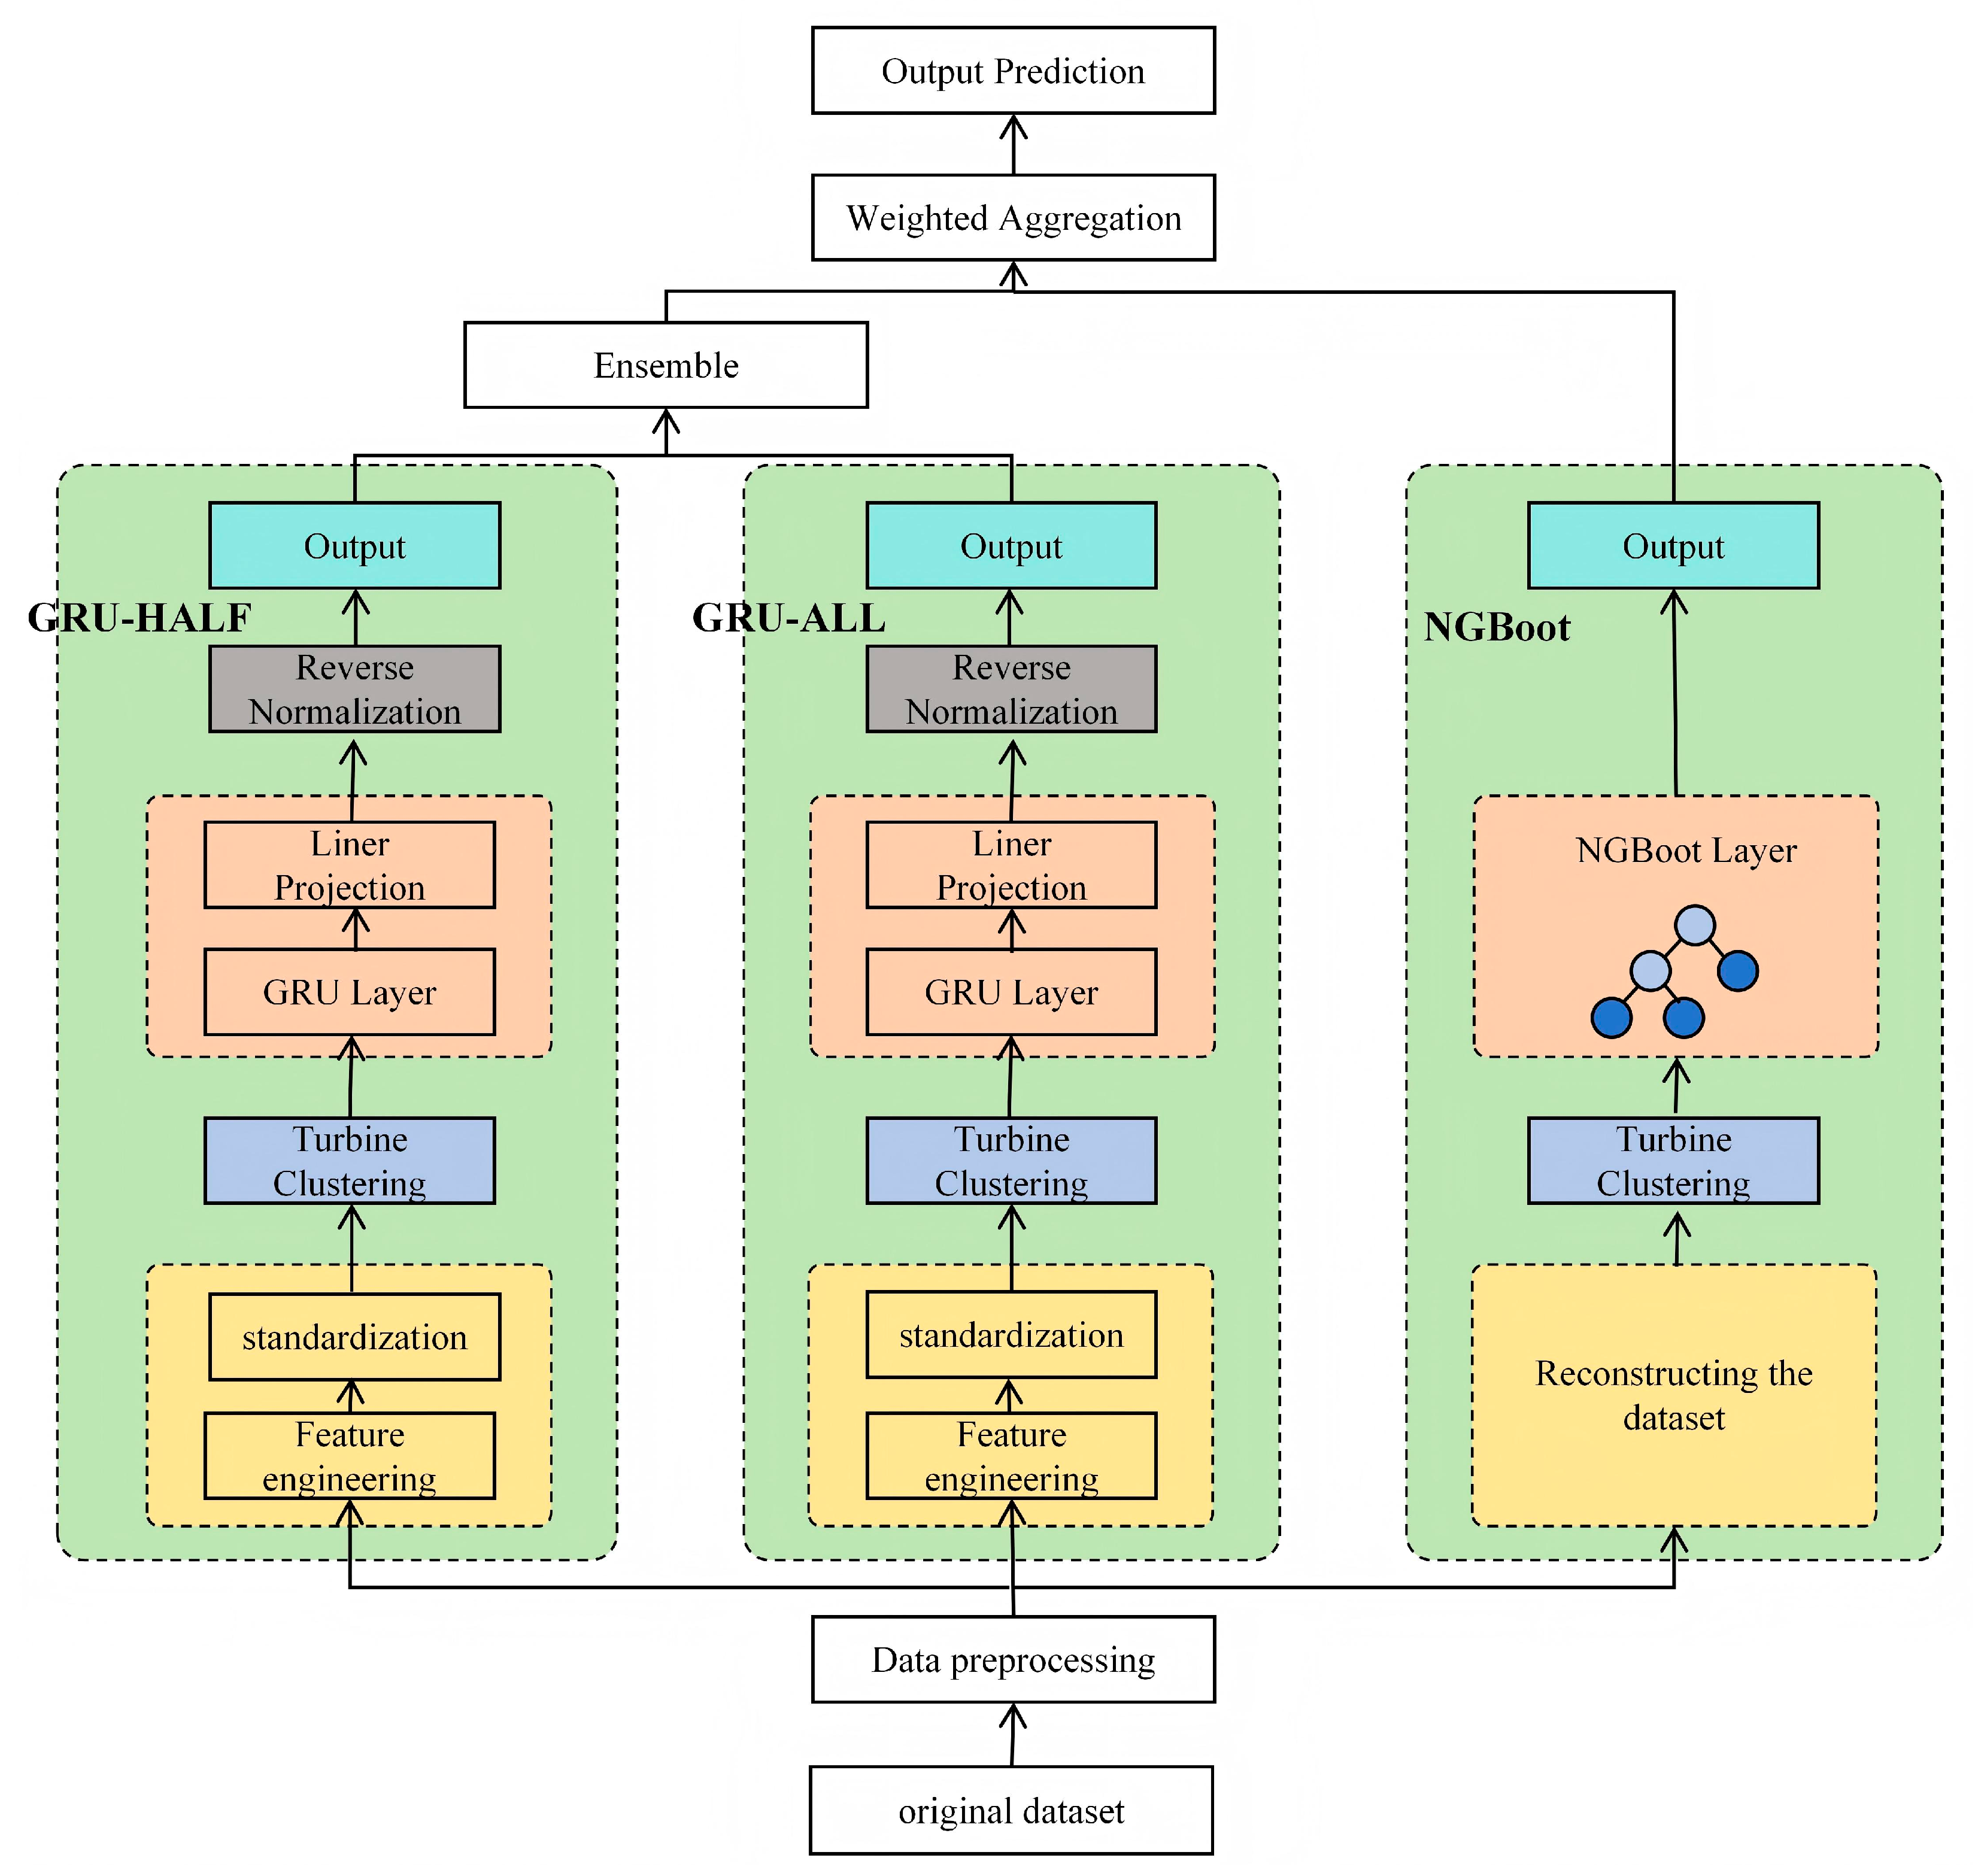
To address existing wind power prediction method deficiencies in deep fusion time-series dynamic modeling, probabilistic prediction, and adaptation to rapid data distribution drift, this paper proposes a wind power prediction method based on an NGBoost–GRU fusion model. It also designs a deeply coordinated dynamic charging optimization strategy for electric vehicles. The prediction model innovatively integrates the core advantages of the Gated Recurrent Unit (GRU) and Natural Gradient Boosting (NGBoost). With its efficient gating mechanism, GRU significantly enhances its ability to extract dynamic features of complex non-stationarity and long-term time-series dependence in wind power series. NGBoost robustly models the complex nonlinear relationships between input features and accurately quantifies predictive uncertainty through its conditional probability distribution-based gradient boosting framework. Unlike traditional prediction methods that depend on single physical models, statistical learning, or deep learning, this integration strategy not only enhances point prediction accuracy but also overcomes the intrinsic limitations of conventional deterministic prediction models in risk quantification. NGBoost equips the model with the capability to output a full probability distribution. The resulting prediction intervals (e.g., confidence intervals) dynamically mirror prediction reliability—narrow during stable periods and wide during volatile ones. This provides critical uncertainty quantification for downstream decisions like grid scheduling and charging strategy optimization, thus significantly boosting the system’s robustness against wind power fluctuations and distribution shifts. Our key contributions are as follows:
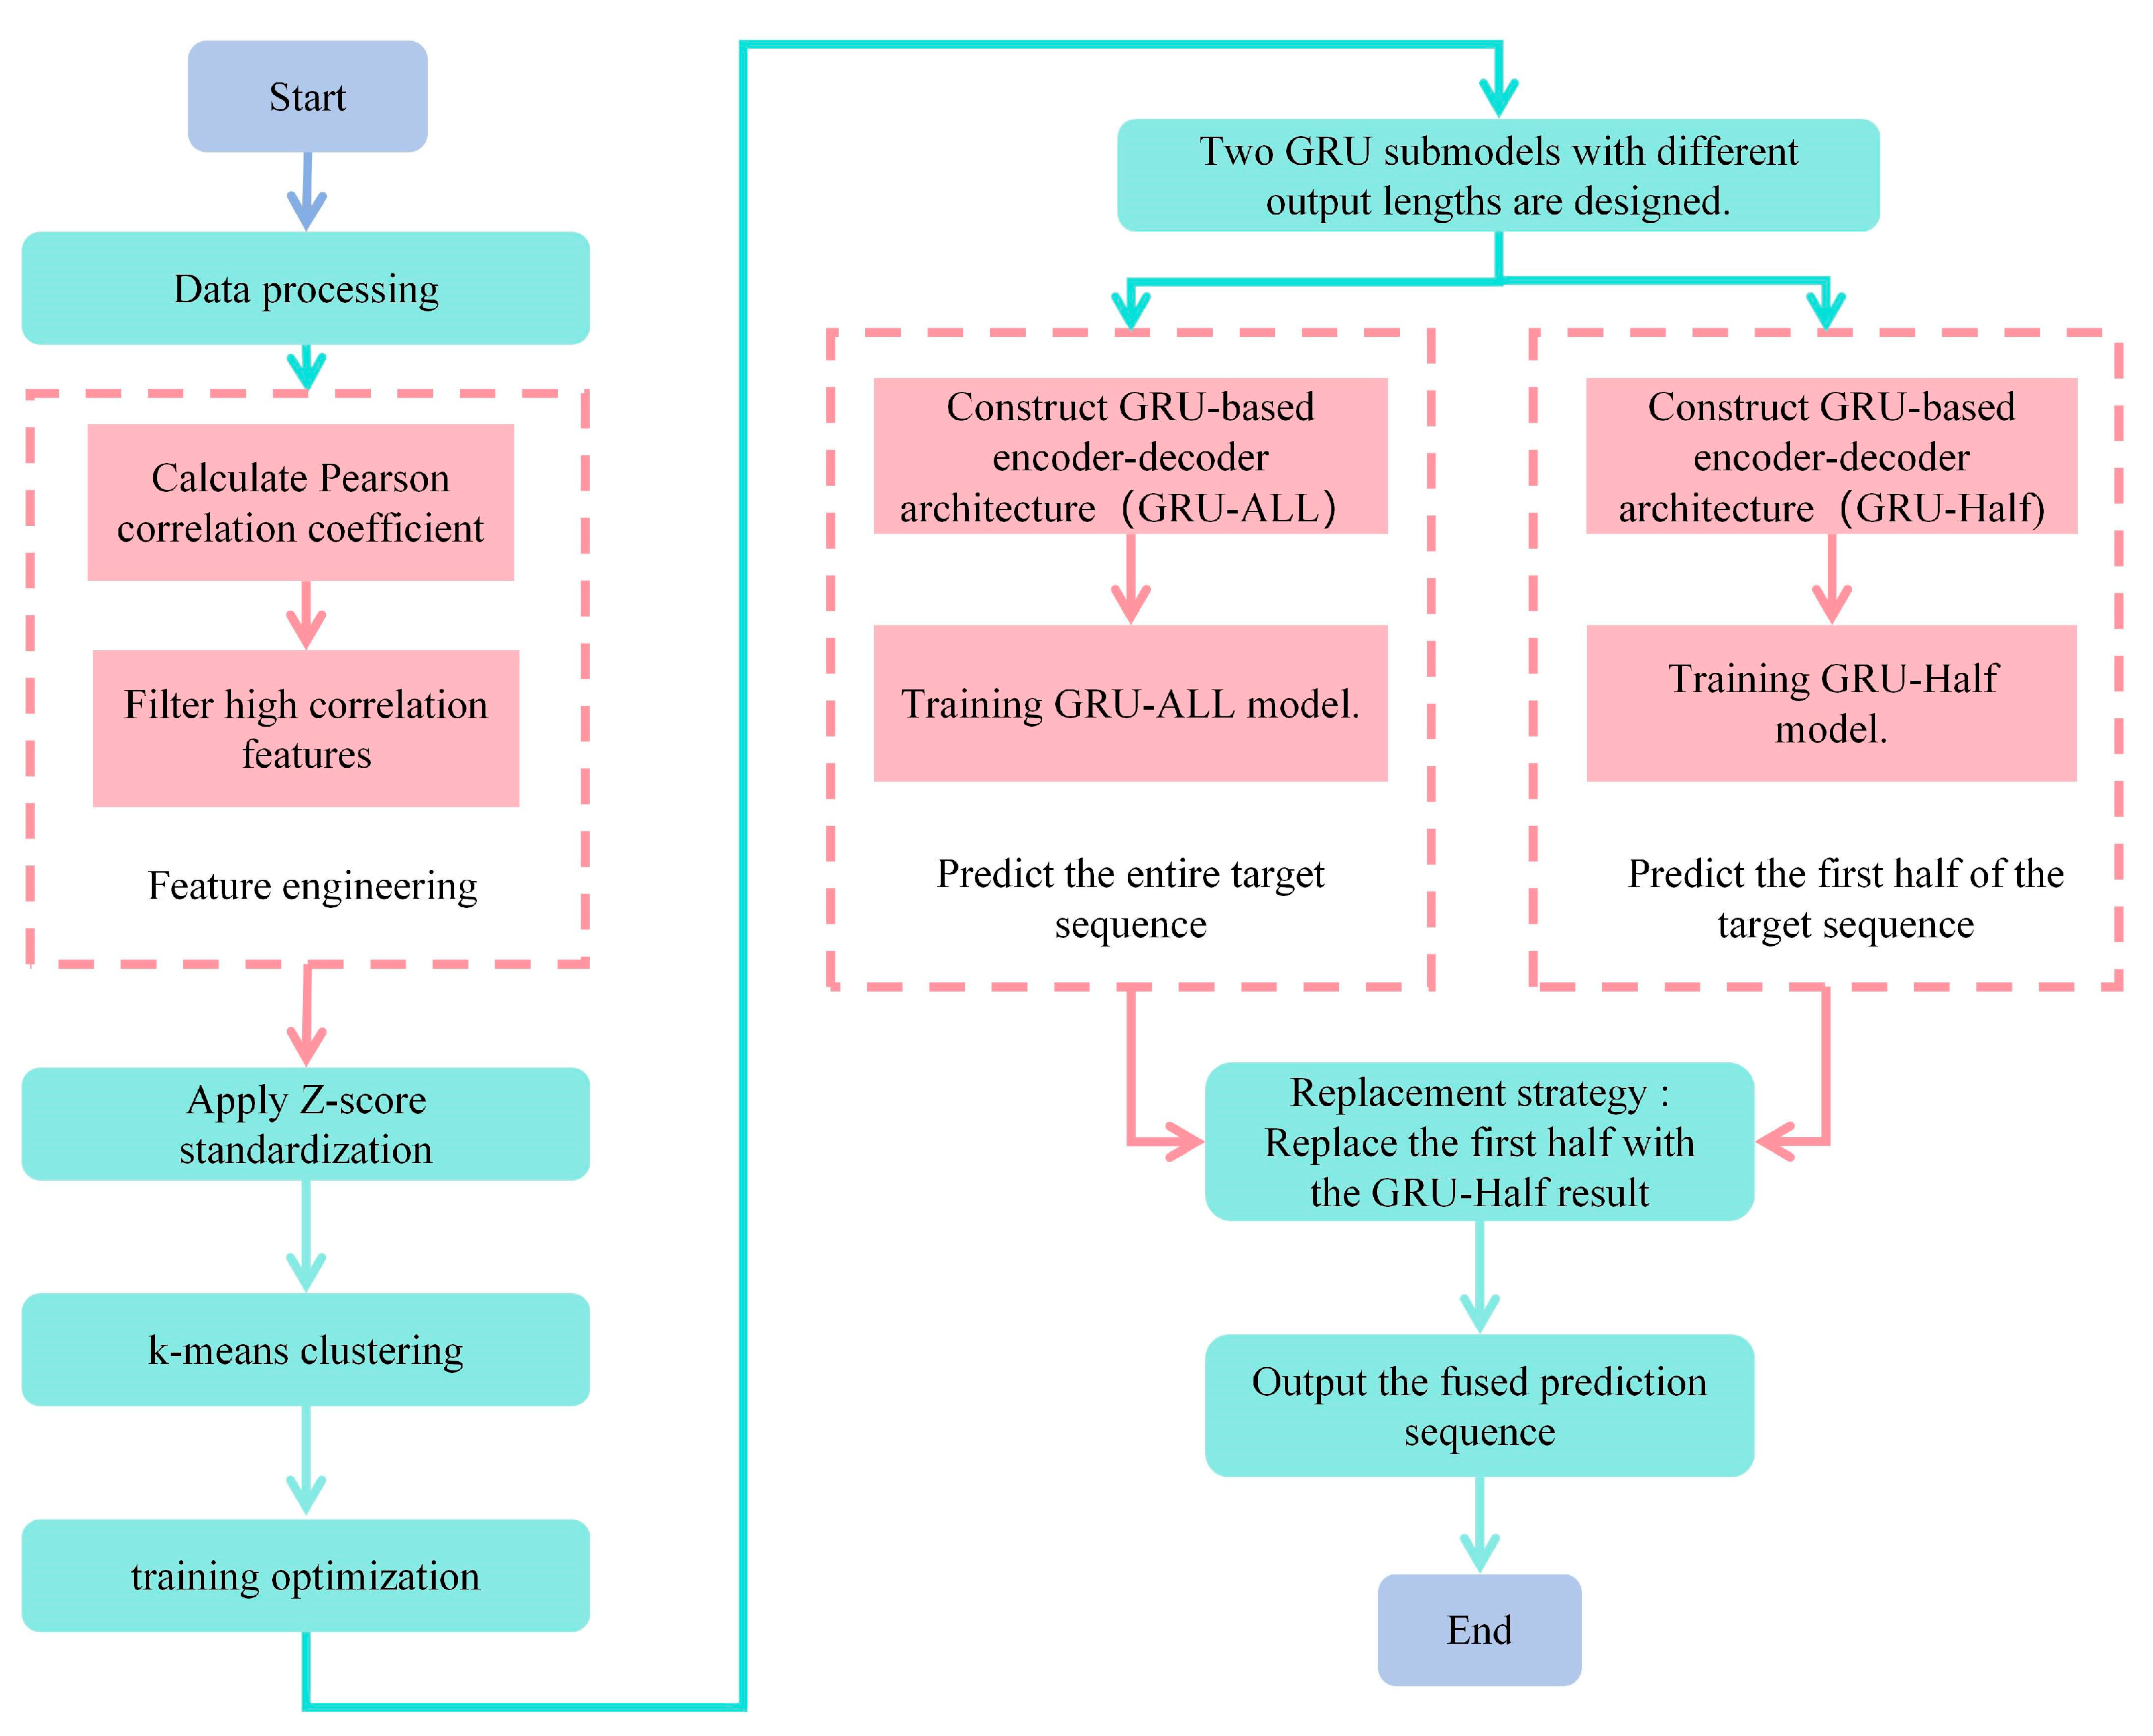
A wind power collaborative forecasting model that integrates time-series modeling and probabilistic prediction is proposed. The model innovatively combines the advantages of GRU in capturing complex time-series dynamics and NGBoost in modeling nonlinear relationships and quantifying uncertainty. Through key technologies such as dual GRU fusion and spatial clustering, the model’s prediction accuracy and uncertainty quantification reliability are enhanced.
An EV dynamic charging coordination strategy based on probabilistic forecasting has been designed. A “global-real-time” dual-mode optimization framework is constructed to deeply integrate wind power forecasts (point and interval estimates) with grid status (including electricity prices and constraints) and user demand. This ensures precise spatiotemporal matching between wind power and charging loads, thereby maximizing wind power utilization and achieving peak load shifting.
The proposed strategy effectively balances system efficiency and economic interests by enhancing wind power utilization, reducing user charging costs, and alleviating grid peak-shaving pressures, thus maximizing energy efficiency and minimizing social and economic costs.
This paper is organized as follows:
Section 2 details the wind power prediction method using the NGBoost–GRU fusion model and the electric vehicle dynamic charging strategy based on this prediction model.
Section 3 validates the effectiveness and advantages of the proposed method through experiments.
Section 4 deeply discusses the research results, analyzing the model’s strengths, potential applications, and future research directions.
Section 5 summarizes the work and draws the research conclusions.
3. Results
3.1. Dataset
The data used in this paper is the spatial dynamic wind power prediction dataset of a wind farm in Guazhou City, Gansu Province, issued by Longyuan Power Group Co., Ltd. in 2022 [
41]. There are 134 wind turbines in total, and the data is collected every 10 min. The data from each wind turbine is collected 144 times a day. Each wind turbine has a total of 144 × 245 = 35,280 continuous data points. The distribution of wind farms is shown in
Figure 6a.
The dataset provides key external features that affect wind power generation, such as wind speed, wind direction, and ambient temperature, as well as basic internal features, such as internal temperature of the blade, cabin direction, and pitch angle. In addition, there is a separate file that provides the spatial location information of each fan in the coordinate form of (x, y). The detailed description of each variable is shown in
Table 2.
3.2. Experimental Environment and Parameter Configuration
In order to verify the effectiveness of the NGBoost–GRU fusion model proposed in this paper, all of this paper is implemented using Python 3.8 code, and the development tool PyCharm 2023 is used to remotely connect to the cloud server provided by the AI Galaxy platform for experiments. The model uses the PyTorch 1.13.1 framework and runs in a GPU computing environment equipped with a GeForce RTX 3090 (24 GB). The Adam optimizer is used in the training process, and the initial learning rate is set to 0.01. The batch size is set to 32, and the dataset is divided into a 60% training set, a 20% validation set, and a 20% test set. Each model undergoes 200 training cycles to ensure full learning and optimal performance. In order to compare the performance of the model fairly, the parameter settings of the baseline model follow the original paper, and the training configurations, such as learning rate and batch size, are consistent with the model.
3.3. Evaluation Indicators
In order to quantitatively evaluate the performance of the NGBoost–GRU fusion model proposed in this paper in wind power prediction tasks, the following two widely used regression evaluation indicators are used: mean absolute error (MAE) and root mean square error (RMSE). The indicators are defined as follows:
3.3.1. Mean Absolute Error (MAE)
MAE represents the mean value of the absolute error between the predicted value and the true value. The calculation method is:
where
is the real active power value of the
-th sample (unit: kW);
is the corresponding predicted value, and
is the total number of samples. MAE is not sensitive to outliers and can directly reflect the absolute level of prediction error.
3.3.2. Root Mean Squared Error (RMSE)
RMSE is the square root of MSE, which is defined as:
RMSE has the same dimension (kW) as the target variable, which is convenient to intuitively explain the actual physical meaning of the prediction error. Compared with MAE, RMSE is more sensitive to extreme errors and can effectively reflect the stability of prediction results.
The above indicators together constitute a multi-dimensional assessment of prediction performance. MAE provides robust estimation of errors, and RMSE focuses on identifying large deviation samples (in wind power forecasting, extreme errors may lead to grid scheduling risks). The experiment will report the results of each index on the test set, respectively, to comprehensively verify the effectiveness of the model.
3.4. Baseline Model
In order to comprehensively evaluate the prediction performance of the NGBoost–GRU fusion model proposed in this paper, five representative advanced prediction models were selected as baseline methods, covering two mainstream paradigms of deep learning and ensemble learning. Here is a selection of comparison algorithms:
Long Short-Term Memory (LSTM) [
42]: Long-term memory and key information extraction of historical dynamic features are realized by using the cell state and a gating unit to selectively retain and transmit timing information.
Convolutional Neural Network (CNN) [
43]: By sliding the one-dimensional convolution kernel in the temporal dimension, local spatial features (such as wind speed mutation, power fluctuation mode) are extracted and predicted.
Extreme Gradient Boosting (XGBoost) [
44]: The decision tree combination is iteratively optimized by the addition training strategy, and the regularization term is introduced to control the complexity of the model. Its advantages are efficient processing of structured features (such as ambient temperature, pitch angle), automatic processing of missing values, and nonlinear modeling capabilities for feature interaction, which are robust in wind power feature engineering.
Light Gradient Boosting Machine (LightGBM) [
45]: Gradient-based one-sided sampling (GOSS) and mutually exclusive feature binding (EFB) techniques are used to significantly improve training efficiency and memory utilization. Compared with XGBoost, its histogram algorithm accelerates feature splitting, which is especially suitable for large-scale processing of high-dimensional wind turbine data (such as multi-unit spatial position and operating condition parameters).
Transformer [
32]: Abandon the loop structure and rely entirely on the self-attention mechanism (self-attention) to dynamically calculate the global dependence weight of sequence elements. By injecting timing information through position coding, its multi-head attention layer can capture the long-range correlation and multivariate interaction of wind speed series in parallel and realize prediction.
3.5. Main Results
We selected the prediction results of a wind turbine for 120 consecutive hours for visual display.
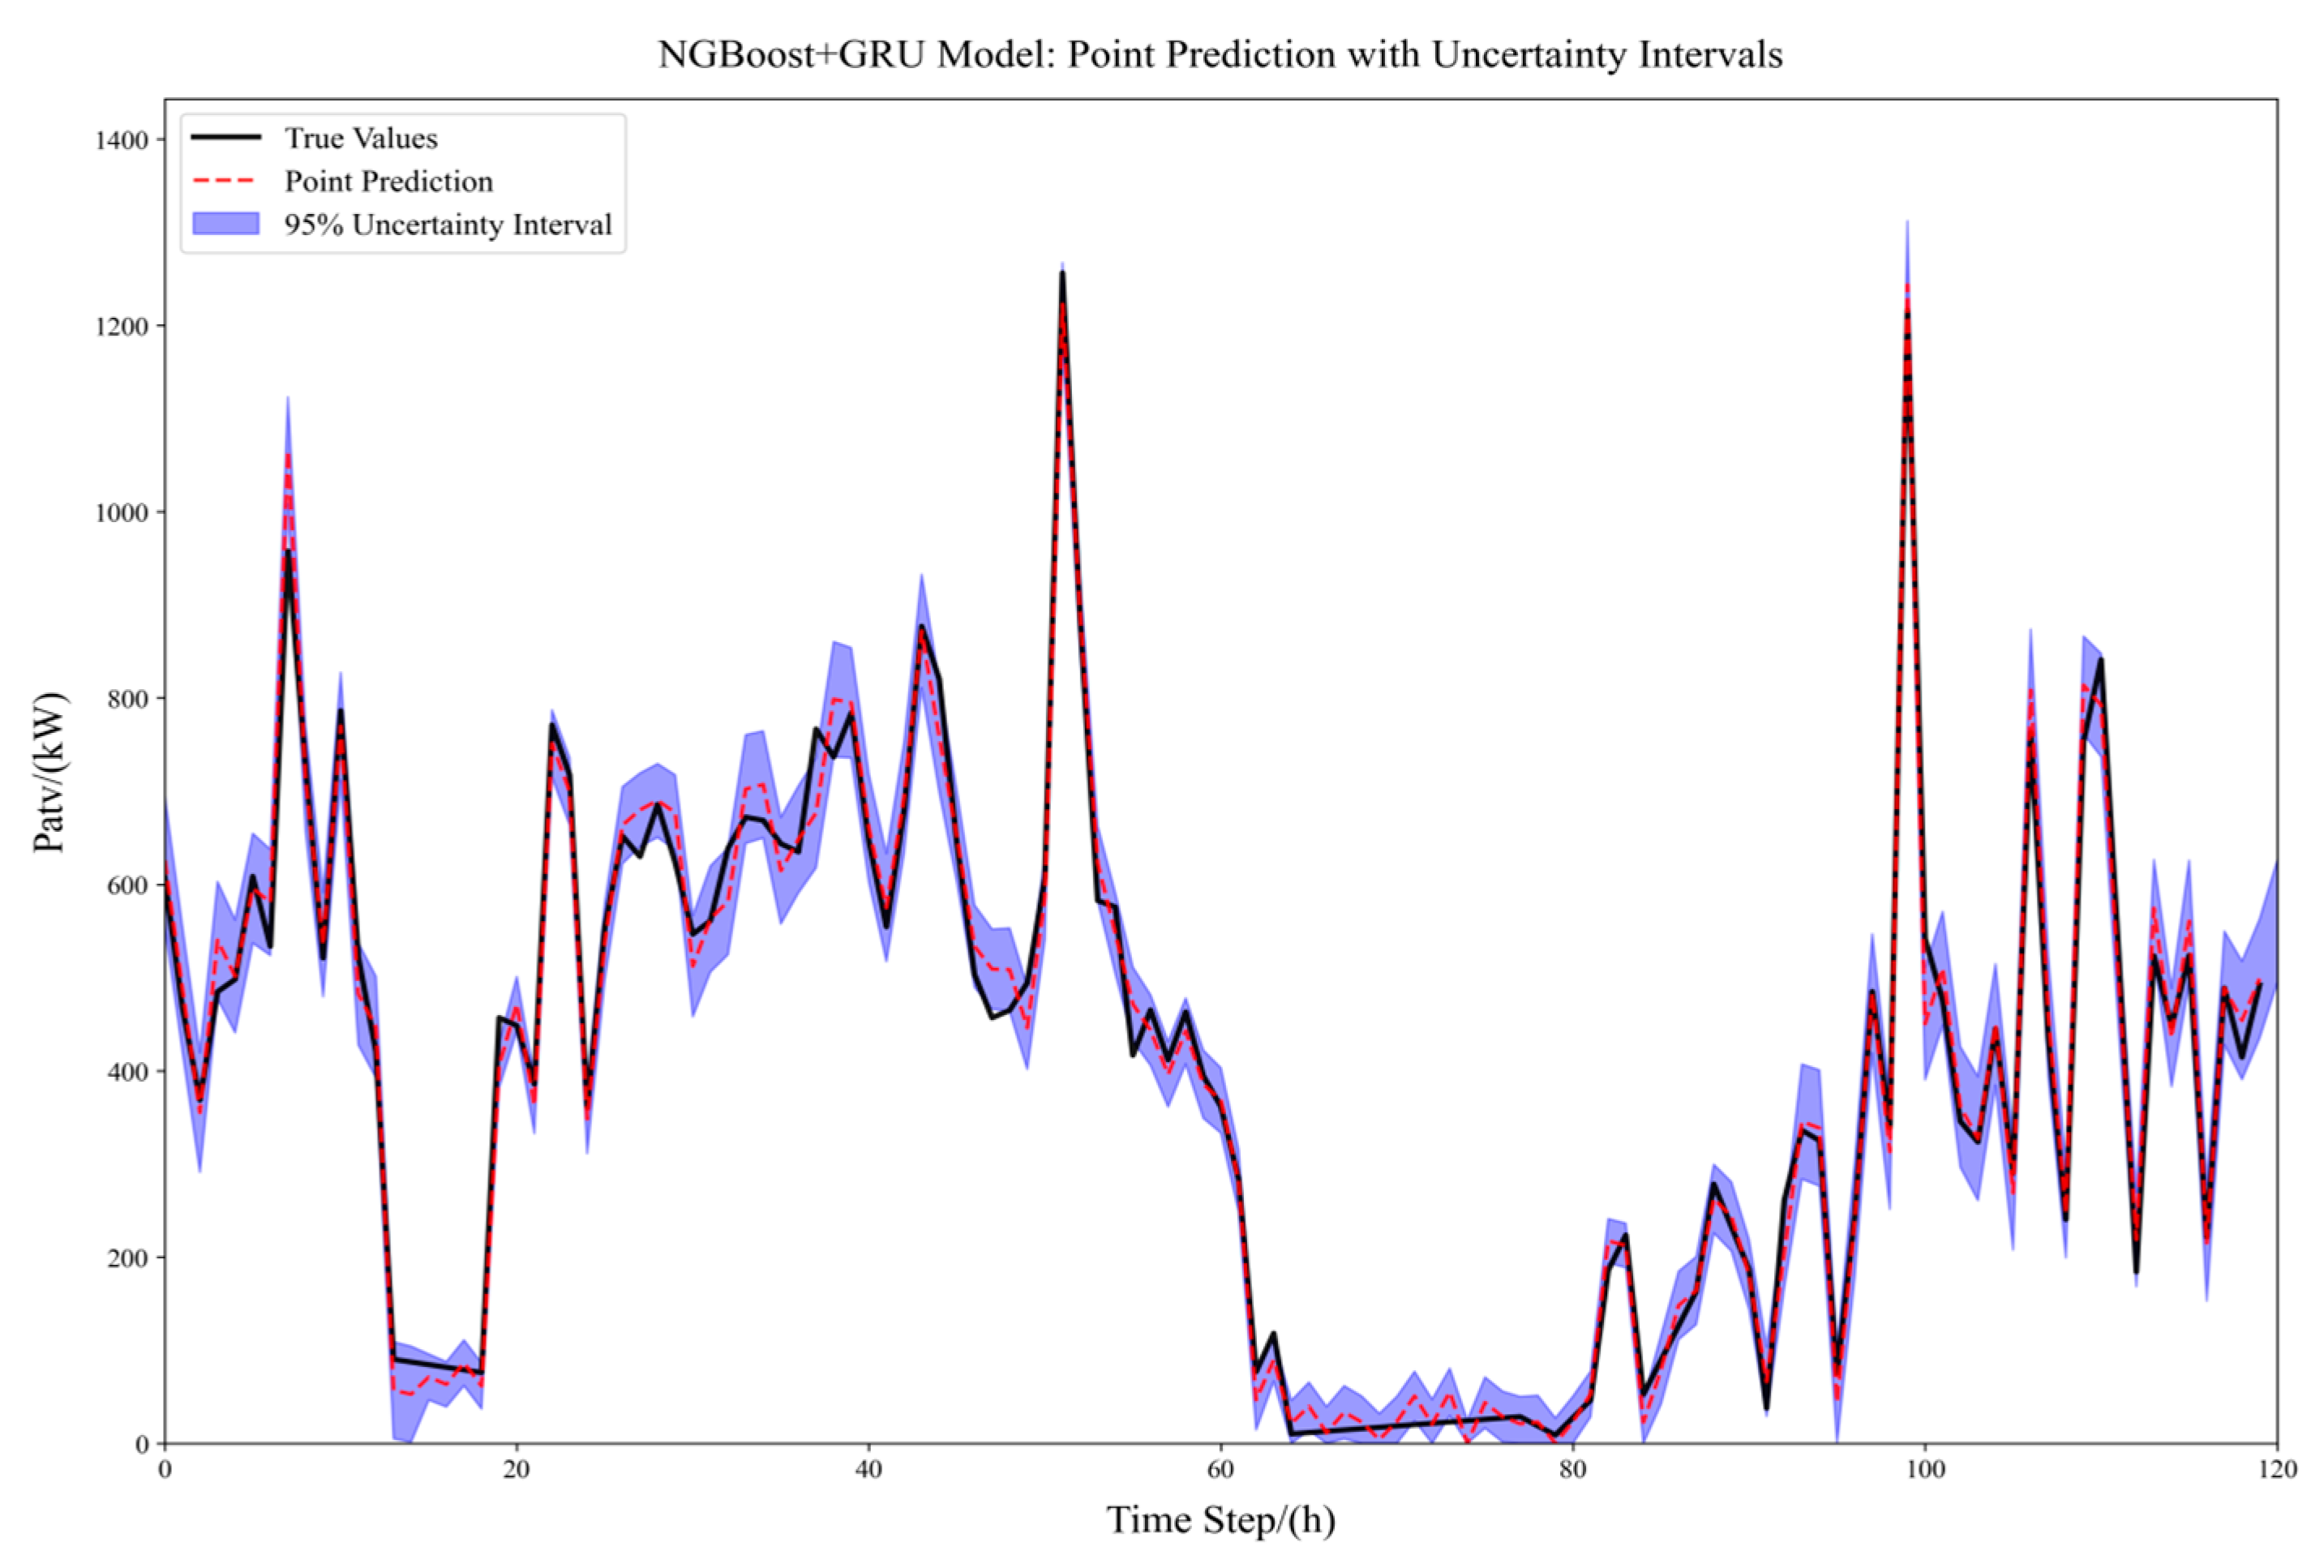
Figure 7 shows the point prediction and uncertainty interval visualization results of the NGBoost–GRU fusion model in the wind power prediction task. By combining GRU’s timing modeling ability with NGBoost’s probabilistic prediction characteristics, the model achieves the dual goals of high-precision point prediction and quantitative uncertainty.
The point prediction value of the model output (red dotted line in
Figure 7) is highly consistent with the real power curve (black solid line). When the wind speed is stable (such as 0–40 h), the predicted value is almost completely consistent with the real value; during the wind speed mutation period (such as 60–80 h), the model captures the dynamic characteristics in time through the GRU gating mechanism and responds to power fluctuations quickly. This performance verifies the strong representation ability of the model of the nonlinear dynamic characteristics in the wind power time series.
The light-blue area denotes the 95% confidence interval for NGBoost’s probabilistic forecasting. It reflects the prediction’s reliability: the interval narrows during wind-speed stability (e.g., 20–30 h), indicating high prediction confidence, and widens during extreme weather (e.g., a strong wind mutation at 60 h), warning of potential predictive risks. This dynamic quantification of uncertainty offers key risk indicators for power grid security scheduling. Grid operators can activate backup power supply plans to prevent frequency instability caused by prediction deviations.
In summary, the NGBoost–GRU fusion model proposed in this paper achieves remarkable performance in wind power prediction. Its point predictions align closely with the actual power curve. Thanks to GRU’s gating mechanism and NGBoost’s probabilistic prediction features, the model accurately captures dynamic characteristics and quantifies uncertainty in both stable and volatile wind speed periods. This provides reliable early warnings for grid security dispatching, confirming the model’s strong ability to characterize nonlinear dynamic features in wind power time series.
3.6. Comparative Experiment
This paper compares the NGBoost–GRU fusion forecasting model with five other algorithms using real wind farm data.
Table 3 shows the RMSE and MAE values for prediction horizons of 3 h, 6 h, 9 h, and 12 h.
As shown in
Table 3, the NGBoost–GRU fusion model outperforms all other algorithms in both long-term and short-term predictions across all evaluation metrics on the real-world dataset. While prediction errors increase with time for all models, the NGBoost–GRU fusion model exhibits the slowest error growth, indicating superior long-term time-series dependency modeling. Compared to models like Transformer and XGBoost, the NGBoost–GRU fusion model effectively reduces prediction bias by integrating GRU’s temporal feature extraction and NGBoost’s nonlinear feature capture capabilities.
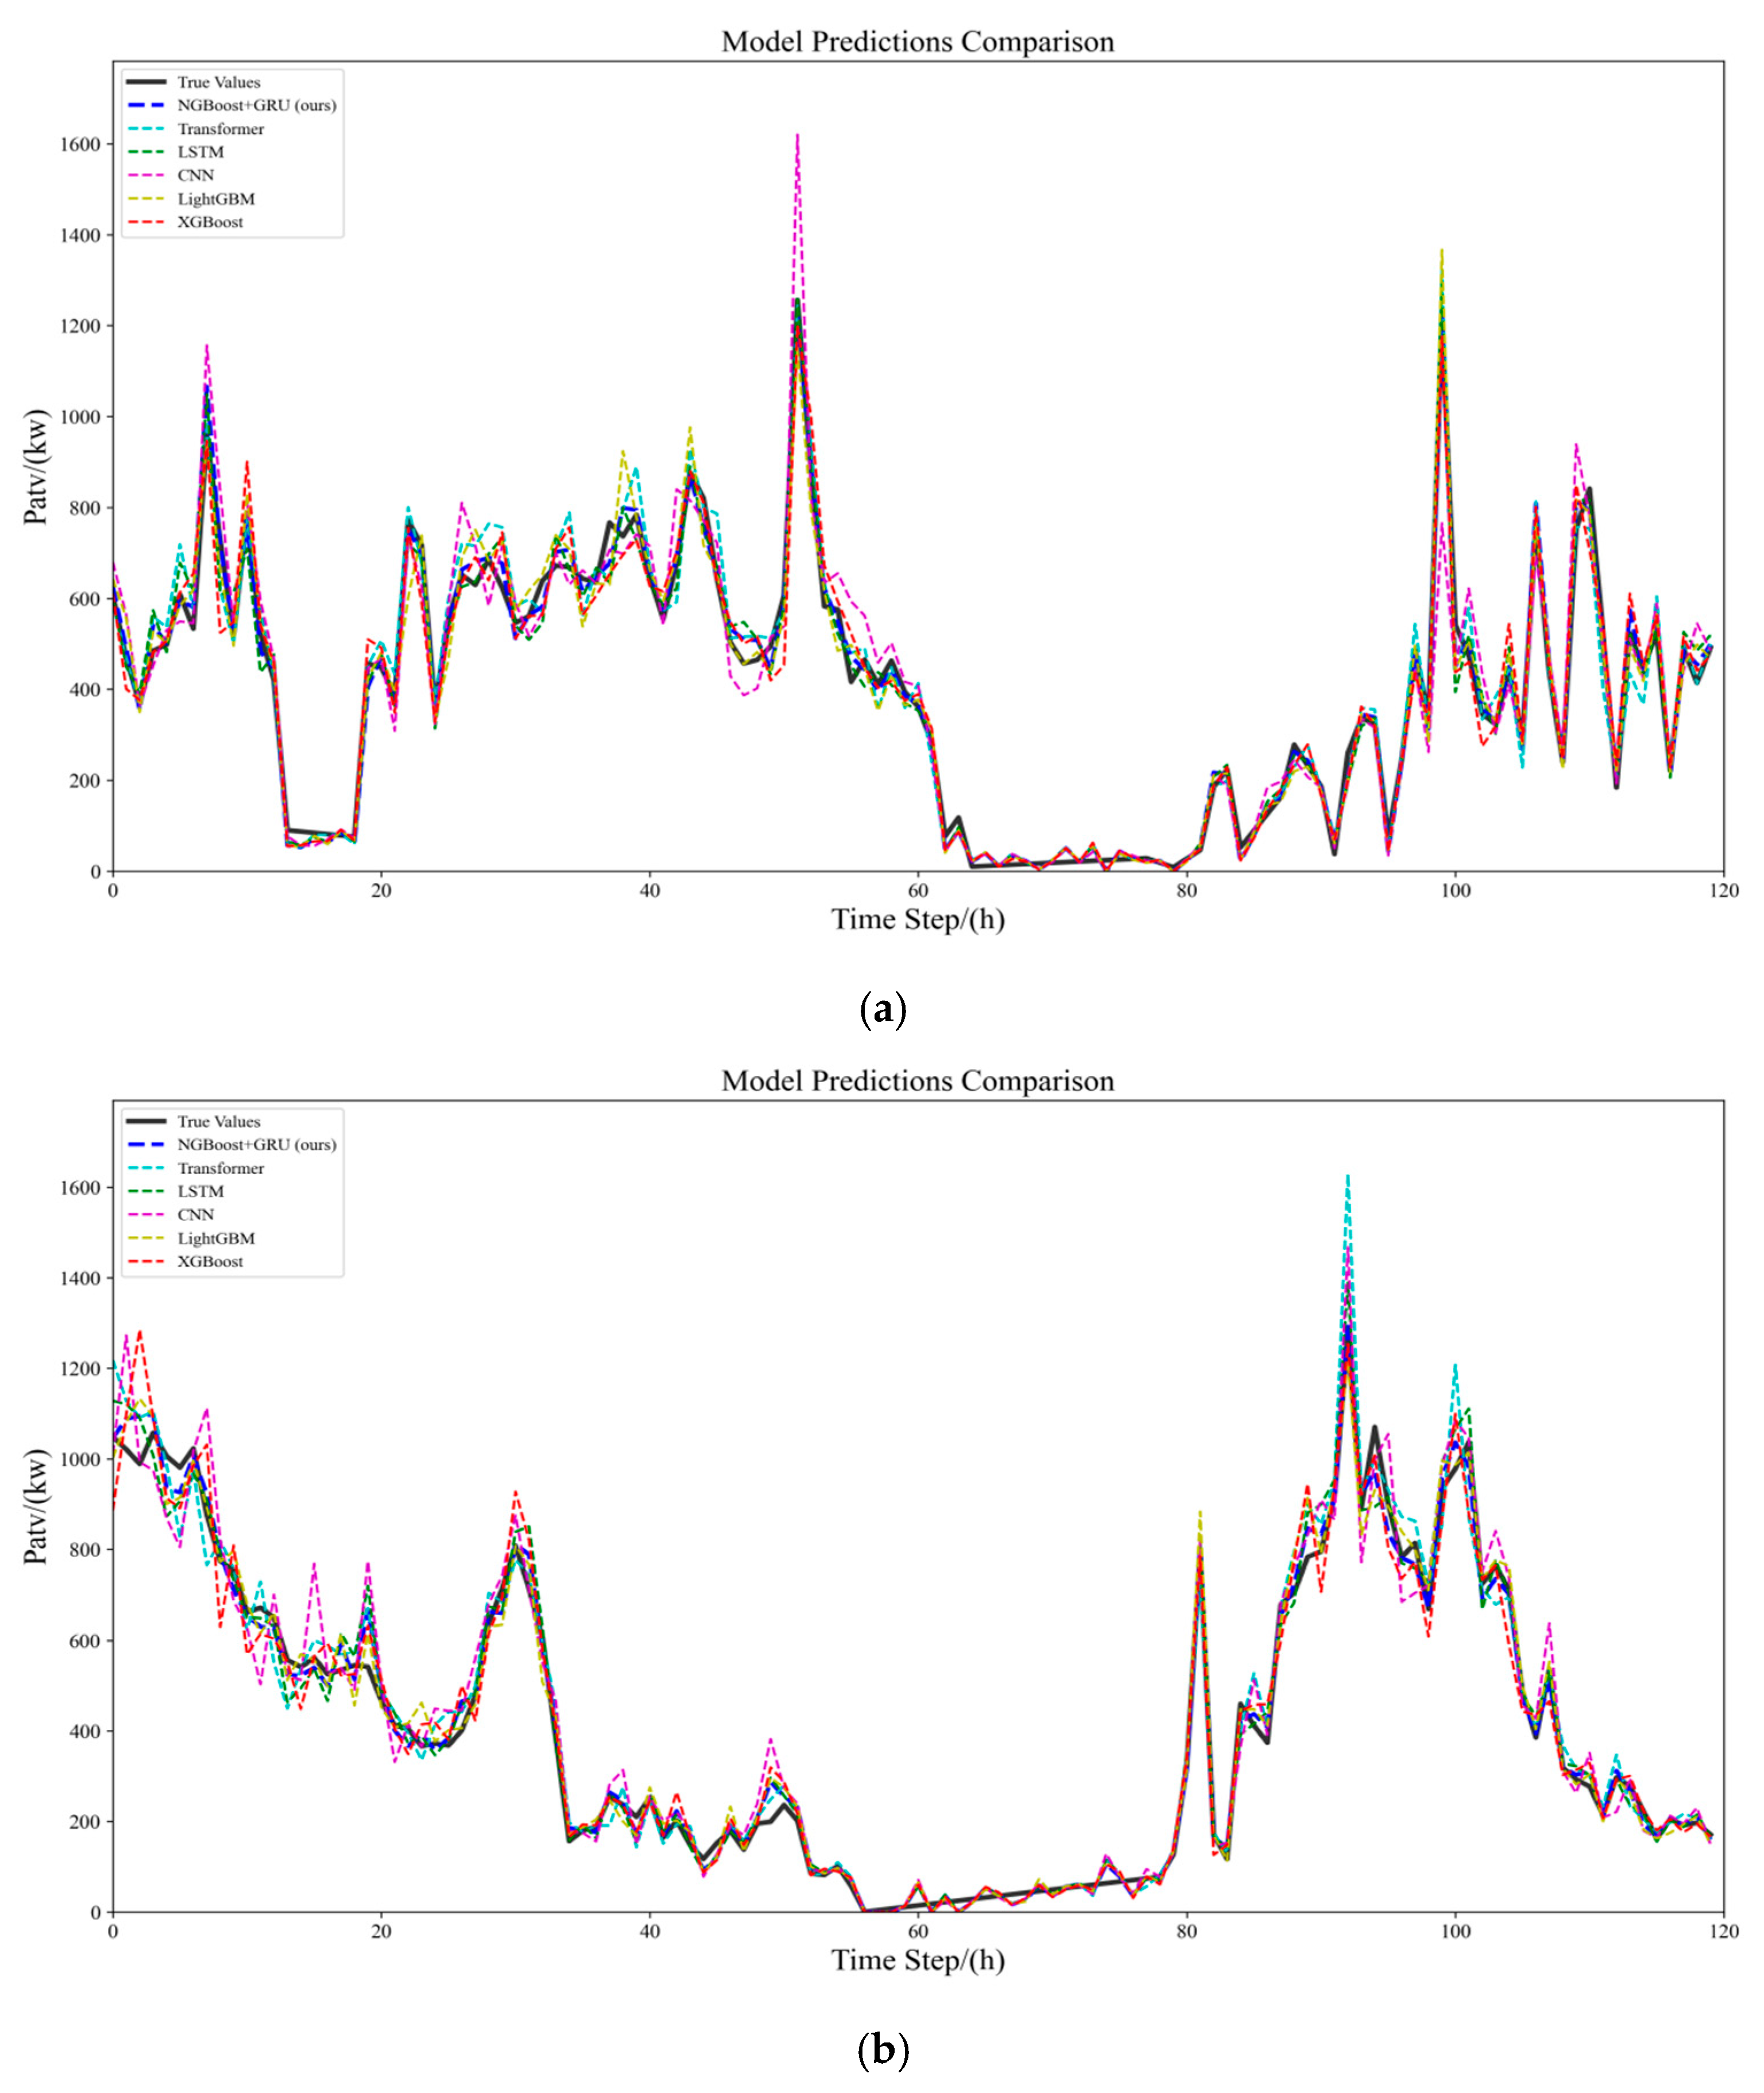
To visually compare NGBoost–GRU fusion model predictions with other algorithms, we randomly selected Turb 1 and Turb 2 from the wind farm dataset, predicted 120 h, and visualized the results.
Figure 8 shows the prediction curves.
The results show that our model performs well on the real dataset of wind farms. The reason may be that the model combines the strong ability of NGBoost in dealing with nonlinear relationships and uncertainties and the advantages of GRU in capturing long-term dependencies of time series data, which can more accurately describe the complex patterns and dynamic changes in wind power generation data, so as to achieve excellent prediction results on each prediction time scale.
3.7. Ablation Experiment
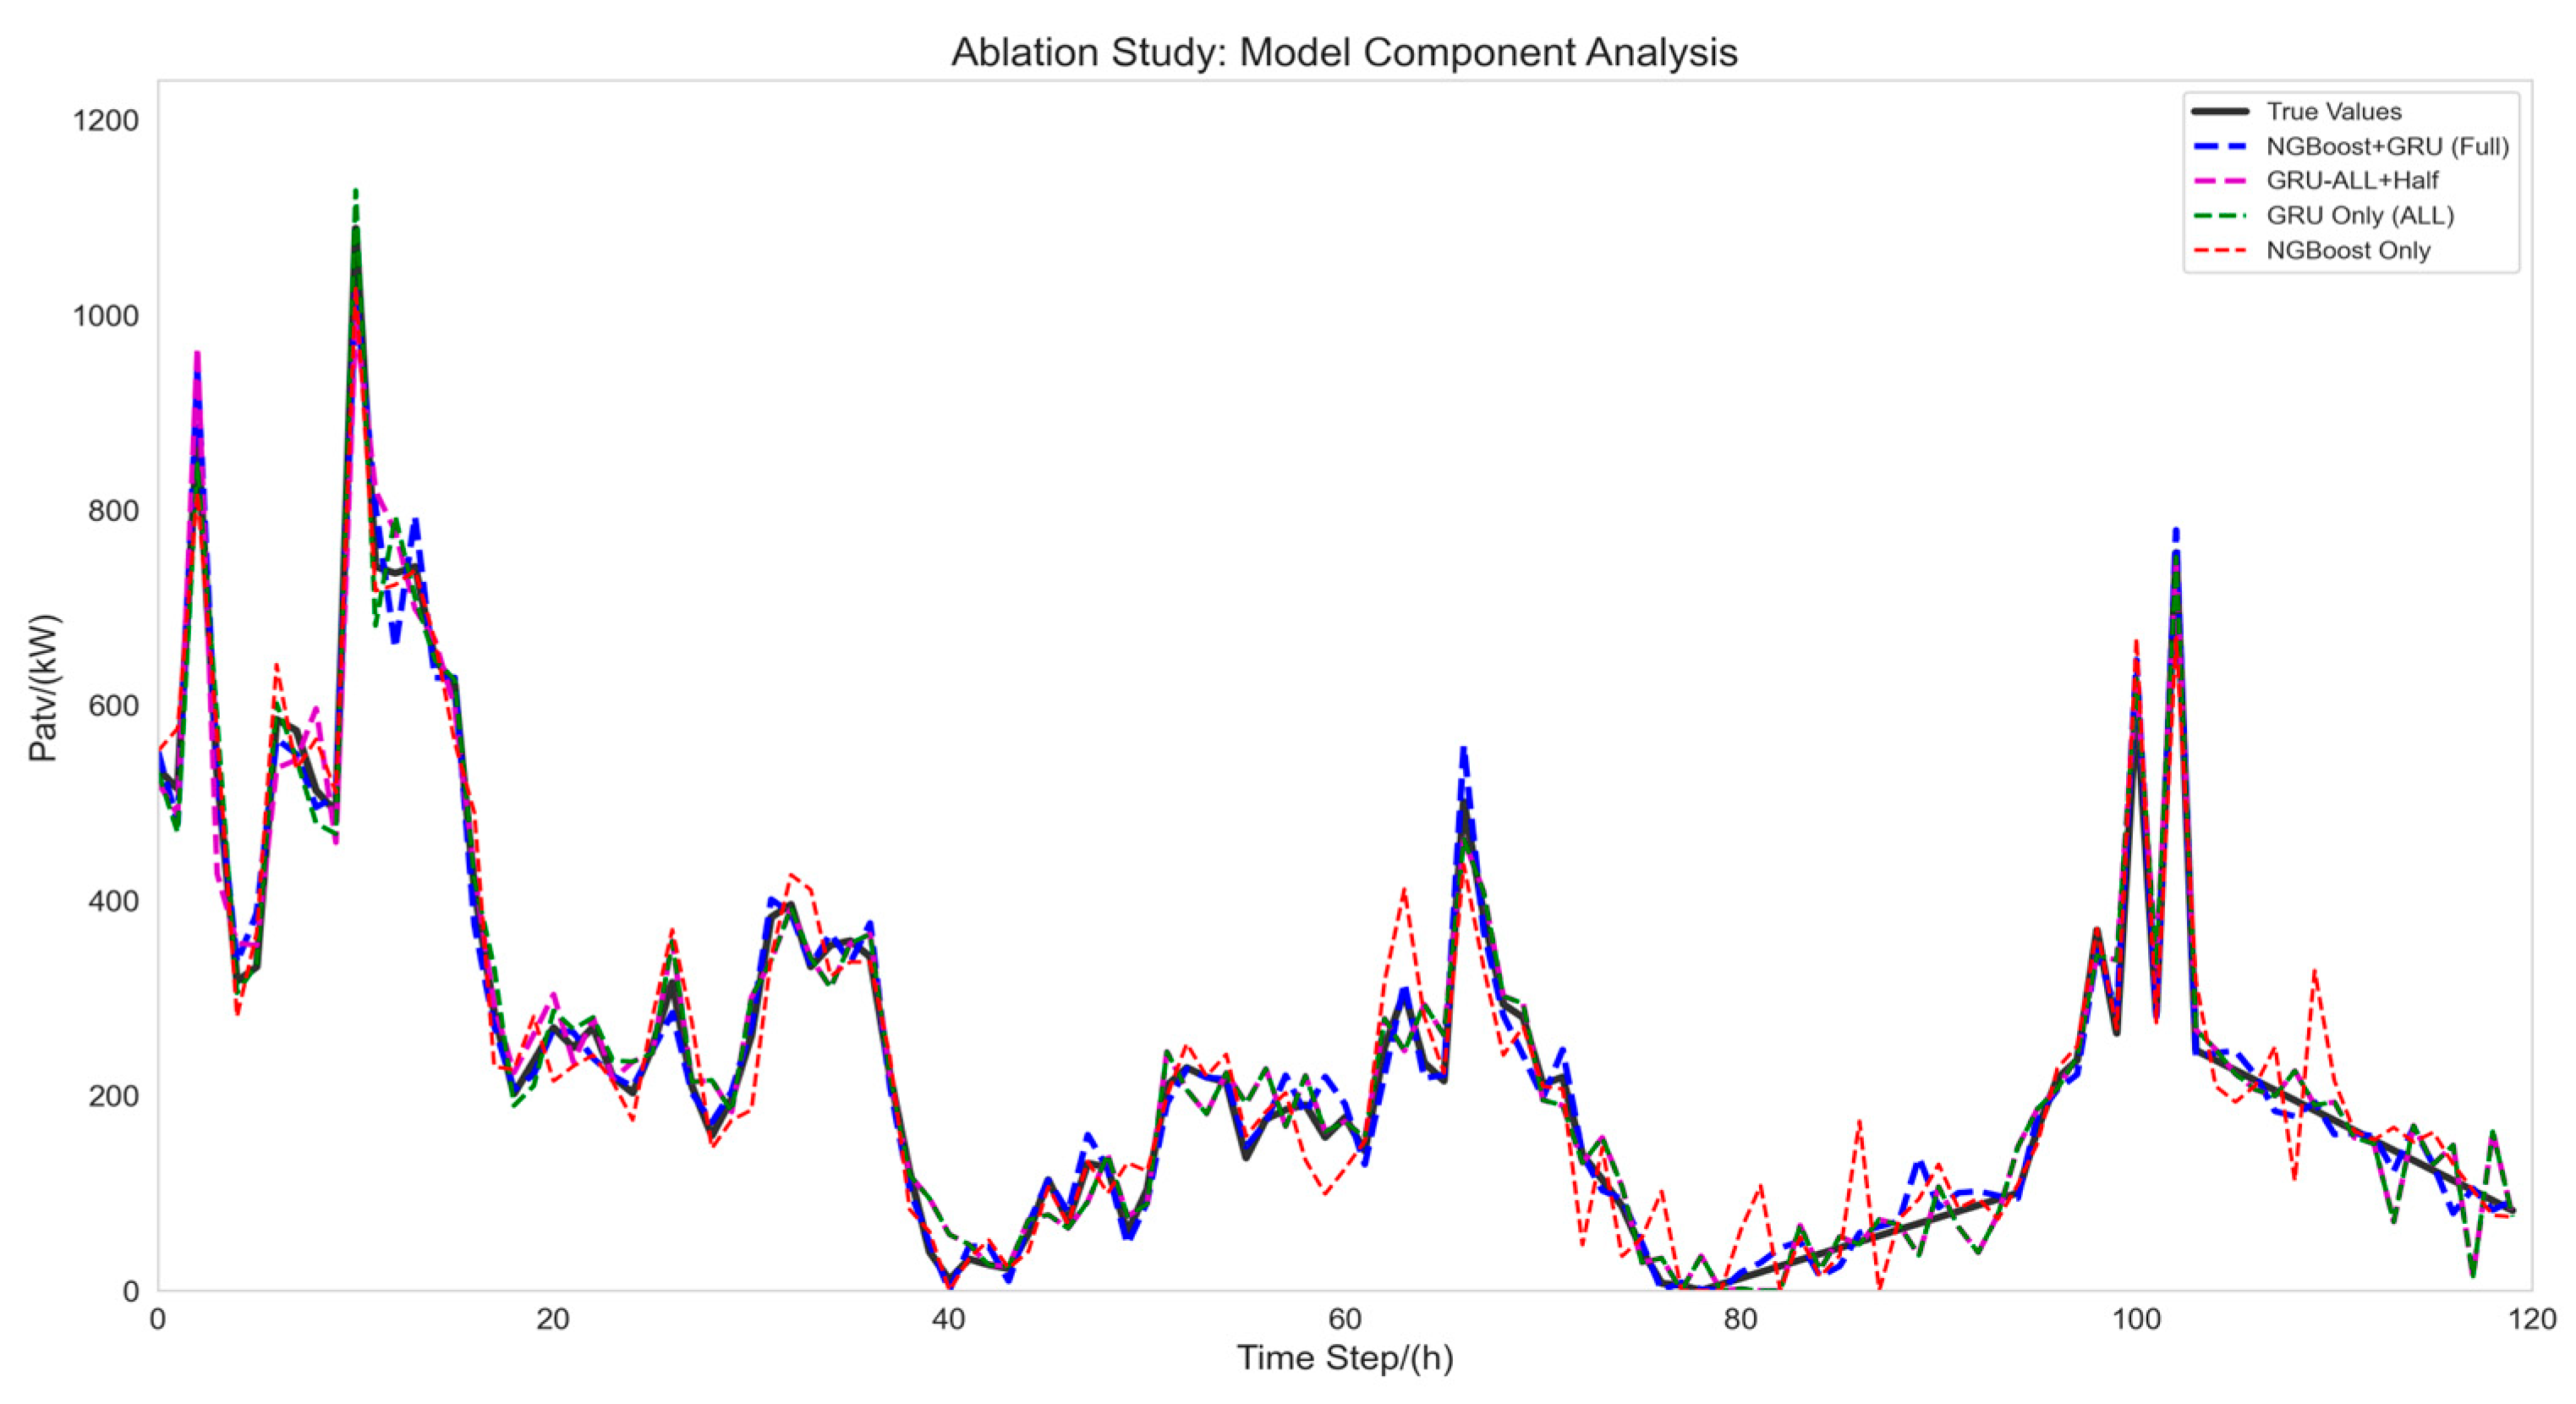
To explore each component’s contribution to the NGBoost–GRU fusion model performance and their synergistic mechanisms, ablation experiments with four model configurations were conducted: NGBoost-Only, GRU-Only, GRU-ALL + Half hybrid, and the Full NGBoost + GRU model. Experimental results are presented in
Table 4 and
Figure 9.
It can be seen from
Table 4 that the model using only NGBoost shows the highest prediction error on all prediction time scales. This is because the dynamic features and long-term dependencies of time series data play a key role in wind power prediction, and NGBoost itself is not good at capturing these time series features. Specifically, the RMSE and MAE of NGBoost Only were 51.99 and 44.47, respectively, which were significantly higher than those of the complete model, NGBoost + GRU (28.87 and 20.24, respectively).
In contrast, the model using only GRU (GRU Only (ALL)) performs well in capturing the dynamic characteristics of time series data. The gating mechanism of GRU can effectively filter and retain valuable historical information for prediction, thus showing good performance in time series prediction tasks. For example, in the 3 h prediction, the RMSE and MAE of GRU Only (ALL) were 46.09 and 33.22, respectively, which were significantly improved compared with NGBoost Only. However, there are still some limitations in relying solely on GRU, because it mainly focuses on the extraction of time series features, and the processing ability of nonlinear relationships and uncertain factors in the data is relatively insufficient.
It is worth noting that this paper designs a GRU-ALL + Half hybrid model, which effectively suppresses the error accumulation in the first half of the sequence by combining the prediction results of the first half of GRU-Half with the prediction results of the second half of GRU-ALL. The experimental results show that this hybrid strategy significantly improves the prediction accuracy: in the 3 h prediction, the RMSE (40.74) and MAE (29.65) of GRU-ALL + Half are 11.6% and 10.8% lower than those of GRU Only, respectively. This improvement takes advantage of GRU-Half’s high-precision capture of short-term dynamics of sequence initiation and makes up for the defect of GRU-ALL’s error accumulation in the initial part of long sequence prediction.
The complete model, NGBoost + GRU, gives full play to the respective advantages of NGBoost and GRU. NGBoost can accurately capture the nonlinear relationship and uncertainty factors in the data, such as the complex correlation between variables, such as ambient temperature, pitch angle, and active power. The temporal features extracted by GRU provide high-quality input for NGBoost, which enables it to model the probability distribution more accurately. This synergy makes the complete model achieve the lowest prediction error at each prediction time scale. For example, in the 12 h prediction, the RMSE and MAE of the complete model are 34.76 and 24.47, respectively, which are significantly better than other models.
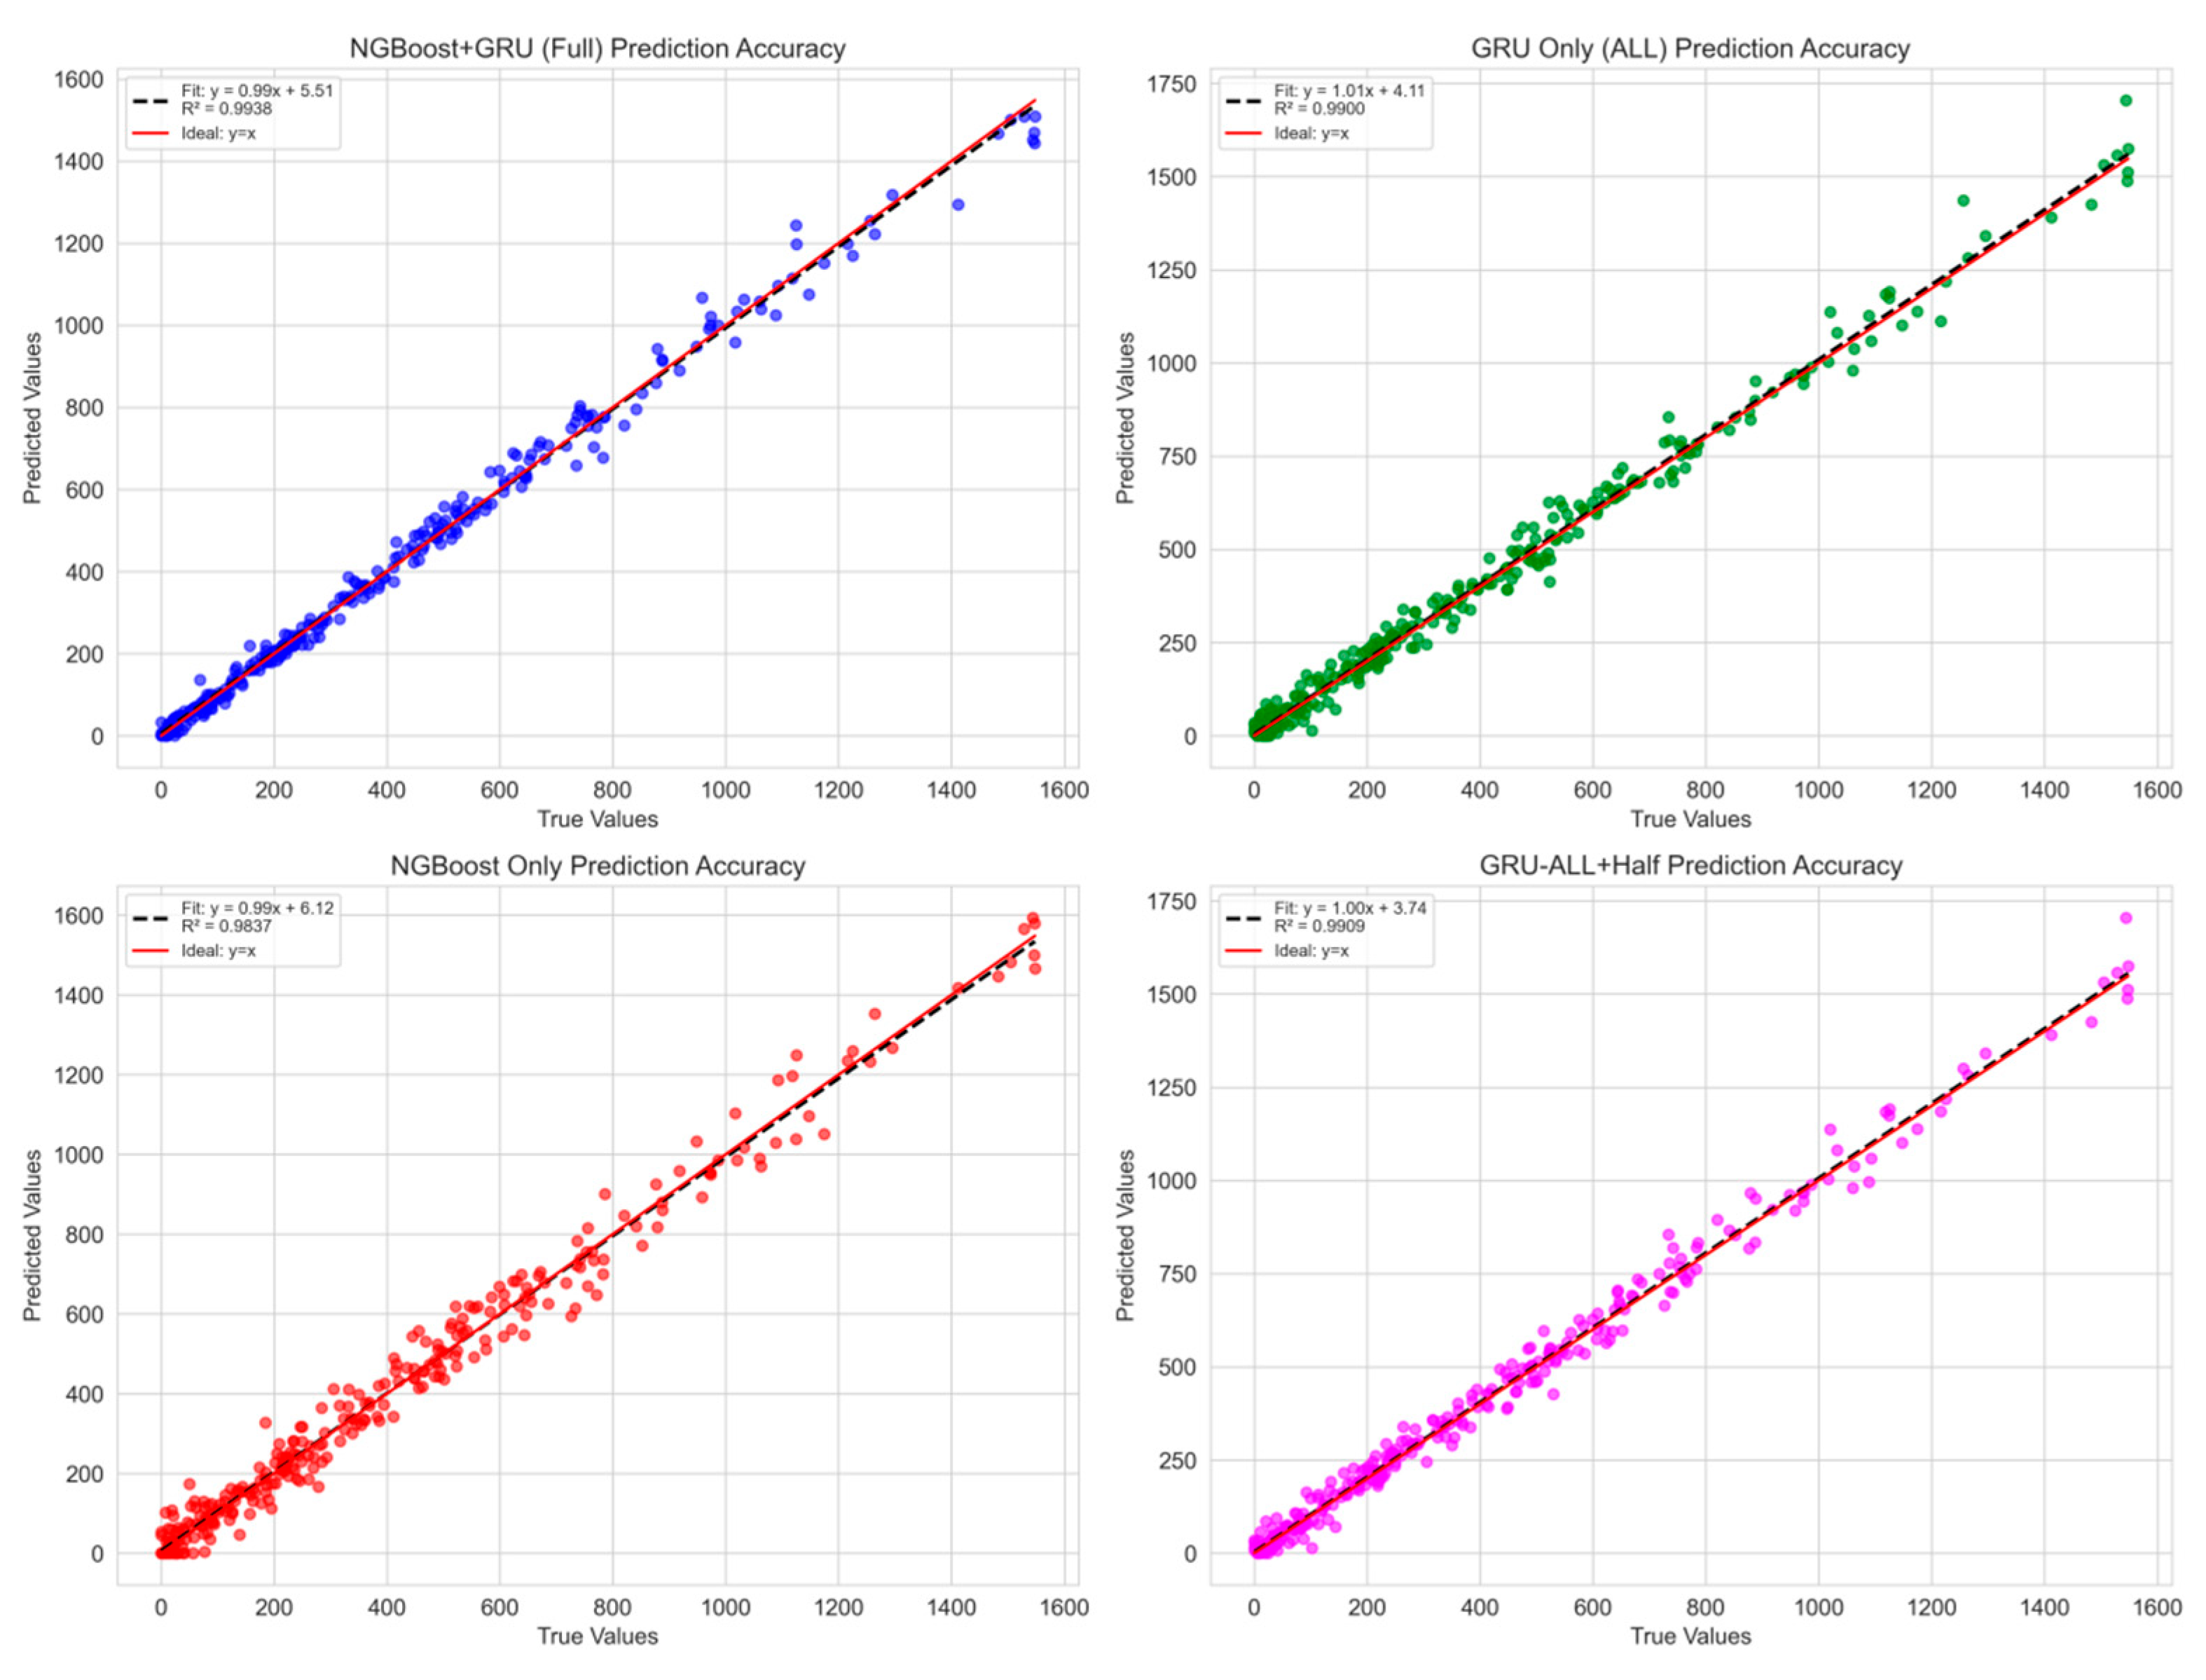
Figure 10 shows the scatter plot of the predicted value and the true value of the complete model, NGBoost + GRU. It can be seen from the figure that the predicted value is highly consistent with the real value, and most of the points are closely distributed near the diagonal, indicating that the model prediction results are consistent with the actual values. This further verifies the effectiveness of the synergy between NGBoost and GRU in wind power prediction tasks. The complete model not only performs well in the error index, but also is significantly better than the single-component model in the accuracy of the actual prediction results.
In summary, the ablation experimental results show that NGBoost and GRU play an irreplaceable role in the complete model, and their synergistic effect significantly improves the accuracy and stability of wind power prediction.
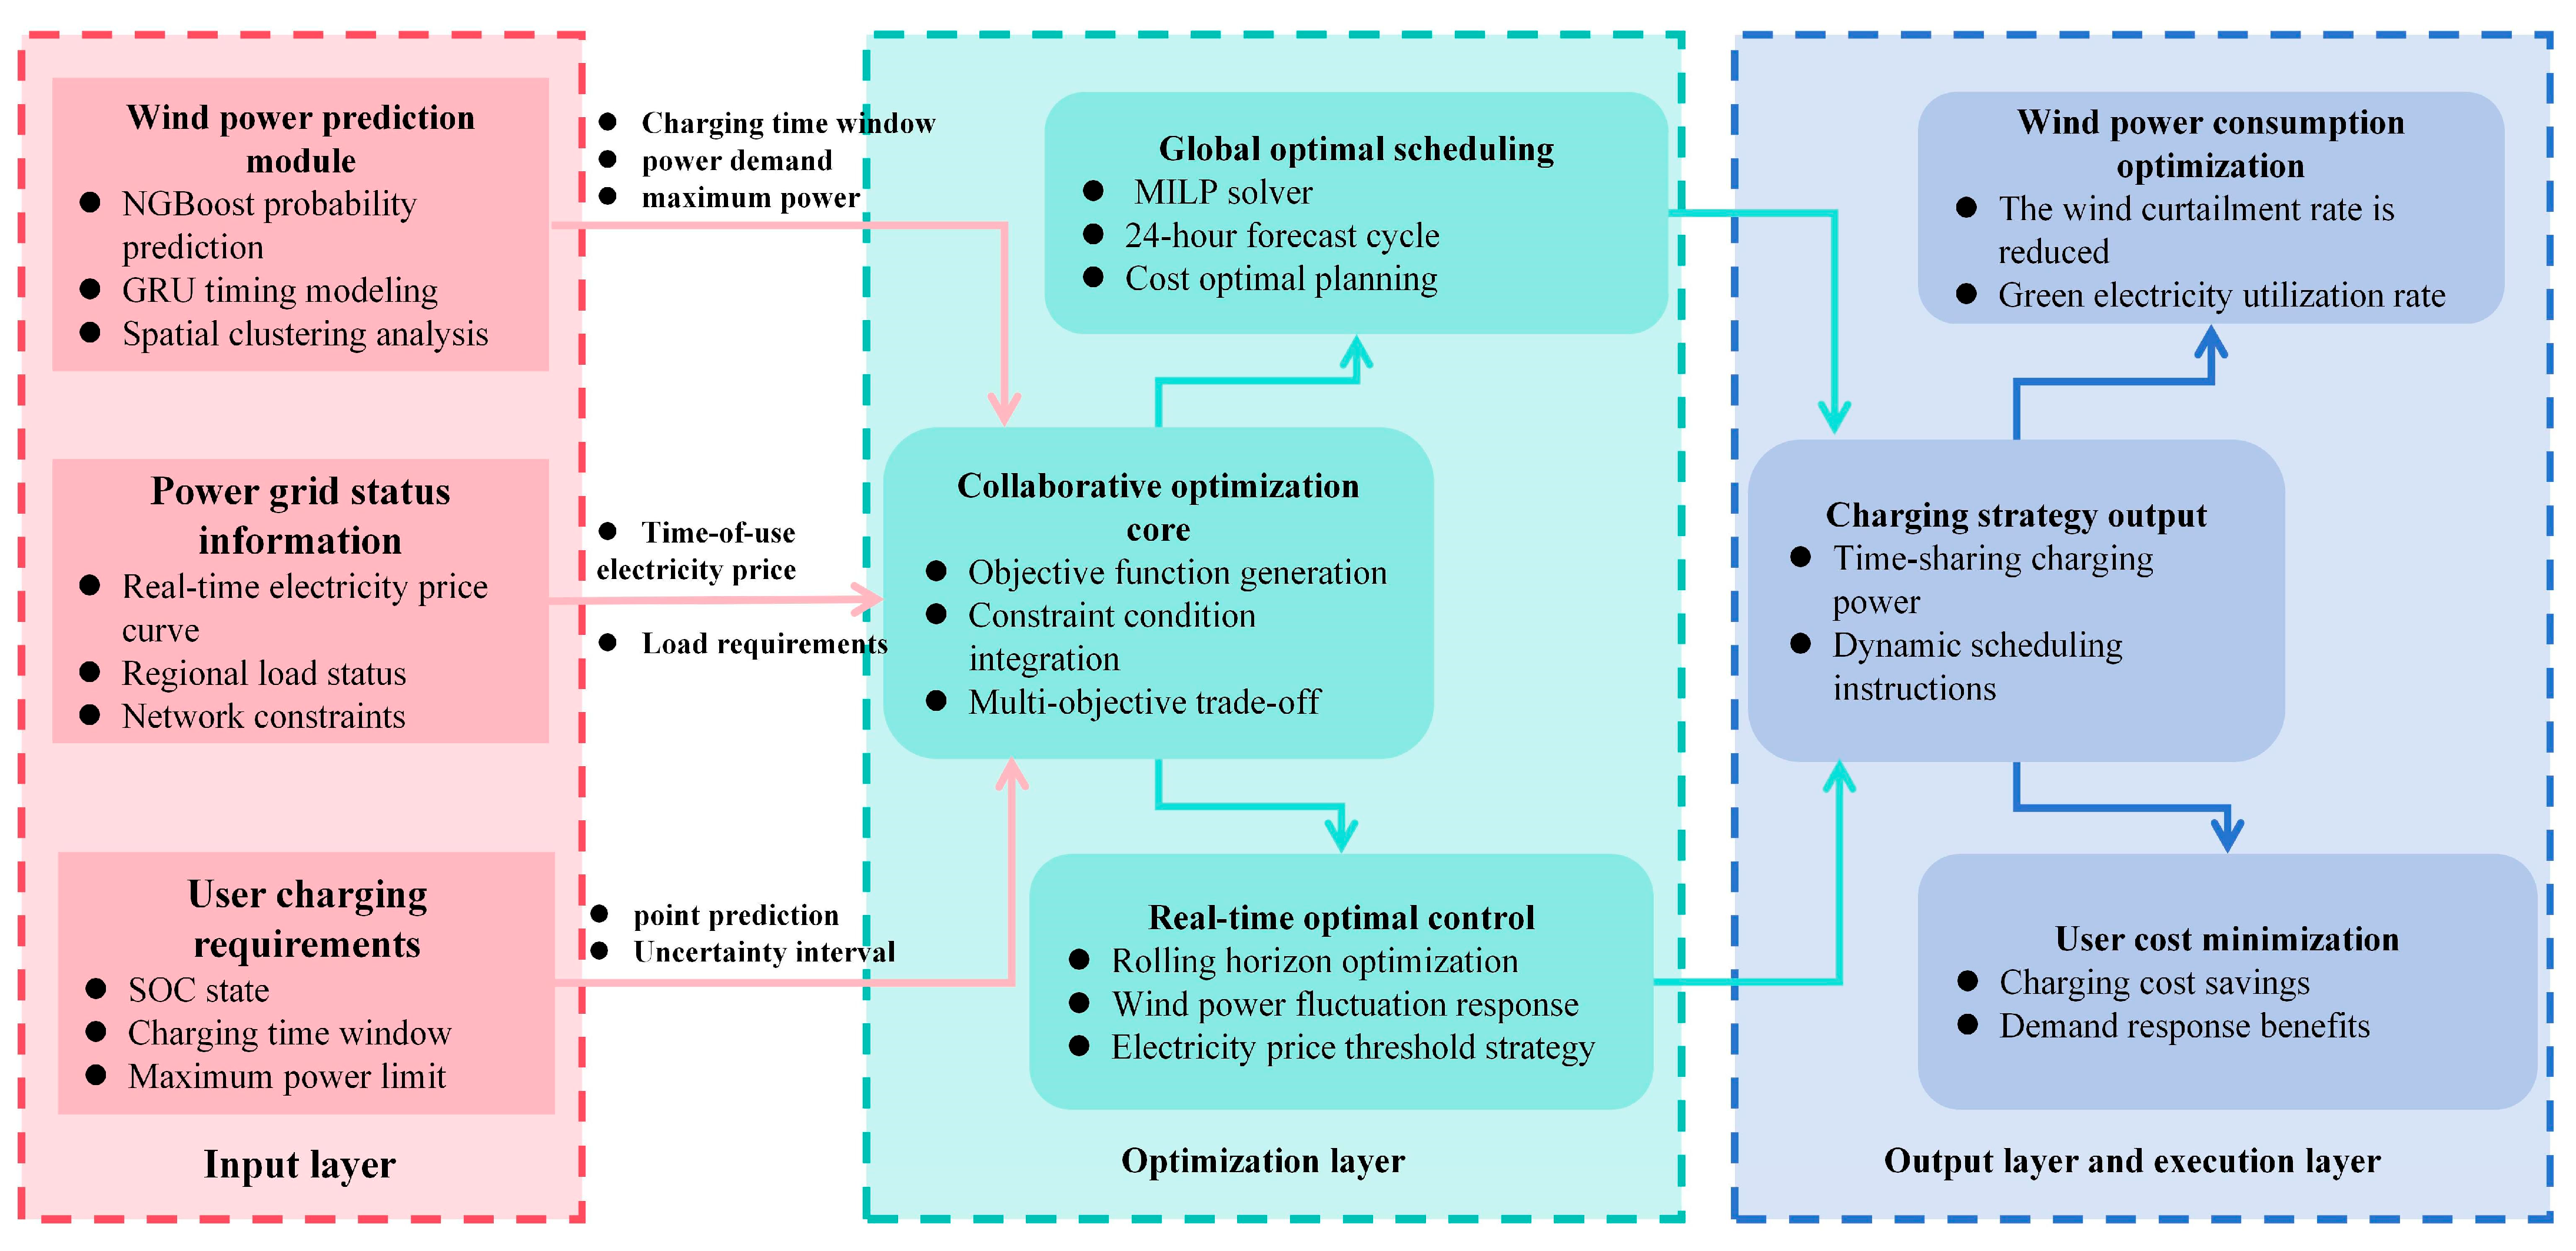
3.8. Dynamic Charging Analysis of Electric Vehicles Based on NGBoost–GRU Fusion Combined Prediction Model
The NGBoost–GRU fusion model achieves high-precision point prediction of power fluctuation and reliable quantification of its uncertainty interval in wind power prediction, which provides key support for subsequent real-time decision optimization. Based on this prediction ability, we design a dynamic charging strategy for electric vehicles, which aims to optimize charging efficiency, reduce user costs, and relieve grid load pressure. In order to rigorously evaluate the applicability and effectiveness of the strategy in actual scenarios, this study constructed a simulation dataset that meets the current charging characteristics of wind power and electric vehicles for experimental analysis. The core idea of this strategy is to intelligently match the predicted wind power output information with the grid state, user demand, and time-of-use electricity price structure, and dynamically guide the charging behavior of electric vehicles.
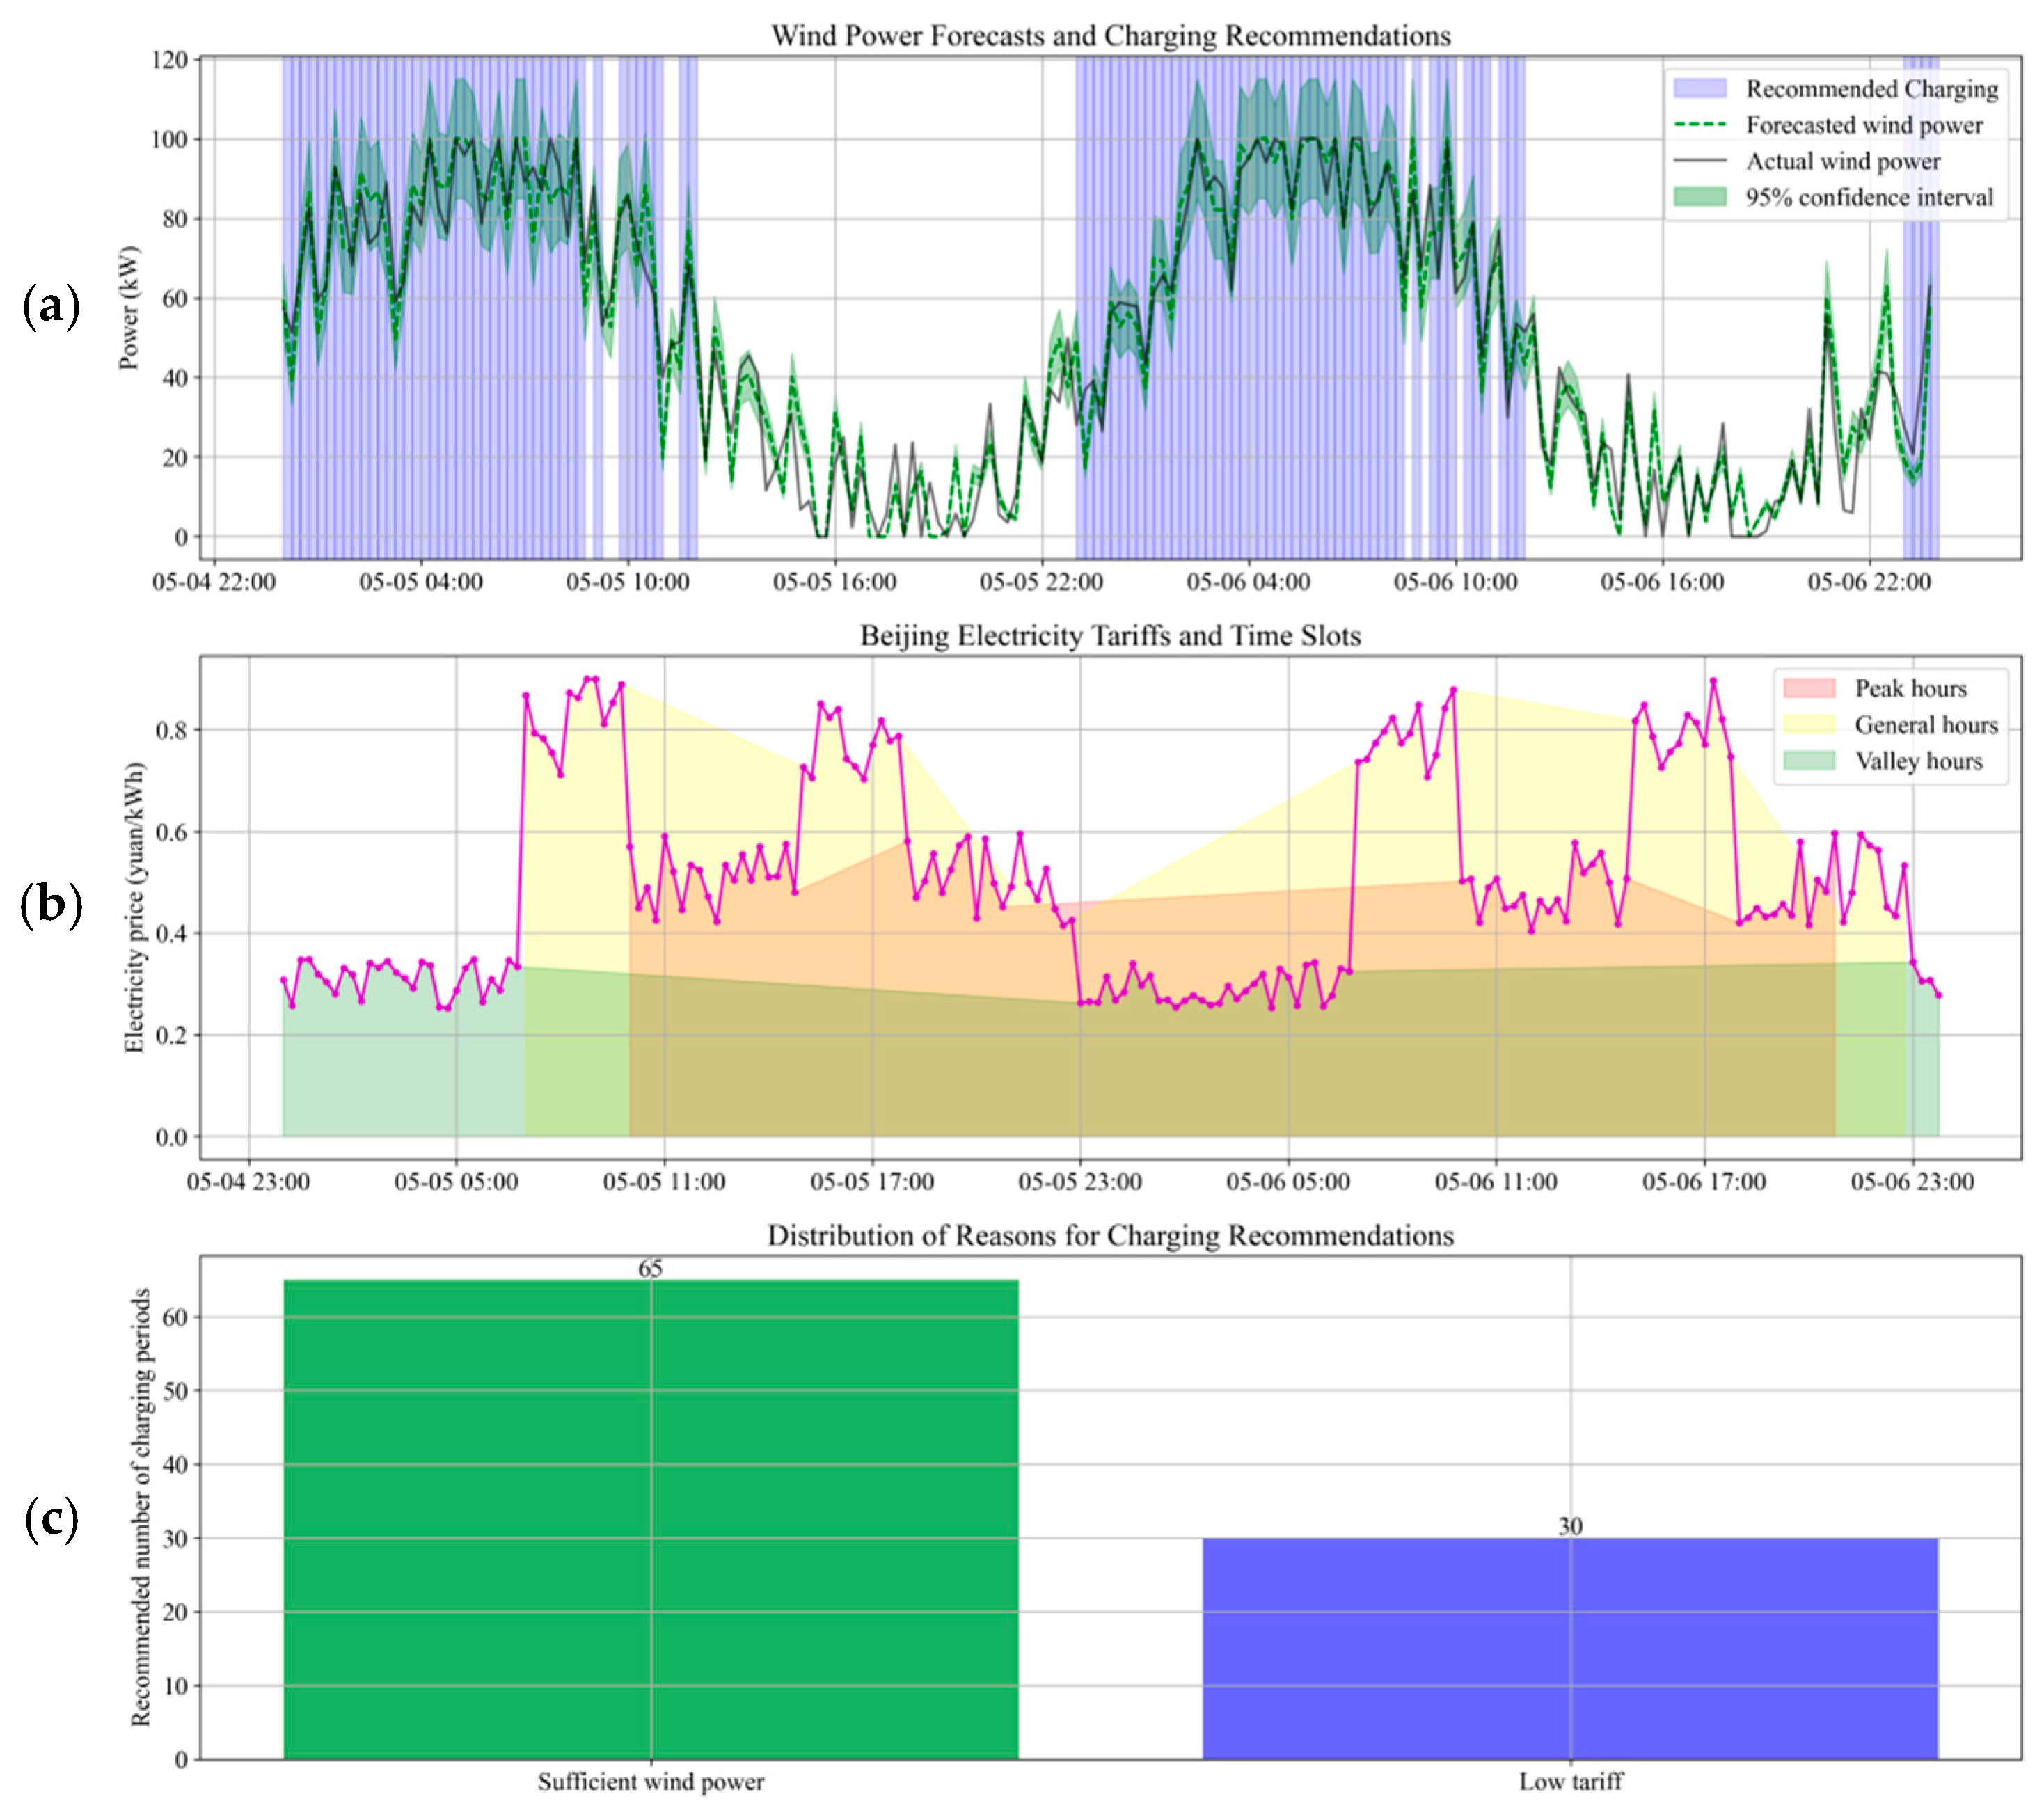
Figure 11 shows a schematic diagram of wind power prediction and electric vehicle charging scheduling. It contains three key subgraphs, which together constitute a complete energy decision support visualization system.
The first subgraph is wind power prediction and charging period recommendation. The GRU-NGBoost model is used to effectively predict wind power. At the same time, the confidence interval is used to provide a risk boundary for decision-making. The confidence interval of this paper is set to 95%, which can intuitively quantify the uncertainty of prediction. The blue area marker image shows the recommended charging period for the charging recommendation.
The second sub-graph clearly shows the peak-valley electricity price structure (magenta curve) of Beijing (2025). The time period is divided into the following: red area—peak period (10:00–15:00, 18:00–21:00, electricity price ≈ 0.8 yuan/kWh); yellow area—normal period (7:00–10:00, 15:00–18:00, 21:00–23:00, electricity price ≈ 0.5 yuan/kWh); green area—valley period (23:00–7:00, electricity price ≈ 0.3 yuan/kWh). The electricity cost and power grid load intuitively show the optimization effect. Provide strong support for decision-making.
The third subgraph shows the optimization results of electric vehicle charging scheduling. More than 70% of the charging suggestions are directly triggered by the dynamic charging strategy designed by the system with sufficient wind power and a low electricity price.
The dynamic charging strategy of electric vehicles based on the NGBoost–GRU fusion prediction model is closely related to the collaborative optimization of wind power prediction and electric vehicle charging demand. In order to achieve the expected goal of the strategy, the following will be an in-depth analysis from three aspects: prediction-driven charging period decision, coordinated optimization of electricity price and economy, and dynamic balance of power grid load, as follows:
The NGBoost + GRU model’s point prediction (the green dotted line in
Figure 11a) accurately depicts the expected trajectory of future wind power. Based on this, the strategy actively identifies and recommends periods of high wind power output (e.g., the blue marked area in
Figure 11a). By guiding the centralized charging of electric vehicles during these periods, the strategy maximizes the local consumption of renewable wind energy, reduces reliance on traditional fossil-fuel power generation, and enhances the system’s environmental performance. The model’s output uncertainty interval (the light-green area in
Figure 11a) provides crucial risk boundary information for decision-making. During stable periods with high prediction confidence (narrow interval), the strategy enables more aggressive use of wind power. When prediction uncertainty increases significantly, the strategy triggers a risk-aversion mechanism. It recommends reducing or avoiding charging or initiating a backup scheduling plan. This buffers the grid impact from prediction deviations and ensures the system’s safe and stable operation.
- 2.
Coordinated Optimization of Electricity Price and Economy:
The strategy integrates wind power forecasts with time-of-use electricity pricing structures (as shown by the magenta curve and red/yellow/green zones in
Figure 11b). This ensures users meet their charging needs at the lowest possible cost. Specifically, it guides users to charge during high-wind-power-output off-peak and regular periods (green and yellow zones in
Figure 11b). This approach offers two benefits: users cut costs by charging at low-price periods, and grid power-purchase costs are reduced, especially during peak periods when high-cost marginal units would otherwise be needed, from Equation (19), it can be calculated that this strategy effectively reduces the user’s charging cost by approximately 18.7%. The model’s prediction accuracy ensures the effectiveness of this “wind-chasing and peak-avoidance” strategy, preventing users from being misled to charge during high-price periods due to prediction errors.
- 3.
Dynamic balance of grid load:
By dynamically adjusting the charging power curve of electric vehicles (as shown in
Figure 11c), the strategy aims to smooth the net load curve of the grid, reduce the peak load, and fill the load trough. For example, in the period when it is predicted that the wind power output is about to decline and the grid load will enter the peak period (combined with the peak period of
Figure 11b and the downward trend of wind power in
Figure 11a), the strategy can reduce the charging power in advance or delay some non-emergency charging requirements (combined with the charging completion time window set by the user), thereby effectively alleviating the peak shaving pressure of the grid, reducing the risk of line congestion, and improving the utilization rate of transmission and distribution equipment. The optimization results shown in
Figure 11c (such as the increase in charging power in the valley period) are the intuitive embodiment of this dynamic balance effect.
Based on the wind power prediction ability of the NGBoost–GRU fusion prediction model, this paper designs a dynamic charging strategy for electric vehicles, which shows significant advantages in optimizing charging efficiency, reducing user costs, and alleviating grid load pressure. It provides strong technical support and theoretical basis for the efficient coordinated operation of the smart grid and electric vehicles, and is of great significance for promoting the consumption of renewable energy and the stable development of the smart grid.
4. Discussion
The NGBoost–GRU fusion-based wind power prediction and EV dynamic charging strategy offer innovative solutions for optimizing AC energy integration systems. By combining GRU’s temporal feature extraction and NGBoost’s probabilistic prediction, the model enhances wind power prediction accuracy and reliability, effectively supporting EV charging strategy optimization. Accurate wind power prediction aids grid operators in devising scientific scheduling plans, pre-planning energy storage charging/discharging, and traditional thermal power output adjustments, thus improving grid operation stability and economy. The strategy also guides EV charging behavior, enabling users to enjoy low-cost charging while supporting grid operations. This fosters a user-grid win-win scenario and promotes the coordinated development of transportation electrification and energy transformation.
However, this study has some limitations in practical application, mainly reflected in the following aspects. First of all, the research assumes that the power grid capacity is not limited, and the practical problems of power grid expansion are not fully considered. At present, under the background of the rapid development of electric transportation and renewable energy charging infrastructure, the power grid complex is facing huge expansion pressure. Wind farms are connected to high-voltage and ultra-high-voltage networks, and electric vehicle charging stations are mostly connected to low-voltage networks. The entire power grid complex is involved, but increasing the capacity of transmission lines and substations requires a lot of time and resources. Secondly, this strategy is mainly applicable to the slow charging station scenario, which requires a large number of electric vehicles to be connected to the slow charging station and implement the charging algorithm, while reducing the electricity price to attract users. However, this mode does not apply to the fast charging station network. When the battery power is insufficient and the driver plans to continue driving, it is difficult to effectively control the fast charging demand using this strategy, thus limiting the scale of the adjustable load. In addition, the complexity and high cost of automatic control systems and communication channels are not considered in the study. Controlling such a large-scale equipment complex requires a large number of communication channels and automatic control system support, which undoubtedly increases the financial burden of actual implementation. Therefore, although the strategy has obvious advantages in theory, its cost-effectiveness ratio has not been fully evaluated, which poses a major limitation to its practical application.
In summary, although the NGBoost–GRU fusion prediction model and the dynamic charging strategy of electric vehicles proposed in this paper have significant advantages and broad application prospects in theory, they still face many challenges in practical applications. Future research should focus on the following directions: First, develop a lightweight and efficient model architecture to reduce the computational complexity and improve the real-time performance of the model in large-scale data scenarios. Second, expand the scope of research, comprehensively consider the deep coupling mechanism of different types of loads (such as electric buses, electric trucks, etc.) and renewable energy sources such as wind power, and build a more comprehensive integrated energy system model. Third, deepen the research on uncertainty quantification and risk assessment, and develop a refined risk assessment index system and early warning mechanism based on advanced theories to provide more forward-looking guidance for power grid dispatching decision-making. Fourth, carry out model verification and optimization in multiple regions and multiple scenes to improve the adaptability and generalization ability of the model. Fifth, evaluate the cost-effectiveness ratio of the implementation of the strategy, comprehensively consider the actual factors such as power grid expansion and communication system construction, and propose solutions with economic feasibility. Through these efforts, it is expected to promote the integration of energy exchange technology to play a greater role in practical applications, and help achieve global energy transformation and carbon emission reduction targets.
5. Conclusions
This paper makes practical contributions to the integration of traffic and energy by focusing on wind power prediction and EV dynamic charging strategies. First, it proposes an NGBoost–GRU fusion combined model for high-precision wind power prediction. This model not only accurately forecasts wind power expectations but also quantifies prediction uncertainty, offering crucial risk warnings for grid dispatching. Second, based on this predictive ability, the paper designs a dynamic EV charging optimization strategy. By aligning with the spatiotemporal fluctuations of wind power generation, time-of-use electricity prices, and user demand, this strategy enables precise scheduling of EV charging loads. In practice, it reduces user charging costs by approximately 18.7%, boosts local wind power consumption, achieves grid load peak-shaving, and enhances system economic and operational stability.
The study focuses on model prediction performance and strategy optimization but faces practical engineering challenges like grid expansion limits, strategy adaptability to fast-charging scenarios, and the complexity and cost of large-scale control systems. Future research should develop lighter, more efficient models for better real-time performance, expand strategies to handle diverse loads and complex scenarios, deepen uncertainty-based risk assessment, and verify the optimization model’s cost-effectiveness across multi-region and multi-scenario settings. This will facilitate large-scale energy integration technology application and support energy transformation and “dual-carbon” goals.


