Article

Assessment of Integrated Coastal Vulnerability Index in the Coromandel Coast of Tamil Nadu, India Using Multi-Criteria Spatial Analysis Approaches

by
Ponmozhi Arokiyadoss
1,*,
Lakshmi Narasimhan Chandrasekaran
2,
Ramachandran Andimuthu
3 and
Ahamed Ibrahim Syed Noor
3
1
Institute for Ocean Management, Department of Civil Engineering, College of Engineering, Guindy Campus, Anna University, Chennai 600025, India
2
Department of Geology, College of Engineering, Guindy Campus, Anna University, Chennai 600025, India
3
Centre for Climate Change and Disaster Management, Department of Civil Engineering, College of Engineering, Guindy Campus, Anna University, Chennai 600025, India
*
Author to whom correspondence should be addressed.
Sustainability 2025, 17(14), 6286; https://doi.org/10.3390/su17146286
Submission received: 10 April 2025 / Revised: 28 May 2025 / Accepted: 1 July 2025 / Published: 9 July 2025

Abstract

This study presents a comprehensive coastal vulnerability assessment framework by integrating a range of physical, environmental, and climatic parameters. Key criteria include shoreline changes, coastal geomorphology, slope, elevation, bathymetry, tidal range, wave height, shoreline change rates, population density, land use and land cover (LULC), temperature, precipitation, and coastal inundation factors. By synthesizing these parameters with real-time coastal monitoring data, the framework enhances the accuracy of regional risk evaluations. The study employs Multi-Criteria Spatial Analysis (MCSA) to systematically assess and prioritize vulnerability indicators, enabling a data-driven and objective approach to coastal zone management. The findings aim to support coastal planners, policymakers, and stakeholders in designing effective, sustainable adaptation and mitigation strategies for regions most at risk. This integrative approach not only strengthens the scientific understanding of coastal vulnerabilities but also serves as a valuable tool for informed decision-making under changing climate and socioeconomic conditions.

1. Introduction

Coastal zones are among the most sensitive and dynamic geographical areas, influenced by a combination of human activity and natural occurrences [1]. These regions are vital for human activities such as fishing, shipping, tourism, and recreational pursuits [2]. They are susceptible to ecological catastrophes such as storms, flooding, erosion, and rising sea levels, which profoundly affect ecosystems and communities [3,4]. A significant proportion of the global population resides in coastal cities, with over 40% of people living within 100 km of the coastline [5,6]. These locations significantly bolster essential economic activities, such as fishing and shipping, which rely largely on coastal infrastructure and ecosystems [7,8]. Ali et al. [9] and Ford-Learner et al. [10] assert that these activities are essential; yet, they significantly exacerbate the economic, social, and environmental pressures on coastal ecosystems.
Coastal vulnerability assessment is an increasingly significant subject globally. According to the literature, researchers have made numerous efforts to evaluate the vulnerability of coastal areas, and one of the most widely used tools for this purpose is the Coastal Vulnerability Index (CVI) [11,12,13,14], which evaluates coastal vulnerability considering several physical elements that affect shoreline changes. In research aiming at assessing the CVI [14,15,16,17], the most often used multi-criteria decision analysis (MCDA) method [18] is the Analytic Hierarchy Process (AHP) approach. The AHP approach provides a disciplined approach to making decisions in difficult circumstances [19]. This approach has been extensively applied in coastal vulnerability assessments to combine several environmental and human elements [20,21]. The AHP method allows one to create consistent weighting schemes that increase the dependability of vulnerability indices by means of quantitative expert assessments [2]. Research has looked at Bangladesh [22], the Digha Coast in West Bengal, India [23], the Belmiro coastal stretches in Brazil [17], and the Chennai Coast in India [24]. The AHP method has shown success in identifying significant development areas in need [25]. In past studies using MCSA approaches, such as the AHP methodology [14,26], the CVI and the ICVI have been used.
Many methodological tools have been developed worldwide, highlighting geomorphological sensitivity. Tursi et al. [27] recommended a thorough erosion vulnerability study for high coastal sectors in Southern Italy, thereby evaluating coastal vulnerability to natural catastrophes. Rizzo et al. [28] developed a coastal vulnerability method applied to the Valdelagrana area in Spain, which included both physical and socioeconomic parameters. Concerning storm-induced hazards across coastal cities like Cartagena and Cadiz, risk assessment studies, like those by Rangel-Buitrago and Anfuso [29], focus on the importance of integrating urban exposure with climatic variability. Mostly dealing with sea-level rises, Gornitz et al. [11] initiated a coastal risk database for the southeast United States. More recently, Tursi et al. [30] proposed advanced geospatial methods for evaluating environmental sensitivity in dynamic coastal environments. Under the increasing influence of climate change, analyzing both the natural and anthropogenic elements of coastal vulnerability under the growing impact of climate change has further broadened the scope, as shown by Anfuso et al. [31] and Mooser et al. [32].
This study advances existing vulnerability assessment methods by integrating physical, socioeconomic, and climatic factors into a unified framework. Unlike traditional indices, it incorporates climate change impacts such as temperature rise, rainfall variation, and coastal flooding inundation. This comprehensive, adaptable, and quantitative approach enhances accuracy and applicability across different coastal regions, offering a more robust tool for coastal vulnerability assessment. The Tamil Nadu Coromandel Coast faces increasing threats from coastal hazards, including erosion, rising sea levels, and severe weather events, influenced by climate change and human activities [33,34]. The rapid growth of urban areas, lack of oversight in coastal construction, and elevated population concentrations intensify these issues, rendering coastal communities, infrastructure, and ecosystems particularly vulnerable to degradation. Conventional assessment approaches sometimes inadequately reflect coastal vulnerability’s complex spatial and temporal dynamics. This difficulty underscores the necessity for sophisticated methodologies, including Geographic Information Systems (GISs), satellite remote sensing, and the Coastal Vulnerability Index (CVI). For the study to determine areas of high risk, it is essential to assess essential physical parameters, such as geomorphology, elevation, slope, bathymetry, tidal ranges, significant wave height, and shoreline changes. Furthermore, the study examines how population density and land use patterns affect coastal vulnerability while evaluating the effects of increasing temperatures, changes in precipitation, and extreme weather events on erosion, flooding, and ecological degradation. The study integrates various factors to propose strategic solutions, and it emphasizes incorporating nature-based approaches, early warning systems, resilient infrastructure, and community participation to strengthen long-term coastal resilience. Our findings will assist decision-makers in formulating sustainable coastal management approaches, promoting environmental integrity and socioeconomic resilience for at-risk coastal populations.
The study aims to provide a thorough vulnerability framework by incorporating criteria such as shoreline changes, coastal geomorphology, coastal slope, elevation, bathymetry, tidal range, wave height, shoreline change rate, population density, land use and land cover, temperature, precipitation, and aspects of coastal inundation. To increase the accuracy of regional risk estimates, environmental and climatic parameters were combined with real-time coastal monitoring data. Through the use of MCSA approaches, risk factors may be systematically assessed and prioritized, improving the effectiveness and data-driven character of coastal management plans. The results aim to support coastal planners and policymakers in formulating sustainable adaptation and mitigation strategies for vulnerable coastal regions.

2. Materials and Methods
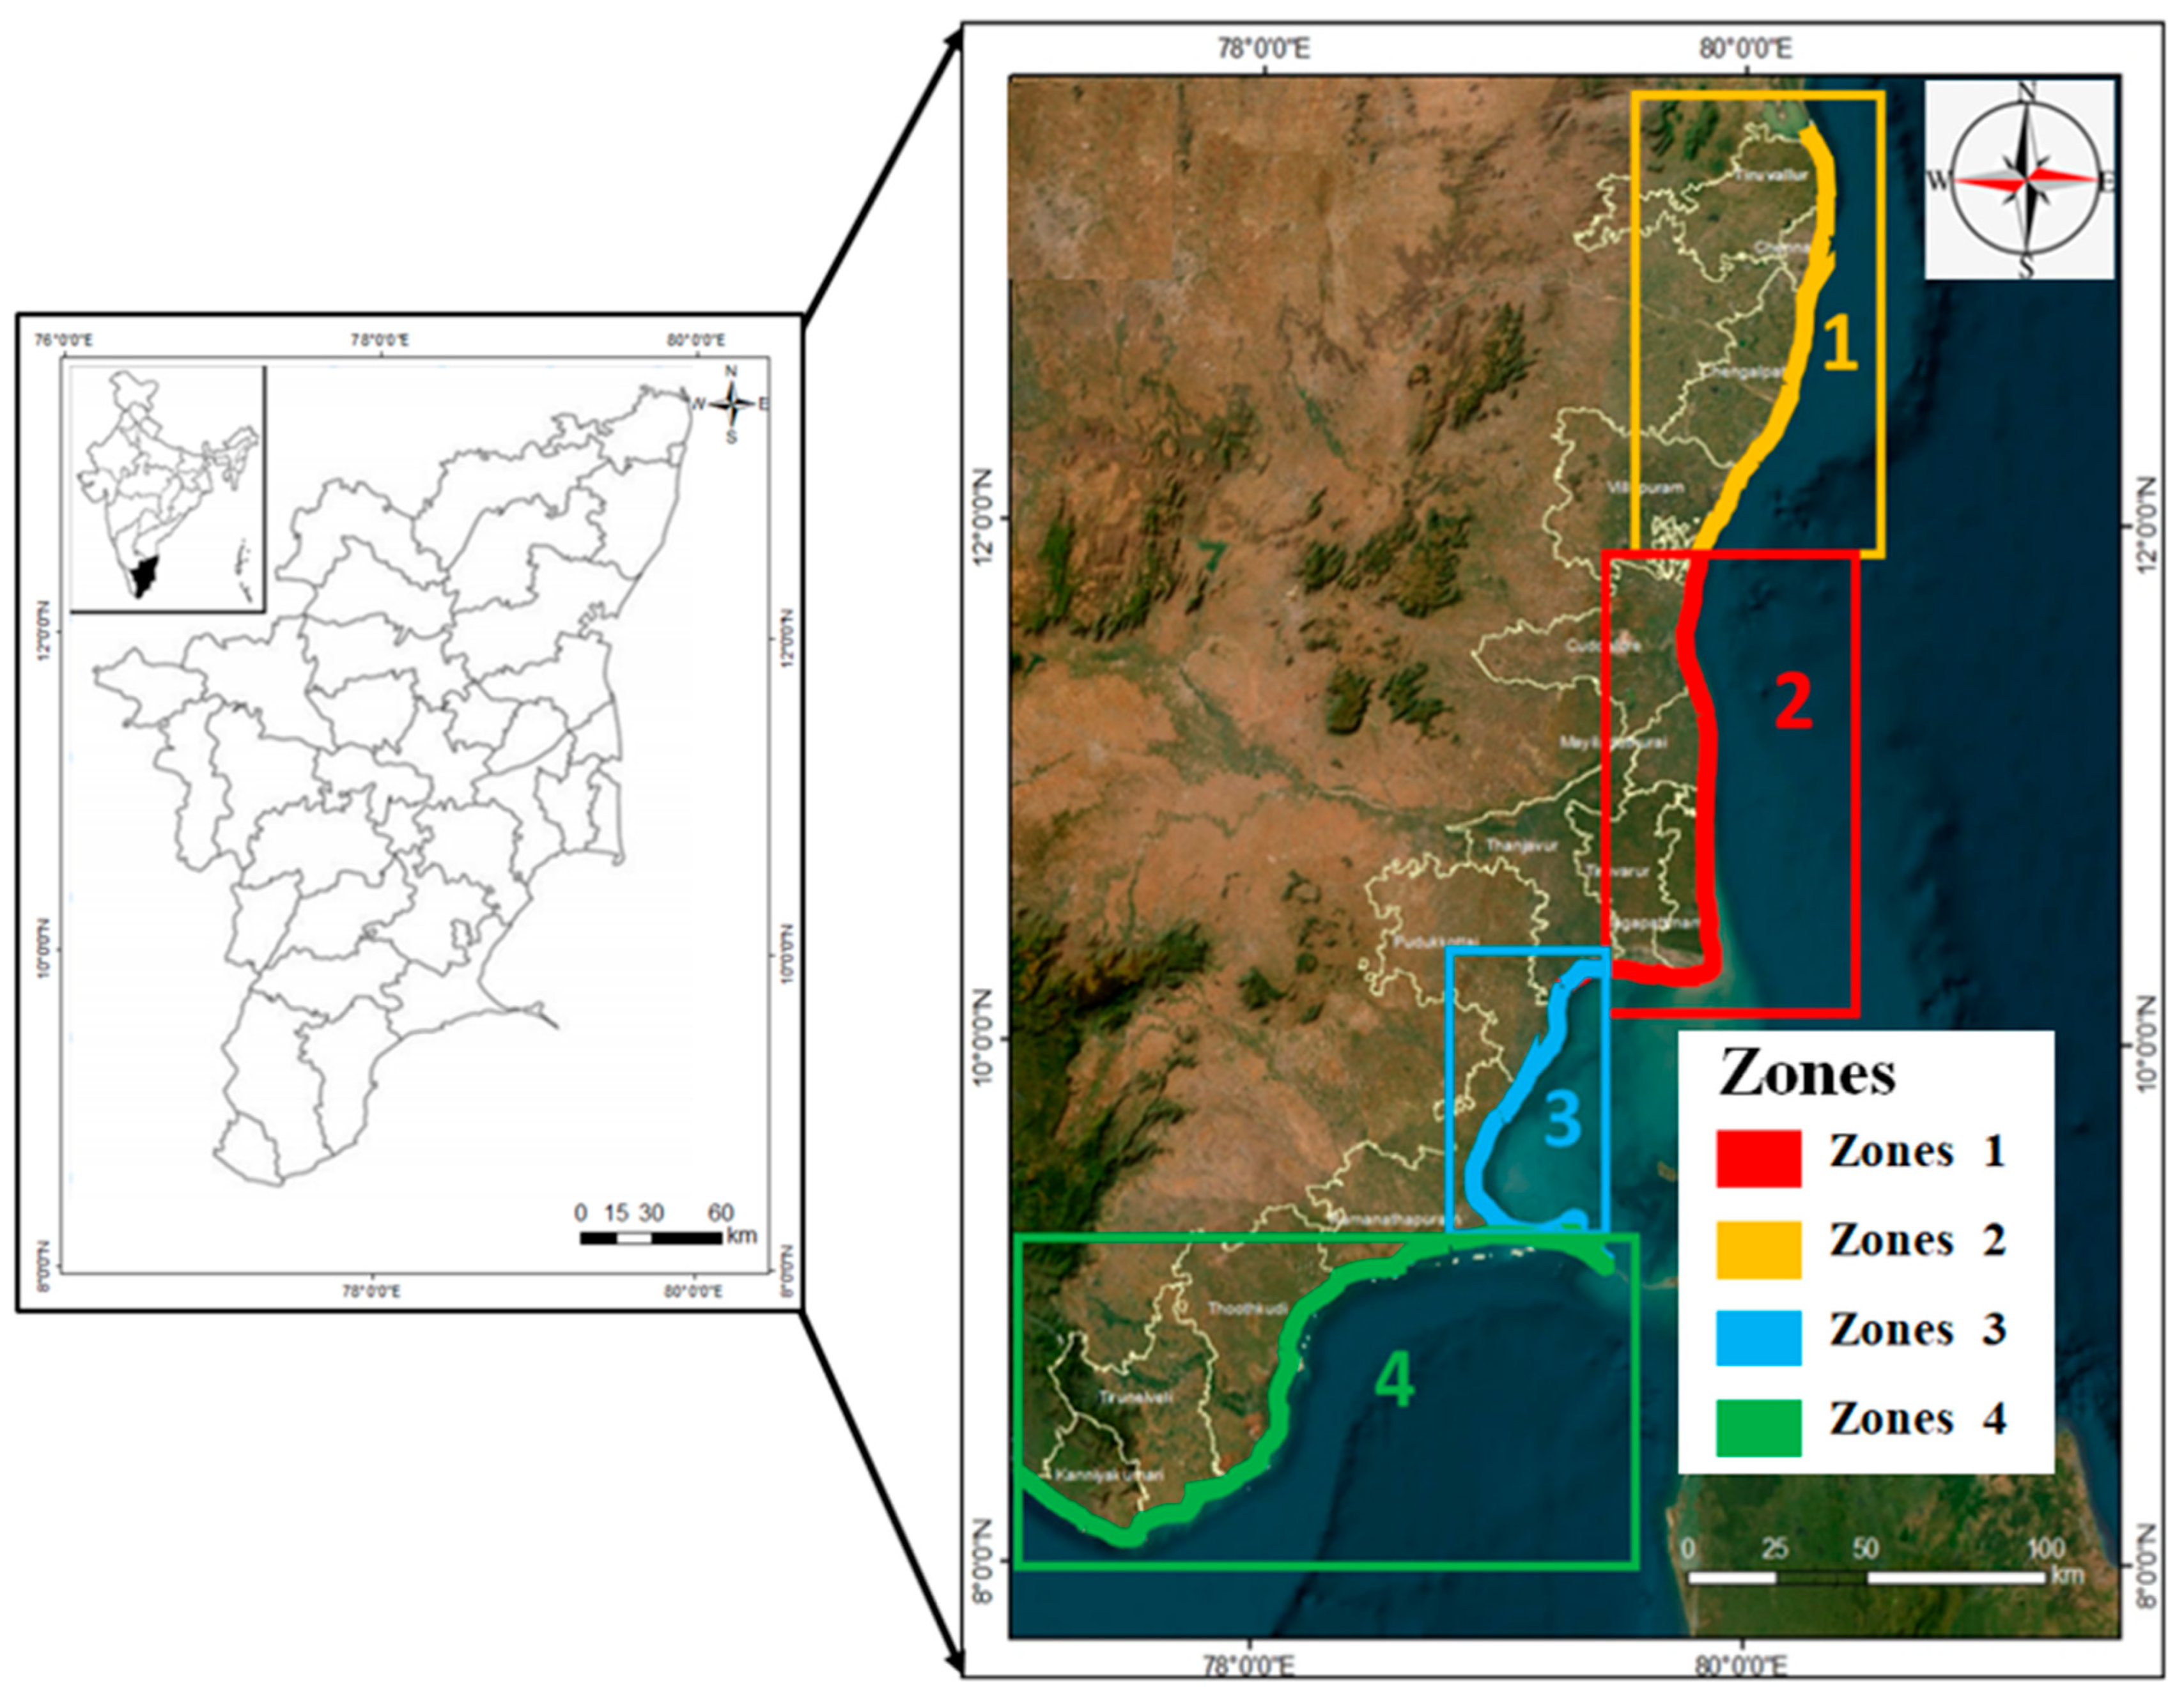
2.1. Study Area

This study primarily focuses on the Coromandel Coast of Tamil Nadu, an Indian state with one of the nation’s longest coastlines, extending over 1076 km along the Bay of Bengal and the Indian Ocean. Figure 1 illustrates the study area, which includes the Coromandel Coast of Tamil Nadu. The coastline extends from the northeastern Tiruvallur district to the southern Kanyakumari district, spanning latitudes 8°20′ to 13°50′ N and longitudes 77°40′ to 80°30′ E. The fourteen districts are Thiruvallur, Chennai, Kanchipuram, Chengalpattu, Cuddalore, Villupuram, Nagapattinam, Mayiladuthurai, Tiruvarur, Thanjavur, Pudukkottai, Ramanathapuram, Thoothukudi, and Kanyakumari. These regions encompass over 200 blocks and thousands of communities, with agriculture and fishing serving as the primary sources of income for the local populace.
Four zones were selected based on their distinctiveness. This study assessed the vulnerability of the four regions of the Coromandel Coast—North, Central, Palk Strait, and South—categorized as Zone 1, Zone 2, Zone 3, and Zone 4, as presented in Table 1. Each region is distinct and possesses varying degrees of vulnerability to coastal hazards. The Zone 1 area, encompassing districts such as Tiruvallur and Chengalpattu, is particularly vulnerable to erosion and flooding due to its significant urbanization and 232 km of coastline. The Zone 2 area, extending 227 km from Cuddalore to Tiruvarur, is prone to sedimentation and cyclonic events. The 193 km coastline of the Zone 3 area, extending from Thanjavur to Ramanathapuram, presents distinct problems owing to its adjacency to Palk Bay. The Zone 4 area, spanning from Ramanathapuram to Kanyakumari, has the longest coastline at 424 km, is recognized for its ecological importance, and is vulnerable to sea-level rises and storms.

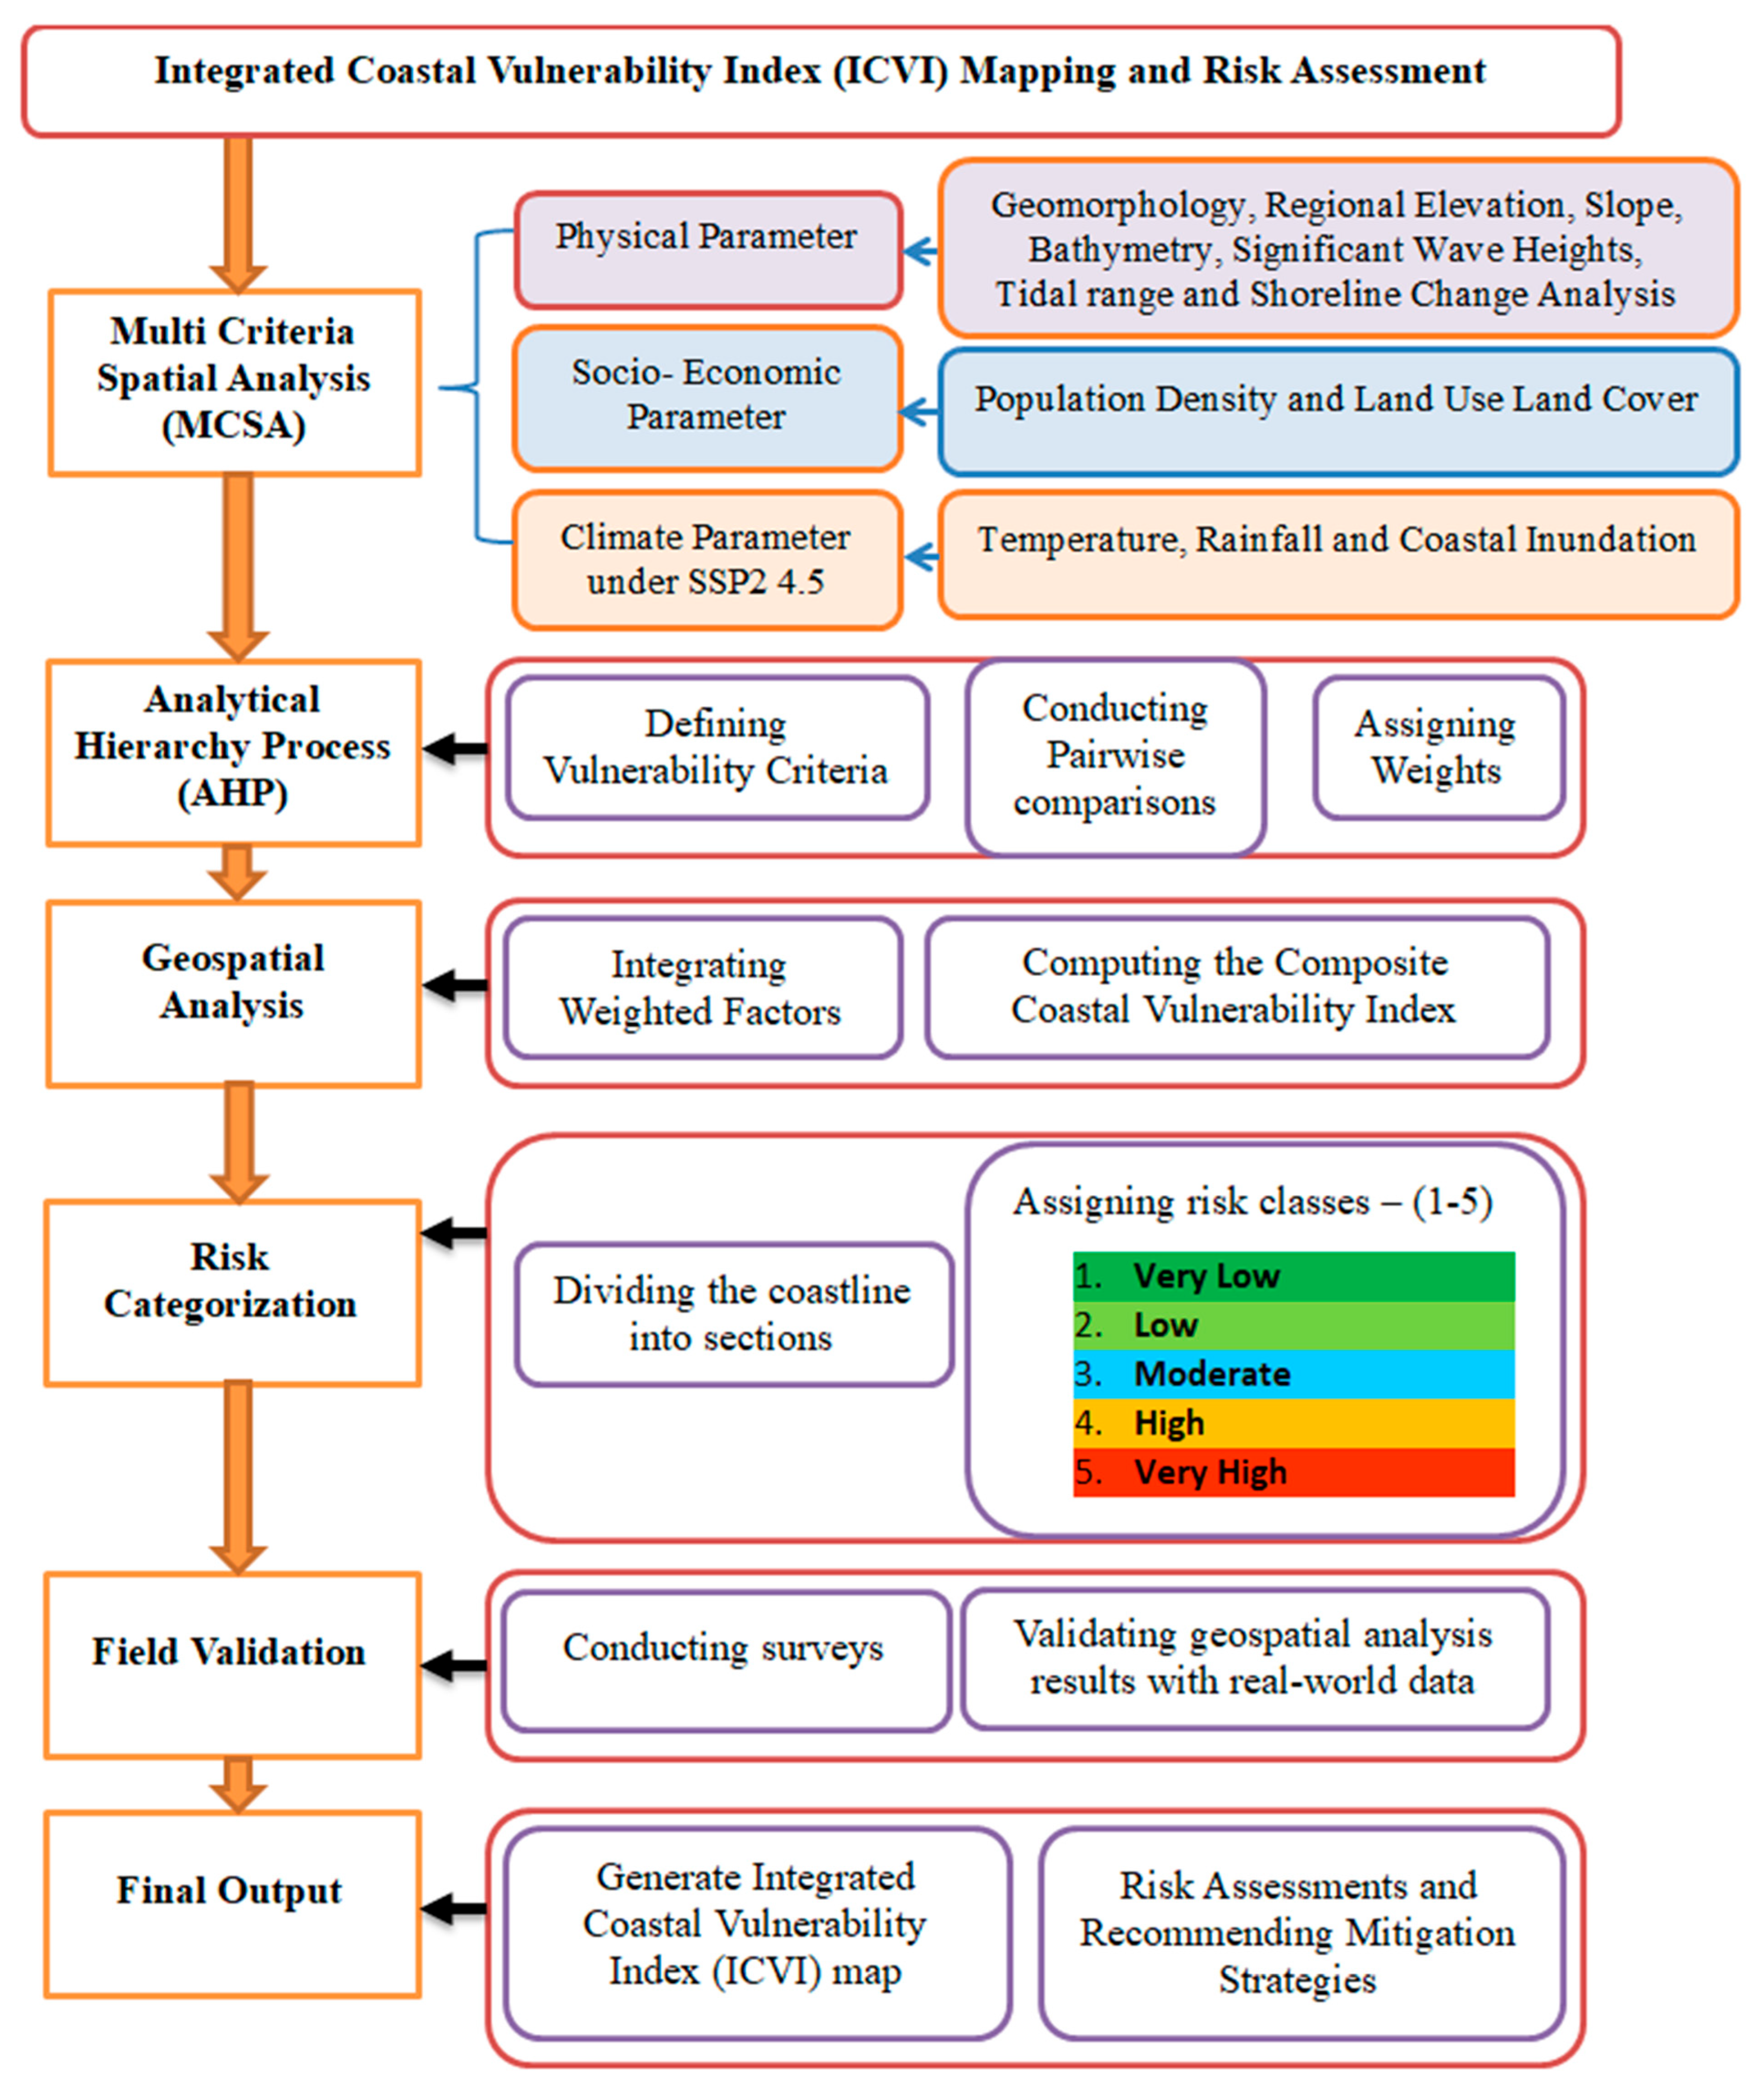
2.2. Analytical Techniques of Coastal Vulnerability Index Using Geospatial Tools

This study employs multiple vulnerability indicators, which were methodically evaluated and ranked using multi-criteria decision analysis (MCDA) [35]. MCSA facilitates objective decision-making in coastal vulnerability assessment by giving weights to twelve important physical, socioeconomic, and climatic aspects, therefore, allowing more precise identification of high-risk zones and informed planning for focused coastal management measures (Figure 2).
The methodology involves acquiring and analyzing geospatial data from satellite imagery, topographic datasets, and global environmental models. Key physical parameters include geomorphology, elevation, slope, bathymetry, significant wave height (SWH), tidal range, and shoreline change (SLC). Coastal geomorphology was classified using Sentinel-2 and Landsat-8 imagery from Bhukosh, while elevation and slope data were derived from the Shuttle Radar Topography Mission (SRTM) via Open Topography. The oceanographic data, specifically significant wave height, were obtained from the European Centre for Medium-Range Weather Forecasts (ECMWF) ERA5 reanalysis dataset. These data represent offshore wave conditions at a spatial resolution of approximately 0.25° (~25 km), covering a distance of around 5 to 25 km from the coastline. This range was selected to capture representative open-ocean wave dynamics that impact nearshore coastal processes. Bathymetric data were sourced from the General Bathymetric Chart of the Oceans (GEBCO), extending from the shoreline to the 15 m isobath. This depth range was chosen to adequately represent the seabed features influencing wave transformation, sediment transport, and coastal vulnerability, while tidal fluctuations were analyzed using WXTide32 (2025) from Tide Text. Shoreline changes were examined through a multi-temporal analysis of Sentinel-2 and Landsat 4–9 datasets from USGS (1990–2025), revealing long-term erosion and accretion trends.
Socioeconomic factors, such as population density and land use/land cover (LULC), were incorporated to assess human-induced pressures on the coastal system. Population density data from the Survey of India’s 2011 Census was integrated, while LULC classification was conducted using the supervised classification of Landsat-8 and Sentinel-2 (2024). This analysis provided insights into land use patterns, highlighting urban expansion, agricultural activities, and ecosystem degradation. Temperature trends were examined using data from the PSMSL, AR6, and CMIP6 models. This analysis included climatic information from the Permanent Service for Mean Sea Level (PSMSL), the Intergovernmental Panel on Climate Change Sixth Assessment Report (IPCC AR6), and the Coupled Model Intercomparison Project Phase 6 (CMIP6). The PSMSL provided recorded sea-level trends for inundation assessment. Climate predictions based on the Shared Socioeconomic Pathway (SSP2-4.5) were derived from AR6 and CMIP6, allowing the precise evaluation of prospective coastal hazards along the Coromandel Coast of Tamil Nadu and covering historical trends (1984–2014) and future projections (2014–2040) under the SSP4.5 climate scenario. Rainfall patterns and Coastal Inundation risks were further analyzed using climate models and hydrodynamic simulations to evaluate the potential impacts of extreme weather events and sea-level rises (Table 2).
The vulnerability of each parameter was assessed using the Coastal Vulnerability Index (CVI), with scores ranging from very low (1) to very high (5) (Table 3). Geomorphological features were categorized based on their resistance to erosion, with coastal plains, waterbodies, and flood plains identified as highly vulnerable. Elevation was classified into five categories, with areas below 2.5 m considered most susceptible to inundation. Coastal slope analysis indicates regions with gradients below 0.5 degrees, which exhibit higher vulnerability to erosion and storm surges. Bathymetry data showed shallow regions (<10 m depth) were more prone to extreme wave impacts. At the same time, tidal range analysis reveals that areas experiencing fluctuations beyond 2 m were at greater risk of flooding. Locations with wave heights exceeding 1.5 m were classified as very high vulnerability zones, while shoreline change rates of less than −2.0 m/year indicated extreme erosion.

2.3. Calculation of Integrated Coastal Vulnerability Index (ICVI)

To evaluate coastal vulnerability considering physical, socioeconomic, and climatic aspects, recent research has progressively adopted integrated models. By including 21 physical and socioeconomic characteristics into a modified Coastal risk Index (CVI), Nigam et al.’s [36] research on coastal risk at the village level in Canacona, South Goa, India, thoroughly assessed and proved the need for a targeted and thorough investigation to comprehend spatial differences in susceptibility and develop appropriate coastal management plans. The Integrated Coastal Vulnerability Index (ICVI) integrates three major components—physical, socioeconomic, and climatic factors—offering a more comprehensive assessment of coastal vulnerability. This formula has been used by researchers since 1991, including Gornitz et al. [11], Thieler and Hammar-Klose [37], Nigam et al. [36], and others [18,38,39,40]. This approach enhances regional specificity by focusing on the dominant drivers of vulnerability on the Coromandel coast, ensuring high interpretability for local management. Furthermore, this method optimizes available high-fidelity data, providing a robust and practical assessment of coastal susceptibility relevant to regional planning and adaptation strategies.

2.3.1. Physical Vulnerability Index (PVI)

The Physical Vulnerability Index (PVI) evaluates factors such as geomorphology, Elevation, slope, tidal range, significant wave height, and shoreline change rate:
P V I = a × b × c × d × e × f × g 7
(a) represents coastal geomorphology and affects shoreline stability and erosion; (b) shows elevation (m) and has lower elevations that flood and receive storm surges; (c) shows slope (°) and affects water runoff and erosion rates; (d) affects bathymetry (m) and the impact of wave energy and storm surges; (e) shows the mean tidal range (m) and affects the tidal flood area; (f) shows significant wave height (m) and causes coastal erosion and coastal structure damages; and (g) shows the shoreline change rate (m/year). By combining the seven elements, the PVI provides a thorough evaluation of coastal vulnerability.

2.3.2. Socioeconomic Vulnerability Index (SEVI)

The Socioeconomic Vulnerability Index (SEVI) incorporates population density and land use patterns:
S E V I = h × i 2
(h) indicates the population density (individuals/km2), whereas (i) represents the implications of the land use land cover (LULC) categorization. As densely populated coastal zones are more prone to erosion, storm surges, and floods, population density is a crucial predictor of socioeconomic vulnerability. In the same way, the LULC classification assesses land use in terms of vegetation cover, agriculture, industrial development, and urban growth. By removing natural buffers, like mangroves and wetlands, which guard against surges and storm-induced erosion, unregulated land use and urban sprawl may increase coastal vulnerability. The SEVI provides a thorough understanding of human-driven coastal risks by taking into account these two important socioeconomic factors.

2.3.3. Climatic Vulnerability Index (CVIc)

The Climatic Vulnerability Index (CVIc) assesses the impact of climate change, including temperature rise, rainfall variations, and extreme weather events:
C V I c = j × k × l 3
The Climatic Vulnerability Index (CVIc) is a crucial instrument for evaluating the effects of climate change on coastal vulnerability, emphasizing variables such as temperature, a rise in rainfall, and the degree of coastal flooding resulting from intense rainfall. The calculation employs a formula, where (j) signifies a temperature rise (°C), (k) indicates rainfall increase (%), and (l) pertains to the degree of coastal inundation resulting from substantial sea level rise. Rising temperatures are a primary factor contributing to climate vulnerability, resulting in higher sea levels, intensified storm surges, and coastal erosion. A rise in temperature directly influences the frequency and severity of extreme weather phenomena, including heatwaves and tropical cyclones. During monsoon seasons, the increase in precipitation indicated by (k) directly affects the flood danger in coastal areas. Elevated precipitation can inundate drainage systems, resulting in more frequent and severe inland and coastal flooding. Additionally, (l) captures the risk of coastal inundation, which is exacerbated by rising sea levels. The interplay of temperature and rainfall fluctuations, alongside increased flooding risks, underscores the necessity of understanding climatic vulnerabilities within the context of coastal development:
I C V I = P V I + S C I + C V I c 3
In this study, each variable (a to l) was assigned a score between 1 and 5 based on its vulnerability classification, as outlined in Table 3. These variables represent physical, socioeconomic, and climatic factors contributing to coastal vulnerability. The scoring system ranges from “Very Low” to “Very High”, with higher values indicating greater vulnerability. A standard formula with equal weight was used for all variables, ensuring an unbiased and consistent approach. The ICVI for each grid cell within the study area was determined by summing the individual scores of all variables. The cumulative score was then classified into five categories—very low, low, moderate, high, and very high—reflecting varying levels of coastal vulnerability. This classification helps identify regions most at risk from coastal hazards, like erosion, flooding, and storm surges. By incorporating both natural and human factors, the ICVI model offers a comprehensive assessment, guiding policymakers in prioritizing areas for intervention and management.
Data processing and analysis were conducted using geospatial tools, such as ArcGIS 10.8.2, QGIS, and the Digital Shoreline Analysis System 5.1 (DSAS), for spatial mapping, visualization, and statistical assessment. Shoreline change was quantified using Linear Regression Rate (LRR) methods. To detect erosion and accretion on the shoreline, 107,600 transects were generated perpendicular to the shoreline, 1000 m long and 100 m apart per transect. LULC classification was performed using the Maximum Likelihood Method to ensure accurate categorization of the land use patterns. Additionally, climate trend analysis was conducted using statistical models to evaluate the long-term risks associated with temperature rise and precipitation variability.
In this study, a Multi-Criteria Spatial Analysis approach was employed to integrate various spatial factors using the Analytical Hierarchy Process (AHP). The Analytical Hierarchy Process (AHP) was employed to compute the ICVI, assigning parameter weights based on their significance in influencing coastal risk [30,31,32,41,42]. The AHP method was selected due to its simplicity, transparency, and effectiveness in spatial studies. The resulting weights were then integrated within a Geographic Information System (GIS) to generate the Integrated Coastal Vulnerability Index map.
Field validation was conducted through ground-truthing surveys at key locations, including deltaic regions, urban coastlines, and ecologically sensitive zones. These surveys verified satellite-derived findings on erosion, inundation risks, and the impacts of artificial coastal structures on sediment transport. The final outputs of this study contribute to the integrated coastal zone management (ICZM) framework, offering data-driven recommendations for sustainable coastal planning, ecosystem-based adaptation, and resilient infrastructure development. This research supports the long-term sustainability of the Coromandel Coast and its coastal communities by providing actionable insights into climate adaptation, disaster risk reduction, and policy implementation.

3. Results

3.1. Various Parameters of Coromandel Coast

The Coromandel Coast is affected by several variables, including physical, socioeconomic, and climatic variables. These characteristics interact to determine the region’s vulnerability to coastal regions. Comprehending these varied aspects is essential for efficient planning, sustainable development, and climate adaptation methods to protect both natural ecosystems and coastal populations along the Coromandel Coast.

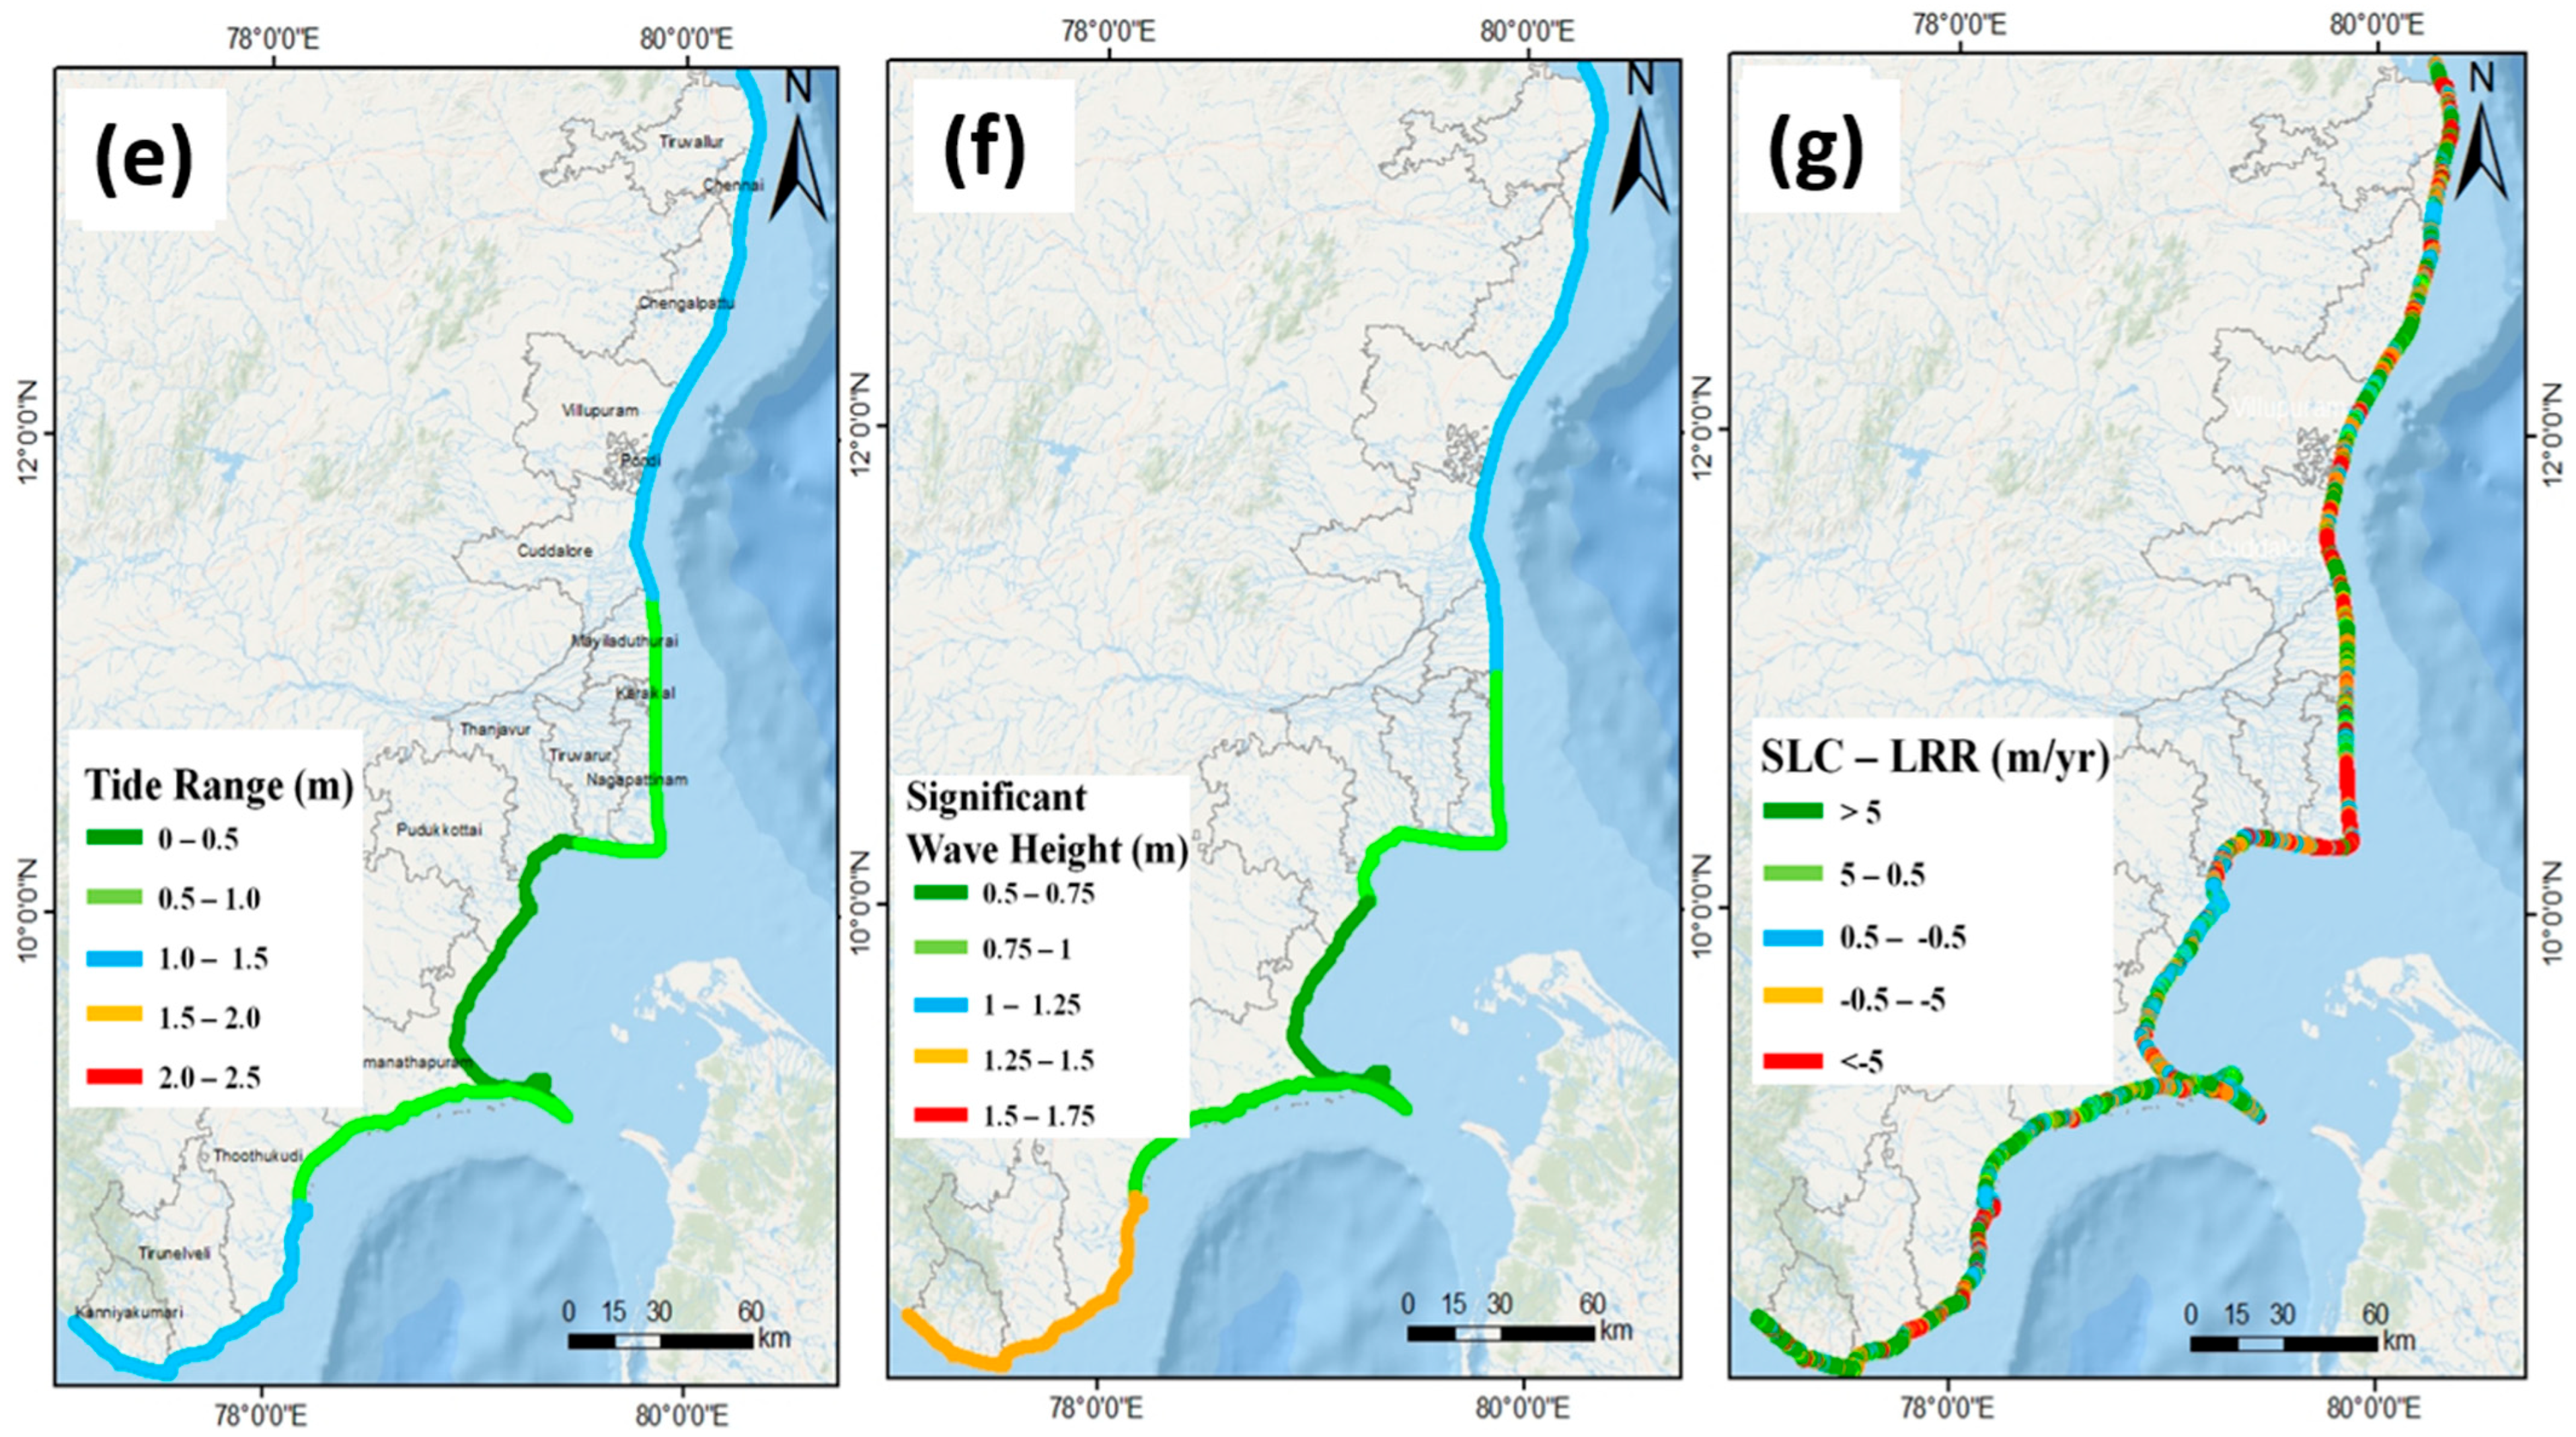
3.1.1. Physical Vulnerability Parameters of the Study Area

The Coromandel Coast of Tamil Nadu is shaped by various factors, such as geomorphology, elevation, slope, bathymetry, wave height, tidal range, and shoreline changes (Figure 3). Human activities, particularly land reclamation, have worsened flooding in low-lying areas by reducing the intertidal zone. In places like Nagapattinam, Thoothukudi, and Rameswaram, vegetated tidal flats are more resistant to flooding compared to the bare tidal flats found in Pulicat, Pichavaram, Muthupet, and Vedaranyam. The delta regions of the Cauvery, Ponnaiyar, and Vaigai Rivers are more prone to flooding than the subtidal estuaries and streams of Ennore, Manamelkudi, and Mandapam. Most of the region’s elevation remains below 5 m, with around 14 km (1.3%) of the coastline, including Pulicat Lake, Ennore, and the Cauvery Delta, being particularly at risk. Areas such as Manamelkudi, Nagapattinam, Vedaranyam, and Cuddalore, which are at elevations between 2.5 and 5 m, are highly vulnerable to storm surges. However, Kanyakumari, Rameswaram, and Tiruchendur, which stand above 10 m, face less risk.
Coastal slope also influences susceptibility, with 28 km (2.6%) of the shoreline having a very low slope (below 0.5 degrees), making it more prone to tidal surges and erosion, especially in Pulicat Lake, Ennore, the Cauvery Delta, and Thoothukudi. Meanwhile, 280 km (26.2%) of the coast has slopes between 0.5 and 1 degree, increasing its sensitivity. In contrast, regions like Kanyakumari and Thirunelveli, with steeper slopes above 3 degrees, are less vulnerable to coastal hazards. The characteristics of bathymetry significantly influence the movement of sediments, the refraction of waves, and the behaviour of tidal currents. The group with an exceptionally high risk encompasses Pulicat Lake, the Cauvery Delta, and Ramanathapuram with shallow bathymetry, while deeper bathymetric areas such as Kanyakumari and Manapad are considered low risk. Wave heights exhibit considerable variation, ranging from 0.5 to 1.75 m. Specifically, the rocky outcrops of Kanyakumari, Thirunelveli, and parts of the Thoothukudi district have significant wave heights between 1.25 and 1.5 m. In contrast, Nagapattinam, Thiruvarur, Thanjavur, and some Ramanathapuram districts have wave heights of 0.75 to 1 m. The wave heights range from 0.5 to 0.75 m in part of the Ramanathapuram district, and the remaining regions have a wave height of 1 to 1.25 m. About 630 km (58.5%) of the coastline exhibits moderate vulnerability, attributed to tidal ranges under 1.5 m. About 302 km (28.07%) of the area, including Muthupet Lagoon, the Vedaranyam and Ramanathapuram districts are classified as showing low vulnerability, with tidal ranges between 0.5 and 1 m, rendering these areas susceptible to extended flooding during storm surges and cyclones.
The Shoreline Change (SLC) Analysis reveals that certain coastal regions in Tamil Nadu are undergoing notable erosion and accretion trends. Karimanal, Pulicat, and Kattupalli are experiencing severe erosion, with shoreline retreat rates reaching as high as −5.17 m per year. In contrast, prominent beaches, such as Marina and Elliot, remain primarily stable, showing little to no significant shoreline changes. In the Cuddalore region, substantial erosion is observed between Thirupoondi and Vedaranyam, with the most extreme erosion rates recorded near Kodiakarai, reaching −16.3 m per year. This highlights the vulnerability of the coastal stretch to wave action, sea-level rise, and human interventions. Meanwhile, areas south of Pichavaram Reserved Forest (R.F.) are witnessing significant accretion, with sediment deposition rates of 23.69 m per year, indicating a natural process of land gain in that region. Zone 3 highlights significant erosion around Ravuthanvayal and Sendalaivayal, while accretion occurs at Rajamadam and Thangachimadam. This zone requires focused coastal management to protect fishing communities and marine ecosystems. Further south, Periyapattinam and Valinokkam show signs of erosion, although it is not as severe as in other parts of the coast. On the other hand, Punnakayal and Kayalpattinam’s coastlines remain stable. The coastline between Periyapattinam and Valinokkam is moderately affected by erosion, whereas Manakudy and Enayam are experiencing accretion due to sediment accumulation. This shows how the shoreline is constantly shifting due to natural and human influences.

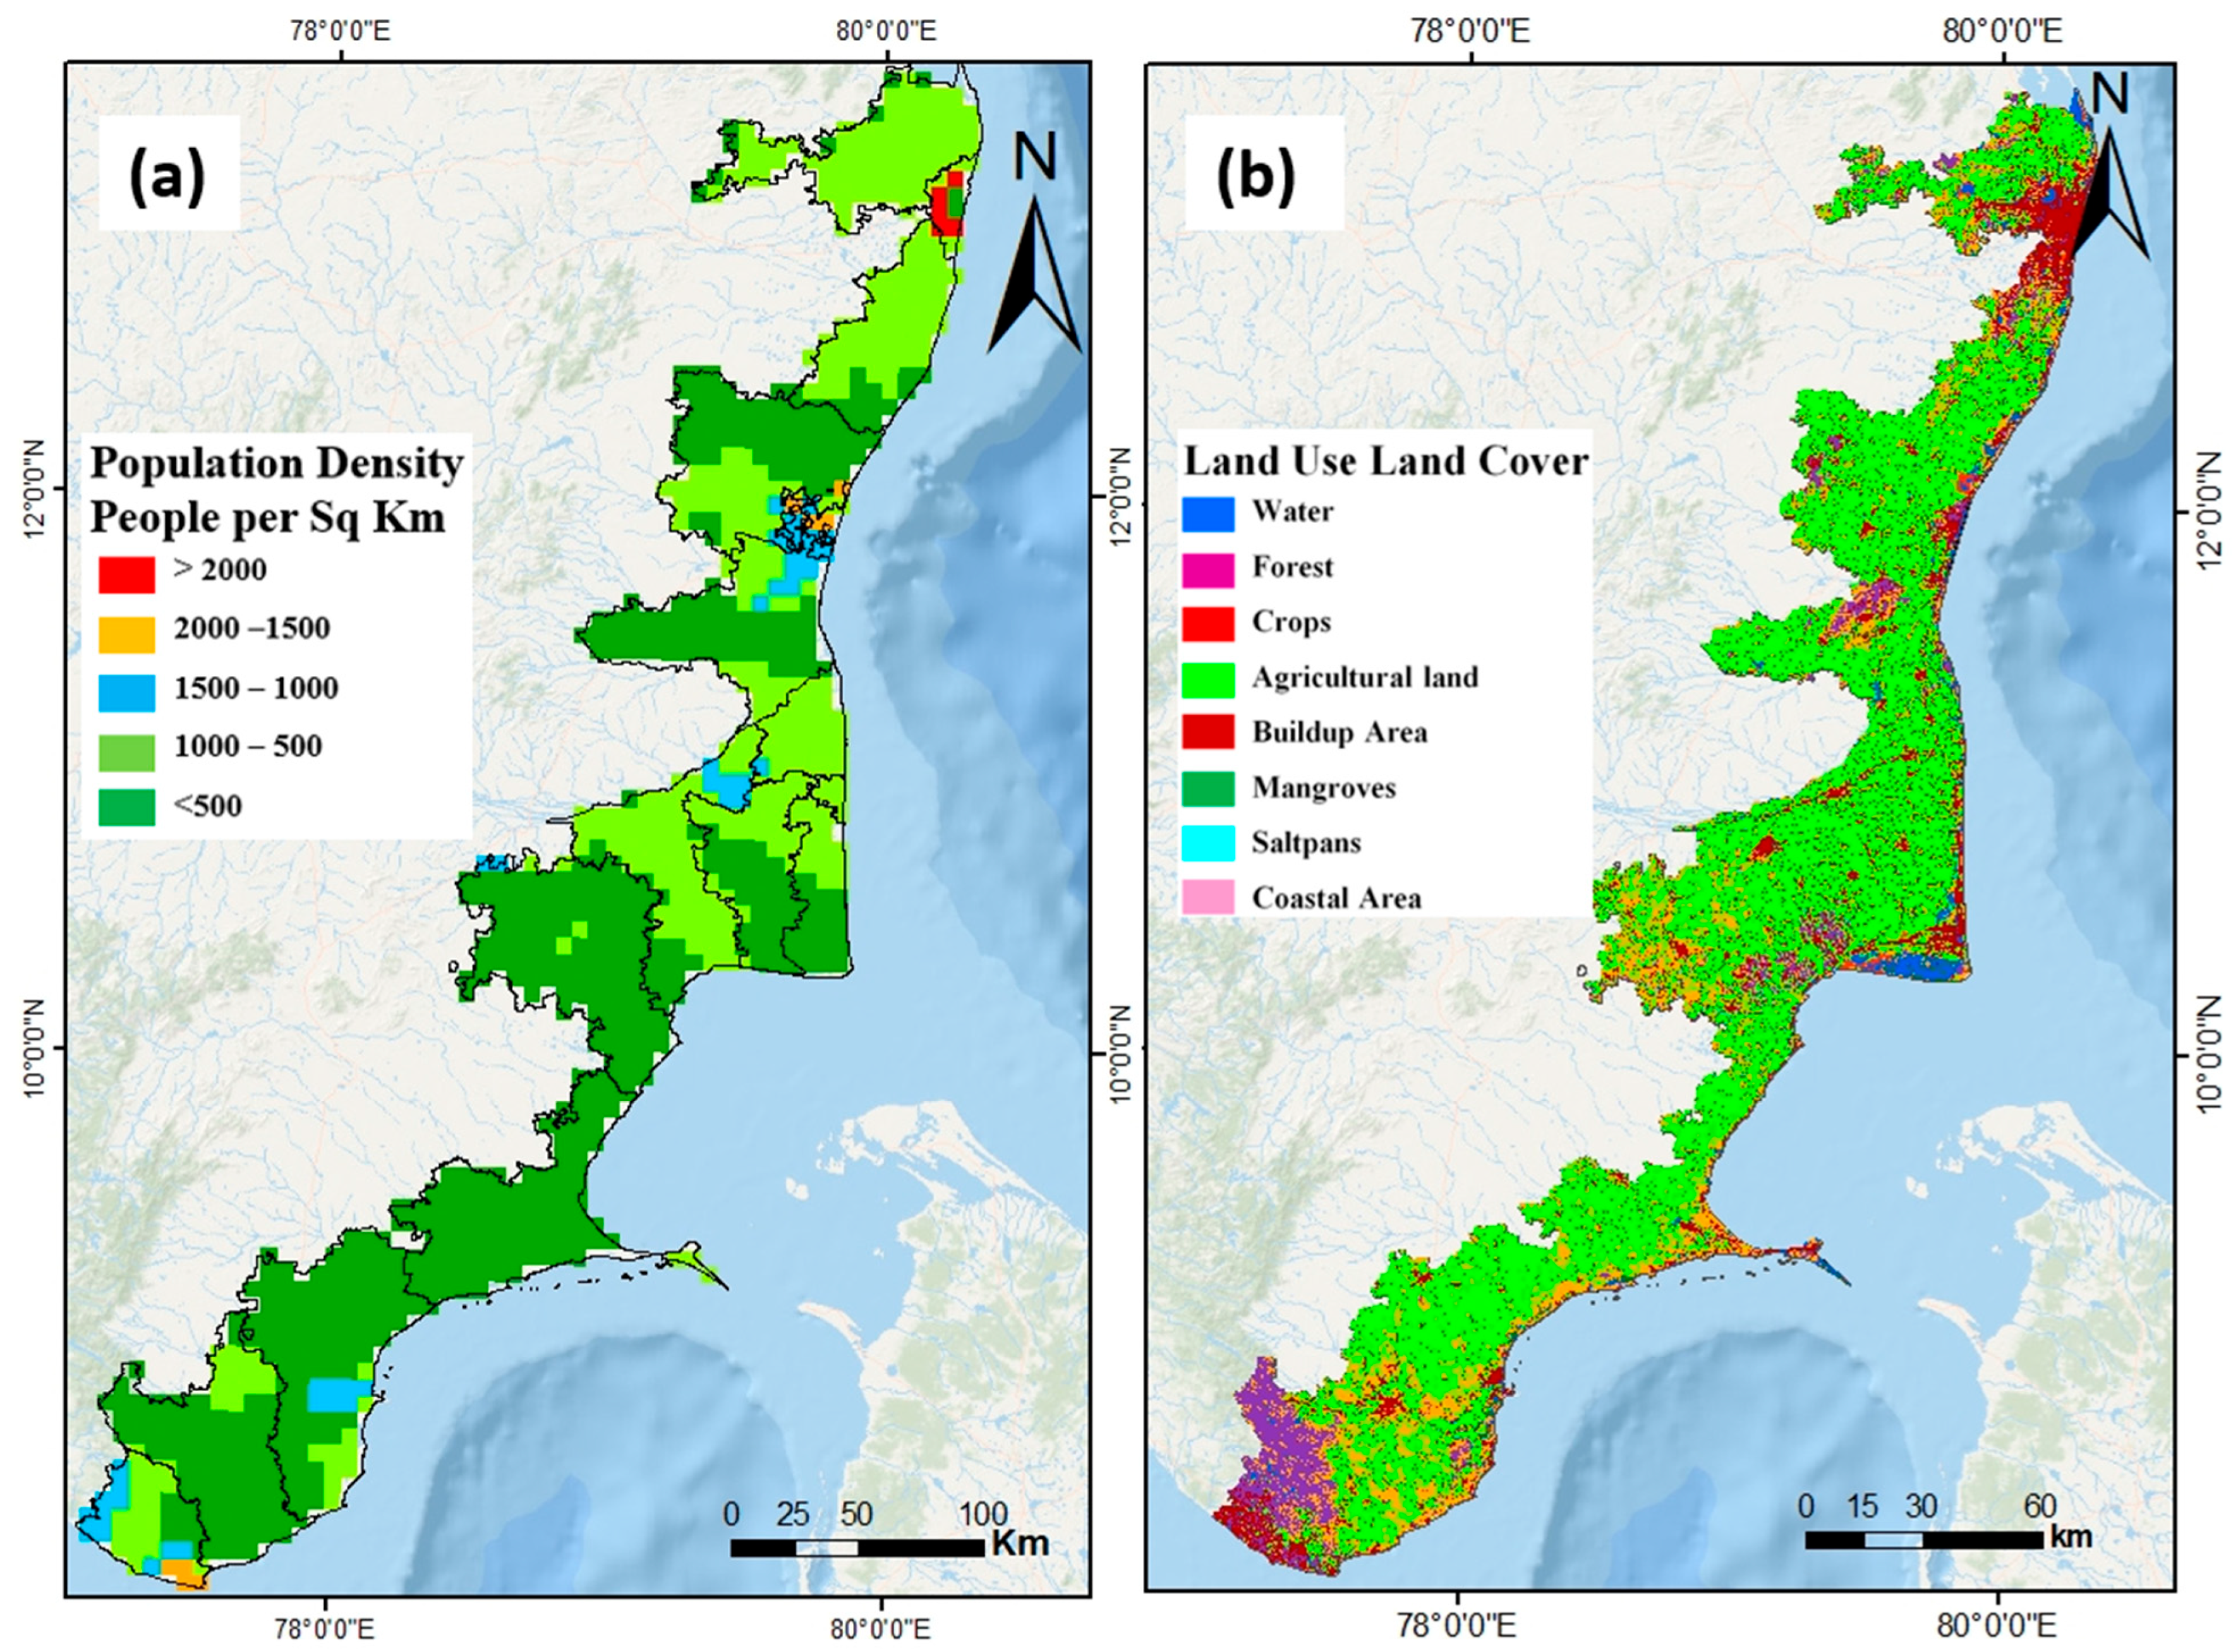
3.1.2. The Role of Socioeconomic Parameters on the Coromandel Coast

Socioeconomic parameters significantly impact the Coromandel Coast’s vulnerability (Figure 4). High population density, urbanization, tourism, and industrial activities increase pressure on coastal resources [43]. In Zone 1, population density varies significantly, with Chennai’s Royapuram being the most densely populated area, reaching 8200 persons per square kilometer. Other notable areas include Ennore (2560 persons/km2), Thiruvanmiyur (2400 persons/km2), and Puducherry (1850 persons/km2). This zone faces severe environmental stress due to intense human activity. Approximately 11 km (1%) of the coastline, mainly in Thiruvanmiyur, Royapuram, Thiruvottiyur, and Ennore, falls under the very highly vulnerable category. Zone 2 exhibits population densities ranging from 1000 to 2000 persons/km2, with areas like Puducherry and Kanyakumari classified as highly vulnerable. Zone 3 is predominantly less populated, with densities below 500 persons per km2. Zone 4 has population densities ranging from 1000 to 2000 persons/km2 in certain areas, such as Muttam and Leepuram in Kanyakumari, which have densities of approximately 1500 persons per km2.
The region’s land use and land cover (LULC) indicate a mix of agricultural land, rural built-up areas, and waterbodies. Land use in Chennai consists of 75% urban areas, 11% vegetated/open spaces, and 170 hectares of mangroves along the Adyar River. Chengalpattu has 56% agricultural land and 14% waterbodies, with 10 hectares of mangroves. Villupuram comprises 78% agricultural land, 11% waterbodies, and 16% forest cover, including 140 hectares of mangroves. Cuddalore has 1100 hectares of mangroves and 79% agricultural land. Mayiladuthurai has 650 hectares of mangroves and 75% agricultural land. Nagapattinam, the second-largest salt producer, has 68% agricultural land, 4150 hectares of salt pans, and 650 hectares of mangroves. Tiruvarur has 79% agricultural land and 1150 hectares of mangroves, while Karaikal has 55% agricultural land and 140 hectares of mangroves. Thanjavur, with 1700 hectares of mangroves, has 80% agricultural land. Pudukkottai has 73.5% agricultural land and 380 hectares of mangroves, while Ramanathapuram has 75.5% agricultural land and 650 hectares of mangroves. Thoothukudi has 81% agricultural land and 600 hectares of mangroves. The remaining regions in this zone generally have population densities below 500 persons per km2. Tirunelveli comprises 56% agricultural land, and Kanyakumari has the highest forest cover (33%) and 43% agricultural land.

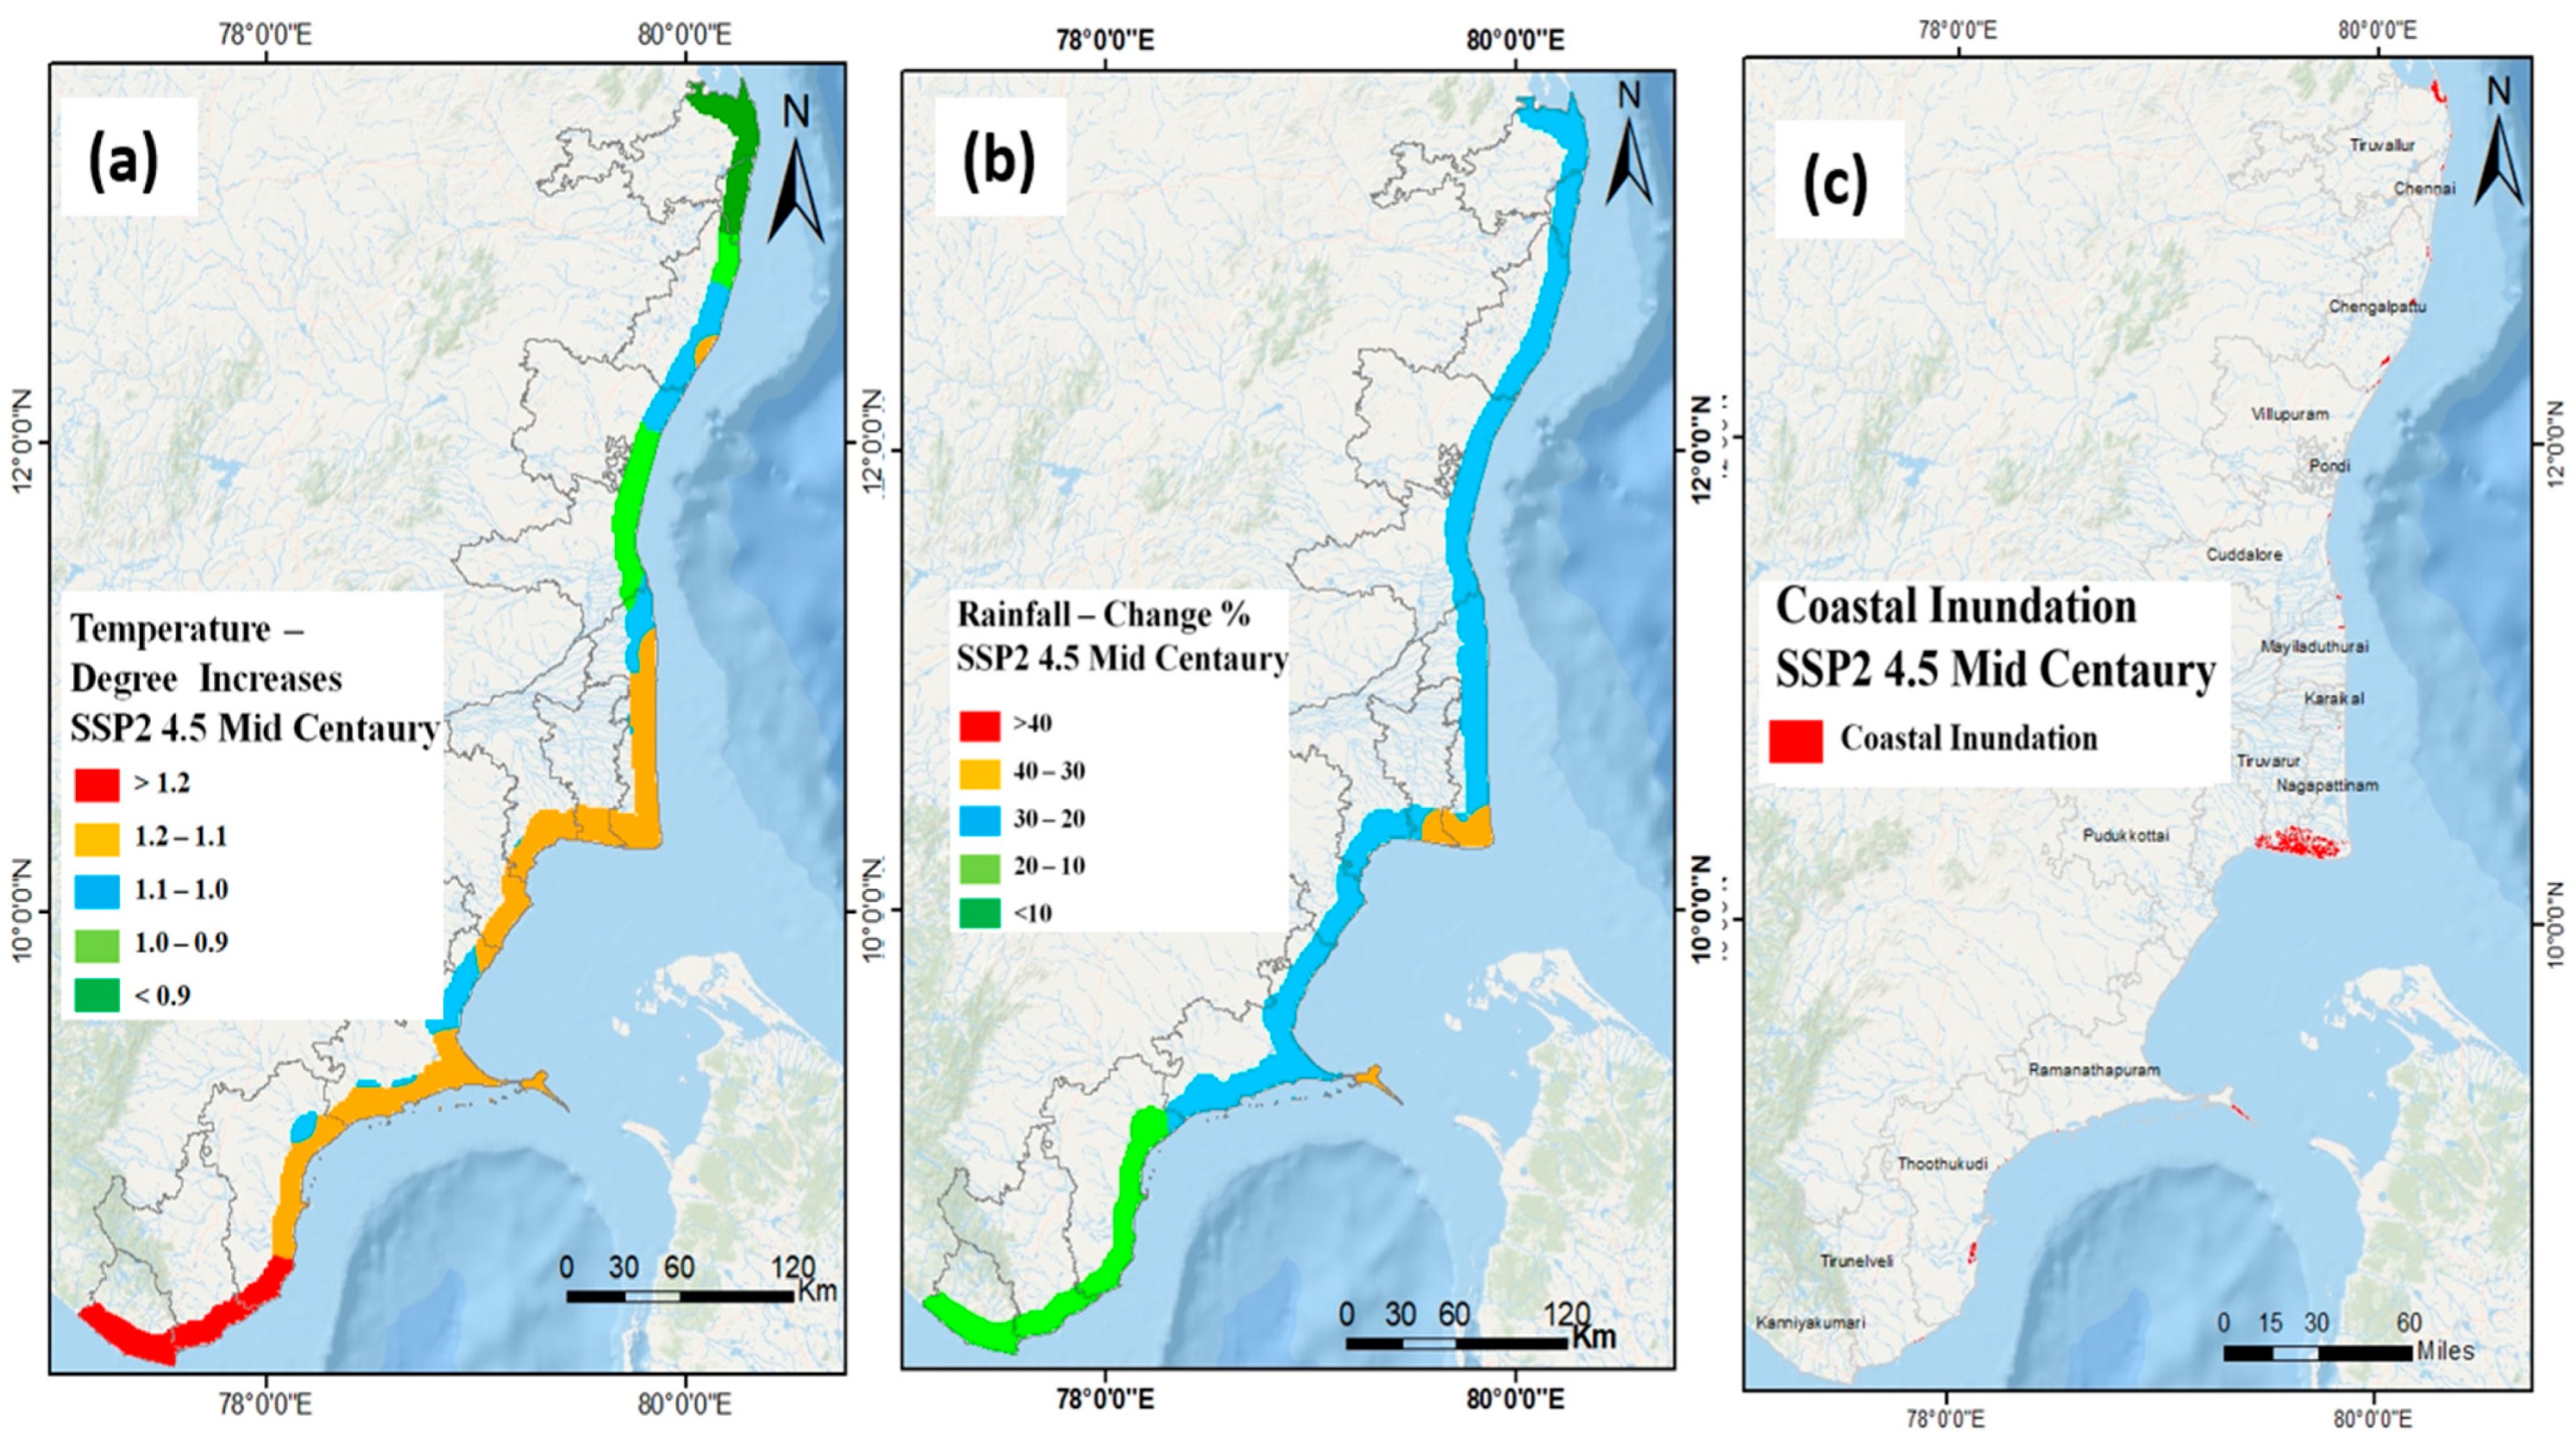
3.1.3. The Role of Climatic Parameters on the Coromandel Coast

By the mid-century, the AR6 SSP2-4.5 scenario predicts significant warming in the Coromandel region (2014–2040), as illustrated in Figure 5. The districts of Chennai and Thiruvallur are expected to experience a temperature increase of up to 0.9 °C. The warming trend is most pronounced in Zones 2, 3, and 4, with projected temperatures of 1.1 °C to 1.2 °C. This indicates an escalating intensity of climate change impacts in certain regions. The southern coastal districts of Tamil Nadu, including parts of Thoothukudi, Tirunelveli, and Kanyakumari, are projected to see temperature increases of up to 1.4 °C by 2040 due to their geographical proximity to the equator. Rising temperatures may significantly impact agriculture, water resources, and human health, particularly in vulnerable coastal and urban areas [44,45]. Significant changes in precipitation patterns are expected in Tamil Nadu. A substantial segment of the region is expected to experience an increase in precipitation by up to 30%, indicating a shift towards more humid conditions.
The increase in precipitation may have beneficial and adverse effects, influencing the region’s agriculture, water supplies, and flood risks. Notably, sections of the Nagapattinam, Thiruvarur, and Rameswaram districts are expected to substantially rise in precipitation by between 30% and 40%. Enhanced precipitation may facilitate groundwater recharging and bolster agriculture, but it may concurrently heighten the risks of waterlogging, flooding, and infrastructural damage, particularly in low-lying coastal areas [46]. The southern districts of Thoothukudi, Tirunelveli, and Kanyakumari are projected to have a little increase in precipitation, estimated at 10% to 20% by 2040. Due to sea level rise, coastal inundation hazards are significant in several areas under changing climate scenario [47,48]. Chennai, Tiruvallur, and Kanchipuram face heightened risk, with vulnerable regions in Cuddalore, Nagapattinam, Thanjavur, Ramanathapuram, and Tuticorin. These areas, owing to their low altitude, are particularly susceptible to flooding. The increasing climate threats highlight the urgent need for coastal defence strategies, robust agriculture practices, and sustainable water management solutions to safeguard vulnerable people [45]. The central region, spanning 227 km from Cuddalore to Tiruvarur, is susceptible to silt accumulation and cyclonic occurrences. The 193 km coastline of the Palk Strait region, stretching from Thanjavur to Ramanathapuram, has specific challenges due to its proximity to Palk Bay. The southern segment, extending from Ramanathapuram to Kanyakumari, has the longest coastline at 424 km, is renowned for its ecological significance, and is susceptible to sea-level rises and storms.

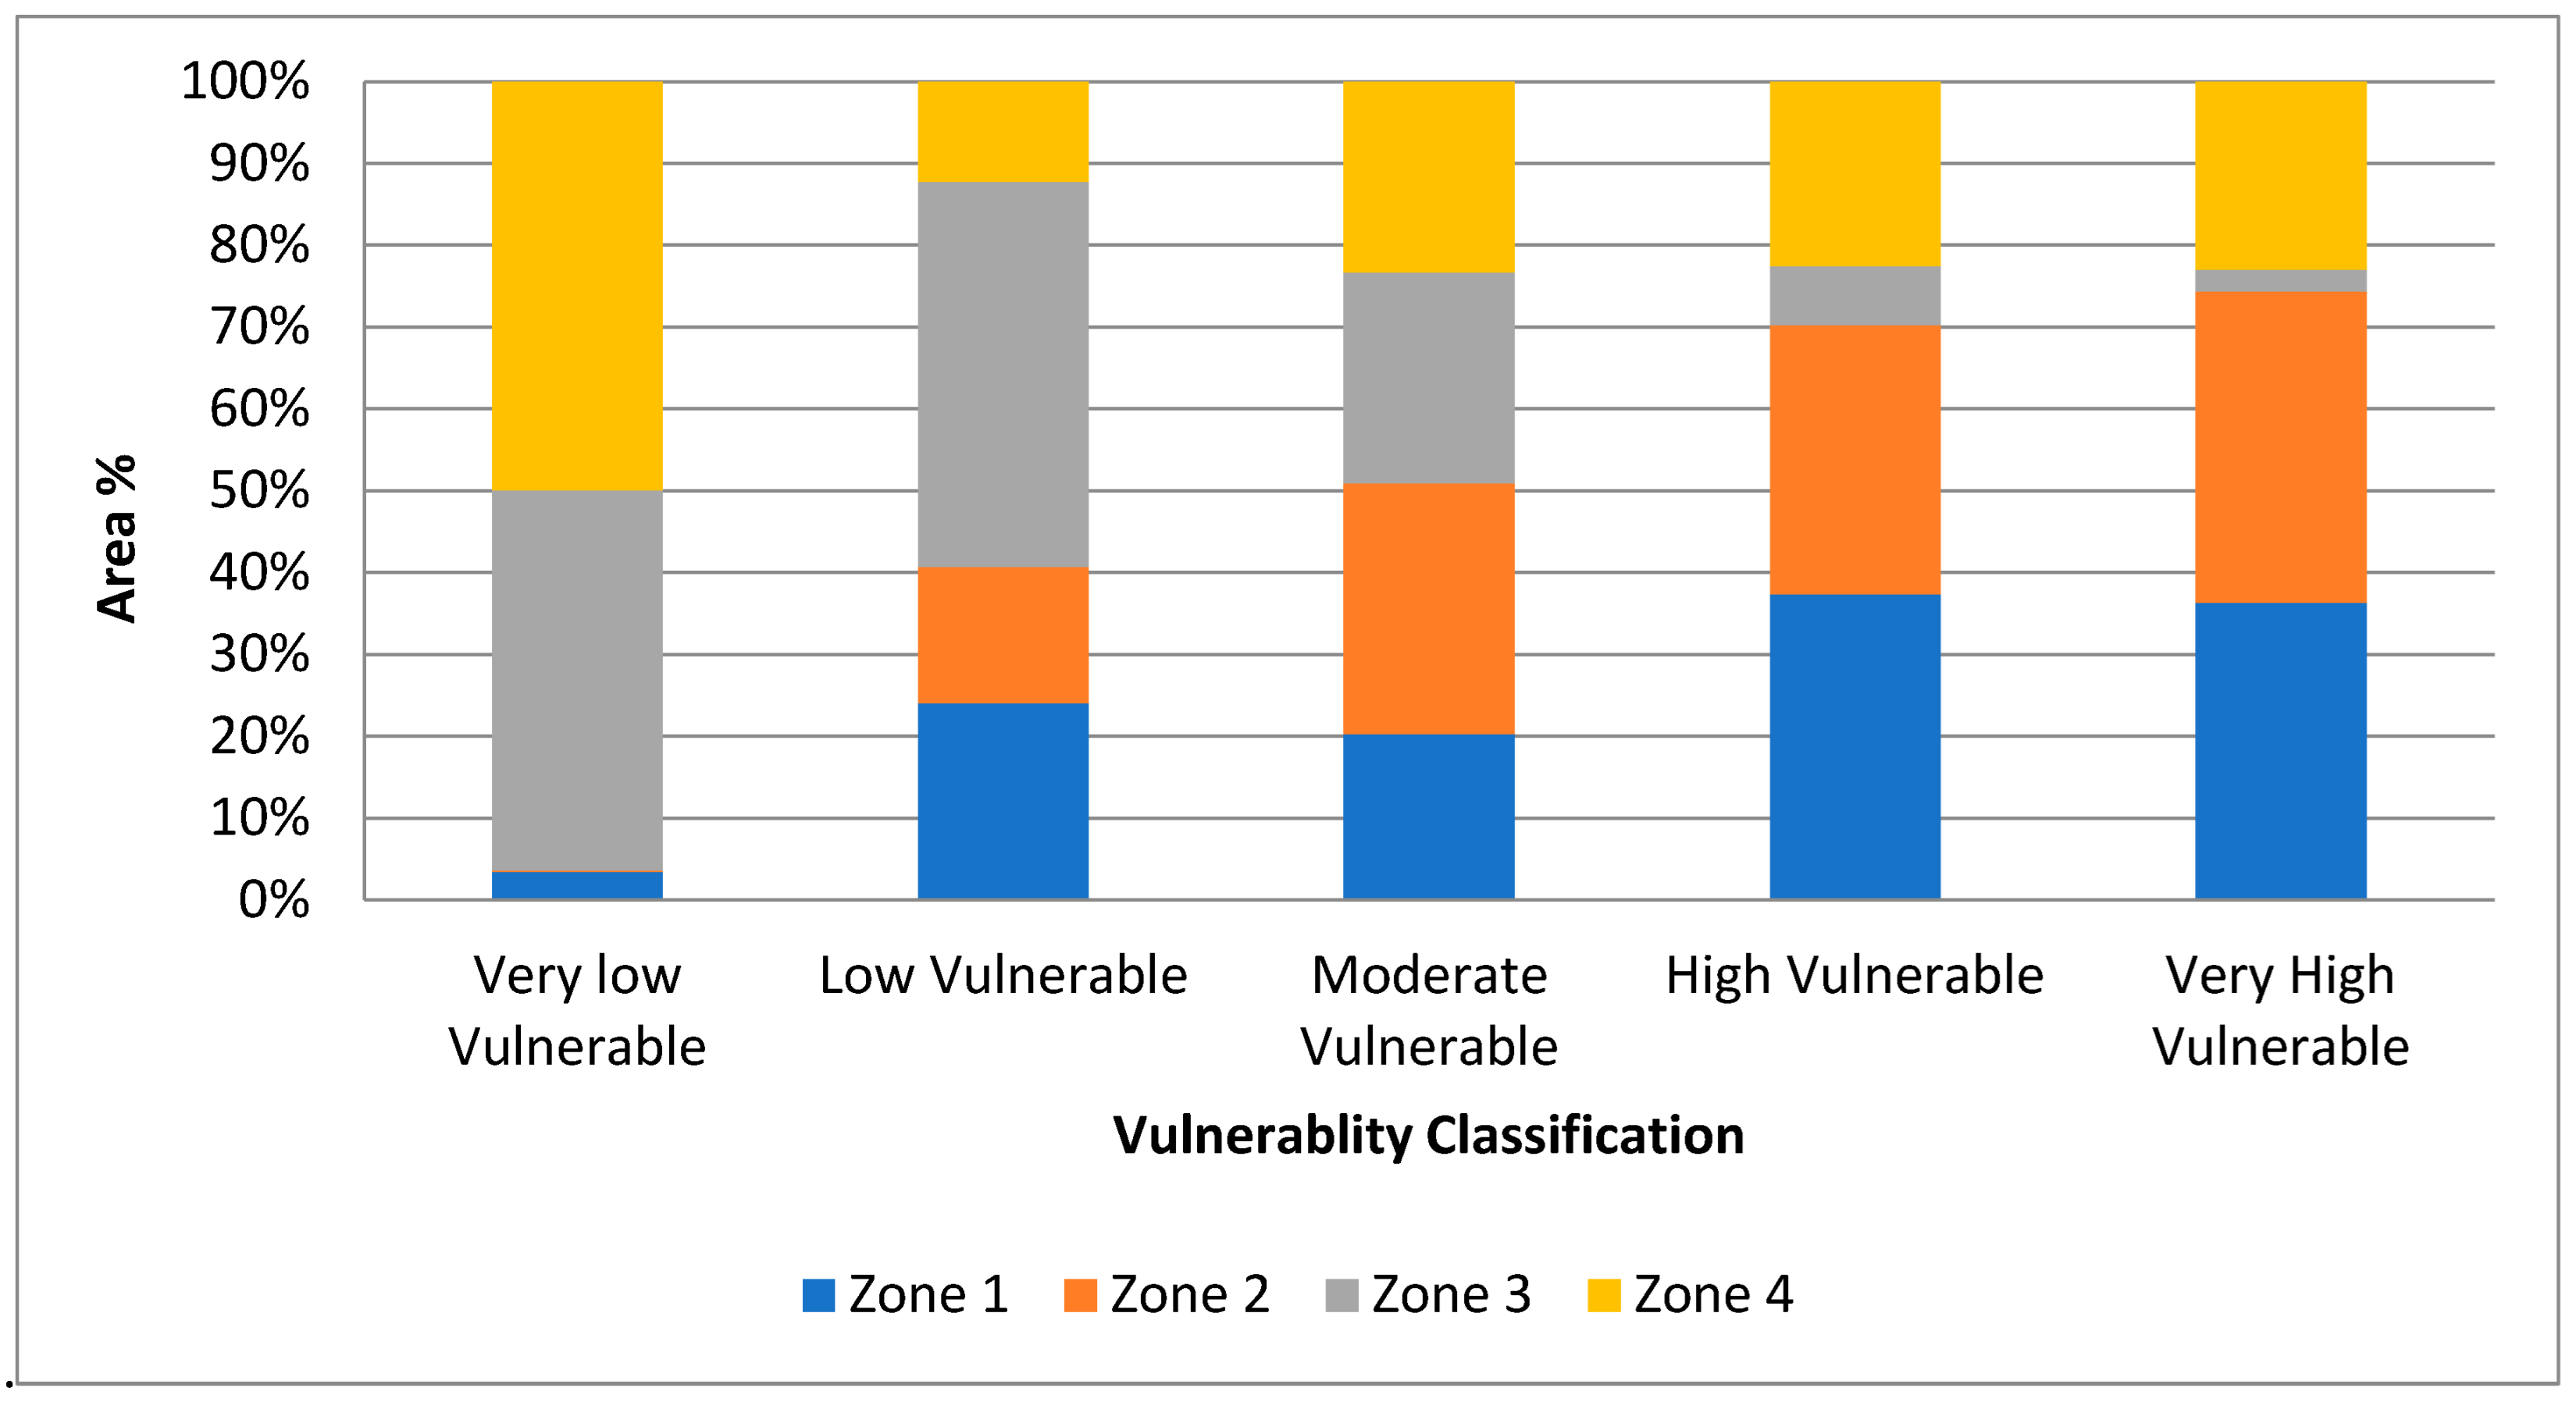
3.2. Coastal Vulnerability Assessment

The coastal vulnerability assessment classifies zones into five categories: very low, low, moderate, high, and very high vulnerability (Figure 6). Zones 1 and 2 exhibit the highest levels of risk, with 29.71% and 26.21% of their areas classified as highly vulnerable and 28.76% and 30.06% categorized as very highly vulnerable, respectively. In contrast, Zone 3 predominantly falls under the low (38.01%) and very low (28.90%) vulnerability categories, suggesting relatively stable coastal conditions. Similarly, Zone 4 has a significant proportion of very low (31.07%) and moderate (22.87%) vulnerability levels, though it still contains notably high-risk areas (17.93%). Overall, moderate vulnerability (24.55%) is the most dominant classification across the study area, followed by low (20.23%), high (19.89%), and very high (19.77%) vulnerability levels. These results reveal spatial variations in susceptibility to coastal hazards, underscoring the need for targeted mitigation strategies, sustainable coastal management practices, and adaptive policies to enhance resilience against climate change and human-induced pressures.
The classification framework for assessing coastal vulnerability is based on the index ranges (Table 4) derived from the Physical Vulnerability Index (PVI), the Socioeconomic Vulnerability Index (SEVI), the Climatic Vulnerability Index (CVIc), and the Integrated Coastal Vulnerability Index (ICVI). This system enables categorization into five levels of vulnerability: very low, low, moderate, high, and very high. For instance, the PVI values exceeding 60 indicate very high physical vulnerability, while the SEVI values above 3.0 reflect intense socioeconomic pressures. Similarly, climatic impacts are considered very high when the CVIc surpasses 5.5. The ICVI, which combines all three components, categorizes areas scoring over 40 as highly vulnerable, aiding in targeted coastal planning and risk mitigation.
Table 5 presents the four distinct zones of coastal vulnerability throughout the Coromandel Coast. Every zone consists of many coastal locations with comparable topographical and oceanic features. With approximately 59% of its coastline classed as high (29.72%) and very high (28.76%), Zone 1, which includes heavily populated places like Chennai and Puducherry, has great sensitivity. Comparably, Zone 2, which includes areas like Cuddalore and Nagapattinam, showcases a similar tendency, with over 56% of its coastline classified as highly or very highly sensitive. These patterns show how sensitive Zones 1 and 2 are to coastal hazards due to their low elevation, dynamic shoreline processes, and considerable degree of human activity. With about 67% of the coastline under a low or very low exposure classification, Zone 3, which encompasses the coastal stretches of Thanjavur, Pudukkottai, and sections of Ramanathapuram, showcases a much reduced risk profile. Between vulnerability categories, from Ramanathapuram to Kanyakumari, Zone 4 shows a more equitable mix. However, about 36% of its coastline is classified as extremely or very highly sensitive, given its exposure to considerable wave energy and changing land use patterns.

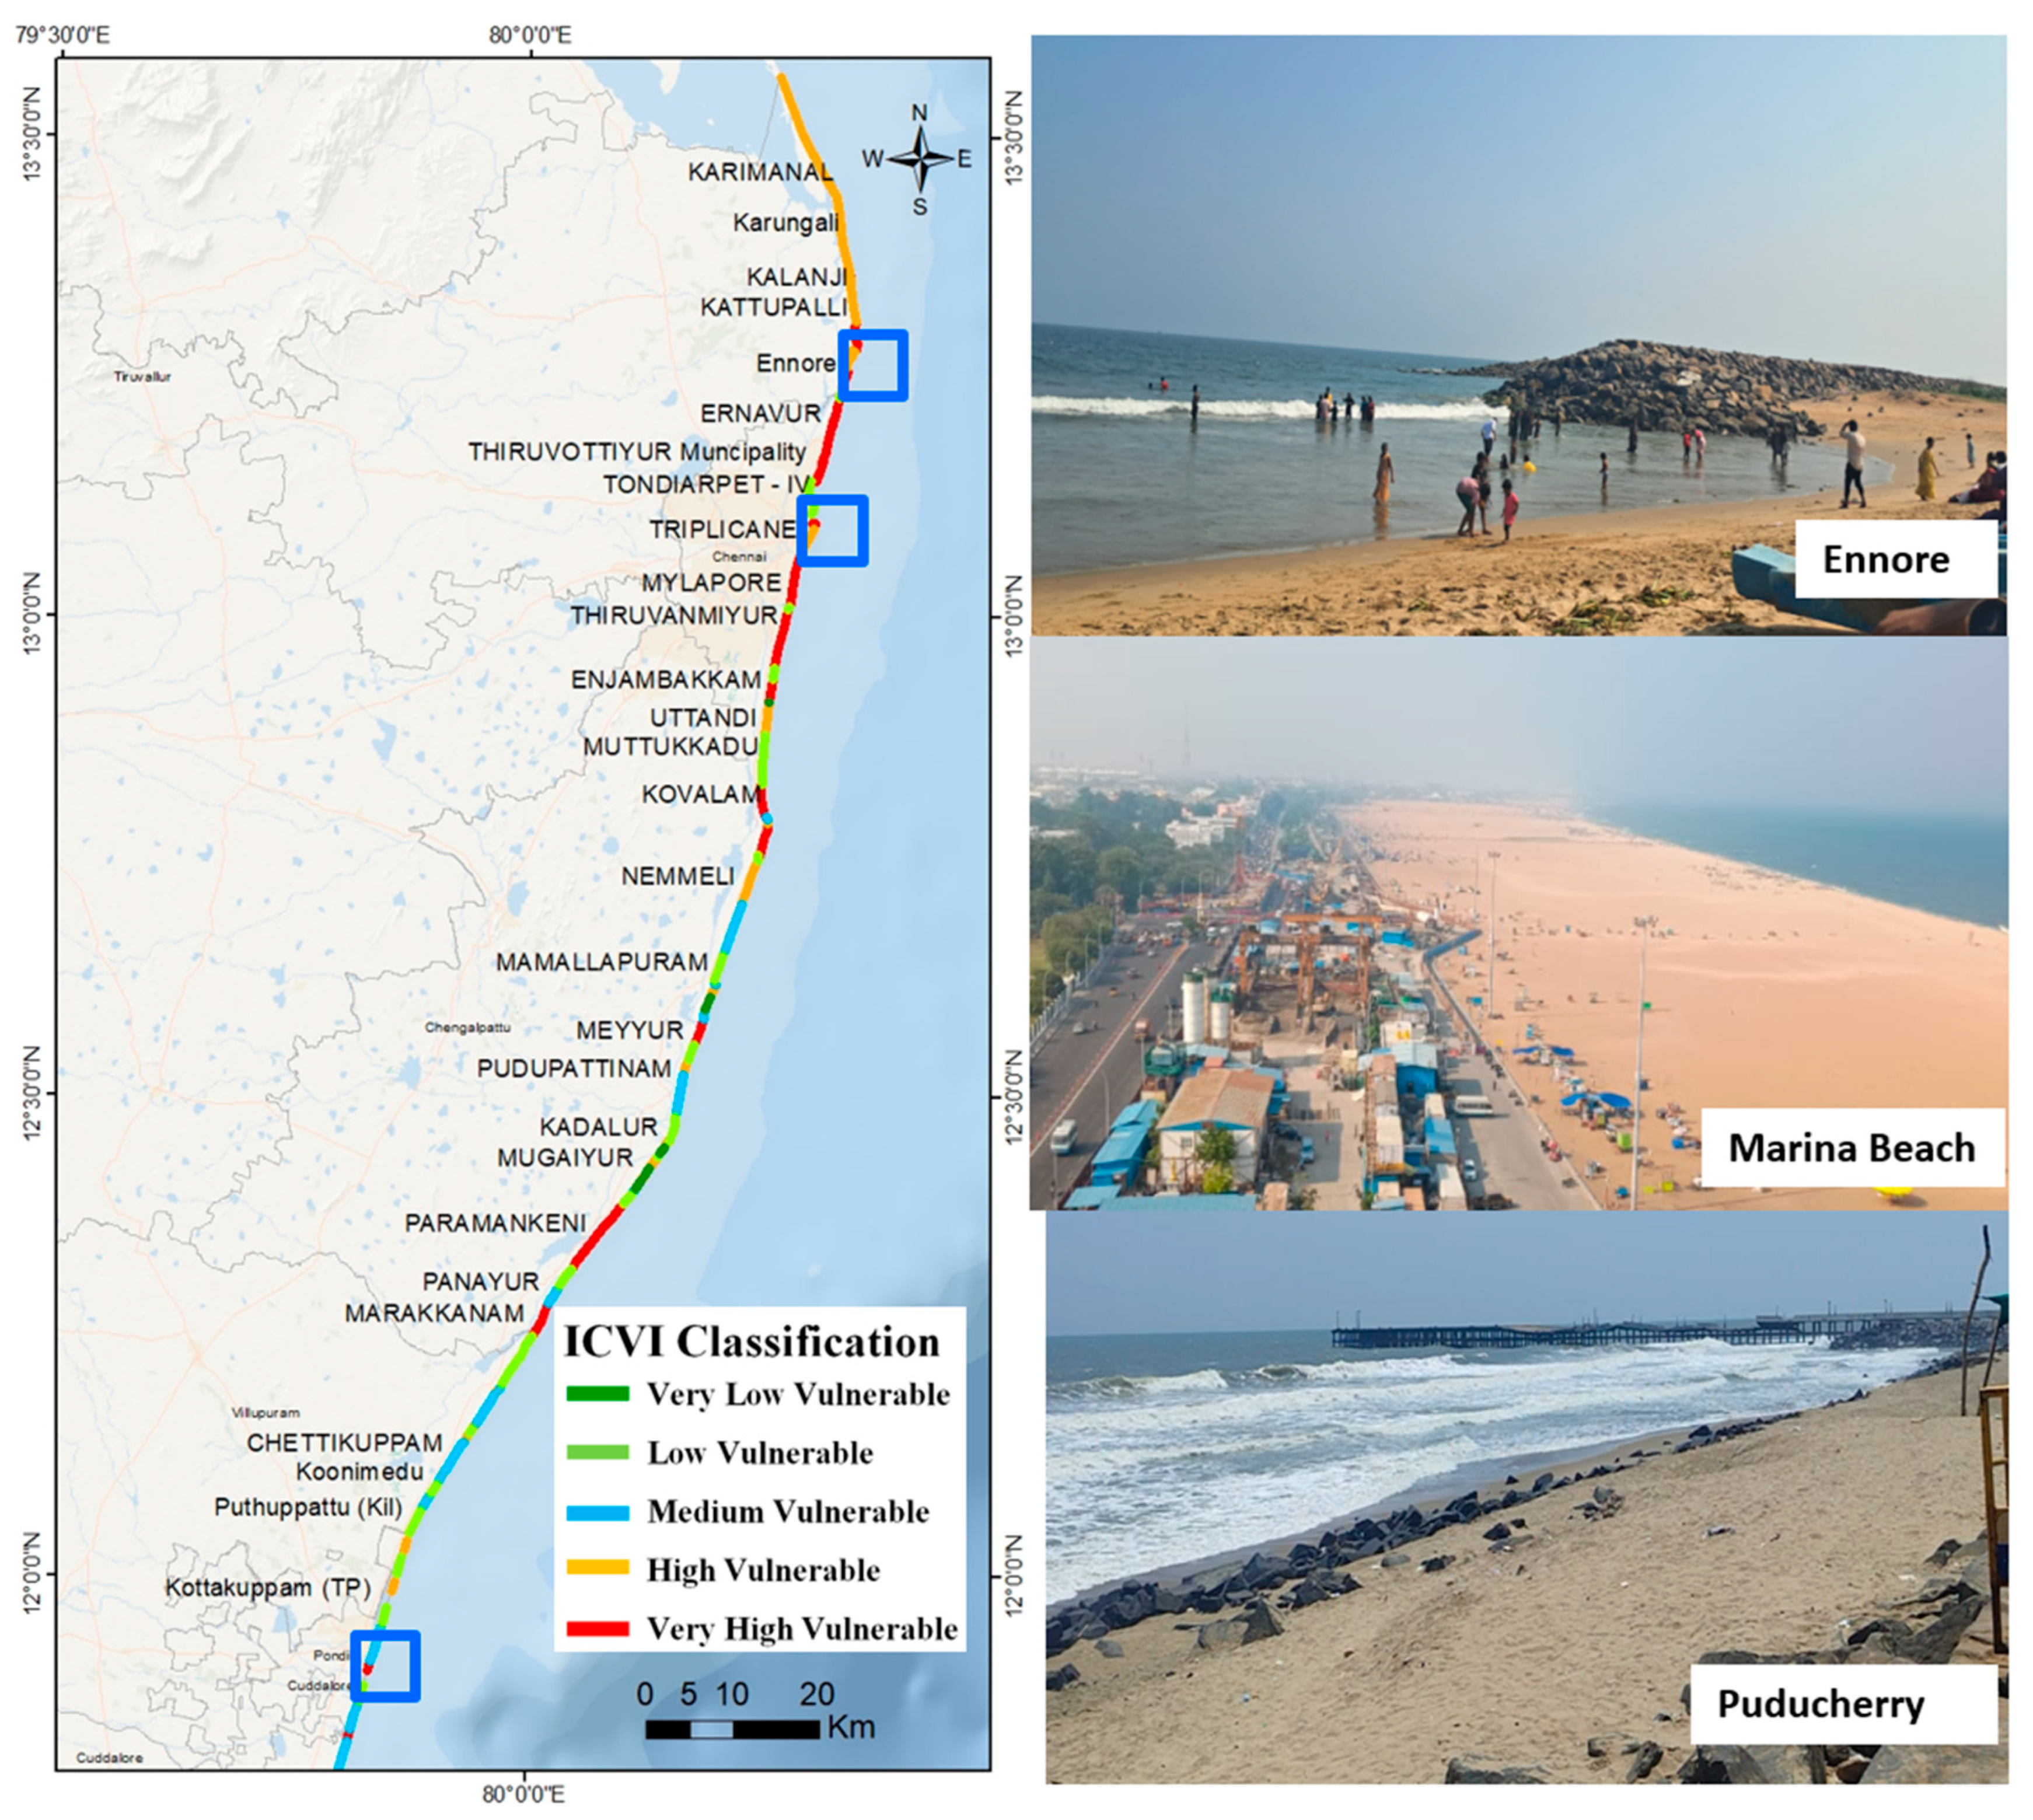
3.2.1. Zone 1: Thiruvallur to Puducherry

Zone 1, covering Chennai, Royapuram, Ennore, and Puducherry, is highly urbanized with significant coastal infrastructure. The region’s low-lying elevation makes it particularly prone to flooding, with areas like Pulicat Lake, Ennore, and the Cauvery Delta at high risk. Rapid urbanization and land reclamation have reduced natural flood buffers, worsening the impacts of storms and rising sea levels. Severe erosion is evident along the northern coast, particularly in Karimanal, Pulicat, and Kattupalli, while the Marina and Elliot beaches remain stable. The region’s gentle coastal slope (<0.5°) increases vulnerability to storm surges. Shallow bathymetry near the coast amplifies wave energy, accelerating erosion. Wave heights range from 0.75 to 1.5 m, and tidal variations under 1.5 m contribute to flooding risks. With increasing climate threats, urgent coastal management is needed.
The analysis of Zone 1’s vulnerability distribution highlights that nearly 58.48% of the region falls under high to very high vulnerability categories, indicating significant exposure to coastal hazards (Figure 7). In contrast, 19.93% of the area experiences moderate vulnerability, while only 21.6% of the region falls under low to very low vulnerability classifications, suggesting limited natural resilience against extreme events. A combination of engineered solutions, like breakwaters and natural defenses, such as mangrove restoration, can help protect communities. Strengthening drainage systems and implementing flood-resistant infrastructure will be crucial for this high-risk urban zone.

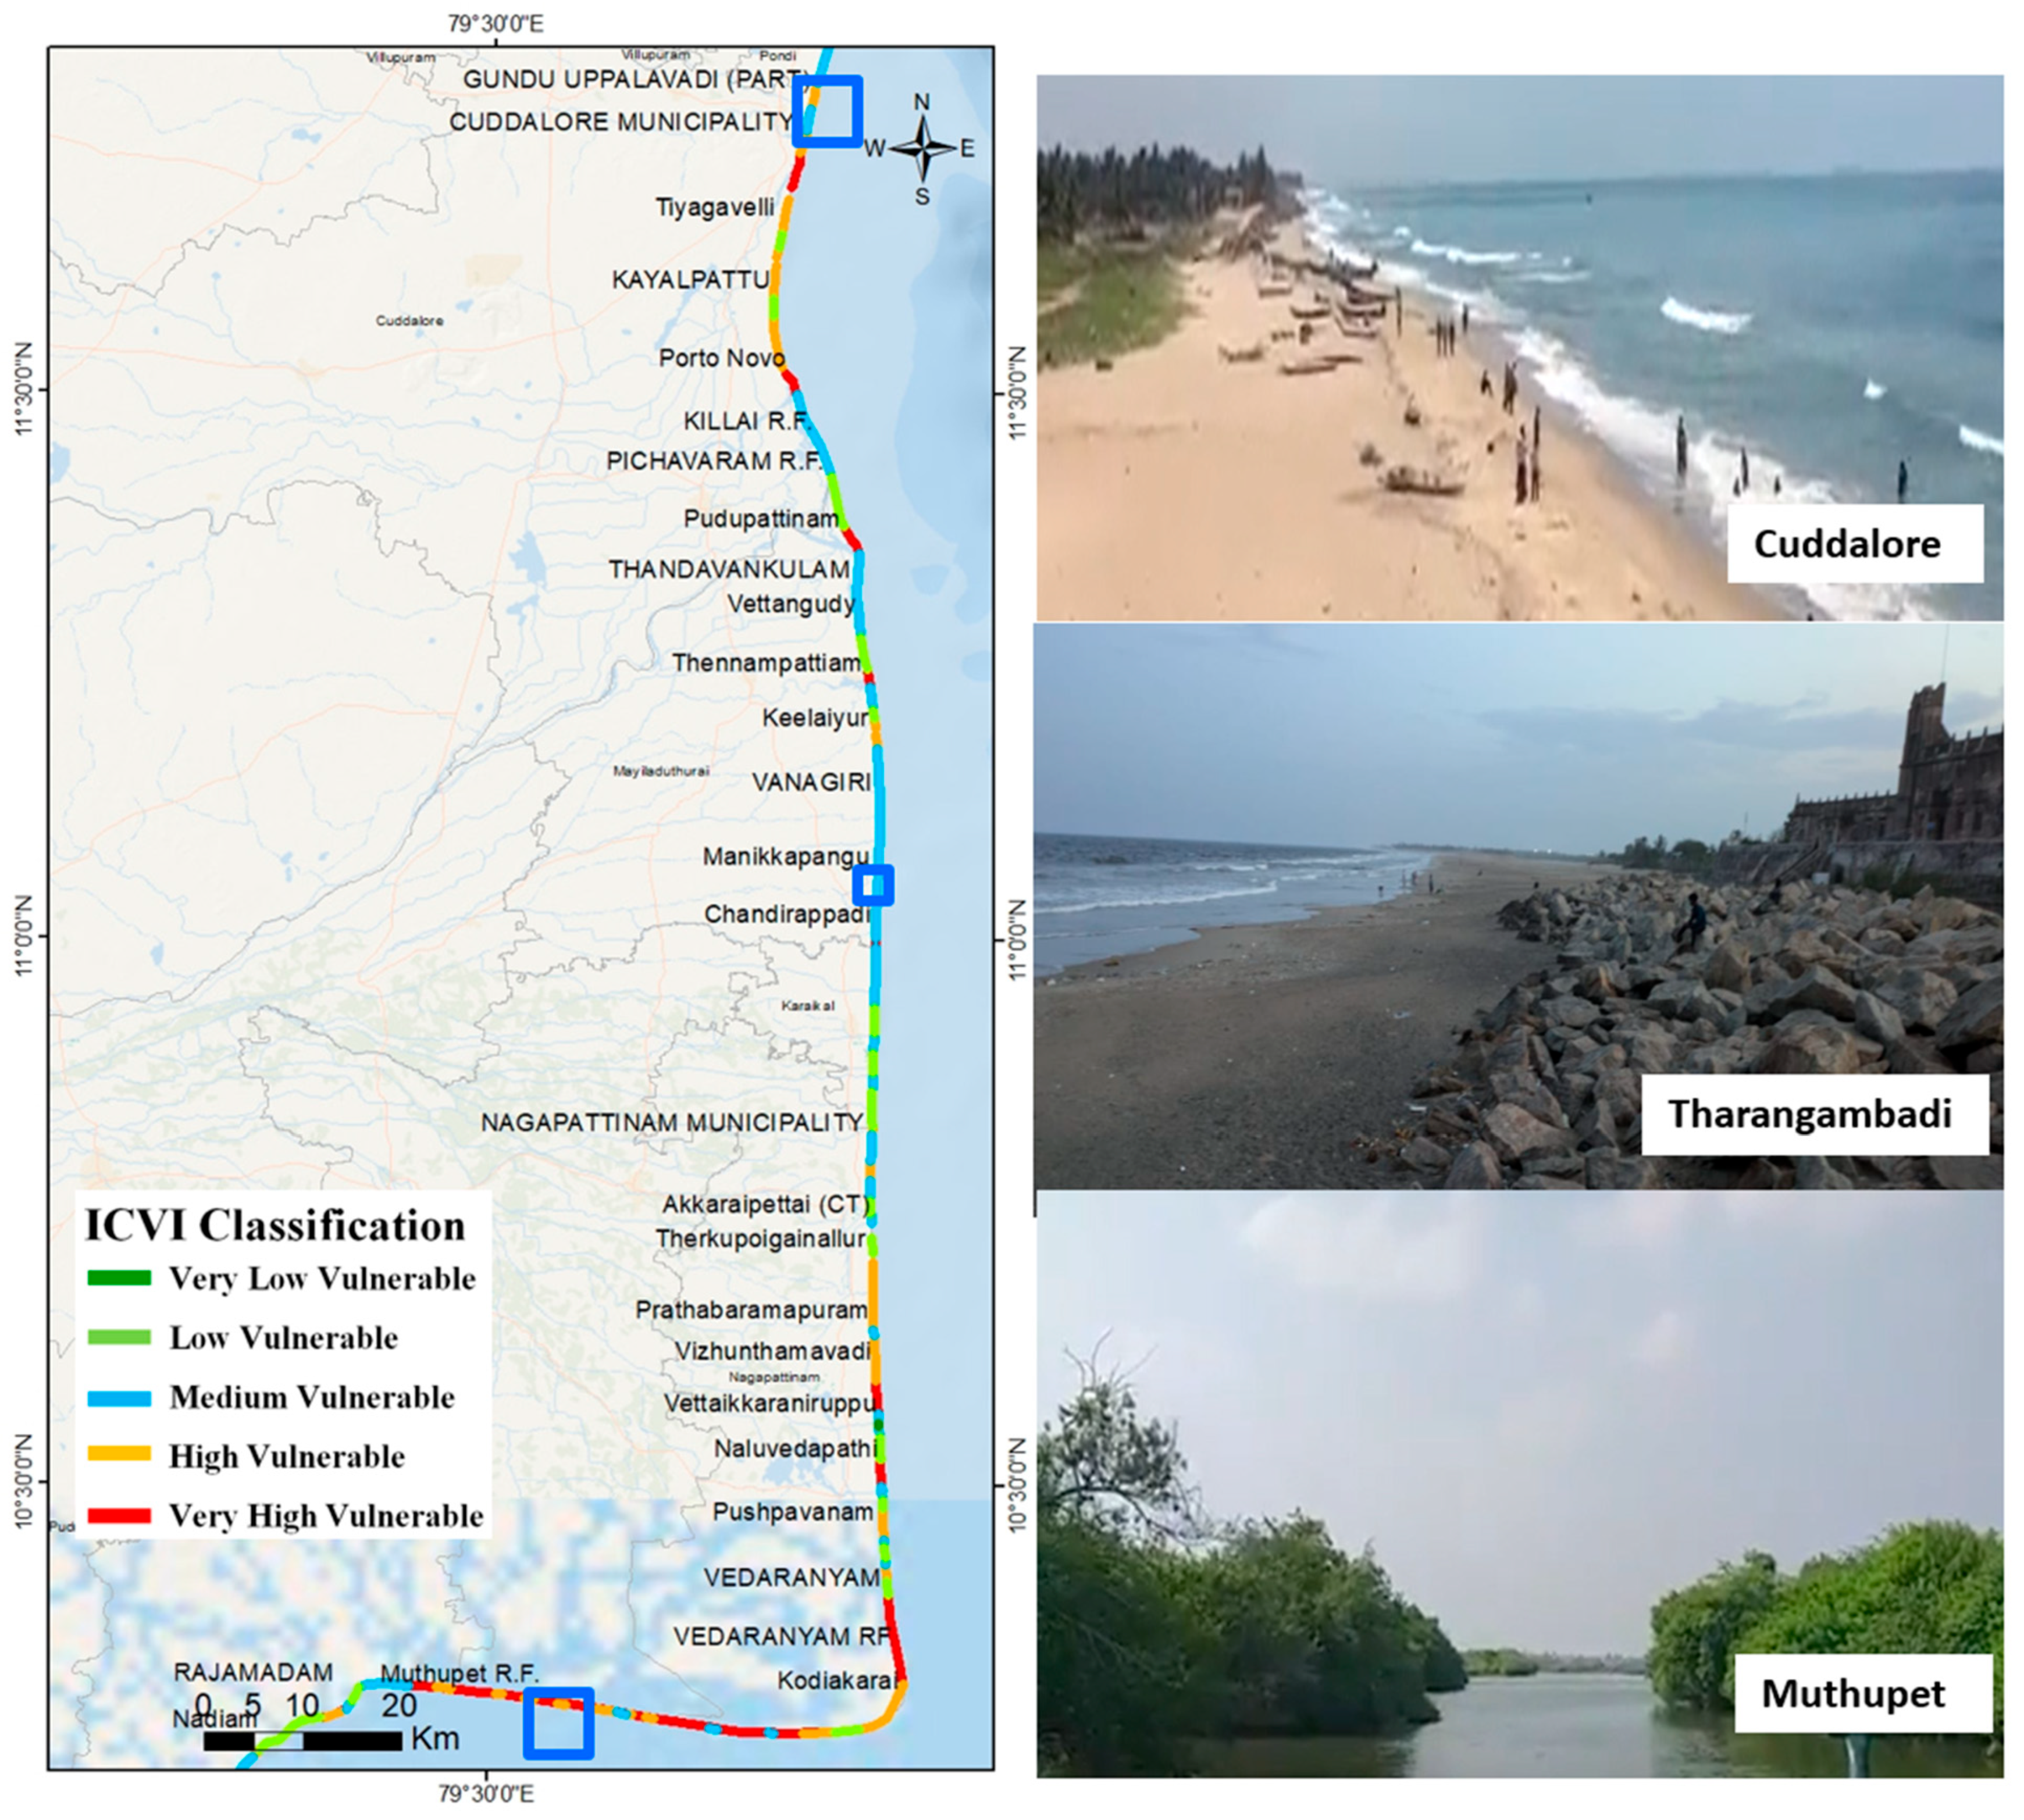
3.2.2. Zone 2: Cuddalore to Thiruvarur

This zone, covering Cuddalore, Mayiladuthurai, and Nagapattinam, is dominated by agriculture, mangrove forests, and salt pans. Population densities range from 1000 to 2000 persons/km2, adding pressure on coastal ecosystems. The Cauvery Delta is a major flood-prone area due to its low elevation (below 5 m) and high erosion rates, especially between Thirupoondi and Vedaranyam. Kodiakarai sees extreme erosion, with rates up to −16.3 m per year, while south of Pichavaram, accretion occurs due to sediment buildup. The bathymetry is shallow, increasing vulnerability to cyclones and tidal surges. Wave heights range from 0.75 to 1.25 m, and tidal fluctuations lead to prolonged flooding. Sea level rise has severe impacts on delta regions, including flooding, erosion, saltwater intrusion, habitat loss, and threats to agriculture and communities. While extensive mangrove coverage in Cuddalore, Nagapattinam, and Thiruvarur provides some natural protection, deforestation and human encroachment threaten this buffer.
The Coastal Vulnerability Index (CVI) indicates that 30.06% of this segment is highly vulnerable, 26.20% falls under high vulnerability, and 30.10% is moderately vulnerable, while 13.50% and 0.12% are categorized as low and very low vulnerability, respectively (Figure 8). Sustainable land use planning, stricter conservation policies, and improved flood mitigation measures are essential. Investing in climate-adaptive agriculture and better coastal infrastructure will help communities adapt to increasing environmental pressures.

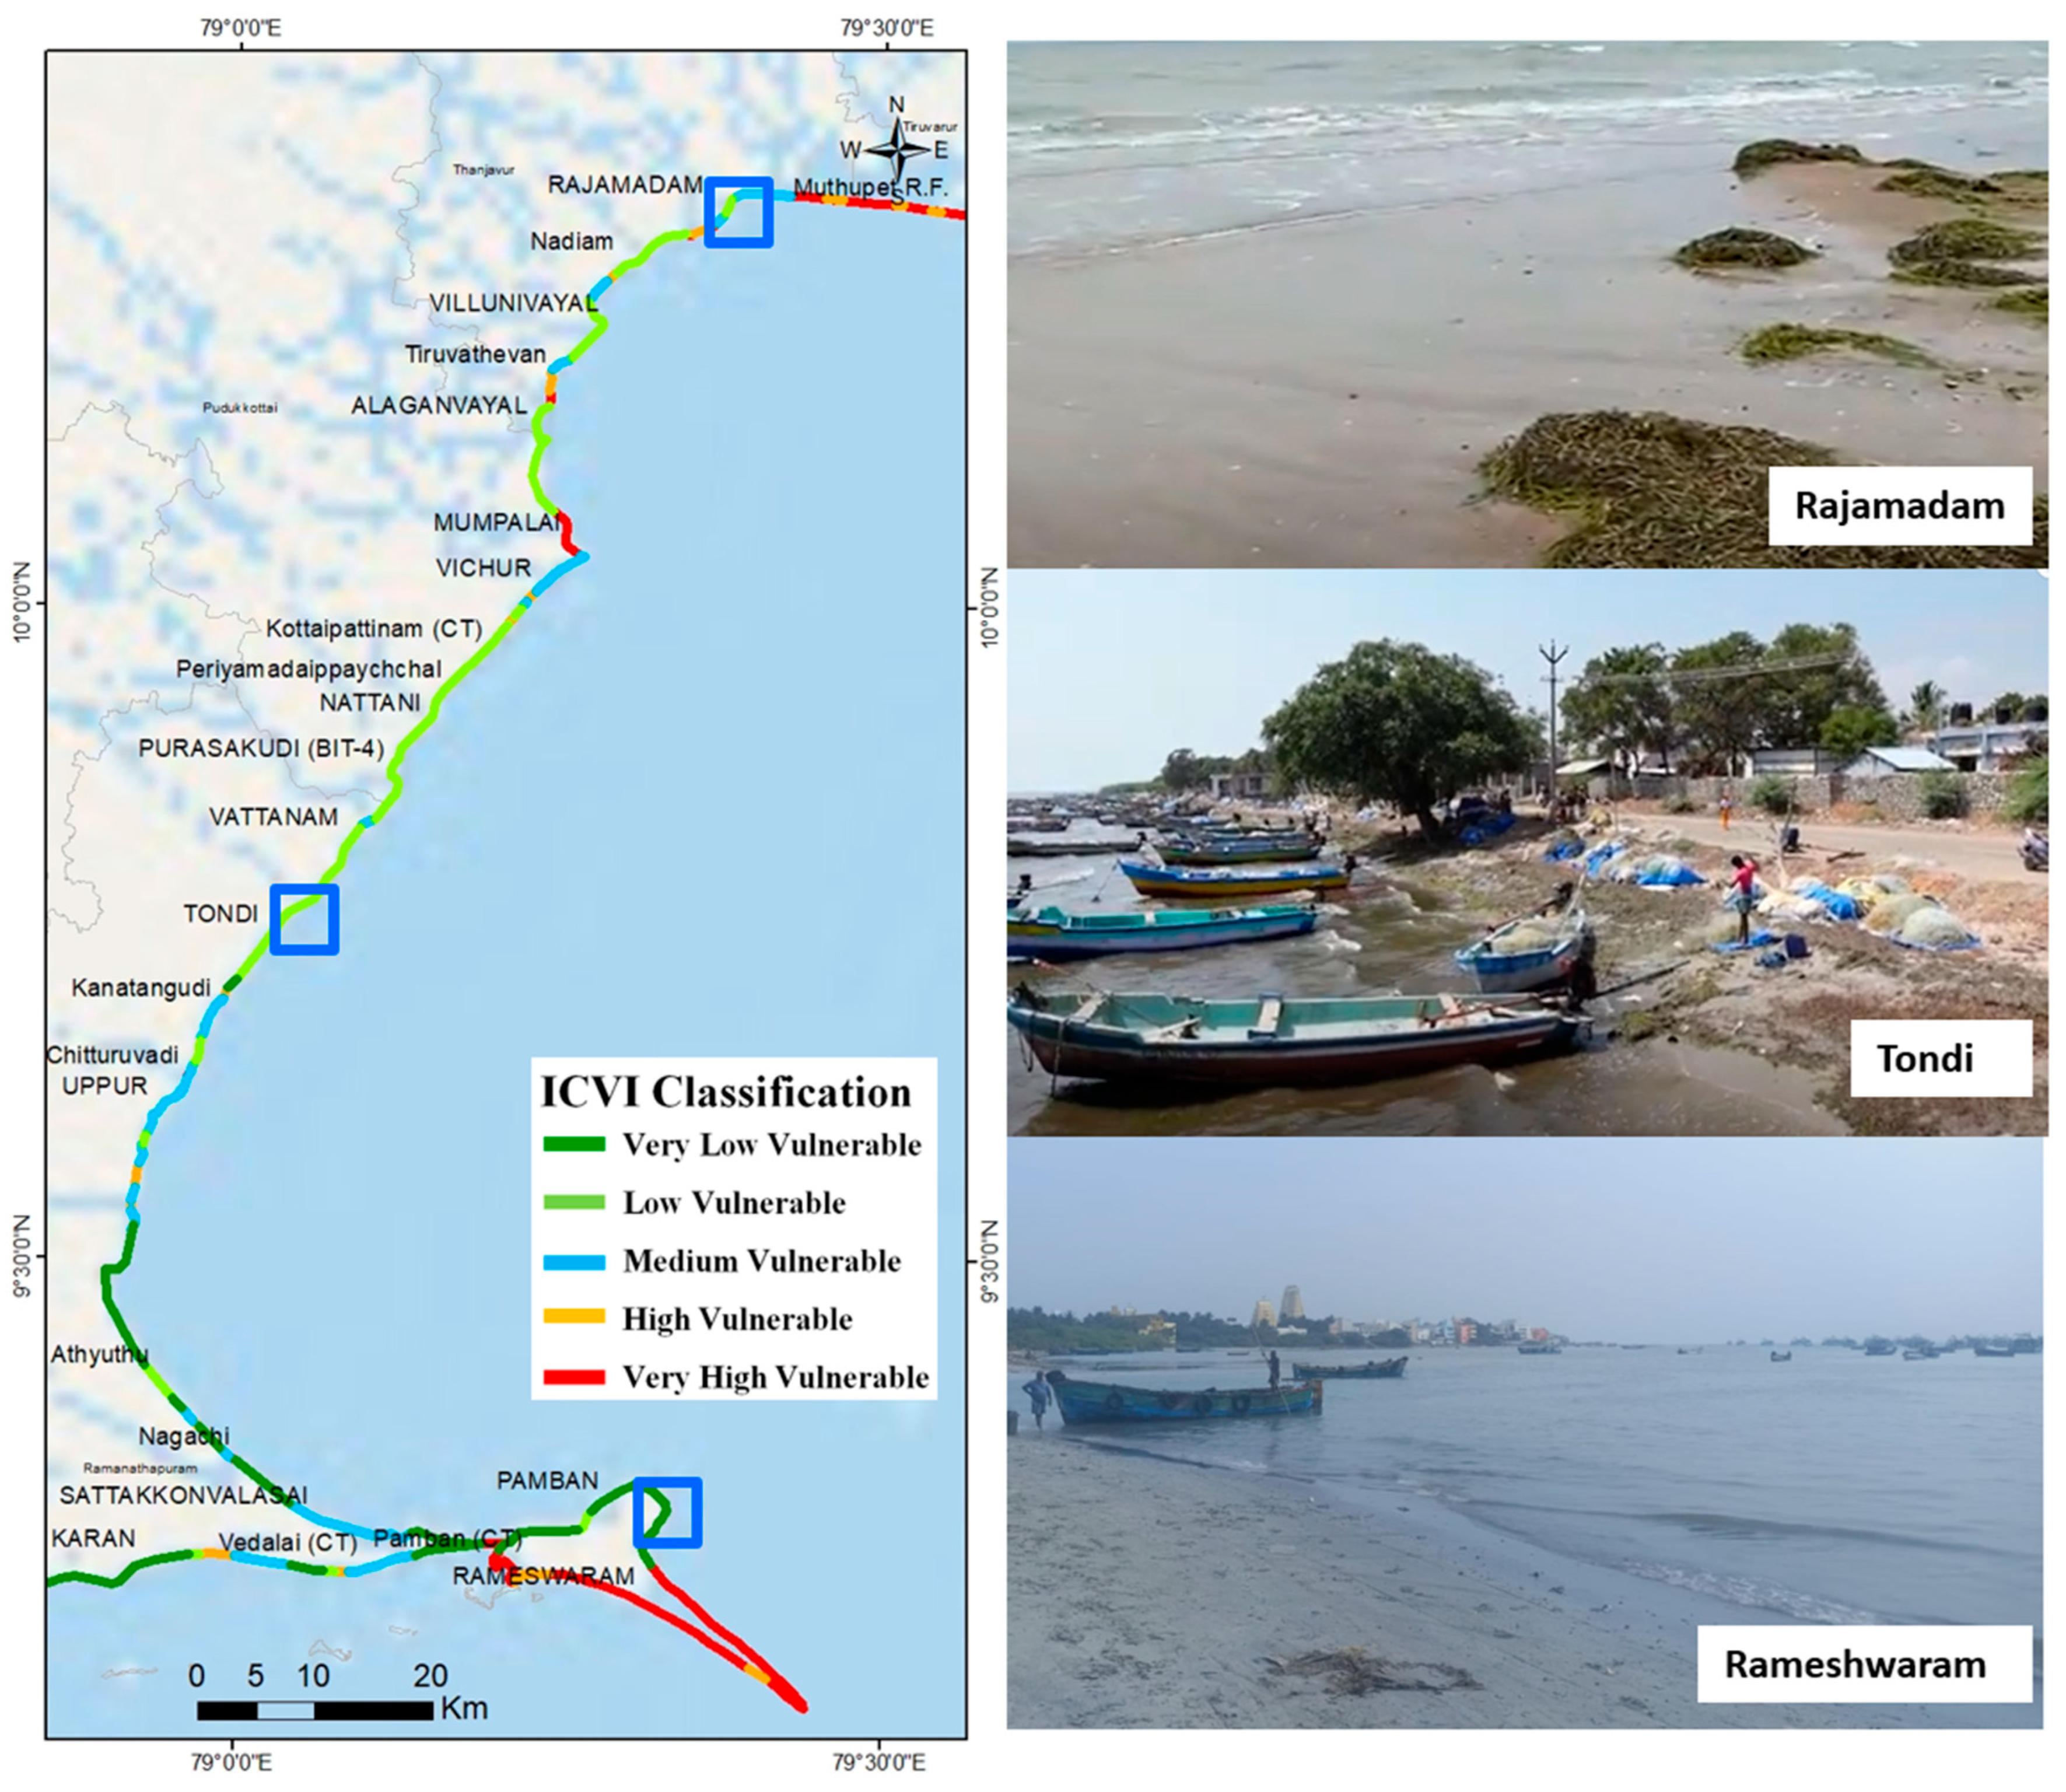
3.2.3. Zone 3: Thanjavur to Ramanathapuram

This zone includes Thanjavur, Pudukkottai, and Ramanathapuram, with mostly rural settlements and a low population density (below 500 persons/km2). Coastal erosion is significant around Ravuthanvayal and Sendalaivayal, while Rajamadam and Thangachimadam experience accretion. The region’s gentle coastal slope (0.5 to 1°) makes it more vulnerable to erosion and storm surges. Shallow waters along the coast increase risks from tidal currents and cyclones. Areas like Periyapattinam and Valinokkam face moderate erosion, while Manakudy and Enayam see sediment accumulation. Wave heights range from 0.5 to 1.25 m, with tidal fluctuations leading to seasonal flooding. Mangroves play a crucial role in protecting the coast, particularly in Thanjavur (1700 hectares) and Ramanathapuram (650 hectares), but agricultural expansion is reducing their coverage. Rising temperatures and erratic rainfall patterns threaten crops and water security.
The Coastal Vulnerability Index (CVI) highlights that 28.89% of Zone 3 falls under very low vulnerability and 38.00% under low vulnerability, while 25.29%, 5.73%, and 2.06% of the region fall under moderate, high, and very high vulnerability categories, respectively (Figure 9). Addressing these challenges requires a comprehensive coastal zone management strategy integrating nature-based solutions, like mangrove restoration and dune stabilization, with engineering interventions, such as seawalls, groynes, and climate-resilient infrastructure, to safeguard vulnerable communities and ecosystems.

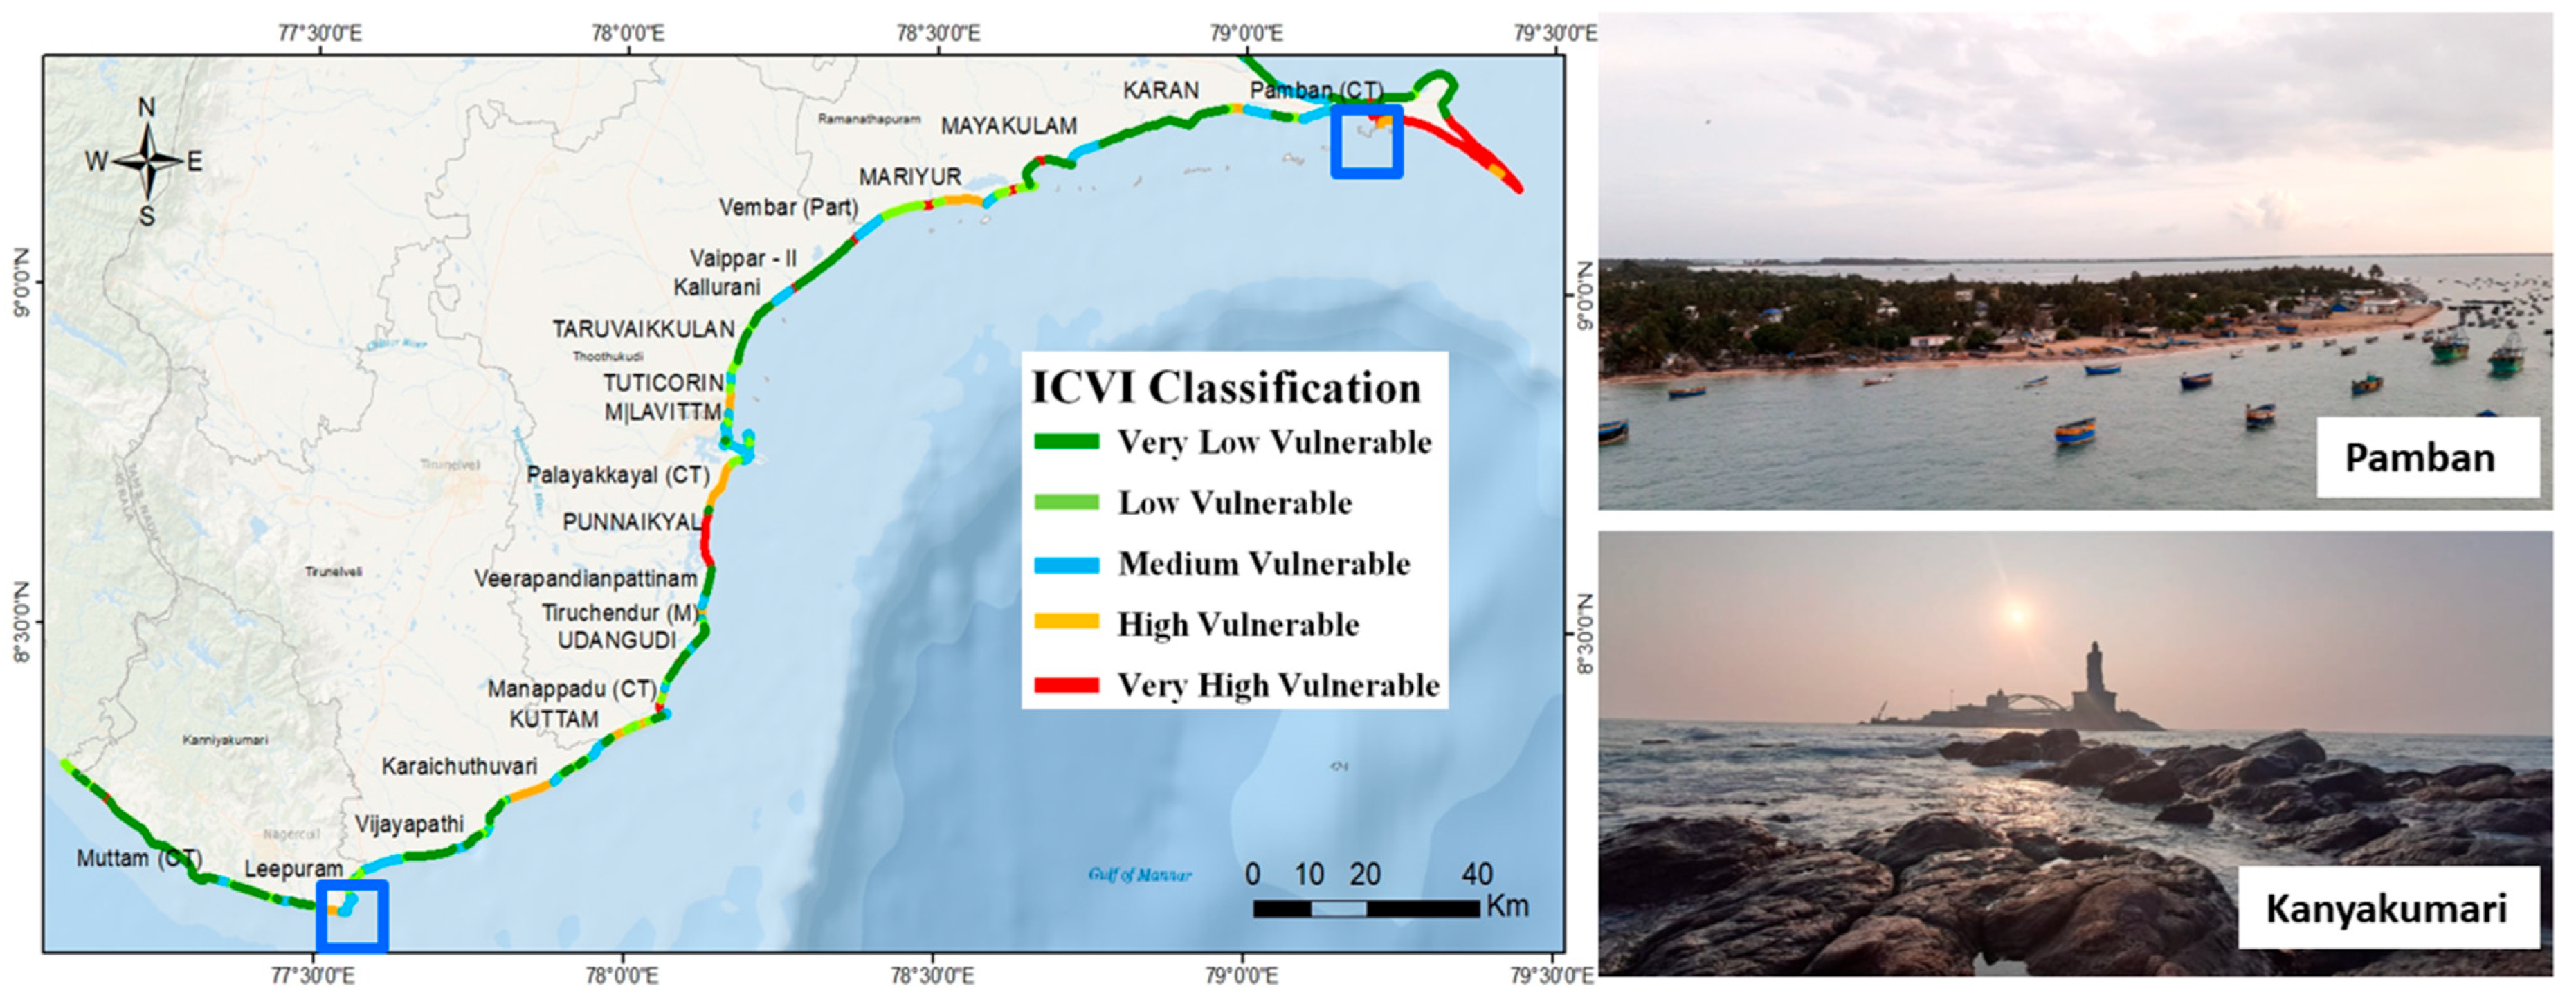
3.2.4. Zone 4: Ramanathapuram to Kanyakumari

Zone 4, spanning Ramanathapuram to Kanyakumari, has a mix of agricultural land, forests, and coastal ecosystems. Certain areas, like Muttam and Leepuram, have population densities of about 1500 persons/km2, while the rest of the region remains sparsely populated. The coastal slope is steeper (>3°), offering some natural resistance to tidal surges compared to other zones. Bathymetric data shows deeper waters near Kanyakumari and Manapad, lowering their flood risk. However, erosion affects parts of the coastline between Periyapattinam and Valinokkam, while sediment accumulation leads to accretion in Manakudy and Enayam. Wave heights in this zone range from 1 to 1.5 m, with rocky outcrops helping buffer wave energy. Tidal ranges are moderate (0.5 to 1 m), contributing to occasional flooding during storms. Kanyakumari has the highest forest cover (33%), offering some natural protection against climate threats. Strengthening coastal defenses through mangrove and dune restoration, combined with infrastructure improvements, will be key to ensuring long-term resilience. Sustainable fisheries management and disaster response planning will also play a vital role in protecting coastal communities.
A detailed vulnerability assessment of Zone 4 highlights varying degrees of exposure to coastal hazards (Figure 10), with 31.07% of the area categorized as very low vulnerability and 9.93% as low vulnerability. However, a significant portion (22.87%) falls under moderate vulnerability, indicating areas that experience periodic but manageable coastal impacts. Alarmingly, 17.93% of Zone 4 is classified as highly vulnerable, while 18.19% is designated as very highly vulnerable, emphasizing the urgent need for targeted intervention strategies.

4. Discussion

The Coromandel Coast of Tamil Nadu is a dynamic coastal system with natural and human activity influences. Evaluating its vulnerability is vital for sustainable coastal management, particularly with the increasing effects of climate change and human pressures. Various studies have assessed risk factors on coastlines worldwide using techniques like the Coastal Vulnerability Index (CVI) [11,37]. The Coastal Vulnerability Index (CVI) is one of the most widely used techniques for assessing coastal vulnerability, according to the literature currently in publication [11,12,13,14]. Several Coastal Vulnerability Indices (CVIs) have been developed over the past decades, including the pioneering work by Gornitz (1991) [11], which focused primarily on physical factors, such as sea-level rise and shoreline change, and the widely used CVI by Thieler and Hammar-Klose [37] and Pendleton et al. [49], which incorporated six physical variables for large-scale assessments. In more recent frameworks, [36,38] introduced socioeconomic and flood exposure indicators, expanding the scope beyond physical parameters. In contrast, the CVI developed in this study integrates physical, climatic, and socioeconomic components using a Multi-Criteria Spatial Analysis (MCSA) framework within a GIS environment. This index is tailored to the specific regional context using high-resolution spatial data, reanalysis of oceanographic datasets, and adaptive capacity indicators, offering a more holistic and locally relevant assessment. By combining these dimensions, our CVI improves existing models by enabling targeted vulnerability mapping and supporting localized coastal management decisions. Most CVI studies use multi-criteria decision analysis techniques, with the Analytic Hierarchy Process (AHP) being the most widely used approach [14,15,16,17]. The Belmiro coastal stretches of Brazil [17], the coast of Bangladesh [22], the Kerala Coast [50], the Digha Coast of West Bengal, India [23], the Vishakhapatnam coastal tract, Andhra Pradesh [51], and the Chennai Coast of India [24] are just a few of the places where coastal vulnerability has been studied.
This study examines vulnerability along the Coromandel Coast, with special reference to the variation in susceptibility along the coastline. The geomorphic character of the region is varied, with sandy beaches, estuarine systems, tidal flats, and deltaic settings, each of which responds differently to accretion and erosion. Low-lying tracts with elevations of less than five meters, such as Pulicat Lake, Ennore, and the Cauvery Delta, are most susceptible to inundation and hence warrant priority attention. Deltaic tracts along the Cauvery, Ponnaiyar, and Vaigai Rivers are most susceptible to storm surges and coastal flooding. Vegetated tidal flats, such as Nagapattinam, Thoothukudi, and Rameswaram, exhibit greater resilience. The findings emphasize the importance of adaptive coastal management strategies that consider the dynamic character of coastal systems. Nature-based strategies, such as mangrove restoration, dune stabilization, and protection from seagrass meadows, can provide long-term resilience against storm surges and erosion [52].
Socioeconomic factors further compound coastal vulnerability, with rapid urbanization, industrialization, and tourism placing increasing stress on coastal ecosystems [53]. Densely populated urban centers disrupt natural sediment transport processes [9,10]. Seasonal variations, including monsoon-driven erosion patterns, further highlight the dynamic nature of the coastal system [54,55]. Climate change projections indicate a temperature rise in Tamil Nadu under SSP2 4.5 AR6 future projection [47,56]. Increased rainfall and sea level rise further raises flood risks, necessitating strong coastal defense strategies [57,58,59]. Strengthening early warning systems, promoting sustainable land use, and developing resilient infrastructure can further enhance coastal resilience [2].
The vulnerability analysis reveals notable variations in the Coromandel Coast’s vulnerability to coastal hazards. By identifying 19.8% of the coastline as highly vulnerable and 19.7% as very highly vulnerable, it highlights the urgent need for sustainable coastal management. The study also highlights how artificial features, such as ports, jetties, and groynes, can worsen erosion by obstructing sediment movement [48]. Case studies from around the world have shown that low-lying, densely populated areas with significant economic activity are particularly vulnerable; the Chennai coastline exhibits comparable trends [15,16,24,56]. Sustainable tourism policies must balance economic development with natural coastal preservation to prevent unintended negative impacts on coastal stability [54]. To achieve sustainable coastal development, policy frameworks should take an integrated approach, combining scientific research, stakeholder engagement, and proactive management [7]. Community-driven adaptation initiatives, along with coastal monitoring programs, can help build resilience against climate-induced hazards [46]. The long-term sustainability of the Coromandel Coast depends on a balanced approach that harmonizes development with conservation, ensuring resilience against future climatic and human-induced pressures. Coastal monitoring programs combined with community-based adaptation plans can increase resilience against climatic hazards [59]. The long-term sustainability of the Coromandel Coast relies on a balanced strategy that balances development with conservation, with resilience against future climatic and anthropogenic pressures.

5. Conclusions

The vulnerability assessment of Tamil Nadu’s Coromandel Coast highlights the complex relationship of physical, socioeconomic, and climatic parameters that contribute to coastal risk. Critical areas like Pulicat Lake, the Cauvery Delta, and Vedaranyam have increased susceptibility due to their low elevation, gradual slopes, and exposure to active coastal activities. Coastal instability caused by sediment movement and wave refraction enhances vulnerability to bathymetric changes. Critical erosion hotspots discovered in regions like Cuddalore, Pulicat, and Kodiakarai underscore the immediate need for focused erosion mitigation strategies. Socio-cultural and economic pressures, especially in heavily populated areas like Chennai, Puducherry, and Ennore, exacerbate environmental degradation and strain coastal ecosystems. Coastal erosion threatens local livelihoods in agricultural regions like Nagapattinam, Ramanathapuram, and Mayiladuthurai. Furthermore, changes in precipitation patterns and increased temperatures (up to 1.4 °C) due to climate change intensify the dangers of flooding and storm surges in low-lying coastal areas. Sea level rise has severe impacts on delta regions, including flooding, erosion, saltwater intrusion, habitat loss, and threats to agriculture and communities.
The analysis indicates that around 19.8% of the coastline is very vulnerable, while an additional 19.7% is categorized as very highly vulnerable. The results underscore the pressing need for integrated coastal zone management (ICZM) techniques that emphasize nature-based solutions, including mangrove restoration, shoreline stability, and adaptive land use planning. Improving early warning systems, advancing robust infrastructure, and encouraging intersectoral cooperation among politicians, scientists, and local people are crucial measures for protecting ecosystems and human settlements. Proactive and participatory management will be crucial in strengthening the long-term resilience of the Coromandel Coast against increasing coastal risks.

Author Contributions

P.A.: Conceptualization; Methodology; Formal analysis and investigation; Software; Writing—original draft preparation. L.N.C.: Conceptualization; Supervision; Methodology; Visualization; Data Collection; Writing and editing—draft preparation and review. R.A.: Resources; Supervision; Writing—review and editing. A.I.S.N.: Data Collection, Methodology; Writing—review and editing. All authors have read and agreed to the published version of the manuscript.

Funding

This research received no external funding.

Institutional Review Board Statement

Not applicable.

Informed Consent Statement

Not applicable.

Data Availability Statement

Data will be provided upon request.

Acknowledgments

The authors thank M. Krishnaveni, Institute for Ocean Management (IOM), and Climate Studio, Centre for Climate Change and Disaster Management (CCCDM), Department of Civil Engineering, Anna University, Chennai, for providing infrastructure and data analysis support.

Conflicts of Interest

The authors declare that they have no known competing financial interests or personal relationships that could have appeared to influence the work reported in this paper.

References

  1. Šimac, Z.; Lončar, N.; Faivre, S. Overview of Coastal Vulnerability Indices with Reference to Physical Characteristics of the Croatian Coast of Istria. Hydrology 2023, 10, 14. [Google Scholar] [CrossRef]
  2. Turriza Canul, R.A.; Fernández-Díaz, V.Z.; Rojas Cárdenas, D.M.; Tzuc, Ó.M. Coastal vulnerability assessment with a hierarchical coastal segments approach. Ocean Coast. Manag. 2024, 249, 106989. [Google Scholar] [CrossRef]
  3. Parthasarathy, K.S.S.; Deka, P.C. Remote sensing and GIS application in assessment of coastal vulnerability and shoreline changes: A review. ISH J. Hydraul. Eng. 2021, 27 (Suppl. S1), 588–600. [Google Scholar] [CrossRef]
  4. Velegrakis, A.F.; Monioudi, I.; Tzoraki, O.; Vousdoukas, M.I.; Tragou, E.; Hasiotis, T.; Asariotis, R.; Andreadis, O. Coastal Hazards and Related Impacts in Greece. In The Geography of Greece: Managing Crises and Building Resilience; Darques, R., Sidiropoulos, G., Kalabokidis, K., Eds.; Springer: Cham, Switzerland, 2024; pp. 353–370. [Google Scholar] [CrossRef]
  5. Small, C.; Nicholls, R.J. A Global Analysis of Human Settlement in Coastal Zones. J. Coast. Res. 2003, 19, 584–599. [Google Scholar]
  6. Grothues, T.M.; Padilla, D.K.; Kolatan, S.; Kaunzinger, C.M.K.; Parker, P.; Handel, S.N. Life as a Design Element of Hardened Urban Shorelines. Estuaries Coasts 2025, 48, 48. [Google Scholar] [CrossRef]
  7. Hamid, N.; Yoganandham, S.T. An Introduction to Marine Ecosystem: Environmental and Economic Impacts. In Advances in Marine Ecosystem Research; Springer: Cham, Switzerland, 2025; pp. 1–20. [Google Scholar] [CrossRef]
  8. Dong, Y. The impact of tourists on the marine environment: A review and managerial implications. Reg. Environ. Chang. 2025, 25, 2385. [Google Scholar] [CrossRef]
  9. Ali, E.M.; Zanaty, N.; Khairy, N.; El-Magd, I.A. Assessment of Climate Change Implications on Coastal and Marine Ecosystems Using Satellite Data. In Modelling and Advanced Earth Observation Technologies for Coastal Zone Management; Ali, E.M., El-Magd, I.A., Eds.; Springer Nature Switzerland: Cham, Switzerland, 2025; pp. 85–115. ISBN 978-3-031-78768-3. [Google Scholar]
  10. Ford-Learner, M.A.; Addison, J.; Cumming, G.S. A Review of Ecosystem Service Supply in Tropical Marine Ecosystems and Its Relationship to Habitats in the Great Barrier Reef. Mar. Ecosyst. Ecol. 2024, in press. [Google Scholar] [CrossRef]
  11. Gornitz, V.; White, T.W.; Cushman, R.M. Vulnerability of the US to Future Sea Level Rise; Report No.: CONF-910780-1; Oak Ridge National Lab.: Oak Ridge, TN, USA, 1991. [Google Scholar]
  12. Deb, D.; Uddin, M.M.; Mahbub-E-Kibria, A.S.M.; Das, M.K.; Hasan, M. Coastal vulnerability assessment to multi hazards in the exposed coast of Southeastern Coastal Region of Bangladesh. Int. J. Disaster Risk Reduct. 2024, 85, 103791. [Google Scholar] [CrossRef]
  13. Kantamaneni, K.; Xing, L.; Gupta, V.; Campos, L.C. Vulnerability assessment of English and Welsh coastal areas. Sci. Rep. 2024, 14, 78238. [Google Scholar] [CrossRef]
  14. Theocharidis, C.; Doukanari, M.; Kalogirou, E.; Demetriou, D.C.; Mettas, C.; Kontoes, C.; Hadjimitsis, D.G.; Argyriou, A.V.; Eliades, M. Coastal Vulnerability Index (CVI) Assessment: Evaluating Risks Associated with Human-Made Activities along the Limassol Coastline, Cyprus. Environ. Sci. Pollut. Res. 2024, 31, 53749–53766. [Google Scholar] [CrossRef]
  15. Boumpoulis, V.; Depountis, N.; Dimas, A.; Papatheodorou, G. Presentation and analysis of the Geotechnical Coastal Vulnerability Index and validation of its application to coastal erosion problems. Sci. Rep. 2025, 15, 85594. [Google Scholar] [CrossRef] [PubMed]
  16. Marzouk, M.; Azab, S. Modeling climate change adaptation for sustainable coastal zones using GIS and AHP. Environ. Monit. Assess. 2024, 196, 12287. [Google Scholar] [CrossRef] [PubMed]
  17. Sethuraman, S.; Alshahrani, H.M.; Tamizhselvi, A.; Sujaatha, A. Assessment of coastal vulnerability using AHP and machine learning techniques. Mar. Pet. Geol. 2024, 144, 106989. [Google Scholar] [CrossRef]
  18. Gaki-Papanastassiou, K.; Karymbalis, E.; Serafim, P.; Zouva, C. Coastal vulnerability assessment to sea-level rise based on geomorphological and oceanographical parameters: The case of Argolikos Gulf, Peloponnese, Greece. Hell. J. Geosci. 2010, 45, 109–122. [Google Scholar]
  19. Arda, T.; Bayrak, O.C.; Uzar, M. Analyzing Coastal Vulnerability Using Analytic Hierarchy Process and Best–Worst Method: A Case Study of the Marmara Gulf Region. Arab. J. Sci. Eng. 2025, 50, 1851–1869. [Google Scholar] [CrossRef]
  20. ElKotby, M.R.; Sarhan, T.A.; El-Gamal, M.; Masria, A. Evaluation of Coastal Risks to Sea Level Rise: Case Study of Nile Delta Coast. Reg. Stud. Mar. Sci. 2024, 78, 103791. [Google Scholar] [CrossRef]
  21. Nourdi, N.F.; Raphael, O.; Achab, M.; Loudi, Y.; Rudant, J.-P.; Minette, T.E.; Kambia, P.; Claude, N.J.; Romaric, N. Integrated Assessment of Coastal Vulnerability in the Bonny Bay: A Combination of Traditional Methods (Simple and AHP) and Machine Learning Approach. Estuaries Coasts 2024, 47, 2670–2695. [Google Scholar] [CrossRef]
  22. Akash, S.H.; Sarkar, S.K.; Bindajam, A.A.; Kumari, R.; Talukdar, S.; Mallick, J. Assessment of Coastal Vulnerability Using Integrated Fuzzy Analytical Hierarchy Process and Geospatial Technology for Effective Coastal Management. Environ. Sci. Pollut. Res. 2024, 31, 53749–53766. [Google Scholar] [CrossRef]
  23. Nath, A.; Koley, B.; Choudhury, T.; Biswas, A. Prioritizing Flood Drivers: An AHP-Based Study of Physical Factors in Digha’s Coastal Belt, East Coast, India. Spat. Inf. Res. 2025, 33, 12. [Google Scholar] [CrossRef]
  24. Sood, A.; Vignesh, K.S.; Prapanchan, V.N. Multi-Hazard Vulnerability Zone Identification Using GIS-Based Fuzzy AHP and MCDM Techniques. Nat. Hazards 2025, 121, 8501–8539. [Google Scholar] [CrossRef]
  25. Liu, J.; Liu, X.; Zhu, A.; Wang, X.; Yu, Q.; Chen, L.; Al-Musawi, T.J.; Aasal, M. Prioritization of Climate Change Mitigation Strategies for Coastal Regions Using the Analytic Hierarchy Process. Mar. Pollut. Bull. 2025, 212, 117516. [Google Scholar] [CrossRef] [PubMed]
  26. Fuentes, J.E.; Olaya, R.A.; Garcia, C.E. Evaluation of Coastal Erosion in the Watersheds of Municipality of Buenaventura, Colombia: Using Geospatial Techniques and the Composite Vulnerability Index. ISPRS Int. J. Geo-Inf. 2022, 11, 568. [Google Scholar] [CrossRef]
  27. Tursi, M.F.; Anfuso, G.; Matano, F.; Mattei, G.; Aucelli, P.P.C. A Methodological Tool to Assess Erosion Susceptibility of High Coastal Sectors: Case Studies from Campania Region (Southern Italy). Water 2023, 15, 121. [Google Scholar] [CrossRef]
  28. Rizzo, A.; Aucelli, P.P.C.; Gracia, F.J.; Anfuso, G. A Novelty Coastal Susceptibility Assessment Method: Application to Valdelagrana Area (SW Spain). J. Coast. Conserv. 2018, 22, 973–987. [Google Scholar] [CrossRef]
  29. Rangel-Buitrago, N.; Anfuso, G. Risk Assessment of Storms in Coastal Zones: Case Studies from Cartagena (Colombia) and Cadiz (Spain); Springer: Cham, Switzerland, 2015. [Google Scholar] [CrossRef]
  30. Tursi, M.F.; Anfuso, G.; Matano, F.; Aucelli, P.P.C.; Mattei, G. A Multi-Component Approach to Predict Erosion Susceptibility of Rocky Coasts: Marine, Terrestrial and Climatic Forcing—An Application in Southern Italy. Environ. Earth Sci. 2025, 84, 183. [Google Scholar] [CrossRef]
  31. Anfuso, G.; Gracia, F.J.; Battocletti, G. Determination of Cliffed Coastline Sensitivity and Associated Risk for Human Structures: A Methodological Approach. J. Coast. Res. 2013, 29, 1292–1296. [Google Scholar] [CrossRef]
  32. Mooser, A.; Anfuso, G.; Williams, A.T.; Molina, R.; Aucelli, P.P.C. An Innovative Approach to Determine Coastal Scenic Beauty and Sensitivity in a Scenario of Increasing Human Pressure and Natural Impacts Due to Climate Change. Water 2020, 13, 49. [Google Scholar] [CrossRef]
  33. Abijith, D.; Saravanan, S.; Sundar, P.K.S. Coastal Vulnerability Assessment for the Coast of Tamil Nadu, India—A Geospatial Approach. Environ. Sci. Pollut. Res. 2023, 30, 75610–75628. [Google Scholar] [CrossRef]
  34. Sekar, L.G.; Androws, X.; Annaidasan, K.; Kumar, A.; Kannan, R.; Muthusankar, G.; Balasubramani, K. Assessment of Shoreline Changes and Associated Erosion and Accretion Pattern in Coastal Watersheds of Tamil Nadu, India. Nat. Hazards Res. 2024, 4, 231–238. [Google Scholar] [CrossRef]
  35. de Andrade Rodrigues, G.; de Souza Filho, F.A.; Nelson, D.R.; Rocha, R.V.; da Silva, S.M.O. Development of a Drought Vulnerability Index Using MCDM and GIS: Study Case in São Paulo and Ceará, Brazil. Nat. Hazards 2020, 104, 1781–1799. [Google Scholar] [CrossRef]
  36. Nigam, R.; Luis, A.J.; Gagnon, A.S.; Vaz, E.; Damásio, B.; Kotha, M. Assessing coastal vulnerability at the village level using a robust framework, the example of Canacona in South Goa, India. iScience 2024, 27, 109129. [Google Scholar] [CrossRef] [PubMed]
  37. Thieler, E.R.; Hammar-Klose, E.S. National Assessment of Coastal Vulnerability to Sea-Level Rise: Preliminary Results for the U.S. Pacific Coast; U.S. Geological Survey: Reston, VA, USA, 2000; p. 22.
  38. Bagdanavičiūtė, I.; Kelpšaitė, L.; Soomer, T. Multi-criteria evaluation approach to coastal vulnerability index development in micro-tidal low-lying areas. Ocean Coast. Manag. 2015, 104, 122–136. [Google Scholar] [CrossRef]
  39. Pramanik, M.K.; Dash, P.; Behal, D. Improving outcomes for socioeconomic variables with coastal vulnerability index under significant sea-level rise: An approach from Mumbai coasts. Environ. Dev. Sustain. 2021, 23, 13819–13853. [Google Scholar] [CrossRef]
  40. Karymbalis, E.; Papanastassiou, D.; Chalkias, C.; Gaki-Papanastassiou, K.; Skilodimou, H.D. Assessment of the sensitivity of the southern coast of the Gulf of Corinth (Peloponnese, Greece) to sea-level rise. Cent. Eur. J. Geosci. 2012, 4, 561–577. [Google Scholar] [CrossRef]
  41. Gornitz, V.M.; Daniels, R.C.; White, T.W.; Birdwell, K.R. The Development of a Coastal Risk Assessment Database: Vulnerability to Sea-Level Rise in the US Southeast. J. Coast. Res. 1994, 12, 327–338. [Google Scholar]
  42. Valdivia-Quidel, P.; Díaz, M.E.; Aguayo, C.; Esse, C.; Muñoz-Pedreros, A.; Guerrero, M.; Figueroa, D. A spatial multi-criteria analysis for the identification of preferential areas for recreational fishing in Chile. GeoJournal 2023, 88, 4441–4455. [Google Scholar] [CrossRef]
  43. Dibba, B.; Yaffa, S.; Sawaneh, M.; Adzawla, W. Land Cover Transformation and Population Growth: Impacts on Coastal Environment of The Gambia (1990–2020). Sustainability 2025, 17, 1853. [Google Scholar] [CrossRef]
  44. Leandro, V.; Pereira, E.; Pluvie, L.; Silva, R.; Dias, F. Analysis of Coastal Environmental Vulnerabilities in the Municipality of Niterói, Rio de Janeiro, Brazil, in the Face of Sea Level Rise Projections. Coasts 2025, 5, 11. [Google Scholar] [CrossRef]
  45. Kemarau, R.A.; Suab, S.A.; Eboy, O.V.; Sa’adi, Z.; Echoh, D.U.; Sakawi, Z. Integrative Approaches in Remote Sensing and GIS for Assessing Climate Change Impacts Across Malaysian Ecosystems and Societies. Sustainability 2025, 17, 1344. [Google Scholar] [CrossRef]
  46. Monioudi, I.; Chatzistratis, D.; Chalazas, T.; Chatzipavlis, A.; Velegrakis, A.; Andreadis, O.; Monioudis, E.; Nikolaou, A.; Hasiotis, T. A Prioritization Framework for Adaptation Responses for Climate Change-Induced Erosion in Island Beaches—Cases from the Aegean Islands, Greece. J. Mar. Sci. Eng. 2025, 13, 491. [Google Scholar] [CrossRef]
  47. Ramachandran, A.; Khan, A.S.; Palanivelu, K.; Prasannavenkatesh, R.; Jayanthi, N. Projection of Climate Change-Induced Sea-Level Rise for the Coasts of Tamil Nadu and Puducherry, India Using SimCLIM: A First Step towards Planning Adaptation Policies. J. Coast. Conserv. 2017, 21, 731–742. [Google Scholar] [CrossRef]
  48. Scala, P.; Manno, G.; Cozar, L.C.; Ciraolo, G. COAST-PROSIM: A Model for Predicting Shoreline Evolution and Assessing the Impacts of Coastal Defence Structures. Water 2023, 17, 269. [Google Scholar] [CrossRef]
  49. Pendleton, E.A.; Thieler, E.R.; Williams, S.J.; Beavers, R.L. Coastal Vulnerability Assessment of Padre Island National Seashore (PAIS) to Sea-Level Rise; U.S. Geological Survey: Reston, VA, USA, 2004. Available online: https://pubs.usgs.gov/of/2004/1090/ (accessed on 1 April 2025).
  50. Vasudevan, S.; Sajeev, R.; Ramakrishnan, R. Assessment of Shoreline Dynamics and Vulnerability along the Central Kerala Coast Using a Geospatial Approach. Mar. Georesour. Geotechnol. 2024, in press. [Google Scholar] [CrossRef]
  51. Baig, M.R.I.; Shahfahad; Ahmad, I.A.; Tayyab, M.; Asgher, M.S.; Rahman, A. Coastal Vulnerability Mapping by Integrating Geospatial Techniques and Analytical Hierarchy Process (AHP) along the Vishakhapatnam Coastal Tract, Andhra Pradesh, India. J. Indian Soc. Remote Sens. 2021, 49, 215–231. [Google Scholar] [CrossRef]
  52. Arun Kumar, A.; Kunte, P.D. Coastal Vulnerability Assessment for Chennai, East Coast of India Using Geospatial Techniques. Nat. Hazards 2012, 64, 853–872. [Google Scholar] [CrossRef]
  53. Tchindjang, M.; Mbevo, F.P.; Kamgho, C. Coastal Hazard and Vulnerability Assessment in Cameroon. Int. J. Clim. Chang. Strateg. Manag. 2024. ahead-of-print. Available online: https://www.proquest.com/docview/3159530022?fromopenview=true&pq-origsite=gscholar (accessed on 1 April 2025). [CrossRef]
  54. McLaughlin, S.; Cooper, J.A.G. A Multi-Scale Coastal Vulnerability Index: A Tool for Coastal Managers. Environ. Hazards 2010, 9, 233–248. [Google Scholar] [CrossRef]
  55. Alawna, S.; Garcia, X. Spatial and Temporal Climate Change Vulnerability Assessment in the West Bank, Palestine. Environments 2025, 12, 69. [Google Scholar] [CrossRef]
  56. Devanantham, A.; Saravanan, S.; Parthasarathy, K.S.S.; Reddy, N.M.; Niraimathi, J.; Bindajam, A.A.; Mallick, J.; Alharbi, M.M.; Abdo, H.G. Assessing the Impact of Climate and Land Use Change on Flood Vulnerability: A Machine Learning Approach in Coastal Region of Tamil Nadu, India. Geosci. Lett. 2025, 12, 15. [Google Scholar] [CrossRef]
  57. Ramachandran, A.; Praveen, D.; Radhapriya, P.; Divya, S.K.; Remya, K.; Palanivelu, K. Vulnerability and Adaptation Assessment—A Way Forward for Sustainable Sectoral Development in the Purview of Climate Variability and Change: Insights from the Coast of Tamil Nadu, India. Int. J. Glob. Warm. 2016, 10, 303–324. [Google Scholar] [CrossRef]
  58. Mourato, S.; Fernandez, P.; Gomes Pereira, L.; Moreira, M. Assessing Vulnerability in Flood Prone Areas Using Analytic Hierarchy Process—Group Decision Making and Geographic Information System: A Case Study in Portugal. Appl. Sci. 2023, 13, 4915. [Google Scholar] [CrossRef]
  59. Barbara, C.B.; D’Ambrosio, V.; Di Martino, F.; Miraglia, V. Hierarchical Fuzzy MCDA Multi-Risk Model for Detecting Critical Urban Areas in Climate Scenarios. Appl. Sci. 2024, 14, 3066. [Google Scholar] [CrossRef]
Figure 1. Study area map showing the Coromandel Coast of Tamil Nadu, highlighting four major coastal zones divided with respect to geographical features.
Sustainability 17 06286 g001
Figure 2. A flowchart illustrating the CVI methodology, integrating geospatial analysis, MCSA, and ICVI for coastal vulnerability assessment.
Sustainability 17 06286 g002
Figure 3. Maps displaying physical parameters used in the study area to indicate dynamic coastal processes influencing vulnerability levels: (a) geomorphology, (b) regional elevation, (c) slope, (d) bathymetry (e) tidal range, (f) significant wave heights, and (g) shoreline change analysis.
Sustainability 17 06286 g003aSustainability 17 06286 g003b
Figure 4. Socioeconomic parameter maps representing human exposure and land utilization patterns along the coast: (a) population density and (b) land use/land cover.
Sustainability 17 06286 g004
Figure 5. Maps of climatic parameters highlighting future climate threats in vulnerable zones: (a) temperature, (b) rainfall, and (c) coastal inundation.
Sustainability 17 06286 g005
Figure 6. Map showing four vulnerability levels based on integrated ICVI scores using MCSA, highlighting high-risk coastal zones.
Sustainability 17 06286 g006
Figure 7. ICVI-based vulnerability map for Zone 1, covering Thiruvallur to Puducherry, showing moderate- to very-high-risk segments. Key locations Ennore, Maria Beach and Puducherry are highlighted within the blue box.
Sustainability 17 06286 g007
Figure 8. ICVI Zone 2 (Cuddalore–Thiruvarur) vulnerability map, revealing areas under high and very high coastal risk categories. Key locations Cuddalore, Tharangambadi and Muthupet are highlighted within the blue box.
Sustainability 17 06286 g008
Figure 9. ICVI Zone 3 illustrates coastal vulnerability extending from Thanjavur to Ramanathapuram along the southeastern Tamil Nadu coastline. Key locations Rajamadam, Tondi and Rameshwaram are highlighted within the blue box.
Sustainability 17 06286 g009
Figure 10. ICVI Zone 4 map: Ramanathapuram to Kanyakumari, illustrating high-risk areas. Key locations Pamban and Kanyakumari are highlighted within the blue box.
Sustainability 17 06286 g010
Table 1. Region-wise distribution of coastal districts in Tamil Nadu, along with their corresponding shoreline lengths, grouped into four coastal zones.
RegionsDistrict NamesShoreline Length (km)
Zone 1Tiruvallur, Chennai, Chengalpattu, Villupuram, Puducherry232
Zone 2Cuddalore, Mayiladuthurai, Karaikal, Nagapattinam, Tiruvarur227
Zone 3Thanjavur, Pudukkottai, Ramanathapuram193
Zone 14Ramanathapuram, Thuthookudi, Tirunelveli, Kanyakumari424
Total1076
Table 2. List of physical, socioeconomic, and climatic parameters used in developing the coastal vulnerability assessment database.
Physical Parameters
ParametersData SourceSource LocationPeriod
GeomorphologySentinel-2, Landsat-8Bhukosh2025
ElevationShuttle Radar Topography Mission (SRTM)Open topography2024
Slope
BathymetryNational Oceanic and Atmospheric Administration (NOAA) Bathymetric DataGeneral Bathymetric Chart of the Oceans (GEBCO)2025
Significant Wave Height (SWH)Wave BuoysERA5, European Centre for Medium-Range Weather Forecasts (ECMWF)2025
Tidal RangeWXTide32Tide Text2025
Shoreline Change (SLC)Sentinel-2,
Landsat 4–9
United States Geological Survey (USGS)1990, 1995, 2000, 2005, 2010, 2015, 2020, 2025
Population DensitySurvey of India2011 Senses2011 Senses
LULCLandsat-8, Sentinel-2Supervised Classification2024
Temperature, Rainfall, Coastal InundationPermanent Service for Mean Sea Level (PSMSL), Sixth Assessment Report (AR6), Shared Socioeconomic Pathways (SSP2 4.5) Mid-CenturyCoupled Model Intercomparison Project
(CMIP6)
Historical Period: 1984 to 2014, Predicted Period 2014–2040
Table 3. Classification of coastal vulnerability parameters into five ranked categories and associated risk levels.
ParameterVery Low (1) Low
(2)
Moderate (3) High
(4)
Very High
(5)
Coastal GeomorphologyAeolian sand dunesPediments, pediplains, salt
marshes, mudflats
Anthropogenic terrain, alluvial plains, coral reefs, mangrovesFlood plains, delta plains, sand beaches, estuaries, lagoonsCoastal plains, waterbodies
Coastal Elevation (m)≥107.5–10.05–7.52.5–5<2.5
Coastal Slope (°)>32–31–20.5–1<0.5
Bathymetry(m)<4030–4020–3010–20<10
Tidal Range (m)>0.50.5–1.01.0–1.51.5–2.0>2
Significant Wave Height (m)0.5–0.750.75–1.01–1.251.25–1.5>1.5
Shoreline Change (SLC) (m/year)>2+1.0 to +2.0−1.1 to +1.0−1.1 to −2.0<−2.0
Population Density (people/km2)<500500–10001000–15001500–2000>2000
Land Use Land Cover (LULC)Barren landForestCrop land, water bodies, coastal areas, mangroves, salt pansAgricultural landBuilt up
Rising Temperature (°C)<0.90.9–11–1.11.1–1.2>1.2
Rainfall
(% increases)
<10%10–2020–3030–40>40
Coastal InundationNo inundation---Inundation
Table 4. Index value ranges and classification criteria for coastal vulnerability evaluation.
ClassificationPVI RangeSEVI RangeCVIc RangeICVI Range
Maximum Range 105.63.546.4638.55
Minimum Range 0.380.710.5780.55
Very High Vulnerability>60>3.0>5.5>30
High Vulnerability40–602.5–3.04.0–5.520–30
Moderate Vulnerability20–401.8–2.52.5–4.010–20
Low Vulnerability10–201.0–1.81.2–2.53–10
Very Low Vulnerability<10<1.0<1.2<3
Table 5. Distribution of vlnerability classes along coastal districts with major parameters.
RegionsDistrict NamesShoreline Length (km)Major Vulnerable ParametersVulnerability ClassificationRankVulnerability (%)Vulnerability (km)
Zone 1Tiruvallur, Chennai, Chengalpattu, Villupuram, Puducherry232Geomorphology, elevation, slope, shoreline changes, population, LULC, Coastal InundationVery low vulnerability12.1286264.938413
Low vulnerability219.4674845.16456
Moderate vulnerability319.9260646.22846
High vulnerability429.7166368.94259
Very high vulnerability528.7611966.72597
Zone 2Cuddalore, Mayiladuthurai, Karaikal, Nagapattinam, Tiruvarur227Geomorphology, elevation, slope, bathymetry, LULC, temperature, rainfall, Coastal InundationVery low vulnerability10.1212020.27513
Low vulnerability213.5004230.64595
Moderate vulnerability330.1074968.34399
High vulnerability426.2076559.49135
Very high vulnerability530.0632568.24358
Zone 3Thanjavur, Pudukkottai, Ramanathapuram193Geomorphology, elevation, slope, bathymetry, shoreline changes, temperatureVery low vulnerability128.8956255.76855
Low vulnerability238.0068473.3532
Moderate vulnerability325.2981548.82543
High vulnerability45.73872911.07575
Very high vulnerability52.0606633.97708
Zone 4Ramanathapuram, Thuthookudi, Tirunelveli, Kanyakumari424Significant wave height, LULC, temperatureVery low vulnerability131.071131.741
Low vulnerability29.93019542.10403
Moderate vulnerability322.8701796.96951
High vulnerability417.9361376.04918
Very high vulnerability518.1925177.13625
Total1076
Disclaimer/Publisher’s Note: The statements, opinions and data contained in all publications are solely those of the individual author(s) and contributor(s) and not of MDPI and/or the editor(s). MDPI and/or the editor(s) disclaim responsibility for any injury to people or property resulting from any ideas, methods, instructions or products referred to in the content.

