Article

The Impact of Climate Change Risk on Corporate Debt Financing Capacity: A Moderating Perspective Based on Carbon Emissions

1
Management College, Ocean University of China, Qingdao 266100, China
2
Mario J. Gabelli School of Business, Roger Williams University, One Old Ferry Road, Bristol, RI 02809, USA
*
Author to whom correspondence should be addressed.
Sustainability 2025, 17(14), 6276; https://doi.org/10.3390/su17146276
Submission received: 29 March 2025 / Revised: 26 June 2025 / Accepted: 7 July 2025 / Published: 9 July 2025

Abstract

Climate change risk has significant impacts on corporate financial activities. Using firm-level data from A-share listed companies in China from 2010 to 2022, we examine how climate risk affects corporate debt financing capacity. We find that climate change risk significantly weakens firms’ ability to raise debt, leading to lower leverage and higher financing costs. These results remain robust across various checks for endogeneity and alternative specifications. We also show that reducing corporate carbon emission intensity can mitigate the negative impact of climate risk on debt financing, suggesting that supply-side credit policies are more effective than demand-side capital structure choices. Furthermore, we identify three channels through which climate risk impairs debt capacity: reduced competitiveness, increased default risk, and diminished resilience. Our heterogeneity analysis reveals that these adverse effects are more pronounced for non-state-owned firms, firms with weaker internal controls, and companies in highly financialized regions, and during periods of heightened environmental uncertainty. We also apply textual analysis and machine learning to the measurement of climate change risks, partially mitigating the geographic biases and single-dimensional shortcomings inherent in macro-level indicators, thus enriching the quantitative research on climate change risks. These findings provide valuable insights for policymakers and financial institutions in promoting corporate green transition, guiding capital allocation, and supporting sustainable development.

1. Introduction

Climate change is one of the greatest challenges facing humanity [1] and a critical issue for governments worldwide. Human activities—especially greenhouse gas emissions—have caused significant climate disruptions, leading to more frequent extreme weather events and natural disasters. Examples include hurricanes in the U.S. in 2017, wildfires in Australia in 2020, and extreme heat and drought in southern China in 2022, all of which have intensified ecosystem vulnerability [2]. In response to climate risks, governments are compelled to increase fiscal spending and often face declining tax revenues, thus reducing overall public revenue stability [3,4]. These risks are reshaping global production systems, geopolitical dynamics, and financial markets [5,6].
The concept of climate risk was first introduced in the Intergovernmental Panel on Climate Change (IPCC)’s 2001 assessment report, which emphasized both its likelihood and consequences. The 2017 G20 Task Force on Climate-related Financial Disclosures further developed a framework for defining and categorizing climate risks. Broadly, climate risks can be classified into physical and transition risks [7]. Physical risks stem from acute climate-related disasters—such as floods and typhoons—as well as chronic environmental changes like rising sea levels. These events can disrupt the real economy [8,9], damage fixed assets [10,11,12,13], halt business operations, and increase default risk [14,15]. In a globalized economy, these effects propagate through supply chains [16], indirectly reducing consumption, dampening investment, and potentially triggering recessions. This in turn erodes firms’ collateral values and credit ratings [17,18,19], affecting asset pricing in financial markets [20,21] and contributing to a rise in non-performing loans for banks.
In parallel, to advance low-carbon transitions and mitigate climate impact, governments are adopting regulatory measures such as carbon taxes. These policies drive firms to pursue green innovation, often involving high investment costs and the risk of transition failure [22,23,24,25,26]. Meanwhile, shifting consumer preferences may lead to declining market shares and asset depreciation for high-carbon companies [27,28], further contributing to stock price volatility [29]. Physical and transition risks are interconnected [30]; although they operate through different channels, both transmit shocks from the real economy to the financial system [31,32], compounding into broader systemic risks. This intersection of environmental and climate economics has catalyzed a growing research field known as climate finance [21,33].
In the field of climate finance, assessing the impact of climate risk on asset pricing is a central topic—reflected in both credit and equity markets. Climate risks significantly influence corporate financing decisions [34,35]. Investors’ heightened sensitivity to climate-related risks can quickly translate into higher risk premiums, increasing capital costs, restricting access to financing, and ultimately reducing firms’ capacity to operate sustainably [36]. The existing literature has extensively explored how climate risks affect equity financing and financing costs, reaching largely consistent conclusions. For instance, climate shocks prompt institutional investors to reduce holdings in firms with high climate risk exposure [37]. Additionally, climate activism has depressed the stock prices of carbon-intensive companies [38], while generating positive risk premiums in emerging market equities [39].
The relationship between climate risks and corporate credit is also a growing area of interest [40,41]. This study focuses specifically on the link between climate risk and corporate debt financing [42]. According to the pecking order theory, firms prefer debt over equity when seeking external capital [43], and debt financing remains the dominant source of capital for Chinese firms [44,45]. However, climate risks complicate firms’ access to debt financing, affecting both supply and demand.
On the supply side, investors are more cautious when bonds are exposed to potential asset depreciation caused by climate change. For example, rising sea levels reduce residential property values, which is reflected in long-term mortgage pricing. Bond underwriters also face higher search costs when marketing climate-exposed bonds, which leads to higher bond yields [21,46] and, ultimately, increased borrowing costs [47,48,49].
On the demand side, the scale of corporate debt financing is also shaped by climate risks. Yet, the findings are mixed. Some studies, drawing on static trade-off theory, argue that climate risk raises operational uncertainty and distress costs—including business disruptions, higher insurance premiums, and supply chain volatility—causing firms to adopt more conservative capital structures and reduce leverage [50,51,52]. Conversely, other research suggests that climate uncertainty may increase leverage. In this view, firms respond to climate pressures by taking on more responsibility and investment, thereby increasing debt financing [53,54].
These divergent findings reflect varying research perspectives. Studies of corporate leverage tend to emphasize demand-side factors, though some acknowledge supply-side influences through increased debt costs. Research on debt financing costs, meanwhile, typically adopts a supply-side perspective, focusing on how climate risks affect financial institutions’ credit assessments and pricing.
This study bridges these perspectives by examining corporate debt financing capacity—defined by both the scale and cost of debt—in the context of climate risk. We argue that firms with strong operating performance, profitability, and growth potential [55,56], as well as effective governance structures, are less likely to default [57,58,59]. For these firms, financial institutions face reduced information asymmetry and are more proactive in credit assessment. As climate risks intensify, banks are increasingly incorporating such risks into their credit decisions [60], and financial regulators are embedding climate considerations into macroprudential policy frameworks [61]. When firms face rising operational risks and uncertainty, default probabilities increase [62,63], prompting banks to tighten lending standards, reduce loan availability [64], and raise risk premiums. Thus, changes in corporate debt financing capacity under climate risk are largely driven by credit rationing behavior among financial institutions, manifested as a reduced debt scale and higher interest rate risk premiums.
To validate the above arguments, we examine the role of corporate carbon emissions as a moderating variable within the context of China’s “dual carbon” goals. In an era of government-led green finance and green credit promotion, carbon emission levels have become a key indicator of corporate environmental responsibility, directly influencing firms’ financing behavior in capital markets [65]. As environmental regulations in China tighten, firms face differentiated incentives and penalties, resulting in varied impacts on their carbon emissions [66]. At the same time, the development of a green finance system channels capital toward low-carbon and environmentally friendly sectors, creating disparities in financial access based on firms’ carbon footprints [67,68].
Specifically, low-carbon firms are better aligned with the green finance agenda and are more likely to receive support through green credit, thus enjoying more favorable debt financing conditions. In contrast, high-carbon firms face stricter regulatory scrutiny and greater operational risks, placing them at a disadvantage in the debt market. Against this backdrop, we use changes in corporate carbon emissions as a moderating variable to test the causal effects of climate change risk on debt financing. We hypothesize that under similar levels of climate risk, firms that successfully reduce emissions will find it easier to obtain debt financing and will face lower financing costs. This would suggest that under the green credit regime, financial institutions allocate credit based on carbon emission levels—a supply-side mechanism—rather than corporate capital structure decisions.
Conversely, if no significant differences are observed, this would support the alternative view that changes in debt financing capacity due to climate risk are primarily driven by firms’ internal financing choices. In addition, our analysis investigates the mechanisms through which climate risks affect debt financing capacity and explores heterogeneity across firms and regions.
Compared to previous research, this study presents several key innovations and contributions: (1) As climate change risks increasingly affect businesses, the relationship between these risks and debt financing remains ambiguous. This study adopts climate change risk as an explanatory variable and explores its effects on corporate debt financing capacity from the perspectives of debt volume and financing costs, while also examining the underlying mechanisms. (2) Current assessments of climate change risk often rely on extreme weather events such as heatwaves, droughts, and heavy rains. However, these indicators fail to capture the significant risks associated with the transition to a low-carbon economy and do not provide a comprehensive view of climate change risk. Furthermore, as extreme weather events are closely tied to geographical locations, they may not be suitable for micro-level firms. To address this limitation, this study utilizes textual analysis to evaluate corporate-level climate change risk by analyzing keywords related to climate change in annual reports. Firstly, the climate change risk indicator developed through textual analysis can extract multidimensional information, thereby overcoming the limitations of macro-geographic indicators that typically reflect only a single dimension of quantitative data and mitigating biases associated with the examination of individual indicators. Secondly, unlike macro-geographic indicators, which primarily rely on meteorological stations or satellite data that have lower temporal resolution and static characteristics, the indicators constructed at the enterprise level through textual analysis offer higher spatial and temporal resolution. They are capable of capturing dynamic feedback from human systems regarding climate change, which helps prevent the oversight of subtle socio-economic impacts. Finally, the integration of textual analysis and machine learning enables the processing of richer descriptive information and unstructured text, resulting in a more comprehensive and accurate assessment of climate change risk. (3) Given the close relationship between corporate carbon emissions and access to credit under China’s green credit policy, this study investigates the moderating role that carbon emissions play in the relationship between climate change risk and corporate debt financing capacity. It further examines how changes in corporate carbon emissions affect the connection between climate change and debt financing, thereby providing a theoretical foundation for understanding how climate change risk influences corporate debt financing through the actions of financial institutions. (4) Additionally, this study explores the mechanisms by which climate change risk undermines corporate debt financing capacity, identifying factors such as reduced competitiveness, increased default risk, and diminished organizational resilience. A heterogeneous analysis is conducted across four dimensions: ownership structure, internal control quality, regional financial development, and environmental uncertainty, further revealing factors that may modify the relationship between climate change risk and corporate debt financing.
The remainder of this paper is organized as follows: Section 2 reviews existing research by synthesizing and summarizing the literature on climate change risk and corporate debt financing capacity, analyzing the logical relationship between the two through relevant theoretical frameworks, and subsequently formulating research hypotheses. Section 3 constructs the research framework, detailing the data sources and measurement methods for the variables, and establishes the research model. Section 4 conducts a comprehensive empirical analysis and validation. First, it examines the impact of climate change risk on corporate debt financing capacity. To ensure the robustness of the results, a series of robustness checks and endogeneity treatments are performed, specifically focusing on the moderating role of corporate carbon emissions in the relationship between climate change risk and corporate debt financing capacity. Additionally, the mediating effects of competitiveness, default risk, and organizational resilience are assessed, along with multiple heterogeneity tests. In Section 5, we conclude the study, highlighting the key contributions while also addressing the limitations encountered during our research. Finally, 
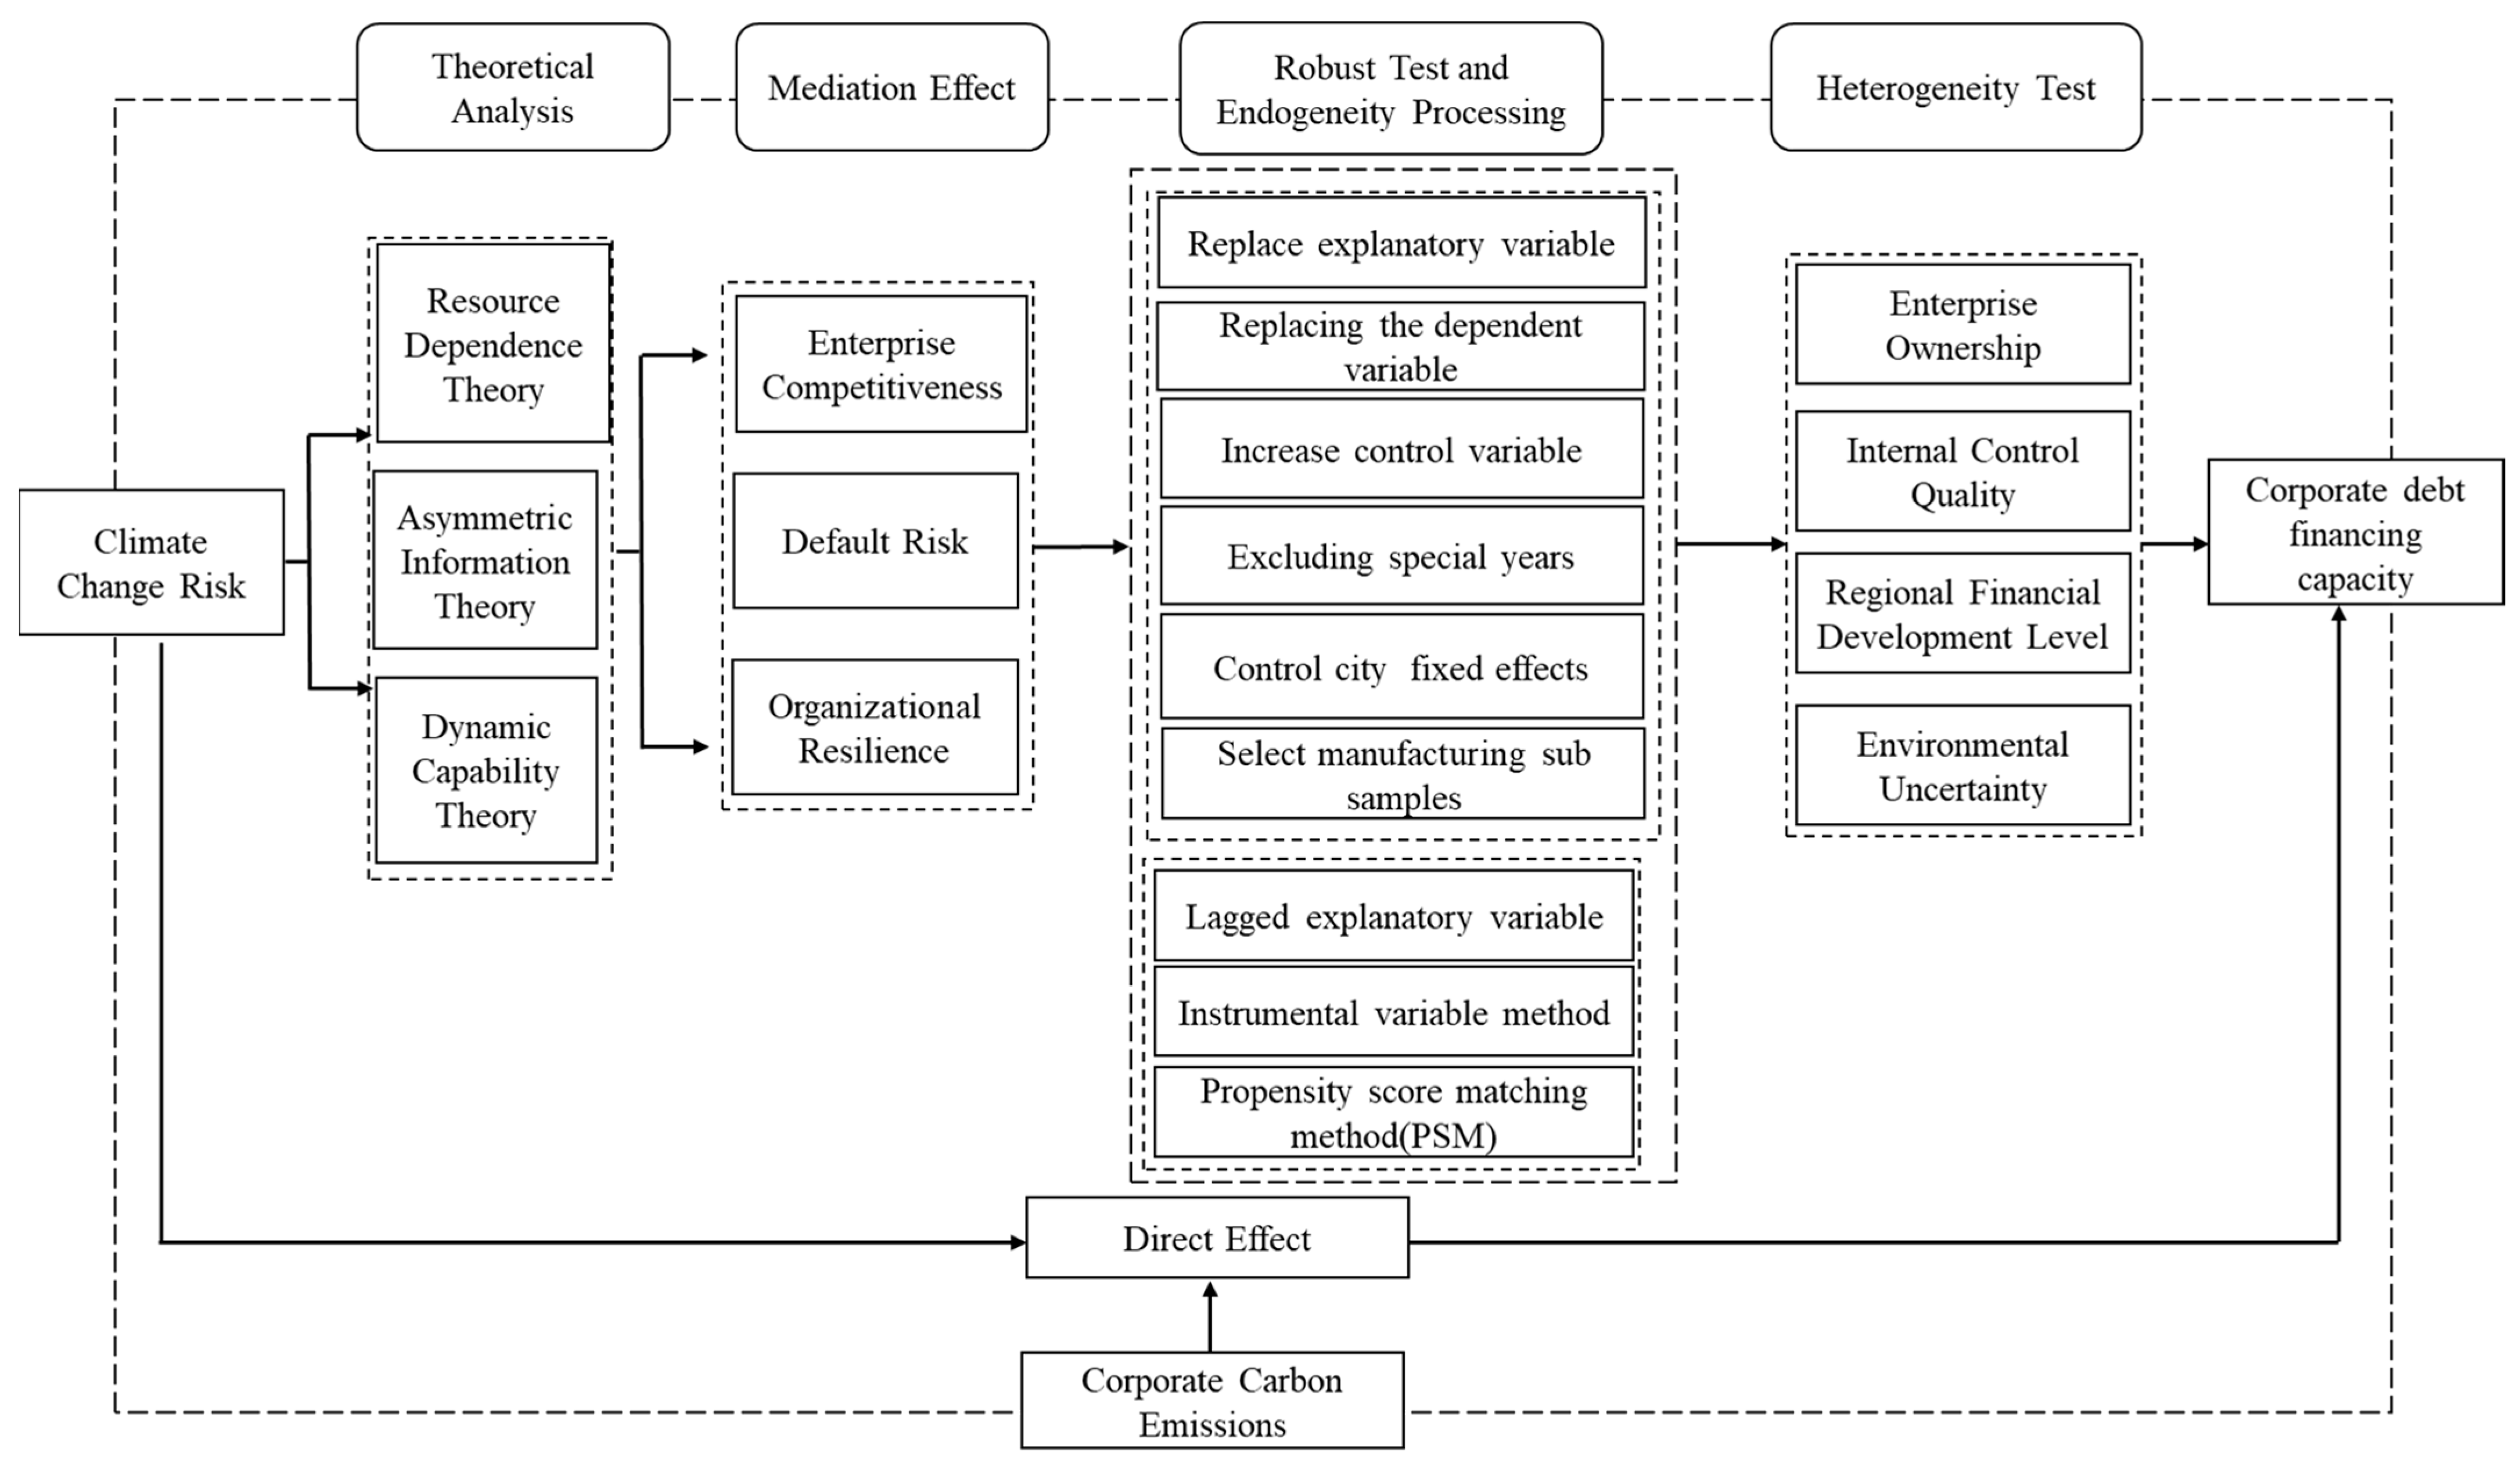
Section 6 offers targeted recommendations for businesses, financial institutions, and government policymakers. The overall research framework is illustrated in Figure 1.

2. Literature and Hypothesis

2.1. Climate Change Risks and Debt Financing Capacity

Climate change risks adversely affect corporate operations and financial health [5,51]. Both physical and transition risks contribute to this impact, ultimately undermining the stability of the financial system [6,17]. As global climate challenges intensify and policy responses escalate, credit institutions are placing greater emphasis on climate risk. This is reflected in tighter lending standards and rising debt financing costs. The reason for this is that credit institutions evaluate a company’s operational quality based on its financial information. In this context, climate change risks directly affect a firm’s core resources, distorting its financial indicators. According to resource dependence theory, climate risks can damage both internal and external resources—such as fixed assets, raw materials, human capital, and business relationships—thereby reducing profitability and weakening debt repayment capacity due to slower cash flow turnover. It can be argued that climate change risks weaken corporate competitiveness, increase potential default risks, and reduce organizational resilience.
Firstly, from the perspective of corporate competitiveness, physical climate change affects regional livability by exacerbating the spread of infectious diseases [69,70] and driving population migration [71]. Labor shortages caused by such demographic shifts undermine talent recruitment and long-term corporate development. Besides, climate change introduces transition risks. Firms dependent on fossil fuel-based fixed assets face value depreciation due to increasing compliance pressures, resulting in “stranded assets” and a decline in overall corporate value [72,73]. This also lowers the value of collateral assets. Moreover, the shift toward low-carbon and green consumption reshapes consumer preferences and market competition [74]. Traditional products are increasingly displaced by green alternatives, and firms perceived as lagging in climate response may suffer reputational damage, reduced demand, and loss of market share—ultimately hurting competitiveness and profitability.
Secondly, from the perspective of potential default risks, heightened climate risks increase firms’ vulnerability to local climate conditions, resulting in more frequent natural disasters that disrupt operational continuity and quality. For example, shifting weather patterns can hinder crop growth and reproduction, disrupting the supply of raw materials and causing shortages in critical production inputs [75,76]. Floods and heavy rainfall can impede logistics and transportation, leading to delivery delays and inventory losses [77]. Extreme weather and chronic climate changes may also damage physical assets such as buildings and equipment [5], halting production and driving up operational costs [51]. These factors reduce profitability and raise default risk. Moreover, climate risks propagate through supply chains, weakening collaborative relationships and operational stability [78]. This deterioration reduces the availability of supply chain financing [79], increases coordination costs, and raises the expense of finding alternative partners. These adverse effects on core resources undermine the integrity of a firm’s financial information, heighten default risk, and influence the lending behavior of credit institutions.
The speed and quality of information acquisition significantly influence credit institutions’ risk assessments. According to information asymmetry theory, disparities in the information held by both parties in market transactions can lead to resource misallocation and decision-making errors. Given the presence of principal–agent problems, creditors often encounter disadvantages in acquiring information. Climate change risks exacerbate the level of information asymmetry between lenders and borrowers. To mitigate their credit risks, financial institutions such as banks may develop a “reluctance to lend” attitude and demand higher risk compensation [18]. Existing research indicates that companies affected by climate change face increased operational risks and uncertainties [80], complicating transactions and increasing opacity, which further heightens information asymmetry with external stakeholders. Additionally, climate change risks can promote managerial short-termism. By concealing the negative impacts of climate change, firms may compromise the accuracy of their financial statements, intensify tax avoidance [80], increase earnings manipulation [81,82], and elevate real earnings management behaviors [83]. However, such short-sighted approaches are detrimental to long-term corporate development, as accumulating negative information can lead to stock price collapses, raising default risks and the likelihood of bankruptcy. Furthermore, climate change risks increase earnings volatility, making analysts’ tasks more complex and reducing the accuracy of their forecasts. This limitation hampers their predictive capabilities and undermines their role as information agents in capital markets [84]. As a result, creditors face significant barriers in understanding a company’s true operational and financial status, which hinders accurate assessments of profitability and repayment capacity, ultimately escalating default risks and negatively impacting the implementation and fulfillment of debt covenants.
Thirdly, from the perspective of organizational resilience, in addition to overt financial information, a company’s dynamic capability to respond to future changes is a crucial consideration for financial institutions. According to dynamic capability theory, a firm’s ability to flexibly adjust and adapt to external changes through resource integration, capability building, and process reconfiguration is essential when facing opportunities and threats [85,86,87,88]. Climate change introduces uncertainty and gradual shifts, resulting in significant unpredictability for future operations [89], which complicates prediction and response efforts. Its destructive impact on physical assets disrupts existing production processes, hinders process recon-figuration, and reduces operational continuity and synergy, ultimately diminishing business performance and total factor productivity [90,91]. Moreover, increasing climate change risks lead to frequent fluctuations throughout the supply chain [92], affecting the integration and coordination of supply chain resources. Seeking new customers or suppliers requires resource restructuring and relationship coordination in the short term, which may weaken a firm’s reconfiguration capabilities. Additionally, the escalation of climate change risks results in more extreme weather events, compromising personnel continuity and work efficiency [93]. Decreased employee loyalty and motivation can adversely affect human resource management and intra-organizational co-ordination. As a result, climate change risks undermine a company’s dynamic capabilities, making it difficult to respond swiftly to the challenges posed by these risks.
Fourthly, considering the impact of heterogeneous factors, we provide further evidence that credit providers significantly influence corporate debt financing capabilities. In the context of China’s policy-driven green low-carbon development, state-owned enterprises (SOEs) benefit from advantages in resource acquisition. Credit institutions implement green lending policies that offer greater resource support, giving SOEs a relative edge over non-state-owned enterprises regarding loan size and cost. However, external environmental uncertainties weaken firms’ dynamic capabilities and core resources, leading to increased governance issues, such as heightened managerial short-termism. This situation exacerbates information asymmetry between credit institutions and firms, making it more difficult for companies to secure credit and subjecting them to higher credit risk premiums. Furthermore, the level of regional financial development significantly influences financial institutions’ ability to access information and establish pricing. In areas with more advanced financial systems, there is a greater capacity to effectively manage debt risks. Banks and bondholders are better equipped to accurately assess the impacts of climate change risks, which enables them to implement stricter controls over loan volumes and debt financing costs. This proactive approach helps mitigate the potential effects of these risks.
Based on the above discussion, we posit that credit providers, such as banks, demonstrate significant proactivity in addressing climate change risks, which is evident in both the size of the credit they extend and the costs associated with debt financing. This responsiveness, in turn, influences firms’ debt financing capabilities. Therefore, we propose the following hypothesis:
Hypothesis 1 (H1).
Climate change risk reduces a firm’s debt financing capacity.

2.2. Moderating Effect of Corporate Carbon Emissions

China is currently the world’s largest carbon emitter and also the largest contributor to carbon reduction efforts [94]. Carbon emissions are closely linked not only to climate change risks but also to industrial restructuring and the low-carbon transition of socioeconomic development. With the introduction of China’s dual carbon goals and the ongoing development of green finance [95], these factors are influencing capital flows and resource allocation in the market [96]. This study aims to validate the moderating effect of corporate carbon emissions, revealing the potential connections among corporate carbon emissions, climate change risks, and a firm’s debt financing capacity, while providing a unified perspective on the impact of climate change risks on corporate debt financing.
Firstly, under the macro-strategic guidance of the dual carbon goals, China is gradually implementing stricter policies and regulatory frameworks related to carbon emissions, alongside governance measures aimed at promoting a low-carbon transition. This implies that firms with high carbon emissions will face greater policy pressures and compliance costs. Stricter environmental regulations increase market entry barriers and production costs for high-emission firms [97], intensifying the uncertainty and operational risks they will encounter in the future [98,99]. Moreover, rising corporate carbon emissions signal negative implications to the market, whether viewed through the lens of information dissemination or corporate reputation [100]. This not only raises concerns among creditors but also exacerbates their tendency to tighten credit in light of increasing climate change risks. Following the principle of matching risks to returns, creditors often demand higher risk premiums to compensate for the additional risks involved.
Secondly, in recent years, as the green finance system has matured and evolved, financial resources are increasingly directed toward low-carbon enterprises and green projects. In this context, firms that reduce carbon emissions are typically perceived as more sustainable and better equipped to manage climate change risks, making it easier for them to secure support from green finance. These firms can leverage various tools such as green loans, green bonds, and green funds to access diverse financing channels and more favorable borrowing rates [101]. The “subsidy effect” generated by green finance enhances their investment capabilities in green technology research and development, further promoting energy-saving and emission reduction goals and creating a positive feedback loop [102]. Conversely, firms with higher carbon emissions face the “crowding-out effect” of green finance, encountering stricter scrutiny and assessments from financial institutions. As a result, they may experience financing constraints exacerbated by measures such as limited funding quotas and punitive high-interest rate policies [103], which decrease their competitiveness and hinder their ability to respond to climate change risks, ultimately negatively impacting their debt financing capacity.
Based on this analysis, it is evident that the characteristics of corporate carbon emissions influence the supply of credit from financial institutions. Therefore, firms with increased carbon emissions face heightened credit discrimination from financial institutions, whereas those that reduce emissions experience an alleviation of this discrimination due to their carbon reduction achievements. This reflects proactive behavior from financial institutions rather than a decline in the willingness of firms to pursue debt financing. Thus, we propose the following hypothesis:
Hypothesis 2 (H2).
The level of corporate carbon emissions significantly moderates the impact of climate change risks on debt financing capabilities. Specifically, a reduction in carbon emissions mitigates the negative effects of climate change risks on these capabilities, whereas an increase in carbon emissions exacerbates the adverse impacts of climate change risks on corporate debt financing abilities.

3. Data Selection and Model Setting

3.1. Data Sources

This study selects A-share listed companies in China from 2010 to 2022 as the sample, applying the following criteria for screening: (1) exclusion of financial sector companies; (2) exclusion of ST and *ST companies; (3) removal of samples with missing data for key variables; (4) to mitigate the influence of outliers on the regression results, data were Winsorized at the 1% level. The financial data used in this study are sourced from the CSMAR database provided by Guotaian, while climate change risk data are obtained from corporate annual reports published by Eastmoney Information. Additional data sources include the China Statistical Yearbook on Industrial Economy and the China Statistical Yearbook on Energy.

3.2. Variable Setting

3.2.1. Dependent Variable

The dependent variable in this study is the firm’s debt financing capability, which is examined from two dimensions: the scale of debt financing (Debt) and the cost of debt financing (Cost). Following the approach of He and Liu [104], the proxy variable for the scale of debt financing (Debt) is calculated as (short-term loans + current portion of long-term debt + non-current liabilities)/total assets at year end. The proxy variable for the cost of debt financing (Cost) is measured as (interest expenses + borrowing costs + other financing costs)/(current portion of long-term debt + short-term loans + non-current liabilities).

3.2.2. Explanatory Variable

Existing research on measuring climate risk is highly contentious. Indicators such as greenhouse gas emissions, energy consumption data, extreme temperatures, and droughts are commonly used as proxies for climate risk, yet these metrics fail to fully capture the climate change risks faced by businesses. Utilizing textual analysis to construct keywords related to climate change risk, along with frequency metrics, offers better adaptability [35,105]. First, most publicly listed companies operate across regions; thus, the physical climate risks of the parent company’s registration location may not adequately reflect the climate change risk levels experienced by the business. Second, considering the diverse expressions in Chinese, textual analysis results can more accurately depict a company’s climate change risk level. Therefore, we use climate change risk (CCR) as the independent variable in this study. Building on the work of Du Jian et al. [35], this study employs a set of 98 keywords associated with climate change risk and uses web scraping techniques for frequency measurement. The proxy for firm-level climate change risk is calculated by taking the frequency of these keywords as they appear in annual reports, dividing it by the total word count of the reports (after removing stop words), and then scaling it up by a factor of 100. The climate change risk keyword set is illustrated in Table 1. The keyword set is categorized into severe risk, chronic risk, and transaction risk. Severe risks include short-duration but impactful meteorological and geological disasters such as floods, earthquakes, hurricanes, typhoons, and mudslides. Chronic risks encompass slowly occurring, widespread climate factors like humidity, water scarcity, and cold waves. Transaction risk, also known as transformation risk, emphasizes the risks associated with the shift to a low-carbon economy, arising from policy adjustments, technological innovations, and changes in consumer preferences. Currently, China has not implemented a carbon tax system; thus, the impacts of a carbon tax are primarily felt through foreign economic organizations, such as the EU, on imports from China. Moreover, during the design of the keyword set and the sample window, the EU’s Carbon Border Adjustment Mechanism (CBAM) was still in the initiation phase and had not yet been formally adopted; hence, the term “carbon tax” was excluded from the transition risk keywords. However, the keywords do capture regulatory risks and policy compliance pressures. On the one hand, these keywords are directly related to policy responses, such as energy conservation, emission reduction, and low carbon, which align closely with national “dual carbon” policies, including initiatives from 2010 by the National Development and Reform Commission and recent guidelines issued in 2022. On the other hand, whether concerning regulatory risks, technological innovations, or shifts in consumer preferences, these ultimately translate into corporate technological actions. Keywords like transition, upgrading, circular economy, efficiency improvement, emission reduction, and intensive use reflect the green transformation and technological upgrades companies undertake to address regulatory pressures, demonstrating the indirect transmission of regulatory stress.

3.2.3. Moderating Variable

This study utilizes corporate carbon emission levels (Carbon) as a moderating variable. The existing literature primarily employs absolute figures, such as the ratio of annual total carbon emissions to revenue or the logarithm of total carbon emissions [106,107,108], to measure corporate carbon emissions. However, relying solely on absolute numbers captures only the scale of carbon emissions at a specific moment and fails to reflect the dynamic trends of these emissions over time. Therefore, this study builds on previous research [109] and approximates corporate CO2 emissions based on industry energy consumption, using the specific calculation method outlined in Equation (1). According to the carbon calculation standards established by the Xiamen Energy Conservation Center, the conversion factor for 1 ton of standard coal is 2.493. This formula incorporates total energy consumption data from the National Bureau of Statistics, addressing the differences in energy consumption, energy structure, and technical efficiency across industries. Compared to non-manufacturing sectors like services, manufacturing firms exhibit higher carbon emission baselines. By utilizing the ratio of a company’s main costs to the industry’s main costs for scale-weight allocation within the industry, the formula allows for a relatively accurate measurement of a firm’s carbon emissions in conjunction with industry and company characteristics. To illustrate the dynamic changes in corporate carbon emissions and account for heterogeneity across different industries or firm sizes, this paper uses the difference between total carbon emissions in the current year and those in the previous year, divided by the previous year’s total carbon emissions, as a proxy variable for changes in corporate carbon emission levels.
Carbon Dioxide Emissions = (Firm’s Main Operating Costs/Industry’s Main Operating Costs) × Total Industry Energy Consumption × CO2 Conversion Factor (2.493)

3.2.4. Mediating Variables

This study investigates the potential reasons for climate change risk diminishing corporate debt financing capacity. First, it posits that greater climate change risk increases the likelihood of firms facing both extreme and chronic weather events, while also heightening the uncertainty associated with the transition to a low-carbon economy. This uncertainty not only obstructs normal operational activities but also increases profit volatility and reduces competitiveness. Second, climate change risk exacerbates information asymmetry between firms and financial institutions. Higher climate change risk can provoke short-sighted behavior among management, intensifying the issue of “stranded assets” and diminishing the firm’s ability to repay debts, thereby increasing default risk. Additionally, it disrupts internal operational models and management processes, undermining supply chain relationships and the synergy of production processes, negatively impacting organizational resilience and growth potential. Based on this discussion, the study will utilize the following mediating variables for mechanism analysis.
  • Corporate Competitiveness (PCM)
This study employs the Lerner index (PCM) to measure corporate competitiveness, adapting the methodology from Chen and Wang [110]. A higher Lerner index indicates stronger pricing power within the industry, reflecting greater corporate competitiveness. Consequently, if a firm possesses stronger competitiveness, it is better positioned to secure debt financing. Conversely, firms with low competitiveness may be perceived by financial institutions as having lower sustainability and limited repayment capacity, which can lead to higher borrowing costs or reduced loan amounts, ultimately diminishing their debt financing capacity.
2.
Default Risk (Z-score)
Following the approach of Abinzano et al. [111], this study selects the Z-score as a measure of default risk. The Z-score takes into account various aspects such as liquidity, profitability, and solvency by integrating multiple financial ratios to reflect the overall health of a firm’s financial situation and its probability of default. A higher Z-score indicates a more robust financial condition with a lower default risk, while a lower Z-score signifies poorer financial health and higher default risk. The calculation formula is presented as follows:
Z = 1.2X1 + 1.4X2 + 3.3X3 + 0.6X4 + 0.999X5
In Equation (2), X1 represents Working Capital/Total Assets, which reflects the asset liquidation capacity and scale characteristics; X2 is Retained Earnings/Total Assets, indicating the firm’s cumulative profitability; X3 denotes EBIT/Total Assets, reflecting the profitability of assets; X4 represents Market Value of Equity/Book Value of Total Liabilities, indicating the firm’s repayment capacity; and X5 is Operating Revenue/Total Assets, which reflects asset turnover.
3.
Organizational Resilience
Organizational resilience emphasizes a firm’s stability and adaptability, which are crucial for survival and recovery. Firms with high organizational resilience can bolster creditor confidence and enhance financial stability, thereby improving their debt financing capacity. Conversely, lower resilience detracts from such capabilities. This study adopts the methodology of Li and Kong [112], measuring organizational resilience from two dimensions: rebound resilience and overtake resilience. Rebound resilience is assessed using indicators such as the quick ratio, redundant resources, and return on net assets, while overtake resilience is represented by metrics like year-on-year growth in total assets, operating revenue, and net profit. After standardizing these indicators and calculating their averages, a composite score representing organizational resilience, denoted as Resilience, is derived.

3.2.5. Control Variables

To minimize the influence of other factors on corporate debt financing capabilities, this study incorporates a series of control variables based on recent research [113,114]. These variables include company characteristic controls: (1) firm size (Size), (2) leverage (Lev), (3) return on equity (ROE), (4) cash flow (Cashflow), (5) capital intensity (FIXED), and (6) listing age (ListAge); governance controls: (7) independent director ratio (Indep) and (8) ownership concentration (Top1); and growth and market controls: (9) Tobin’s Q (TobinQ).
Firstly, company characteristics play a crucial role in creditors’ credit decisions. Firm size significantly influences financing opportunities; larger firms typically have more assets and enhanced market transparency, which facilitate easier access to debt financing and potentially lower borrowing costs. Leverage indicates the current financial risk; companies with higher leverage face greater default risks, likely resulting in higher debt financing costs under similar conditions. ROE serves as a measure of profitability, and profitable firms generally have stronger internal cash flows and repayment capabilities, making it easier for them to secure cheaper debt financing. Cash flow and capital intensity directly impact debt repayment ability, positioning them as key factors in creditors’ credit allocation decisions. Additionally, controlling for listing age allows for differentiation of the effects related to firm lifecycle stages and maturity on financing capabilities.
Secondly, effective corporate governance reduces agency costs and enhances investor confidence. By controlling for the independent director ratio, this study aims to mitigate the impact of variations in governance quality on debt financing. At the same time, accounting for ownership concentration captures potential risks or advantages stemming from ownership structure that may affect debt financing. Lastly, a firm’s growth potential and market valuation are vital to its future development and significantly influence its debt financing capability. Therefore, the selection of these control variables aids in isolating the other factors affecting corporate debt financing capabilities, allowing for a clearer observation of the independent impact of climate change risks on corporate debt financing. The definitions of the main variables are presented in Table 2.

3.3. Model Setting

To investigate the impact of climate change risk on corporate debt financing capacity, this study constructs the models represented by Equations (3) and (4), as follows:
D e b t i , t = α 0 + α 1 C C R i , t + α i C o n t r o l i , t + Y e a r + I n d u s t r y + ε i , t
C o s t i , t = β 0 + β 1 C C R i , t + β i C o n t r o l i , t + Y e a r + I n d u s t r y + ε i , t
In these equations, D e b t i , t represents the scale of corporate debt financing, C o s t i , t denotes the cost of corporate debt financing, C C R i , t signifies climate change risk, and C o n t r o l i , t refers to the nine selected control variables encompassing various financial and operational characteristics of the firm (such as firm size, debt-to-asset ratio, return on equity, cash flow, capital intensity, and listing period), as well as governance attributes (including the size of independent directors and ownership concentration), and growth and market level attributes (Tobin’s Q value). The terms Y e a r and I n d u s t r y account for year and industry fixed effects, respectively, while ε i , t represents the random disturbance term.
This model aims to analyze the relationship between climate change risk and corporate debt financing capacity, while controlling for a range of factors that could influence these capabilities. The coefficients of climate change risk α 1 and β 1 will indicate the magnitude and direction of its impact on corporate debt financing capacity.

4. Analysis of Empirical Results

4.1. Descriptive Statistics

Table 3 presents the descriptive statistics for the key variables. The average scale of debt financing (Debt) for the sample firms is 0.188, with a median of 0.158, a standard deviation of 0.154, and a maximum value of 0.641. These figures indicate that most firms have relatively small scales of debt financing, while a few exhibit significantly larger scales. The average cost of debt financing (Cost) is 0.028, with a standard deviation of 0.03 and a maximum of 0.152, suggesting considerable variation in debt financing costs among firms, with a minority facing notably higher costs. For climate change risk (CCR), the minimum value in the sample is 0.014, while the maximum is 0.768, accompanied by a standard deviation of 0.145. This indicates that firms across the country experience climate change risks to varying degrees, highlighting significant disparities among different firms. The descriptive statistics for the other variables fall within reasonable ranges and are consistent with the existing literature.

4.2. Baseline Regression Results

Table 4 presents the baseline regression results for Models 1 and 2, which examine the impact of climate change risk on firms’ debt financing capacity. The results indicate that in column (1), the regression coefficient for the climate change risk indicator (CCR) is −0.031, with a t-value of −6.19, significant at the 1% level. This suggests that, after controlling for other factors, climate change risk is negatively correlated with the scale of debt financing. Specifically, a 1% increase in a firm’s climate change risk relative to its industry competitors is associated with a 3.1% decrease in the firm’s debt financing scale. In comparison to existing research, there is an ongoing debate regarding the scale of debt financing and the factors that influence it. Ref. [52] employed the standardized Herfindahl–Hirschman index (HHI) to evaluate both short-term commercial credit financing and long-term debt, thereby assessing the concentration of corporate debt. Their analysis, using a fixed effects model, revealed that increased exposure to corporate climate risks prompts companies to reduce certain types of debt financing, which in turn leads to higher debt concentration. Specifically, their findings indicate that a one standard deviation increase in climate risk exposure results in a 6.4% increase in corporate debt concentration. Similarly, refs. [50,51] observed that companies facing climate change risks tend to lower their leverage in response to heightened operational risks and potential bankruptcy costs, aiming to avoid escalating debt expenses. However, Edith introduced the perspective that leverage is shaped not only by corporate capital structure decisions but also by the actions of creditors, emphasizing a supply-side view on the availability of loans. This dual perspective enriches the discussion by highlighting the interplay between corporate decision-making and creditor behavior in the context of climate-related financial pressures [50,51,52]. In column (2), the regression coefficient for the climate change risk indicator (CCR) is 0.004, with a t-value of 3.25, which is also significant at the 1% level. This finding indicates a positive correlation between climate change risk and debt financing costs, whereby a 1% increase in climate change risk relative to industry competitors results in a 0.4% increase in debt financing costs. The economic significance of this coefficient depends on the rigidity of corporate financing costs and the influence of climate change risk factors. Compared to equity financing, debt costs are constrained by collateral and contractual terms, resulting in a naturally narrow range of fluctuations. For AAA-rated enterprises in China, the risk premium on bond yields typically ranges from 0.1% to 0.5%, rarely exceeding 1%. Currently, the average interest rate for corporate loans in China has dropped below 3.5%; thus, a 0.4% increase in costs corresponds to a relative rise of 11–15% in capital costs, reflecting effective market pricing. Additionally, debt market pricing is a gradual adjustment process. The impact of climate change risk, particularly transition risk, is long-term and exhibits a long-tail effect, meaning that its effects will become more pronounced over time. Research indicates that, in response to extreme precipitation across various regions in China, the credit spread on urban investment bonds increases with rising rainfall, with a marginal effect of 6.8 basis points for every additional 100 mm of precipitation—an effect consistent with the findings in this study. Therefore, the 0.4% increase in debt financing costs is neither negligible nor an overreaction. Similar conclusions emerge from multiple studies examining the effects of climate change risks within the framework of climate finance, particularly regarding the pricing of various debt financing instruments. Although the studies approach the subject from different angles, they collectively highlight the influence of corporate climate risks on debt costs. For instance, refs. [48,49] investigated the impacts of drought and high temperatures on corporate bank loans, finding increases in debt costs of 1.68% and 0.2411%, respectively. Both studies emphasized that banks’ sensitivity to information plays a crucial role in escalating debt costs, as banks are able to swiftly obtain and incorporate data regarding potential fluctuations in corporate earnings attributable to climate risks into their lending decisions. Ref. [47] provided a more direct analysis by examining the relationship between sea level rise and property mortgages, establishing a clear connection between environmental changes and mortgage costs. Meanwhile, refs. [21,46] focused on bond pricing, both concluding that bond prices have risen. Their analyses revealed that this increase is largely driven by higher underwriting fees and tighter financing constraints faced by firms. Despite these insights, existing research on the impact of climate change risks on debt financing often fails to simultaneously analyze both the scale and costs of debt, leading to divergent perspectives in the literature [21,46,47,48,49]. This gap underscores the need for a more integrated approach that considers how climate risks affect both the volume and the pricing of debt financing instruments. These findings demonstrate that climate change risk significantly diminishes a firm’s debt financing capacity, indicating that greater climate change risk leads to a reduction in the available debt scale and necessitates higher risk premiums. Thus, Hypothesis 1 is supported by this evidence.

4.3. Robustness Test Results

To ensure the robustness of the regression results, this study conducts six robustness checks: (1) substituting the explanatory variables, (2) altering the dependent variable, (3) inclusion of control variables related to corporate governance, (4) excluding specific years from the analysis, (5) introducing city fixed effects, and (6) selecting a subsample from the manufacturing sector.

4.3.1. Substituting Explanatory Variables

To address the potential impact of different measurement methods on the core variables, this study replaces the explanatory variables and conducts new regression analyses. First, a dictionary related to “climate risk” is developed using information disclosed by the National Meteorological Science Data Center and the China Meteorological Disaster Yearbook, and research conducted by Li et al. (2024) [105]. Following this, inspired by the studies of Bengio et al. (2003), LeCun et al. (2015), and Hu Nan et al. (2021) [115,116,117], machine learning techniques are employed to process the annual report corpus using the Continuous Bag-of-Words (CBOW) model for word collection. Web scraping technology is then utilized to assess word frequency. The frequency of terms appearing in the annual reports is calculated by dividing the number of occurrences by the total word count of the reports (after removing stop words) and is subsequently multiplied by one hundred to serve as an alternative measure of climate change risk. Using this new indicator (CCR1), the research hypotheses are re-evaluated empirically. As shown in Table 5, columns (1) and (2), CCR1 significantly impacts the scale of debt financing (Debt) at the 1% level, with a coefficient of −0.01, and it also significantly affects the cost of debt financing (Cost) at the 1% level, with a coefficient of 0.003. This indicates that after substituting the explanatory variables, for every 1% increase in climate change risk relative to industry competitors, the corporate debt financing scale decreases by 1%, while the cost increases by 0.3%. The suppressive effect of climate change risk on corporate debt financing capability remains robust.
Second, extreme weather events are selected as an alternative indicator for corporate climate change risk. This study characterizes the exposure level to climate change risk using temperature and precipitation, following the methodology of Guo et al. (2024) [118]. Utilizing daily observational data from meteorological stations in prefecture-level cities, the study establishes the 10th percentile of daily temperature and the 5th percentile of precipitation as thresholds for extreme low temperatures and extreme rainfall, respectively. The total number of days each year that exceed these thresholds is calculated and standardized to obtain the mean, thereby constructing an alternative climate change risk variable (CCR2). Regression analyses utilizing this variable are presented in Table 5, columns (3) and (4). CCR2 significantly influences the debt financing scale (Debt) at the 5% level, with a coefficient of −0.018, and it also significantly affects the cost of debt financing (Cost) at the 5% level, with a coefficient of 0.004. This indicates that employing extreme weather events in prefecture-level cities to represent the climate change risk faced by enterprises further corroborates the prediction of Hypothesis H1, confirming the robustness of the suppressive effect of climate change risk on corporate debt financing capability.

4.3.2. Changing the Dependent Variable

To mitigate potential biases arising from the measurement of the dependent variable, this study substituted the dependent variable and re-ran the regression analysis. The total of long-term loans due within one year, short-term loans, and non-current liabilities, plus one, was used as an alternative measure for the debt financing scale. Following the research by Zheng et al. [119], financial expenses divided by total liabilities at the end of the period served as an alternative measure for debt financing costs. Using these new indicators (Debt1 and Cost1), the empirical tests of the research hypotheses were conducted again. The regression results for the substituted dependent variables are presented in columns (5) and (6) of Table 5. After the substitution, the signs of the explanatory variable coefficients remained unchanged and consistent with the baseline regression results, both significant at the 1% level. Specifically, a 1% increase in firms’ climate change risk relative to industry competitors results in a 13.3% reduction in the debt financing scale and a 0.3% increase in financing costs. This further confirms the significant negative impact of climate change risk on firms’ debt financing abilities.

4.3.3. Inclusion of Control Variables Related to Corporate Governance

Firstly, drawing from upper echelons theory and human capital theory, the characteristics of executives significantly influence strategic choices through their cognitive frameworks. Generally, executives with financial backgrounds possess specialized knowledge of financing, are skilled at asset risk pricing, and exhibit heightened sensitivity to risk identification. As climate change risk is one such risk factor, individuals with financial expertise are more likely to incorporate climate change risk into existing risk management frameworks, while executives from other backgrounds may overlook its financial implications. Secondly, executives with financial backgrounds greatly enhance their financial decision-making capabilities and their ability to recognize risk. They also have access to valuable financial networks that can broaden financing channels. Moreover, the financial background of executives serves as a crucial indicator of corporate governance. Including this control variable allows for a clearer assessment of the net effects of climate change risk on a firm’s debt financing capacity, thereby improving the precision of hypothesis testing and reducing model standard errors. Therefore, this research incorporates whether executives have a financial background (FinBack) as a control variable in robustness checks. The regression results, as presented in Table 6, columns (1) and (2), reveal that the coefficients for climate change risk are significant at the 1% level, aligning with the main regression findings. This consistency suggests that the negative impact of climate change risk on corporate debt financing remains highly robust.

4.3.4. Excluding Specific Years

Considering the substantial impact of the COVID-19 pandemic in 2020, which affected various aspects of the economy and business operations, the presence of anomalous data in firms’ operational and financial metrics could obscure underlying trends and genuine relationships between variables. To eliminate the interference of this unique factor on the study’s conclusions, data from 2020 were excluded, and the regression analysis was repeated. The results, presented in columns (3) and (4) of Table 6, indicate that even after excluding the 2020 data, the negative impact of climate change risk on firms’ debt financing capacity remained unchanged. The coefficients indicate that after removing the pandemic’s influence, a 1% increase in firms’ climate change risk relative to industry competitors corresponds to a 2.9% reduction in the debt financing scale and a 0.3% increase in financing costs, further validating the robustness of the study’s findings.

4.3.5. Incorporating City Fixed Effects

Climate change risk is closely related to the geographic distribution of cities, and variations in economic development levels, industrial structures, policy environments, and financial market maturity among different cities may affect firms’ debt financing capacity. By incorporating city fixed effects, this study aims to control for unobservable factors across cities, thereby enhancing the reliability of the results. The regression outcomes, shown in columns (5) and (6) of Table 6, are consistent with the baseline regression findings, with coefficients of −0.027 and 0.003, both significant at the 1% level. This indicates that a 1% increase in firms’ climate change risk relative to industry competitors results in a 2.7% reduction in debt financing scale and a 0.3% increase in financing costs, further supporting the research hypotheses presented in this paper.

4.3.6. Selection of Manufacturing Subsample

As a crucial component of the real economy, the manufacturing sector possesses distinct characteristics, including high energy consumption, significant emissions, and extensive supply chains. These traits render it potentially more vulnerable to climate change risks compared to other industries, exposing it to more direct and urgent physical threats, as well as pressures from carbon taxation and the need for technological upgrades. To ascertain whether our findings remain consistent when excluding the influences of other sectors, this study focuses on a manufacturing subsample. The regression results, shown in Table 6, columns (7) and (8), demonstrate that climate change risk has a significantly negative impact on the debt financing scale at the 1% level, with a more substantial reduction in magnitude compared to the baseline regression. Furthermore, the coefficient for climate change risk regarding debt financing cost is 0.004, also significant at the 1% level, and slightly higher than the baseline coefficient of 0.0037. These findings suggest that the impact of climate change risk on corporate debt financing is generally applicable across sectors, with heightened sensitivity observed in the manufacturing sector. This supports our Hypothesis H1 and reinforces the robustness of our results.

4.4. Endogeneity Test Results

4.4.1. Lagged Explanatory Variables

This study primarily examines the impact of climate change risk on firms’ debt financing capacity; however, it is important to recognize that firms’ debt financing abilities may also influence climate change risk, leading to a bidirectional endogeneity issue. To address this concern, we utilize lagged climate change risk (LCCR) as an explanatory variable in the regression analysis of firms’ current debt financing capacity. The regression results presented in columns (1) and (2) of Table 7 reveal that the first lag of climate change risk significantly negatively affects the debt financing scale (Debt) and significantly positively affects debt financing costs (Cost). This indicates that firms’ past climate change risk suppresses their current debt financing capacity, thereby affirming the robustness of the baseline regression conclusions.

4.4.2. Instrumental Variable Approach

In addition, this study employs an instrumental variable (IV) approach to further address potential endogeneity issues. The air quality index of the region where the firm is located is selected as the instrumental variable, and a two-stage least squares (2SLS) estimation is conducted. Firstly, the municipal-level air quality index is highly correlated with climate change risk, satisfying the relevance requirement for instrumental variables. Secondly, this air quality index is unlikely to have a direct impact on an individual firm’s debt financing capacity, fulfilling the exogeneity requirement. To test the validity of the instrumental variable, the study conducts an under-identification test as well as a weak instrument test. The regression results using the instrumental variable approach are presented in Table 8. The coefficient for the IV in column (1) is significantly positive at the 1% level, and the F-statistic is 111.869, which is well above the critical value of 10, thus passing the weak instrument test and confirming that the instrumental variable is relevant. Additionally, the p-value of the LM test is less than 0.1, satisfying the conditions for the identification test. These results indicate that the selected instrumental variable is effective. Accordingly, the regression results in columns (2) and (3) show that climate change risk (CCR) has a significantly negative coefficient for debt financing scale (Debt) and a significantly positive coefficient for debt financing costs (Cost). This demonstrates that even after accounting for endogeneity issues, the negative impact of climate change risk on firms’ debt financing capacity remains significant.

4.4.3. Propensity Score Matching (PSM)

To mitigate biases, the median climate change risk was calculated by industry year and used as a grouping variable, dividing the full sample into two groups: firms above and below the median. Subsequently, the control variables from the baseline regression were utilized as covariates, implementing a 1:1 sampling with the replacement nearest neighbor matching method to construct the experimental and control groups. The matched samples were then re-regressed. The regression outcomes are presented in Table 9, where columns (2) and (4) report the results for the matched samples. The regression results indicate a significantly negative coefficient for the impact of climate change risk on the debt financing scale (Debt), with a value of −0.03, and a significantly positive coefficient for debt financing costs (Cost) at 0.004. This suggests that, after controlling for differences in firms’ characteristics, a 1% increase in the firms’ climate change risk relative to industry competitors results in a 3% reduction in the debt financing scale and a 0.4% increase in debt financing costs. These findings confirm that climate change risk diminishes firms’ financing capabilities, which is consistent with previous results.

4.5. Moderating Effect of Corporate Carbon Emissions

Based on existing research, corporate carbon emissions significantly impact financing capacity. This study constructs a variable for the level of changes in corporate carbon emissions (Carbon) and creates an interaction term between carbon emissions and climate change risk (CCR × Carbon). The regression results, shown in Table 10, indicate that the estimated coefficient for the interaction term (CCR × Carbon) in column (1) is −0.029, which is significant at the 5% level. This suggests that an increase in carbon emissions exacerbates the reduction effect of climate change risk on the debt financing scale. Companies with rising carbon emissions are perceived as facing higher long-term risks, leading creditors to tighten credit limits and intensifying the suppressive effect of climate risk on financing scale. In the regression results for debt financing costs, column (2) shows that the estimated coefficient for the interaction term (CCR × Carbon) is significantly positive at the 1% level. This indicates that when corporate carbon emissions increase, the effect of climate change risk on raising debt financing costs is significantly enhanced. Companies with growing carbon emissions face higher transition risks (e.g., carbon taxes, regulatory penalties), prompting creditors to demand additional risk premiums, further amplifying the impact of climate risk on financing costs.
These regression results validate Hypothesis 2, demonstrating that the reduction effect of climate change risk on the debt financing scale and the increase effect on debt financing costs are further intensified with rising carbon emission levels. This highlights that carbon emission levels are a crucial consideration for creditors during the financing process. Companies demonstrating effective carbon emission control not only enhance their social reputation and transmit more positive signals to the capital market but also align with the policy direction of green finance, gaining preferential access to green credit from financial institutions like banks and experiencing lower debt financing costs. Conversely, companies with high carbon emission levels may be viewed as lacking effective emission reduction measures, suffering severe negative impacts on their social reputation, facing restricted financing channels, and encountering greater transition risks and environmental regulatory pressures, ultimately diminishing their market competitiveness and placing them at a relative disadvantage in capital markets. Thus, we argue that incorporating changes in corporate carbon emissions as a moderating variable provides further evidence that the impact of climate change risk on corporate debt financing capability is largely influenced by supply-side financial institutions such as banks. If changes in corporate capital structure decisions on the demand side were the primary drivers of leverage scale, the impact of climate change risk on corporate debt financing capability would not vary with changes in carbon emission levels, as financing resource fluctuations related to carbon emissions are predominantly affected by supply-side factors rather than demand-side influences. Therefore, this research conclusion not only confirms that carbon emission levels moderate the changes in debt financing capability under the influence of climate change risk but also demonstrates that the variations in leverage scale and capital costs resulting from climate change risk are driven by increased pressures from the supply side.

4.6. Mediating Effect Test Results

Building on the theoretical analysis and baseline regression results, the findings align with the principles of Resource Dependence Theory, Information Asymmetry Theory, and Dynamic Capabilities Theory. To elucidate the potential pathways through which climate change risk influences corporate debt financing capability, this study further explores the mechanisms from the perspectives of corporate competitiveness, default risk, and organizational resilience.

4.6.1. Mechanism of Reduced Competitiveness

Nowadays, sustaining competitiveness in the face of intense market competition is essential for the sustainable development and operational efficiency of enterprises. Additionally, a company’s relative strength in market competition is a critical consideration for creditors. A decline in corporate competitiveness can lead to instability in operating cash flows and an increase in business uncertainty. According to Credit Pricing Risk Theory, creditors may respond to this decline by tightening credit availability and demanding higher risk premiums to compensate for potential losses. Moreover, less competitive firms often limit information disclosure to conceal operational challenges, resulting in decreased financial transparency. This lack of transparency makes it difficult for creditors to accurately assess a firm’s repayment capacity, consequently raising risk costs. To mitigate the risks associated with adverse selection, creditors may implement stricter credit rationing policies, further constraining financing levels and increasing interest rates, ultimately diminishing a firm’s debt financing capability.
This study employs the Lerner index (PCM) as a measure of corporate competitiveness. Column (1) of Table 11 illustrates the impact of climate change risk on corporate competitiveness, revealing that the coefficient for CCR is −0.011, which is significant at the 5% level. Specifically, for each 1% increase in climate change risk relative to industry competitors, corporate competitiveness will decrease by 1.1%. This finding indicates that climate change risk adversely affects corporate competitiveness; as climate change risk increases, the competitiveness of the firm declines. As noted earlier, the uncertainty brought about by extreme weather events and natural disasters disrupts normal operations and resource acquisition. Additionally, transition risks arising from resource restructuring and stricter regulations hinder firms from maintaining sustainable competitive advantages. This instability negatively impacts their production and profitability, reducing their attractiveness in financial markets and making debt financing more challenging, ultimately lowering corporate debt financing capability.

4.6.2. Mechanism of Increased Default Risk

Default risk, a fundamental risk associated with corporate debt financing, directly affects creditors’ expected loss rates. When the probability of default increases, creditors, concerned about the firm’s repayment capacity, often respond by adjusting credit limits, imposing stricter loan reviews, and reducing both loan amounts and bond issuances for the firm. Furthermore, credit spreads are significantly positively correlated with default probabilities; as default risk rises, creditors demand higher risk compensation, resulting in increased financing costs for the firm. According to signaling theory, an increase in default risk—especially following actual default events—conveys negative signals to the market, leading to lower credit ratings for firms. This can trigger a “herding effect” among investors, further constraining financing channels and driving up debt financing costs. A substantial body of literature has confirmed that default risk is a significant determinant of corporate debt financing [120,121].
In this study, the Z-score is utilized as a proxy for default risk, where lower Z-scores indicate a higher default risk. Column (2) of Table 11 demonstrates the impact of climate change risk on default risk, revealing that the coefficient for climate change risk (CCR) is −0.617, significant at the 1% level. For each one-unit increase in climate risk relative to industry competitors, the distance to default for the company will decrease by 0.617 units, resulting in an average increase of 0.617 units in default risk. This indicates that climate change risk significantly increases corporate default risk, raising concerns for financial institutions regarding repayment capacity and, consequently, diminishing the firm’s ability to secure debt financing. As previously discussed, climate change risk can lead to operational disruptions, inventory losses, and impairments of fixed assets, which, in turn, deteriorate financial conditions, reduce repayment capacity, and elevate default risk, ultimately harming credit ratings. This scenario poses credit risks for financial institutions, prompting them to require higher returns on risk or reduce the credit supply to the firm. In summary, climate change risk elevates corporate default risk, amplifying financial institutions’ concerns about repayment capacity and thereby decreasing a firm’s debt financing capability.

4.6.3. Mechanism of Reduced Organizational Resilience

Organizational resilience highlights the dual attributes of stability and adaptability, serving as a core capability for firms to withstand shocks, adjust to changes, and maintain sustainable development—factors that are particularly significant for creditors in the credit market. According to the resource-based view, firms with diminished resilience experience considerable pressure in resource allocation and management, often lacking sufficient cash reserves and liquidity buffers to cope with shocks, thus losing the “reservoir” effect. Furthermore, low-resilience firms face not only higher short-term survival risks but also convey negative signals to the market regarding poor management, governance deficiencies, and weak risk control. This exposure to financial vulnerabilities exacerbates adverse selection.
This study asserts that organizational resilience partially mediates the relationship between climate change risk and debt financing capability. To this end, a variable named Resilience is constructed as a proxy for organizational resilience. Column (3) of Table 11 illustrates the impact of climate change risk on organizational resilience, revealing a significantly negative coefficient of −0.019 for climate change risk (CCR). This implies that for every 1% increase in climate change risk relative to industry competitors, organizational resilience will decrease by 1.9%. This finding indicates that increasing climate change risk adversely affects organizational resilience. As previously mentioned, climate change risk directly undermines the operational foundation of firms, disrupting internal resource allocation and management while posing challenges to sustained operations. These disruptions can create spillover effects on supply chains, damaging long-established relationships and synergies in production processes. Additionally, the uncertainty associated with climate change risk complicates decision-making as well as risk identification and response efforts, further weakening the organization’s capacity to withstand and recover from risks. This demonstrates that climate change risk reduces organizational resilience, undermining firms’ risk-bearing abilities and recovery capacities. As a result, this places them at a disadvantage in the financing market and diminishes their debt financing capability.

4.7. Heterogeneity Analysis Results

4.7.1. Group Testing of State-Owned and Non-State-Owned Enterprises

Based on institutional theory and the principle of competitive neutrality, state-owned enterprises (SOEs) have greater access to various policy resources, including fiscal subsidies and special funding support. These advantages enhance their financial stability and help mitigate potential revenue fluctuations resulting from climate risks, thereby strengthening their capacity to secure financing in the debt market. Additionally, SOEs benefit from implicit government guarantees, facilitating their ability to obtain bank loans, which in turn leads to lower default risks and reduced financing costs. However, SOEs also bear certain policy obligations, such as ensuring local employment and improving the quality of life, which closely ties them to the national image and enhances their credibility and reputation. As a result, financial institutions are more likely to factor these advantages into their risk management and reputation considerations when evaluating debt financing applications, resulting in more favorable financing conditions for SOEs. Furthermore, the Chinese government’s “dual carbon” targets introduced in 2020 impose greater responsibilities on SOEs to promote green and sustainable development. This compels them to adopt proactive measures for green transformation and energy conservation, leading to improved performance in environmental, social, and governance (ESG) aspects. Given these factors, even when accounting for the impacts of climate change risk, SOEs can maintain relatively stable debt financing capability. In contrast, non-state-owned enterprises face significant constraints in resource acquisition and endure greater survival pressures. When confronted with climate change risks, these resource limitations become even more pronounced, causing these firms to prioritize capital market performance and profits over green, low-carbon strategies. This often results in more symbolic green innovations in response to environmental regulations, rendering them more vulnerable to the adverse effects of climate change risks. The transition risks associated with “stranded assets” lead to the depreciation of collateral assets, especially for small- and medium-sized private enterprises that lack sufficient collateral and favorable credit ratings. Consequently, their debt financing capabilities are negatively impacted. Thus, compared to SOEs, the negative impact of climate change risk on debt financing capability is significantly more pronounced in non-state-owned enterprises. The results of the grouped regression analysis are presented in Table 12. In column (1), the coefficient for climate change risk (CCR) is significantly negative at −0.038, while in column (2), the coefficient is statistically insignificant. In column (3), the CCR coefficient is significantly positive at 0.004, and in column (4), it remains insignificant. This indicates that for NSOEs, a 1% increase in climate change risk leads to a 3.8% decrease in the debt financing scale, while debt financing costs increase by 0.4%, thus confirming the hypothesis that the suppressive effect of climate change risk on debt financing capacity is more significant for NSOEs.

4.7.2. Group Testing of Different Quality Levels of Internal Control

Based on information asymmetry theory and principal–agent theory, firms with low internal control quality often provide untimely or non-standard information disclosures, making it challenging for creditors to accurately assess the firm’s true climate change risk and operational status. To mitigate this risk, creditors may raise financing thresholds or demand higher risk premiums. In contrast, high-quality internal controls improve the quality of information disclosure, thereby reducing adverse selection and moral hazard issues during the execution of debt contracts [122]. Credit providers face an information disadvantage relative to firms and require more comprehensive data to optimize their understanding of climate change risks. Firstly, firms with high internal control quality possess more robust risk assessment processes that effectively integrate climate scenario analyses. Through their internal control activities, these firms can diversify asset allocations and strengthen supply chain resilience to directly address climate change risks; for example, by supporting suppliers and purchasing disaster insurance to minimize production interruptions. Secondly, firms with high internal control quality can ensure the authenticity of ESG information by reliably disclosing carbon emission data and audit results. This transparency helps meet the requirements for green bond issuance and lowers the levels of information asymmetry faced by creditors. Thirdly, stringent supervision of fund usage can prevent management from misappropriating loans, thereby enhancing creditors’ trust. Consequently, for firms with higher internal control quality, the negative impact of climate change risk on their debt financing capability is mitigated. Using the DiBo Internal Control Index score, the analysis divides firms into high and low internal control quality groups based on the median, as shown in Table 12. In columns (5) and (6), the coefficients of the explanatory variable are significantly negative at the 1% level, with the low internal control quality group having a coefficient of −0.034, indicating that a 1% increase in climate change risk results in a 3.4% reduction in the debt financing scale. The high internal control quality group has a coefficient of −0.03, meaning that for this group, a 1% increase in climate change risk leads to a 3% decrease in the debt financing scale. The results passed the inter-group difference coefficient tests, demonstrating that the weakening effect of climate change risk on the debt financing scale is stronger in the low internal control quality group. In columns (7) and (8), the coefficients of the explanatory variable for the low internal control quality group are significantly positive at 0.005, while those for the high internal control quality group are positive but not significant. This suggests that for firms in the low internal control quality group, a 1% increase in climate change risk leads to a 0.5% increase in debt financing costs compared to the high internal control quality group, indicating that the suppressive effect of climate change risk on debt financing capacity is more significant in firms with lower internal control quality.

4.7.3. Group Testing of High Level and Low Level of Regional Financial Development

Based on financial geography and financial constraint theory, the spatial distribution of financial resources is influenced by geographic agglomeration effects. These effects, in turn, guide the allocation of financial resources across different regions and indirectly impact the financial resources available to firms. Firstly, varying levels of regional financial development reflect differences in the sophistication of financial intermediaries and market infrastructure. In more developed regions, financial institutions can effectively utilize climate scenario analyses and stress testing tools to quantitatively assess the impacts of physical risks and transition challenges. This enables them to accurately determine debt pricing and reduce biases. For instance, in the Yangtze River Delta, carbon footprints are integrated into credit models, resulting in more equitable green debt spreads compared to traditional enterprises. Conversely, in less developed financial regions, there is often a lack of data and reliance on outdated models, leading to the misclassification of climate change risks as force majeure and causing distortions in financing cost pricing. Secondly, developed regions tend to exhibit higher levels of digital finance, which facilitates faster, more transparent, and efficient information dissemination. In these areas, creditors can more easily access various types of information about firms, enabling a more accurate assessment of their operational conditions. Thirdly, the negative impacts of climate change risks on the financial system, combined with national policy guidance for low-carbon transitions, prompt financial institutions to place greater emphasis on risk assessment and management. Consequently, regions with higher financial development typically exhibit heightened sensitivity to climate change risks, often accompanied by stricter environmental policies and regulatory frameworks. In summary, regions with higher levels of financial development demonstrate greater efficiency in information acquisition, allowing for a more precise identification of the impacts of climate change risks. This, in turn, amplifies the adverse effects of climate change risks on firms’ debt financing capabilities.
In this analysis, the regional financial development level is measured by the ratio of (the number of financial professionals in the prefecture-level city/the total employment in the prefecture-level city) to (the number of financial professionals nationwide/the total employment nationwide). Firms were then divided into high and low financial development-level groups based on the median for the heterogeneity examination, as shown in Table 13. In columns (1) and (2), the coefficients of the explanatory variables are significantly negative, with the low financial development level group having a coefficient of −0.022 and the high financial development level group a coefficient of −0.038. The inter-group coefficient difference tests indicate that a 1% increase in climate change risk leads to a 2.2% reduction in the debt financing scale for firms in regions with lower financial development levels, while firms in regions with higher financial development levels experience a 3.8% reduction. In columns (3) and (4), the coefficients of the explanatory variables are significantly positive, with the low financial development level group at 0.0039 and the high financial development level group at 0.004. The inter-group coefficient difference tests confirm these results, indicating that a 1% increase in climate change risk results in a 0.39% rise in debt financing costs for firms in regions with lower financial development levels and a 0.4% rise for those in regions with higher financial development levels. This demonstrates that the suppressive effect of climate change risk on debt financing capacity is stronger in regions with higher financial development levels, aligning with expectations.

4.7.4. Group Testing of High Level and Low Level of Environmental Uncertainty

Based on information asymmetry theory and institutional theory, environmental uncertainty increases the complexity and unpredictability of the business environment, which in turn amplifies the impact of climate change risks on firms’ debt financing capabilities. Environmental uncertainty intensifies the degree of information friction, leading to reduced transparency in corporate disclosures. For example, when firms present climate data in an ambiguous manner, creditors may resort to punitive pricing and limit the amount of loans they extend. In regions characterized by significant policy and regulatory fluctuations, market signals related to green investments may be overlooked, resulting in ineffective sustainable investments. These challenges cause creditors to misjudge climate change risks, thereby exacerbating the negative effects of these risks on firms’ debt financing capabilities.
Based on the above analysis, this study posits that higher levels of environmental uncertainty amplify the negative impact of climate change risk on firms’ debt financing capacity. Following the methodology of Shen et al. [123], the study uses the standard deviation of industry-adjusted sales revenue over the past five years as a measure of environmental uncertainty. Firms are categorized into high and low environmental uncertainty groups based on the median. The results are shown in Table 13. In columns (5) through (8), it is evident that the coefficient for climate change risk (CCR) in the high environmental uncertainty group is significantly negative at the 1% level in the debt financing scale regression, with a coefficient of −0.039, while the coefficient in the debt financing cost regression is significantly positive at 0.004. This indicates that for firms in the high environmental uncertainty group, a 1% increase in climate change risk results in a 3.9% reduction in debt financing scale and a 0.4% increase in financing costs. Conversely, the coefficient for the low environmental uncertainty group is larger but less significant, and the coefficient for climate change risk (CCR) in relation to debt financing costs is not significant. The inter-group difference tests confirm these results at the 1% significance level. This indicates that climate change risk has a more substantial suppressive effect on the debt financing capacity of firms facing high environmental uncertainty.

5. Conclusions

This study utilizes data from A-share listed companies in China spanning from 2010 to 2022 to examine the impact of climate change risks on corporate debt financing capacity. The empirical results indicate that, after controlling for potential influencing factors, climate change risks significantly diminish a firm’s ability to finance through debt. Specifically, the findings reveal a decrease in debt financing volume and an increase in the cost of debt capital. This core conclusion remains robust even after a series of checks for robustness and treatments for endogeneity.
These findings expand the research landscape in climate finance and green finance, reconciling existing discrepancies by unifying perspectives on how climate change risks affect both debt financing volume and cost. The results suggest that the influence primarily originates from the supply side, rather than being driven by corporate capital structure decisions or the risk assessments performed by credit institutions. To further validate this perspective, the study introduces changes in corporate carbon emissions as a moderating variable, demonstrating that fluctuations in carbon emissions guide credit funding and exert a negative moderating effect on the relationship between climate change risks and debt financing capacity. This indirectly supports the notion that both debt volume and capital cost are influenced by the actions of supply-side financial institutions. Moreover, this research explores the pathways through which climate change risks undermine corporate debt financing capability. These include diminished competitiveness, increased default risks, and reduced organizational resilience. Heterogeneity analyses reveal that the impact of climate change risks on debt financing capacity varies according to ownership structure, internal control quality, regional financial development levels, and the degree of external environmental uncertainty. Notably, the suppressive effect of climate change risks on debt financing capacity is stronger in non-state-owned enterprises, firms with lower internal control quality, companies operating in regions with higher financial development, and environments characterized by greater uncertainty.
Given the growing implications of climate change, these results elucidate the relationship between climate change risks and corporate debt financing capacity. They offer valuable insights into understanding the risks posed by climate change, adapting to and mitigating these risks, guiding capital flows, facilitating industrial transformation, and promoting low-carbon sustainable economic development.
However, the study acknowledges certain limitations, particularly concerning the measurement of climate change risks, which rely on annual report disclosures and may contain noise and interference. This suggests opportunities for future research in this area. A scientifically sound assessment and measurement of micro-level corporate climate change risks will be crucial for further investigation. Additionally, given that dual carbon targets are specific policies set by the Chinese government, further examination is needed to determine the applicability of these conclusions to climate finance practices in other countries.

6. Policy and Managerial Suggestions

Our research offers valuable insights for formulating green policies and guiding corporate sustainable development decisions. We have clarified the impact of climate change risk on corporate debt financing capacity, which is essential for shaping corporate strategies and operational adjustments. By identifying the underlying mechanisms, this research can help firms restructure their business models, enhance organizational resilience, and proactively address climate change. Furthermore, it can assist financial institutions in optimizing operations, refining risk assessment models, reducing credit risk, innovating financial products and services, and improving the efficiency of financial resource allocation, thereby contributing to stability in financial markets. Policymakers, who are responsible for facilitating a green economic transition and ensuring social stability, can leverage these findings to inform decision-making and enhance governance.
Based on our empirical results, we propose the following recommendations:
Firstly, banks and financial institutions, as the pricing agents for climate change risks and lenders, need to enhance their risk assessment systems by integrating climate change risks into their corporate credit risk evaluation models and incorporating a climate risk scoring module into the credit approval process. They should develop climate risk stress testing models to assess potential losses in loan portfolios under various climate disaster scenarios. Additionally, expanding their analysis of relevant soft indicators related to corporate climate change risks will provide a deeper understanding of firms’ dynamic capabilities in addressing these challenges. Financial institutions can also issue green bonds and sustainability-linked loans to provide dedicated funding for companies effectively managing climate change risks, thereby increasing the supply of climate-related credit; promote climate-linked loans by dynamically tying loan interest rates and terms to the climate performance indicators of borrowing enterprises, facilitating their emission reduction efforts; integrate data from the CDP platform and employ Internet of Things (IoT) technology for real-time monitoring; require high-risk sector borrowers to install sensor networks (e.g., monitoring water levels and temperatures in factories) that connect directly to the bank’s risk management platform, enhancing post-loan monitoring and activating risk mitigation mechanisms based on climate risk thresholds; and establish dedicated climate risk reserves for enterprises categorized by varying risk levels to finance debt relief or technological upgrades necessitated by climate events.
Secondly, at the corporate level, firms should conduct systematic assessments of the physical and transition risks associated with climate change. This involves establishing dedicated climate risk management teams within their risk management departments and regularly performing climate scenario stress tests, such as simulating the impacts of extreme weather events on supply chain disruptions. Collaboration with research institutions to develop climate risk early warning systems is essential for effectively monitoring these physical and transition risks. Companies should also actively pursue the green transformation of their supply chains, set clear timelines for phasing out outdated capacities, and invest in forestry carbon sink projects to help offset their carbon emissions. Furthermore, enhancing both the quantity and quality of disclosures related to climate change risks and their mitigation strategies is crucial. Firms should publish independent climate-themed reports as part of their annual reports to improve information symmetry. Simultaneously, strengthening internal control quality can help reduce creditors’ misjudgments regarding climate change risks.
Finally, the government needs to actively guide the flow of low-carbon funds and improve relevant policies within the green finance system. This includes increasing financial subsidies and tax incentives related to climate change responses, establishing special funds for green technology development, and implementing differentiated carbon taxes for companies based on their carbon emissions. Enhanced financial support, particularly for non-state-owned enterprises, is crucial to helping them overcome credit constraints arising from climate risks. For instance, the government should implement state-backed loans and establish a climate whitelist for non-state-owned enterprises, enabling them to benefit from expedited loan approvals and preferential interest rates. Additionally, it should provide purchase and interest subsidies for green transformation investments in these enterprises and offer preferential treatment in green government procurement to support their sustainable initiatives. A stable policy framework targeting climate change risks should be established that promotes standardized regulations for climate information disclosure to reduce uncertainties resulting from policy fluctuations. Additionally, a national-level climate information-sharing platform for enterprises should be created to integrate carbon emissions data and other relevant information. This would increase the information available to financial institutions and help reduce information asymmetry between these institutions and companies. From a long-term development perspective, the government can implement integrated policies that focus on financial optimization, green infrastructure, and technological support in ecologically vulnerable areas. By creating replicable models through pilot programs, the government can fundamentally enhance enterprises’ capabilities to address climate change risks.

Author Contributions

Conceptualization, R.L. and M.W.; methodology, R.L. and J.L.; software, R.L. and J.L.; formal analysis, M.W. and J.L.; writing—original draft preparation, J.L. and R.L.; writing—review and editing, R.L. and M.W.; supervision, M.W.; funding acquisition, R.L. All authors have read and agreed to the published version of the manuscript.

Funding

This research was funded by the 2024 Shandong Province Social Science Planning Research Project: Research on Pathways to Accelerate Comprehensive Green Transformation of Economic and Social Development in the Context of Further Deepening Reforms, grant number 24CXSXJ29, from Shandong Jinping Xi Thought on Socialism with Chinese Characteristics for a New Era Research Center.

Institutional Review Board Statement

Not applicable.

Informed Consent Statement

Not applicable.

Data Availability Statement

The data supporting the findings of this study are available on request from the corresponding author. The data are not publicly available due to privacy or ethical restrictions.

Conflicts of Interest

The authors declare no conflicts of interest. There is no professional or other personal interest of any nature or kind in any product, service, and/or company that could be construed as influencing the position presented in, or the review of, the manuscript entitled.

References

  1. The Global Risks Report 2024. World Economic Forum. 2024. Available online: https://www.weforum.org/publications/global-risks-report-2024/ (accessed on 1 November 2024).
  2. Bhatt, R.P. Consequences of Climate Change Impacts and Implications on Ecosystem and Biodiversity. Impacts of Developmental Projects and Mitigation Strategy in Nepal; In Climate Change in Asia and Africa: Examining the Biophysical and Social Consequences, and Society’s Responses; Tiefenbacher, J.P., Ed.; IntechOpen: London, UK, 2022; 253p. [Google Scholar]
  3. Qi, Y.; Zhang, H.X.; Shao, S. Valuing high temperature’s fiscal costs: Evidence from China. Econ. Anal. Policy 2024, 81, 134–152. [Google Scholar]
  4. Zhang, Z.N.; Chen, Y.L. Climate risk, corporate investment intention, and local fiscal revenue. Stat. Decis. 2024, 40, 156–160. [Google Scholar]
  5. Stroebel, J.; Wurgler, J. What do you think about climate finance? J. Financ. Econ. 2021, 142, 487–498. [Google Scholar]
  6. Yang, Z.H.; Li, D.C.; Chen, Y.T. Research on the “Green Swan” Risk in Financial Markets: Based on the Dual Perspectives of Physical Risk and Transition Risk. J. Manag. World 2024, 40, 47–67. [Google Scholar]
  7. Carney, M.; Breaking the Tragedy of the Horizon-Climate Change and Financial Stability. Speech Given Lloyd’s of London. 29 September 2015. Available online: https://www.bankofengland.co.uk/speech/2015/breaking-the-tragedy-of-the-horizon-climate-change-and-financial-stability/ (accessed on 1 November 2024).
  8. Tankov, P.; Tantet, A.; Climate Data for Physical Risk Assessment in Finance. SSRN. 2019. Available online: https://papers.ssrn.com/sol3/papers.cfm?abstract_id=3480156 (accessed on 1 November 2024).
  9. Xi, Y.; Huynh, A.N.Q.; Jiang, Y.S.; Hong, Y.R. Energy transition concern: Time-varying effect of climate policy uncertainty on renewables consumption. Technol. Forecast. Soc. Change 2023, 192, 122551. [Google Scholar]
  10. Baldauf, M.; Garlapp, L.; Yannelis, C. Does climate change affect real estate prices? Only if you believe in it. Rev. Financ. Stud. 2020, 33, 1256–1295. [Google Scholar]
  11. Bernstein, A.; Gustafson, M.T.; Lewis, R. Disaster on the horizon: The price effect of sea level rise. J. Financ. Econ. 2019, 134, 253–272. [Google Scholar]
  12. Giglio, S.; Maggiori, M.; Rao, K.; Stroebel, J.; Weber, A. Climate change and long-run discount rates: Evidence from real estate. Rev. Financ. Stud. 2021, 34, 3527–3571. [Google Scholar]
  13. Murfin, J.; Spiegel, M. Is the risk of sea level rise capitalized in residential real estate? Rev. Financ. Stud. 2020, 33, 1217–1255. [Google Scholar]
  14. Sautner, Z.; Van, L.L.; Vilkov, G.; Zhang, R.S. Firm-Level Climate Change Exposure. J. Financ. 2023, 78, 1449–1498. [Google Scholar]
  15. Abdesslem, R.B.; Chkir, I.; Saadi, S. Earning quality and climate risk: The case of European firms. Int. Rev. Financ. Anal. 2025, 102, 104133. [Google Scholar]
  16. Su, Z.F.; Deng, C.Z.; Feng, Y.F.; Bai, Y.L.; Xu, Z.K. Climate risks and corporate supply chain configuration: Evidence from China. Res. Int. Bus. Financ. 2025, 76, 102852. [Google Scholar]
  17. Dafermos, Y.; Nikolaidi, M.; Galanis, G. Climate change, financial stability and monetary policy. Ecol. Econ. 2018, 152, 219–234. [Google Scholar]
  18. Ho, K.; Wong, A. Effect of climate-related risk on the costs of bank loans: Evidence from syndicated loan markets in emerging economies. Emerg. Mark. Rev. 2023, 55, 100977. [Google Scholar]
  19. Griffin, P.; Lont, D.; Lubberink, M. Extreme high surface temperature events and equity-related physical climate risk. Weather Clim. Extrem. 2019, 26, 100220. [Google Scholar]
  20. Bourdeau-Brien, M.; Kryzanowski, L. Natural disasters and risk aversion. J. Econ. Behav. Organ. 2020, 177, 818–835. [Google Scholar]
  21. Painter, M. An inconvenient cost: The effects of climate change on municipal bonds. J. Financ. Econ. 2020, 135, 468–482. [Google Scholar]
  22. Iqbal, N.; Bouri, E.; Shahzad, S.J.H.; Alsagr, N. Asymmetric impacts of Chinese climate policy uncertainty on Chinese asset prices. Energy Econ. 2024, 133, 107518. [Google Scholar]
  23. Al Mamun, M.; Boubaker, S.; Nguyen, D.K. Green finance and decarbonization: Evidence from around the world. Financ. Res. Lett. 2022, 46, 102807. [Google Scholar]
  24. He, M.; Zhang, Y. Climate policy uncertainty and the stock return predictability of the oil industry. J. Int. Financ. Mark. Inst. Money 2022, 81, 101675. [Google Scholar]
  25. Chen, Z.; Zhang, L.; Weng, C. Does climate policy uncertainty affect Chinese stock market volatility? Int. Rev. Econ. Financ. 2023, 84, 369–381. [Google Scholar]
  26. Tedeschi, M.; Foglia, M.; Bouri, E.; Dai, P.F. How does climate policy uncertainty affect financial markets? Evidence from Europe. Econ. Lett. 2024, 234, 111443. [Google Scholar]
  27. Chen, G.J.; Chen, L.L.; Jin, H.; Zhao, X.Q. Climate Transition Risk and Macroeconomic Policy Regulation. Econ. Res. J. 2023, 58, 60–78. [Google Scholar]
  28. Chen, W.M.; Kang, J.N.; Han, M.S. Global environmental inequality: Evidence from embodied land and virtual water trade. Sci. Total Environ. 2021, 783, 146992. [Google Scholar] [PubMed]
  29. Zhou, M.T.; Yong, M. Climate risk and predictability of global stock market volatility. J. Int. Financ. Mark. Inst. Money 2025, 101, 102135. [Google Scholar]
  30. Chen, G.J.; Guo, J.R.; Zhao, X.Q. Research Progress on Climate Finance. Econ. Perspect. 2021, 2021, 131–145. [Google Scholar]
  31. Wu, X.; Bai, X.; Qi, H.Y.; Lu, L.X.; Yang, M.T.; Taghizadeh-hesary, F. The impact of climate change on banking systemic risk. Econ. Anal. Policy 2023, 78, 419–437. [Google Scholar]
  32. Battiston, S.; Dafermos, Y.; Monasterolo, I. Climate risks and financial stability. J. Financ. Stab. 2021, 54, 100867. [Google Scholar]
  33. Nordhaus, W.D. Optimal greenhouse-gas reductions and tax policy in the “DICE” model. Am. Econ. Rev. 1993, 83, 313–317. [Google Scholar]
  34. Tran, L.T.H.; Ho, T.; Ho, H.T.; Phung, N.D. Climate vulnerability and capital structure: Moderating effect of financial development, financial constraints, and 2015 Paris Agreement. Int. Rev. Econ. Financ. 2024, 96, 103711. [Google Scholar]
  35. Du, J.; Xue, X.Y.; Yang, Y. Does Corporate Climate Risk Affect the Cost of Equity?—Evidence from Textual Analysis with Machine Learning. Chin. Rev. Financ. Stud. 2023, 15, 19–46+125. [Google Scholar]
  36. Chen, Z.F.; Yin, M.M.; Zhou, M.L. Does environmental regulatory pressure affect corporate debt financing? Resour. Conserv. Recycl. 2022, 184, 106405. [Google Scholar]
  37. Blanco, I.; Martin-Flores, J.M.; Remesal, A. Climate shocks, institutional investors, and the information content of stock prices. J. Corp. Financ. 2024, 86, 102567. [Google Scholar]
  38. Ramelli, S.; Ossola, E.; Rancan, M. Stock price effects of climate activism: Evidence from the first Global Climate Strike. J. Corp. Financ. 2021, 69, 102018. [Google Scholar]
  39. Li, B.Y.; Zhang, J.W.; Shen, X.H. Is there a stock premium effect on climate change risk? Financ. Econ. 2024, 6, 31–47. [Google Scholar]
  40. Del Giudice, A.; Rigamonti, S.; Signori, A. Climate Change Risk and Green Bond Pricing. J. Empir. Financ. 2025, 82, 101616. [Google Scholar]
  41. Goodell, J.W.; Palma, A.; Paltrinieri, A.; Piserà, S. Firm-level climate change risk and corporate debt maturity. J. Int. Money Financ. 2025, 152, 103275. [Google Scholar]
  42. Francis, B.B.; Hasan, I.; Jiang, C.X.; Sharma, Z.; Zhu, Y. Climate Risks and Debt Structure. Br. Account. Rev. 2025, 101614. [Google Scholar] [CrossRef]
  43. Myers, S.C.; Majluf, N.S. Corporate financing and investment decisions when firms have information that investors do not have. J. Financ. Econ. 1984, 13, 187–221. [Google Scholar]
  44. Liu, J.W.; Deng, B.F.; Yu, B.T.; Ji, L. Corporate Awards and Debt Financing Capabilities—Evidence from A-share Listed Companies in China. Financ. Res. 2019, 5, 56–67. [Google Scholar]
  45. The People’s Bank of China. Statistical Report on the Incremental Scale of Social Financing in 2023. 2024. Available online: https://www.gov.cn/lianbo/bumen/202401/content_6925681.htm (accessed on 12 January 2024).
  46. He, F.; Ren, X.Z.; Wang, Y.R.; Lei, X.F. Climate risk and corporate bond credit spreads. J. Int. Money Financ. 2025, 154, 103297. [Google Scholar]
  47. Nguyen, D.D.; Ongena, S.; Qi, S.S.; Sila, V. Climate change risk and the cost of mortgage credit. Rev. Financ. 2022, 26, 1509–1549. [Google Scholar]
  48. Javadi, S.; Masum, A.A. The impact of climate change on the cost of bank loans. J. Corp. Financ. 2021, 69, 102019. [Google Scholar]
  49. Zhao, Y.S.; Liu, Y.X.; Dong, L.; Sun, Y.H.; Zhang, N. The effect of climate change on firms’ debt financing costs: Evidence from China. J. Clean. Prod. 2024, 434, 140018. [Google Scholar]
  50. Jiang, C.Y.; Li, Y.T.; Zhang, X.; Zhao, Y. Climate risk and corporate debt decision. J. Int. Money Financ. 2025, 151, 103261. [Google Scholar]
  51. Ginglinger, E.; Moreau, Q. Climate risk and capital structure. Manag. Sci. 2023, 69, 7492–7516. [Google Scholar]
  52. Song, W.; Xu, W.; Qu, W.; Gong, X. Climate risk exposure and debt concentration: Evidence from Chinese listed companies. Account. Financ. 2024, 64, 3361–3386. [Google Scholar]
  53. Zhou, X.Y.; Caldecott, B.; Shrimali, G.; Zhang, H.Y. An empirical analysis of climate and environmental policy risk, the cost of debt and financial institutions’ risk preferences. Energy Econ. 2025, 144, 108323. [Google Scholar]
  54. Jawadi, F.; Rozin, P.; Cheffou, A.I. Climate change uncertainty and corporate debt relationship: A quantile panel data analysis. J. Int. Money Financ. 2025, 154, 103320. [Google Scholar]
  55. Jiang, Y. Cost of equity, cost of debt, and corporate governance: A study on the differences in their impact. J. Manag. World 2009, 11, 144–155. [Google Scholar]
  56. Akhmadi, A.; Yunia, D.; Robiyanto, R. The role of profitability in the effect of company growth on the debt policy. Int. J. Financ. Res. 2020, 11, 267–274. [Google Scholar]
  57. Ben-Nasr, H.; Boubaker, S.; Sassi, S. Board reforms and debt choice. J. Corp. Financ. 2021, 69, 102009. [Google Scholar]
  58. Zhen, Y.H.; Zhang, Z.W.; Zhao, L. Board Supervision, Debt Level and Cost of Debt Financing: Evidence from Audit Committee Performance Disclosure. J. Nanjing Audit Univ. 2023, 20, 31–40. [Google Scholar]
  59. Li, L.; Dong, F.Y.; Liu, Y.F.; Huang, H.J.; Wang, S.Y. The effect of corporate governance on debt financing cost of listed companies. J. Syst. Sci. Complex. 2016, 29, 772–778. [Google Scholar]
  60. Liu, Z.Y.; Xie, Y.S.; Niu, Y.N. Energy Prices, Green Concern Index in Financial Markets and Climate Risks in Commercial Banks. Shanghai Financ. 2024, 4, 56–69. [Google Scholar]
  61. Wang, X.M.; Xia, H.T.; Li, J.W. Carbon Reduction Constraints, Transition Risks and Macro-prudential Policies. S. China Financ. 2023, 8, 22–40. [Google Scholar]
  62. An, Q.G.; Zheng, L.; Wang, S.H. Climate risk and banking stability in China: A dynamic analysis from the short-and long-term perspectives. Res. Int. Bus. Financ. 2025, 77, 102915. [Google Scholar]
  63. Covas, F.; Den Haan, W.J. The Role of Debt and Equity Finance Over the Business Cycle. Econ. J. 2012, 122, 1262–1286. [Google Scholar]
  64. Bordo, M.D.; Duca, J.V.; Koch, C. Economic policy uncertainty and the credit channel: Aggregate and bank level US evidence over several decades. J. Financ. Stab. 2016, 26, 90–106. [Google Scholar]
  65. Zhang, P.C.; Qi, J.Y. Carbon emission regulation and corporate financing constraints: A quasi-natural experiment based on China’s carbon emissions trading mechanism. J. Contemp. Account. Econ. 2025, 21, 100452. [Google Scholar]
  66. Xiao, J.; Zeng, P.; Li, D.W. Research on the Action Mechanism of Dual Environmental Regulation Leveraging Enterprise Environmental Performance from the Optimal Distinctiveness Perspective. Sci. Technol. Manag. Res. 2024, 44, 207–215. [Google Scholar]
  67. Zhang, Y.B.; Li, X. The impact of the green finance reform and innovation pilot zone on the green innovation—Evidence from China. Int. J. Environ. Res. Public Health 2022, 19, 7330. [Google Scholar]
  68. Du, M.Z.; Zhang, J.N.; Hou, Z.J. Decarbonization like China: How does green finance reform and innovation enhance carbon emission efficiency? J. Environ. Manag. 2025, 376, 124331. [Google Scholar]
  69. Neira, M.; Erguler, K.; Ahmady-Birgani, H.; Al-Hmoud, N.D.; Fears, R.; Gogos, C.; Hobbhahn, N.; Koliou, M.; Kostrikis, L.G.; Christophides, G.; et al. Climate change and human health in the Eastern Mediterranean and Middle East: Literature review, research priorities and policy suggestions. Environ. Res. 2023, 216, 114537. [Google Scholar]
  70. Mora, C.; McKenzie, T.; Gaw, I.M.; Dean, J.M.; von Hammerstein, H.; Knudson, T.A.; Setter, R.O.; Smith, C.Z.; Webster, K.M.; Patz, J.A.; et al. Over half of known human pathogenic diseases can be aggravated by climate change. Nat. Clim. Chang. 2022, 12, 869–875. [Google Scholar] [PubMed]
  71. Fussell, E. The Long-Term Recovery of New Orleans’ Population After Hurricane Katrina. Am. Behav. Sci. 2015, 59, 1231–1245. [Google Scholar]
  72. Hong, H.; Karolyi, G.A.; Scheinkman, J.A. Climate Finance. Rev. Financ. Stud. 2020, 33, 1011–1023. [Google Scholar]
  73. Sen, S.; Schickfus, M.-T.V. Climate policy, stranded assets, and investors’ expectations. J. Environ. Econ. Manag. 2020, 100, 102277. [Google Scholar]
  74. Wei, C.H.; Zhang, Y.J.; Lan, M.H.; Su, Z.; Du, H.R.; Wang, K. How could we benefit from a low-carbon economy? Evidence from Chinese regional labor markets. Struct. Chang. Econ. Dyn. 2024, 71, 523–537. [Google Scholar]
  75. Ding, Y.G.; Deng, Q.X. Impact of Climate Risks on China’s Agricultural Economic Development: Heterogeneity and Mechanism Analyses. J. Financ. Res. 2022, 507, 111–131. [Google Scholar]
  76. Gordeev, R.V.; Pyzhev, A.I.; Zander, E.V. Does Climate Change Influence Russian Agriculture? Evidence from Panel Data Analysis. Sustainability 2022, 14, 718. [Google Scholar] [CrossRef]
  77. Xiong, Y.C.; Han, R.Y.; Ma, X.X.; Lam, H.K.S.; Lyons, A. Mitigating the negative financial effects of extreme weather events through supply chain analytics. Int. J. Prod. Econ. 2025, 279, 109441. [Google Scholar]
  78. Pankratz, N.M.C.; Schiller, C.M. Climate change and adaptation in global supply-chain networks. Rev. Financ. Stud. 2024, 37, 1729–1777. [Google Scholar]
  79. Cao, Z.F.; Chen, S.X.L.; Dong, T.; Lee, E. Climate Change Uncertainty and Supply Chain Financing. Br. Account. Rev. 2024, 101423. [Google Scholar] [CrossRef]
  80. Tao, R. Does Climate Risk Induce Corporate Tax Avoidance? Financ. Econ. 2024, 1, 91–102. [Google Scholar]
  81. Liu, X.Y.; Wang, D.L.; Han, W.Q.; Wu, S.R. Does the subsidiary’s climate risk matter? Evidence from the stock price crash. Econ. Lett. 2024, 244, 111952. [Google Scholar]
  82. Dong, X.Y.; Liu, L. Climate risk and future stock price crash: Evidence from U.S. firms. J. Clim. Financ. 2023, 3, 100012. [Google Scholar]
  83. Ding, R.; Liu, M.Z.; Wang, T.T.; Wu, Z.Y. The impact of climate risk on earnings management: International evidence. J. Account. Public Policy 2021, 40, 106818. [Google Scholar]
  84. Kim, I.; Lee, S.; Ryou, J. Does climate risk influence analyst forecast accuracy? J. Financ. Stab. 2024, 75, 101345. [Google Scholar]
  85. Teece, D.J.; Pisano, G.; Shuen, A. Dynamic capabilities and strategic management. Strateg. Manag. J. 1997, 18, 509–533. [Google Scholar]
  86. Zhao, Q.Z.; Guo, Z.Q. Digital Transformation Empowering New Quality Productivity Development of Manufacturing Industry in China—Evidence from Resource-Based and Dynamic Capability Theory. J. Ind. Technol. Econ. 2025, 44, 12–24. [Google Scholar]
  87. Gao, H.; Zhou, M.S. How digital transformation enhances enterprise resilience—Based on dynamic capability theory and enterprise technology application scenario. Sci. Manag. Res. 2024, 42, 53–65. [Google Scholar]
  88. Mei, D.L.; Long, Y. A Study on the Relationship Among Entrepreneurial Competence, Innovation Types and Financing Choices in High-Tech Companies. Manag. Rev. 2012, 24, 67–74. [Google Scholar]
  89. Baum, S.D. Climate change, uncertainty, and global catastrophic risk. Futures 2024, 162, 103432. [Google Scholar]
  90. Addoum, J.M.; Ng, D.T.; Ortiz-Bobea, A. Temperature Shocks and Establishment Sales. Rev. Financ. Stud. 2020, 33, 1331–1366. [Google Scholar]
  91. Huynh, T.D.; Nguyen, T.H.; Truong, C. Climate risk: The price of drought. J. Corp. Financ. 2020, 65, 101750. [Google Scholar]
  92. Nakano, K. Risk assessment for adaptation to climate change in the international supply chain. J. Clean. Prod. 2021, 319, 128785. [Google Scholar]
  93. Somanathan, E.; Somanathan, R.; Sudarshan, A.; Tewari, M. The Impact of Temperature on Productivity and Labor Supply: Evidence from Indian Manufacturing. J. Political Econ. 2021, 129, 1797–1827. [Google Scholar]
  94. Peters, G.P.; Andrew, R.M.; Canadell, J.G.; Fuss, S.; Jackson, R.B.; Korsbakken, J.I.; Le Quéré, C.; Nakicenovic, N. Key indicators to track current progress and future ambition of the Paris Agreement. Nat. Clim. Chang. 2017, 7, 118–122. [Google Scholar]
  95. Jing, R.F.; Liu, R.Z. The impact of green finance on persistence of green innovation at firm-level: A moderating perspective based on environmental regulation intensity. Financ. Res. Lett. 2024, 62, 105274. [Google Scholar]
  96. Zhao, X.; Benkraiem, R.; Abedin, M.Z.; Zhou, S.L. The charm of green finance: Can green finance reduce corporate carbon emissions? Energy Econ. 2024, 134, 107574. [Google Scholar]
  97. Lv, M.C.; Bai, M.Y. Evaluation of China’s carbon emission trading policy from corporate innovation. Financ. Res. Lett. 2021, 39, 101565. [Google Scholar]
  98. Zhu, B.; Hou, R. Carbon risk and dividend policy: Evidence from China. Int. Rev. Financ. Anal. 2022, 84, 102360. [Google Scholar]
  99. Lewandowski, S. Corporate carbon and financial performance: The role of emission reductions. Bus. Strategy Environ. 2017, 26, 1196–1211. [Google Scholar]
  100. Li, Y.W.; Gong, M.F.; Zhang, X.Y.; Koh, L. The impact of environmental, social, and governance disclosure on firm value: The role of CEO power. Br. Account. Rev. 2018, 50, 60–75. [Google Scholar]
  101. Su, X.; Qiao, R.Y.; Xu, S.Y. Impact of green finance on carbon emissions and spatial spillover effects: Empirical evidence from China. J. Clean. Prod. 2024, 457, 142362. [Google Scholar]
  102. Li, Z.H.; Liao, G.K.; Wang, Z.Z.; Huang, Z.H. Green loan and subsidy for promoting clean production innovation. J. Clean. Prod. 2018, 187, 421–431. [Google Scholar]
  103. Xu, X.K.; Li, J.S. Asymmetric impacts of the policy and development of green credit on the debt financing cost and maturity of different types of enterprises in China. J. Clean. Prod. 2020, 264, 121574. [Google Scholar]
  104. He, Y.; Liu, R.Z. The impact of the level of green finance development on corporate debt financing capacity. Financ. Res. Lett. 2023, 52, 103552. [Google Scholar]
  105. Li, Q.; Shan, H.Y.; Tang, Y.H.; Yao, V. Corporate climate risk: Measurements and responses. Rev. Financ. Stud. 2024, 37, 1778–1830. [Google Scholar]
  106. Arian, A.G.; Sands, J. Do corporate carbon emissions affect risk and capital costs? Int. Rev. Econ. Financ. 2024, 93, 1363–1377. [Google Scholar]
  107. Zhang, Y.H.; Zhao, Y.; Zheng, Q.A. Managerial climate attention and corporate carbon emissions: Sincerity or disguise? Int. Rev. Econ. Financ. 2024, 94, 103421. [Google Scholar]
  108. Luo, Z.X.; Zhou, X.L. Environmental courts, environmental investment, and corporate carbon emissions. Financ. Res. Lett. 2025, 75, 106859. [Google Scholar]
  109. Shen, H.T.; Huang, N. Will the Carbon Emission Trading Scheme Improve Firm Value? Financ. Trade Econ. 2019, 40, 144–161. [Google Scholar]
  110. Chen, Z.B.; Wang, S.Y. Research on the Impact of Product Market Competition on Corporate Cash Flow Risk: A Dual Consideration Based on Industry Competition Level and Corporate Competitive Position. China Ind. Econ. 2015, 3, 96–108. [Google Scholar]
  111. Abinzano, I.; Gonzalez-Urteaga, A.; Muga, L.; Sanchez, S. Performance of default-risk measures: The sample matters. J. Bank. Financ. 2020, 120, 105959. [Google Scholar]
  112. Li, X.X.; Kong, M.Q. The Impact of Digital Transformation on Organizational Resilience—Moderating Effects Based on Environmental Uncertainty. J. Jilin Bus. Technol. Coll. 2023, 39, 49–55. [Google Scholar]
  113. Cai, Y.B.; Tan, X.Y.; Fang, W.B.; Nahar, S.; Wang, F.Y. Digital inclusive finance and corporate debt financing: Empirical evidence from China. Econ. Anal. Policy 2025, 86, 494–509. [Google Scholar]
  114. Fard, A.; Javadi, S.; Kim, I. Environmental regulation and the cost of bank loans: International evidence. J. Financ. Stab. 2020, 51, 100797. [Google Scholar]
  115. Bengio, Y.; Ducharme, R.; Vincent, P.; Jauvin, C. A neural probabilistic language model. J. Mach. Learn. Res. 2003, 3, 1137–1155. [Google Scholar]
  116. LeCun, Y.; Bengio, Y.; Hinton, G. Deep learning. Nature 2015, 521, 436–444. [Google Scholar] [PubMed]
  117. Hu, N.; Xue, F.J.; Wang, H.N. Does Managerial Myopia Affect Long-Term Investment? Based on Text Analysis and Machine Learning. Manag. World 2021, 37, 139–156+11+19–21. [Google Scholar]
  118. Guo, K.; Ji, Q.; Zhang, D.Y. A dataset to measure global climate physical risk. Data Brief 2024, 54, 110502. [Google Scholar] [PubMed]
  119. Zheng, J.; Lin, Z.G.; Peng, L. Monetary Policy, Internal Quality Control and Cost of Debt Financing. Contemp. Financ. Econ. 2013, 9, 118–129. [Google Scholar]
  120. Cai, S.X.; Ni, X.R. Administrative monopoly regulation and the cost of debt financing: Evidence from China. Pac. Basin Financ. J. 2025, 92, 102777. [Google Scholar]
  121. Nguyen, H.; Pham, A.V.; Pham, M.D.M.; Pham, M.H. Climate change and corporate credit worthiness: International evidence. Glob. Financ. J. 2025, 64, 101073. [Google Scholar]
  122. Chen, Z.; Chen, X.G.; Deng, L. Does Quality of Internal Control Affect Bond Contracts? Account. Res. 2023, 6, 150–166. [Google Scholar]
  123. Shen, H.H.; Yu, P.; Wu, L.S. State Ownership, Environment Uncertainty and Investment Efficiency. Econ. Res. J. 2012, 47, 113–126. [Google Scholar]
Figure 1. The framework of this study.
Sustainability 17 06276 g001
Table 1. Vocabulary set for climate change risk.
Types of RiskVocabulary Set
Severe RisksDisasters, Earthquakes, Typhoons, Tsunamis, Droughts and Floods, Extremes, Adverse Conditions, Urban Flooding, Strong Winds, Dust Storms, Hurricanes, Frost, Water Disasters, Storms, Mudslides, Landslides, Ice Jam, Snow Disasters, Drought Disasters, Flooding, Heavy Rain, Tornadoes, Hail, Flooding Events, Rain and Snow, Freezing, Heavy Snow, Freeze Damage, Drought Conditions, Drought Severity, Intense Rainfall, Floods, Severe Cold, Wind Erosion.
Chronic RisksClimate, Weather, Humidity, Water Temperature, Cooling, Cold Weather, Air Temperature, Precipitation, Temperature, Rainwater, Rainy Season, Rain Conditions, Precipitation Levels, Overcast Weather, Frequent Rain, Extreme Cold, Winter, Flood Season, High Temperatures, Water Conditions, Water Levels, Light Exposure, Water Scarcity, High Altitude Cold, Cold Waves, Land Subsidence, Groundwater, Flood Conditions, Surface Water, and Budding Water.
Transaction RisksEnergy Conservation, Energy, Clean Energy, Ecology, Environment, Transition, Solar Energy, Upgrading, Circular Economy, Utilization Rate, Nuclear Power, Wind Power, Natural Gas, Efficiency Improvement, Fuel Oil, Efficiency, Renewable Energy, Emission Reduction, Environmental Protection, Green Initiatives, Low Carbon, Consumption Reduction, Fuel, Water Conservation, Photovoltaics, High Efficiency, Retrofitting, Fuel Consumption, Electricity Consumption, Energy Consumption, Wind Energy, Photovoltaics, Performance, and Intensive Use.
Table 2. Definitions of variables.
ClassificationVariableSymbolDescription
Dependent variableDebt financing scaleDebt(Long term borrowings due within one year + short-term borrowings + non current liabilities)/Total assets at the end of the period
Debt financing costCost(Interest expenses + borrowing costs + other financing expenses)/(Long term borrowings due within one year + short-term borrowings + non current liabilities)
Explanatory
variable
Climate change riskCCR(Frequency of word occurrence and/or total word count in annual report − stop words) × 100
Control variableThe size of the enterpriseSizeLogarithmic calculation of total assets of the enterprise
Debt-to-asset ratioLevTotal liabilities at year-end/Total assets at year-end
Return on equityROENet profit/average balance of owner’s equity
Cash flowCashflowNet cash flow from operating activities/Total assets
Capital intensity shareholdersFIXEDNet fixed assets/total assets
Independent director sizeIndepIndependent directors divided by the number of directors
Concentration of equityTop1Shareholding of the largest shareholder/Total number of shares
Tobin’s Q valueTobinQ(circulating stock market value + number of non circulating shares × net assets per share + book value of liabilities)/total assets
Time on the marketListAgeln(year − IPO year +1)
Dummy variableIndIndustry
Dummy variableYearYear
Table 3. Descriptive statistics.
VariableNMean ValueStandard DeviationMinimum ValueMedianMaximum Value
Debt22,7770.1880.1540.0000.1580.641
Cost22,7770.0280.0300.0000.0260.152
CCR22,7770.1940.1450.0140.1530.768
Size22,77722.3741.29819.82122.18726.163
Lev22,7770.4240.1990.0500.4170.894
ROE22,7770.0570.139−0.6160.0690.368
Cashflow22,7770.0490.068−0.1660.0480.248
FIXED22,7770.1980.1500.0020.1670.698
Indep22,77737.8705.40633.33036.36057.140
Top122,7770.3300.1460.0860.3060.746
TobinQ22,7771.9891.2530.8541.5938.321
ListAge22,7772.2180.7960.6932.3033.332
Table 4. Baseline regression results.
Variable12
DebtCost
CCR−0.031 ***0.004 ***
(0.005)(0.001)
Size0.011 ***−0.002 ***
(0.001)(0.000)
Lev0.526 ***0.018 ***
(0.005)(0.001)
ROE−0.057 ***−0.029 ***
(0.007)(0.002)
Cashflow−0.210 ***0.035 ***
(0.011)(0.003)
FLXED0.196 ***−0.002 **
(0.005)(0.001)
Indep0.000 ***0.000 **
(0.000)(0.000)
Top1−0.082 ***−0.012 ***
(0.005)(0.001)
TobinQ−0.004 ***−0.000 ***
(0.001)(0.000)
ListAge−0.008 ***0.003 ***
(0.001)(0.000)
_cons−0.265 ***0.055 ***
(0.015)(0.004)
IndustryYesYes
YearYesYes
r2_a0.6480.351
N22,77722,777
Note: *** p < 0.01, ** p < 0.05.
Table 5. Robustness test results 1.
Variable123456
Replace Explanatory Variables1Replace Explanatory Variables1Replace Explanatory Variables2Replace Explanatory Variables2Replace the Explained VariablesReplace the Explained Variables
DebtCostDebtCostDebt1Cost1
CCR −0.133 ***0.003 ***
(0.048)(0.001)
CCR1−0.010 ***0.003 ***
(0.004)(0.001)
CCR2 −0.018 **0.004 **
(0.008)(0.002)
Control variableYesYesYesYesYesYes
_cons−0.264 ***0.055 ***−0.277 ***0.057 ***−6.413 ***0.007 **
(0.015)(0.004)(0.018)(0.004)(0.171)(0.004)
YearYesYesYesYesYesYes
IndustryYesYesYesYesYesYes
City
r2_a0.6470.3510.6470.3570.8050.316
N22,68322,68316,31616,31622,77722,777
Note: *** p < 0.01, ** p < 0.05.
Table 6. Robustness test results 2.
Variable12345678
Increase Control Variables at the Corporate Governance LevelIncrease Control Variables at the Corporate Governance LevelExcluding the Impact of the EpidemicExcluding the Impact of the EpidemicControl for City Fixed EffectsControl for City Fixed EffectsSelect Manufacturing SubsamplesSelect Manufacturing Subsamples
DebtCostDebtCostDebtCostDebtCost
CCR−0.031 ***0.004 ***−0.029 ***0.003 **−0.027 ***0.003 ***−0.046 ***0.004 ***
(0.005)(0.001)(0.005)(0.001)(0.005)(0.001)(0.006)(0.001)
FinBack0.005 ***0.001 *
(0.001)(0.000)
Control variableYesYesYesYesYesYesYesYes
_cons−0.265 ***0.054 ***−0.270 ***0.052 ***−0.271 ***0.063 ***−0.230 ***0.045 ***
(0.015)(0.004)(0.017)(0.004)(0.016)(0.004)(0.019)(0.005)
YearYesYesYesYesYesYesYesYes
IndustryYesYesYesYesYesYesYesYes
City YesYes
r2_a0.6480.3510.6490.3820.6730.3700.6440.334
N22,74322,74319,60119,60122,75822,75815,18315,183
Note: *** p < 0.01, * p < 0.1.
Table 7. Endogeneity test results for lagged explanatory variables.
Variable12
DebtCost
LCCR−0.028 ***0.005 ***
(0.005)(0.001)
Size0.011 ***−0.002 ***
(0.001)(0.000)
Lev0.529 ***0.018 ***
(0.005)(0.001)
ROE−0.060 ***−0.029 ***
(0.008)(0.002)
Cashflow−0.209 ***0.036 ***
(0.012)(0.003)
FLXED0.192 ***−0.003 ***
(0.006)(0.001)
Indep0.000 ***0.000 **
(0.000)(0.000)
Top1−0.081 ***−0.011 ***
(0.005)(0.001)
TobinQ−0.003 ***−0.000 *
(0.001)(0.000)
ListAge−0.008 ***0.003 ***
(0.001)(0.000)
_cons−0.262 ***0.049 ***
(0.017)(0.004)
IndustryYesYes
YearYesYes
r2_a0.6510.379
N18,84918,849
Note: *** p < 0.01, ** p < 0.05, * p < 0.1.
Table 8. Endogeneity test results for instrumental variable.
Variable123
CCRDebtCost
IV0.001 ***
(0.000)
CCR −0.480 ***0.056 ***
(0.082)(0.022)
Size0.021 ***0.020 ***−0.004 ***
(0.001)(0.002)(0.001)
Lev0.062 ***0.541 ***0.007 ***
(0.006)(0.007)(0.002)
ROE0.057 ***−0.029 ***−0.035 ***
(0.007)(0.008)(0.002)
Cashflow−0.044 ***−0.200 ***0.044 ***
(0.015)(0.015)(0.004)
FLXED0.100 ***0.245 ***−0.010 ***
(0.009)(0.011)(0.003)
Indep−0.001 ***−0.0000.000 **
(0.000)(0.000)(0.000)
Top10.022 ***−0.066 ***−0.014 ***
(0.007)(0.006)(0.002)
TobinQ−0.007 ***−0.007 ***−0.000
(0.001)(0.001)(0.000)
ListAge−0.004 ***−0.007 ***0.002 ***
(0.001)(0.001)(0.000)
_cons−0.316 ***−0.382 ***0.098 ***
(0.023)(0.046)(0.012)
IndustryYesYesYes
YearYesYesYes
r2_a0.3240.5150.046
N16,46116,46116,461
Anderson canon. corr. LM statistic: 111.383
Chi-sq(1) p-value = 0.0000
Cragg–Donald Wald F-statistic: 111.869
Note: *** p < 0.01, ** p < 0.05.
Table 9. Endogeneity rest results for PSM.
Variable1234
Before MatchingAfter MatchingBefore MatchingAfter Matching
DebtDebtCostCost
CCR−0.031 ***−0.030 ***0.004 ***0.004 ***
(0.005)(0.005)(0.001)(0.001)
Size0.011 ***0.010 ***−0.002 ***−0.002 ***
(0.001)(0.001)(0.000)(0.000)
Lev0.526 ***0.552 ***0.018 ***0.017 ***
(0.005)(0.005)(0.001)(0.001)
ROE−0.057 ***−0.064 ***−0.029 ***−0.026 ***
(0.007)(0.008)(0.002)(0.002)
Cashflow−0.210 ***−0.205 ***0.035 ***0.033 ***
(0.011)(0.013)(0.003)(0.004)
FLXED0.196 ***0.203 ***−0.002 **0.000
(0.005)(0.006)(0.001)(0.001)
Indep0.000 ***0.000 **0.000 **0.000
(0.000)(0.000)(0.000)(0.000)
Top1−0.082 ***−0.089 ***−0.012 ***−0.011 ***
(0.005)(0.005)(0.001)(0.001)
TobinQ−0.004 ***−0.003 ***−0.000 ***−0.000
(0.001)(0.001)(0.000)(0.000)
ListAge−0.008 ***−0.008 ***0.003 ***0.003 ***
(0.001)(0.001)(0.000)(0.000)
_cons−0.265 ***−0.237 ***0.055 ***0.053 ***
(0.015)(0.017)(0.004)(0.004)
IndustryYesYesYesYes
YearYesYesYesYes
r2_a0.6480.6580.3510.366
N22,77717,07522,77717,075
Note: *** p < 0.01, ** p < 0.05.
Table 10. Moderating effect of carbon emission test results.
Variable12
DebtCost
CCR−0.032 ***0.004 ***
(0.006)(0.001)
Carbon−0.005 **−0.000 ***
(0.002)(0.000)
CCR × Carbon−0.029 **0.001 ***
(0.012)(0.000)
Size0.012 ***−0.002 ***
(0.001)(0.000)
Lev0.523 ***0.020 ***
(0.005)(0.001)
ROE−0.060 ***−0.028 ***
(0.008)(0.002)
Cashflow−0.216 ***0.032 ***
(0.013)(0.004)
FLXED0.184 ***0.000
(0.007)(0.001)
Indep0.000 **0.000 **
(0.000)(0.000)
Top1−0.083 ***−0.011 ***
(0.005)(0.001)
TobinQ−0.003 ***−0.000
(0.001)(0.000)
ListAge−0.007 ***0.003 ***
(0.001)(0.000)
_cons−0.278 ***0.048 ***
(0.018)(0.005)
IndustryYesYes
YearYesYes
r2_a0.6480.343
N16,20916,209
Note: *** p < 0.01, ** p < 0.05.
Table 11. Results of the mechanism analysis.
Variable123
PCMZResilience
CCR−0.011 **−0.617 ***−0.019 ***
(0.005)(0.124)(0.004)
Control variableYesYesYes
_cons−0.206 ***−5.133 ***0.090 ***
(0.017)(0.492)(0.015)
YearYesYesYes
IndustryYesYesYes
R20.4540.7030.455
N22,77722,77722,777
Note: *** p < 0.01, ** p < 0.05.
Table 12. Heterogeneity analysis results for ownership and internal control quality.
VariableNon-State-Owned EnterpriseState-Owned EnterpriseNon-State-Owned EnterpriseState-Owned EnterpriseLow-Level Internal Control QualityHigh-Level Internal Control QualityLow-Level Internal Control QualityHigh-Level Internal Control Quality
12345678
DebtDebtCostCostDebtDebtCostCost
CCR−0.038 ***−0.0150.004 ***0.002−0.034 ***−0.030 ***0.005 ***0.002
(0.006)(0.009)(0.002)(0.002)(0.007)(0.007)(0.002)(0.002)
Control variableYesYesYesYesYesYesYesYes
_cons−0.345 ***−0.209 ***0.060 ***0.036 ***−0.361 ***−0.255 ***0.064 ***0.040 ***
(0.020)(0.025)(0.006)(0.006)(0.024)(0.020)(0.007)(0.005)
YearYesYesYesYesYesYesYesYes
IndustryYesYesYesYesYesYesYesYes
r2_a0.6400.6500.3340.4150.6770.6240.3560.338
N14,938783814,938783811,38711,39011,38711,390
(1) (2) p-Value > F(43, 22,691) = 0.0000
(3) (4) p-Value > F(43, 22,691) = 0.0000
(5) (6) p-Value > F(43, 22,691) = 0.0000
(7) (8) p-Value > F(43, 22,691) = 0.0000
Note: *** p < 0.01.
Table 13. Heterogeneity analysis results for regional financial development and environmental uncertainty.
VariableLow-Level Regional Financial DevelopmentHigh-Level Regional Financial DevelopmentLow-Level Regional Financial DevelopmentHigh-Level regional Financial DevelopmentLow-Level Environmental UncertaintyHigh-Level Environmental Uncertainty Low-Level Environmental UncertaintyHigh-Level Environmental Uncertainty
12345678
DebtDebtCostCostDebtDebtCostCost
CCR−0.022 ***−0.038 ***0.004 **0.004 **−0.016 *−0.039 ***0.0020.004 ***
(0.008)(0.007)(0.002)(0.002)(0.008)(0.006)(0.002)(0.001)
Control variableYesYesYesYesYesYesYesYes
_cons−0.269 ***−0.261 ***0.054 ***0.055 ***−0.207 ***−0.303 ***0.036 ***0.065 ***
(0.024)(0.020)(0.006)(0.005)(0.023)(0.021)(0.006)(0.005)
YearYesYesYesYesYesYesYesYes
IndustryYesYesYesYesYesYesYesYes
r2_a0.6320.6640.3600.3460.6340.6620.3730.344
N10,06812,70910,06812,709904213,735904213,735
(1) (2) p-Value > F(43, 22,691) = 0.0000(5) (6) p-Value > F(43, 22,691) = 0.0000
(3) (4) p-Value > F(43, 22,691) = 0.0399(7) (8) p-Value > F(43, 22,691) = 0.0000
Note: *** p < 0.01, ** p < 0.05, * p < 0.1.
Disclaimer/Publisher’s Note: The statements, opinions and data contained in all publications are solely those of the individual author(s) and contributor(s) and not of MDPI and/or the editor(s). MDPI and/or the editor(s) disclaim responsibility for any injury to people or property resulting from any ideas, methods, instructions or products referred to in the content.

