1. Introduction
The rapid growth of digital platforms has fundamentally transformed market structures across industries. Platform markets, characterized by their two-sided nature, create value by facilitating interactions between distinct user groups—content providers on one side and consumers on the other [
1,
2]. These markets exhibit unique dynamics where platforms act as gatekeepers, controlling access and setting terms for both sides [
3]. Understanding how power dynamics evolve in these markets has become crucial for both theory and policy.
A particularly intriguing phenomenon emerges when platform and content markets evolve asymmetrically. While traditional economic theory suggests that increased competition should strengthen firms’ bargaining positions, we observe the opposite in many platform-mediated markets. Content providers face declining bargaining power precisely when competition among them intensifies, while platforms consolidate their market position. This paradox challenges conventional understanding and demands new theoretical frameworks.
The Korean home shopping industry provides an exceptional case for examining these dynamics. Home shopping channels, which broadcast product demonstrations 24 h daily, depend entirely on cable TV and IPTV platforms for distribution to consumers. This complete dependence creates a pure platform–content provider relationship without alternative distribution channels. The industry has undergone remarkable transformation between 2015 and 2023, with transmission fees—payments from content providers to platforms—increasing from 41.15% to 68.72% of revenue [
4].
This fee increase coincides with divergent market structures: platform markets consolidated with the Herfindahl–Hirschman Index (HHI) have risen from 1390 to 2154, while content markets fragmented with HHI have declined from 1797 to 1118. The simultaneous occurrence of platform consolidation and content fragmentation, which we term “asymmetric market evolution”, fundamentally alters bargaining dynamics in ways that existing two-sided market theories do not fully capture [
5,
6].
This study aims to (1) identify the mechanisms driving fee increases under asymmetric market evolution; (2) determine whether critical thresholds exist for sustainable business models; (3) analyze how different firms adapt to structural changes; and (4) examine the role of external shocks in accelerating these dynamics.
We analyze comprehensive panel data from all 12 licensed home shopping companies operating during our study period (11 companies in 2015, expanding to 12 from 2016 with SK Stoa’s market entry), yielding 104 firm-year observations after outlier removal. Our empirical strategy employs Hansen’s threshold regression to identify structural breaks, instrumental variable analysis to address endogeneity concerns, and fixed-effects models to control unobserved heterogeneity.
Our findings reveal several important insights. First, platform concentration shows near-perfect correlation (0.972) with transmission fees, demonstrating that competitive forces among content providers cannot constrain platform power. Second, we identify a critical threshold at 62.2% transmission fees, beyond which traditional business models become unviable. Third, the fee–profitability relationship underwent a structural reversal, shifting from negative to positive correlation, indicating fees’ evolution from cost burdens to selection mechanisms. Fourth, firms pursue divergent strategies “profitable shrinkage” versus “volume defense”—based on their position relative to the threshold.
This research contributes to literature in several ways. We extend two-sided market theory by introducing asymmetric market evolution as a distinct source of platform power. We provide empirical evidence of threshold effects in platform fee structures. We document heterogeneous firm adaptation strategies under extreme platform dominance. Finally, we offer insights for competition policy in platform markets.
The remainder of this paper is organized as follows.
Section 2 reviews relevant literature and develops our theoretical framework.
Section 3 describes the institutional context, data, and methodology.
Section 4 presents empirical results.
Section 5 discusses theoretical and practical implications.
Section 6 concludes with policy recommendations.
2. Literature Review and Theoretical Development
2.1. Two-Sided Markets and Platform Economics
The theoretical foundation for understanding platform markets originates from the seminal work of Rochet and Tirole [
1,
2], who demonstrated that platforms create value by facilitating interactions between two distinct user groups. Their key insight—that the price structure matters beyond the price level—fundamentally distinguishes platform markets from traditional vertical relationships. In platform markets, the division of fees between sides affects transaction volume, as each side’s participation depends on the other side’s presence. This interdependence creates complex pricing dynamics where a platform charging ten dollars total might generate entirely different outcomes depending on whether the split is seven–three or five–five between the two sides [
3].
Armstrong [
3] advanced this framework by analyzing “competitive bottlenecks”, where one side single homes while the other multi-homes. This asymmetric participation creates fundamentally unequal bargaining positions. In our context, home shopping channels must negotiate with each platform separately to reach that platform’s exclusive subscriber base, while consumers typically subscribe to only one platform. Recent theoretical advances by Tan and Zhou [
6] demonstrate how this asymmetry can paradoxically strengthen platform power even as competition increases on the content side. Their model shows that more content providers competing for platform access enhances the platform’s ability to extract rents, as each provider’s individual bargaining position weakens.
Recent developments in platform theory have expanded our understanding significantly. Peitz [
7] provides a comprehensive synthesis of two-sided platform economics, emphasizing how non-price strategies—including platform design, data policies, and algorithmic recommendations—complement traditional pricing mechanisms to extract value. This multidimensional approach to platform strategy helps explain why simple fee comparisons across industries may understate true platform power.
The pricing implications of platform economics have been formalized by Weyl [
5], who developed a general theory showing how optimal platform pricing depends on demand elasticities and cross-side externalities. His framework demonstrates that platforms often find it optimal to subsidize one side while extracting maximum rents from the other, with the rent extraction typically targeting the side with more inelastic demand or greater dependence on platform access. Building on this foundation, Peitz and Sato [
8] analyze asymmetric platform oligopoly, showing how platforms strategically differentiate their fee structures based on the heterogeneity of content providers—a pattern clear in our Korean home shopping data where fees range from 41% to 88%.
Recent extensions by Jullien and Sand-Zantman [
9] provide a comprehensive framework for understanding platform regulation failures. They emphasize that platform power emerges not merely from market share but from the unique ability to control access between sides. This control becomes particularly potent when platforms implement contractual restrictions such as exclusivity clauses or anti-steering provisions that effectively prevent multi-homing, as analyzed by Belleflamme and Peitz [
10]. The regulatory challenges are further complicated by what Heidhues et al. [
11] term “digital ecosystems”, where platforms leverage dominance in one market to create interconnected networks of services that collectively enhance market power beyond what traditional concentration measures would suggest.
2.2. Platform Power and Market Concentration
The sources and consequences of platform power have evolved substantially beyond traditional network effects. While early work by Katz and Shapiro [
12] established how network effects create natural tendencies toward market concentration, and Church and Gandal [
13] demonstrated how these effects interact with switching costs to entrench dominant platforms, recent scholarship identifies additional self-reinforcing mechanisms that create unprecedented market power.
Cabral et al. [
14] synthesize four interconnected sources of platform dominance: direct and indirect network effects that increase value with scale, switching costs that lock in users, data advantages that improve service quality and targeting, and behavioral biases that default users toward incumbent platforms. The European Commission’s comprehensive analysis [
15] adds two critical dimensions: ecosystem envelopment, where platforms leverage dominance in one market to enter adjacent markets, and “kill zones”, where the mere threat of platform entry deters innovation and investment.
Recent theoretical work has formalized these intuitions. Choi and Jeon [
16] examine platform design biases in ad-funded two-sided markets, showing how platforms can manipulate content visibility to maximize advertising revenue while appearing neutral. This subtle form of bias represents a new dimension of platform power that operates through algorithmic design rather than explicit pricing. Additionally, working papers by Johnson, Rhodes, and Wildenbeest [
17] and Ali, Lewis, and Vasserman [
18] explore algorithmic pricing coordination and personalized pricing strategies, though their final publication status requires confirmation.
Empirical evidence reveals increasingly sophisticated exercises of platform power. Beyond the well-documented cases of Amazon’s strategic entry into profitable product categories using merchant data [
19] and Google’s innovation-dampening effect on app developers [
20], recent studies reveal systemic patterns across industries. Condorelli and Padilla [
21] analyze platform envelopment strategies, showing how dominant platforms systematically identify and enter complementary markets to strengthen ecosystem control. Their analysis of over 200 platform market entries reveals a consistent pattern: platforms first establish dominance in a core market, then leverage data and user relationships to enter adjacent markets with built-in advantages.
The innovation implications of platform power have been explored by Jeon, Lefouili, and Madio [
22], who analyze how platform liability rules affect innovation incentives. They find that stricter liability can paradoxically reduce innovation by making platforms overly cautious about hosting new content, illustrating the complex trade-offs in platform regulation. This work extends earlier insights by showing how legal frameworks interact with market structure to shape innovation outcomes.
De Cornière and Taylor [
23] demonstrate how data advantages create insurmountable entry barriers, as incumbent platforms use superior data to offer targeted services that new entrants cannot match even with superior technology. These mechanisms operate simultaneously and reinforce each other, creating what Parker and Petropoulos [
24] term “super-dominant” platforms that become virtually impossible to challenge.
The bargaining implications of platform power require fundamentally new theoretical frameworks. Traditional bargaining models from Nash [
25] through Rubinstein [
26] assume negotiations between parties with relatively stable outside options. However, Crawford and Yurukoglu’s [
27] groundbreaking analysis of cable television markets showed that bargaining outcomes in multi-sided markets depend critically on relative concentration across sides, not just absolute concentration levels. Their structural model revealed that a one percent increase in distributor concentration leads to approximately three percent higher content costs, even after controlling for viewership and content quality.
Recent theoretical work by Lee and Whinston [
28] extends this analysis to dynamic settings, demonstrating how platforms can strategically induce content market fragmentation through sophisticated fee structures. They show that platforms benefit from encouraging entry on the content side up to a point, as this reduces any individual content provider’s bargaining power while maintaining sufficient variety to attract consumers. This strategic manipulation of market structure represents a subtle form of platform power that traditional competition analysis would miss entirely. Belleflamme and Peitz [
29] provide a comprehensive review of these platform strategies in their handbook chapter, synthesizing how network effects, pricing, and market structure interact in platform markets.
2.3. Asymmetric Market Evolution: A New Framework
While existing literature examines platform consolidation and content market dynamics as separate phenomena, the simultaneous occurrence of opposing concentration trends—what we term “asymmetric market evolution”—represents a critical gap in our understanding. Traditional industry lifecycle theories from Gort and Klepper [
30] through Jovanovic and MacDonald [
31] assume that vertically related markets evolve following similar patterns, typically progressing from fragmentation through shakeout to maturity. However, platform-mediated markets exhibit fundamentally different dynamics where one side of the market consolidates while the other simultaneously fragments, creating novel economic relationships that existing theory cannot adequately explain.
The theoretical foundations for understanding these dynamics are still developing. While some working papers explore related concepts, the specific phenomenon of sustained asymmetric evolution—where platform concentration and content fragmentation proceed simultaneously over extended periods—remains undertheorized. Our empirical analysis of the Korean home shopping market, where this pattern has persisted for nearly a decade, provides crucial evidence for theory development.
As illustrated in
Figure 1, asymmetric market evolution operates through three interconnected and self-reinforcing mechanisms that transform market structure and competitive dynamics over time.
Mechanism 1: Structural Divergence occurs when technological, economic, or regulatory factors affect the two sides of a platform market in opposite directions. On the platform side, massive infrastructure investments, economies of scale in technology development, and strong network effects create natural tendencies toward consolidation [
12,
13]. High fixed costs for maintaining platform infrastructure, combined with the competitive advantages of larger user bases, drive smaller platforms to exit or merge. Simultaneously, on the content side, digital technologies dramatically reduce entry barriers by eliminating traditional distribution costs, while platforms actively encourage content variety to maximize consumer appeal [
3,
5]. This creates a paradox where the same technological forces that concentrate platform markets fragment content markets, leading to an increasing Asymmetry Ratio between platform and content market concentration.
Mechanism 2: Bargaining Power Transformation follows inevitably from structural divergence. Traditional bargaining theory predicts that increased competition reduces firms’ outside options and thus their negotiating leverage [
26]. However, in platform-mediated markets, this effect becomes dramatically amplified by the platform’s unique gatekeeper position. As platforms consolidate, each platform’s threat to exclude content becomes increasingly credible and costly to content providers who have fewer alternative distribution channels. Meanwhile, fragmented content providers lose any ability to negotiate collectively, as platforms can easily replace any individual provider due to high substitutability. Athey and Luca [
32] model this as “dynamic monopsony power”, where the platform’s bargaining position strengthens not through its own actions but through the structural evolution of the market itself. This transformation in bargaining dynamics leads to systematic increases in platform fees as a direct consequence of the structural asymmetry.
Mechanism 3: Feedback Loops accelerate the divergence between platform concentration and content fragmentation. As platforms extract higher fees enabled by their strengthened bargaining position, marginal content providers face profitability pressures that force exit or consolidation. However, this consolidation occurs through the elimination of weaker players rather than the strengthening of survivors, as the remaining firms still face the same concentrated platform power. Jacobides et al. [
33] term this process “orchestrated ecosystems”, where platforms actively manage the competitive dynamics among their complementors to maintain optimal fragmentation. This self-reinforcing cycle—higher fees leading to provider exits, which reduces collective bargaining power, which enables further fee increases—can push markets toward critical thresholds where traditional business models become unsustainable. The feedback mechanism ensures that asymmetric market evolution, once initiated, tends to accelerate rather than stabilize.
These three mechanisms interact to create a dynamic system where platform power grows not merely from individual platform actions but from the structural evolution of the entire ecosystem. The theoretical framework suggests that platform markets may exhibit multiple equilibria, with critical thresholds separating different competitive regimes. Understanding these mechanisms is essential for predicting market evolution and designing effective regulatory interventions in platform economies.
2.4. Threshold Effects and Multiple Equilibria
The industrial organization literature has long recognized that markets can exhibit multiple equilibria, with critical thresholds determining which equilibrium emerges [
34,
35]. In the context of platform markets, Evans and Schmalensee [
36] identified “critical mass” thresholds necessary for platform launch—the minimum participation needed on each side to create positive feedback loops. We extend this concept from platform launch to platform fees, proposing that critical fee thresholds exist beyond which traditional business models become not just unprofitable but mathematically impossible to sustain.
Theoretical support for fee thresholds comes from models of endogenous sunk costs developed by Sutton [
34], which demonstrate how high fixed costs can fundamentally alter market structure and create discontinuities in firm behavior. When platform fees exceed a critical percentage of content provider revenue, the remaining funds become insufficient to cover both variable costs of content creation and the minimum fixed costs necessary for operation. This mathematical constraint creates discontinuous changes in optimal firm strategy. Below the threshold, firms can compete using traditional business models focused on volume and market share. Above the threshold, firms must either fundamentally transform their operations to achieve radically different cost structures or exit the market entirely.
Empirical evidence from multiple industries supports the existence and importance of threshold effects. Genakos and Valletti [
37] found discontinuous changes in mobile operator strategies at specific market concentration levels, with firms shifting from competition on network quality to service differentiation when concentration exceeded critical thresholds. Berry and Waldfogel [
38] documented similar threshold effects in radio markets, where station quality jumped discontinuously when market size exceeded specific population levels. In digital platform markets, the near-universal 30% fee charged by mobile app stores has created observable discontinuities in developer behavior, with many shifting from premium pricing to freemium models or exiting entirely when the fee burden becomes unsustainable [
20]. These cross-industry patterns suggest threshold effects represent general phenomena in concentrated markets, though the specific threshold levels vary based on industry cost structures and demand characteristics.
2.5. External Shocks and Structural Acceleration
Recent theoretical and empirical literature examines how external shocks affect market dynamics and competitive equilibrium. Theoretical models developed by Schelling [
35] and formalized by Morris and Shin [
39] demonstrate that shocks can cause markets to shift rapidly between multiple equilibria, particularly when coordination effects are present. In platform markets, external shocks may have fundamentally asymmetric effects, simultaneously strengthening platform positions while weakening content providers, thereby accelerating pre-existing evolutionary trends rather than creating new dynamics.
The COVID-19 pandemic provides an unprecedented natural experiment for examining shock effects on platform markets. While aggregate studies document acceleration in digital transformation [
40] and shifts in work patterns [
41], platform-specific research reveals profoundly asymmetric impacts across market sides. Alcedo et al. [
42] analyze e-commerce data from 47 economies, showing that the pandemic permanently shifted bargaining power toward platforms as traditional businesses lost their primary alternative to digital channels. Consumer behavior changes that might have taken years occurred within months, and platforms leveraged this rapid shift to renegotiate terms with content providers who had no alternative channels during lockdowns.
Bai et al. [
43] provide crucial evidence that these shifts represent permanent structural changes rather than temporary adjustments. Their analysis of firm-level data shows that forced digitalization during the pandemic created path dependence—emergency adaptations to platform requirements became embedded in business operations and consumer expectations, making reversion impossible even after physical channels reopened. Rather than serving as a temporary disruption that markets would recover from, COVID-19 functioned as an accelerator of pre-existing asymmetric evolution. By eliminating gradual adaptation options and forcing immediate platform dependence, the pandemic compressed evolutionary changes that might have taken a decade into a two-year period, fundamentally altering market structure in ways that persist beyond the crisis.
2.6. Theoretical Integration and Hypotheses
Integrating these diverse literature streams—two-sided market theory, platform economics, bargaining dynamics, threshold effects, and shock acceleration—we develop a comprehensive dynamic model of asymmetric market evolution that extends beyond static equilibrium analysis. Our theoretical framework synthesizes insights from platform economics regarding cross-side network effects and pricing structures with industrial organization perspectives on market evolution and concentration dynamics. We incorporate recent advances in understanding platform power sources and bargaining theory adaptations for multi-sided markets. This integration reveals how structural divergence between platform and content markets creates fundamentally new economic dynamics that traditional theories cannot adequately explain.
Hypothesis 1. Platform market concentration combined with content market fragmentation will lead to transmission fee increases that exceed the sum of effects from either trend independently.
This hypothesis extends the bargaining literature by proposing that the interaction between platform concentration and content fragmentation creates multiplicative rather than additive effects on fee levels. When platforms consolidate, each platform’s bargaining position strengthens through enhanced network effects and reduced inter-platform competition. Simultaneously, when content markets fragment, individual content providers lose negotiating leverage as they become more substitutable and less essential to any platform. The critical insight is that these effects reinforce each other—concentrated platforms can more credibly threaten to exclude fragmented content providers who have fewer alternative distribution channels, while fragmented providers cannot coordinate collective responses. This creates a bargaining dynamic where the combined effect on fees exceeds what would be predicted by examining structural change in isolation.
Hypothesis 2. As asymmetric market evolution progresses, the relationship between transmission fees and content provider profitability will transform from negative to positive.
This seemingly paradoxical hypothesis emerges from recognizing that platform fees undergo a fundamental functional transformation over time. In the early stages of platform markets, fees operate as traditional costs: higher fees uniformly reduce content provider profitability by decreasing margins. However, as asymmetric evolution progresses and fees reach critical levels, they begin functioning as selection mechanisms that sort firms by operational efficiency and strategic capability. Only firms capable of fundamental business model transformation can survive in high fee environments, either through radical cost reduction, premium positioning, or operational innovation. This selection process creates a positive correlation between fee levels and profitability among surviving firms, not because high fees cause high profitability, but because only highly profitable firms can survive high fees. This represents a qualitative shift in the economic function of platform fees from cost burdens to market selection devices.
Hypothesis 3. A critical transmission fee threshold exists at approximately 62–65% of content provider revenue, beyond which traditional business models become unviable, and firms must either transform operations or exit the market.
This hypothesis applies threshold models from coordination games and industrial organization to platform fee structures. The threshold emerges from mathematical constraints inherent in content provider cost structures. When platform fees consume more than approximately two-thirds of revenue, the remaining margin becomes insufficient to cover both the variable costs of content creation and the minimum fixed costs necessary for sustainable operations. This creates a discontinuity in viable strategies below the threshold—firms can compete using traditional volume-based models with normal profit margins—while above it, only radically transformed business models focusing on premium products or extreme operational efficiency remain viable. The specific threshold level depends on industry-specific cost structures, but the existence of such a discontinuity represents a general phenomenon in platform-mediated markets.
Hypothesis 4. External shocks such as COVID-19 will not fundamentally alter the trajectory of asymmetric market evolution, because path-dependent structural forces dominate temporary disruptions.
The COVID-19 pandemic offers a natural experiment for testing shock effects in platform markets. Yet deeply embedded structural dynamic network effects, sunk infrastructure investments, and multi-year contracts create substantial inertia that resists external disruptions. Platform concentration reflects decades of infrastructure building and regulatory decisions, whereas content fragmentation stems from low entry barriers and declining fixed costs. These opposing but stable forces imply that shocks may shift short-term demand but rarely reverse fundamental bargaining asymmetries. The pandemic may have accelerated digital adoption, but it could not undo the structural imbalance between highly concentrated platforms and fragmented content providers.
3. Data and Methodology
3.1. Institutional Context
The Korean home shopping industry operates within a unique regulatory framework that shapes market dynamics and competitive behavior. Established in 1995 with the launch of the first dedicated channels, the industry broadcasts product demonstrations and sales programming 24 h daily, allowing viewers to purchase products via telephone or internet while watching [
44]. Unlike general television programming, home shopping channels are classified as “program provider channels” under the Broadcasting Act, subjecting them to dual oversight from the Korea Communications Commission (KCC) for broadcasting operations and the Korea Fair Trade Commission (KFTC) for commercial practices [
45].
The industry structure consists of two distinct layers with asymmetric regulatory treatment. Content providers—the home shopping channels themselves—face stringent entry barriers and operational constraints. Broadcasting and program provision businesses require legal permits and registration under the Broadcasting Act, with strict qualification requirements for operators. However, no new entrants have been approved since 2016, though data-based home shopping licenses are currently under consideration. Existing license holders undergo mandatory re-approval evaluations approximately every five years, with the KCC assessing financial soundness, programming quality, consumer protection measures, and support for small and medium enterprises (SMEs). These evaluations can result in conditional approvals requiring operational improvement or, in extreme cases, license revocation [
44].
In contrast, distribution platforms—cable TV operators and IPTV providers—have consolidated through mergers and acquisitions with less regulatory scrutiny. Major platforms include cable operators (LG HelloVision, D’Live, and regional MSOs) and IPTV providers (KT, SK Broadband, and LG U+). These platforms control the technical infrastructure delivering channels to approximately 34 million households as of 2023, representing over 99% of Korean homes [
46].
Critical regulatory asymmetry emerges from differential bargaining structures. Home shopping channels must negotiate transmission fees individually with each platform, as collective bargaining is restricted under competition law. While the government has introduced “Home Shopping Broadcasting Channel Use Contract Guidelines” that establish negotiation procedures, fee calculation standards, and mediation mechanisms for disputes, major IPTV operators (KT, SK Broadband, LG U+) effectively set industry-wide fee formulas that influence all negotiations. This creates multiple bilateral bargaining situations where individual channels face concentrated platform power, though recent market deterioration has led some home shopping channels to demand fee reductions or threaten broadcasting suspension, partially shifting bargaining dynamics [
4,
45].
Transmission fees an), represent the most significant cost for home shopping channels after product procurement. These fees are typically structured as revenue-sharing agreements where channels pay platforms a percentage of gross merchandise value (GMV), though some agreements include minimum guarantee payments. The fee percentage varies by channel size, viewership ratings, channel position, and bargaining outcomes. Importantly, Korean regulations do not cap these fees, unlike some international markets, allowing market forces and bargaining dynamics to determine rates [
4].
3.2. Data Sources
Our analysis draws on three primary data sources that together provide comprehensive coverage of the Korean home shopping industry from 2015 to 2023.
Korea Communications Commission Annual Reports: The KCC publishes annual “Broadcasting Business Financial Status Reports” containing detailed financial statements for all licensed broadcasters [
4]. As home shopping channels are classified as program providers requiring financial transparency, they must submit audited statements including revenue breakdowns, operating expenses with transmission fees as separate line items, and profitability metrics. These reports provide our core financial variables.
Platform Market Data: We construct platform concentration measures using two sources. The Korea Cable TV Broadcasting Association provides quarterly subscriber counts and revenue data for cable operators [
47]. The Ministry of Science and ICT’s “Broadcasting Industry Survey Report” tracks IPTV operators and overall platform market dynamics [
46]. Cross-validation between sources ensures data consistency.
Supplementary Industry Data: Additional operational metrics come from Nielsen Korea’s viewership ratings, channel position data from platform operators, and SME support compliance reports mandated by broadcasting regulations. While we cannot access confidential bilateral negotiation records, the financial disclosures provide sufficient detail to analyze fee structures and their impacts.
3.3. Sample Construction
Our sample includes all licensed home shopping channels operating in Korea during 2015–2023. We begin with 11 channels in 2015, expanding to 12 from 2016 with SK Stoa’s market entry, yielding 107 initial firm-year observations (11 × 1 + 12 × 8). After removing 3 extreme outliers with a |z-score| > 3, our final analysis is based on a sample of 104 firm-year observations:
The resulting unbalanced panel of 104 observations across 12 firms, which avoids survivorship bias concerns, provides sufficient variation to identify both cross-sectional differences and temporal dynamics.
3.4. Variable Construction
3.4.1. Dependent Variables
ProfitRate: Operating profit margin calculated as operating profit divided by home shopping broadcasting revenue. We use operating profit rather than net profit to focus on core business performance, excluding financial income and extraordinary items. This measure captures operational efficiency under varying transmission fee burdens.
MarketShare: Each channel’s share of total industry revenue, calculated annually to track competitive dynamics and market structure evolution.
3.4.2. Key Independent Variables
TransmissionFeeRate: The percentage of revenue paid to platforms as transmission fees, our primary variable of interest capturing platform power.
Platform_HHI: Herfindahl–Hirschman Index measuring platform market concentration, calculated as the sum of squared market shares multiplied by 10,000 following standard antitrust practice.
where
represents platform
’s market share in year
based on broadcasting revenue.
HS_HHI: Similar concentration measure for home shopping channels, capturing competitive dynamics among content providers.
where
represents channel
’s market share in year
.
3.4.3. Control Variables
Big 4: Binary indicator equals one for channels affiliated with major conglomerates (CJ, GS, Woori, Hyundai); zero otherwise. These firms potentially possess superior resources, brand recognition, and negotiating capabilities.
Viewership: Annual average viewership rating from Nielsen Korea [
48], measured as percentage of households viewing. While home shopping channels typically achieve modest ratings (mean 0.048%), variation affects bargaining power and revenue potential.
Revenue Billion: Channel revenue in billions of Koreans won, included in logarithmic form in some specifications to control for size effects.
Post COVID: Binary indicator for years 2020–2023, capturing potential structural breaks from the pandemic’s acceleration of digital commerce.
Table 1 provides detailed variable definitions and measurement approaches.
3.5. Descriptive Statistics
Table 2 presents summary statistics for our main variables. The dataset comprises 104 observations after removing 3 extreme outliers with profit rates below −200% using the z-score method (|z| > 3). The average transmission fee rate across all observations is 52.41% (SD = 15.39%), ranging from 19.47% to 87.99%. This wide range reflects both temporal variation and heterogeneity across firms.
The transmission fee rate increased dramatically over our study period. As shown in
Table 3, the average rate rose from 41.15% in 2015 to 68.72% in 2023, representing a 33.3 percentage point increase (94% growth). This increase coincides with platform market consolidation, as Platform HHI rose from 1390 to 2154 (55% increase), moving from moderately concentrated to highly concentrated by Department of Justice standards [
49].
Big 4 Share represents the combined market share of CJ Onstyle, GS Home Shopping, Hyundai Home Shopping, and Woori Home Shopping.
Profitability patterns show interesting dynamics. Average profit rates fluctuated considerably, reaching a peak of 19.0% in 2020 (likely due to COVID-19 demand surge) before declining to 10.5% in 2023. The Big 4’s market share declined steadily from 81.2% to 58.0%, indicating market fragmentation despite rising transmission fees. This asymmetric evolution—platform consolidation with content fragmentation—creates the conditions for our theoretical predictions.
Based on the actual analysis output, Big 4 firms (N = 36) maintain an average profit rate of 23.4% compared to 4.9% for other firms (N = 68), despite paying similar transmission fees (51.9% vs. 51.1%). This 18.5 percentage profitability gap suggests that firm characteristics and capabilities play a crucial role in adaptation to high platform fees (see
Table 4 for regression analysis).
3.6. Empirical Strategy
Our empirical analysis proceeds in four stages to test our theoretical predictions while addressing potential endogeneity concerns.
3.6.1. Market Evolution Analysis
We first document the evolution of market structures and transmission fees over time. Following the industrial organization literature, we calculate Herfindahl–Hirschman Indices for both platform and content markets:
3.6.2. Threshold Identification
To test critical fee thresholds (Hypothesis 3), we employ Hansen’s [
42] threshold regression methodology. The model specification is as follows:
where τ is the unknown threshold parameter and I(⋅) is an indicator function. We estimate τ by minimizing the sum of squared residuals across all possible thresholds between the 30th and 80th percentiles of the transmission fee distribution.
Our grid search identifies an optimal threshold at 62.2% (p = 0.012), though we also test pre-specified thresholds at 50%, 55%, 60%, 63%, 65%, and 73% for robustness. The 73% threshold shows significant differences in profitability (p = 0.002), aligning with our theoretical predictions about business model viability.
3.6.3. Regression Analysis
We estimate four main regression specifications:
Standard errors are clustered at the firm level to account for serial correlation [
50].
3.6.4. Dynamic Analysis
To examine changing relationships over time, we employ multiple approaches. First, we calculate year-by-year correlations between transmission fees and profitability to identify potential relationship reversals. Second, we estimate rolling three-year window regressions to track parameter evolution continuously. Third, we apply Chow tests at theoretically motivated dates (2017 for market structure shifts, 2020 for COVID-19) and Andrews–Ploberger tests for endogenous break detection. Finally, we estimate interaction models with period indicators to quantify differential effects across time:
3.7. Identification Strategy
3.7.1. Endogeneity Concerns
Three main challenges complicate causal inference. First, reverse causality may arise if profitable firms negotiate better rates. Second, unobserved factors like management quality could affect both fees and profitability. Third, selection bias from firm exits may lead us to observe only successful survivors, underestimating true fee impacts.
3.7.2. Instrumental Variables Approach
We use lagged platform HHI as an instrument for transmission fees, estimating the following:
We assess instrument strength using first-stage F-statistics and test endogeneity using Wu–Hausman tests. The exclusion restriction relies on platform concentration being determined by regulatory and infrastructure factors exogenous to individual content providers.
3.7.3. Fixed Effects Models
As a complementary identification strategy, we estimate firm fixed-effects specifications:
where
captures time-invariant firm characteristics such as management quality, brand value, and operational capabilities. This specification exploits within-firm variation over time to identify fee effects while controlling for unobserved heterogeneity. We use Hausman tests to compare fixed versus random effects specifications and determine the appropriate model.
The fixed-effects approach addresses time-invariant confounders but cannot control for time-varying unobservable. Additionally, identification requires sufficient within-firm variation in transmission fees, which may be limited if contracts involve multi-year agreements with infrequent renegotiations.
4. Results
4.1. Platform Concentration and Transmission Fee Dynamics
4.1.1. Temporal Evolution of Transmission Fees
The progression of transmission fees reveals distinct phases. From 2015 to 2016, fees increased modestly from 41.15% to 44.23%, suggesting initial market adjustment. The period from 2017 to 2019 witnessed steady increases, with fees rising from 44.87% to 54.12% as platform consolidation accelerated. Most dramatically, the 2020–2023 period saw fees surge from 55.23% to 68.72%, representing a 33% increase in just four years. This acceleration coincides with platform HHI exceeding 1900, suggesting a tipping point in bargaining power dynamics.
The dispersion of fees also evolved meaningfully. Standard deviations decreased from 11.40% in 2015 to 8.33% in 2019, indicating convergence as platforms standardized pricing. However, dispersion increased again to 12.80% by 2023, reflecting sophisticated price discrimination as platforms leveraged enhanced market power to extract maximum value from each content provider based on their specific characteristics and bargaining position.
4.1.2. Platform Concentration as the Primary Driver
Regression analysis of the time series relationship yields compelling results:
The coefficient indicates that each 100-point increase in platform HHI is associated with a 4.23 percentage point increase in transmission fees. With platform HHI increasing by 764 points over our study period (from 1390 to 2154), this model predicts a 32.3 percentage point increase, closely approximating the actual 33.28 percentage point rise. The R-squared of 0.944 demonstrates that platform concentration alone explains 94.4% of temporal variation in average transmission fees. The t-statistics of 10.91 (p < 0.001) confirm the highly significant nature of this relationship.
This remarkably strong explanatory power suggests that platform market structure serves as the primary driver of transmission fee dynamics. The near-perfect correlation of 0.972 between platform HHI and average transmission fees provides compelling evidence for our hypothesis that asymmetric market evolution drives fee increases through enhanced platform bargaining power.
Figure 2 illustrates this progression, with the shaded bands representing one standard deviation above and below the mean. The steady upward trajectory accelerates notably after 2019, coinciding with platform HHI approaching 2000. The COVID-19 marker at 2019.5 shows that while the pandemic may have contributed to short-term disruptions, the underlying trend preceded and continued through this period.
4.1.3. Heterogeneous Fee Dynamics Across Firm Types
The aggregate trends mask important heterogeneity in how different firms experience fee increases. During the early period (2015–2019), Big 4 firms enjoyed modest advantages, paying fees averaging 2–3 percentage points below other firms. This pattern reflected their stronger initial bargaining positions and multi-year legacy contracts.
However, the post-2020 period reveals a striking reversal. By 2023, fee structures showed extreme dispersion, with some Big 4 firms paying the highest rates in the industry—up to 87.99% for GS Home Shopping. This counterintuitive pattern reflects divergent strategic choices. Firms like CJ and GS accepted extreme fee increases as the price of transformation, using the crisis to justify radical operational changes. Meanwhile, firms attempting to preserve traditional business models negotiated more moderate increases but struggled with profitability.
The evolution from relatively uniform fees to highly differentiated structures indicates that platforms have developed sophisticated capabilities to identify and extract maximum value from each content provider. The near-perfect correlation of 0.972 between platform HHI and average transmission fees provides strong preliminary support for our hypothesis that asymmetric market evolution drives fee increases through enhanced platform bargaining power.
4.2. Determinants of Profitability
To understand how rising transmission fees affect firm performance, we estimate a series of regression models with increasing complexity.
Table 4 presents these results, revealing important nuances in the fee–profitability relationship.
The baseline specification reveals a positive but statistically insignificant relationship between transmission fees and profitability (0.198, p > 0.10). This counterintuitive result becomes clearer as we add controls. The Big 4 indicator enters with a significant positive coefficient of 0.184 (p < 0.01), indicating that major firms maintain substantial profitability advantages averaging 18.4 percentage points. When we include year fixed effects in Model 3, the transmission fee coefficient drops nearly to zero (0.018) and remains insignificant, suggesting that within-year variation shows no systematic relationship with profitability.
Model 4 provides crucial insights by including platform HHI directly. The positive and significant coefficient on platform concentration (0.0002, p < 0.05) indicates that each 100-point increase in platform HHI is associated with a 2 percent increase in content provider profitability, even after controlling transmission fees. This seemingly paradoxical result reflects selection effects—as platform concentration increases and fees rise, only more efficient firms survive, raising average profitability among remaining firms. The transmission fee coefficient becomes slightly negative (−0.038) but remains insignificant, suggesting that the selection effects captured by platform HHI dominate any direct cost effects of fees.
4.3. Threshold Effects and Operating Regimes
Our theoretical framework predicts that transmission fees create critical thresholds beyond which traditional business models become unviable. Using Hansen’s [
51] threshold regression methodology, we test for structural breaks in the fee–profitability relationship.
The optimal threshold search identifies a primary breakpoint at 62.2% transmission fees (
p = 0.012).
Table 5 presents the detailed threshold analysis results. Further analysis reveals a secondary threshold at 73% (
p = 0.002). These thresholds divide the market into three distinct operating regimes.
Table 6 summarizes the characteristics of each operating regime.
Figure 3 visualizes the three-stage structure created by these thresholds. The scatter plot shows individual firm-year observations colored by regime, while the loess curve confirms the non-linear relationship. The vertical lines mark the critical thresholds at 62.2% and 73%. Firms in the normal regime (green, <62.2%) cluster around traditional profitability levels. The transition zone (orange, 62.2–73%) shows greater dispersion as firms undergo transformation. The extreme regime (red, >73%) contains only successfully transformed firms with high profitability.
Bootstrap analysis confirms the robustness of these thresholds, with 95% confidence intervals placing the primary threshold between 59.8% and 64.6%. The stability of these estimates across alternative specifications suggests they represent fundamental operational constraints rather than statistical artifacts.
4.4. Dynamic Evolution of Market Relationships
A central prediction of our theoretical framework concerns the temporal evolution of the fee–profitability relationship. Cross-sectional analysis at different time points reveals a remarkable transformation (
Table 7).
In 2015, the correlation between transmission fees and profitability was −0.145, consistent with traditional cost burden effects, though not statistically significant due to small sample size. By 2023, this correlation had reversed to 0.554 (p = 0.062), indicating that higher fees now associate with higher profitability.
Figure 4 traces this evolution, with the purple line indicating the correlation coefficient over time, showing the progression from negative to positive correlations. The turning point around 2017 corresponds to platform HHI exceeding 1600 and average transmission fees surpassing 40%. These appear to represent critical levels, triggering fundamental changes in market dynamics.
4.5. Panel Analysis and Selection Effects
To distinguish between selection effects and within-firm dynamics, we employ panel data methods.
Table 8 compares results across different econometric approaches.
The panel fixed-effects estimate is positive but insignificant, indicating that within-firm variation in fees does not systematically relate to profitability changes. This null result likely reflects limited within-firm fee variation due to multi-year contracts.
The instrumental variable analysis using lagged platform HHI reveals the importance of selection effects. The IV coefficient (0.473) is significantly positive and 2.6 times larger than the OLS estimate. The first-stage F-statistic of 38.86 confirms instrument strength, while the Wu–Hausman test (p = 0.023) indicates significant endogeneity in OLS. This stark difference reveals that selection effects dominate the fee–profitability relationship—as platform-driven fee increases force out less efficient firms, and average profitability among survivors rises.
4.6. Heterogeneous Firm Responses and Market Structure Evolution
The aggregate patterns mask important heterogeneity in firm responses to rising platform fees. Analysis of individual firm trajectories reveals two distinct strategic approaches (
Table 9).
CJ and GS pursued profitable shrinkage strategies, accepting extreme fee increases while transforming operations. Despite revenue declines exceeding 35%, these firms improved profitability through radical cost reduction, category exit, and premium positioning. In contrast, Woori and Hyundai attempted volume defense, negotiating more moderate fee increases to preserve scale. These firms maintained more revenue but suffered severe compression of margin, with profitability declining 75–90%.
These individual dynamics aggregate to fundamental market structure changes.
Table 10 tracks the evolution of concentration measures and market shares.
The significant interaction terms using within-firm variation provide robust evidence for both Hypothesis 1 (market structure effects) and Hypothesis 2 (temporal transformation), while controlling for unobserved firm heterogeneity.
The “Asymmetry Ratio” (Platform HHI/HS HHI) captures the degree of structural divergence between the two sides of the market. When this ratio exceeded 1.0 around 2017, fee acceleration began. By 2023, platforms were nearly twice as concentrated as content markets, creating extreme bargaining imbalances.
4.7. The Role of COVID-19
The COVID-19 pandemic provides a natural experiment to test whether external shocks alter the structural dynamics of asymmetric market evolution. Industry revenues grew 15% in 2020 [
4] as lockdowns accelerated digital commerce adoption.
Table 11 compares key metrics between pre-COVID and post-COVID periods.
While transmission fees accelerated and profitability improved post-COVID, regression analysis reveals these changes reflect continuation of pre-existing trends rather than structural breaks (
Table 12):
The insignificant interaction term (p = 0.912) confirms that COVID-19 did not fundamentally alter fee–profitability dynamics. The pandemic accelerated existing asymmetric market evolution but did not create new economic relationships. This supports Hypothesis 4, that structural forces dominate temporary disruptions in platform markets.
4.8. Robustness Checks
We validate our findings through comprehensive robustness tests.
Table 13 presents results across various specifications:
Outlier Treatment: Including extreme outliers reverses the coefficient sign, confirming these observations represent firms in severe financial distress following different economic dynamics.
Alternative Methods: Quantile regression confirms the positive relationship holds across the distribution, with the Big 4 advantage remaining consistent (coefficient = 0.139, 95% CI [0.101, 0.187]).
Sample Heterogeneity: Results vary significantly by firm type. Big 4 firms show a statistically significant positive relationship (p = 0.035), while other firms show no significant effect, highlighting the importance of firm capabilities in adapting to high platform fees.
These robust checks support our main findings while revealing important nuances about the transformation of platform fee dynamics in the Korean home shopping industry.
5. Discussion and Implications
5.1. Theoretical Contributions
Our findings fundamentally challenge conventional understanding of market power in two-sided markets. Traditional industrial organization theory, from the structure–conduct–performance paradigm through modern game-theoretic approaches, typically examines concentration on each market side independently. This approach fails to capture the critical interaction effects our study reveals. The near-perfect correlation of 0.972 between platform concentration and transmission fees, occurring simultaneously with increasing competition among content providers, demonstrates that competitive forces on one side cannot constrain power arising from concentration on the other.
We introduce asymmetric market evolution as a distinct source of market power that emerges when platform and content markets follow divergent concentration paths. This concept extends two-sided market theory beyond the static frameworks of Rochet and Tirole [
1,
2] and Armstrong [
3] to encompass dynamic structural transformation. When platform markets consolidate while content markets fragment, the resulting bargaining dynamics differ qualitatively from situations where both sides exhibit similar concentration trends. The platform’s gatekeeper position becomes increasingly valuable as it faces a more fragmented set of content providers competing for access.
The identification of dual thresholds at 62.2% and 73% transmission fees reveals that platform markets exhibit properties characteristic of complex systems with multiple equilibria. This finding extends threshold models from coordination games to vertical market relationships. The three distinct operating regimes we identify—normal operations below 62.2%, transition zone between 62.2% and 73%, and extreme adaptation above 73%—create fundamentally different competitive dynamics in each range. This non-linearity in market relationships suggests that platform markets can experience phase transitions between qualitatively different states, like physical systems undergoing state changes.
Our variable instrumental results provide crucial insights into the role of selection mechanisms in platform markets. The stark difference between OLS estimates (0.184) and IV estimates (0.473) reveals that cross-sectional analyses severely underestimate the true effect of platform fees on industry structure. This finding extends the literature on endogenous market structure by demonstrating how platform-mediated selection operates. As fees rise, they cease functioning as simple costs and transform into filters that systematically remove less efficient firms while allowing more capable ones to thrive. This mechanism differs from traditional cost-based competition where higher costs uniformly reduce profitability across all firms.
The temporal reversal in the fee–profitability relationship from a negative correlation of −0.145 in 2015 to positive correlation of 0.554 in 2023 presents a fundamental transformation in how platform fees function economically. This evolution suggests that platform markets can undergo qualitative shifts in their basic economic relationships, not merely parametric changes within stable frameworks. The turning point around 2017, coinciding with the platform-to-content HHI ratio exceeding 1.0, indicates that structural asymmetry must reach critical levels before these transformations occur.
5.2. Managerial Implications
Our findings provide actionable strategic guidance for managers operating in platform-mediated markets. The three-stage framework we identify offers clear diagnostic tools and strategic prescriptions based on a firm’s position relative to critical thresholds.
In the normal operations stage below 62.2% transmission fees, traditional competitive strategies remain viable. Firms can pursue scale economies, expand product variety, and compete on service quality using conventional business models. However, managers must monitor platform concentration trends and fee trajectories as early warning indicators. When the platform-to-content HHI ratio approaches 1.0, as occurred in our market around 2017, firms should begin contingency planning for potential regime changes. The lead time between structural shifts and fee acceleration provides a window for strategic preparation that proactive firms can exploit.
The transition zone between 62.2% and 73% fees represents a critical phase requiring decisive action. Our analysis reveals that incremental adaptation fails in this range—firms must commit to fundamental transformation or risk being trapped in declining profitability spirals. The contrasting outcomes between firms pursuing profitable shrinkage versus volume defense strategies demonstrate the importance of strategic clarity. Successful transformation requires accepting short-term revenue declines to achieve sustainable profitability. Key elements include existing low-margin categories regardless of their revenue contribution, investing heavily in operational automation and efficiency, developing exclusive or highly differentiated products that can command premium prices, and building direct customer relationships to reduce platform dependence.
In the extreme adaptation stage above 73% of fees, only radically transformed business models remain viable. The firms succeeding in this range, primarily CJ and GS in our sample, have essentially become different types of organizations from their former selves. They operate with minimal physical infrastructure, focus exclusively on high-margin premium segments, employ sophisticated data analytics for all decisions, and maintain profitability despite paying up to 87.99% (GS) and 79.3% (CJ) of revenues in platform fees. This transformation requires overcoming substantial organizational inertia and accepting that traditional growth metrics no longer apply.
Platform diversification emerges as a critical strategic consideration across all stages. While complete platform independence may be infeasible in industries with strong network effects, even partial alternative channels can improve bargaining positions. Firms should invest in owned digital properties, explore emerging platforms before they consolidate, and build brand strength that creates consumer pull regardless of distribution channel. The option value of alternative channels may exceed their direct revenue contribution by constraining platform pricing power.
5.3. Policy Implications
Our findings reveal fundamental market failures in platform-mediated markets that traditional competition policy cannot address. The asymmetric evolution we document—simultaneous platform consolidation and content fragmentation—creates bargaining imbalances that worsen over time without natural correction mechanisms. This challenges the conventional regulatory approach of examining each market side independently.
5.3.1. The Asymmetry Ratio as a Regulatory Tool
We propose the Asymmetry Ratio (Platform HHI/Content HHI) as a new metric for regulatory monitoring. In our data, this ratio progressed from 0.77 to 1.93, with fee acceleration beginning when it exceeded 1.0. This suggests a clear trigger for enhanced regulatory scrutiny. When platform concentration exceeds content concentration, the structural conditions for excessive fee extraction are established. Regulators should monitor this ratio across platform markets and consider intervention when it approaches 2.0, indicating platforms are twice as concentrated as content markets.
5.3.2. Fee Cap Design Considerations
The 62.2% fee threshold we identify provides concrete guidance for regulatory intervention design. To validate a 60% cap recommendation, we conducted counterfactual simulations assuming fee reductions transfer fully to content providers.
Table 14 presents the simulation results across different cap levels:
The results reveal important trade-offs. While a 55% cap maximizes total surplus (+22.6%), it affects 37 firms—potentially too disruptive. A 60% cap achieves optimal balance, affecting only 25 firms while generating substantial surplus gains (+15.1%) and, notably, improving SME profitability by 2.9 percentage points. The convergence between our empirically identified 62.2% threshold and the simulation-optimal 60% level validates this approach. This 60% threshold preserves business model viability while allowing efficiency-enhancing selection. However, our findings caution against premature intervention. The profitable shrinkage strategies of successful adapters, while painful, did improve operational efficiency. Capping fees too early might perpetuate inefficient operations and delay necessary restructuring.
5.3.3. Collective Bargaining as a Market-Based Solution
Collective bargaining rights for content providers offer a potentially effective structural remedy. The extreme bargaining imbalance is shown by individual content providers facing concentrated platform resembles labor markets where collective bargaining rights are established policy tools. Several jurisdictions have implemented frameworks allowing news publishers to negotiate collectively with digital platforms (e.g., Australia’s News Media Bargaining Code, Canada’s Online News Act). Extending similar frameworks to other content industries could restore bargaining balance without direct price regulation.
Key design elements should include the following:
Broad eligibility criteria to prevent exclusion of smaller providers
Transparent revenue allocation mechanisms
Binding arbitration for deadlocked negotiations
Safeguards against collusion beyond platform-specific negotiations
5.3.4. Structural Interventions for Extreme Cases
When behavioral remedies prove insufficient, structural interventions warrant consideration. The extreme concentration we document, with platform HHI exceeding 2100 and trending higher, suggests the market structure itself requires reform. Policy options include the following:
Enhanced Merger Review: Apply the Asymmetry Ratio alongside traditional HHI in platform merger analysis
Interoperability Mandates: Reduce switching costs through technical standards
Public Alternatives: Government-supported platforms to provide competitive constraints
Vertical Separation: Potential divestiture requirements for integrated platform-content operations
The European Union’s Digital Markets Act provides a regulatory framework, with Article 6(12) prohibiting gatekeepers from imposing unfair commercial conditions on business users (Regulation (EU) 2022/1925). However, the DMA’s reliance on absolute size thresholds (€7.5 billion annual turnover) may miss smaller platforms with extreme asymmetric power. Our findings suggest complementing size-based criteria with relative concentration metrics.
5.3.5. Implementation Recommendations
Effective platform regulation requires recognizing that asymmetric market evolution creates unique competitive dynamics. We recommend a tiered approach:
Monitoring (Asymmetry Ratio < 1.0): Standard competition surveillance
Enhanced Scrutiny (Ratio 1.0–1.5): Detailed market studies and fee monitoring
Active Intervention (Ratio 1.5–2.0): Consider collective bargaining rights and fee guidelines
Structural Remedies (Ratio > 2.0): Evaluate market restructuring options
This framework acknowledges that platform markets can exhibit phase transitions between qualitatively different competitive states, requiring regulatory responses calibrated to specific market conditions rather than one-size-fits-all interventions.
5.4. Broader Implications for the Digital Economy
While our study examines Korean home shopping, the dynamics we document provide critical insights for global platform markets. To contextualize our findings, we systematically compare transmission fees across major platform markets worldwide.
5.4.1. Why Korean Home Shopping Shows Exceptionally High Thresholds
The 62.2% threshold identified in Korean home shopping significantly exceeds the 30% standard in mobile app stores and 15–20% in e-commerce platforms shown in
Table 15. This extreme divergence demands explanation, as it reveals fundamental differences in platform power dynamics across industries.
Three structural factors explain why Korean home shopping exhibits such exceptional fee levels, and more importantly, how these factors interact multiplicatively to create unprecedented market power. We propose that platform fee potential emerges from the multiplication of platform dependence, operational leverage, and bargaining asymmetry.
First, platform dependence reaches its maximum in Korean home shopping. While app developers can distribute via web browsers and e-commerce merchants maintain physical stores or multiple online channels, home shopping channels face complete dependence with zero alternatives. This “single-channel lock-in” eliminates any credible threat of bypass, giving platforms absolute leverage that other industries lack.
Second, operational leverage creates severe exit barriers unique to broadcasting. Home shopping requires massive fixed investments—studios costing 30–50 billion KRW, broadcasting equipment at 20–30 billion KRW, production crews of 500–1000 employees, and 24 h operations requiring 100–150 billion KRW annually. These sunk costs totaling 200–300 billion KRW contrast sharply with digital platforms’ minimal infrastructure requirements and e-commerce’s liquidatable inventory, creating exit barriers that platforms systematically exploit.
Third, bargaining asymmetry reaches extreme levels through structural imbalances. Korean home shopping channels must negotiate individually with only three major platform operators (KT, SK Broadband, LG U+) controlling 85% of households. Unlike app stores where developers exert some collective influence or e-commerce with multiple competing platforms, home shopping faces bilateral monopoly situations without collective bargaining rights, multi-year contracts, and no regulatory fee caps.
These factors do not simply add—they multiply. When complete dependence combines with severe operational leverage and extreme bargaining asymmetry, the resulting platform power enables fee extraction impossible in markets where even one factor remains moderate. This multiplicative model explains why Korean home shopping fees are not merely higher but exist in a fundamentally different regime.
The framework suggests extreme platform fees emerge only when all three conditions coincide: no distribution alternatives, high sunk costs creating lock-in, and concentrated platforms facing fragmented suppliers negotiating individually. Markets missing any condition show dramatically lower fees, confirming platform power’s multiplicative nature. This insight helps predict which platform markets might evolve toward similar extremes and where intervention could prove most effective; addressing even one factor substantially reduces total platform power.
5.4.2. Cross-Industry Asymmetry Patterns
The Asymmetry Ratio—Platform HHI divided by Content HHI—provides a diagnostic tool for identifying markets susceptible to extreme fee extraction. While comprehensive cross-industry HHI data remains limited due to disclosure constraints, available evidence reveals significant variation in platform fee structures that correlates with relative market concentration.
Korean home shopping exhibits an Asymmetry Ratio of 1.93 (Platform HHI: 2154/Content HHI: 1118), placing it within the critical range identified by our threshold analysis. This structural imbalance manifests in transmission fees that climbed from 41.15% to 68.72% during our study period, representing the highest platform fees documented in any major consumer market.
By comparison, mobile app stores charge a standard 30% commission on digital sales, reduced to 15% for developers earning less than
$1 million annually under small business programs (Apple Developer Program [
44,
45]; Google Play Console [
47]). E-commerce marketplaces impose substantially lower fees, with Amazon’s referral rates ranging from 8% to 15% depending on product category [
47]. Thus, Korean home shopping platforms extract fees more than double the upper bound of major e-commerce sites and significantly exceeding the much-criticized 30% standard in mobile ecosystems.
These disparities highlight that fee levels depend less on absolute platform concentration than on relative concentration between platforms and their suppliers. Mobile app stores, despite extreme platform concentration, face countervailing power from major publishers who command significant market shares in gaming and enterprise software. When supplier concentration is substantially lower—yielding an Asymmetry Ratio approaching 2.0—platforms gain latitude to impose fees that fundamentally reshape industry economics, as our Hansen threshold test demonstrates (
Section 4.3).
The paucity of publicly available two-sided concentration data limits systematic cross-industry analysis, underscoring an important gap in platform market surveillance. We recommend that regulators systematically collect and monitor relative concentration metrics alongside traditional single-market HHI measures. Markets exhibiting Asymmetry Ratios exceeding 1.5, particularly those approaching 2.0, warrant enhanced scrutiny regardless of absolute concentration levels on either side. Such monitoring would enable early identification of markets structurally prone to extreme fee extraction before competitive harm becomes entrenched.
5.4.3. Evolution Trajectories Across Platform Markets
The progression we document—from 41.15% to 68.72% over nine years—suggests that platform fees may not stabilize at commonly assumed levels. Most academic and policy discussions treat the 30% fees charged by app stores as an upper bound for sustainable platform taxation. Our evidence challenges this assumption, demonstrating that under conditions of complete platform dependence and asymmetric market evolution, fees can reach levels that fundamentally transform industry economics.
The three-stage evolution we identify likely characterizes platform market development more broadly:
Stage 1 (Normal Operations, <62.2%): Platform fees function as traditional costs, with higher fees reducing profitability uniformly across content providers. Most digital platforms currently operate in this stage, where competitive dynamics follow conventional economic logic.
Stage 2 (Transition Zone, 62.2–73%): Selection effects begin dominating as marginal content providers exit while efficient ones adapt. Several platform markets show early signs of this transition, particularly in news publishing where platform referral fees increasingly determine viability.
Stage 3 (Extreme Adaptation, >73%): Only transformed business models survive, with platform fees serving primarily as selection mechanisms rather than costs. Korean home shopping has reached this stage, but other markets may follow as platform concentration increases.
5.4.4. Strategic Implications for Global Platforms
The strategic responses we document—profitable shrinkage versus volume defense—manifest across platform contexts. Netflix exemplifies profitable shrinkage in content markets, transitioning from a broad content aggregator to a focused producer of high-margin originals. Amazon’s private label strategy similarly represents withdrawal from commodity categories to focus on differentiated products. Conversely, traditional news publishers pursuing volume defense struggle with declining margins as they maintain broad coverage while paying increasing platform distribution costs.
The acceleration mechanism we identify—where platform concentration relative to content provider concentration drives fee increases—operates in multiple digital markets. In mobile app development, the duopolistic app store market faces millions of fragmented developers, creating structural conditions for fee extraction. E-commerce marketplaces show increasing concentration (Amazon’s share approaching 40% in the USA) while merchant fragmentation intensifies through easy entry. Social media platforms have consolidated into a few major players while content creators proliferate. Each case exhibits the asymmetric evolution that enables platform power accumulation.
5.4.5. Policy Implications for Digital Market Regulation
Our finding that the platform-to-content HHI ratio serves as a leading indicator of fee acceleration has immediate practical applications. When this ratio exceeded 1.0 in our market around 2017, transmission fees began to increase rapidly within two years. Currently, several global platform markets approach or exceed this threshold:
US app store market: Ratio ~3.0 (platform HHI ~5000, developer HHI ~1700), suggesting potential for significant fee increases without regulatory intervention
E-commerce marketplaces: Ratios between 1.5–2.5 in many countries, indicating middle-stage evolution
Social media platforms: Extreme concentration facing atomized content creators, representing the highest ratios globally
International regulatory responses show growing recognition of these dynamics. The European Union’s Digital Markets Act, South Korea’s platform regulations, and proposed legislation in the United States all attempt to address platform power. However, our findings suggest these interventions may underestimate the natural trajectory of platform markets. Regulations designed around current fee levels (typically 15–30%) may prove inadequate as platforms evolve toward the extreme states we document. Policymakers should prepare for platform fees potentially doubling or tripling from current levels without effective intervention.
The Korean home shopping experience thus serves as a “canary in the coal mine” for global platform markets. The extreme fees, business model transformations, and market exits we document may indicate the future of other platform-mediated industries. Content providers, platform operators, and policymakers should study these dynamics carefully, as the patterns we identify likely represent not anomalies but natural endpoints of asymmetric market evolution in platform economies.
5.5. Limitations and Future Research
This study advances the literature on asymmetric platform–supplier relationships by combining granular fee data with a two-stage econometric design. Nevertheless, several boundary conditions qualify our conclusions and open avenues for further inquiry.
First, Industry and Country Scope: Our analysis focuses on the Korean home-shopping sector, where complete platform dependence and high fees (68.72% in 2023) create a quasi-laboratory. However, this context-specific setting may constrain generalizability. Markets with stronger multi-channel distribution or different regulatory regimes can display alternative bargaining dynamics. Cross-national studies can delineate external validity and test whether the 62.2% threshold appears in other platform markets.
Second, Residual Endogeneity: Although the instrumental-variable coefficient (0.473) is 2.6 times the OLS estimate (0.184) and the first-stage F-statistic is 38.86, unobserved factors may persist. The 62.2% threshold is statistically significant at the 5% level (p = 0.012), whereas panel fixed-effects estimates are insignificant (p = 0.329) because multi-year contracts limit within-firm variation. Exploiting exogenous shocks—such as fee cap legislation or merger interventions—as natural experiments could provide cleaner identification, and event-study designs around regulatory changes would complement the panel analysis by capturing time-varying effects.
Third, Measurement and Sample Composition: Platform fee schedules derive from KCC disclosure requirements, which may omit off-book rebates or volume discounts and thereby understate actual fee burdens. Our unbalanced panel covers 104 observations across 12 firms (11 in 2015, expanding to 12 from 2016 with SK Stoa’s entry); Shopping&T’s rebranding is the only major corporate change. While this coverage removes survivorship bias, it limits cross-sectional variation. We observe realized equilibrium outcomes rather than the negotiation process itself; access to proprietary bargaining records would illuminate the mechanisms underlying asymmetric power dynamics.
Fourth, Welfare and Demand-Side Effects: The empirical focus on firm-level profitability and concentration omits consumer surplus measurement. The Big 4’s market share fell from 81.2% to 58.0%, and the home-shopping HHI declined from 1797 to 1118, suggesting increased variety but potentially altered quality. Without viewership elasticities or purchase-panel data, we cannot quantify how transmission fees affect end-user prices, product selection, or service innovation. This limitation directly motivates the research direction (iii) below.
Building on these limitations, several research avenues appear promising:
(i) Comparative cross-platform analyses covering mobile app stores (≈30% fees), e-commerce (≈15%), and food-delivery services (≈20%) can test whether the 62.2% threshold reflects industry-specific constraints or general platform dynamics, thereby clarifying universal versus context-dependent patterns.
(ii) Dynamic structural models that incorporate strategic interactions can explain the correlation reversal from –0.145 (2015) to 0.554 (2023) between fees and profitability, predicting the timing and magnitude of market transformations under different regulatory scenarios and filling a gap in temporal analyses.
(iii) Policy simulations calibrated to our three-stage framework (below 62.2%, 62.2–73%, above 73%) can quantify consumer welfare impacts of alternative fee caps. Integrating demand elasticities would complete the welfare analysis absent from the current study.
(iv) Regulatory impact evaluations using difference-in-differences designs around interventions such as the EU Digital Markets Act can assess real-world policy effectiveness. The insignificant COVID-19 interaction (p = 0.912) shows that external shocks need not disrupt structural trends, underscoring the need for carefully designed regulation.
In sum, although comprehensive panel coverage and multiple identification strategies bolster our findings, addressing these limitations will enhance causal inference, establish external validity, and inform evidence-based platform regulation across digital ecosystems.
6. Conclusions
This study documents how asymmetric market evolution in two-sided platforms creates new forms of market power that challenge conventional economic understanding. Through comprehensive analysis of the Korean home shopping industry from 2015 to 2023, we reveal how platform consolidation occurring simultaneously with content provider fragmentation fundamentally alters market dynamics. Transmission fees paid by content providers to platforms increased from 41.15% to 68.72% of revenue, driven by platform HHI rising from 1390 to 2154 while content market HHI declined from 1797 to 1118.
Our empirical analysis yields several key findings that extend platform economics theory. First, platform concentration alone explains 94.4% of transmission fee variation, with a near-perfect correlation of 0.972 demonstrating that competitive forces among content providers cannot constrain platform power. Second, we identify statistically significant dual thresholds at 62.2% and 73% transmission fees that create three distinct operating regimes with fundamentally different competitive dynamics. Third, the relationship between fees and profitability underwent a structural reversal, shifting from negative to positive correlation as fees transformed from cost burdens to selection mechanisms. Fourth, instrumental variable analysis reveals that standard econometric approaches underestimate these effects by factor of 2.6 due to selection bias, as less efficient firms exit under fee pressure.
These findings make several theoretical contributions. We introduce asymmetric market evolution as a distinct source of market power arising from divergent concentration trends across market sides. We demonstrate that platform markets exhibit complex system properties with multiple equilibria and phase transitions between qualitatively different states. We reveal how platform fees can transform from simple costs to evolutionary filters that reshape industry structure. These insights extend two-sided market theory from static analysis to dynamic structural transformation.
For managers, our three-stage framework provides clear strategic guidance. Below 62.2% fees, traditional strategies remain viable. Between 62.2% and 73%, firms must commit to fundamental transformation. Above 73%, only radically restructured operations survive. The divergent outcomes between firms pursuing profitable shrinkage versus volume defense demonstrate that half-measures fail when platform power reaches critical levels. Success requires recognizing the applicable regime and committing fully to appropriate strategies.
For policymakers, asymmetric market evolution demands new regulatory approaches. Traditional competition analysis examining each market independently misses crucial interaction effects. We propose the Asymmetry Ratio (Platform HHI/Content HHI) as a monitoring tool, with values exceeding 1.0 triggering enhanced scrutiny. The 62.2% fee threshold provides concrete intervention guidance—caps at 60% would preserve business viability while allowing beneficial selection. Collective bargaining rights for content providers offer a market-based remedy to restore bargaining balance.
Several limitations qualify our findings. Our single-industry focus in one country limits generalizability, though similar patterns across global platform markets suggest broader relevance. We cannot definitively establish causality despite multiple robustness checks and instrumental variables. Our analysis excludes consumer welfare effects, which require additional investigation. The sustainability of profitable shrinkage strategies remains uncertain over longer horizons.
Future research should examine asymmetric market evolution across different platform contexts to establish external validity. Dynamic models incorporating both platform and content provider strategies could generate testable predictions about market evolution. Welfare analysis should quantify consumer impacts of reduced content variety and quality under high platform fees. Natural experiments from regulatory interventions could identify which policies effectively constrain platform power while preserving innovation incentives.
The transformation we document continues unfolding. Platform concentration shows no signs of reversal while content markets fragment further. Without intervention, transmission fees will likely continue rising toward the mathematical limits of business viability. The Korean home shopping experience provides both warning and guidance—demonstrating how unchecked asymmetric evolution transforms entire industries while revealing patterns enabling anticipation and adaptation. As digital platforms increasingly mediate economic activity, understanding these dynamics becomes essential for scholars, managers, and policymakers working toward platform ecosystems that create rather than extract value. The extreme case we document, with platform fees consuming over two-thirds of content provider revenue, may predict the future of other platform markets unless stakeholders recognize and respond to the fundamental challenge of asymmetric market evolution.


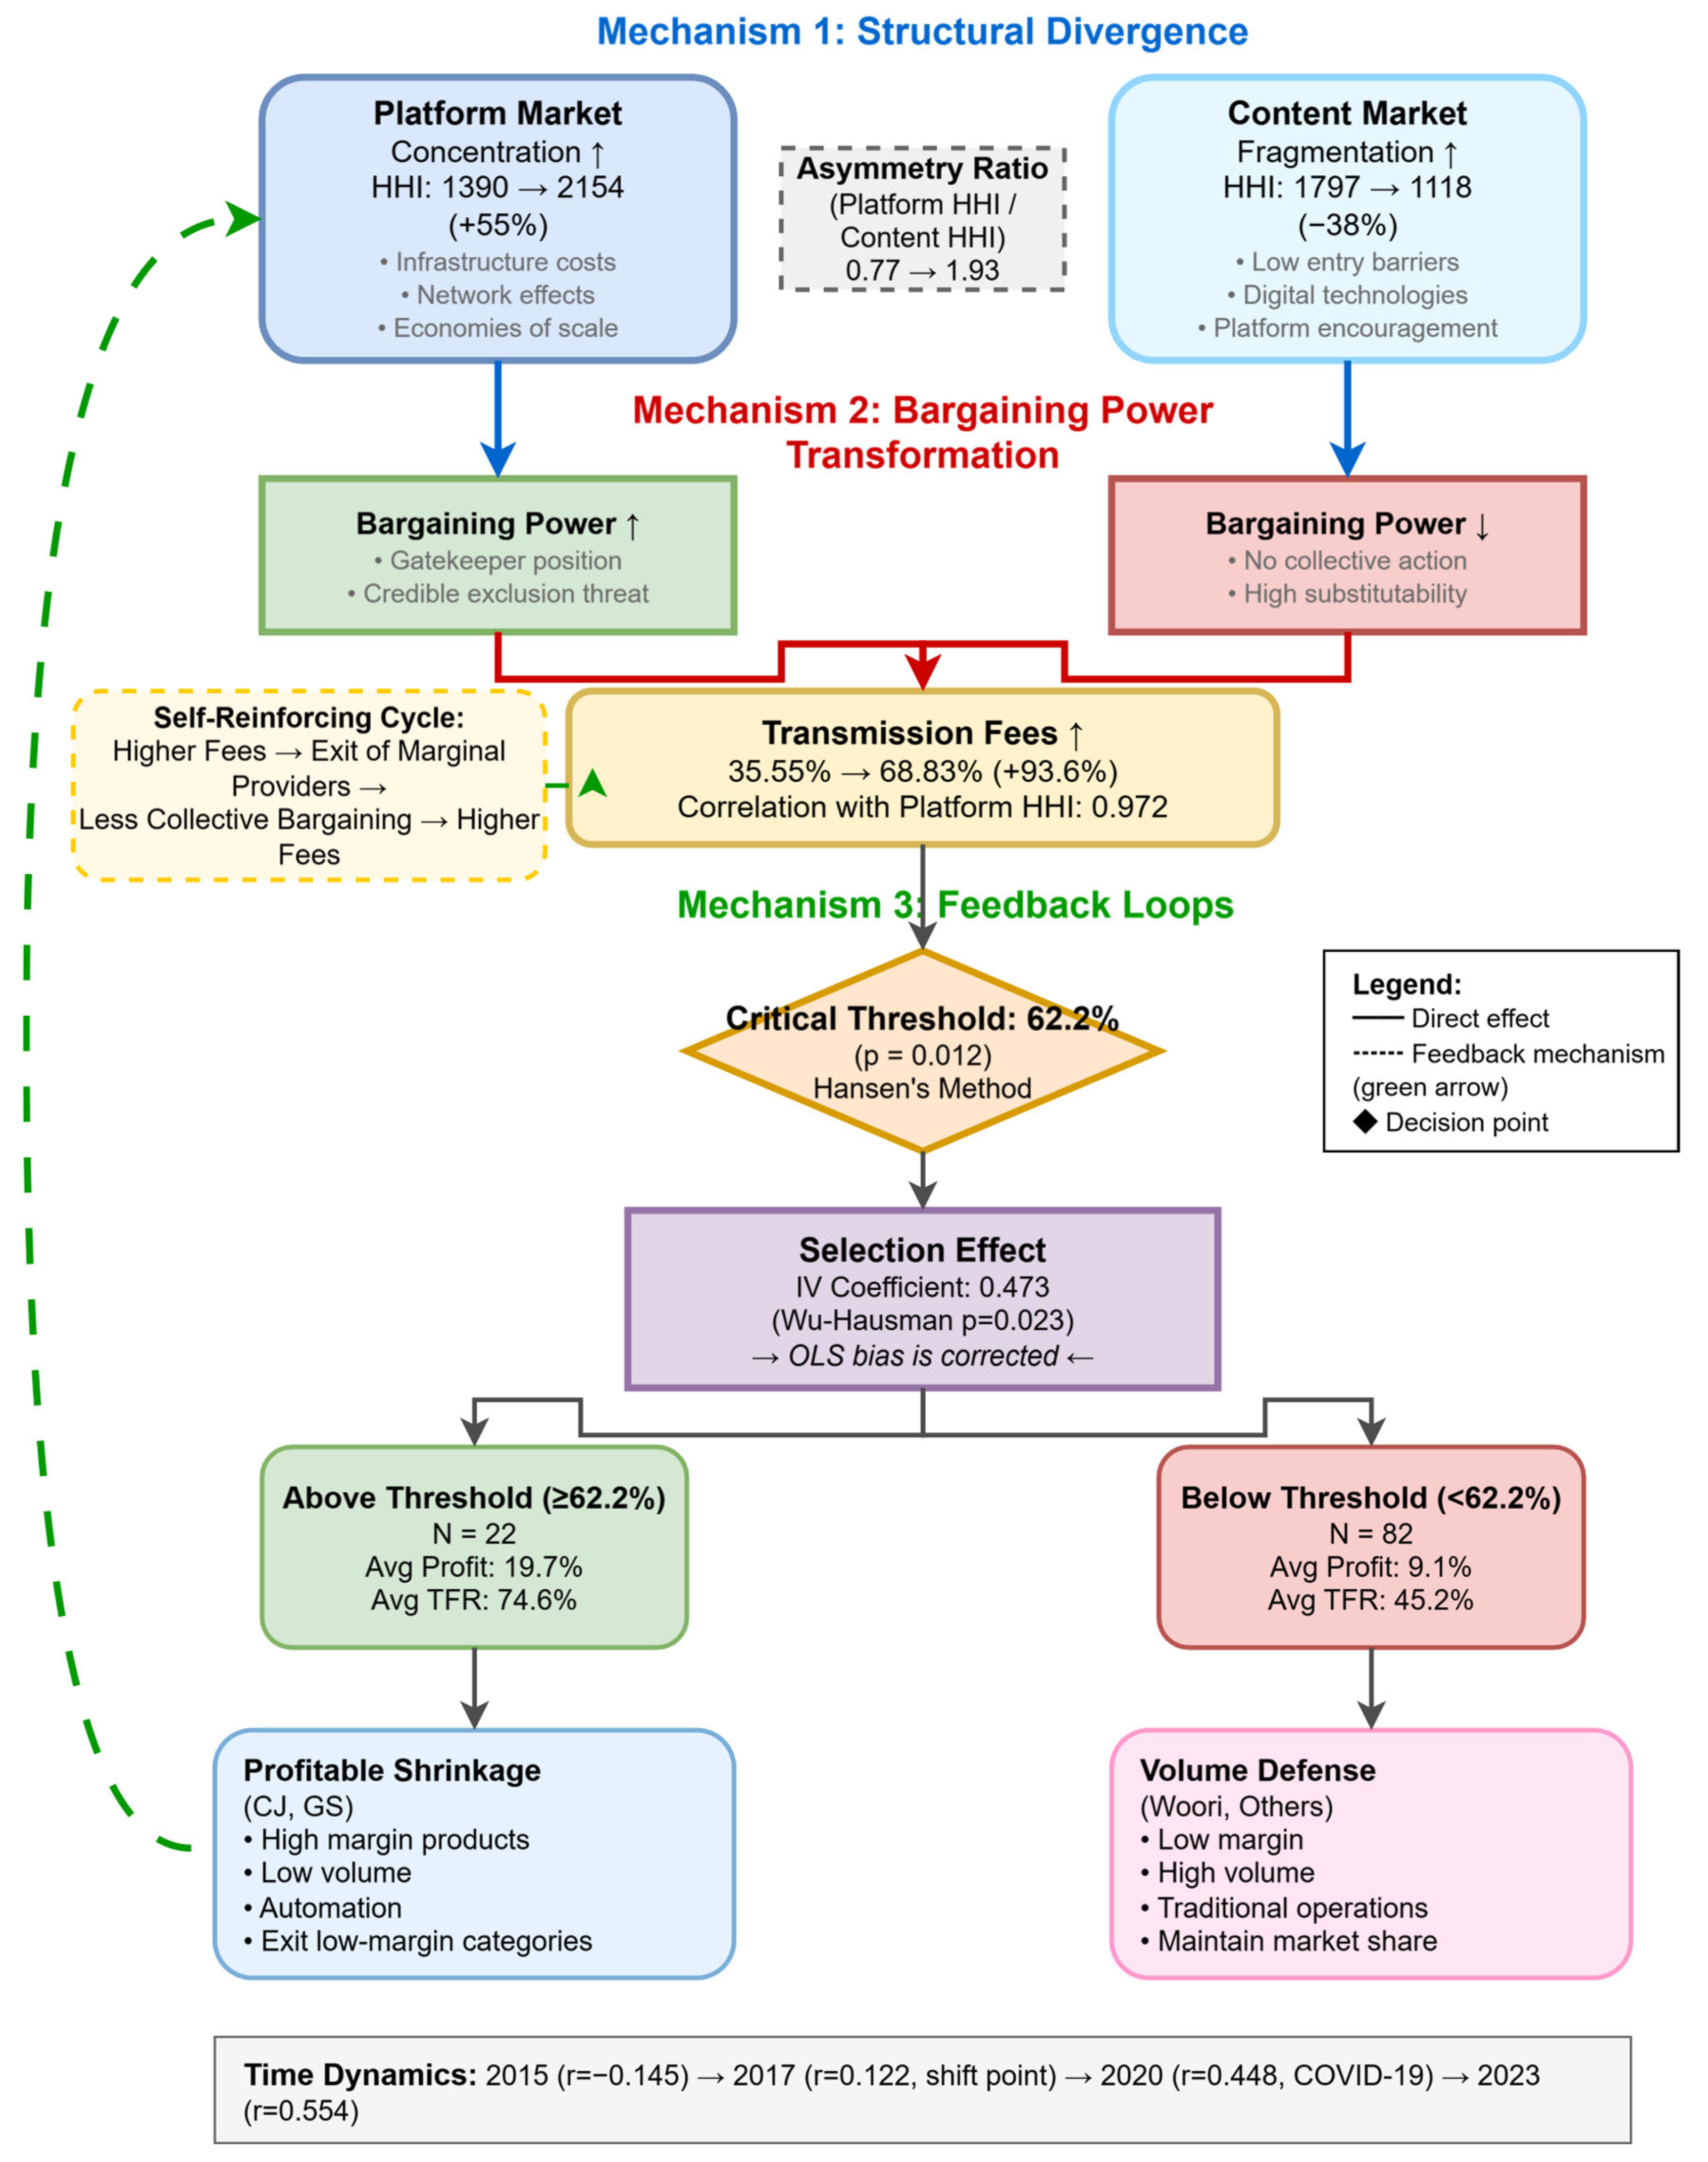
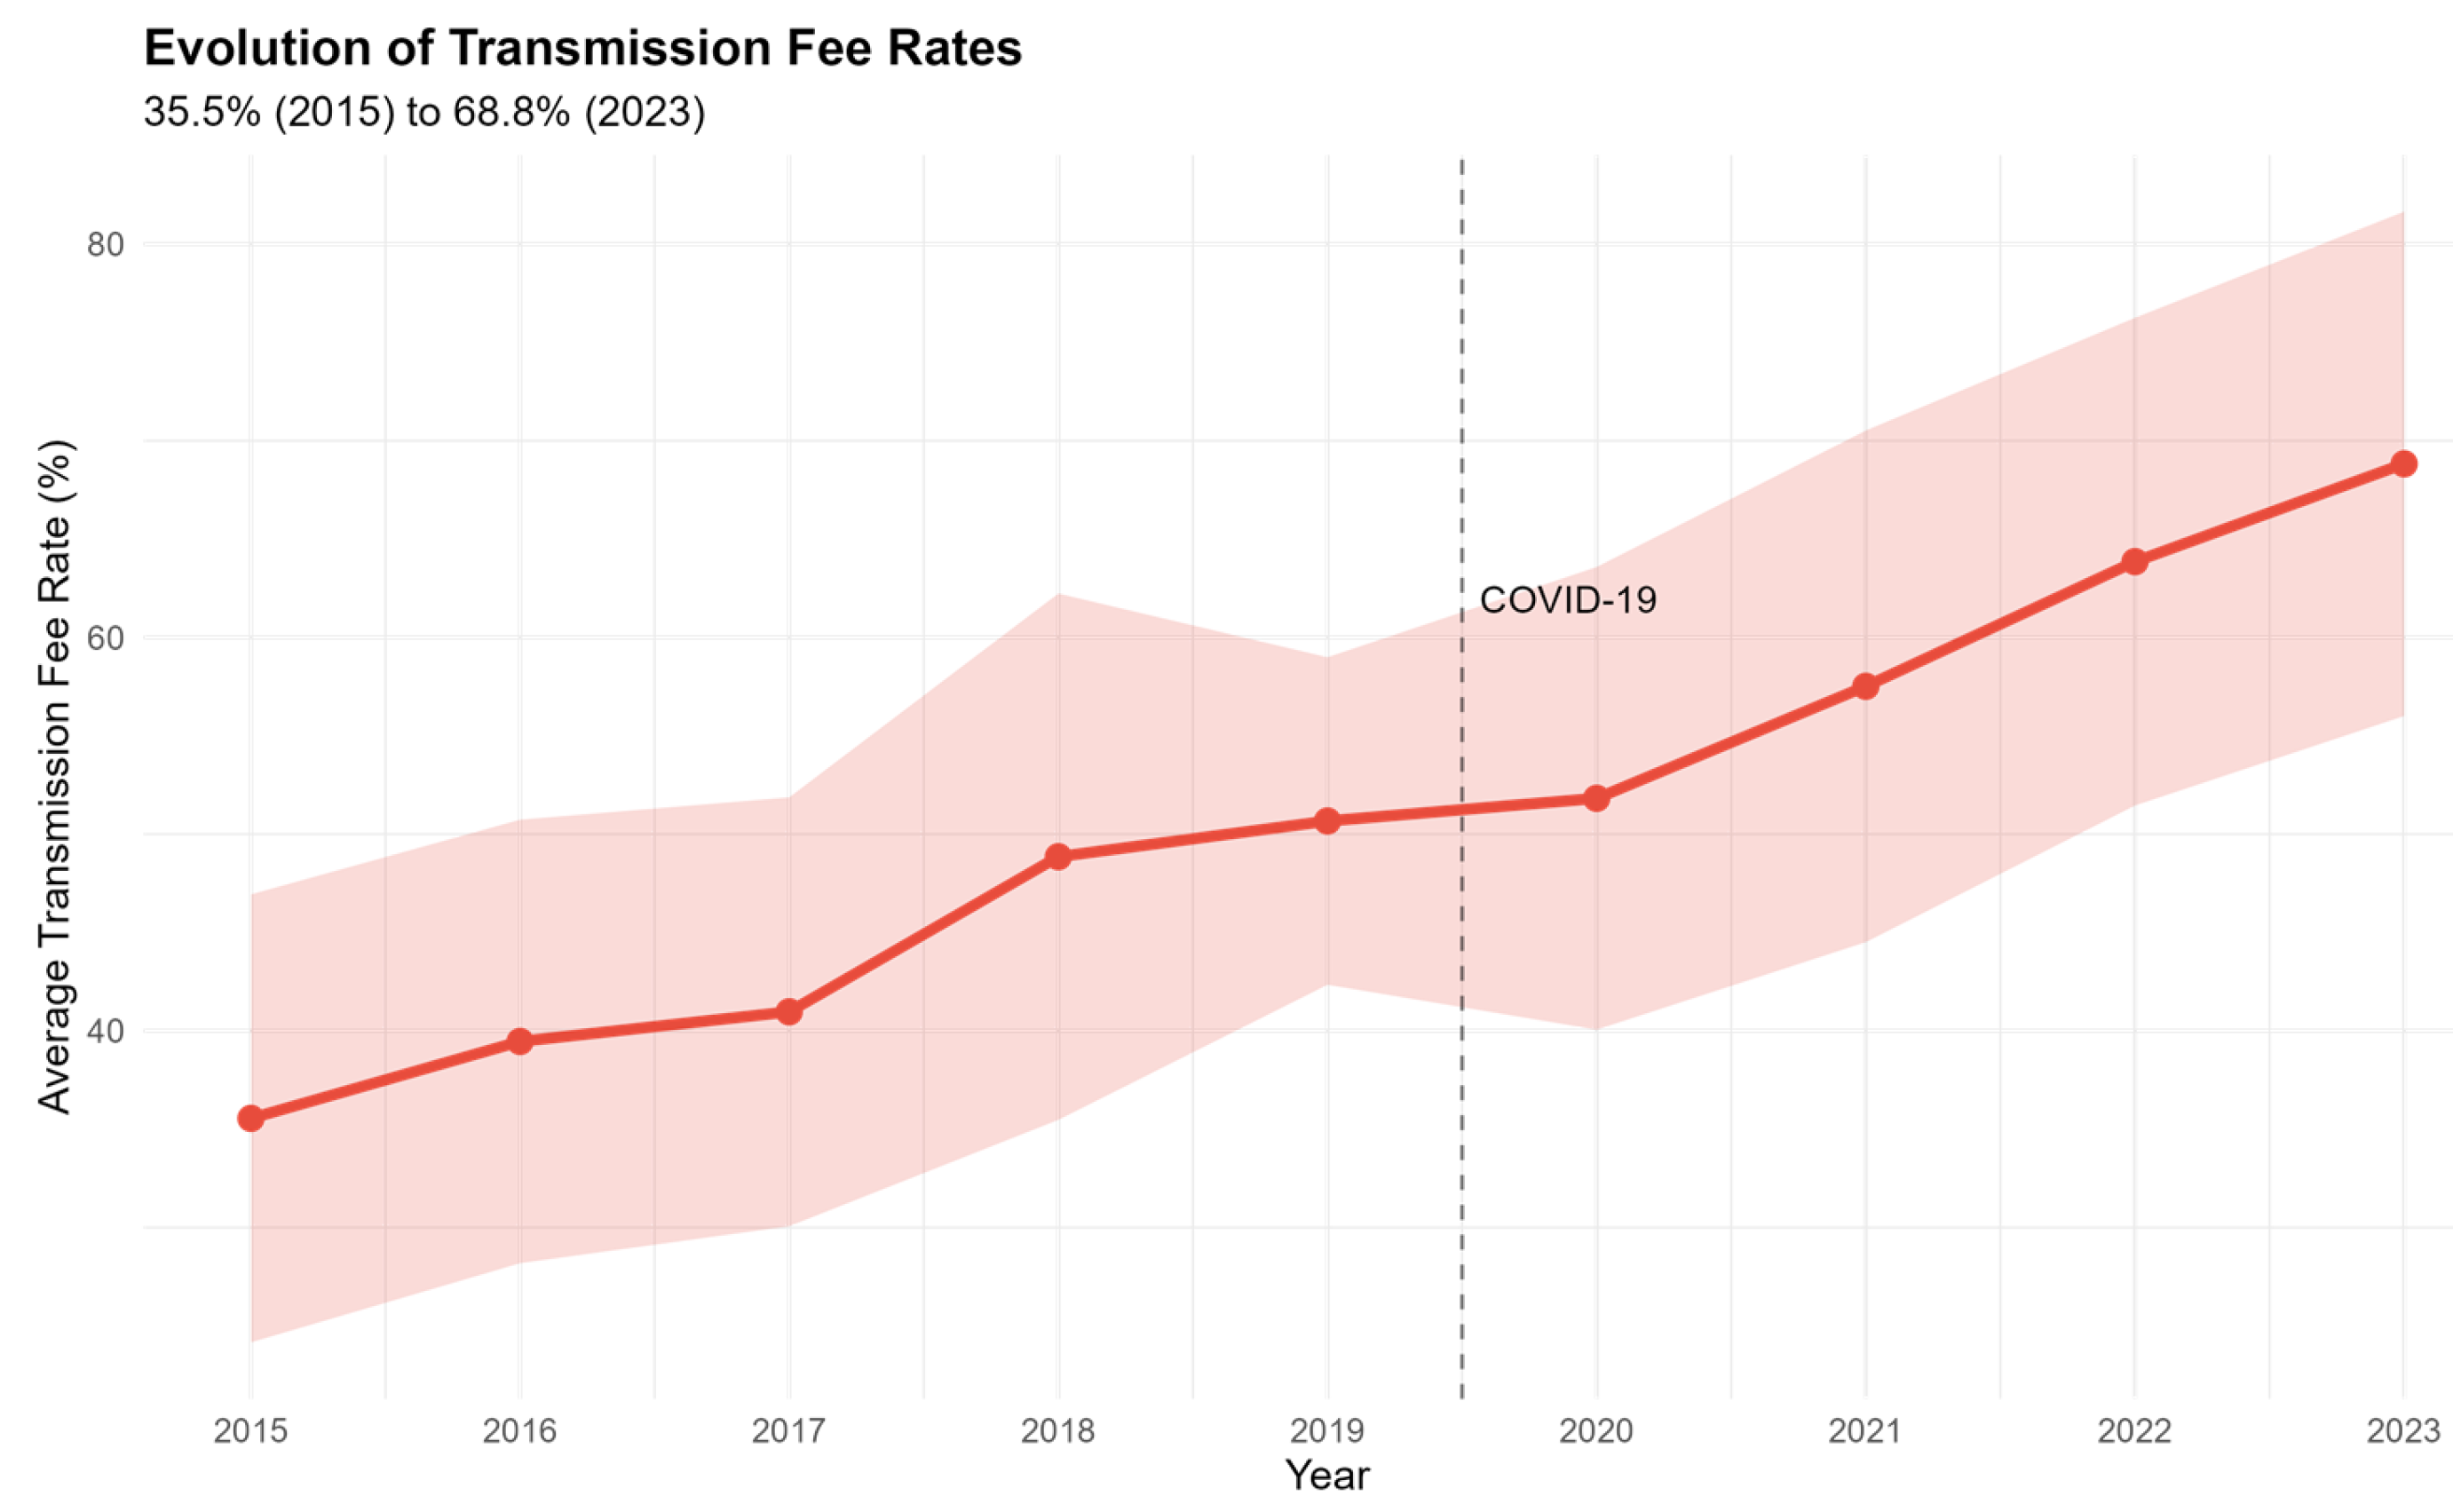
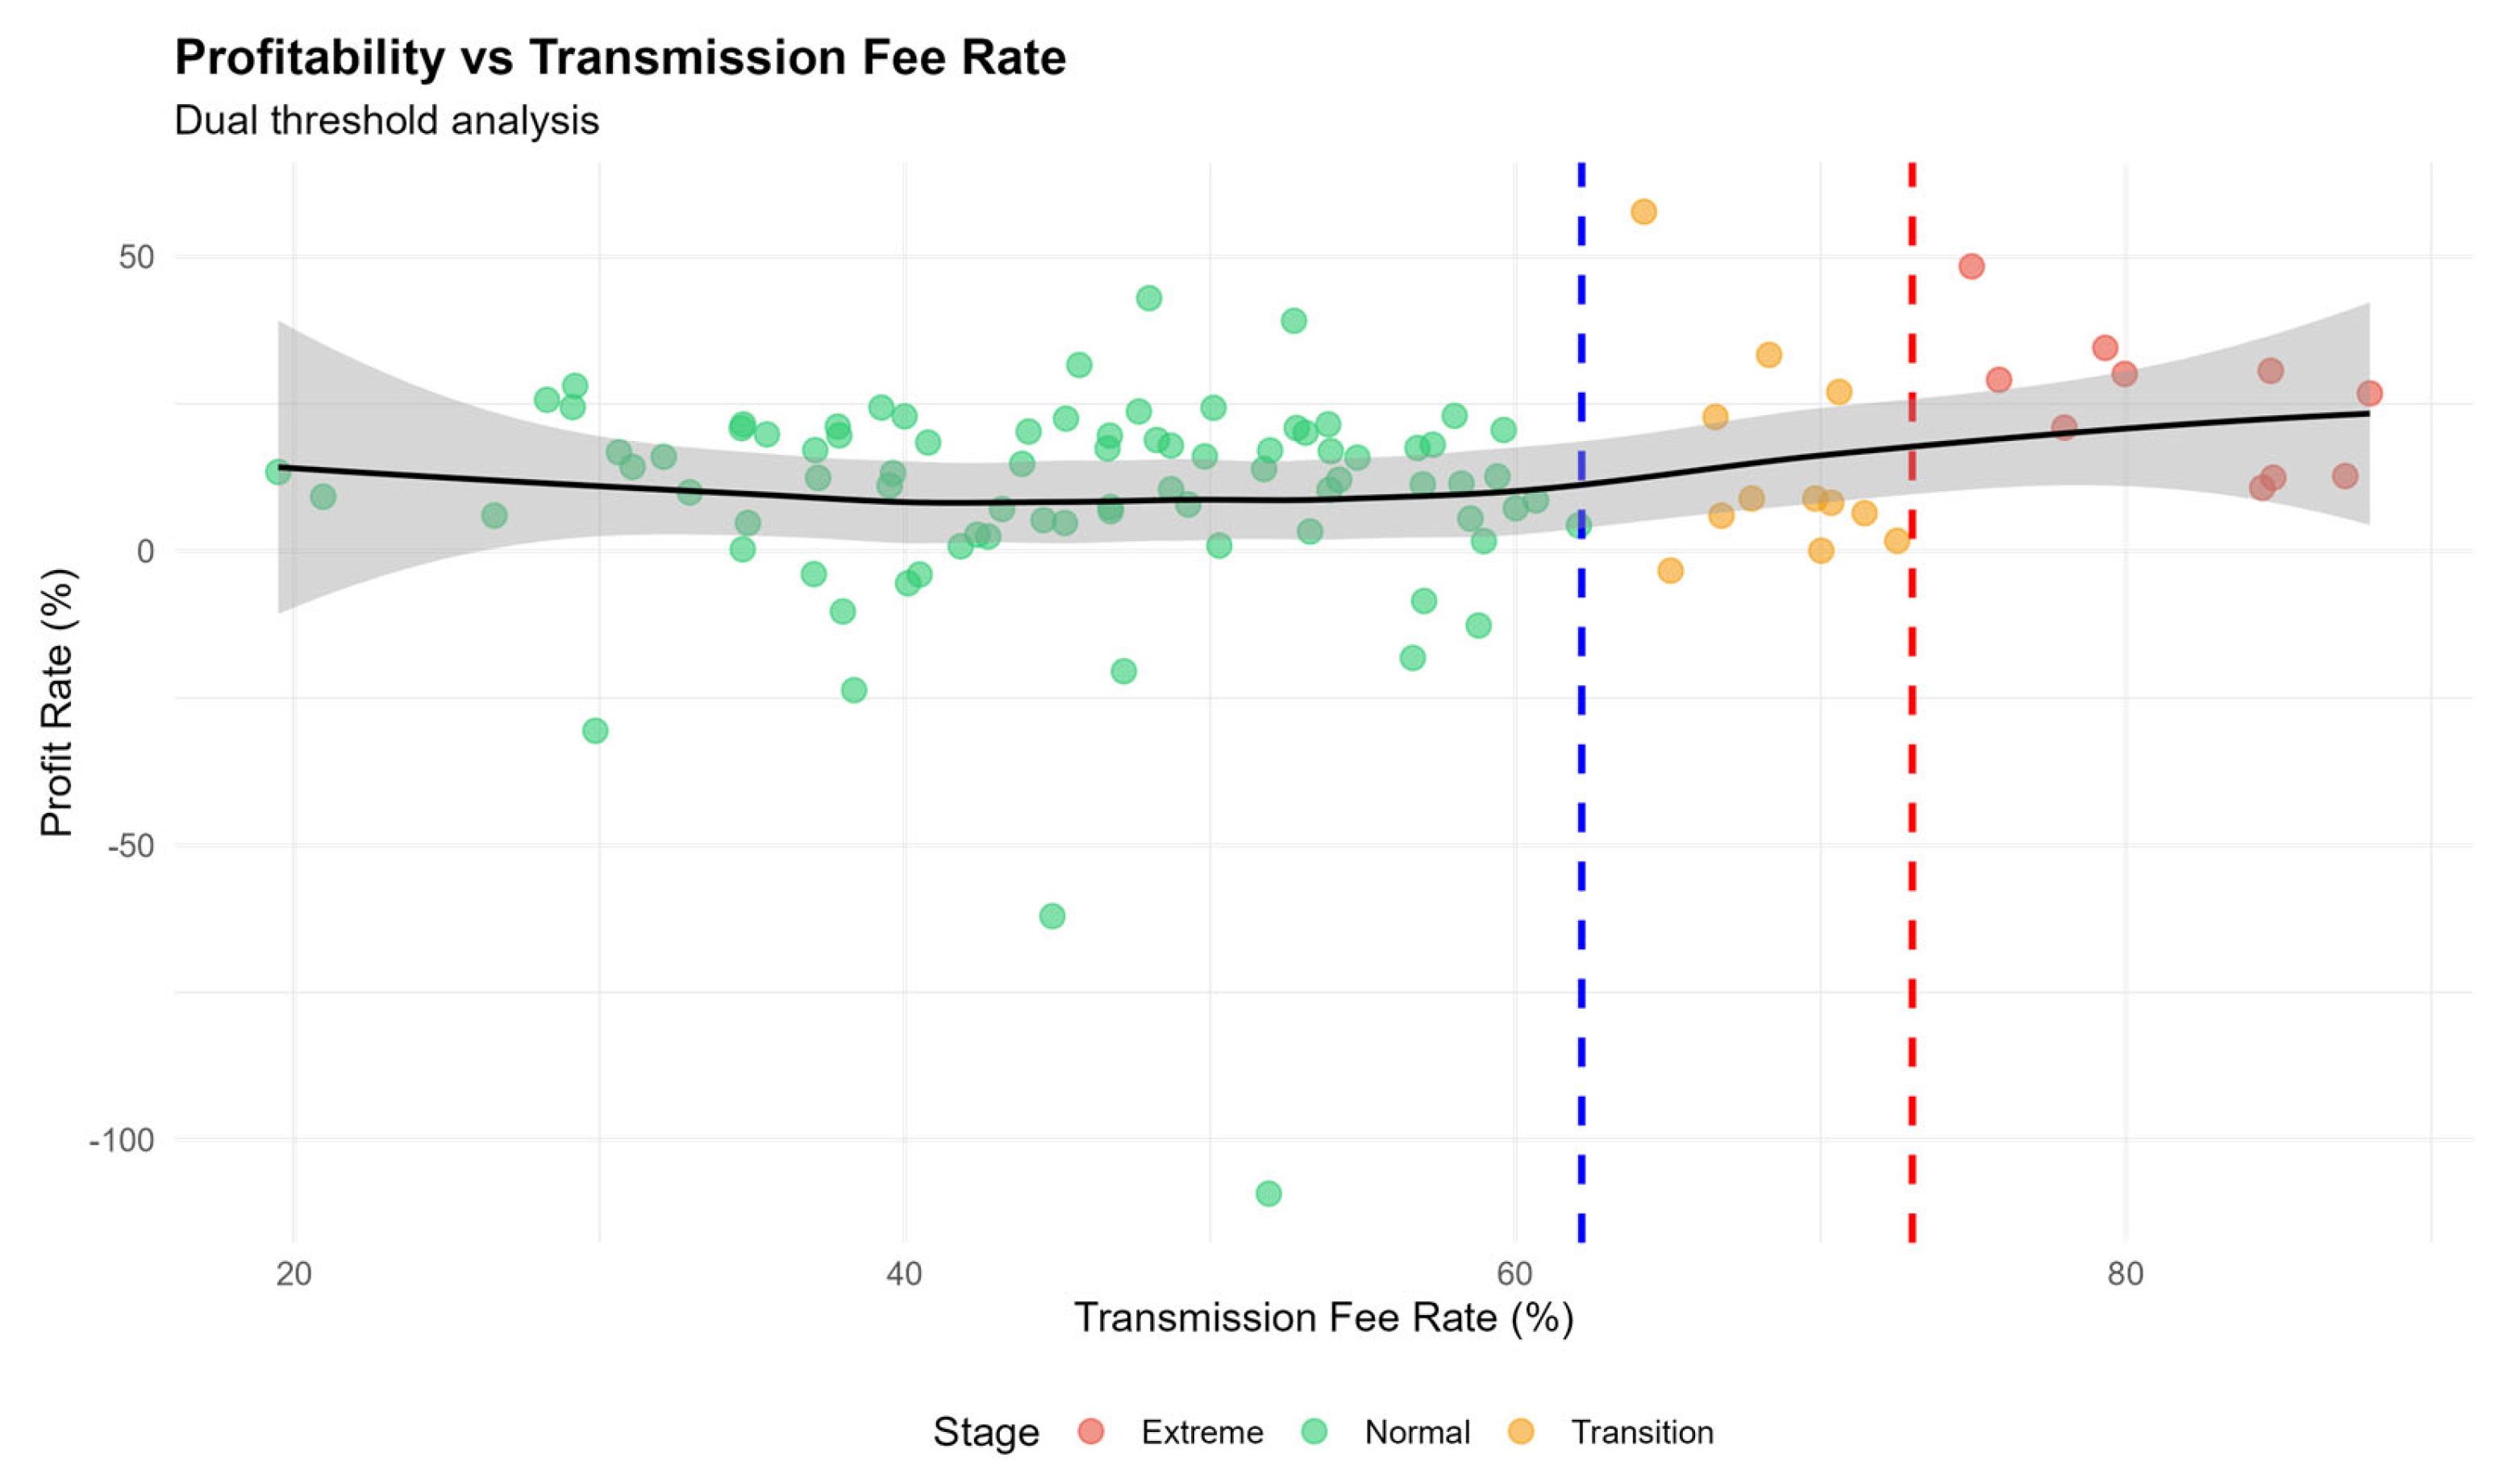

