
Hydrogeochemical Characteristics and Evolutionary Mechanisms of the Nanping Geothermal Field, Southeastern Hainan Island, China

Abstract
1. Introduction
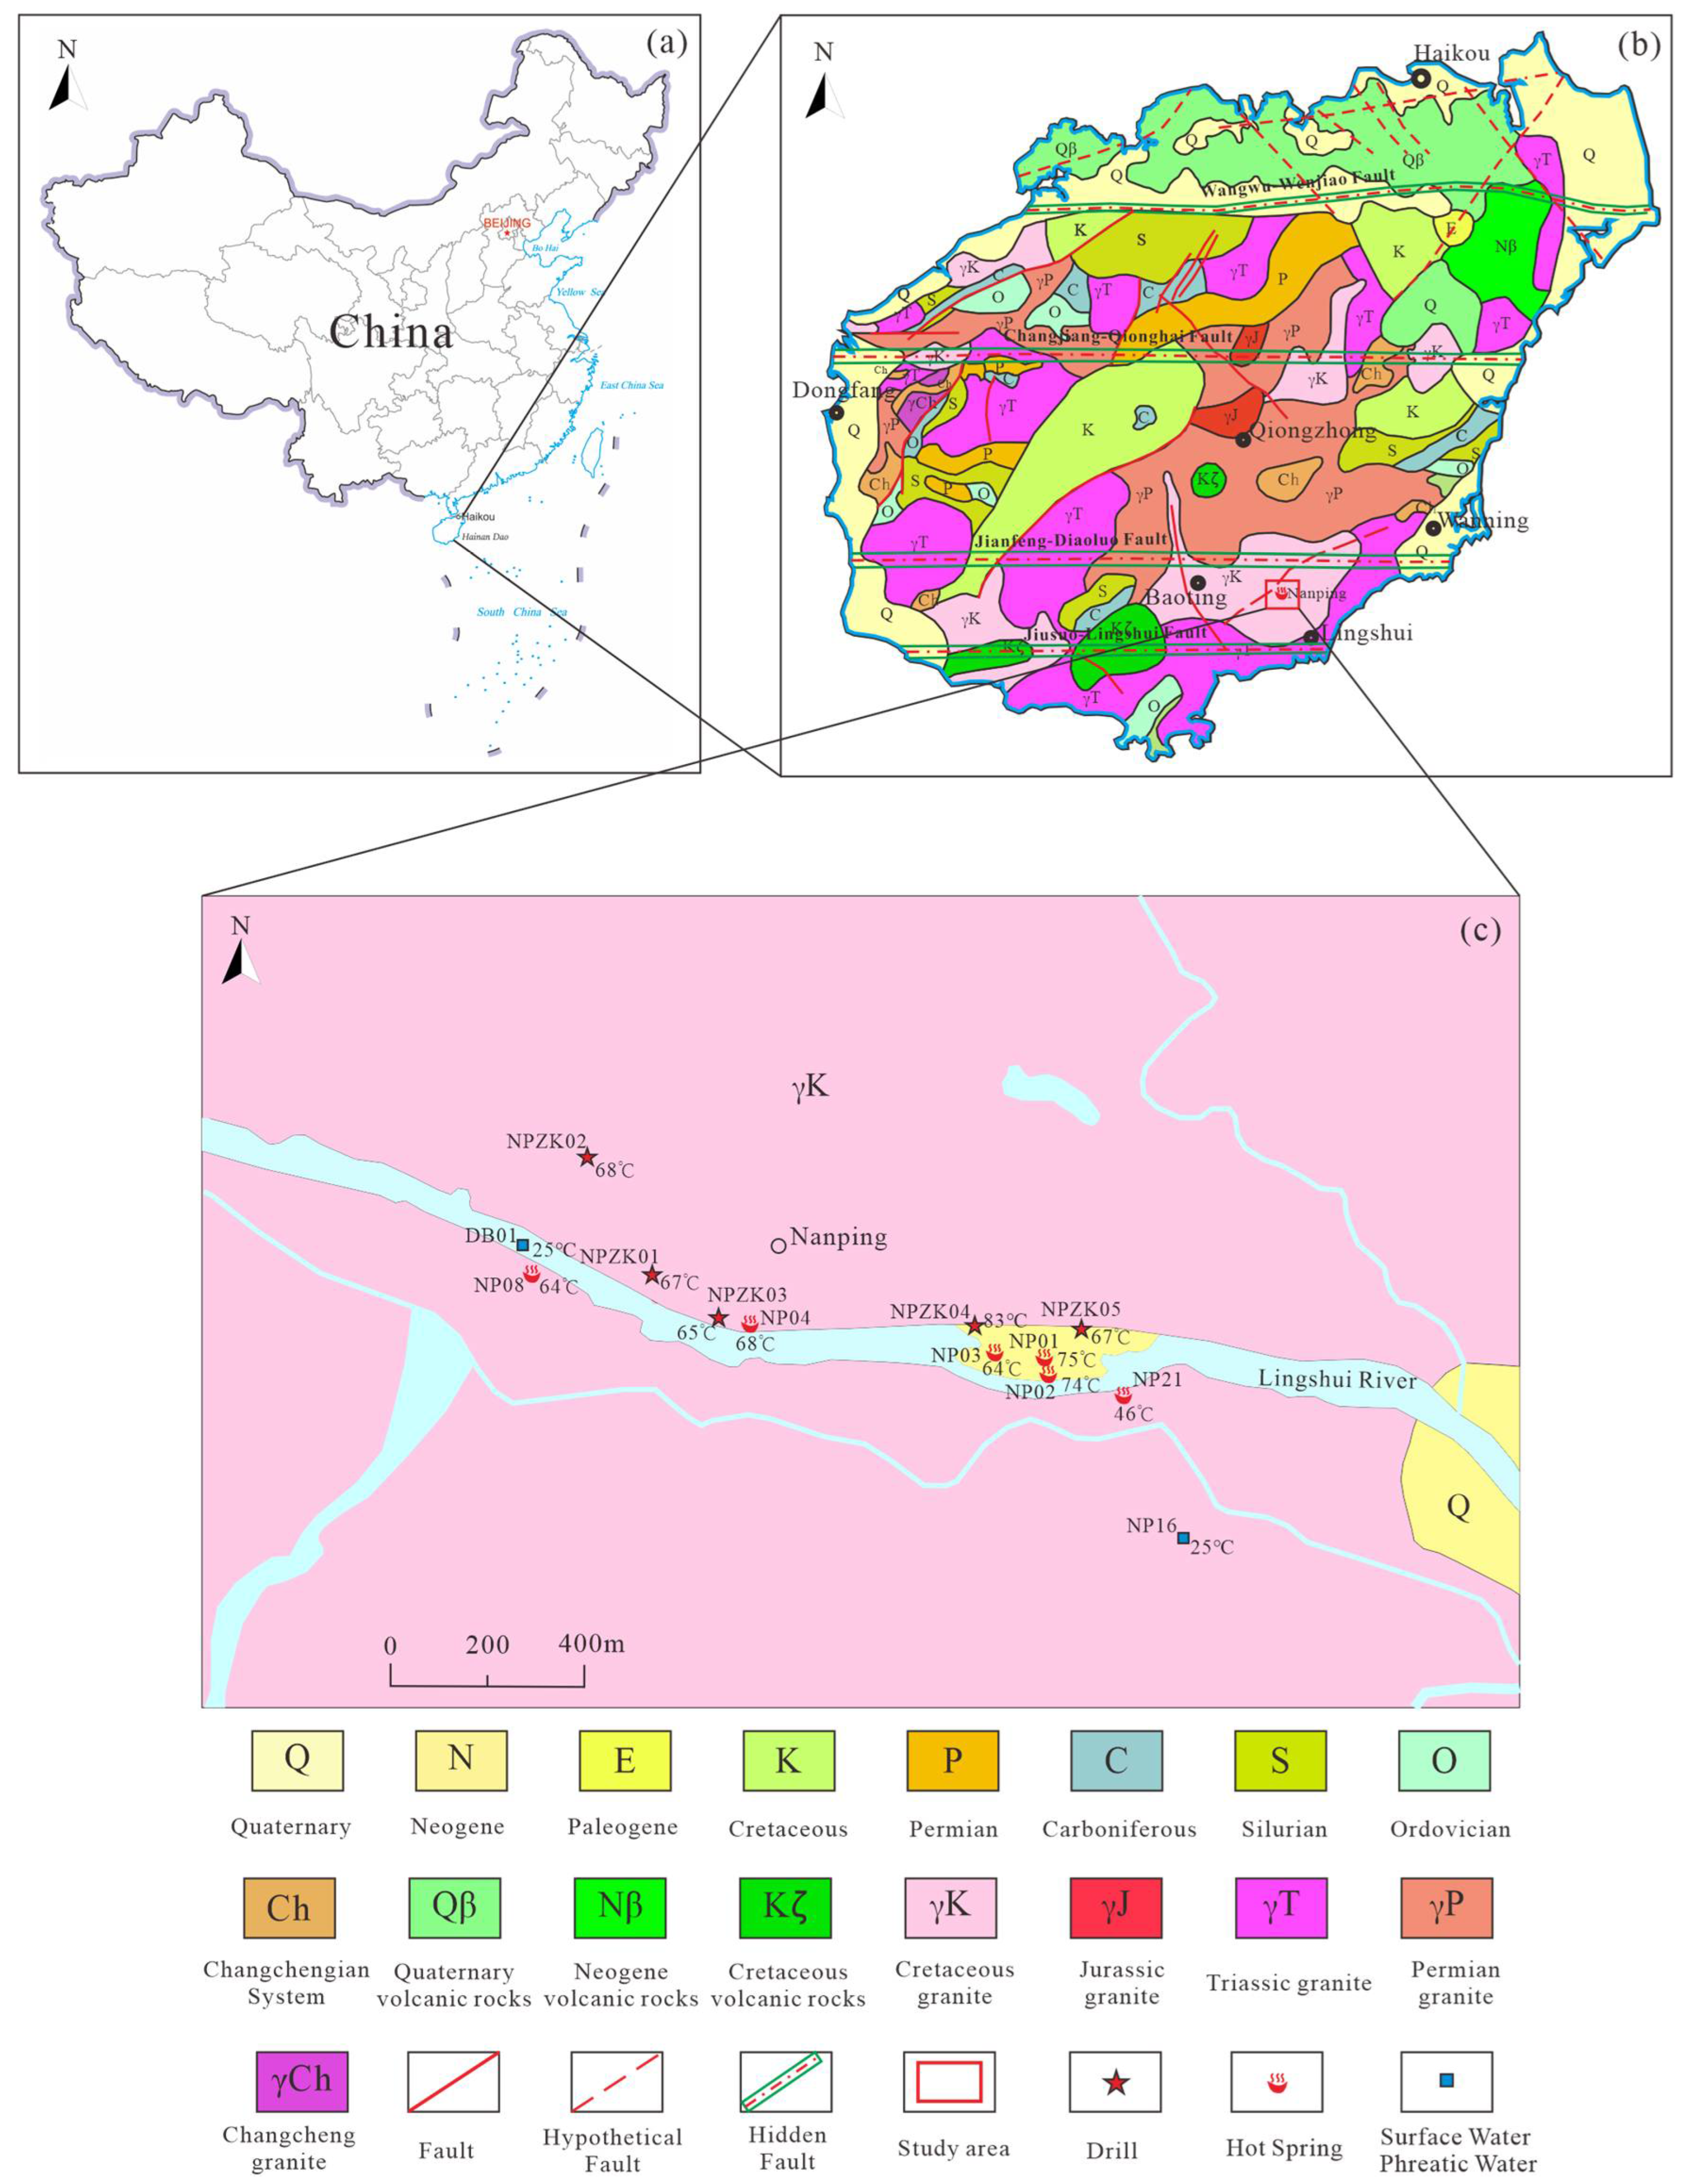
2. Study Area
3. Samples and Methods
3.1. Samples Collection and Test
3.2. Research Methods
3.3. Test Results
4. Discussion
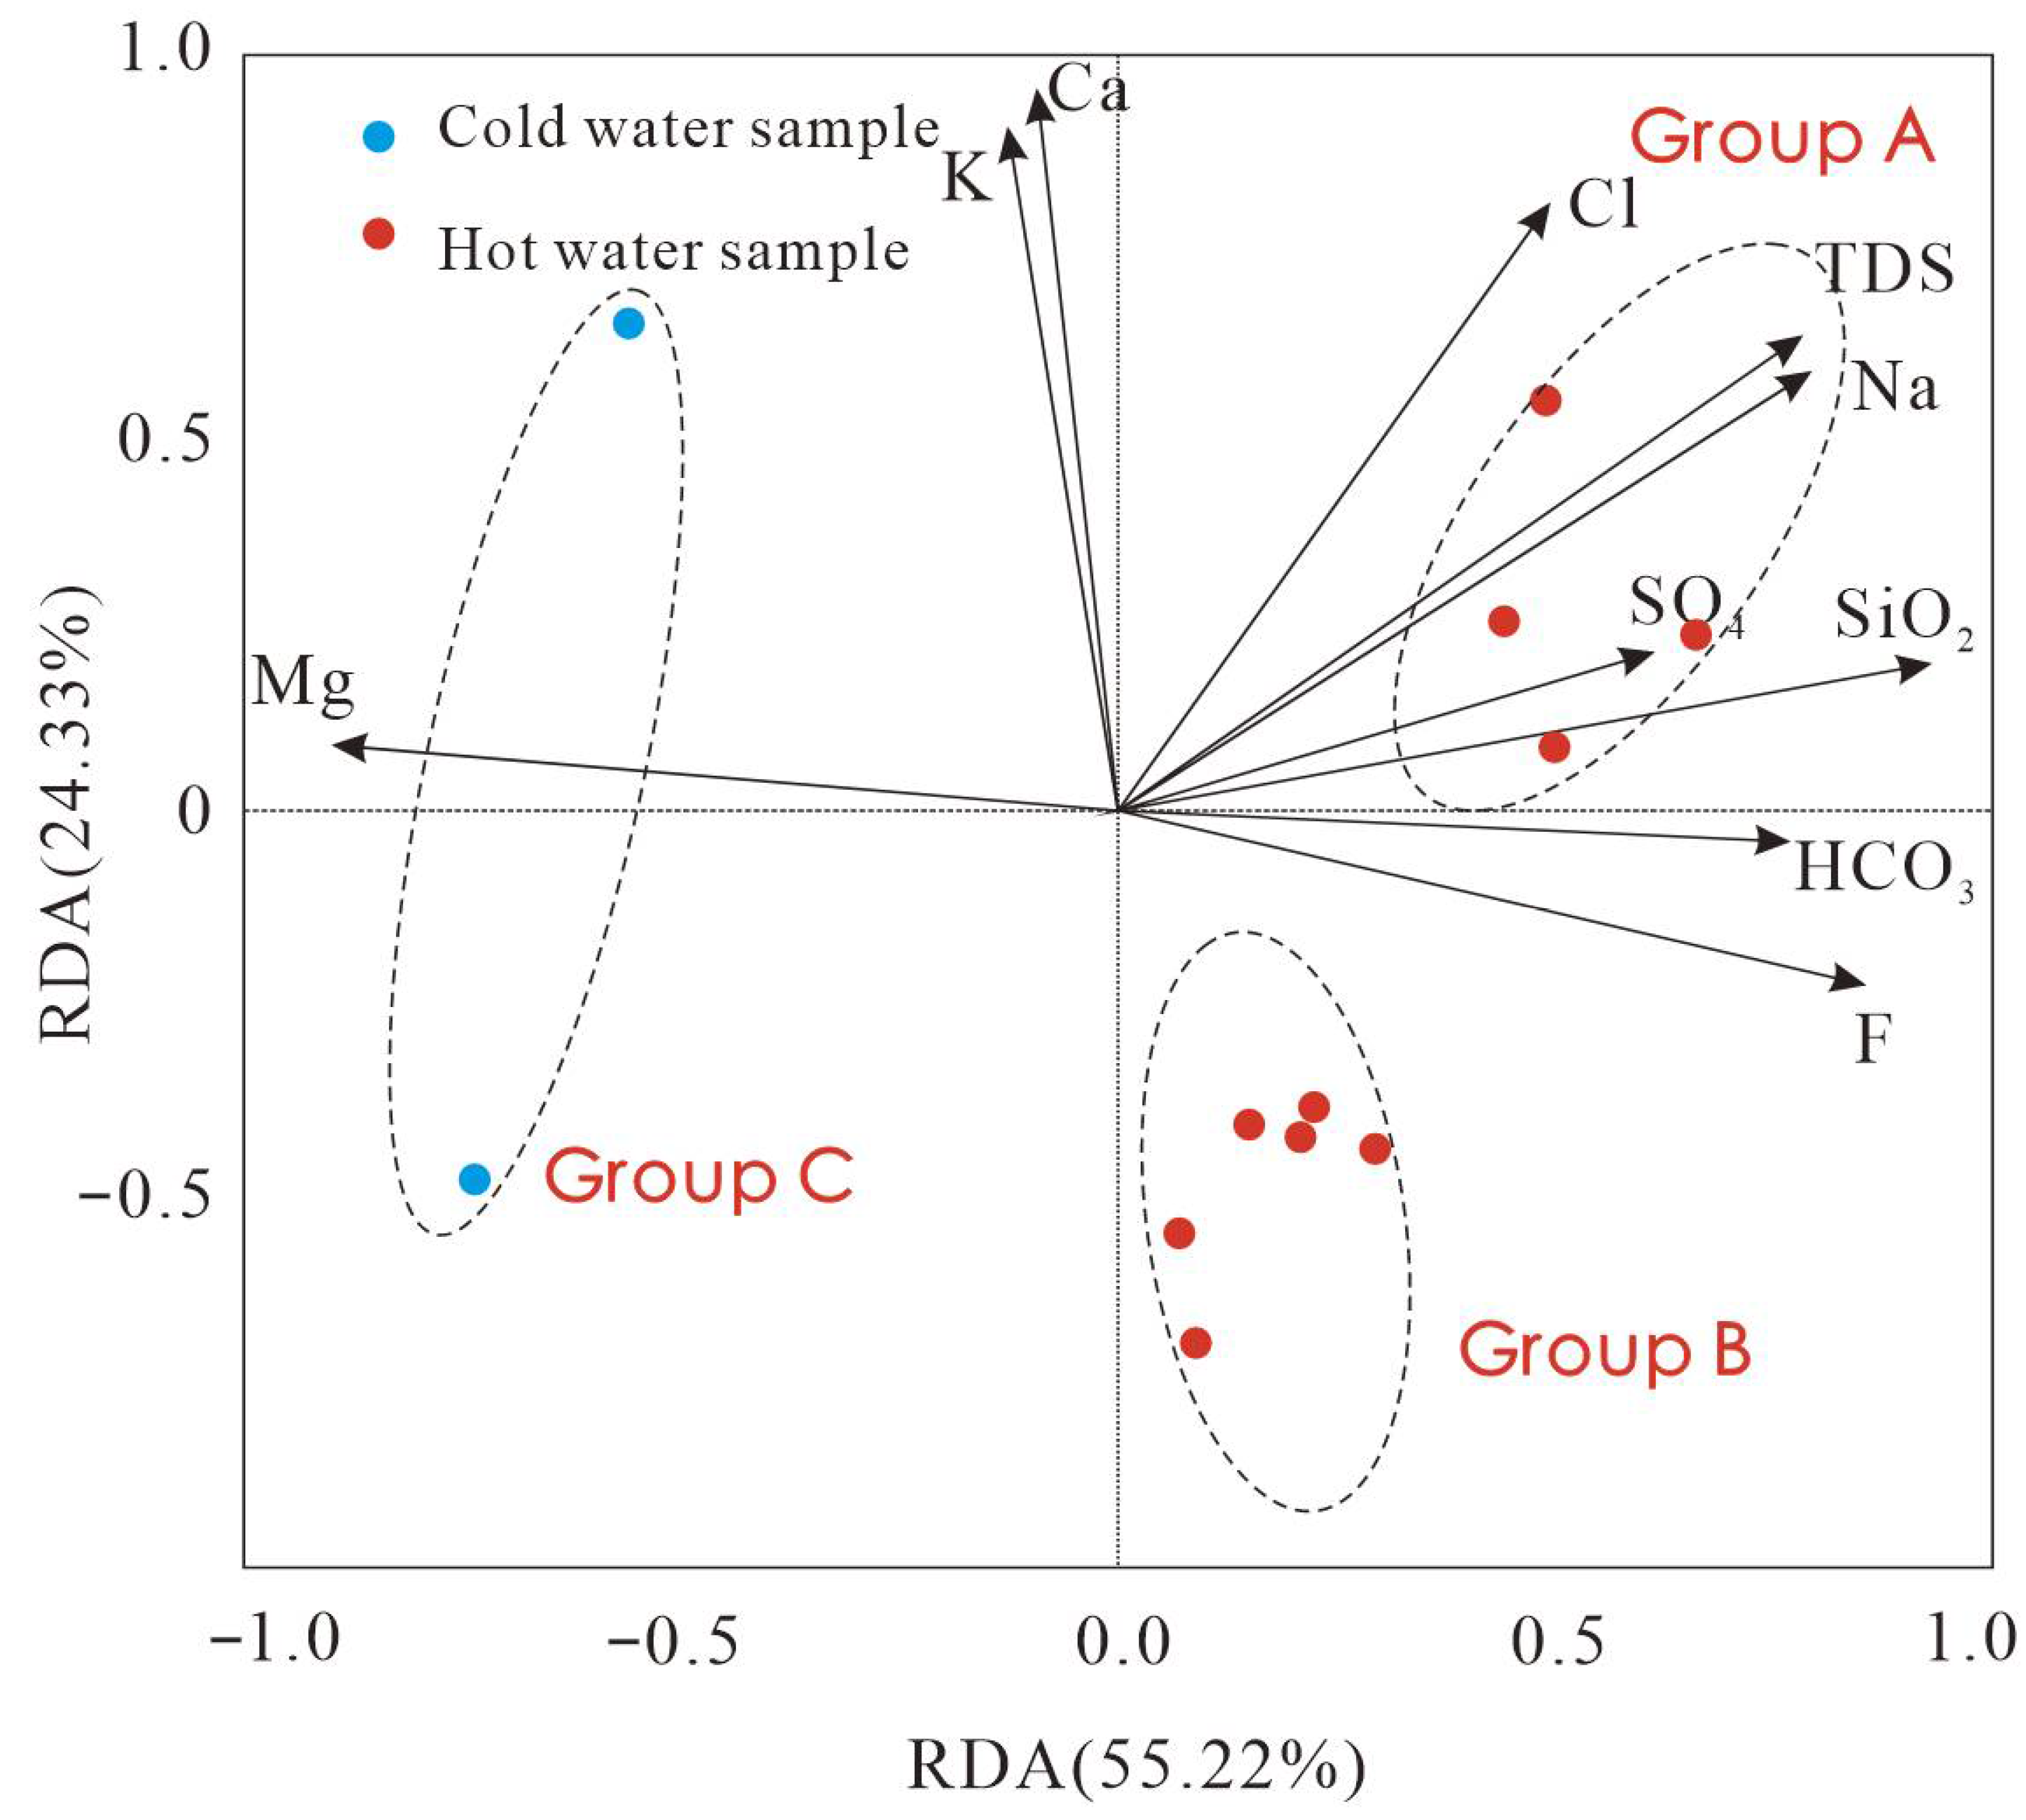
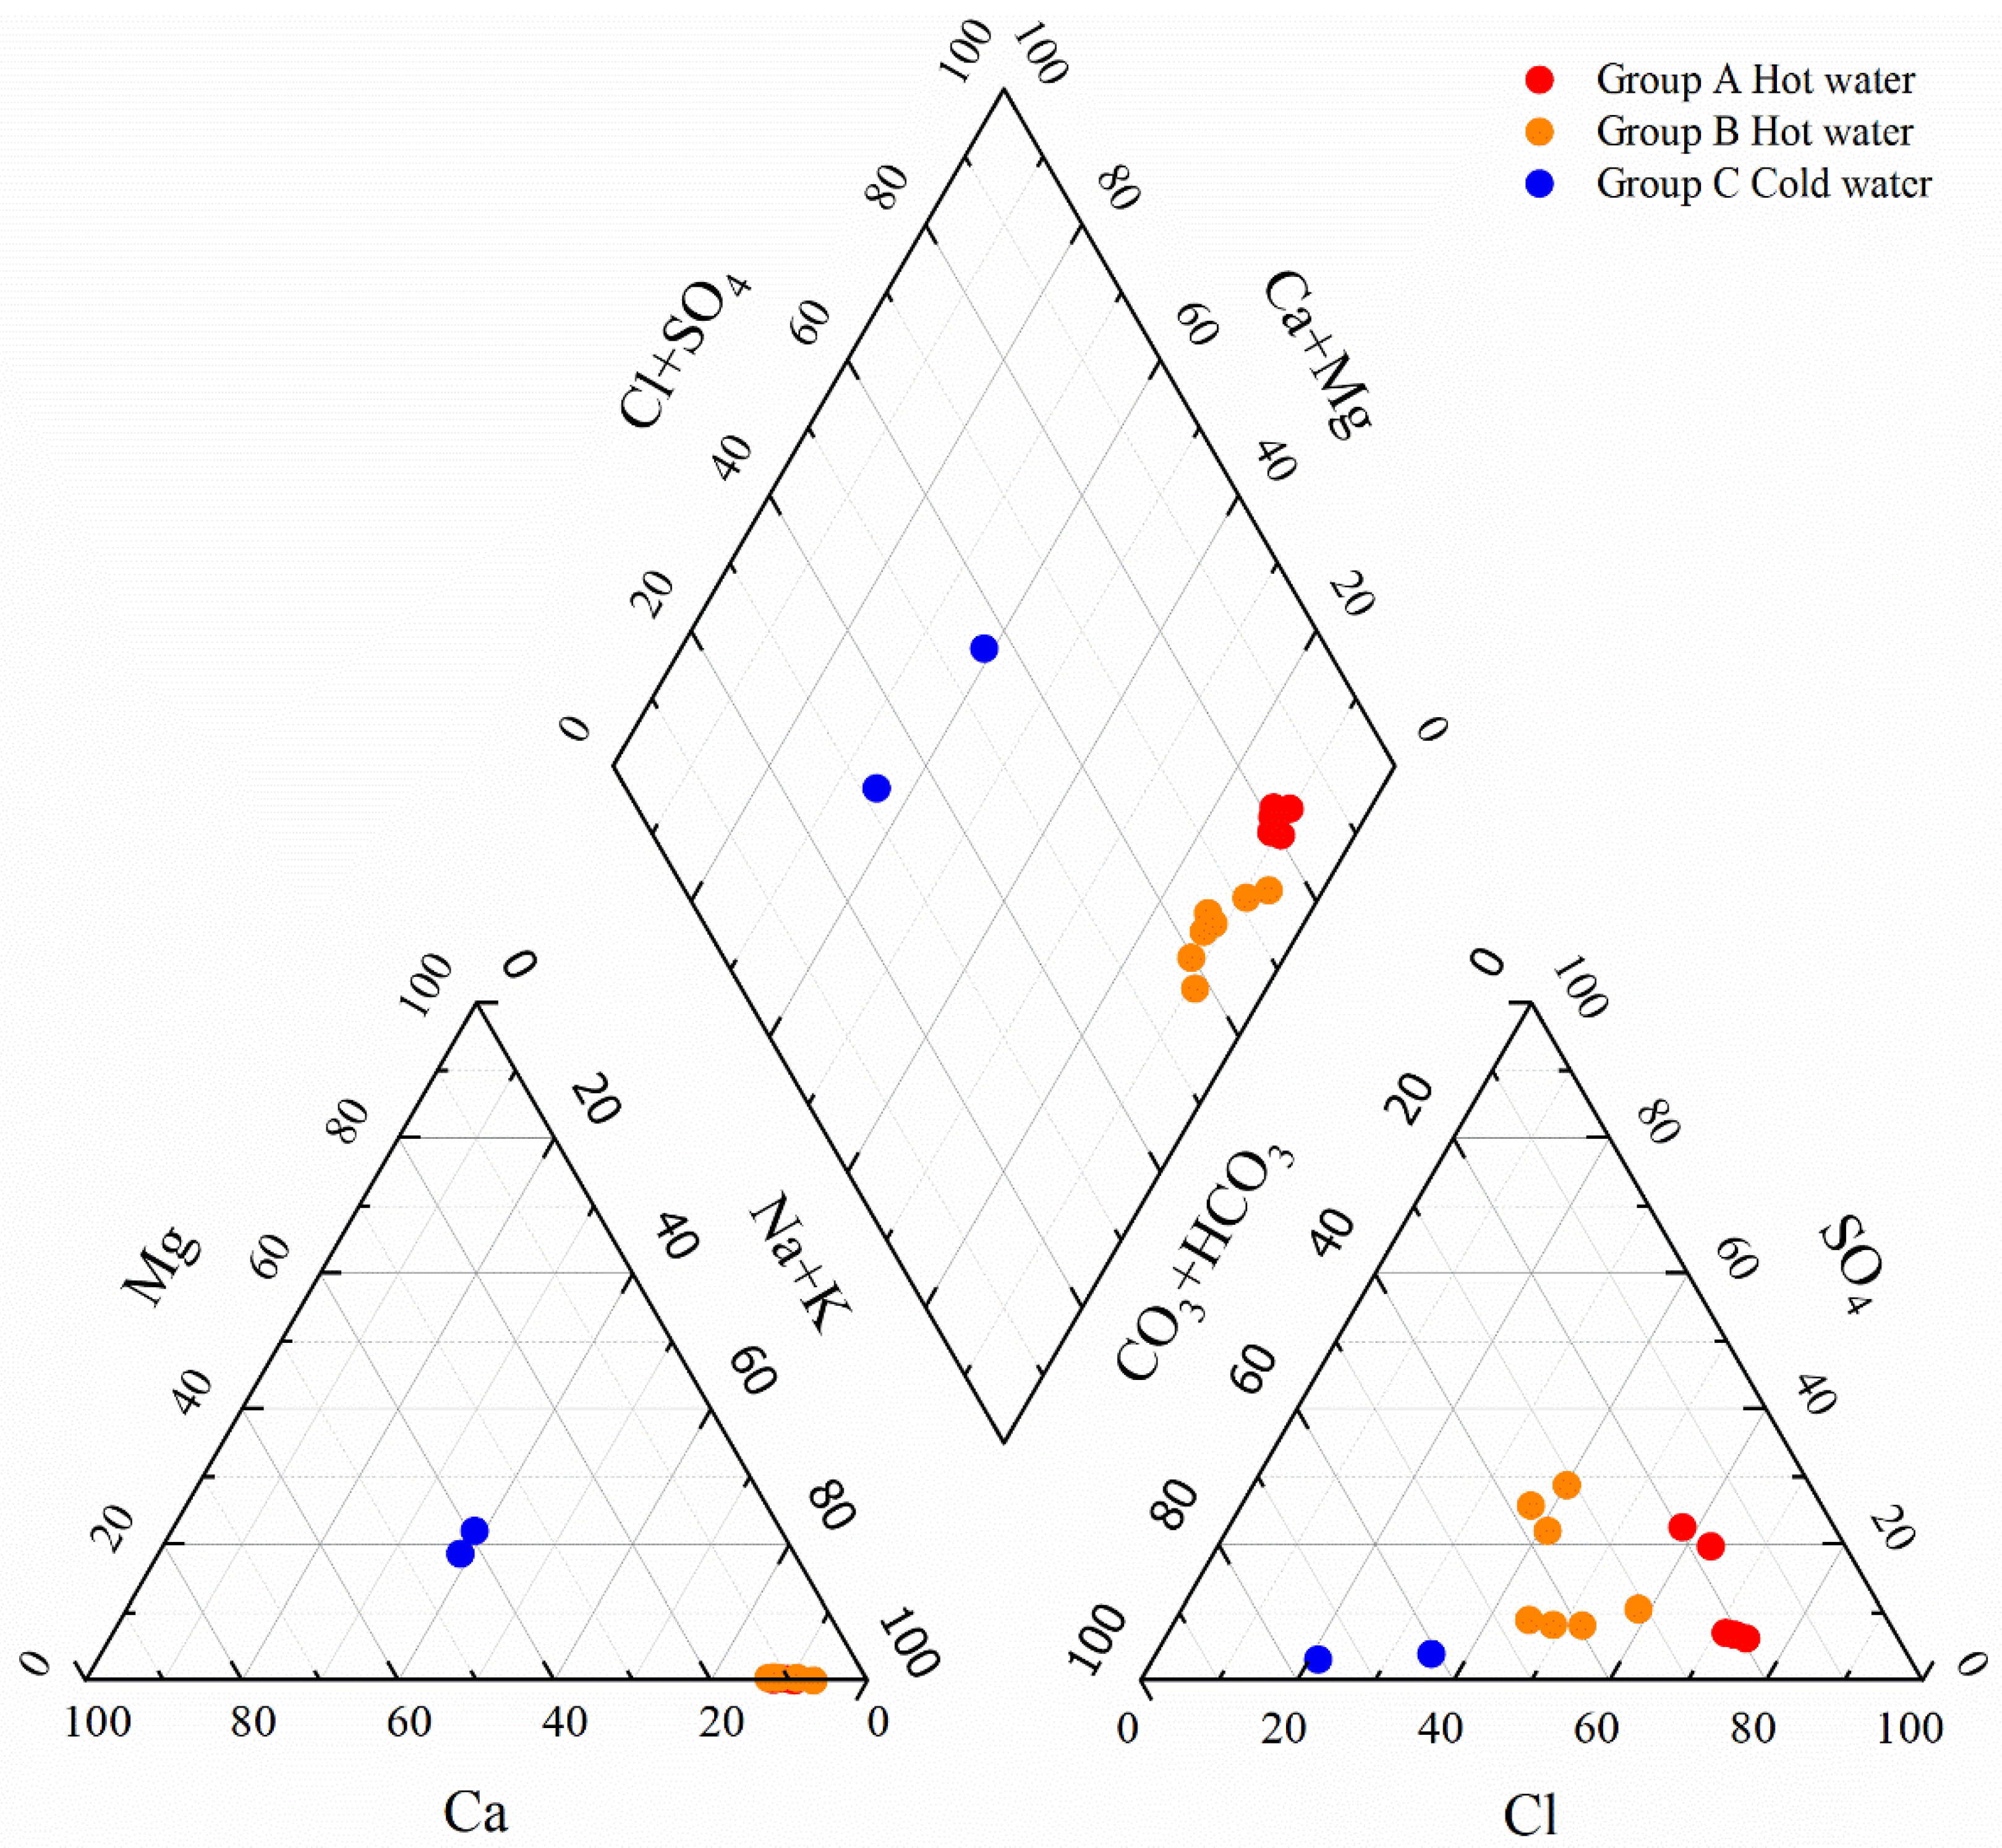
4.1. Analysis of Hydrochemical Evolution
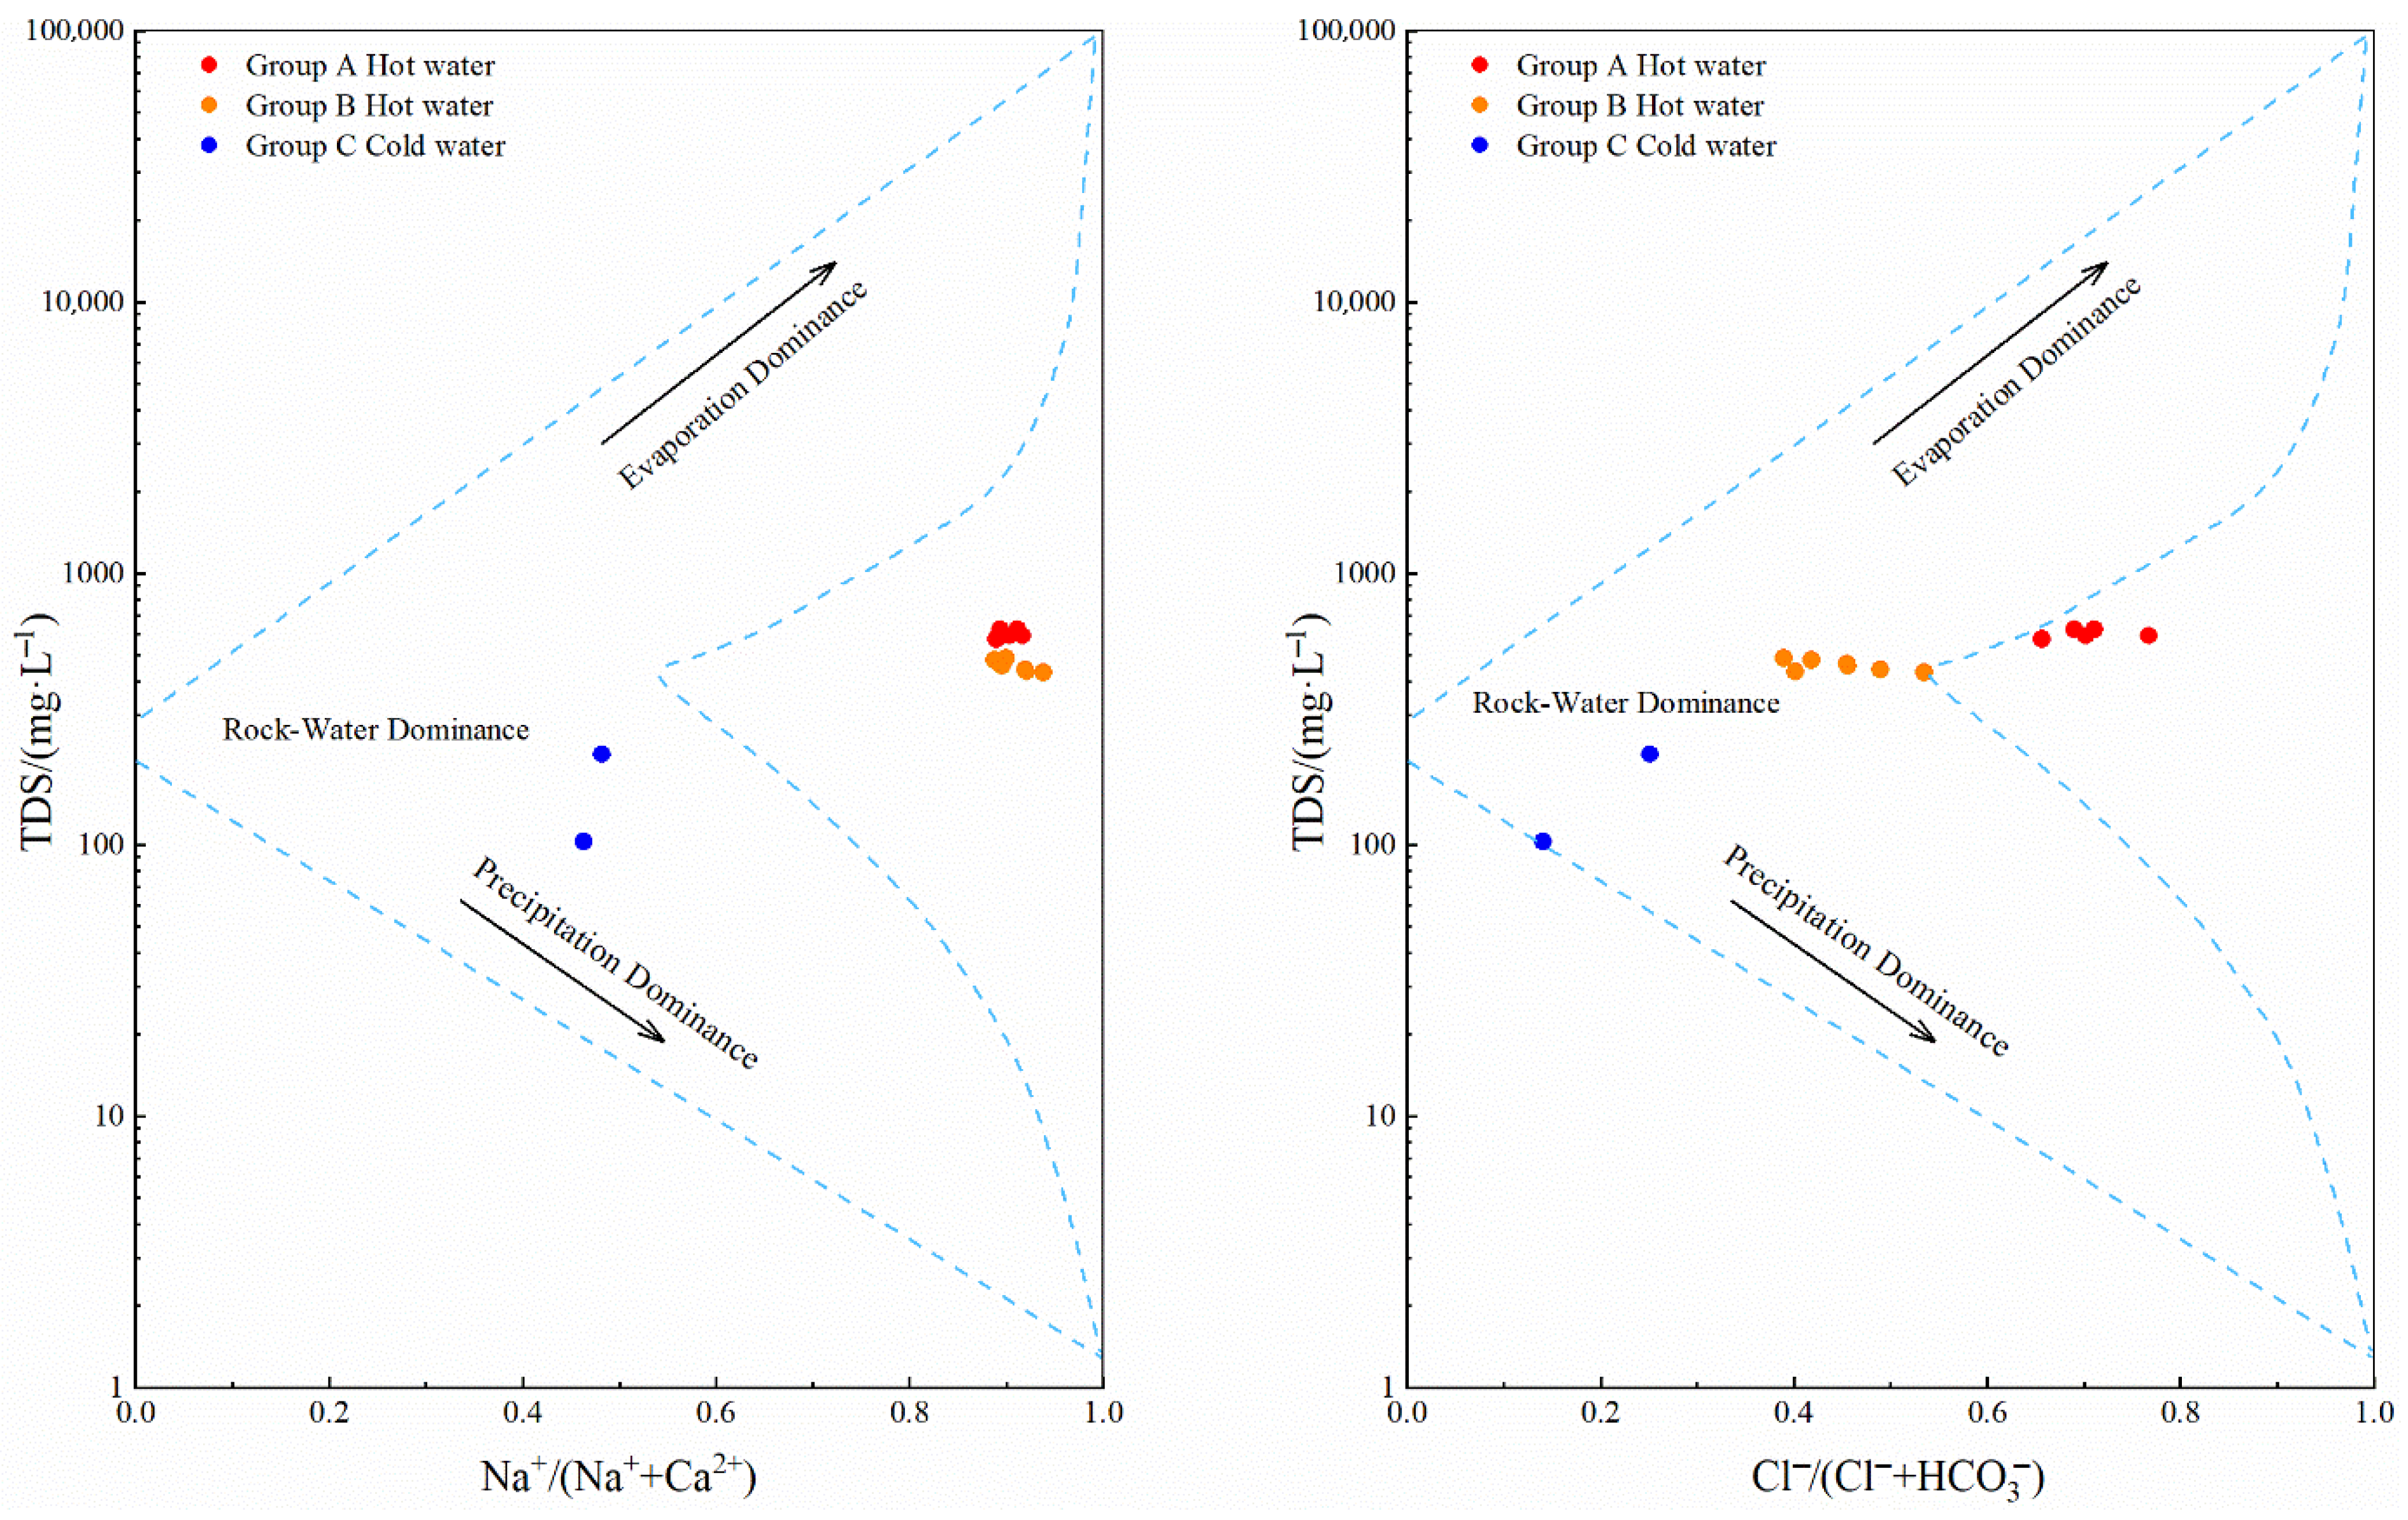
4.1.1. Gibbs Diagram-Based Analysis
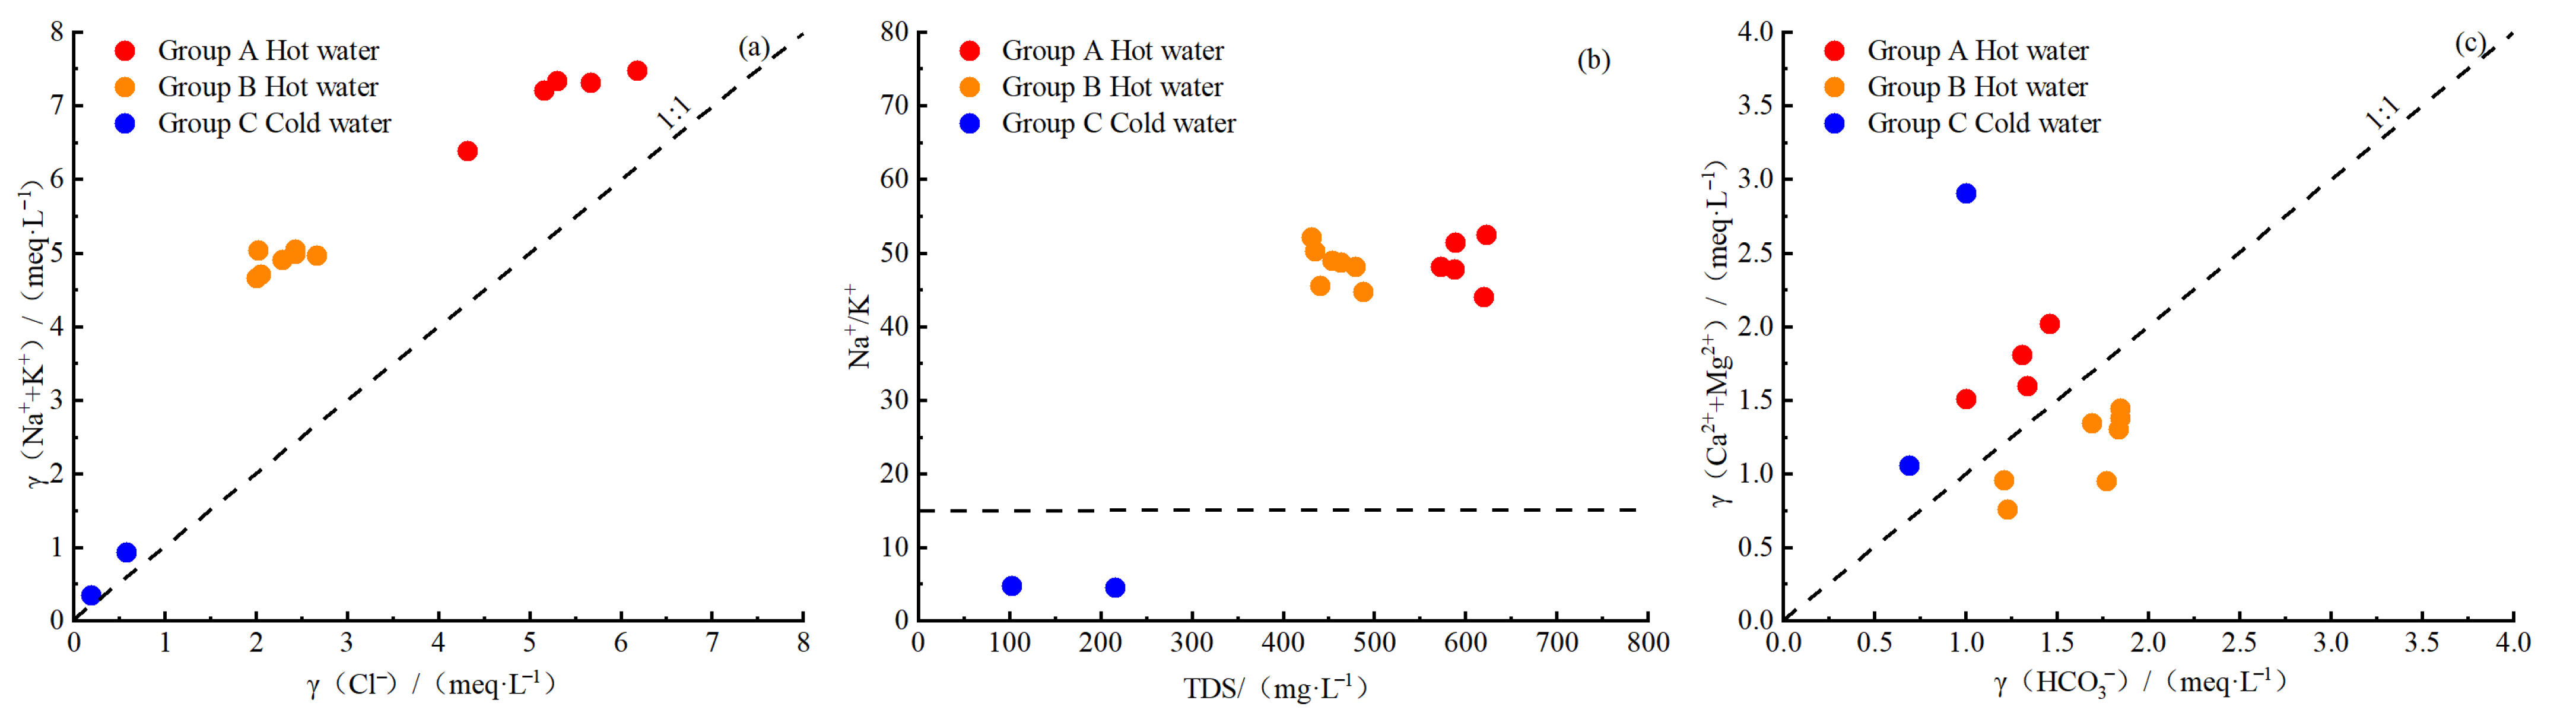
4.1.2. Ion Ratios
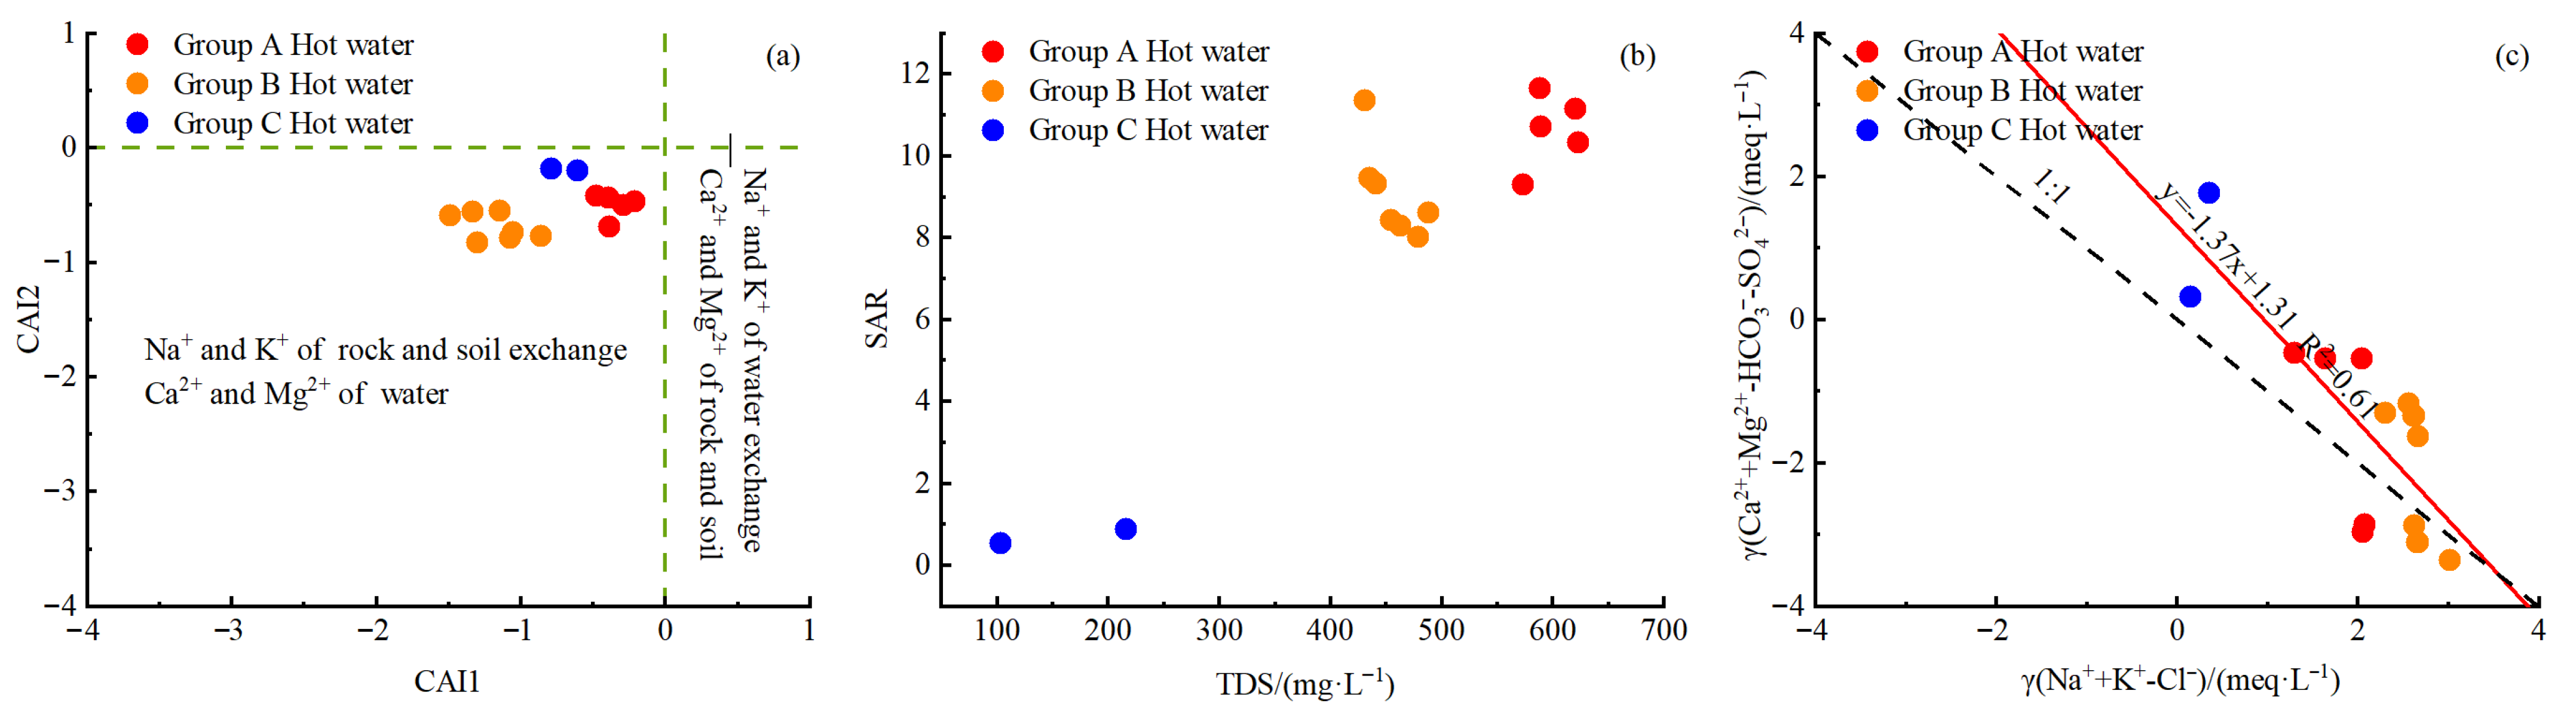
4.1.3. Cation Exchange Reactions
4.2. Characteristics of Hydrogen and Oxygen Isotopes
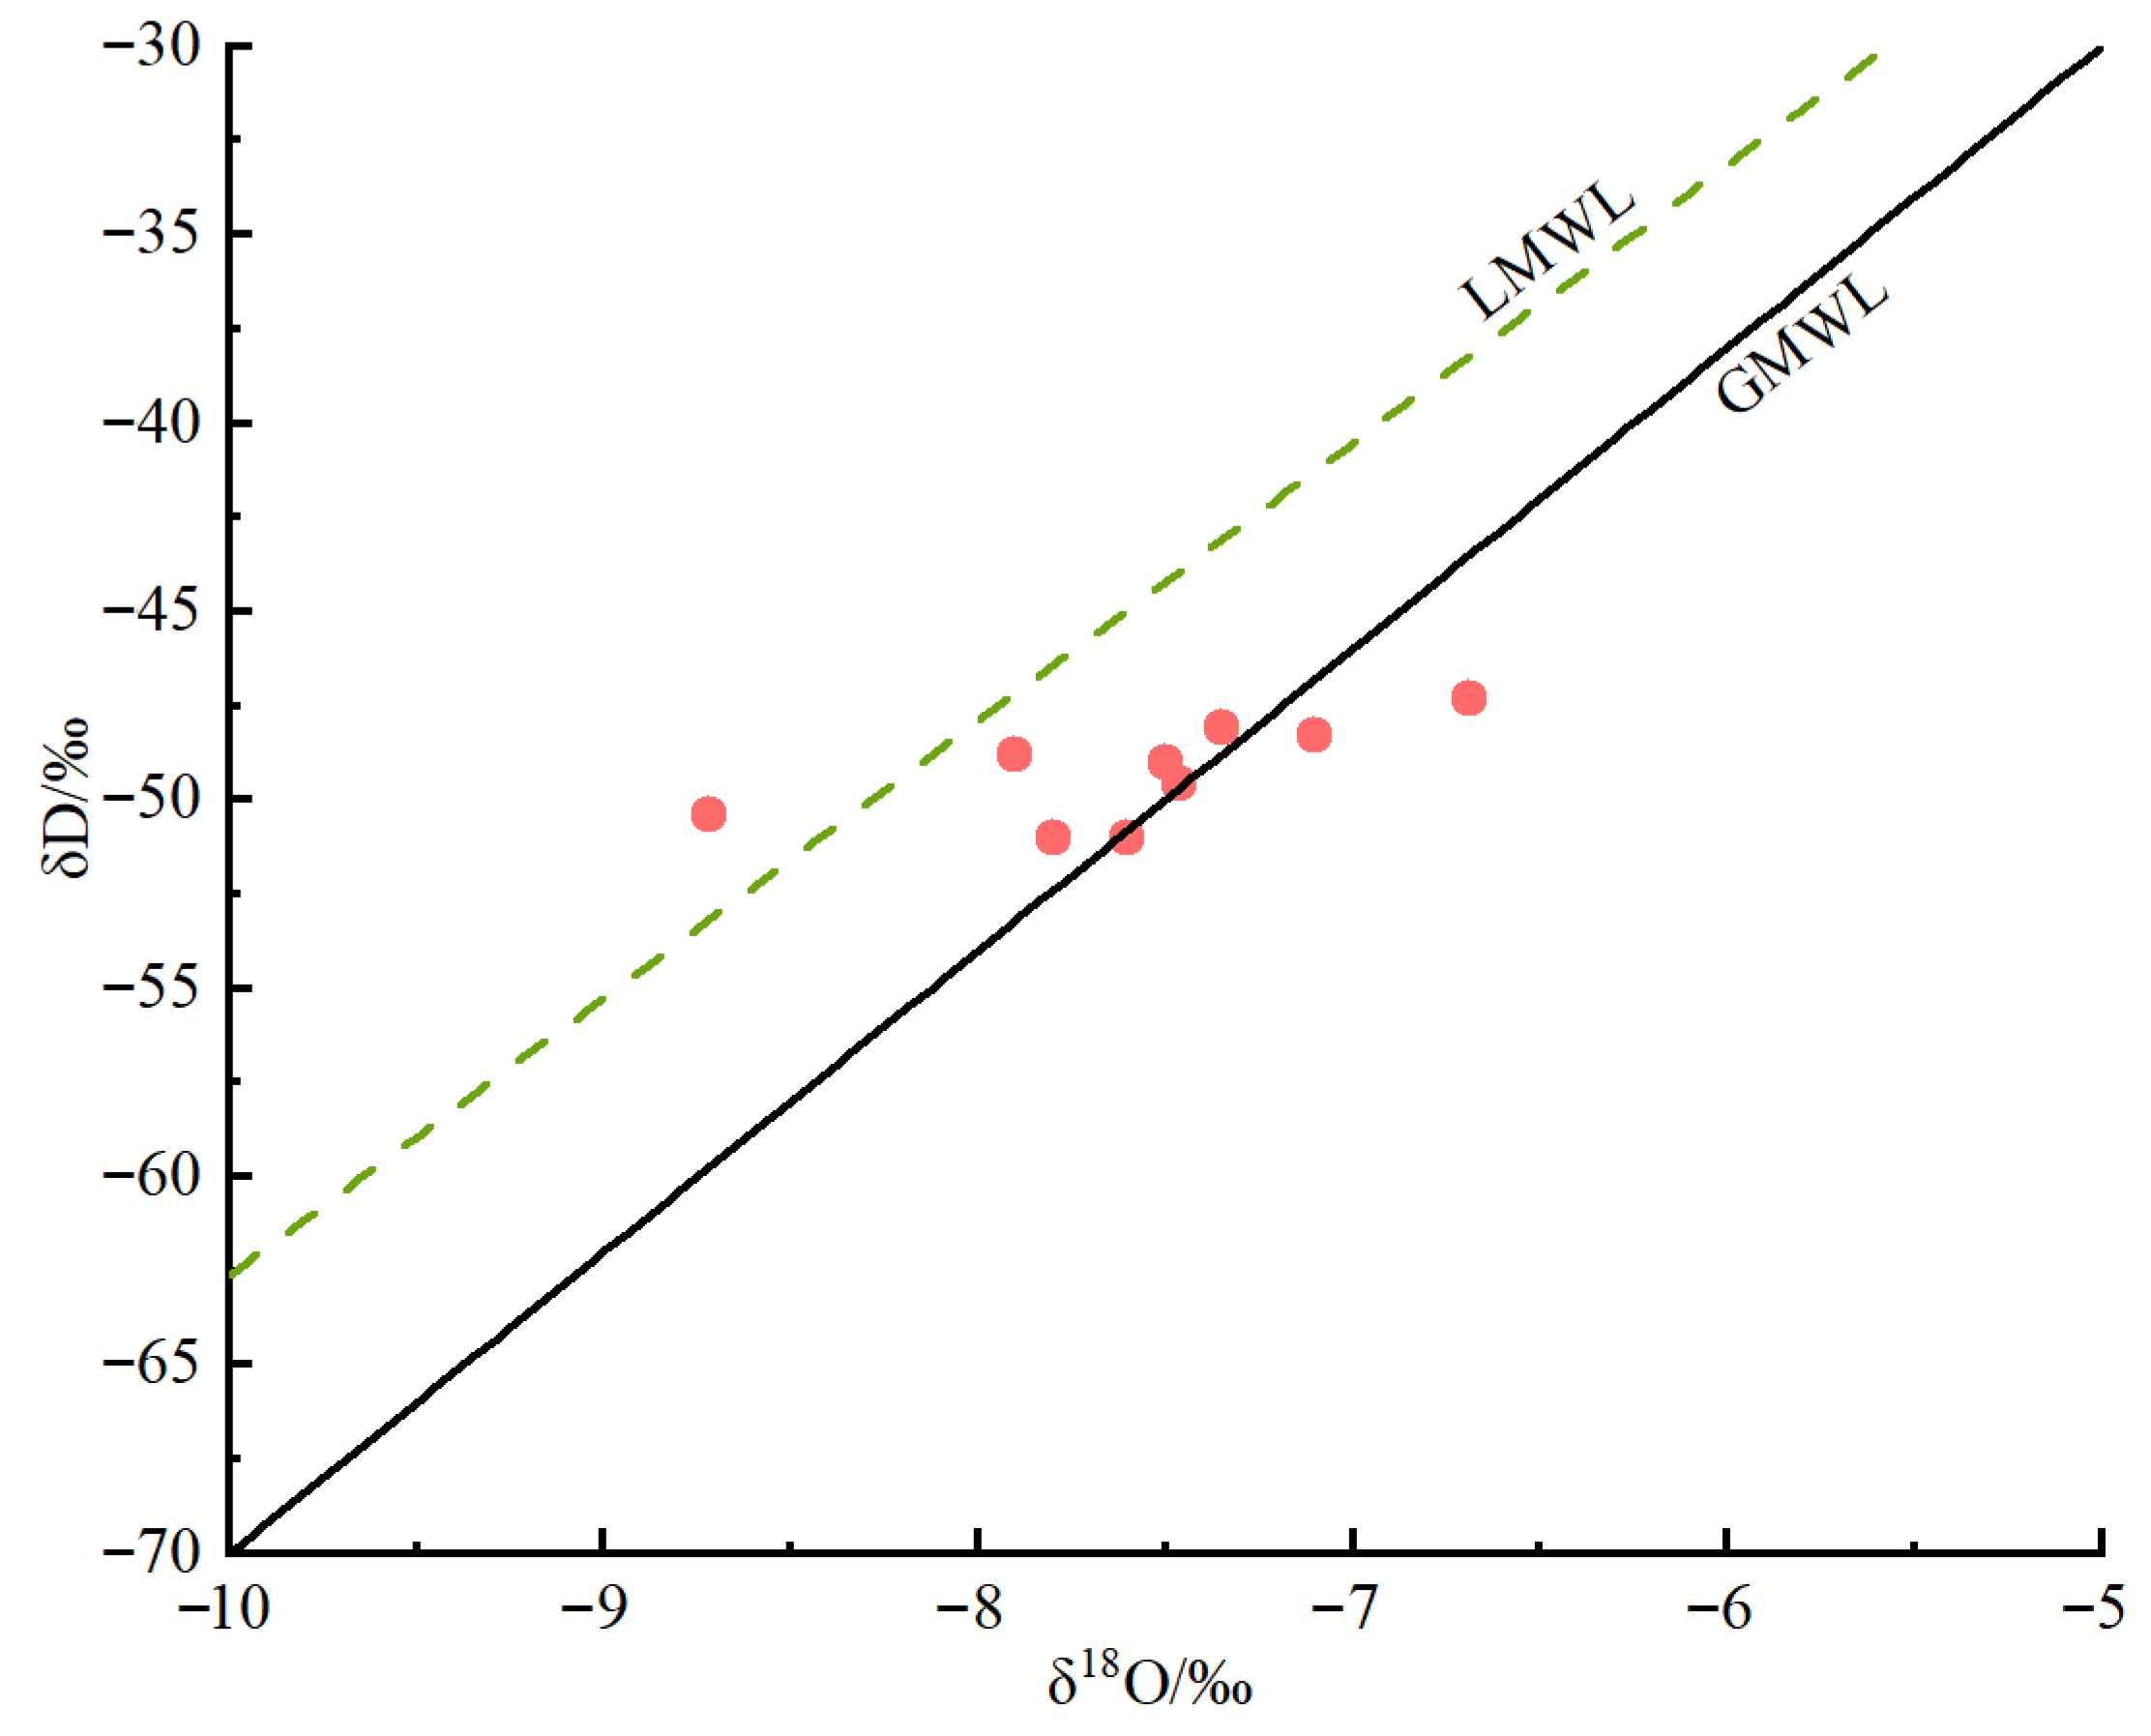
4.2.1. Recharge Sources of Geothermal Water
4.2.2. Recharge Elevation of Geothermal Water
4.3. Inverse Hydrogeochemical Simulation
4.3.1. Determination of Reaction Pathways and Possible Mineral Phases
4.3.2. Analysis of the Simulation Results
- (1)
- Saturation index (SI) analysis
- (2)
- Analysis of the reaction pathway simulation results
5. Conclusions
- (1)
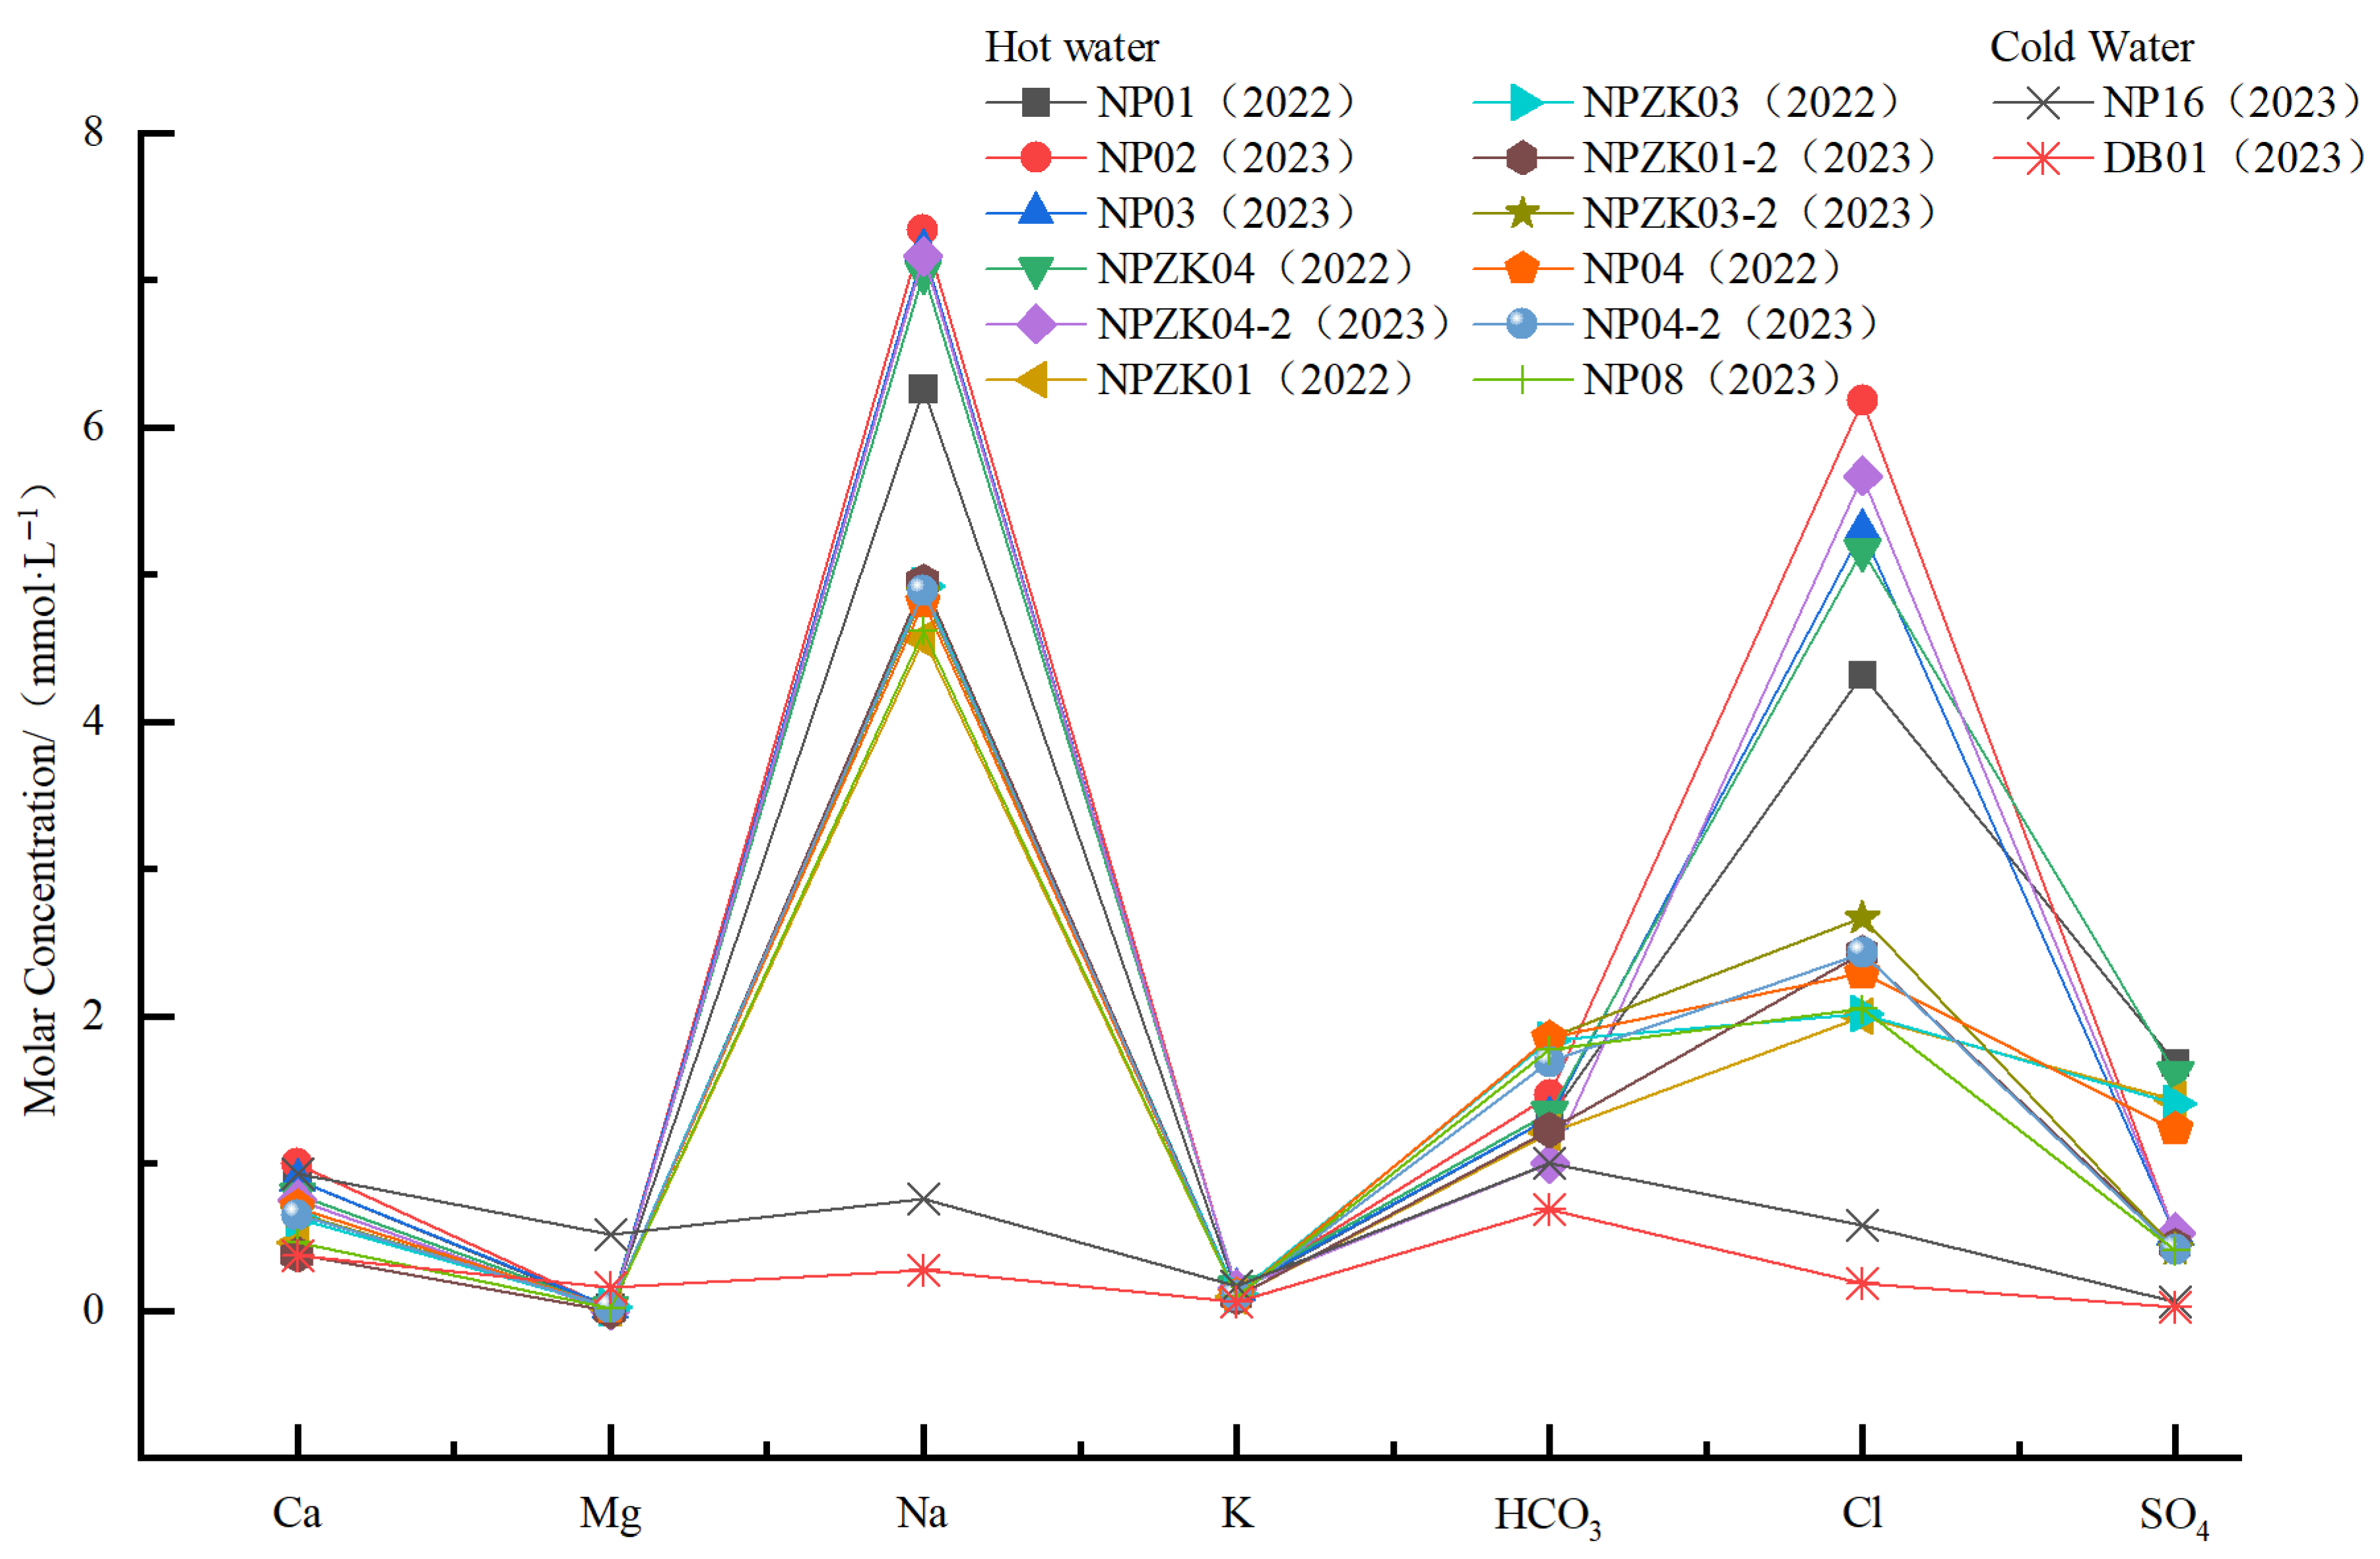
- Geothermal water in the study area exhibits temperatures ranging from 64 °C to 80 °C, pH values from 8.32 to 8.64, and TDS concentrations from 431 mg/L to 623 mg/L (higher than those of cold water), suggesting slightly alkaline freshwater and low-temperature geothermal water. The concentrations of conventional components in various water bodies in the study area decrease in the order of geothermal water, shallow groundwater, and surface water. In geothermal water, the concentrations of cations decrease in the order of Na+, Ca2+, K+, and Mg2+, while the concentrations of anions decrease in the order of Cl−, HCO3−, and SO42−. Primary hydrochemical types of geothermal water in the study area include Cl-Na and Cl·HCO3-Na.
- (2)
- Analyses using the Gibbs model, ion ratios, CAIs, and SARs reveal that the hydrochemical components of geothermal water in the study area were formed primarily due to intense water–rock interactions. Besides the dissolution of silicate minerals and halite, cation exchange reactions also serve as an important factor in the formation of Na+ and K+ in geothermal water.
- (3)
- Geothermal water in the study area is mainly derived from atmospheric precipitation recharge, with a recharge elevation ranging from 967 to 1115 m. The author speculates that the main recharge area is located in the Diaoluo Shan area of the northwest of the study area.
- (4)
- The inverse hydrogeochemical simulation results indicate that during the water–rock interactions, silicate minerals, clay minerals, gypsum, and halite dissolve, whilst quartz and carbonate minerals precipitate. Additionally, these processes are accompanied by cation exchange reactions dominated by the replacement of Na+ in surrounding rocks by Ca2+ in geothermal water.
Author Contributions
Funding
Institutional Review Board Statement
Informed Consent Statement
Data Availability Statement
Conflicts of Interest
References
- Wang, G.; Zhang, W.; Liang, J.; Lin, W.; Liu, Z.; Wang, W. Evaluation of Geothermal Resources Potential in China. Acta Geosci. Sin. 2017, 38, 449–459. [Google Scholar]
- Wang, G.; Lin, W. Main hydro-geothermal systems and their genetic models in China. Acta Geosci. Sin. 2020, 94, 1923–1937. [Google Scholar]
- Guo, Q.H. Hydrogeochemistry of High-Temperature Geothermal Systems in China: A Review. Appl. Geochem. 2012, 27, 1887–1898. [Google Scholar] [CrossRef]
- Zhao, J.; Zhang, W.; Zhang, H.; Qu, Z.; Li, M.; Yue, G. Hydrogeochemical characteristics and genesis of the geothermal fields in Batang of Sichuan. Hydrogeol. Eng. Geol. 2019, 46, 81–89. [Google Scholar]
- Wei, X.; Shi, H.; Chen, S.; Shang, J.; Liu, M. Application of hydrogeochemical methods in geothermal resource exploration: A case study of Yingcheng City, Hubei Province. Bull. Geol. Sci. Technol. 2024, 43, 68–80. [Google Scholar]
- Li, C.; Wu, X.; Sun, B.; Sui, H.; Geng, F.; Qi, H.; Ma, X. Hydrochemical characteristics and formation mechanism of geothermal water in northern Ji’nan. Earth Sci. 2018, 43 (Suppl. 1), 313–325. [Google Scholar]
- Qian, H.; Ma, Z.; Li, P. Hydrogeochemistry; Geology Press: Beijing, China, 2012. [Google Scholar]
- Wang, J. Geothermics and Its Applications; Science Press: Beijing, China, 2015. [Google Scholar]
- Liu, F. Study on Water-Rock Interaction Using Geochemical Reaction Modeling—Taking Simulation Software Phreeqc for Example; China University of Geosciences (Beijing): Beijing, China, 2010. [Google Scholar]
- Zhang, Y.; Li, Q.; Yu, S. Hydrochemical Characteristics Constraints on Evolution of Geothermal Water in Guantang Area on the East Coast of Hainan Island. Earth Sci. 2024, 49, 952–964. [Google Scholar]
- Hamed, Y.; Hadji, R.; Ahmadi, R.; Ayadi, Y.; Shuhab, K.; Pulido-Bosch, A. Hydrogeological investigation of karst aquifers using an integrated geomorphological, geochemical, GIS, and remote sensing techniques (Southern Mediterranean Basin-Tunisia). Environ. Dev. Sustain. 2024, 26, 6943–6975. [Google Scholar] [CrossRef]
- Gao, W.; Guo, Z.; Zhou, J.; Meng, Q.; Shu, Q.; Wang, C. High precision aeromagnetic characteristics and Curie depth analysis of the Hainan Island. Acta Geol. Sin. 2020, 94, 3246–3262. [Google Scholar]
- Jiang, Y.; Liang, X.; Liang, X.; Fu, J.; Wang, C.; Zhou, Y.; Wen, S. Formation Mechanism of East Asia Continental Margin Extensional Belt: Evidence from Geochemistry Study of Hainan Mantle Xenoliths. Geotecton. Metallog. 2017, 41, 157–182. [Google Scholar]
- Gao, F.; Yang, X.; Wu, G.; Fu, Y.; Chen, Y. Characteristics of Thermal Springs and Genesis of Thermal Underground Waters in Hainan Island. J. Jilin Univ. (Earth Sci. Ed.) 2009, 39, 281–287. [Google Scholar]
- Wang, X.; Wei, F.; Wang, J.; Guo, M.; Lu, Q.; Zhang, H. Study on Geochemical Characteristics of hot spring gas in Hainan Island. Inland Earthq. 2024, 38, 13–21. [Google Scholar]
- Liu, F.; Wang, G.; Jiang, G.; Hu, S.; Zhang, W.; Lin, W.; Liu, J.; Zhang, X.; Qu, Z.; Liao, C. Recent advances in heat flow measurement and new understanding of terrestrial heat flow distribution in terrestrial areas of China. Earth Sci. Front. 2024, 31, 19–30. [Google Scholar]
- Wang, G.; Lin, W. The thermal status of China’s land areas and heat-control factors. Earth Sci. Front. 2024, 31, 1–18. [Google Scholar]
- Jiang, G.; Gao, P.; Rao, S.; Zhang, L.; Tang, X.; Huang, F.; Zhao, P.; Pang, Z.; He, L.; Hu, S.; et al. Compilation of heat flow data in the continental area of China (4th edition). Chin. J. Geophys. 2016, 59, 2892–2910. [Google Scholar]
- Yan, X.; Wang, X.; Xue, G.; Yuan, R.; Yang, F. Terrestrial Heat Flow and Lithospheric Thermal Structure Characteristics in Nanping City of Hainan. Energies 2024, 17, 4824. [Google Scholar] [CrossRef]
- Zhao, T. Characteristics and Evaluation of Geothermal Resources in Hainan Province. Master’s Thesis, Guilin University of Technology, Guilin, China, 2016. [Google Scholar]
- Fu, H.; Wang, S.; Huang, Z.; Xu, Z. Hydrogeochemical characteristics and genesis of Gaofeng geothermal fields in Hainan province. World Nucl. Geosci. 2024, 41, 508–521. [Google Scholar]
- Yuan, X.; Huang, X.; Gan, H.; Huang, L. Variation in Chemical elements of Groundwater along the South Coast of Hainan Island and Significance to Seawater Intrusion. Mar. Geol. Front. 2017, 33, 32–40. [Google Scholar]
- Fan, Y. Groundwater in the Earth’s Critical Zone: Relevance to Large-Scale patterns and processes. Water Resour. Res. 2015, 51, 3052–3069. [Google Scholar] [CrossRef]
- Huang, Z.; Chen, Z.; Liu, Y.; Liu, C.; Shi, Z.; Liu, L.; Liu, Z.; He, H.; Li, Y. Notably high salinity of geothermal water in the coastal area in Hainan Island, China, predominantly dominated by tectonic activities. Geothermics 2025, 126, 103202. [Google Scholar] [CrossRef]
- Hainan Geological Survey Institute. The Regional Geology of China, Hainan Province; Geology Press: Beijing, China, 2017. [Google Scholar]
- Arnórsson, S.; Stefánsson, A.; Bjarnason, J.O. Fluid-Fluid Interactions in Geothermal Systems. Rev. Mineral. Geochem. 2007, 65, 259–312. [Google Scholar] [CrossRef]
- Gibbs, R.J. Mechanisms controlling world water chemistry. Science 1970, 170, 1088–1090. [Google Scholar] [CrossRef] [PubMed]
- Sun, K.; Fan, L.; Ma, W.; Chen, J.; Peng, J.; Zhang, P.; Gao, S.; Li, C.; Miao, Y.; Wang, H. Geochemical characteristics of groundwater about Zhiluo formation in the northern Ordos Basin and its indicative significance. J. China Coal Soc. 2024, 49, 2004–2020. [Google Scholar]
- Peng, H.; Hou, Q.; Zeng, M.; Huang, C.; Shi, H.; Pi, P.; Pan, Y. Hydrochemical characteristics and controlling factors of groundwater in the Leizhou Peninsula. Environ. Sci. 2021, 42, 5375–5383. [Google Scholar]
- Gong, Y.; Gong, X.; Xu, S.; Tang, X.; Su, D.; Wu, X. Hydrogeochemical characteristics and evolution of groundwater in southern Jiangsu. Geol. Rev. 2022, 68, 2207–2218. [Google Scholar]
- Fan, H.; Yang, P.; Zhang, S.; Cui, R.; Li, Z.; Wang, Y. Chemical characteristics and utilization potential of brackish water in Oasis area of Yuli county, Xinjiang. Yellow River 2024, 46, 98–103. [Google Scholar]
- Craig, H. Isotopic variations in meteoric waters. Science 1961, 133, 1702–1703. [Google Scholar] [CrossRef] [PubMed]
- Yao, J.; Zhou, X.; Li, J.; Dai, W.; Kang, X. Hydrogeochemical characteristics and evolution simulation of groundwater in basalts on the Leizhou Peninsula, Guangdong, China. Geol. Bull. China 2007, 26, 327–334. [Google Scholar]
- Zhang, Y. A Study of the Characteristics and Formation of the Hot Springs in Hainan Island; China University of Geosciences (Beijing): Beijing, China, 2019. [Google Scholar]
- Yun, X.; Zhang, Y.; Liang, D.; Qu, Y.; Chen, H. Granite thermal reservoirs in Lingshui area of Hainan Island and their significance to geothermal resources, China. Energy Geosci. 2023, 4, 100166. [Google Scholar] [CrossRef]
- Dong, W. Application of Inverse Hydrogeochemical Modeling in 14C Age Correction of Deep Groundwater in the Ordos Cretaceous Artesian Basin; Jilin University: Changchun, China, 2005. [Google Scholar]
- Zhu, L. The important methods of geothermal exploration—Research status of trace element geochemistry methods. Foreign Geol. Explor. Technol. 1989, 11, 9–11. [Google Scholar]

| Group | ID | Time | T/°C | pH | K+ | Na+ | Ca2+ | Mg2+ | Cl− | SO42− | CO32− | HCO3− | F− | TDSs | H2SiO3 | IBE |
|---|---|---|---|---|---|---|---|---|---|---|---|---|---|---|---|---|
| mg·L−1 | ||||||||||||||||
| A | NP01 | 2022 | 75 | 8.32 | 4.9 | 144 | 17.8 | 0.2 | 153 | 80.6 | 3.9 | 80 | 6.3 | 573 | 105 | −0.49 |
| A | NP02 | 2023 | 74 | 8.32 | 5.4 | 169 | 20 | 0.15 | 219 | 24.5 | 4.6 | 89.2 | 0.43 | 623 | 118 | 1.68 |
| A | NP03 | 2023 | 64 | 8.35 | 5.4 | 165 | 17.7 | 0.26 | 188 | 24.8 | 9.2 | 79.8 | 6.4 | 589 | 119 | 6.10 |
| A | NPZK04 | 2022 | 80 | 8.32 | 6.1 | 162 | 15.7 | 0.19 | 183 | 76.7 | 2 | 82 | 6.2 | 620 | 111 | −0.80 |
| A | NPZK04-2 | 2023 | 80 | 8.33 | 5.7 | 165 | 15.1 | <0.02 | 201 | 25.4 | 18 | 61 | 6.4 | 588 | 117 | 3.76 |
| B | NPZK01 | 2022 | 65 | 8.64 | 4 | 105 | 9.2 | 0.23 | 71 | 68.8 | 10 | 74 | 7.8 | 441 | 118 | 3.35 |
| B | NPZK01-2 | 2023 | 65 | 8.51 | 3.7 | 114 | 7.5 | <0.02 | 86.3 | 20.8 | 18 | 75.1 | 7.8 | 431 | 127 | 10.51 |
| B | NPZK03 | 2022 | 68 | 8.32 | 4.4 | 113 | 12.6 | 0.28 | 71.7 | 67.6 | 5.9 | 112 | 7.2 | 488 | 121 | 2.87 |
| B | NPZK03-2 | 2023 | 68 | 8.38 | 4 | 112 | 13.3 | 0.31 | 94.5 | 19.9 | 4.6 | 113 | 7.2 | 463 | 122 | 6.16 |
| B | NP04 | 2022 | 68 | 8.32 | 4 | 111 | 14 | 0.27 | 81.2 | 58.9 | 6.3 | 113 | 6.8 | 479 | 109 | 1.61 |
| B | NP04-2 | 2023 | 68 | 8.39 | 4 | 112 | 13 | 0.27 | 86.3 | 19.6 | 14 | 103 | 6.9 | 454 | 123 | 8.49 |
| B | NP08 | 2023 | 64 | 8.37 | 3.6 | 106 | 9.1 | 0.2 | 72.6 | 19.5 | 9.2 | 108 | 7.8 | 435 | 129 | 8.35 |
| C | NP16 | 2023 | 24 | 6.09 | 5.2 | 15.4 | 16.5 | 5.3 | 21.5 | 4.1 | 0 | 61 | 0.29 | 216 | 56.4 | 10.07 |
| C | DB01 | 2023 | 25 | 7.1 | 2.3 | 6.4 | 7.4 | 2 | 6.9 | 1.3 | 0 | 42 | 0.22 | 103 | 36.2 | −2.02 |
| ID | δD/‰ | δ18O/‰ | Sampling Point Elevation/m | Recharge Elevation/m |
|---|---|---|---|---|
| NPZK01-2 | −50.4 | −8.72 | 17 | 1093 |
| NPZK03-2 | −48.8 | −7.90 | 18 | 1030 |
| NPZK04-2 | −48.1 | −7.35 | 15 | 999 |
| NP02 | −48.3 | −7.10 | 15 | 1007 |
| NP03 | −47.3 | −6.69 | 15 | 967 |
| NP08 | −49.6 | −7.46 | 18 | 1062 |
| NP04 | −51.0 | −7.80 | 13 | 1113 |
| NP01 | −49.0 | −7.50 | 11 | 1031 |
| NPZK04 | −51.0 | −7.60 | 15 | 1115 |
| Mineral | Dissolution Chemical Reaction Equation |
|---|---|
| Albitite | NaAlSi3O8 + 8H2O = Na+ + Al(OH)4− + 3H4SiO4 |
| K-Feldspar | KAlSi3O8 + 8H2O = K+ + Al(OH)4− + 3H4SiO4 |
| Calcite | CaCO3 + H2O = Ca2+ + HCO3− + OH− |
| Dolomite | CaMg(CO3)2 + 2H2O = Ca2+ + Mg2+ + 2HCO3− + 2OH− |
| Gypsum | CaSO4·2H2O = Ca2+ + SO42− + 2H2O |
| Halite | NaCl = Na+ + Cl− |
| Cation exchange | Ca2+ + 2NaX = 2Na+ + CaX2 |
| Mineral | SI | ||
|---|---|---|---|
| Initial Precipitation | End of Path I | End of Path Ⅱ | |
| Albitite | - | −0.6 | −0.73 |
| K-Feldspar | - | −0.01 | −0.01 |
| Quartz | - | 1.46 | 1.60 |
| Chlorite | - | −5.01 | −0.92 |
| Calcite | −1.65 | 1.77 | 1.97 |
| Dolomite | −3.52 | 2.23 | 3.90 |
| Illite | - | −6.96 | −6.94 |
| Gypsum | −4.18 | −1.33 | −1.48 |
| CO2 (g) | −2.38 | −2.23 | −1.92 |
| Kaolinite | −8.24 | −8.44 | |
| Halite | −7.30 | −4.25 | −4.71 |
| Fluorite | - | ||
| Mineral | Path I | Path II |
|---|---|---|
| Albitite | 2.05 × 10⁻³ | 1.62 × 10⁻³ |
| Anorthite | 2.20 × 10⁻³ | 2.05 × 10⁻⁴ |
| K-Feldspar | 9.73 × 10⁻⁵ | 4.35 × 10⁻⁵ |
| Quartz | −3.00 × 10⁻³ | −3.50 × 10⁻³ |
| Calcite | −2.24 × 10⁻³ | −2.53 × 10⁻³ |
| Dolomite | −1.22 × 10⁻⁴ | −7.79 × 10⁻⁵ |
| Calcium Montmorillonite | −2.88 × 10⁻³ | −3.52 × 10⁻³ |
| Chlorite | 4.96 × 10⁻⁴ | 4.81 × 10⁻⁴ |
| Illite | 1.62 × 10⁻⁴ | 7.25 × 10⁻⁵ |
| Kaolinite | 3.75 × 10⁻³ | 2.61 × 10⁻³ |
| CO2 (g) | 6.87 × 10⁻⁴ | 1.26 × 10⁻³ |
| Gypsum | 7.85 × 10⁻⁴ | 6.00 × 10⁻⁴ |
| Halite | 4.99 × 10⁻³ | 2.12 × 10⁻³ |
| NaX | 8.30 × 10⁻⁴ | 3.88 × 10⁻⁴ |
| CaX2 | −4.15 × 10⁻⁴ | −1.94 × 10⁻⁴ |
Disclaimer/Publisher’s Note: The statements, opinions and data contained in all publications are solely those of the individual author(s) and contributor(s) and not of MDPI and/or the editor(s). MDPI and/or the editor(s) disclaim responsibility for any injury to people or property resulting from any ideas, methods, instructions or products referred to in the content. |
© 2025 by the authors. Licensee MDPI, Basel, Switzerland. This article is an open access article distributed under the terms and conditions of the Creative Commons Attribution (CC BY) license (https://creativecommons.org/licenses/by/4.0/).
Share and Cite
Wang, X.; Yan, X.; Zhang, W.; Ma, B.; Liu, C.; Yang, Y.; Yuan, R.; Chen, J.; Su, W. Hydrogeochemical Characteristics and Evolutionary Mechanisms of the Nanping Geothermal Field, Southeastern Hainan Island, China. Sustainability 2025, 17, 6189. https://doi.org/10.3390/su17136189
Wang X, Yan X, Zhang W, Ma B, Liu C, Yang Y, Yuan R, Chen J, Su W. Hydrogeochemical Characteristics and Evolutionary Mechanisms of the Nanping Geothermal Field, Southeastern Hainan Island, China. Sustainability. 2025; 17(13):6189. https://doi.org/10.3390/su17136189
Chicago/Turabian StyleWang, Xiaolin, Xiaoxue Yan, Wei Zhang, Bo Ma, Changzhu Liu, Yongpeng Yang, Ruoxi Yuan, Jie Chen, and Wencun Su. 2025. "Hydrogeochemical Characteristics and Evolutionary Mechanisms of the Nanping Geothermal Field, Southeastern Hainan Island, China" Sustainability 17, no. 13: 6189. https://doi.org/10.3390/su17136189
APA StyleWang, X., Yan, X., Zhang, W., Ma, B., Liu, C., Yang, Y., Yuan, R., Chen, J., & Su, W. (2025). Hydrogeochemical Characteristics and Evolutionary Mechanisms of the Nanping Geothermal Field, Southeastern Hainan Island, China. Sustainability, 17(13), 6189. https://doi.org/10.3390/su17136189