Abstract
In the era of new urbanization and shared prosperity, addressing the entrenched contradiction between unequal urban–rural public services and consumption disparities is central to achieving sustainable urban–rural development. As the world’s largest developing country, China faces a pronounced urban–rural consumption gap, underscoring the urgency of narrowing this divide through improved urban–rural public services. This study constructs a theoretical framework to analyze how urban–rural public service gaps influence consumption disparities, developing an evaluation index system for public service gaps across three dimensions: basic education, healthcare, and social security. Using panel data from 26 Chinese provinces (2011–2023), we employed fixed effects (FE) estimation, two-stage least squares (2SLS), and two-step system GMM models to examine the impact of public service gaps on consumption disparities and explore heterogeneous effects across inter-period dynamics and economic catching-up levels. Findings show that the coefficients of the three public service gaps (education, healthcare, social security) on the consumption gap are positive and statistically significant. This indicates that further widening of urban–rural public service gaps will exacerbate consumption disparities. The urban–rural consumption gap exhibits a reinforcing effect: gaps in the previous period strengthen current-period disparities, forming a vicious cycle that hinders sustainable development. Heterogeneity analysis across time reveals that the impacts of healthcare and social security gaps on consumption disparities tend to weaken, while the effect of compulsory education gaps increases significantly. From the perspective of economic catching-up heterogeneity, regions with higher catching-up levels exhibit a stronger impact of public service gaps on consumption disparities compared to lower catching-up regions.
1. Introduction
The United Nations 2030 Agenda for Sustainable Development identifies “reducing inequality” and “sustainable cities and communities” as core objectives, advocating the narrowing of urban–rural development gaps through public service equalization []. This aligns with the sustainable development perspective, which emphasizes that inclusive public services are a prerequisite for achieving social sustainability and economic sustainability. The 20th Party Congress report highlights urban–rural disparities as a key manifestation of unbalanced and insufficient development in China []. As a critical dimension of urban–rural gaps, the urban–rural consumption divide influences both the trajectory toward common prosperity for urban and rural residents and the sustainability of urban–rural economic development. Empirical evidence shows that a 1% increase in the global urban–rural consumption gap correlates with a 0.3% decline in the sustainable development index []. As the world’s largest developing nation, China faces persistent and pronounced urban–rural consumption disparities, which hinder the sustainability of high-quality urban–rural economic growth. In 1978, at the outset of economic reforms, the urban–rural consumption gap stood at just 195 yuan; however, with the implementation of national urbanization strategies, this gap expanded rapidly. By 2024, urban per capita consumption expenditure reached CNY 34,557, compared to CNY 19,280 for rural residents, resulting in an absolute gap of CNY 15,277 and a ratio of 1.79:1 []. The widening consumption divide has emerged as a major constraint on optimizing consumption structures, enhancing consumption quality, and elevating rural consumption levels []. Moreover, against the backdrop of a weakening global economy and escalating U.S.–China trade tensions, fostering endogenous economic growth has become essential for sustaining healthy economic development []. Under China’s “new normal” economic conditions, reducing urban–rural consumption disparities is critical to unblocking domestic circulation and promoting sustainable urban–rural economic growth.
The core driver behind the persistent expansion of the absolute consumption gap between urban and rural residents lies in the ongoing widening of basic public service disparities across urban–rural divides. Urban–rural public services serve as a pivotal factor in narrowing consumption gaps and fostering sustainable urban–rural economic development. Reducing these public service disparities can enhance rural residents’ consumption capacity and willingness, thereby exerting positive effects on narrowing urban–rural consumption gaps. In 2024, the proportions of service-oriented consumption among urban and rural residents were 48.41% and 40.29%, respectively []. The significantly lower proportion among rural residents highlights the increasingly prominent constraints that urban–rural public service gaps impose on consumption behaviors. Enhancing urban–rural public services represents not only a critical institutional arrangement for safeguarding and improving people’s livelihoods but also an essential pathway to narrowing urban–rural consumption gaps. Promoting the equalization of urban–rural public services holds profound theoretical and practical significance for advancing balanced and sustainable urban–rural consumption development.
Against this backdrop, this study innovatively constructs a theoretical impact framework between urban–rural public services and consumption gaps from the perspective of sustainable development. Using panel data from 26 Chinese provinces (2011–2023), it employs fixed effects (FE) estimation, two-stage least squares (2SLS), and two-step system GMM to quantify the impact of urban–rural public service gaps on consumption gaps. The study further conducts multidimensional verification of heterogeneous effects across inter-period dynamics and varying levels of economic catching-up. These findings provide valuable references for policy makers to improve urban–rural integrated development mechanisms, while also contributing to the academic literature by filling critical gaps in our understanding of public service disparities and consumption inequalities.
In recent years, the influencing factors and mechanisms of urban–rural consumption gaps have become key academic concerns. First, regarding urbanization: Existing research widely acknowledges that urbanization exerts a positive influence on urban–rural consumption [], though some scholars argue that with accelerated urbanization and the economy entering a “new normal”, its effect in continuously reducing consumption gaps may face diminishing returns []. Using ridge regression, scholars have found uncoordinated relationships between urbanization and consumption, where cross-regional population mobility challenges lead neighboring provinces’ urbanization rates to widen local urban–rural consumption gaps []. Second, fiscal policy: The complementary or substitutive relationship between fiscal policy and consumption often depends on expenditure scale, structure, and social security systems. Expansionary fiscal policies generally boost consumption [], while the fairness of public welfare investments exhibits a “crowding-in effect” on urban–rural consumption, with notable regional variations []. Third, economic structure: The dual consumption structure stems from the legacy of the planned economy and supply-side discrimination by monopoly enterprises [], where industrial structure adjustments inhibit consumption gap expansion with spatiotemporal variations. Fourth, population aging: Urban–rural age structure influences consumption gaps—reductions in old-age dependency ratios and the new rural pension system help narrow disparities [].
Existing literature reveals two key gaps. First, most studies focus on urbanization, fiscal policy, economic structure, income gaps, and aging [,,], enriching academic discourse but overlooking the specific impact of urban–rural public service gaps. Even in rare empirical studies involving public service gaps, the analysis primarily relies on fiscal transfer payments or income gap proxies rather than direct measurements of urban–rural public service supply. Second, while existing research examines geographic heterogeneity in public services, it neglects heterogeneity arising from local government behavioral mechanisms. This study addresses this by introducing economic catching-up heterogeneity for group comparisons, aiming to decipher the challenges behind urban–rural public service equalization across regions. By analyzing the internal mechanisms of public service gaps and consumption disparities, and using provincial panel data to verify impacts from national, inter-period, and catching-up group perspectives, this research provides critical insights for refining urban–rural integration policies, while contributing to a more nuanced understanding of the linkages between public service provision and sustainable development outcomes.
The remainder of this paper is structured as follows: Section 2 provides a theoretical analysis, exploring the theoretical mechanisms through which urban–rural public service gaps influence urban–rural consumption gaps from the perspective of sustainable development. Section 3 discusses data and methodology, covering variable measurement, data sources, and model construction. Section 4 presents empirical results, verifying the impact of urban–rural public service gaps on consumption gaps and analyzing heterogeneities across temporal dimensions and levels of economic catch-up. Section 5 concludes with policy recommendations, proposing strategies to narrow public service gaps and promote income growth for rural residents.
2. Theoretical Analysis
This paper analyzes how urban–rural public service gaps influence urban–rural consumption disparities, developing the theoretical framework from two primary perspectives. On one hand, the urban–rural dual structure leads local governments to adopt city-favored pricing and policy biases that marginalize rural areas []. During the planned economy era, the government distorted or suppressed agricultural product prices to benefit urban workers. Even after these price policies were abolished, government investments in basic public services in rural areas remained significantly lower than in urban areas in both scale and standards []. On the other hand, under fiscal decentralization and economic catch-up pressures, rational local governments prioritize allocating public funds to projects and regions with short-term economic benefits and lower service costs. This leads to a focus on economic construction expenditures that rapidly boost GDP and cities with well-developed production conditions [,]. These mechanisms collectively result in an overall widening of urban–rural public service gaps, which in turn exacerbates consumption disparities through reduced rural consumption capacity, suppressed consumption willingness, and intensified resource allocation inequalities. Such urban-biased development policies and public finance allocation patterns place rural areas at a disadvantage in public service resource distribution, weakening long-term trends toward narrowing urban–rural public service gaps [].
First, urban–rural compulsory education gaps affect consumption disparities by influencing human capital accumulation. Rural education in China currently faces challenges such as student attrition, teacher shortages, poor school layout, and insufficient investment [,,,]. The stark disparity in education investment returns and human capital accumulation between urban and rural residents—known as the “Matthew effect”—widens income gaps, which in turn amplify consumption gaps through differences in consumption capacity and marginal propensity to consume [,,]. Second, urban–rural healthcare gaps impact consumption by affecting health investment levels. Government expenditure biases in healthcare lead to imbalances in health human capital between urban and rural areas, influencing rural residents’ consumption willingness and marginal propensity to consume [,]. Additionally, China’s rural health system suffers from issues such as inadequate resource supply, low medical service efficiency, and increasing patient burdens [,,], which remain key constraints on rural consumption capacity. Third, urban–rural social security gaps affect rural residents’ savings behavior and consumption willingness through income redistribution mechanisms, thereby suppressing consumption capacity and motivation. The overall impact of urban–rural public service gaps on consumption disparities is characterized by a cumulative vicious cycle: inadequate public service provision in rural areas reduces residents’ human capital and income earning capacity, forcing higher precautionary savings for education and healthcare needs, which ultimately widens consumption gaps. Conversely, narrowed public service gaps can enhance rural consumption capacity through improved human capital, reduced uncertainty, and released consumption potential, forming a positive feedback loop for sustainable urban–rural development. Based on the above theoretical analysis, this study proposes the following hypothesis:
Hypothesis 1.
Urban–rural gaps in public services have a significant positive impact on urban–rural consumption disparities.
Notably, while clarifying how structural public service gaps influence consumption disparities, it is essential to recognize that urban–rural public service gaps constitute multidisciplinary inequalities. These gaps not only exacerbate resource and factor market dualism but also leave welfare services in poor rural areas far behind urban standards. This ultimately perpetuates wide urban–rural economic divides and stagnant rural consumption growth, contradicting the sustainable development goal of inclusive and balanced progress.
3. Data and Methodology
3.1. Explained Variable
The explanatory variable is the urban–rural residents’ consumption gap. Extensive research has been conducted on urban–rural consumption patterns [,,,,]. This study adopts a dual perspective to measure this gap: overall urban–rural inequality and intra-group consumption inequality across population subgroups. Specifically, two approaches are employed. The first is the urban–rural consumption ratio (gapconit), defined as urban residents’ per capita consumption expenditure divided by rural residents’ per capita living expenditure. The second is the urban–rural Theil index (theilit), calculated using the following formula:
In Equation (1), j = 1 and 2 represent urban and rural areas, respectively; zjt represents the population of area j in period t; pjt represents the consumption of area j in period t; and zt and pt represent the total population and total consumption, respectively.
3.2. Explaining Variable
The core explanatory variable is the urban–rural public service gap. To assess the overall urban–rural public service gap, this paper measures it across three dimensions—compulsory education (edu), medical and health care (med), and social security (safe)—considering data availability, representativeness, continuity, and measurement efficiency []. These indicators are selected for their objective measurability and consistency with prior research on urban–rural disparities. While primarily quantitative, they reflect structural inequalities in resource allocation. It is acknowledged that qualitative aspects are not directly captured due to data limitations—provincial-level panel data on service quality metrics are scarce and difficult to standardize across regions. The specific measurement formulas are as follows:
Urban–rural compulsory education gap = 1/2 × (urban/rural junior high per capita budget + urban/rural primary per capita budget);
Urban–rural gap in medical and health care = Number of beds in urban medical and health care institutions/Number of beds in rural medical and health care institutions;
Urban–rural gap in social security services = Per capita net transfer income of urban residents/Per capita net transfer income of rural residents.
3.3. Control Variables
The urban–rural consumption gap results from multiple factors. In addition to the urban–rural public service gap, this study controls for the following influencing factors on the urban–rural consumption gap:
- (1)
- Industrial upgrading level (upgrading), measured by the industrial structure hierarchy coefficient. The formula is as follows:where qi represents the output value proportion of the i-th sub-industry.
- (2)
- Urbanization level (urban), characterized by the ratio of urban population to total population.
- (3)
- Openness level (open), measured by the trade dependency ratio (i.e., the proportion of import–export trade volume to regional GDP). Import–export values are converted using the mid-price exchange rate of USD to CNY.
- (4)
- Urban–rural income gap (ingap), defined as the ratio of urban per capita disposable income to rural per capita net income.
3.4. Data Source
This study employs panel data from 26 Chinese provinces spanning 2011–2023. Focused on relative gaps in urban–rural public service provision, the analysis excludes four direct-controlled municipalities (Beijing, Tianjin, Shanghai, Chongqing) due to their ambiguous urban–rural demarcations and the Tibet Autonomous Region, owing to incomplete or discontinuous data availability. Relevant data are sourced from the China Statistical Yearbook, China Education and Economic Statistics Yearbook, and China Economy Net Statistical Database. Table 1 presents the descriptive statistics for all sample variables.

Table 1.
Statistical descriptiveness of sample variables.
Based on the theoretical framework derivation, this paper constructs the benchmark model as follows:
Specifically, the explained variable gapconit represents the urban–rural consumption gap. The explanatory variables include gapconit−1 (one-period lagged urban–rural consumption gap in region i at time t), eduit, medit, and safeit, which denote the urban–rural gaps in compulsory education, medical and health care, and social security services, respectively. Control variables consist of the industrial upgrading level (upgradedit), urbanization level (urbanit), openness level (openit), and urban–rural income gap (ingapit). Here, i denotes the province, t denotes the time period, α is the intercept term, and β and γ represent the coefficients of each explanatory variable. μi and vi are individual and time effects, respectively. εit is the random perturbation term. To ensure the data approximate a normal distribution as closely as possible, natural logarithms of each explanatory variable and some control variables are taken in separate models for regression estimation. This study employed Stata 15 for empirical analysis.
4. Results
4.1. The Impact of the Urban–Rural Public Service Gap on the Urban–Rural Consumption Gap
Building on previous theoretical analysis and model design, this study investigated how relative gaps in public service provision influence consumption disparities. This paper reports regression results from fixed effects (FE) estimation, two-stage least squares (2SLS), and two-step system GMM, with detailed findings presented in Table 2. Given the potential endogeneity arising from reciprocal causality between variables and to address endogeneity in welfare-related public service gaps, this paper employed two-stage least squares estimation, selecting the first-order lag of each core explanatory variable as instrumental variables []. Instrument validity was tested via the Anderson canonical correlation LM test (p < 0.01) for under-identification and the Cragg–Donald Wald F test (F > 10 critical value) for weak instruments, confirming no weak instrument bias. Further, to address endogeneity from omitted variables and the dynamic adjustment process of urban–rural consumption gaps, this study used two-step system GMM estimation—preferred for dynamic panel data—to mitigate challenges inherent in such models. Instrumental variables are specified as lagged terms of explanatory variables and exogenous controls, with result validity assessed via disturbance term autocorrelation tests and instrumental variable over-identification tests. Moreover, to ensure regression result robustness and account for heteroskedasticity from individual heterogeneity, parameter estimates utilize robust bootstrap standard errors.
Table 2.
The empirical results of urban–rural public service gaps on consumption gaps.
Models (1)–(3) reveal significant positive correlations between logarithms of urban–rural gaps in compulsory education, healthcare, and social security with the consumption gap. These results align with theoretical mechanisms, indicating that public service disparities exacerbate consumption inequality. Consequently, policy makers should prioritize rural welfare service expansion, enhance compulsory education quality through targeted resource allocation, promote healthcare resource redistribution to rural areas, strengthen the rural minimum living standard security system, and improve rural residents’ access to public services. In models (3)–(4), lagged explanatory variables exhibit positive coefficients significant at the 5% level, with large effect sizes. This suggests a cumulative effect, where prior-period consumption gaps reinforce current disparities. To address this, the central government should reinforce urban–rural integration policies, improve performance evaluation of local governments, standardize government procurement of services, cautiously adopt public–private partnerships, and accelerate public institution reforms to promote equitable access to basic services.
Additionally, this study employs the urban–rural residents’ Theil index to analyze consumption and demographic structures. In regression models (5)–(8), the logarithm of the urban–rural compulsory education gap exhibits inconsistent coefficient signs across specifications. This inconsistency primarily stems from historically low investment levels in China’s urban–rural compulsory education during the study period. Compounded by the urban–rural dual structure and urban-priority policies, rural compulsory education faces persistent shortages in teacher allocation, infrastructure, and teaching conditions. Rural households with limited educational resources exhibit more homogeneous consumption patterns focused on basic needs, whereas urban households with diverse educational backgrounds show greater consumption heterogeneity. Rural residents with lower educational attainment tend to have lower marginal propensities to consume due to income constraints, while urban residents with higher education levels show more diversified consumption behaviors. These factors have widened basic education inequalities between urban and rural areas. Regression results across models (1)–(8) show that the logarithm of the urban–rural compulsory education gap has the highest significance level and largest absolute coefficient in explaining the consumption gap. This underscores that among China’s welfare public services, compulsory education exerts a stronger influence on urban–rural consumption disparities than other components.
Combined fixed effects (FE), 2SLS, and two-step system GMM regressions reveal heterogeneous effects of control variables on the urban–rural consumption gap. Among these, only the logarithm of the urban–rural income gap is statistically robust, with positive coefficients across models that are significant at the 5% level. This suggests increasing rural household income remains critical for narrowing consumption disparities. The logarithm of industrial structure level exhibits significant negative coefficients in most specifications, indicating that industrial upgrading effectively mitigates the urban–rural consumption gap. Specifically, industrial transformation improves labor remuneration in both sectors and alleviates supply constraints through new rural economic activities, such as agricultural deep processing, rural tourism, and e-commerce, which stimulate rural market vitality []. Urbanization level and its squared term show significantly negative and positive coefficients, respectively, indicating a U-shaped non-linear relationship with the consumption gap. In early urbanization stages, increased employment opportunities for rural residents enhance consumption capacity. However, in advanced stages, higher-skilled rural migrants with stronger economic capabilities tend to settle in cities, exacerbating consumption disparities. The logarithm of trade openness yields inconsistent coefficient signs across models and lacks statistical significance. A plausible explanation is that China’s deepening integration into the global economy has stabilized its influence on rural consumption behaviors, leading to muted effects on consumption gaps over time.
4.2. Cross-Period Robustness Test
The 19th National Congress of the Communist Party of China in 2017 explicitly proposed the Rural Revitalization Strategy, emphasizing the establishment of an institutional framework and policy system for integrated urban–rural development. The policy objective of “equalizing basic public services and significantly narrowing urban–rural disparities in development and living standards” has effectively promoted the extension of basic public services to rural areas. Consequently, the absolute urban–rural consumption gap began to narrow after 2018.
To assess this policy shift, this study employed a comparative analysis of two periods: 2013–2017 (pre-policy) and 2018–2023 (post-policy). Given the potential reverse causality between public service gaps and consumption disparities, this paper addressed endogeneity concerns by applying two-stage least squares (2SLS) and two-step system GMM estimation. These robust econometric methods ensure credible regression results. Detailed empirical findings are presented in Table 3.
Table 3.
Results of cross-period robustness tests.
Regression results across models (1)–(8) show cross-period estimation findings broadly consistent with full-sample results. Both periods exhibit time-lag effects of explanatory variables. Specifically, lagged first-period coefficients for the urban–rural consumption gap and Theil index pass the 1% significance test in all models, with positive coefficients exceeding 0.8. This indicates persistent positive autocorrelation in urban–rural consumption disparities across periods.
Logarithms of urban–rural gaps in compulsory education, healthcare, and social security all exhibit significant positive coefficients on the consumption gap. Notably, the coefficient of the compulsory education gap logarithm on the consumption Theil index is negative. This suggests that while widening compulsory education gaps significantly increase overall consumption inequality, they may concurrently narrow internal consumption disparities.
In absolute terms, healthcare and social security gap coefficients in 2018–2023 are significantly smaller than those in 2011–2017, whereas the compulsory education gap coefficient shows stronger effects in the later period. This pattern implies diminishing effects of rural welfare services on consumption disparities, while educational gaps exhibit amplified impacts. A plausible reason is that the Rural Revitalization Strategy proposed in 2017 promoted policy interventions to advance rural educational equity—specifically through provincial-level coordination of rural education funding and optimization of county-level education expenditure ratios. As a result, rural households may have prioritized educational investment in their consumption decisions, thereby strengthening the link between education gaps and consumption disparities.
A plausible explanation is that policy interventions—such as strengthening provincial-level coordination for rural education funding, dismantling household registration barriers to education access, and optimizing county-level education expenditure shares—have progressively rationalized compulsory education resource allocation. In contrast, persistent challenges in rural healthcare (e.g., limited accessibility, high costs) and structural rigidities in urban–rural social security integration suggest incomplete institutional reforms in these domains.
These findings highlight the need for holistic, systemic, and synergistic policy design in welfare public service provision, aligning with objectives of Healthy China initiatives and an all-around moderately prosperous society.
4.3. Robustness Tests with Alternative Model Specifications
To further validate the robustness of our findings and address potential omitted variable biases, we employed a Random Effects (RE) model as an alternative specification. The RE model assumes that individual-specific effects are uncorrelated with the explanatory variables. Table 4 presents the regression results.
Table 4.
Results of robustness tests with random effects model.
The coefficients of urban–rural gaps in compulsory education, healthcare, and social security remain positive and statistically significant in the RE model, aligning with the baseline FE results. Specifically in model (1), a 1% increase in the education gap is associated with a 0.1882 unit rise in the consumption gap between urban and rural residents, reinforcing the conclusion that public service disparities exacerbate consumption inequality. The healthcare and social security gap coefficients further validate the robust positive relationship.
4.4. Heterogeneity Analysis Based on the Level of Economic Catch-Up
To account for local governments’ incentives to narrow gaps with economically advanced regions by referencing neighboring provinces’ and national-level GDP per capita growth, this study operationalized economic catch-up intensity. Provinces with higher economic catch-up levels tend to prioritize public investments in industries and regions with short-term economic returns and low public service expenditure costs. This paper employs the highest per capita GDP among neighboring and national provinces to classify regions into “high economic catch-up” and “low economic catch-up” groups, enabling analysis of how urban–rural public service gaps affect consumption disparities.
The high economic catch-up group includes 15 provinces: Shanxi, Anhui, Jiangxi, Henan, Hunan, Guizhou, Hainan, Sichuan, Yunnan, Shaanxi, Gansu, Qinghai, Ningxia, and Xinjiang. The low economic catch-up group comprises 11 provinces: Hebei, Inner Mongolia, Liaoning, Jilin, Heilongjiang, Jiangsu, Zhejiang, Fujian, Shandong, Hubei, and Guangdong. The distribution of each province is shown in Figure 1. Empirical results are presented in Table 5.
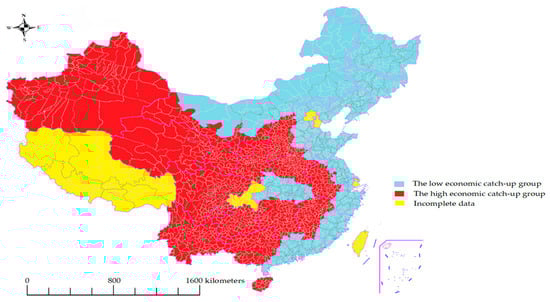
Figure 1.
The distribution of each province.
Table 5.
Heterogeneity analysis results.
Regression results from models (1) to (8) demonstrate that economic catch-up level heterogeneity estimates align with full-sample findings. In the economic catch-up heterogeneity tests, first-period lagged coefficients for both the urban–rural consumption gap and Theil index are significant at the 1% level, with large positive values. This confirms the presence of echo and diffusion effects, where prior-period income gaps influence current consumption disparities through cumulative mechanisms.
Notably, coefficients for urban–rural gaps in education, healthcare, and social security exhibit high significance in the high economic catch-up group, with large positive absolute values. This indicates that public service disparities exert stronger impacts on consumption gaps in regions under intense economic catch-up pressures.
This pattern is attributable to two key mechanisms. First, high catch-up regions—predominantly located in central and western provinces—face persistent urban–rural gaps in basic public service standards, with inadequate rural service provision. Recent policy interventions, such as deepening rural compulsory education funding guarantees, implementing medical poverty alleviation initiatives, and unifying urban–rural healthcare systems, have improved rural access to services, significantly narrowing consumption gaps. Second, fiscal constraints in these regions drive prioritization of short-term growth objectives, leading to targeted allocation of limited welfare resources—such as focusing on areas with high elderly and child populations—to maximize social welfare outcomes.
In contrast, low catch-up regions (primarily eastern and some central provinces) benefit from abundant educational/healthcare resources and higher rural social security coverage, resulting in weaker mitigation effects on consumption gaps and smaller coefficient magnitudes. Notably, while compulsory education gaps still exacerbate overall consumption inequality in these regions, they correlate with narrower internal urban–rural disparities as measured by the Theil index.
5. Discussion
This study confirms that urban–rural public service gaps have a significant positive impact on consumption disparities, with the gap in compulsory education showing the most pronounced effect, verifying the conclusion that the inequality of educational resources leads to the expansion of the disparity in consumption capacity [,,,]. The impacts of healthcare and social security gaps exhibit stage-specific characteristics: policy interventions after 2018 reduced the healthcare gap coefficient from 0.1468 to 0.1645, while social security gaps in high economic catch-up regions remained significant, reflecting the short-term orientation of fiscal resource allocation []. Distinct from existing literature focusing on urbanization and income gaps [], this study first quantifies the independent role of public service gaps: controlling for income gaps, public service gaps still explain the consumption disparity variations. The stronger effect in high economic catch-up regions validates the hypothesis of “fiscal competition leading to public service imbalance” [].
This study has two limitations: first, it only quantifies the “quantity gap” of public services and does not involve service quality (such as teacher qualifications and medical technology levels), which is related to the lack of quality indicators in provincial data; second, it does not consider the impact of digital public services. Future research can be expanded in three aspects: (1) combining micro-survey data to analyze the impact of public service satisfaction on consumption willingness; (2) introducing spatial econometric models to explore the spatial spillover effects of public service gaps; and (3) comparing and analyzing the equalization paths of public services in developed and developing countries to provide Chinese experience for global poverty reduction.
6. Conclusions and Policy Implications
6.1. Conclusions
Enhancing the integration of urban–rural public services necessitates narrowing the urban–rural public service gap, while fostering a sound system for comprehensive urban–rural development requires reducing the urban–rural consumption gap—a pivotal step toward achieving the UN 2030 Agenda’s sustainable development goals (SDGs), particularly SDG 10 (reduced inequalities) and SDG 11 (sustainable cities and communities). This paper aimed to analyze the internal mechanisms linking urban–rural public service gaps and consumption gaps within the context of economic catch-up. Using provincial panel data, we empirically examined the multi-dimensional impacts of urban–rural public service gaps on consumption gaps from national, inter-period, and heterogeneous economic catch-up group perspectives. The study derives the following key findings:
First, based on national-level panel data, gaps in urban–rural compulsory education, healthcare, and social security services exhibit significantly positive effects on urban–rural consumption gaps. Specifically, widening public service disparities exacerbate consumption inequalities, with evidence of a circular trajectory in consumption gap dynamics. Among these, the urban–rural compulsory education gap demonstrates the highest level of statistical significance and the largest absolute coefficient value, indicating that among China’s welfare public services, compulsory education exerts a stronger influence on urban–rural consumption disparities than healthcare and social security services. Notably, across different models analyzing the urban–rural consumption Theil index logarithm, the sign of the coefficient for compulsory education gaps remains inconsistent. This phenomenon primarily stems from the historically low proportion of compulsory education investment in rural areas, compounded by urban–rural dual structural constraints and urban-priority development strategies. These factors have resulted in persistent shortages in rural teacher allocation, infrastructure, and teaching conditions, deepening basic education inequalities and their complex impacts on consumption behavior. Concurrently, variables such as industrial structure level, urbanization level, the squared urbanization term, and urban–rural income gaps show high statistical significance. The “U”-shaped relationship between urbanization level and consumption gaps indicates that early-stage urbanization enhances rural residents’ consumption capacity through job creation, while advanced urbanization tends to widen gaps as more skilled rural migrants with better economic conditions settle in cities. Second, inter-period robustness analysis reveals that the impact of rural welfare public services—particularly healthcare and social security—on consumption gaps tends to weaken over time, whereas the effect of compulsory education gaps on consumption disparities increases significantly. Third, heterogeneity analysis demonstrates that in regions with higher levels of economic catch-up, urban–rural public service gaps exert more pronounced effects on consumption gaps compared to regions with lower catch-up capacities.
6.2. Policy Implications
The findings of this study carry significant policy implications, prompting the following evidence-based policy recommendations:
- (1)
- Governments at all administrative levels should steadfastly implement the central government’s strategic mandate to establish and refine the institutional framework for urban–rural basic public service integration, accelerating the trajectory of “high-quality urban–rural integrated development.” This necessitates continuous acceleration of welfare public service supply in rural areas, with targeted focus on education, healthcare, and social security sectors, while maintaining the proportional allocation of welfare fiscal expenditure to narrow urban–rural public service disparities. In operationalizing this mandate, two complementary strategies are proposed: First, integrating basic welfare public service gap metrics into the supervisory and performance evaluation mechanisms of grassroots governments—particularly in economically lagging regions with high catch-up potential—to strengthen policy implementation and rectify the historical “urban-priority, rural-suppression” development mindset. Second, advancing systematic equalization of urban–rural basic public services through holistic, synergistic allocation of public resources in education, healthcare, and social security. Specific interventions include implementing the “Rural Compulsory Education Renovation Program” to address infrastructure shortages in rural schools, advancing the “Urban–Rural Residents’ Endowment Insurance Coordination” to unify social security standards, alongside dynamic adjustments to rural minimum living security standards based on regional economic levels.
- (2)
- Strengthening the catalytic role of public service supply on rural consumption capacity. This entails dual-pronged strategies: On one hand, coordinating the layout of rural consumption infrastructure at the county level, and improving the accessibility of rural public service facilities in combination with new urbanization construction. For example, convenient consumption outlets can be arranged around township health centers and village primary schools to solve the bottleneck of the “last mile” of rural consumption, indirectly amplifying the pulling effect of public services on consumption. On the other hand, fostering integrated primary–secondary–tertiary industry development by promoting agricultural product processing, leisure agriculture, rural tourism, and e-commerce alongside the cultivation of moderate-scale agricultural operations. These measures aim to solidify the industrial foundation for urban–rural integration while creating diversified consumption patterns for rural households.
Author Contributions
Conceptualization, Z.W. and C.L.; Methodology, Z.W.; Software, Z.W.; Validation, Z.W.; Formal Analysis, Z.W.; Resources, Z.W.; Data Curation, Z.W. and Y.T.; Writing—Original Draft Preparation, Z.W.; Writing—Review and Editing, Z.W.; Funding Acquisition, C.L. and Y.T. All authors have read and agreed to the published version of the manuscript.
Funding
This research was funded by the Liaoning University Youth Research Fund (grant number LDQN2024005); the Shenyang Normal University Doctoral Research Start-up Fund (grant number BS202501); and the National Social Science Fund Youth Project: Research on promotion mechanism of digital technology enabling high-quality supply and efficacy of agricultural productive services (grant number 24CJY111).
Institutional Review Board Statement
Not applicable.
Informed Consent Statement
Not applicable.
Data Availability Statement
The data in the manuscript come from the China Statistical Yearbook, the China Statistical Yearbook of Education Expenditures, and the China Economy Net Statistical Database.
Conflicts of Interest
The authors declare no conflicts of interest.
References
- United Nations. Transforming Our World: The 2030 Agenda for Sustainable Development; United Nations: New York, NY, USA, 2015. [Google Scholar]
- Central Committee of the Communist Party of China. Holding High the Great Banner of Socialism with Chinese Characteristics and Striving in Unity for the Comprehensive Construction of a Modernized Socialist Country—Report at the Twentieth National Congress of the Communist Party of China; People’s Publishing House: Beijing, China, 2022. (In Chinese) [Google Scholar]
- World Bank. Available online: https://data.worldbank.org.cn/ (accessed on 7 May 2025).
- National Bureau of Statistics. Available online: https://www.stats.gov.cn/ (accessed on 7 May 2025).
- Jin, H.; Du, C.; Wang, M.; Wang, Y.; Chen, L. Reducing the Consumption Gap Between Urban and Rural Areas: The Role of Rural Industrial Integration in China. Sustainability 2024, 16, 10646. [Google Scholar] [CrossRef]
- Hughes, B.B.; Narayan, K. Enhancing integrated analysis of national and global goal pursuit by endogenizing economic productivity. PLoS ONE 2021, 16, e0246797. [Google Scholar] [CrossRef] [PubMed]
- Henderson, J.V.; Roberts, M.; Storeygard, A. Is Urbanization in Sub-Saharan Africa Different? The World Bank. 2013. Policy Research Working Paper Series 6481. Available online: https://ideas.repec.org/p/wbk/wbrwps/6481.html (accessed on 30 June 2025).
- Qi, H.Q.; Xi, X.W.; Cao, L. Why does China’s urbanization fail to promote the simultaneous growth of urban and rural residents’ consumption?—An empirical study based on inter-provincial panel data. Nanjing Soc. Sci. 2017, 9, 20–27+44. (In Chinese) [Google Scholar]
- Xiong, Y.; Qiu, W.J. Research on the relationship between urbanization and urban-rural residents’ consumption. Stat. Decis. Mak. 2014, 11, 107–109. (In Chinese) [Google Scholar]
- Fatas, A.; Mihov, I. The Effects of Fiscal Policy on Consumption and Employment: Theory and Evidence. CEPR Discussion Paper. 2001. Available online: https://faculty.insead.edu/fatas/fiscal.pdf (accessed on 30 June 2025).
- Ji, J.M.; Zhang, L.T.; Jiang, Q.Y. An empirical study on the impact of social security differences on residents’ consumption in urban and rural areas in China. Shanghai Econ. Res. 2011, 1, 46–53. (In Chinese) [Google Scholar]
- Gao, L.L.; Yan, J.; Du, Y. Identifying the Turning Point of the Urban–Rural Relationship: Evidence from Macro Data. China World Econ. 2018, 26, 106–126. [Google Scholar] [CrossRef]
- Ohtake, F.; Saito, M. Population Aging and Consumption Inequality in Japan. Rev. Income Wealth 1998, 44, 361–381. [Google Scholar] [CrossRef]
- Lin, X.; Qi, Y. Influence of Consumption Decisions of Rural Residents in the Context of Rapid Urbanization: Evidence from Sichuan, China. Sustainability 2023, 15, 16524. [Google Scholar] [CrossRef]
- Li, J.; Cheong, T.S.; Shen, J.; Fu, D. Urbanization and Rural-Urban Consumption Disparity: Evidence from China. Singap. Econ. Rev. 2018, 64, 983–996. [Google Scholar] [CrossRef]
- Liu, J.; Ma, X.; Jia, W.; Zhang, S. Can New-Type Urbanization Construction Narrow the Urban–Rural Income Gap? Evidence from China. Sustainability 2022, 14, 14725. [Google Scholar] [CrossRef]
- Wang, Y.; Chen, X.; Sun, P.; Liu, H.; He, J. Spatial-temporal Evolution of the Urban-rural Coordination Relationship in Northeast China in 1990–2018. Chin. Geogr. Sci. 2021, 31, 429–443. [Google Scholar] [CrossRef]
- Liang, S. International trade and urban-rural income inequality in China. Appl. Econ. Lett. 2023, 31, 1243–1246. [Google Scholar] [CrossRef]
- Po, L. Asymmetrical integration: Public finance deprivation in China’s urbanized villages. Environ. Plan. A 2012, 44, 2834–2851. [Google Scholar] [CrossRef]
- Cui, X.J.; Ma, L.B.; Tao, T.M.; Zhang, W.B. Do the supply of and demand for rural public service facilities match? Assessment based on the perspective of rural residents. Sustain. Cities Soc. 2022, 82, 103905. [Google Scholar] [CrossRef]
- Xue, E.; Li, J.; Li, X. Mapping Historical Trends of Sustainable Rural Education Policy Development in China. Educ. Philos. Theory 2021, 55, 217–226. [Google Scholar] [CrossRef]
- Liu, W.; Li, J.; Zhao, R. The effects of rural education on poverty in China: A spatial econometric perspective. J. Asia Pac. Econ. 2021, 28, 176–198. [Google Scholar] [CrossRef]
- Xue, E.; Li, J.; Li, X. Sustainable Development of Education in Rural Areas for Rural Revitalization in China: A Comprehensive Policy Circle Analysis. Sustainability 2021, 13, 13101. [Google Scholar] [CrossRef]
- Ju, F.; Wang, S.; Lin, W. Nonlinear effect of urbanization on the gap between urban and rural elementary education in China. Math. Probl. Eng. 2022, 2022, 7025433. [Google Scholar] [CrossRef]
- Lundh, C. Was there an urban–rural consumption gap? The standard of living of workers in southern Sweden, 1914–1920. Scand. Econ. Hist. Rev. 2013, 61, 233–258. [Google Scholar] [CrossRef]
- Dou, R.; Zhu, B.; Chen, W.; Li, Q.; Zhang, S.; Xu, W. How does townships’ economic landscape affect urban–rural income inequality in China? Socio-Econ. Plan. Sci. 2025, 98, 102150. [Google Scholar] [CrossRef]
- Xiong, B.; Li, J. New Cooperative Medical Scheme and Consumption of Rural Residents. Financ. Econ. 2017, 7, 13. [Google Scholar]
- Wang, L.J.; Hu, Q. The effect of urban-rural health insurance integration on consumption of middle-aged and older adult households in rural areas: Evidence from China. Front. Public Health 2023, 11, 1260571. [Google Scholar] [CrossRef]
- Tang, Y.Q.; Fu, R.; Noguchi, H. Impact of medical insurance integration on reducing urban-rural health disparity: Evidence from China. Soc. Sci. Med. 2024, 357, 117163. [Google Scholar] [CrossRef]
- Zhao, Y.; Qiao, Q.; Xu, X.; Bian, Y. Effectiveness of hierarchical medical system and economic growth: Based on China’s urban vs. rural health perspectives. Front. Public Health 2024, 12, 1364584. [Google Scholar] [CrossRef]
- Huang, X.; Wu, B. Impact of urban-rural health insurance integration on health care: Evidence from rural China. China Econ. Rev. 2020, 64, 101543. [Google Scholar] [CrossRef]
- Roy, S. Trends and Patterns in Consumption Expenditure: A Review of Class and Rural-Urban Disparities; University Library of Munich: Munich, Germany, 2011. [Google Scholar]
- Zhang, G.; Kang, J.; Jing, S.; Chen, Y.; Deng, T.; Xu, H.; Wu, H.; Xu, F. Meat, vegetable, and fruit consumption among urban and rural elders aged 60 years in regional China: A population-level nutritional study. J. Nutr. Sci. 2023, 12, 104. [Google Scholar] [CrossRef] [PubMed]
- Faye, N.F.; Fall, T.; Reardon, T.; Theriault, V.; Ngom, Y.; Barry, M.B.; Sy, M.R. Consumption of fruits and vegetables by types and sources across urban and rural Senegal. J. Agribus. Dev. Emerg. Econ. 2024, 14, 958–978. [Google Scholar] [CrossRef]
- Xu, Y.; Ou, G. A study on the impact of high-speed rail on the consumption structure of urban and rural residents in China. PLoS ONE 2024, 19, 0307947. [Google Scholar] [CrossRef]
- Mu, X.L.; Wang, T.; Gao, Y.G. The impact of transfer payments on the urban-rural public service gap—A subgroup comparison of different economic catching-up provinces. Econ. Res. 2017, 52, 52–66. (In Chinese) [Google Scholar]
- Liu, C.; Wang, X.; Bai, Z.; Wang, H.; Li, C. Does Digital Technology Application Promote Carbon Emission Efficiency in Dairy Farms? Evidence from China. Agriculture 2023, 13, 904. [Google Scholar] [CrossRef]
- Hong, M.Y.; Zhang, W.J. Industrial structure upgrading, urbanization and urban-rural income disparity: Evidence from China. Appl. Econ. Lett. 2021, 28, 1321–1326. [Google Scholar] [CrossRef]
Disclaimer/Publisher’s Note: The statements, opinions and data contained in all publications are solely those of the individual author(s) and contributor(s) and not of MDPI and/or the editor(s). MDPI and/or the editor(s) disclaim responsibility for any injury to people or property resulting from any ideas, methods, instructions or products referred to in the content. |
© 2025 by the authors. Licensee MDPI, Basel, Switzerland. This article is an open access article distributed under the terms and conditions of the Creative Commons Attribution (CC BY) license (https://creativecommons.org/licenses/by/4.0/).