Abstract
This study investigates the factors affecting the choice of school travel mode among students in Mersin, Türkiye, focusing on walking, private car, public transit and school bus. A two-step modeling approach was adopted. First, a latent class cluster analysis (LCCA) was applied to identify subgroups of students with similar characteristics. Then, separate multinomial logit (MNL) models were estimated for each cluster. The data come from the 2022 Urban Transport Master Plan household survey and include 2798 students from 2092 households. The results show that trip distance is the most consistent and significant factor across all clusters, as increasing distance makes students more likely to use motorized modes instead of walking. Gender also demonstrates a consistent influence in specific clusters, where male students are less likely to travel by private car. Similarly, residing in a single-family house consistently increases the likelihood of car use in multiple clusters. Conversely, the influence of household structure, parental education, income, and household size differs significantly between clusters, underlining the importance of considering group-level differences in school travel behavior. These findings suggest that policies aiming to promote sustainable school travel should be sensitive to the needs of different student groups. Integrating land use and transportation planning may help to support active and shared modes of travel.
1. Introduction
Children’s daily travel to school is a significant aspect of urban mobility, with far-reaching implications for traffic congestion, environmental sustainability, and public health. As cities expand and educational facilities are increasingly located outside traditional residential areas, how students commute to school has become a growing concern for urban planners and policymakers. While school travel behavior has been widely studied in high-income countries, research remains limited in contexts like Türkiye, where distinct urban dynamics, socioeconomic diversity, and evolving spatial patterns warrant closer attention. This study addresses this gap by examining the key factors influencing the choice of school travel mode in Türkiye, drawing on a broad set of individual, household, and environmental characteristics.
Children, especially those enrolled in schools, need transportation options similar to those of adults [1]. However, the decision-making processes related to children’s transportation needs differ from those of adults [2]. Generally, children rely on adults to decide where, when, and how they will travel [3,4]. Research shows that regular physical activity and the use of active transportation modes enhance children’s social well-being and cognitive abilities [5,6]. Active transportation involves traveling by modes dependent on human power, such as walking or cycling [7].
Biking and walking are encouraged around the world to help children become more active and reduce obesity. Including these activities in children’s daily routines, especially for school trips, has important health benefits [8,9]. Children who regularly walk or bike to school are more likely to maintain this healthy and active lifestyle by choosing sustainable travel practices as they grow older [10,11]. Cardiovascular diseases and other health issues in adulthood are often linked to a lack of physical activity during childhood and adolescence [12].
In the literature, it is increasingly evident that families are choosing larger, more dispersed schools over smaller, neighborhood-based ones. This leads to fewer opportunities for children’s active transportation and greater reliance on motorized vehicles [13]. This shift worsens problems such as air pollution, energy consumption, and traffic congestion during peak urban hours [14,15]. The trend is observed in both developed and developing countries [16]. At the same time, urban sprawl, along with concerns about transportation safety and declining walkability conditions for students, has contributed to a growing dependence on motorized modes of school travel in recent years.
McDonald et al. [17] stated that 10–14% of morning traffic in the U.S. is caused by parents dropping their children off at school. Addressing this issue could help reduce congestion and vehicle emissions, making roads safer for vulnerable users [18]. This effect becomes especially evident during school holidays, when peak-hour traffic volumes noticeably drop, particularly around school areas [19]. Increased vehicular traffic on school routes and concerns about traffic safety for pedestrians and cyclists have contributed to a decline in children using active transportation modes. This downward trend has been exacerbated by parents’ growing concerns about their children’s personal safety [20,21,22]. The proportion of school trips made by elementary and middle school students using active modes in the U.S. dropped from 48% in 1969 to 13% by 2009 [17]. Similarly, in Australia, the percentage of children using active and independent travel to school fell from 61% to 32% between 1991 and 2012 [23]. This phenomenon is observed not only globally but also in Türkiye. Urbanization and population growth have led authorities to invest in new schools, often in peripheral areas due to limited land in city centers. As a result, students increasingly rely on school buses, public transit, or parental accompaniment, contributing to a decline in public transit use and a rise in private car dependency in urban areas. However, unlike many developed countries, a significant proportion of middle and high school students in Türkiye—about 55%—still walk to school. Similar to other developing countries, school travel choices in Türkiye may be influenced by unique geographical and cultural factors, making them distinct from more developed regions [9].
To the best of our knowledge, only one recent study from Türkiye has examined school travel behavior [24], focusing on the impact of built environment characteristics on children’s choice to walk to school. However, that study was limited to a single travel mode and did not account for socio-demographic or household-level factors.
This study offers several contributions to the literature. First, it analyzes multiple school travel modes—walking, car, public transit, and school bus—in an integrated manner. Second, it considers a wide range of explanatory variables, including student age, gender, school grade, household size and income, siblings, parental employment and education, car ownership, and travel distance. Third, it is the first study in Türkiye to address the choice of school travel mode with this level of detail and breadth. It also employs a latent class approach to capture unobserved heterogeneity, which enhances the explanatory power of the analysis. Finally, it offers new insights from a developing country context, contributing to a more balanced understanding of global school travel behavior and informing evidence-based transport planning.
The remainder of this paper is organized as follows. Section 2 presents the literature review, summarizing key findings from previous research on the choice of school travel mode. Section 3 describes the study area and the dataset used in this research. Section 4 outlines the methodology, including the modeling approach and variable definitions. Section 5 presents the model’s results, followed by a discussion in Section 6. Finally, Section 7 provides the main conclusions and policy implications.
2. Literature Review
There is an extensive body of literature exploring the factors that influence children’s school travel, with most studies conducted in developed countries. The findings reveal that various elements play a role in shaping children’s transportation preferences. Table 1 provides a summary of selected studies, including key aspects such as study location, students’ age, modes of travel, and methodology.
Distance between home and school stands out as a pivotal factor influencing mode choice [8,25,26]. As the distance increases, the use of active transportation modes for school commutes tends to decrease [27,28,29]. Meanwhile, the use of school buses [29], cars [30], and public transit [2] has increased, along with parental driving [31]. Scheiner et al. [32] argued that the threshold for abandoning active modes depends on cultural norms and environmental conditions. In China and the U.S., walking is preferred up to 500 m [33,34], while in Germany, Müller et al. [35] reported a 1 km threshold. In Australia, Timperio et al. [36] emphasized that walking and biking are preferred by children of all age groups up to 800 m. Studies from Canada and the U.S. have identified an upper threshold for active travel at around 1.6 km [37,38].
The built environment is an important factor in the use of active transportation [39]. Pedestrian- and cyclist-friendly infrastructure has been shown to increase the use of active transportation modes [27,36]. In contrast, inadequate infrastructure—such as high-traffic streets and busy intersections—usually leads to more car use [40,41,42,43]. Conversely, Mandic et al. [31] concluded that a high intersection density in residential areas supports active school transportation.
Broberg and Sarjala [44] reported that as urbanization levels rise, public transit becomes a more common choice than active transportation. Similarly, Yarlagadda and Srinivasan [3] found that children living in areas with high employment rates are more likely to use public transit, although Braza et al. [45] argued that high employment rates support walking. Studies show mixed findings regarding land use and street density. Some suggest that a mixed land use and high street density encourage walking [37,46,47], while others report the opposite effect [39,41]. Features such as short block lengths, a high density of sidewalks, good street connectivity, and tree coverage along school routes have been found to encourage walking [24,34,39,48]. Although many aspects of residential land use support active transportation, Lin and He [8] found that residential density itself is not a significant factor in school travel.
Household socio-demographic characteristics—including income level [41,47], car ownership [27,28,29], the number of licensed drivers [13], work obligations, and travel behavior [3,49]—play a crucial role in determining the choice of school travel mode. Higher income levels and car ownership are generally associated with a greater likelihood that parents will drive their children to school [9,22,50]. Lidbe [51] indicated that in the U.S., children from low-income families tend to prefer taking the school bus. However, Lin and He [8] found no significant relationship between income and active transportation in their study in China
Other household dynamics also influence this decision. For example, Mitra and Buliung [27] found that if adults are at home during school commute times, children are more likely to be driven by private car. Li and Zhao [52] noted that a greater number of family members increases the chance of children being driven to school. Flexible working hours for parents also make it more likely that they will accompany their children to school [53]. McDonald [49] found that fathers’ commuting patterns do not strongly affect children’s active travel, whereas children whose mothers work in the morning are less likely to walk. Students with unemployed parents are more likely to walk [26,43].
The influence of children’s age [9,54,55] and gender [56,57,58,59] on mode choice has been explored in various studies. One exception is Lin and He [8], who found no association between age or gender and choice of school travel mode. As children grow older, they tend to become more independent, reducing the likelihood of being accompanied by parents and increasing the use of independent modes such as bicycles, buses, or walking [19,59]. Dias et al. [9] found that this independence leads older students to prefer walking as their primary mode of transportation. Males are generally more likely to use active or independent transportation modes compared to females [43,59,60,61], while females are more often driven to school by their parents [51,62]. McMillan et al. [63] noted that males tend to use active transportation more frequently at younger ages. Clifton [64] observed that young adolescents use active modes more often than older ones but quickly abandon them when driving becomes an option. McDonald [65] suggested that the combined effects of age and gender shape choices of school travel mode.
Martin et al. [66] observed that students from families with educated parents are less likely to use public transport or walk. Similarly, AlQuhtani [43] found that higher parental education levels are associated with lower levels of active commuting. However, Ozbil et al. [24] reported the opposite effect. It has also been noted that parents tend to be more cautious about the mode choice for young girls, although gender differences tend to narrow as children get older. McDonald [65] highlighted that a higher number of siblings reduces the reliance on cars for school travel.
Families are more likely to support active transportation in areas perceived as walkable [37,41,67]. In contrast, traffic [68,69] and crime [55,70] negatively impact the use of active modes. Van den Berg et al. [71] concluded that parental safety perceptions are shaped by children’s age, income, neighborhood infrastructure, and social cohesion. Pabayo et al. [72] observed that when older and younger siblings travel together, parental concerns decrease. Families worried about punctuality and comfort may prefer driving their children to school or using the school bus [73].
The literature shows that factors such as distance to school, household income, car ownership, and parental employment strongly affect the choice of school travel mode. Built environment features and safety concerns are also important, especially for younger students and girls. Although many studies in developed countries examine multiple travel modes, they typically do not account for unobserved heterogeneity in travel behavior. To address this gap and provide evidence from a developing country context, recent data from Mersin, Türkiye, were analyzed using a latent class modeling approach, which better captures variations in travel choices across different student groups.

Table 1.
Summary of selected school trip studies.
Table 1.
Summary of selected school trip studies.
| Study | Country | Age Group | Active | Car | Public Transit | School Bus | Others | Method |
|---|---|---|---|---|---|---|---|---|
| Liu et al. [54] | China | 6–18 | x | GWLR | ||||
| Dias et al. [9] | Sri Lanka | 6–18 | x | x | x | x | x | MNL, Mix logit |
| Li et al. [59] | China | 6–18 | x | x | x | x | MNL | |
| Müller et al. [19] | Germany | 10–19 | x | x | x | Nested logit | ||
| Ozbil et al. [24] | Türkiye | 12–14 | x | Nominal. logistic reg. | ||||
| Lin and He [8] | China | 6–13 | x | Binary logit | ||||
| Scheiner et al. [32] | Germany | 6–10 | x | x | x | MNL | ||
| Distefano et al. [74] | Italy | 3–11 | x | x | SEM | |||
| Singh and Vasudevan [75] | India | 5–15 | x | x | x | x | MNL | |
| Stark et al. [2] | Austria, Germany | 12, 13 | x | x | x | SEM | ||
| Ermagun and Samimi [16] | Iran | 12–17 | x | x | x | x | Copula-based joint | |
| Woldeamanuel [76] | U.S. | 12–16 | x | x | x | Binary logit | ||
| Ermagun et al. [73] | Iran | 12–17 | x | x | x | x | Random forest | |
| Li and Zhao [52] | China | 13–15 | x | x | x | MNL | ||
| Mitra and Buliung [77] | Canada | 11, 14, 15 | x | x | x | x | MNL | |
| Guliani et al. [60] | Canada | 10–12 | x | x | SEM | |||
| Broberg and Sarjala [44] | Finland | 11–14 | x | x | MNL | |||
| Elias and Katoshevski-Cavari [78] | Israel | 9–15 | x | x | x | MNL | ||
| Noland et al. [79] | U.S. | 3–14 | x | x | x | x | Mix logit | |
| Nevelsteen et al. [80] | Belgium | 6–12 | x | x | x | Logistic regression | ||
| He [81] | U.S. | 5–18 | x | x | MNL | |||
| Alemu and Tsutsumi [82] | Japan | 15–18 | x | x | x | MNL | ||
| Mitra et al. [83] | Canada | 11–13 | x | x | Binary logit | |||
| McDonald [84] | U.S. | 5–13 | x | x | x | MNL | ||
| Mota et al. [85] | Portugal | 12–16 | x | x | x | Logistic regression |
3. Study Area and Data
Mersin City, situated on Türkiye’s southern coast, is the focus of this research, with a population slightly exceeding one million in 2022 [86]. During the late 20th century, Mersin City experienced rapid industrialization and urban growth, propelling it to become the 10th largest city in Türkiye. Consequently, both the general population and the student population saw significant increases. Over this period, the number of cars per thousand people surged from 69 to 150, while the average daily trips per person rose from 1.28 to 1.64 (see Table 2).
Table 2.
Basic indicators [87,88].
The dataset for this study is sourced from a travel survey carried out among residents of Mersin City as part of the Urban Transport Master Plan in 2022 [87]. The households were selected through random sampling, with approximately 3% of households surveyed in each of the 140 neighborhoods of Mersin City. All members of the selected 12,324 households were asked to report their one-day travel activities, resulting in a total of 48,832 trip records. Alongside travel details such as travel duration, starting and ending points, trip purpose, and mode of transportation, respondents were also asked about pertinent household characteristics, including household size, vehicle ownership, income, employment status, and housing situation. For the current research, while the travel survey covered all of Mersin City, the focal areas selected for this study specifically include the city center and the most urbanized regions of Mersin City, encompassing Akdeniz, Mezitli, Toroslar, and Yenişehir. Within these areas, middle school students (aged 11–14 years old) and high school students (aged 15–18 years old) were chosen as the target population.
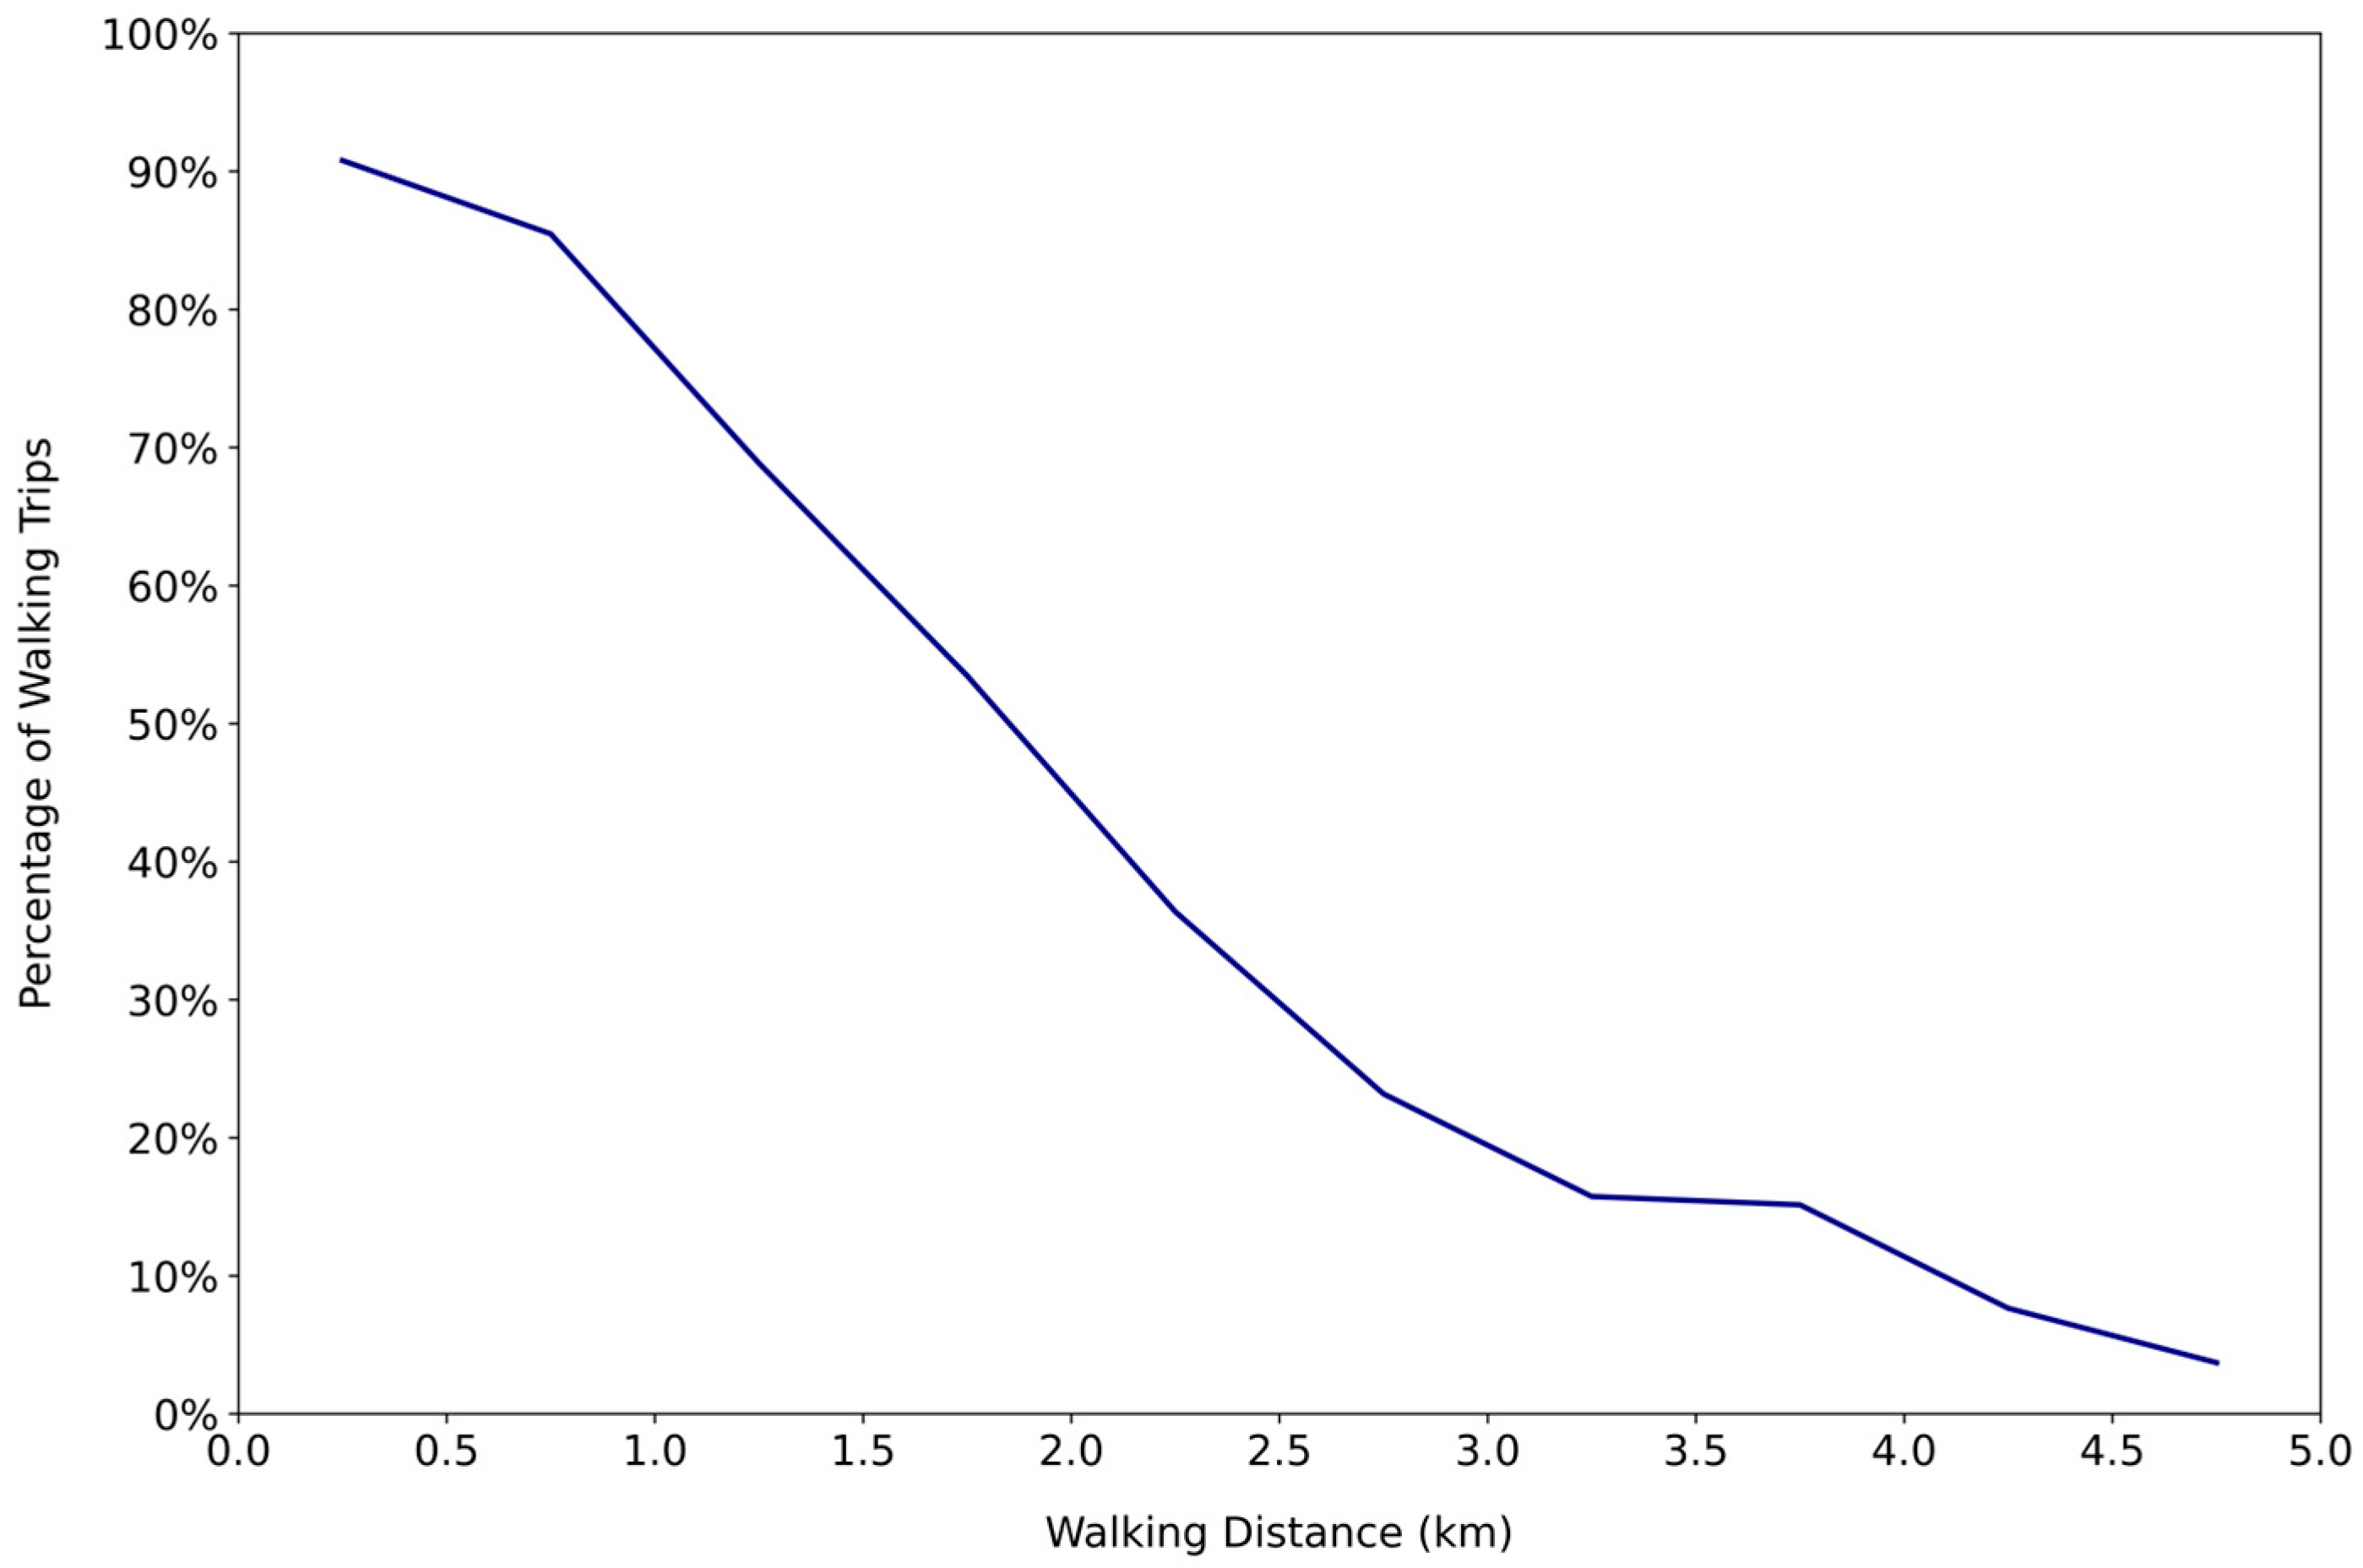
Table 3 presents the descriptive statistics of the final dataset, which includes 2798 students from 2092 households living in the study area. In total, 5534 school trips were recorded, almost equally distributed between trips to school (50.4%) and from school (49.6%). Walking appears as the most used travel mode, with 55.3% of trips, followed by public transit (25.6%), school buses (14.6%), and private cars (4.5%). In Türkiye, school bus services are typically provided by private operators, and the monthly cost ranges from USD 100 to 150. A significant portion of walking trips occurred at very short or relatively long distances: 35.3% were shorter than 0.5 km, and 32.6% were longer than 2.5 km. Medium-range distances were less common, with 18.6% of trips between 0.5 and 1.49 km and 13.5% between 1.5 and 2.49 km. Trip distances were calculated by determining the shortest pedestrian path between each student’s home and school using a GIS-based network analysis. This analysis utilized the home and school locations obtained from the household travel survey, which was conducted as part of the Transport Master Plan, and the resulting shortest paths were accepted as the trip distances for this study. As shown in Figure 1, walking dominates at short distances: more than 90% of trips under 0.5 km and over 85% of those up to 1 km were made on foot. However, after 2 km, the walking rate drops significantly, falling below 40% and reaching around 15% at 4 km. These findings indicate that 2 km may represent a behavioral threshold for students’ willingness to walk.
Table 3.
Summary of sample characteristics.
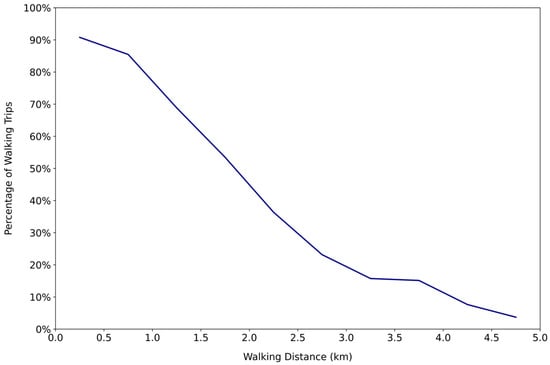
Figure 1.
Walking percentage by distance.
The sample includes 52.8% male and 47.2% female students, with the majority (60.1%) attending middle school and the rest (39.9%) in high school. In terms of household size, families with four members are the most common (33.3%), followed by five-member (26.7%) and six-or-more-member (21.6%) households. Three-member households make up 16.1%, while only 2.2% of students live in two-person households.
Regarding housing conditions, 60.4% of students live in apartments, 37.6% in single-family houses, and 2.0% in shanty-type dwellings. A large proportion of students (85.1%) come from two-parent households. Only 13.6% of students reside in households where all parents are employed, and notably, 83.7% of mothers are not working. Additionally, just 14.9% of students have at least one parent with a university degree.
About 21.4% of students have siblings attending the same school. Car ownership is generally low; 56.6% of households have no vehicle, 40.8% own one car, and only 2.6% have two or more cars. The average monthly household income is USD 802. The majority of households (58.3%) fall within the USD 1000–1499 income range, followed by 22.4% in the USD 500–999 range. Only 4.0% of households earn less than USD 500, while 3.5% report an income higher than USD 2000.
4. Method of the Study
When individuals travel from one point to another, they tend to choose the mode that maximizes utility by evaluating factors such as cost, travel time, and other attributes (e.g., comfort, safety) associated with the available options [13]. The literature presents various approaches to modeling travel mode choices, with discrete choice models being a common method due to their closed-form expressions and interpretable results. Recently, studies have also incorporated machine learning and explainable AI to enhance their predictive and interpretative capabilities [89,90].
While multinomial logit (MNL) models are frequently used to evaluate multiple mode alternatives (see Table 1), their use is constrained by the Independence of Irrelevant Alternatives (IIA) assumption, which implies that unobserved factors are uncorrelated across choices [9]. To address this limitation and better capture unobserved heterogeneity, advanced models such as latent class and random parameter approaches have been adopted in some studies [91,92]. One advantage of the latent class model is that it identifies homogeneous subgroups without requiring assumptions on parameter distributions, unlike random parameter models that rely on specific distributional forms [93].
Building on this, our study adopted a two-step modeling approach to address unobserved heterogeneity in school travel behavior. First, latent class clustering (LCC) was utilized to group students with similar characteristics. Subsequently, a separate multinomial logit model was estimated for each identified class to pinpoint the factors influencing their school mode choices.
4.1. Latent Class Clustering
Latent class clustering (LCC) is a statistical method based on a probability model used to determine subgroups of datasets according to a latent categorical variable. LCC maximizes the homogeneity of the samples within classes and the heterogeneity between classes [94]. If a dataset with J categorical items is classified into N classes, the LCC model can be described by the following equation:
where represents item j of a response pattern y. is an indicator function that equals 1 when the response variable and equals 0 otherwise. is the probability of membership in latent class n, and is the probability of response to item j, conditional on membership in latent class n. γ is a vector of latent class membership probabilities [95].
There is no requirement to specify the number of clusters in advance, as this can be statistically determined. Common criteria used for selecting the optimal number of classes include the Bayesian Information Criterion (BIC) and the Akaike Information Criterion (AIC). Lower values of AIC and BIC indicate a better model fit. Additionally, entropy is frequently employed to assess the quality of the clustering solution. Entropy values range from 0 to 1. Values closer to 1.0 indicate the significance of the model [96].
4.2. Multinomial Logit Model
For each cluster, MNL was utilized to investigate the significant factors influencing school trip mode choices among multiple modes as shown in Equation (2).
where Uin determines the mode choice outcome i by individuals, Xin is a vector of observed characteristics (covariates), and εin is the random error term.
Table 4 presents the variables included in the model, grouped by their type and listed with their respective levels and reference categories. The dependent variable is the choice of school trip mode, modeled across four alternatives: walking (reference), private car, public transit, and school bus. The explanatory variables comprise a mix of categorical, ordinal, and continuous measures. Categorical variables include student gender, school grade, housing type, parent count, trip direction (to or from school), presence of a sibling in the same school, parental education status e.g., whether a university graduate parent exists), and indicators of employment (e.g., whether all parents are employed, or the mother is unemployed). Ordinal variables reflect ordered categories such as household income, household size, number of same-school siblings, and number of cars in the household. The continuous variables, student age and home-to-school distance, were entered in their original metric form.
Table 4.
Data’s variable specifications.
5. Results
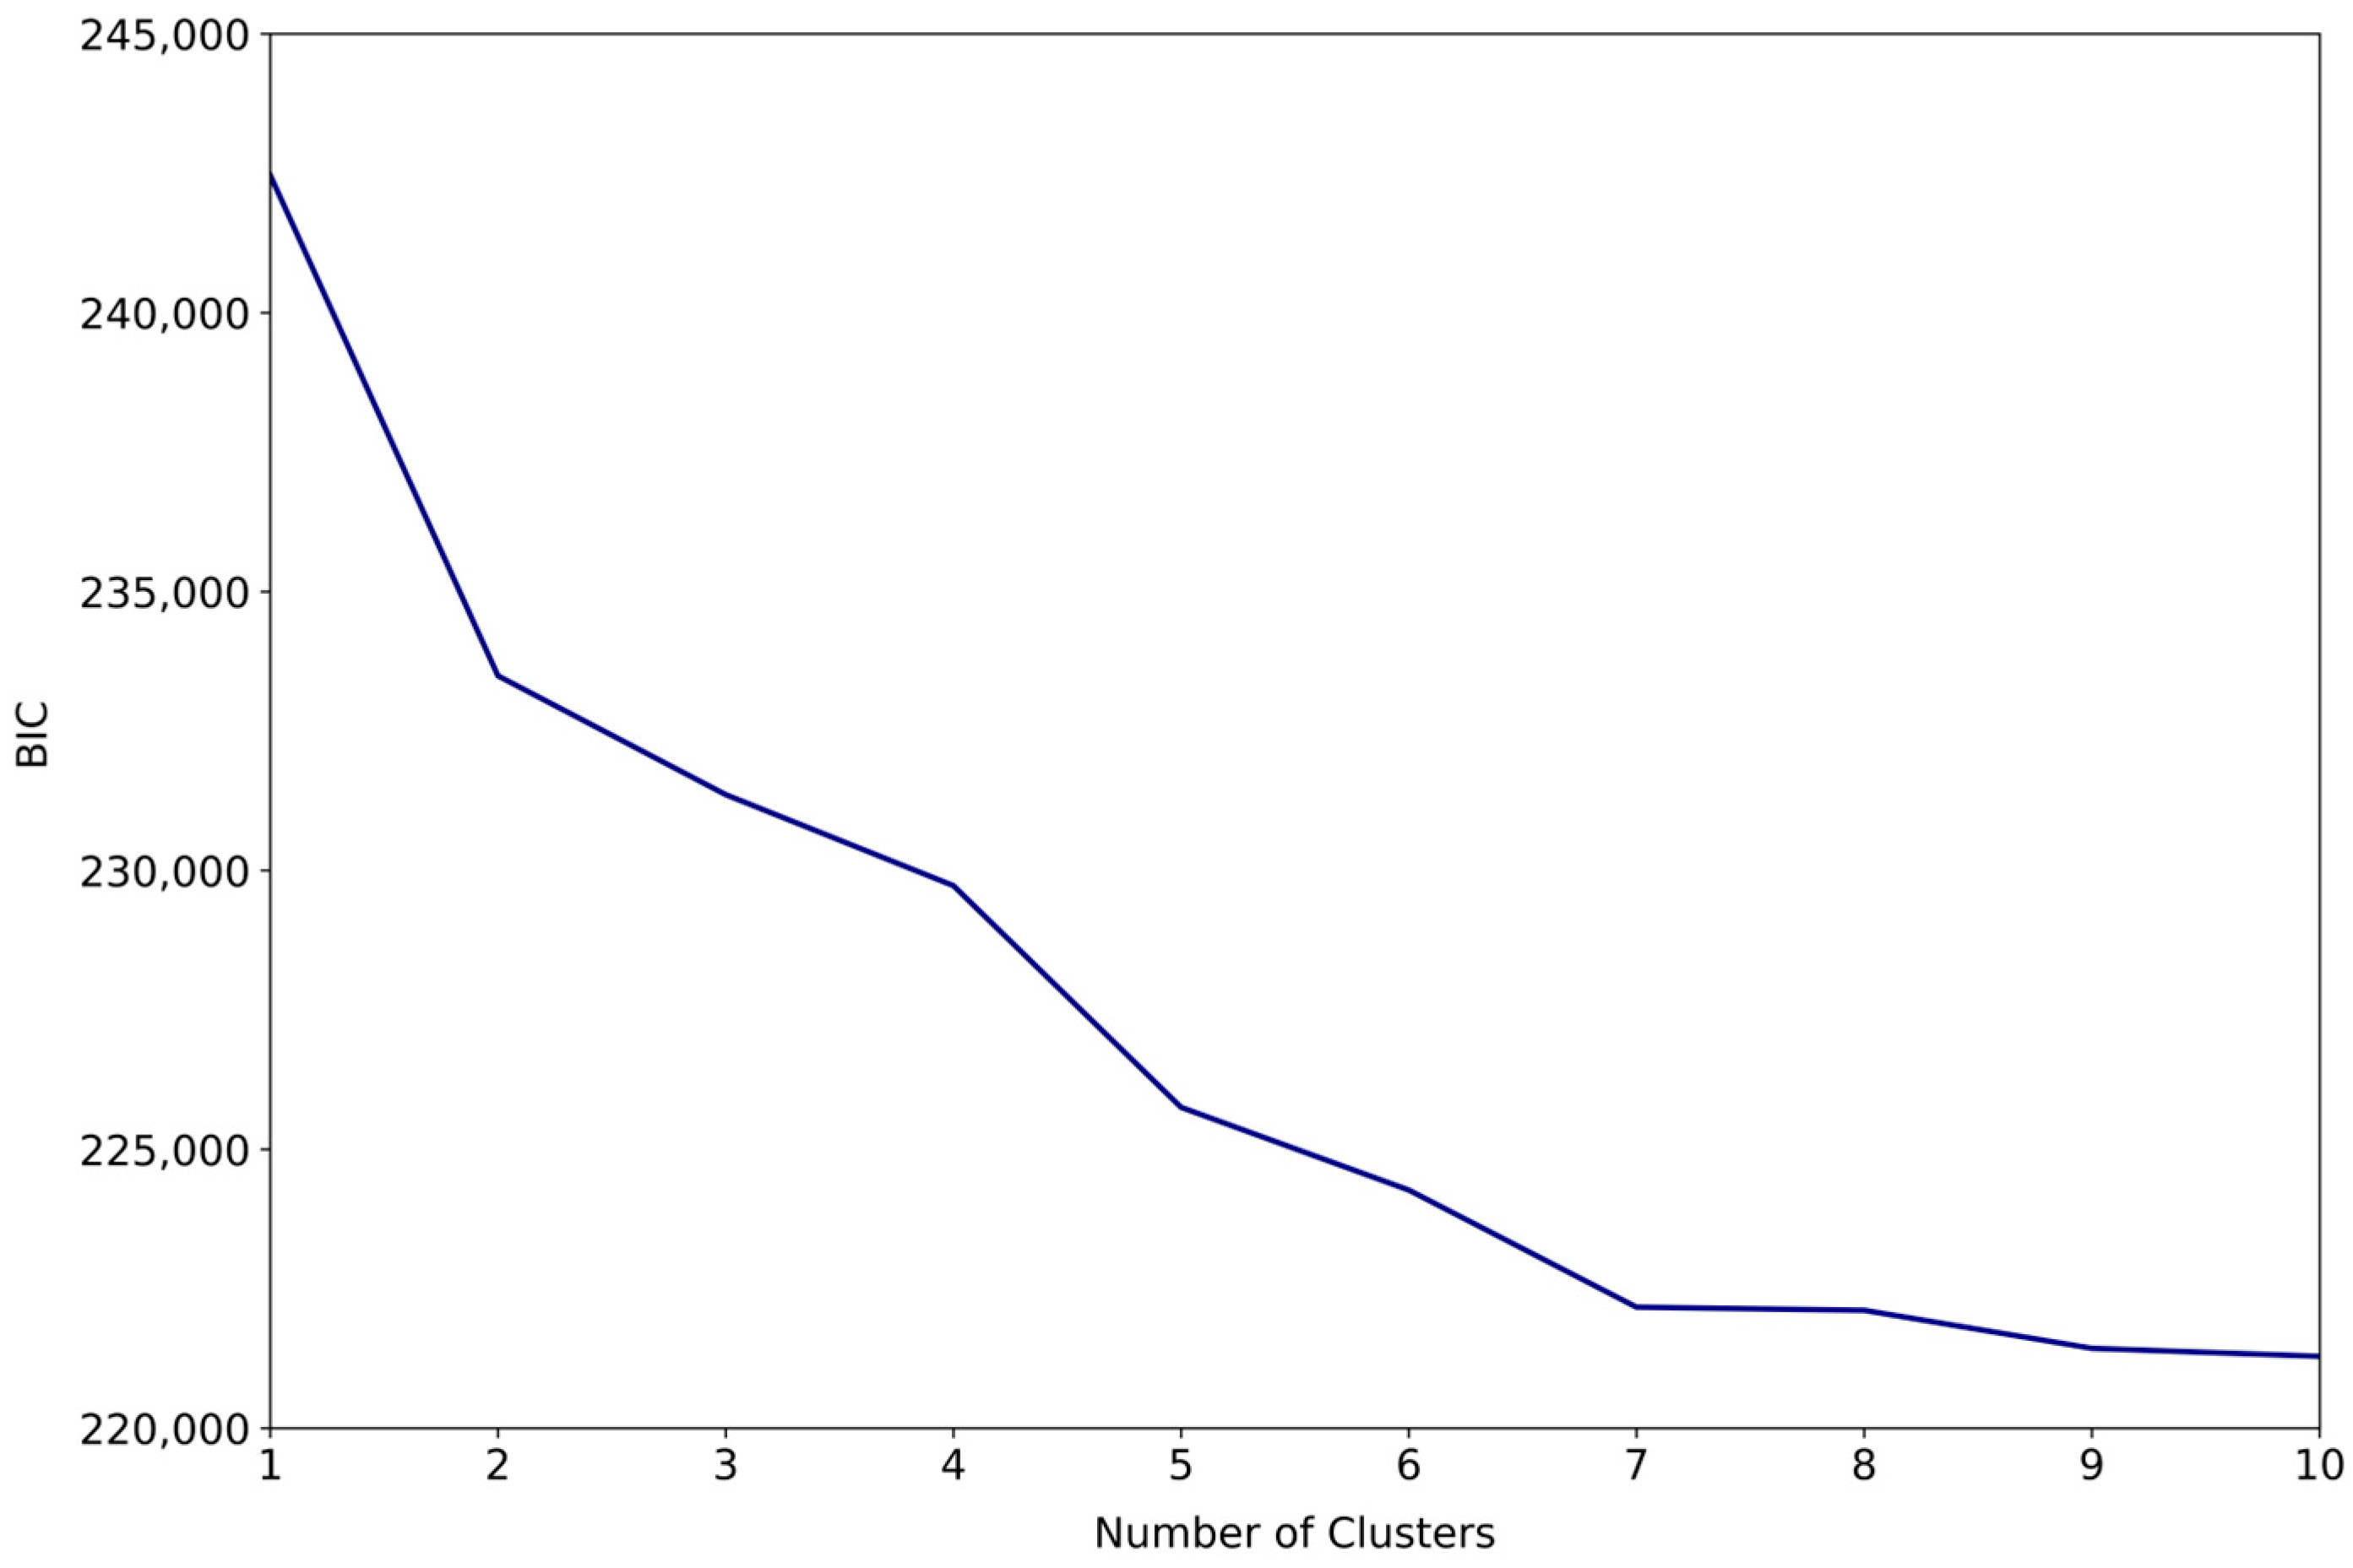
Latent class cluster analysis (LCCA) was applied in the first stage to reduce preference heterogeneity within the sample. The number of clusters was determined using model fit criteria such as log-likelihood, the Bayesian Information Criterion (BIC), and entropy. The three-cluster solution, with a BIC score of 231,359 and a high entropy value of 0.991, was selected as the best-fitting model. Notably, the percentage decrease in BIC fell below 2% beyond the three-cluster model, indicating a diminishing improvement in model fit (see Figure 2).
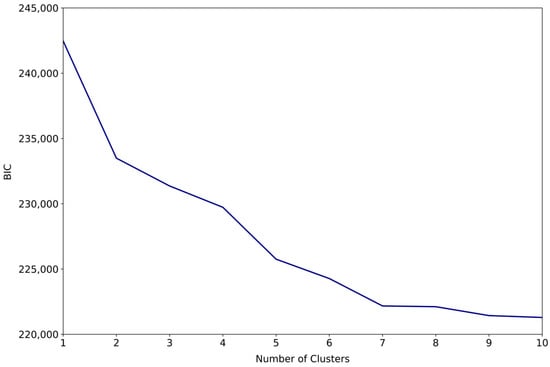
Figure 2.
BIC values for clusters.
Table 5 presents an overview of the cluster characteristics. Cluster 1 is composed mostly of middle school students, with walking being the most common mode of travel (44.6%). A significant portion of households own a car (60.0%), and all mothers are employed. This cluster has the lowest household size. Household income generally falls within the middle range, and the proportion of university-educated parents is higher compared to the other clusters. Travel distances in this group range from short to medium.
Table 5.
Overview of cluster characteristics.
Cluster 2 consists entirely of high school students, and public transportation stands out as the dominant travel mode (50.0%). Households in this cluster are larger than those in Cluster 1. Almost all of the mothers are unemployed. Income levels are concentrated in the low-to-middle range, and the share of university-educated parents is relatively low. On average, students in this cluster travel longer distances to school than those in the other groups.
Cluster 3 includes only middle school students; the vast majority of whom walk to school. This group has the lowest level of car ownership and the highest household size. Representing a low-income population, almost all mothers in this cluster are not working, and the proportion of university-educated parents is low. Students in this group have the shortest school travel distances among all clusters.
Multinomial logit (MNL) models, with walking mode set as the reference category, were estimated separately for each latent cluster. The results indicate that the variables influencing choice of school travel mode vary both within and across clusters. McFadden’s pseudo R-squared values for the models across all clusters range between 0.2 and 0.4, indicating an acceptable level of model fit [97] (see Table 6).
Table 6.
Multinomial logit models results by cluster.
For Cluster 1, the likelihood of choosing a car, public transit, or school bus instead of walking changes with several factors. Male students are less likely to use a car compared to female students (OR = 0.499). Students in middle school are about four times more likely to use a car compared to those in high school (OR = 4.010). As the trip distance increases, the use of a car becomes more likely (OR = 3.339). Students living in a single-family house are more likely to travel by car (OR = 2.831). Having two parents (OR = 0.483) or having parents without a university degree (OR = 0.389) reduces the chance of using a car. Students living in a shanty have a much higher probability of using a car (OR ≈ 6.88 × 10⁹). For public transit, longer trip distances increase the likelihood of use (OR = 3.731), while having two parents lowers it (OR = 0.343). A higher household income increases the use of public transit (OR = 1.344). Students living in a shanty are also much more likely to use public transit (OR ≈ 1.77 × 10⁹). For school bus use, older students are less likely to choose it (OR = 0.689), while a greater distance increases the probability (OR = 3.760). Students with two parents (OR = 0.495) or from larger households (OR = 0.550) are less likely to use the school bus. A higher household income slightly increases the likelihood of school bus use (OR = 1.445).
In the second cluster (C2), the likelihood of choosing a car, public transit, or school bus instead of walking also varies with several factors. Male students are less likely to use a car compared to female students (OR = 0.309). Students living with both parents are much more likely to use a car (OR = 14.4). As the trip distance increases, the use of a car becomes more likely (OR = 4.353). Students living in a single-family house are more likely to travel by car (OR = 3.393). For public transit, longer trip distances increase the likelihood of use (OR = 4.075), and students living with both parents are also more likely to choose this mode (OR = 3.985). However, a higher household income slightly reduces the use of public transit (OR = 0.835). Students from larger households are more likely to use public transit (OR = 1.56), while an increase in the number of household cars greatly reduces the probability (OR ≈ 1.91 × 10⁻⁸). Students living in a single-family house are also more likely to use public transit (OR = 1.877). For school bus use, students living with both parents are more likely to choose this mode (OR = 3.387), and a greater distance again increases the probability (OR = 3.356). A higher household income slightly reduces the likelihood of school bus use (OR = 0.773). Students from larger households are less likely to use the school bus (OR = 0.651). The interaction between household income and number of cars also reduces the probability of choosing the school bus (OR = 0.296). Additionally, students from households without a car are much less likely to use the school bus (OR = 0.045).
In the third cluster (C3), the effects of most variables are weaker compared to the other clusters; however, trip distance still increases the likelihood of choosing all three motorized modes. Specifically, a greater distance raises the probability of using a private car (OR = 1.723), public transit (OR = 2.804), and school bus (OR = 1.952). As student age increases, the likelihood of using public transit also increases (OR = 1.392). School bus use is less likely among students whose parents have no university education (OR = 0.322). In contrast, students without a sibling attending the same school are more likely to use the school bus (OR = 2.33). Additionally, a larger household size slightly reduces the probability of choosing a school bus (OR = 0.651).
6. Discussions
The findings of this study show that school travel choices vary significantly among students, depending on individual, household, and environmental characteristics. Among all variables, trip distance emerges as the most consistent and influential factor across the three clusters. As the distance between home and school increases, students are more likely to shift from walking to motorized modes such as private car, public transit, or school bus. This pattern is especially clear in Cluster 2, where students travel longer distances and motorized modes are used more often. In contrast, students in Cluster 3 mostly walk to school, which can be explained by their short travel distances and very low levels of car ownership. In Cluster 1, walking is also relatively common, likely due to moderate travel distances and the younger age of the students. These findings are consistent with previous studies showing that distance is a key determinant in school travel behavior [8,25,26], with longer distances leading to a reduced use of active modes [27,28,29] and greater reliance on school buses [29], private cars [30], and public transit [2].
The effects of household structure vary between clusters. In Cluster 1, students living with both parents are less likely to use a private car, public transit, or school bus. This may be related to the fact that in this group, all the mothers are employed, and the students are in middle school; under these conditions, walking may be a more practical choice. On the other hand, in Cluster 2, where the mothers are mostly not working, and the students are in high school, living with both parents increases the likelihood of using all motorized modes. In such households, families may have a stronger influence on their children’s travel decisions and may encourage safer or more structured transportation options.
Household income also shows different effects depending on the cluster. In Cluster 1, a higher income increases the likelihood of using public transit and a school bus. This may reflect families’ preference for more secure and organized options. In Cluster 2, however, a higher income slightly reduces the use of these modes, possibly due to a tendency toward private car travel. In Cluster 3, income has no significant effect, likely because the group is more socioeconomically homogeneous, and income levels are generally low.
Some findings are specific to certain clusters. For example, in Cluster 3, students whose parents do not have a university degree are less likely to use the school bus. Also in this group, students without a sibling attending the same school are more likely to choose the school bus, which may reflect hesitation toward walking alone. In Cluster 2, a higher number of household cars drastically reduces public transit use, suggesting that private vehicles are a strong substitute. In both Clusters 1 and 2, living in a single-family house increases the probability of using a private car, but only in Cluster 2 is this associated with higher public transit use as well. Lastly, school bus use is associated with not having a sibling in the same school only in Cluster 3; this effect does not appear in the other groups.
These differences clearly show that student travel behavior cannot be explained by a single model. The results justify the use of a latent class approach in this study, as it allows for uncovering meaningful heterogeneity based on both social and spatial conditions. It is important to note that most previous studies have used single-level models based on the full sample, without identifying distinct clusters of students. These models generally assume that all students behave in a similar way. However, this study used a latent class approach, which helps to identify different groups of students based on their social and spatial characteristics. Thanks to this method, it was possible to see specific patterns in each group that would not be visible in a single model. For this reason, results from other studies that do not use this type of segmentation should be compared carefully, as their findings may reflect general averages rather than group-specific behaviors.
7. Conclusions
School trips represent a significant portion of urban travel, with walking being particularly crucial for sustainability and children’s health. Many studies emphasize the benefits of walking and highlight several key factors that influence how students travel to school. These include the distance between home and school, the quality of pedestrian and cycling infrastructure, and family characteristics such as income level, car ownership, and whether the parents are working. Additionally, the age and gender of the children are important, with older students and males more likely to choose active transportation modes like walking or biking. Understanding these factors is essential for developing strategies that promote healthier and more sustainable travel habits among students.
In the past few decades, students in Mersin, like other major cities in Türkiye, have become increasingly dependent on school buses and parental escorts. This shift has led to a decline in public transit use and a growing reliance on private cars. Although walking remains a common mode of travel for school trips in Mersin due to the city’s relatively low household income levels, this trend may change as income and car ownership rates rise in the future. Such changes could significantly alter students’ travel patterns, increasing the use of cars and private school buses. The current advantage of walking as a primary mode of transport may not last if school locations are not carefully planned and transportation facilities are not improved. In recent years, both public and private schools have chosen to build on the periphery of the city, where land costs are lower than in the city center. This trend reflects findings from previous studies, showing that families tend to prefer schools on the periphery over neighborhood-based locations, leading to longer travel distances and more motorized school trips. As a result, walking and public transport usage have decreased, leaving parents with limited options, like driving their children or relying on private school buses. This shift brings both monetary and non-monetary costs for families and society, including fuel expenses, time costs, air pollution, and increased accident risks. Additionally, students’ health and well-being may suffer. Policymakers should consider the long-term social impacts of school location decisions, not just the short-term investment costs.
While this study provides valuable insights into the factors affecting school travel mode choices, it is important to acknowledge some limitations. This study mainly focused on middle and high school students, so younger children and university students, who might have different travel behaviors, were not included. Also, the research was based on cross-sectional data, meaning it only looked at travel patterns at one point in time, not showing how these patterns might change over time. Moreover, even though key variables were considered, other factors like weather conditions, crime statistics, family perceptions about safety and convenience, and school policies were not included but could affect transportation choices. This research obtained data from a conventional home interview survey; therefore, the questions were limited to household profile, traveler profile, and trip-making behaviors. Future studies could include more demographic groups and variables and explore how facility location and land use planning affect school travel behavior.
It has been shown in the literature that the walkability of the physical environment has an important impact on the share of walking trips. In this study, it was not possible to calculate a walkability index covering the entire city due to data limitations. Therefore, the effects of physical factors such as sidewalk quality, land use diversity, or street connectivity on walking trip shares at the neighborhood level could not be evaluated. Previous studies have also pointed out that variables like housing density, perceived safety, and environmental quality play a role in shaping walkability. In our case, the dataset did not include information about these variables, and it was not possible to access reliable secondary data either. For example, data related to weather conditions, crime rates, or parental perceptions of safety were not available and thus could not be included in the analysis. It is recommended that future studies consider incorporating such factors, by using more detailed surveys or combining different data sources. In this way, more comprehensive modeling approaches, including microscopic or multi-level methods, could be applied to better understand the determinants of choices of school travel mode and to help develop planning strategies that support sustainable mobility.
Author Contributions
Conceptualization, M.O. and F.Z.; methodology, M.O. and N.C.K.; software, M.O. and N.C.K.; validation, M.O. and F.Z.; formal analysis F.Z.; data curation, F.Z.; writing—original draft preparation, M.O. and N.C.K.; writing—review and editing, F.Z.; visualization, M.O. and N.C.K.; supervision, M.O. and F.Z.; project administration, M.O. and F.Z. All authors have read and agreed to the published version of the manuscript.
Funding
This research received no external funding.
Institutional Review Board Statement
Not applicable.
Informed Consent Statement
Not applicable.
Data Availability Statement
The original contributions presented in this study are included in the article. Further inquiries can be directed to the corresponding author.
Conflicts of Interest
The authors declare no conflicts of interest.
References
- Shokoohi, R.; Hanif, N.R.; Dali, M. Influence of the socio-economic factors on children’s school travel. Procedia-Soc. Behav. Sci. 2012, 50, 135–147. [Google Scholar] [CrossRef]
- Stark, J.; Bartana, I.B.; Fritz, A.; Unbehaun, W.; Hössinger, R. The influence of external factors on children’s travel mode: A comparison of school trips and non-school trips. J. Transp. Geogr. 2018, 68, 55–66. [Google Scholar] [CrossRef]
- Yarlagadda, A.K.; Srinivasan, S. Modeling children’s school travel mode and parental escort decisions. Transportation 2008, 35, 201–218. [Google Scholar] [CrossRef]
- Mackett, R.L. Children’s travel behaviour and its health implications. Transp. Policy 2013, 26, 66–72. [Google Scholar] [CrossRef]
- Tomporowski, P.D.; Davis, C.L.; Miller, P.H.; Naglieri, J.A. Exercise and children’s intelligence, cognition, and academic achievement. Educ. Psychol. Rev. 2008, 20, 111–131. [Google Scholar] [CrossRef]
- Fusco, C.; Moola, F.; Faulkner, G.; Buliung, R.; Richichi, V. Toward an understanding of children’s perceptions of their transport geographies: (Non)active school travel and visual representations of the built environment. J. Transp. Geogr. 2012, 20, 62–70. [Google Scholar] [CrossRef]
- Sallis, J.F.; Frank, L.D.; Saelens, B.E.; Kraft, M. Active transportation and physical activity: Opportunities for collaboration on transportation and public health research. Transp. Res. Part A Policy Pract. 2004, 38, 249–268. [Google Scholar] [CrossRef]
- Lin, L.; He, L. Active commuting to school by Chinese school-age children. In Transport and Children’s Wellbeing; Waygood, O., Friman, M., Olsson, L., Mitra, R., Eds.; Elsevier: London, UK, 2019; pp. 339–357. [Google Scholar] [CrossRef]
- Dias, C.; Abdullah, M.; Lovreglio, R.; Sachchithanantham, S.; Rekatheeban, M.; Sathyaprasad, I. Exploring home-to-school trip mode choices in Kandy, Sri Lanka. J. Transp. Geogr. 2022, 99, 103279. [Google Scholar] [CrossRef]
- Faulkner, G.E.; Buliung, R.N.; Flora, P.K.; Fusco, C. Active school transport, physical activity levels and body weight of children and youth: A systematic review. Prev. Med. 2009, 48, 3–8. [Google Scholar] [CrossRef]
- Bürgi, F.; Meyer, U.; Granacher, U.; Schindler, C.; Marques-Vidal, P.; Kriemler, S.; Puder, J.J. Relationship of physical activity with motor skills, aerobic fitness and body fat in preschool children: A cross-sectional and longitudinal study (Ballabeina). Int. J. Obes. 2011, 35, 937–944. [Google Scholar] [CrossRef]
- Andersen, L.B.; Harro, M.; Sardinha, L.B.; Froberg, K.; Ekelund, U.; Brage, S.; Anderssen, S.A. Physical activity and clustered cardiovascular risk in children: A cross-sectional study (The European Youth Heart Study). Lancet 2006, 368, 299–304. [Google Scholar] [CrossRef]
- Ewing, R.; Schroeer, W.; Greene, W. School location and student travel analysis of factors affecting mode choice. Transp. Res. Rec. J. Transp. Res. Board 2004, 1895, 55–63. [Google Scholar] [CrossRef]
- Wilson, E.J.; Wilson, R.; Krizek, K.J. The implications of school choice on travel behavior and environmental emissions. Transp. Res. Part D Transp. Environ. 2007, 12, 506–518. [Google Scholar] [CrossRef]
- Loo, B.P.; Lam, W.W. A multilevel investigation of differential individual mobility of working couples with children: A case study of Hong Kong. Transp. A Transp. Sci. 2013, 9, 629–652. [Google Scholar] [CrossRef]
- Ermagun, A.; Samimi, A. Mode choice and travel distance joint models in school trips. Transportation 2018, 45, 1755–1781. [Google Scholar] [CrossRef]
- McDonald, N.C.; Brown, A.L.; Marchetti, L.M.; Pedroso, M.S. US school travel, 2009: An assessment of trends. Am. J. Prev. Med. 2011, 41, 146–151. [Google Scholar] [CrossRef]
- Badland, H.M.; Schofield, G.M. The Built Environment and transport-related physical activity: What we do and do not know. J. Phys. Act. Health 2005, 2, 435–444. [Google Scholar] [CrossRef]
- Müller, S.; Mejia-Dorantes, L.; Kersten, E. Analysis of active school transportation in hilly urban environments: A case study of Dresden. J. Transp. Geogr. 2020, 88, 102872. [Google Scholar] [CrossRef]
- van der Ploeg, H.P.; Merom, D.; Corpuz, G.; Bauman, A.E. Trends in Australian children traveling to school 1971–2003: Burning petrol or carbohydrates? Prev. Med. 2008, 46, 60–62. [Google Scholar] [CrossRef]
- Buliung, R.N.; Mitra, R.; Faulkner, G. Active school transportation in the Greater Toronto Area, Canada: An exploration of trends in space and time (1986–2006). Prev. Med. 2009, 48, 507–512. [Google Scholar] [CrossRef]
- Ermagun, A.; Samimi, A. Promoting active transportation modes in school trips. Transp. Policy 2015, 37, 203–211. [Google Scholar] [CrossRef]
- Schoeppe, S.; Tranter, P.; Duncan, M.J.; Curtis, C.; Carver, A.; Malone, K. Australian children’s independent mobility levels: Secondary analyses of cross-sectional data between 1991 and 2012. Child. Geogr. 2016, 14, 408–421. [Google Scholar] [CrossRef]
- Ozbil, A.; Yesiltepe, D.; Argin, G.; Rybarczyk, G. Children’s active school travel: Examining the combined perceived and objective built-environment factors from space syntax. Int. J. Environ. Res. Public Health 2020, 18, 286. [Google Scholar] [CrossRef]
- Fyhri, A.; Hjorthol, R. Children’s independent mobility to school, friends and leisure activities. J. Transp. Geogr. 2009, 17, 377–384. [Google Scholar] [CrossRef]
- Kelly, J.A.; Fu, M. Sustainable school commuting–understanding choices and identifying opportunities: A case study in Dublin, Ireland. J. Transp. Geogr. 2014, 34, 221–230. [Google Scholar] [CrossRef]
- Mitra, R.; Buliung, R.N. The influence of neighborhood environment and household travel interactions on school travel behavior: An exploration using geographically-weighted models. J. Transp. Geogr. 2014, 36, 69–78. [Google Scholar] [CrossRef]
- Waygood, E.O.D.; Susilo, Y.O. Walking to school in Scotland: Do perceptions of neighbourhood quality matter? IATSS Res. 2015, 38, 125–129. [Google Scholar] [CrossRef]
- Zhang, R.; Yao, E.; Liu, Z. School travel mode choice in Beijing, China. J. Transp. Geogr. 2017, 62, 98–110. [Google Scholar] [CrossRef]
- Wen, L.M.; Fry, D.; Rissel, C.; Dirkis, H.; Balafas, A.; Merom, D. Factors associated with children being driven to school: Implications for walk to school programs. Health Educ. Res. 2008, 23, 325–334. [Google Scholar] [CrossRef]
- Mandic, S.; Ikeda, E.; Stewart, T.; Garrett, N.; Hopkins, D.; Mindell, J.S.; Tautolo, E.S.; Smith, M. Sociodemographic and built environment associates of travel to school by car among New Zealand adolescents: Meta-analysis. Int. J. Environ. Res. Public Health 2020, 17, 9138. [Google Scholar] [CrossRef]
- Scheiner, J.; Huber, O.; Lohmüller, S. Children’s mode choice for trips to primary school: A case study in German suburbia. Travel Behav. Soc. 2019, 15, 15–27. [Google Scholar] [CrossRef]
- Kontou, E.; McDonald, N.C.; Brookshire, K.; Pullen-Seufert, N.C.; LaJeunesse, S.U.S. active school travel in 2017: Prevalence and correlates. Prev. Med. Rep. 2020, 17, 101024. [Google Scholar] [CrossRef]
- Han, L.; Wang, Y.; Ao, Y.; Ding, X.; Li, M.; Wang, T. The built environment impacts on route choice from home to school for rural students: A stated preference experiment. Front. Public Health 2022, 10, 1087467. [Google Scholar] [CrossRef]
- Müller, S.; Tscharaktschiew, S.; Haase, K. Travel-to-school mode choice modelling and patterns of school choice in urban areas. J. Transp. Geogr. 2008, 16, 342–357. [Google Scholar] [CrossRef]
- Timperio, A.; Ball, K.; Salmon, J.; Roberts, R.; Giles-Corti, B.; Simmons, D.; Baur, L.A.; Crawford, D. Personal, family, social, and environmental correlates of active commuting to school. Am. J. Prev. Med. 2006, 30, 45–51. [Google Scholar] [CrossRef]
- McMillan, T.E. The relative influence of urban form on a child’s travel mode to school. Transp. Res. Part A Policy Pract. 2007, 41, 69–79. [Google Scholar] [CrossRef]
- Easton, S.; Ferrari, E. Children’s travel to school—The interaction of individual, neighbourhood and school factors. Transp. Policy 2015, 44, 9–18. [Google Scholar] [CrossRef]
- Schlossberg, M.; Greene, J.; Phillips, P.P.; Johnson, B.; Parker, B. School trips: Effects of urban form and distance on travel mode. J. Am. Plan. Assoc. 2016, 72, 337–346. [Google Scholar] [CrossRef]
- Giles-Corti, B.; Wood, G.; Pikora, T.; Learnihan, V.; Bulsara, M.; Van Niel, K.; Timperio, A.; McCormack, G.; Villanueva, K. School site and the potential to walk to school: The impact of street connectivity and traffic exposure in school neighborhoods. Health Place 2011, 17, 545–550. [Google Scholar] [CrossRef]
- Larsen, K.; Gilliland, J.; Hess, P.M. Route-based analysis to capture the environmental influences on a child’s mode of travel between home and school. Ann. Assoc. Am. Geogr. 2012, 102, 1348–1365. [Google Scholar] [CrossRef]
- Ahern, S.M.; Arnott, B.; Chatterton, T.; de Nazelle, A.; Kellar, I.; McEachan, R.R. Understanding parents’ school travel choices: A qualitative study using the Theoretical Domains Framework. J. Transp. Health 2007, 4, 278–293. [Google Scholar] [CrossRef]
- AlQuhtani, S. Factors affecting active commuting to school in sprawled cities: The case of Najran City, Saudi Arabia. Sustainability 2023, 15, 9562. [Google Scholar] [CrossRef]
- Broberg, A.; Sarjala, S. School travel mode choice and the characteristics of the urban built environment: The case of Helsinki, Finland. Transp. Policy 2015, 37, 1–10. [Google Scholar] [CrossRef]
- Braza, M.; Shoemaker, W.; Seeley, A. Neighborhood design and rates of walking and biking to elementary school in 34 California communities. Am. J. Health Promot. 2004, 19, 128–136. [Google Scholar] [CrossRef]
- Panter, J.R.; Jones, A.P.; Van Sluijs, E.M.; Griffin, S.J. Neighborhood, route, and school environments and children’s active commuting. Am. J. Prev. Med. 2010, 38, 268–278. [Google Scholar] [CrossRef]
- Yang, Y.; Abbott, S.; Schlossberg, M. The influence of school choice policy on active school commuting: A case study of a middle-sized school district in Oregon. Environ. Plan. A Econ. Space 2012, 44, 1856–1874. [Google Scholar] [CrossRef]
- Lin, J.-J.; Chang, H.-T. Built environment effects on children’s school travel in Taipai: Independence and travel mode. Urban Stud. 2010, 47, 867–889. [Google Scholar] [CrossRef]
- McDonald, N.C. Household interactions and children’s school travel: The effect of parental work patterns on walking and biking to school. J. Transp. Geogr. 2008, 16, 324–331. [Google Scholar] [CrossRef]
- Wilson, E.J.; Marshall, J.; Wilson, R.; Krizek, K.J. By foot, bus or car: Children’s school travel and school choice policy. Environ. Plan. A Econ. Space 2010, 42, 2168–2185. [Google Scholar] [CrossRef]
- Lidbe, A.; Li, X.; Adanu, E.K.; Nambisan, S.; Jones, S. Exploratory analysis of recent trends in school travel mode choices in the US. Transp. Res. Interdiscip. Perspect. 2020, 6, 100146. [Google Scholar] [CrossRef]
- Li, S.; Zhao, P. The determinants of commuting mode choice among school children in Beijing. J. Transp. Geogr. 2015, 46, 112–121. [Google Scholar] [CrossRef]
- He, S.Y.; Giuliano, G. Factors affecting children’s journeys to school: A joint escort-mode choice model. Transportation 2017, 44, 199–224. [Google Scholar] [CrossRef]
- Liu, Y.; Min, S.; Shi, Z.; He, M. Exploring students’ choice of active travel to school in different spatial environments: A case study in a mountain city. J. Transp. Geogr. 2024, 115, 103795. [Google Scholar] [CrossRef]
- Lee, C.; Zhu, X.; Yoon, J.; Varni, J.W. Beyond distance: Children’s school travel mode choice. Ann. Behav. Med. 2013, 45, 55–67. [Google Scholar] [CrossRef]
- Leslie, E.; Kremer, P.; Toumbourou, J.W.; Williams, J.W. Gender differences in personal, social and environmental influences on active travel to and from school for Australian adolescents. J. Sci. Med. Sport 2010, 13, 597–601. [Google Scholar] [CrossRef]
- Van Dyck, D.; De Bourdeaudhuij, I.; Cardon, G.; Deforche, B. Criterion distances and correlates of active transportation to school in Belgian older adolescents. Int. J. Behav. Nutr. Phys. Act. 2010, 7, 87. [Google Scholar] [CrossRef]
- Clifton, J.; Akar, G.; Smith, A.L.; Voorhees, C.C. Gender Differences in 1 Adolescent Travel to School. Exploring the Links with Physical Activity and Health. Women Issues Transp. 2010, 2, 203–222. [Google Scholar]
- Li, H.; Han, L.; Ao, Y.; Wang, Y.; Wang, T. Influences of the built environment on rural school children’s travel mode choice: The case of Chengdu. Int. J. Environ. Res. Public Health 2022, 19, 9008. [Google Scholar] [CrossRef]
- Guliani, A.; Mitra, R.; Buliung, R.N.; Larsen, K.; Faulkner, G.E. Gender-based differences in school travel mode choice behaviour: Examining the relationship between the neighbourhood environment and perceived traffic safety. J. Transp. Health 2015, 2, 502–511. [Google Scholar] [CrossRef]
- Stone, M.; Larsen, K.; Faulkner, G.E.; Buliung, R.N.; Arbour-Nicitopoulos, K.P.; Lay, J. Predictors of driving among families living within 2km from school: Exploring the role of the built environment. Transp. Policy 2014, 33, 8–16. [Google Scholar] [CrossRef]
- Zwerts, E.; Allaert, G.; Janssens, D.; Wets, G.; Witlox, F. How children view their travel behaviour: A case study from Flanders (Belgium). J. Transp. Geogr. 2010, 18, 702–710. [Google Scholar] [CrossRef]
- McMillan, T.; Day, K.; Boarnet, M.; Alfonzo, M.; Anderson, C. Johnny walks to school—does Jane? Sex differences in children’s active travel to school. Child. Youth Environ. 2006, 16, 75–89. [Google Scholar] [CrossRef]
- Clifton, K.J. Independent mobility among teenagers: Exploration of travel to after-school activities. Transp. Res. Rec. J. Transp. Res. Board 2003, 1854, 74–80. [Google Scholar] [CrossRef]
- McDonald, N.C. Is there a gender gap in school travel? An examination of US children and adolescents. J. Transp. Geogr. 2012, 20, 80–86. [Google Scholar] [CrossRef]
- Martin, S.L.; Lee, S.M.; Lowry, R. National prevalence and correlates of walking and bicycling to school. Am. J. Prev. Med. 2007, 33, 98–105. [Google Scholar] [CrossRef]
- Boarnet, M.G.; Anderson, C.L.; Day, K.; McMillan, T.; Alfonzo, M. Evaluation of the California Safe Routes to School legislation: Urban form changes and children’s active transportation to school. Am. J. Prev. Med. 2005, 28, 134–140. [Google Scholar] [CrossRef]
- Panter, J.R.; Jones, A.P.; van Sluijs, E.M.F.; Griffin, S.J. Attitudes, social support and environmental perceptions as predictors of active commuting behaviour in school children. J. Epidemiol. Community Health 2010, 64, 41–48. [Google Scholar] [CrossRef]
- Hsu, H.-P.; Saphores, J.-D. Impacts of parental gender and attitudes on children’s school travel mode and parental chauffeuring behavior: Results for California based on the 2009 National Household Travel Survey. Transportation 2014, 41, 543–565. [Google Scholar] [CrossRef]
- Stewart, O. Findings from research on active transportation to school and implications for safe routes to school programs. J. Plan. Lit. 2011, 26, 127–150. [Google Scholar] [CrossRef]
- Van den Berg, P.; Waygood, E.O.D.; van de Craats, I.; Kemperman, A. Factors affecting parental safety perception, satisfaction with school travel and mood in primary school children in the Netherlands. J. Transp. Health 2020, 16, 100837. [Google Scholar] [CrossRef]
- Pabayo, R.; Gauvin, L.; Barnett, T.A. Longitudinal changes in active transportation to school in Canadian youth aged 6 through 16 years. Pediatrics 2011, 128, e404–e413. [Google Scholar] [CrossRef]
- Ermagun, A.; Rashidi, T.H.; Lari, Z.A. Mode choice for school trips: Long-term planning and impact of modal specification on policy assessments. Transp. Res. Rec. 2015, 2513, 97–105. [Google Scholar] [CrossRef]
- Distefano, N.; Leonardi, S.; Pulvirenti, G. Home-school travel: Analysis of factors affecting italian parents’ mode choice. Civ. Eng. Arch. 2019, 7, 75–87. [Google Scholar] [CrossRef]
- Singh, N.; Vasudevan, V. Understanding school trip mode choice—The case of Kanpur (India). J. Transp. Geogr. 2018, 66, 283–290. [Google Scholar] [CrossRef]
- Woldeamanuel, M. Younger teens’ mode choice for school trips: Do parents’ attitudes toward safety and traffic conditions along the school route matter? Int. J. Sustain. Transp. 2016, 10, 147–155. [Google Scholar] [CrossRef]
- Mitra, R.; Buliung, R.N. Exploring differences in school travel mode choice behaviour between children and youth. Transp. Policy 2015, 42, 4–11. [Google Scholar] [CrossRef]
- Elias, W.; Katoshevski-Cavari, R. The role of socio-economic and environmental characteristics in school-commuting behavior: A comparative study of Jewish and Arab children in Israel. Transp. Policy 2014, 32, 79–87. [Google Scholar] [CrossRef]
- Noland, R.B.; Park, H.; Von Hagen, L.A.; Chatman, D.G. A mode choice analysis of school trips in New Jersey. J. Transp. Land Use 2014, 7, 111–133. [Google Scholar] [CrossRef]
- Nevelsteen, K.; Steenberghen, T.; Van Rompaey, A.; Uyttersprot, L. Controlling factors of the parental safety perception on children’s travel mode choice. Accid. Anal. Prev. 2012, 45, 39–49. [Google Scholar] [CrossRef]
- He, S. Effect of school quality and residential environment on mode choice of school trips. Transp. Res. Rec. J. Transp. Res. Board 2011, 2213, 96–104. [Google Scholar] [CrossRef]
- Alemu, D.D.; Tsutsumi, J.-I.G. Determinants and spatial variability of after-school travel by teenagers. J. Transp. Geogr. 2011, 19, 876–881. [Google Scholar] [CrossRef]
- Mitra, R.; Buliung, R.N.; Roorda, M.J. Built environment and school travel mode choice in Toronto, Canada. Transp. Res. Rec. J. Transp. Res. Board 2010, 2156, 150–159. [Google Scholar] [CrossRef]
- McDonald, N.C. Children’s mode choice for the school trip: The role of distance and school location in walking to school. Transportation 2008, 35, 23–35. [Google Scholar] [CrossRef]
- Mota, J.; Gomes, H.; Almeida, M.; Ribeiro, J.C.; Carvalho, J.; Santos, M.P. Active versus passive transportation to school–differences in screen time, socio-economic position and perceived environmental characteristics in adolescent girls. Ann. Hum. Biol. 2007, 34, 273–282. [Google Scholar] [CrossRef]
- TurkStat, Turkish Statistical Institute, 2024. Address Based Population Registration System Results. Turkish Statistical Institute. Available online: https://data.tuik.gov.tr (accessed on 14 June 2025).
- Kaiser. Mersin Transportation Master Plan Report; Boğaziçi: Istanbul, Turkey, 2023. [Google Scholar]
- RMT Limited. Mersin Transportation Study and Master Plan Report; Boğaziçi: Istanbul, Turkey, 2000. [Google Scholar]
- Zhang, H.; Zhang, L.; Liu, Y.; Zhang, L. Understanding travel mode choice behavior: Influencing factors analysis and prediction with machine learning method. Sustainability 2023, 15, 11414. [Google Scholar] [CrossRef]
- Hermaputi, R.L.; Hua, C. Decoding Jakarta Women’s Non-Working Travel-Mode Choice: Insights from Interpretable Machine-Learning Models. Sustainability 2024, 16, 8454. [Google Scholar] [CrossRef]
- Esmaili, A.; Aghabayk, K.; Shiwakoti, N. Latent class cluster analysis and mixed logit model to investigate pedestrian crash injury severity. Sustainability 2022, 15, 185. [Google Scholar] [CrossRef]
- Czine, P.; Balogh, P.; Blága, Z.; Szabó, Z.; Szekeres, R.; Hess, S.; Juhász, B. Is It Sufficient to Select the Optimal Class Number Based Only on Information Criteria in Fixed- and Random-Parameter Latent Class Discrete Choice Modeling Approaches? Econometrics 2024, 12, 22. [Google Scholar] [CrossRef]
- Mannering, F.L.; Bhat, C.R. Analytic methods in accident research: Methodological frontier and future directions. Anal. Methods Accid. Res. 2014, 1, 1–22. [Google Scholar] [CrossRef]
- Depaire, B.; Wets, G.; Vanhoof, K. Traffic accident segmentation by means of latent class clustering. Accid. Anal. Prev. 2008, 40, 1257–1266. [Google Scholar] [CrossRef]
- Lanza, S.T.; Rhoades, B.L. Latent class analysis: An alternative perspective on subgroup analysis in prevention and treatment. Prev. Sci. 2013, 14, 157–168. [Google Scholar] [CrossRef]
- Tein, J.-Y.; Coxe, S.; Cham, H. Statistical power to detect the correct number of classes in latent profile analysis. Struct. Equ. Model. 2013, 20, 640–657. [Google Scholar] [CrossRef]
- McFadden, D. Conditional Logit Analysis of Qualitative Choice Behavior. 1972. Available online: https://eml.berkeley.edu/reprints/mcfadden/zarembka.pdf (accessed on 7 June 2025).
Disclaimer/Publisher’s Note: The statements, opinions and data contained in all publications are solely those of the individual author(s) and contributor(s) and not of MDPI and/or the editor(s). MDPI and/or the editor(s) disclaim responsibility for any injury to people or property resulting from any ideas, methods, instructions or products referred to in the content. |
© 2025 by the authors. Licensee MDPI, Basel, Switzerland. This article is an open access article distributed under the terms and conditions of the Creative Commons Attribution (CC BY) license (https://creativecommons.org/licenses/by/4.0/).