Article

Evaluative Potential for Reclaimed Mine Soils Under Four Revegetation Types Using Integrated Soil Quality Index and PLS-SEM

1
College of Environment and Ecology, Taiyuan University of Technology, Jinzhong 030600, China
2
Shanxi Fenxi Mining (Group) Co., Ltd., Jiexiu 032000, China
3
Shanxi Coshare Innovation Institute of Energy and Environment, Taiyuan 030032, China
*
Author to whom correspondence should be addressed.
Sustainability 2025, 17(13), 6130; https://doi.org/10.3390/su17136130
Submission received: 18 April 2025 / Revised: 24 June 2025 / Accepted: 25 June 2025 / Published: 4 July 2025

Abstract

Anthropogenic revegetation allows effective and timely soil development in mine restoration areas. The evaluation of soil quality is one of the most important criteria for measuring reclamation effectiveness, providing scientific reference for the subsequent management of ecological restoration projects. The aim of this research was to further investigate the influence of revegetation on mine-reclaimed soils in a semi-arid region. Thus, a coal-gangue dump within the afforestation chronosequence of 1 and 19 years in Shanxi Province, China, was selected as the study area. We assessed the physicochemical properties and nutrient stock of topsoils under four revegetation species, i.e., Pinus tabuliformis (PT), Medicago sativa (MS), Styphnolobium japonicum (SJ), and Robinia pseudoacaciaIdaho’ (RP). A two-way ANOVA revealed that reclamation age significantly affected SOC, TN, EC, moisture, and BD (p < 0.05), while the interaction effects of revegetation type and age were also significant for TN and moisture. In addition, SOC and TN stocks at 0–30 cm topsoil at the RP site performed the best among 19-year reclaimed sites, with an accumulation of 62.09 t ha−1 and 4.23 t ha−1, respectively. After one year of restoration, the MS site showed the highest level of SOC and TN accumulation, which increased by 186.8% and 88.5%, respectively, compared to bare soil in the 0–30 cm interval, but exhibited declining stocks during the 19-year restoration, possibly due to species invasion and water stress. In addition, an integrated soil quality index (ISQI) and the partial least squares structural equation model (PLS-SEM) were used to estimate comprehensive soil quality along with the interrelationship among influencing factors. The reclaimed sites with an ISQI value > 0 were 19-RP (3.906) and 19-SJ (0.165). In conclusion, the restoration effect of the PR site after 19 years of remediation was the most pronounced, with soil quality approaching that of the undisturbed site, especially in terms of soil carbon and nitrogen accumulation. These findings clearly revealed the soil dynamics after afforestation, further providing a scientific basis for choosing mining reclamation species in the semi-arid regions.

1. Introduction

Mining has historically been a cornerstone of economic development in China. However, the long-term extraction of mineral resources consequently poses significant challenges to regional ecological equilibrium and environmental sustainability. For instance, mining activities can extensively remove the topsoil layer and result in the massive accumulation of solid waste, causing land over-occupation and soil impoverishment, which in turn hampers plant growth [1,2]. Based upon the sustainable development concept, ecological restoration is recognized as the most cost-effective method and is widely used in newly established mine systems, contributing to soil stabilization and nutrient amelioration through the succession and self-recovery capacities of ecological communities [3,4,5]. In over 30 years of coalmine reclamation practices in China, a comprehensive system consisting of five phases (i.e., geomorphic reshaping, soil reconstruction, hydrological stability, vegetation restoration, and landscape rebuilding) has been well established and authenticated [6]. Particularly for such a demanding area with harsh soil conditions, the maturation of reconstructed soil tends to be protracted, taking several centuries if merely adopting natural recovery [7]. With the objective of reinstating topography and land productivity rapidly, the process of soil reconstruction requires the perspectives of biology, chemistry and ecology to implement artificial remediation and governance engineering [8]. Due to being highly modified during the technological reclamation processes, such as soil stripping, excavation, transportation, and land leveling, newly built soil experiences structural disturbance and carbon pool loss, which is generally characterized by low fertility and high bulk density [9]. Simultaneously, such soil types can also be categorized as “Technosol”, i.e., anthropogenic soil composed of mine spoil materials [10]. Soil quality refers to the capacity of soil to function within natural or managed ecosystems to sustain plant and animal productivity, maintain environmental quality, and promote biological health [11]. In such contexts, evaluating soil quality is essential for understanding the ecological performance of reconstructed Technosol and guiding vegetation recovery strategies.
Among various restoration projects in coalmines, the coal-gangue dump is a typical area requiring geomorphic reshaping and soil reestablishment. Shanxi, as a pivotal region for coal production in China, holds rich and varied coal resources. With the growth of coal minging, the discharge of coal gangue is increasing in recent years [12]. According to the statistics, it is estimated that there were 1477 coal-gangue dumps and 2.7 billion tons of gangue stacked by 2015 in Shanxi [13]. In the process of promoting the ecological restoration project of territorial space, the choice of suitable species and patterns are particularly imperative, affecting the overall stability of the reconstructed mine ecosystem [14]. For instance, in places with mine metal-contaminated soils, the implementation of metal-tolerant plant species contributes to the removal of toxic metals from Technosol through phytostabilization and phytoextraction [15]. In term of the soil organic carbon (SOC) indicator, Yuan et al. [16] reported that arbor forests displayed greater carbon pools than cropland in reclaimed mine soils along a long chronosequence. The finding of Misebo et al. [17] demonstrated that the use of grass and legumes better facilitates the early accumulation of SOC compared with afforestation. In addition, mixed-species forests tend to be more productive than monocultures through complementarity interactions and evolve into more ecologically stable plant communities over time, as stated by David et al. [18]. Likewise, the potential of long-term fallow lands to reverse degradation was reflected in SOC levels comparable to virgin soils, as investigated by Lisetskii et al. in the Chernozem zone of the East European Plain [19]. Thus, understanding the effects of different vegetation types on soil properties can be conducive to artificial management aimed at achieving the expected ecological environment.
Likewise, the assessment of soil quality is important for decision-making management and land sustainable development in mining areas [20]. Many previous studies have reported the impact of restoration activities on Technosol and have proposed different methods for soil quality assessment, such as multiple-variable indicator kriging [21], the visual soil assessment (VSA) combined with the soil physicochemical properties method [22], the technique for order preference by similarity to ideal solution (TOPSIS) [23], and the soil quality index (SQI) model [24]. Similarly, the study by Sneha et al. [25] reported an integrated mine soil quality index to evaluate the success of mine reclamation, with emphasis on the evolution analysis of soil quality along chronosequence and the correlation between the soil condition and the vegetation characteristics. On this basis, we employed an integrated soil quality index (ISQI) in accordance with the characteristics of the mine restoration area. Moreover, factor analysis approaches from other fields, such as the structural equation model (SEM) and the partial least squares structural equation model (PLS-SEM), were used to further discuss the interrelationship among multiple influencing elements. In contrast to the conventional SEM method, PLS-SEM, which was first conceptualized by the Swedish statistician Herman Wold in the 1970s, is an iterative estimation method involving principal component analysis, canonical correlation analysis, and multiple regression techniques [26]. It has been validated for its applicability and accuracy in theoretical frameworks [27] and can handle complex causal relationships effectively, being more suitable for small samples and non-normal data [28]. Many researchers have utilized this model to test and build more comprehensive frameworks within the studied variables, thereby substantiating the robustness of their findings [29,30,31].
The recovery of ecologically fragile mine areas for a satisfactory ecosystem is a systematic and long-term process [32]. It is necessary to monitor the soil quality dynamically in order to explore the remediation effects under varying revegetation on poor Technosol. Consequently, this research is based on the hypothesis that the recovery of soil physicochemical properties in a degraded coal-gangue dump relies on types and growth of revegetation species, the nature of the substrate, and reclamation age. Through the space-for-time substitution approach, along with the integrated soil quality index, this study analyzed the plant characteristic and soil attributes within a mine restoration area, under two reclamation durations (1 year and 19 years), aiming to (1) investigate the impacts of different revegetation species on soil physicochemical properties along chronosequence; (2) estimate soil organic carbon (SOC) and total nitrogen (TN) stocks in mine spoils with varying revegetation cover; (3) quantify the level of soil recovery in reclaimed sites based on ISQI, while exploring the correlation between soil and revegetation features using PLS-SEM. The findings provide scientific insights into the choice of reclamation species and the management of ecological restoration practices for coalmines in semi-arid regions.

2. Materials and Methods
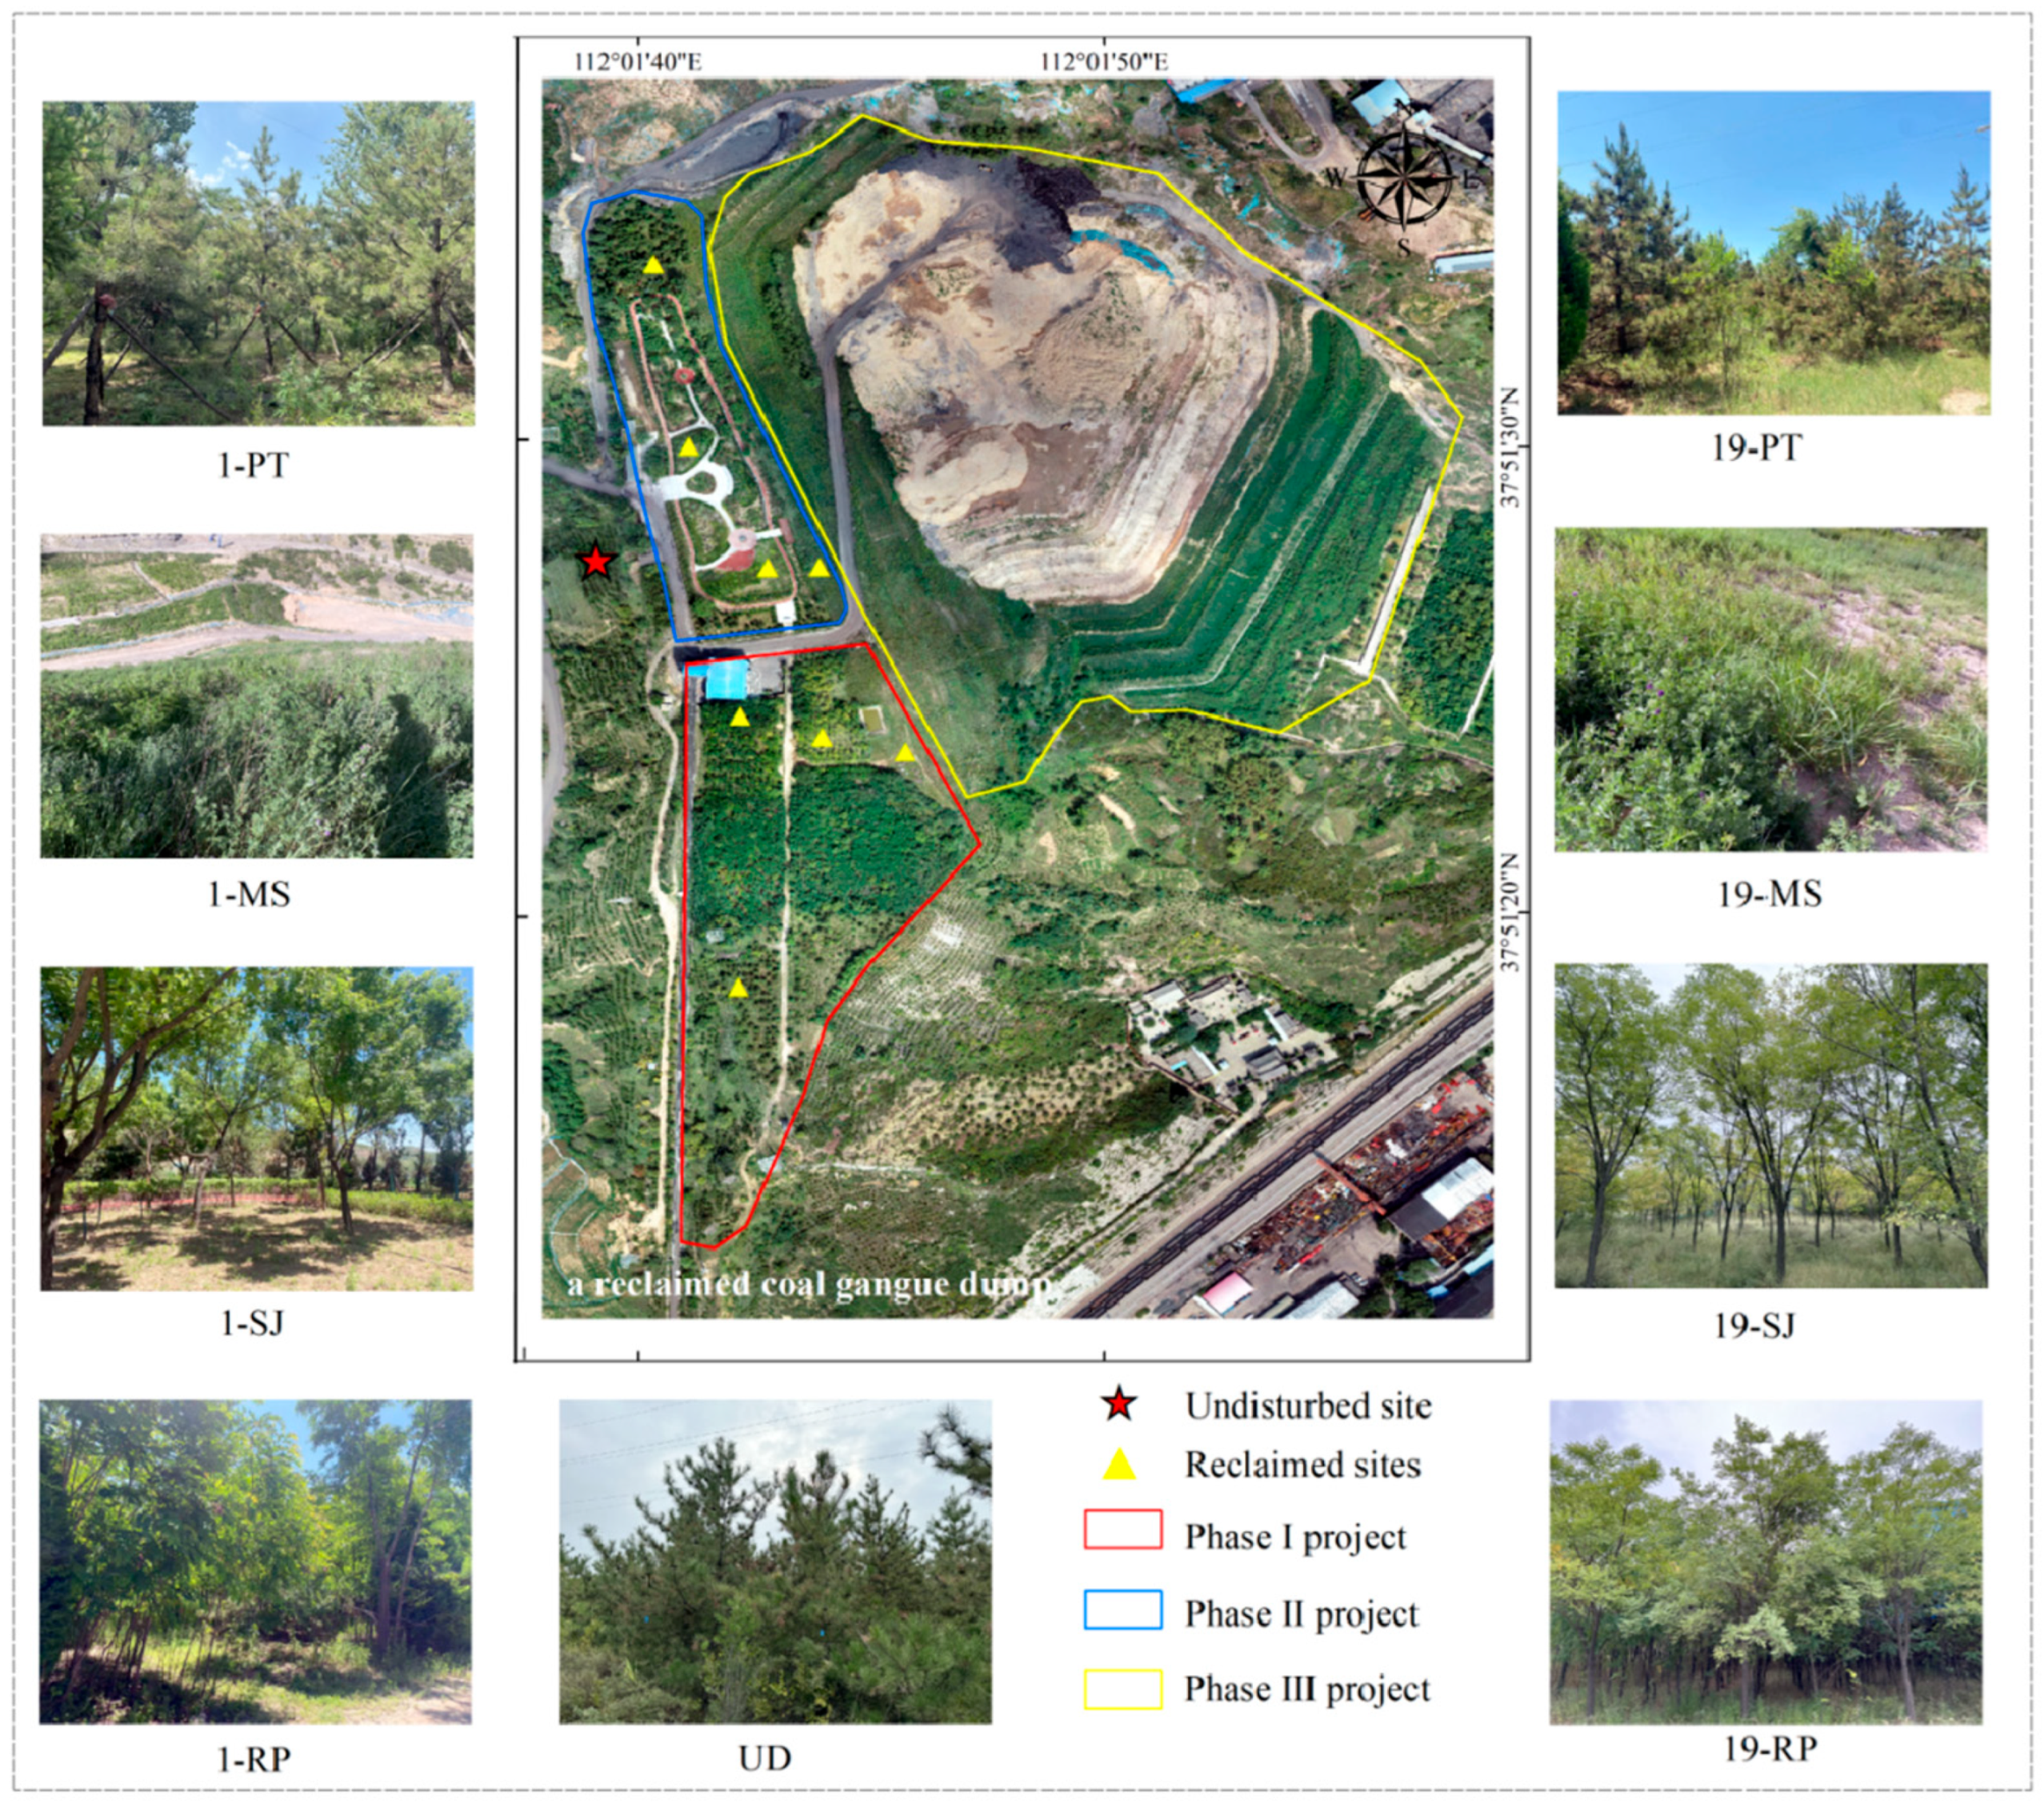
2.1. Study Area

The study area is part of the Malan coalmine (111°58′07″–112°07′30″ E and 37°45′00″–37°55′00″ N), located in the southwest of Gujiao City, Shanxi Province, China. This region is characterized by a typical temperate semi-arid climate with an average annual temperature of 9.4 °C. The annual average precipitation is 426.1 mm, of which 72% occurs from July to September, while the average annual evaporation amounts to 1480.9 mm. The mine, which extends for about 104 km2, started full operations in 1999, with a production capacity of 4 million tons coal per year. Driving gangue is the main type of solid waste generated from underground at this site, and it is transported to the designated destination for dumping. Specifically, the coal gangue is transported to the loading warehouse through a closed belt corridor of the auxiliary shaft and then transferred by truck to the waste discharge platform, where it is stacked layer by layer from bottom to top.
The specific study site selected for this research is an afforested gangue dump with an altitude of 1180–1215 m, situated at nearly 1.0 km northeast from the industrial site of the mining area. This dump covers an area around 19.45 ha, with a total stacking capacity of approximately 1.986 million cubic meters of gangue. The soil materials for reconstruction were all excavated from the nearby hills and belong to Quaternary loess. The thickness of backfilled loess was 1.0 m on the platform and 0.5 m on the slope. Moreover, the initially rebuilt soil was characterized by poor structure and low levels of nutrient matter, with a SOC content of 2.47 g kg−1, a TN content of 0.33 g kg−1, a pH of 8.35, an electrical conductivity (EC) of 237.3 µs cm−1, and an average bulk density (BD) of 1.20 g cm−3, used as the control check (CK). The entire gangue-dumped area is divided into three parts (Figure 1). The Phase I project covers an area of 4.85 ha and underwent greening in 2004, mainly with the planting of Styphnolobium japonicum, Pinus tabulaeformis, and Robinia pseudoacaciaIdaho’, with a survival rate of over 80%. Likewise, the Phase II project was completed in May 2022, with an area of 2.7 ha, and it is currently still in the restoration and management period. In addition to the three main tree species mentioned in the Phase I project, other species have also been planted in this area, such as Ginkgo biloba, Juniperus formosana, and Acer truncatum. Moreover, the Phase III project is located in the eastern part of the dump, covering an area of 11.9 ha, and still remains in the state of gangue dumping accompanied by slope treatment.

2.2. Sampling Plots Design and Vegetation Surveys

On the basis of vegetation surveys in reclaimed mine sites with 1- and 19-year reclamation ages (namely RMS1 and RMS19), it was found that the main tree species for revegetation include Robinia pseudoacaciaIdaho’, Pinus tabuliformis, Styphnolobium japonicum, Populus davidiana, and Platycladus orientalis, which are widely used for coalmine reclamation in northern mining areas. Among them, the planting proportions of RP, PT, and SJ accounted for more than 50% of the study area. Notably, the tree specifications under the same variety were not significantly different between RMS1 and RMS19, which is because soil ball plants were used for restoration in RMS1. Furthermore, the understory vegetation introduced in RMS1 included a variety of ornamental herbs, such as Syringa oblata, Iris tectorum, Hemerocallis fulvaGolden Doll’, Phedimus aizoon, and Ophiopogon japonicus, while that in RMS19 mainly comprised native herbs such as Artemisia gmelinii, Leymus chinensis, Chenopodium album, and Aster tataricus, reflecting the difference in understory patterns under two reclamation strategies. Based on the phytosociological and geo-botanical surveys of the study area, two experimental groups were selected in RMS1 and RMS19, following a randomized block design, including four distinct types of vegetation (i.e., Pinus tabulaeformis, grassland, Styphnolobium japonicum, and Robinia pseudoacaciaIdaho’). For comparison, an adjacently undisturbed forest dominated by Pinus tabulaeformis, along with some shrubs and small herbs, was selected as the reference group. In addition, the selected sample plots were located at least 10 m away from the block boundary to minimize any edge effects. To sum up, a total of nine sampling sites were laid down randomly, with 10 m × 10 m plots for arbors and 2 m × 2 m plots for herbs (Figure 1). The vegetation survey and soil sampling were performed from July to August 2023 (Table 1).

2.3. Soil Sampling and Analysis

The 0–30 cm topsoil layer, as the area with dense vegetation roots, is where soil changes occur first and are most active [33]. In this work, soil samples were therefore collected at topsoil depths of 0–10 cm, 10–20 cm, and 20–30 cm. Subsamples were collected at three sampling points within each site using a soil auger (4.2 cm diameter), following the diagonal method. After thoroughly mixing the soil layer by layer, composite samples of around 0.5 kg each were obtained by the conning and quartering method. Likewise, the other group of fresh soil samples was collected from soil profiles of the studied sites by using a cutting ring of 100 cm3 and then was transferred into individual aluminum boxes to control soil evaporation. In conclusion, a total number of 54 soil samples were collected and tested, comprising 27 composite samples for soil nutrient measurement and 27 samples for the determination of soil moisture content and bulk density.
For soil chemical analysis, composite samples were air-dried for nearly 5 days at room temperature (25–30 °C), then passed through a 2 mm sieve to separate impurities such as gravel, plant debris, and gangue fragments. After grinding and sifting through a 0.25 mm sieve, the prepared samples were separately stored into brown glass bottles for the following experiment. Soil pH and electric conductivity were measured by a pH meter (METTLER TOLEDO FE 28, Mettler-Toledo, Zurich, Switzerland) and a conductivity meter (METTLER TOLEDO FE 38, Mettler-Toledo, Zurich, Switzerland), respectively, with a water–soil ratio of 2.5:1 in the water suspension. SOC was determined by the K2Cr2O7 oxidation-outer heating method, while TN was measured by a semi-automatic azotometer (KDN-08A, Shanghai Hongji Instrument Co., Ltd., Shanghai, China). For soil physical analysis, the soil moisture content was determined gravimetrically. The samples for soil moisture were oven-dried at 105 °C to a constant weight. The weight difference between the saturated and dry soil was considered as water holding capacity, and soil bulk density was calculated by measuring the dry mass of soil in the aluminum box of standard volume [34]. Furthermore, soil porosity was calculated from bulk density measurements with an assumed particle density of 2.65 Mg/m [25]. The formula is as follows:
Soil porosity = ( 1 BD / 2.65 ) × 100 %
where BD is the soil bulk density (g cm−3).

2.4. Calculations of SOC and TN Stocks

To assess the availability of nutrient accumulation in the reclaimed sites, SOC and TN stocks were calculated on the basis of the SOC and TN concentrations, bulk density, and soil profile thickness. The indicator mentioned above was determined as follows [33]:
SOCS = SOC × BD × H / 10
where SOCS is the soil organic carbon stock (t ha−1), SOC is the soil organic carbon concentration (g kg−1), and H is the soil profile thickness (cm). The calculation method for TN stock is the same as that for SOCS.

2.5. Calculation of Integrated Soil Quality Index

To better evaluate soil quality and identify the most suitable plant species for reclamation of gangue-dumped degraded land, the integrated soil quality index based on principle component analysis (PCA) was conducted following three major steps. Firstly, a few principal components (PCs) explaining a minimum of 5% variance in the dataset and having large eigenvalues (≥1) were extracted. Secondly, the raw data was normalized to eliminate the influence of dimension, improving data comparability and availability. Then, the expressions comprising the loading factors of each indicator in the component matrix and their corresponding variable values were utilized to determine the scores of all sites under respective PCs. Lastly, the percentage explained by each PC was divided by the variance percentage explained by all selected PCs to calculate the weighting factors. ISQI was further computed based on the weighting factor and the scoring values of each PC, as shown in the equation below [34]:
ISQI = λ 1 λ 1 + λ 2 F 1 + λ 2 λ 1 + λ 2 F 2
where F1 and F2 are the scores of principal component 1 (PC1) and principal component 2 (PC2), respectively. λ1 and λ2 are the corresponding variance explained by these principal components.

2.6. Statistical Analysis

The Shapiro–Wilk test was employed to test the normal distribution of the dataset. For each soil physicochemical parameter, a two-way analysis of variance (ANOVA) was performed to assess the main effects of the reclamation period and revegetation type, as well as their interaction effects. The stratified soil data (0–10, 10–20, 20–30 cm) were treated as replicates. Post hoc comparisons among group means were conducted using Duncan’s multiple range test at a significance level of p < 0.05. SmartPLS 4 software (version 4.1.0.9) was used to build the partial least squares structural equation model, encompassing both measurement and structural analysis [35]. PCA was used to exhibit the relationships between variables and to check for redundancy of parameters. All the statistical analyses were performed by SPSS 26.0 package (SPSS, Chicago, IL, USA), and the figures were drawn using Origin 2024.

3. Results

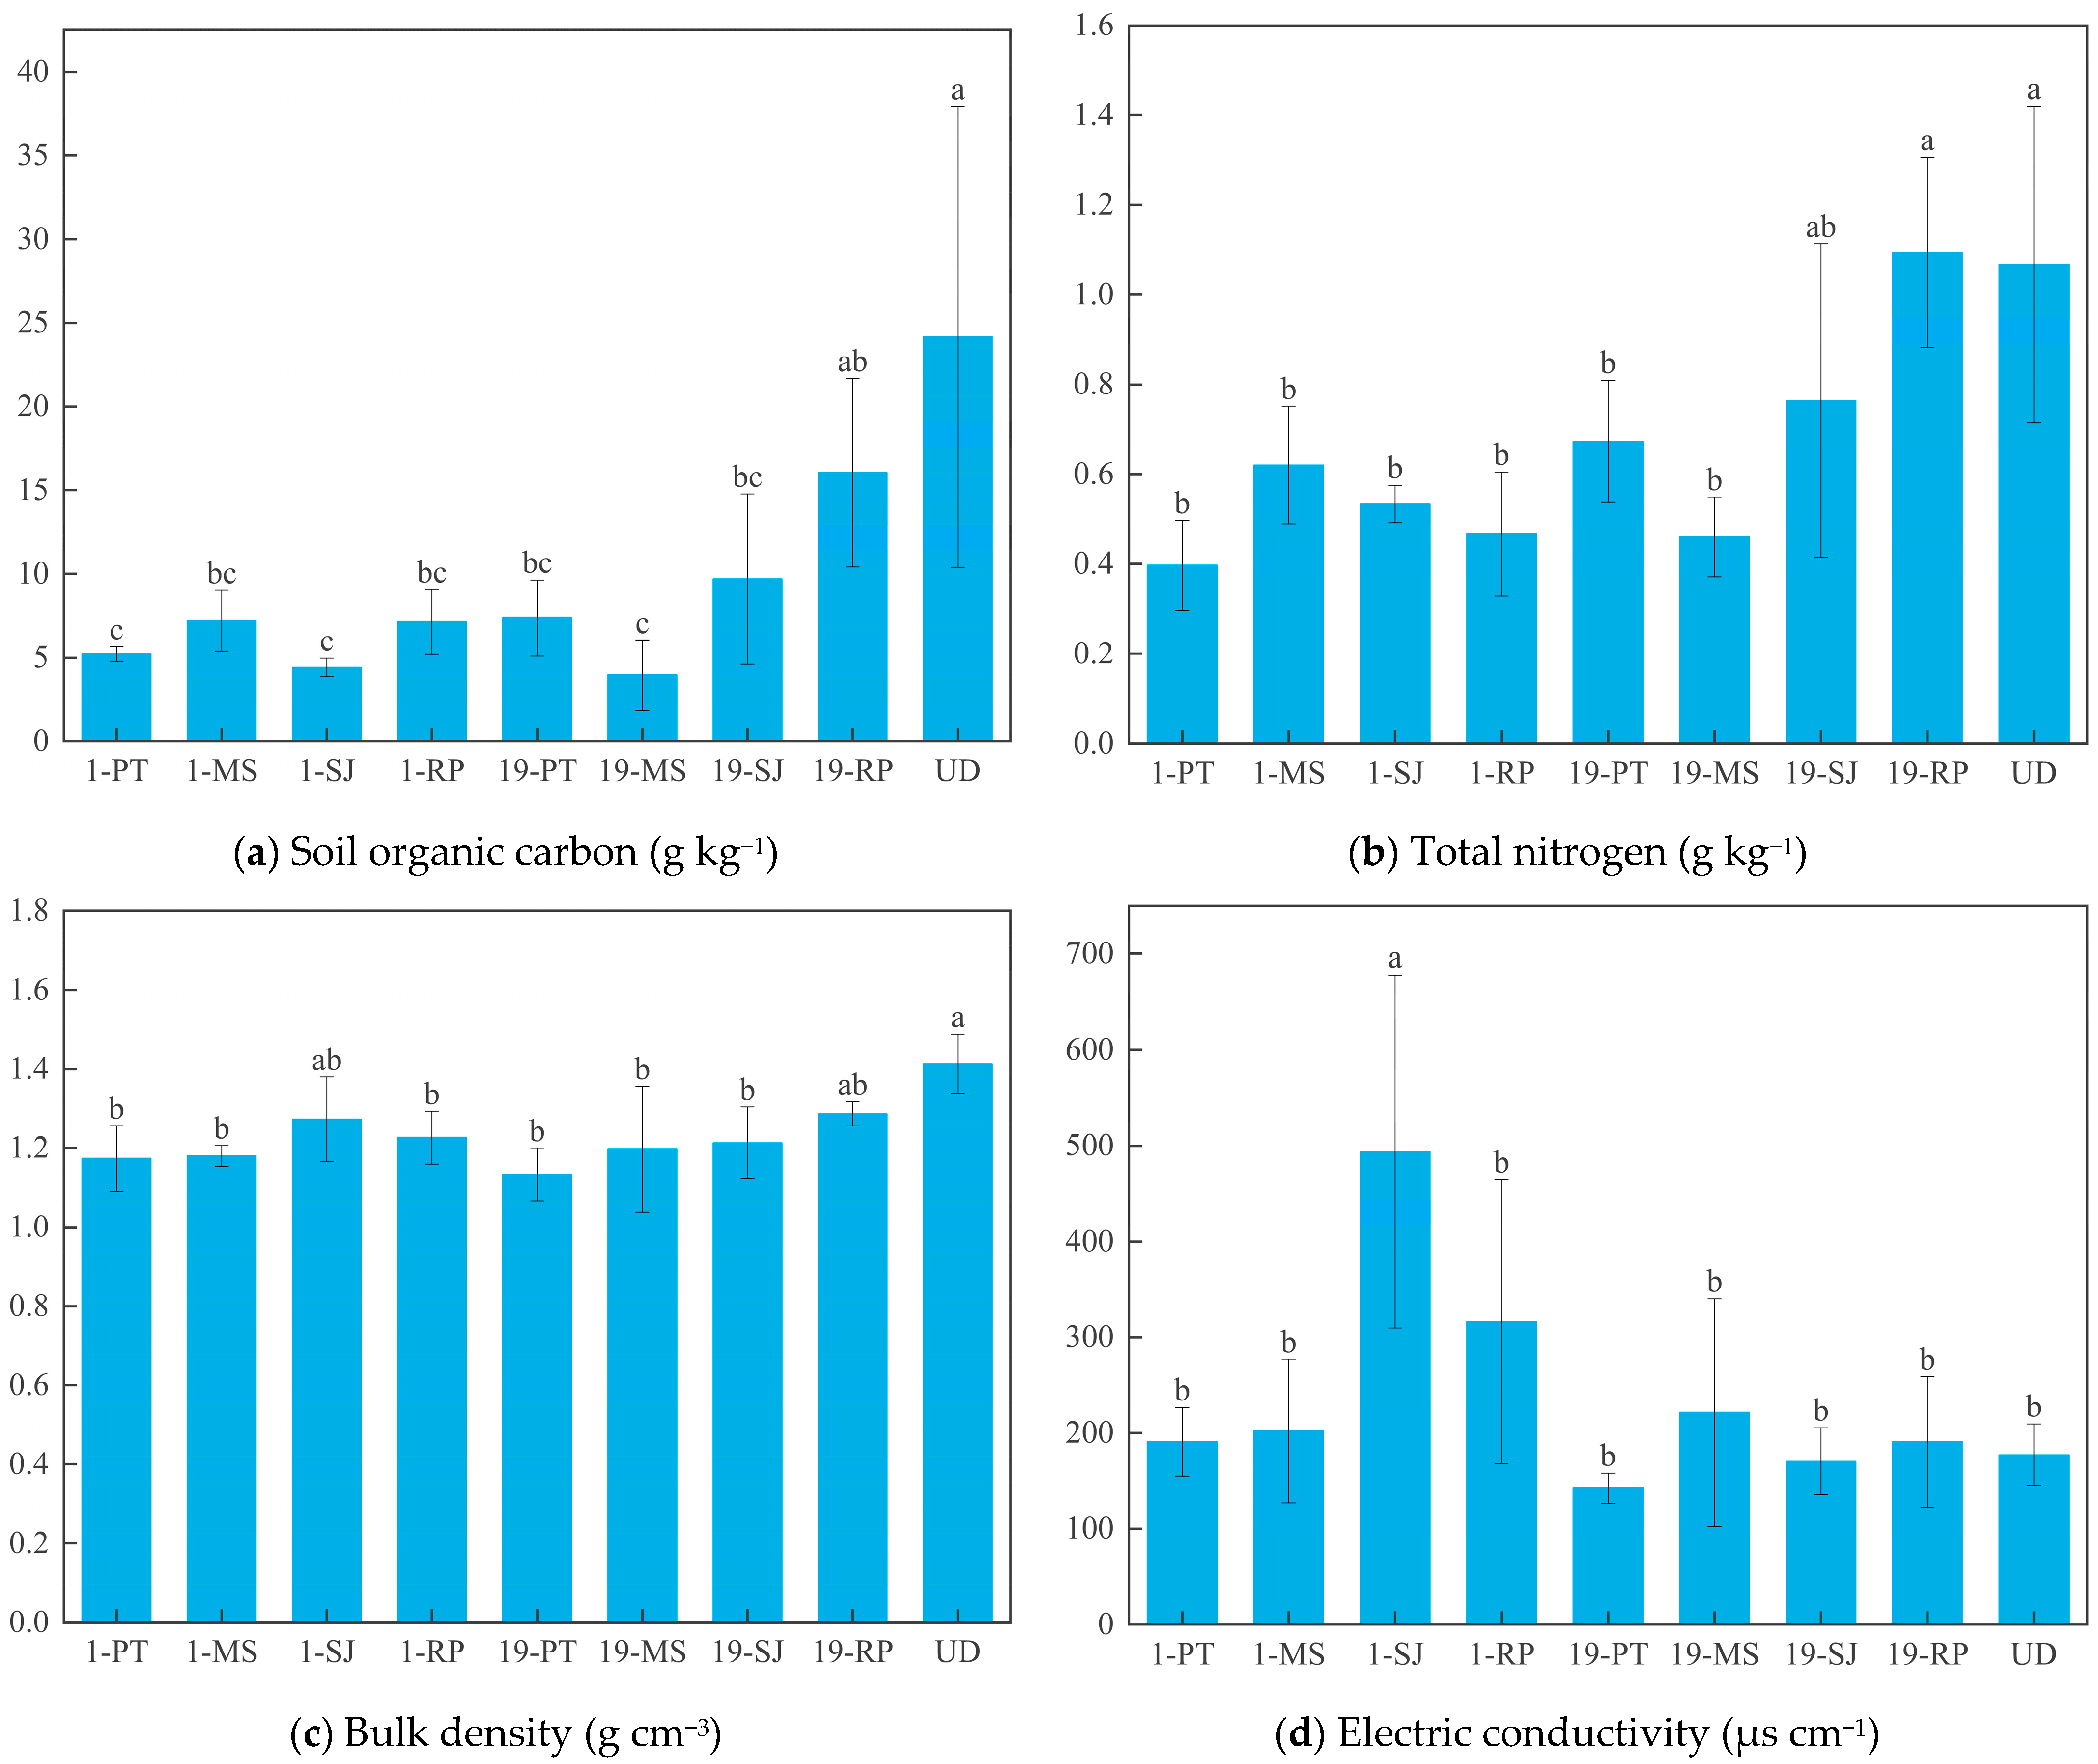
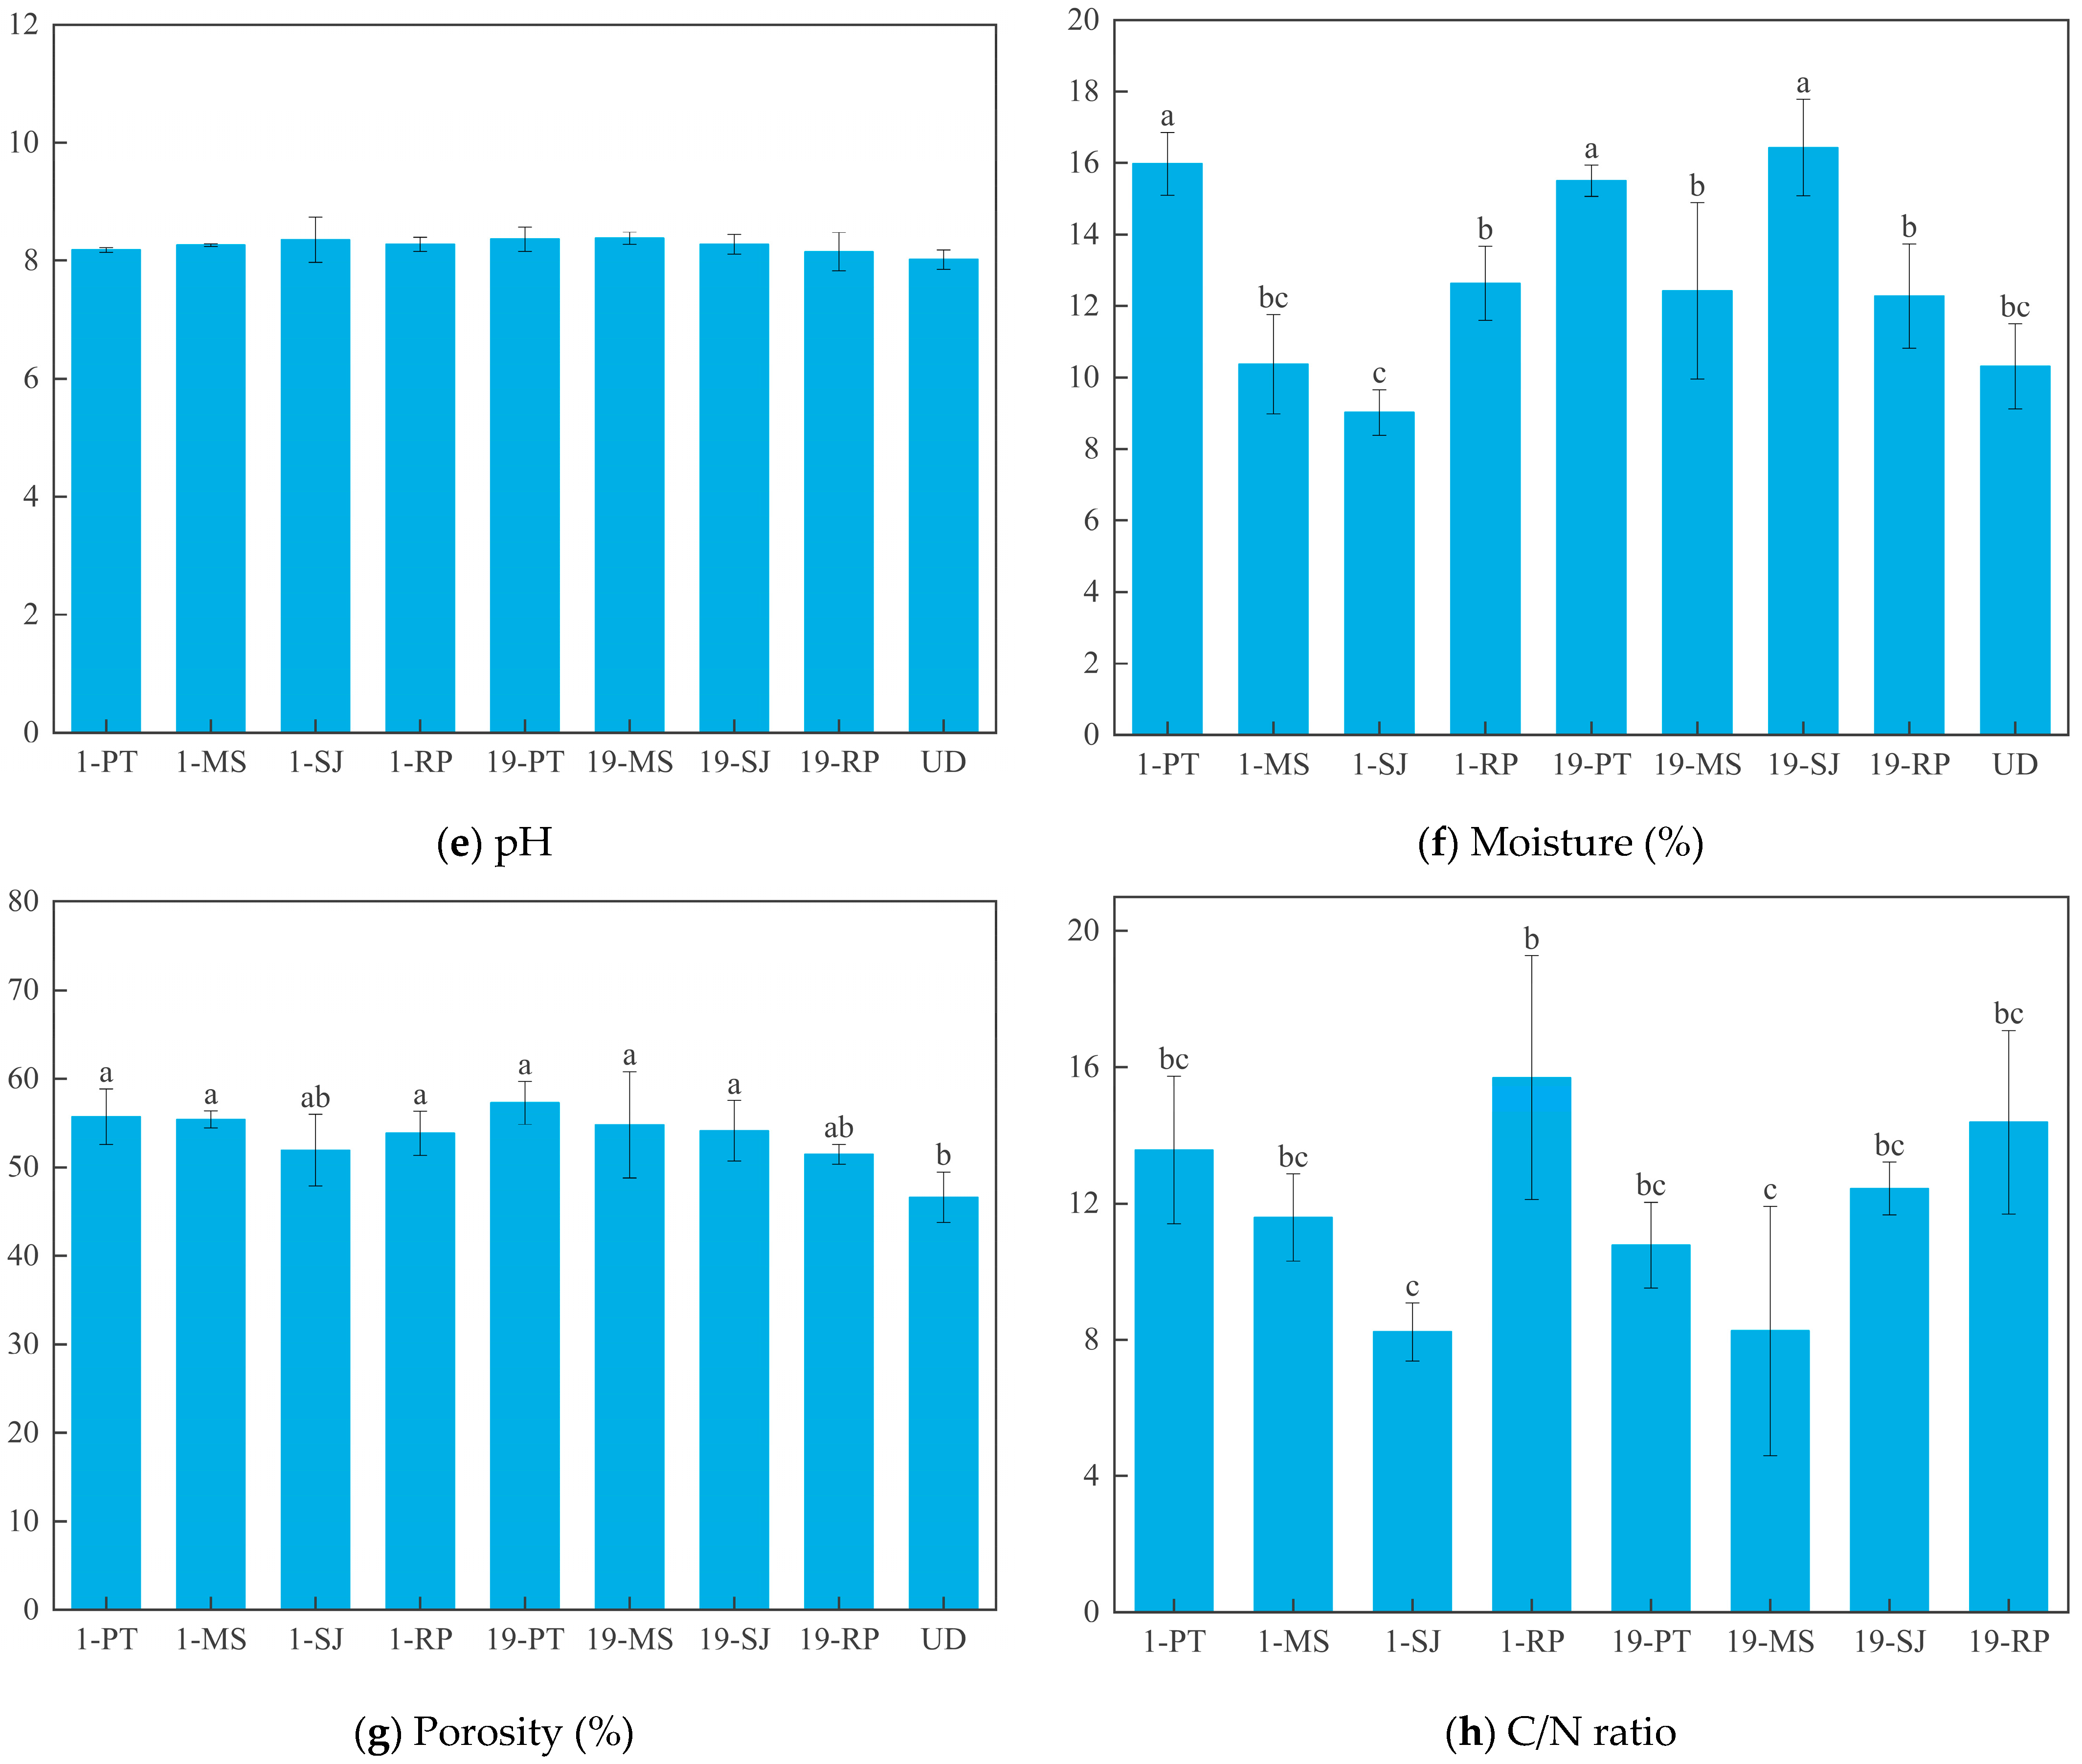
3.1. Soil Physicochemical Properties in Reclaimed Sites

By analyzing the overall data using a two-way ANOVA method (Figure 2), it was found that the selected soil variables were significantly different (p < 0.05) in terms of SOC, TN, C/N ratio, EC, soil moisture content, and BD among the studied sites. The average concentrations of SOC (2.47 g kg−1) and TN (0.33 g kg−1) in exposed Technosol were less than 89.8% and 69.2% of the values in the undisturbed site. Varied enhancements were observed in the average SOC and TN content in restored sites compared with that of original Technosol. Apart from MS plots, the older revegetation sites (RMS19) showed significantly higher SOC and TN concentration compared to the younger site (RMS1). In addition, the C/N ratio in UD was the highest (21.79), while those in 1-SJ (8.23) and 19-MS (8.26) were significantly lower compared to the other sites. Studies have shown that the C/N ratio is generally related to the degree of soil organic matter decomposition, and a higher C/N ratio contributes to maintaining soil nutrients [36,37]. The reconstructed topsoil within this area is alkaline, with soil pH values ranging from 8.02 to 8.38. Although there was no significant difference in pH among all studied sites, the pH level in UD (8.02) and 19-RP (8.15) exhibited a slight decrease in comparison to the initial alkaline soil condition (8.35). In addition, the value of EC (µs cm−1) varied from 142.5 to 493.9 and exhibited a varied decrease with age in the reclaimed chronosequence sites under the same revegetation types (except MS).
The observed trends are further detailed in Table 2, which reveals that both revegetation type and reclamation age had significant effects on most soil physicochemical properties, while a few indices exhibited notable interaction effects. Specifically, reclamation age significantly influenced SOC, TN, EC, moisture content, and BD (p < 0.01), highlighting the strong temporal dynamics in soil development following reclamation. Significant interaction effects between vegetation and age were observed for TN and EC, suggesting that the combined influence of species selection and reclamation time is critical in shaping these parameters.
To provide a more comprehensive understanding of the correlation among eight selected soil indicators, a Pearson correlation analysis was conducted. This preliminary statistical approach helped identify the strength and direction of the linear associations between soil variables, which is essential for diagnosing soil development processes and informing subsequent multivariate modeling. As the data depicted in Table 3 show, the correlation coefficient of 0.864 suggests a strong positive relationship between SOC and TN. Both nutrients are pivotal for plant growth, and their availability might be affected by other soil factors and vice versa. For instance, the positive correlation between BD and SOC (0.594) underscores that a higher SOC level corresponds to elevated soil bulk density. Similarly, the correlation coefficient between pH and SOC was −0.593, while that between pH and TN was −0.559. This indicated that the enhancement of C and N in Technosol is closely associated with decreased pH. Another study showed that due to the varied adaptability of plant species to soil pH and the sensitivity of soil organisms to pH changes, strong alkalinity or acidity can have an apparent inhibitory effect on normal growth for a vast majority of plants [38]. In addition, the result showcases a moderate negative correlation of −0.504 between soil moisture and bulk density. This linkage could be explained by the fact that soil water takes up more space as soil moisture increases, leading to the enlargement of pore spaces between soil particles, thereby reducing soil density per unit [39].

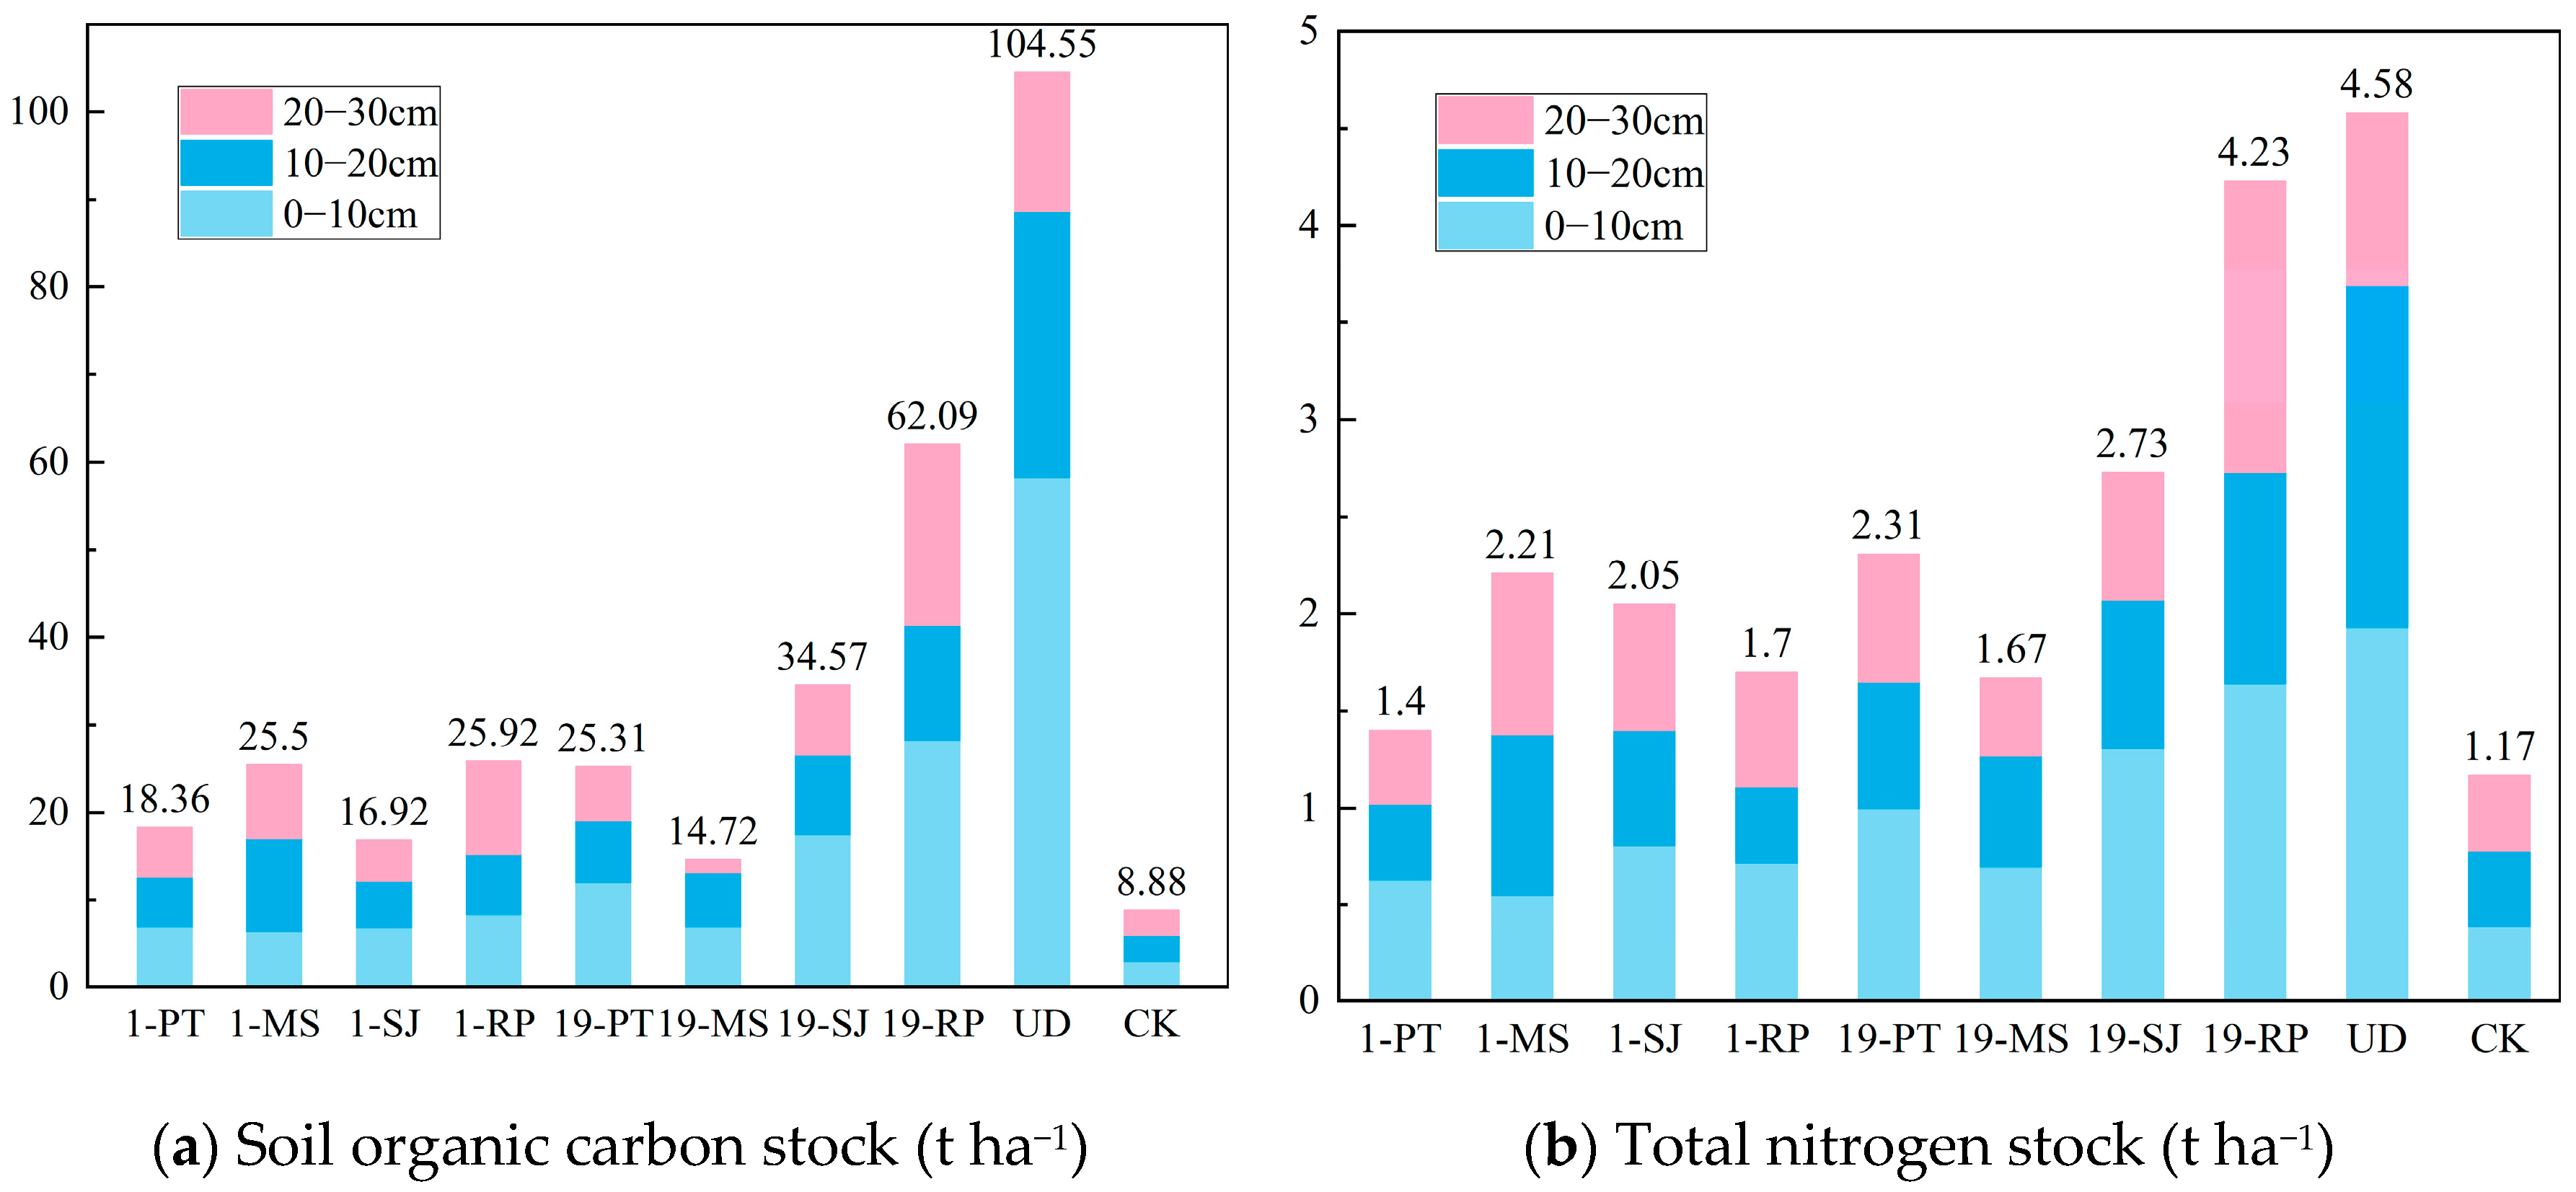
3.2. SOC and TN Stocks in Reclaimed Sites

SOC and TN are crucial indicators of soil fertility that are highly associated with soil structure and revegetation patterns. An estimation of SOC and TN stocks per unit area in the studied sites was carried out (Figure 3). Owing to the mixture of excavated soil, the SOC and TN stocks of original Technosol at 0–30 cm depth were approximately calculated based on SOC and TN concentration and bulk density of the initial soil, yielding low values of 8.88 t ha−1 (SOC) and 1.17 t ha−1 (TN). Overall, no clear pattern was observed in SOC and TN stocks at the newly rehabilitated sites with increasing soil depth, whereas the distribution of C and N was mainly concentrated in the 0–10 cm interval of the revegetated area. In this study, 19-RP showed the greatest capacity for SOC (62.09 t ha−1) and TN (4.23 t ha−1) sequestration, with a 7.0-fold and 3.6-fold increase in the 0–30 cm topsoil compared to CK, respectively. Meanwhile, it reached the closest values to the UD level with the recovery of SOC (59.4%) and TN (92.4%). After one year of revegetation, 1-MS displayed notable prowess in nutrient accumulation, which increased by 186.8% and 88.5% compared to bare Technosol for SOC and TN stocks at 0–30 cm depth, respectively. Apart from grassland sites, the levels of SOC and TN in RMS19 were higher than those in RMS1 under the same vegetation types. Specifically, the SOC stock increased by 37.9%, 104.4%, and 139.6% for the PT, SJ, and RP sites, respectively, while the TN stock increased by 65.5%, 33.0%, and 147.8% compared to RMS1. With a prolonged reclamation period, fragile coalmine ecosystems tend to progress to a relatively ordered state, creating an environment that is more conducive to promoting ecosystem sustainability [40].

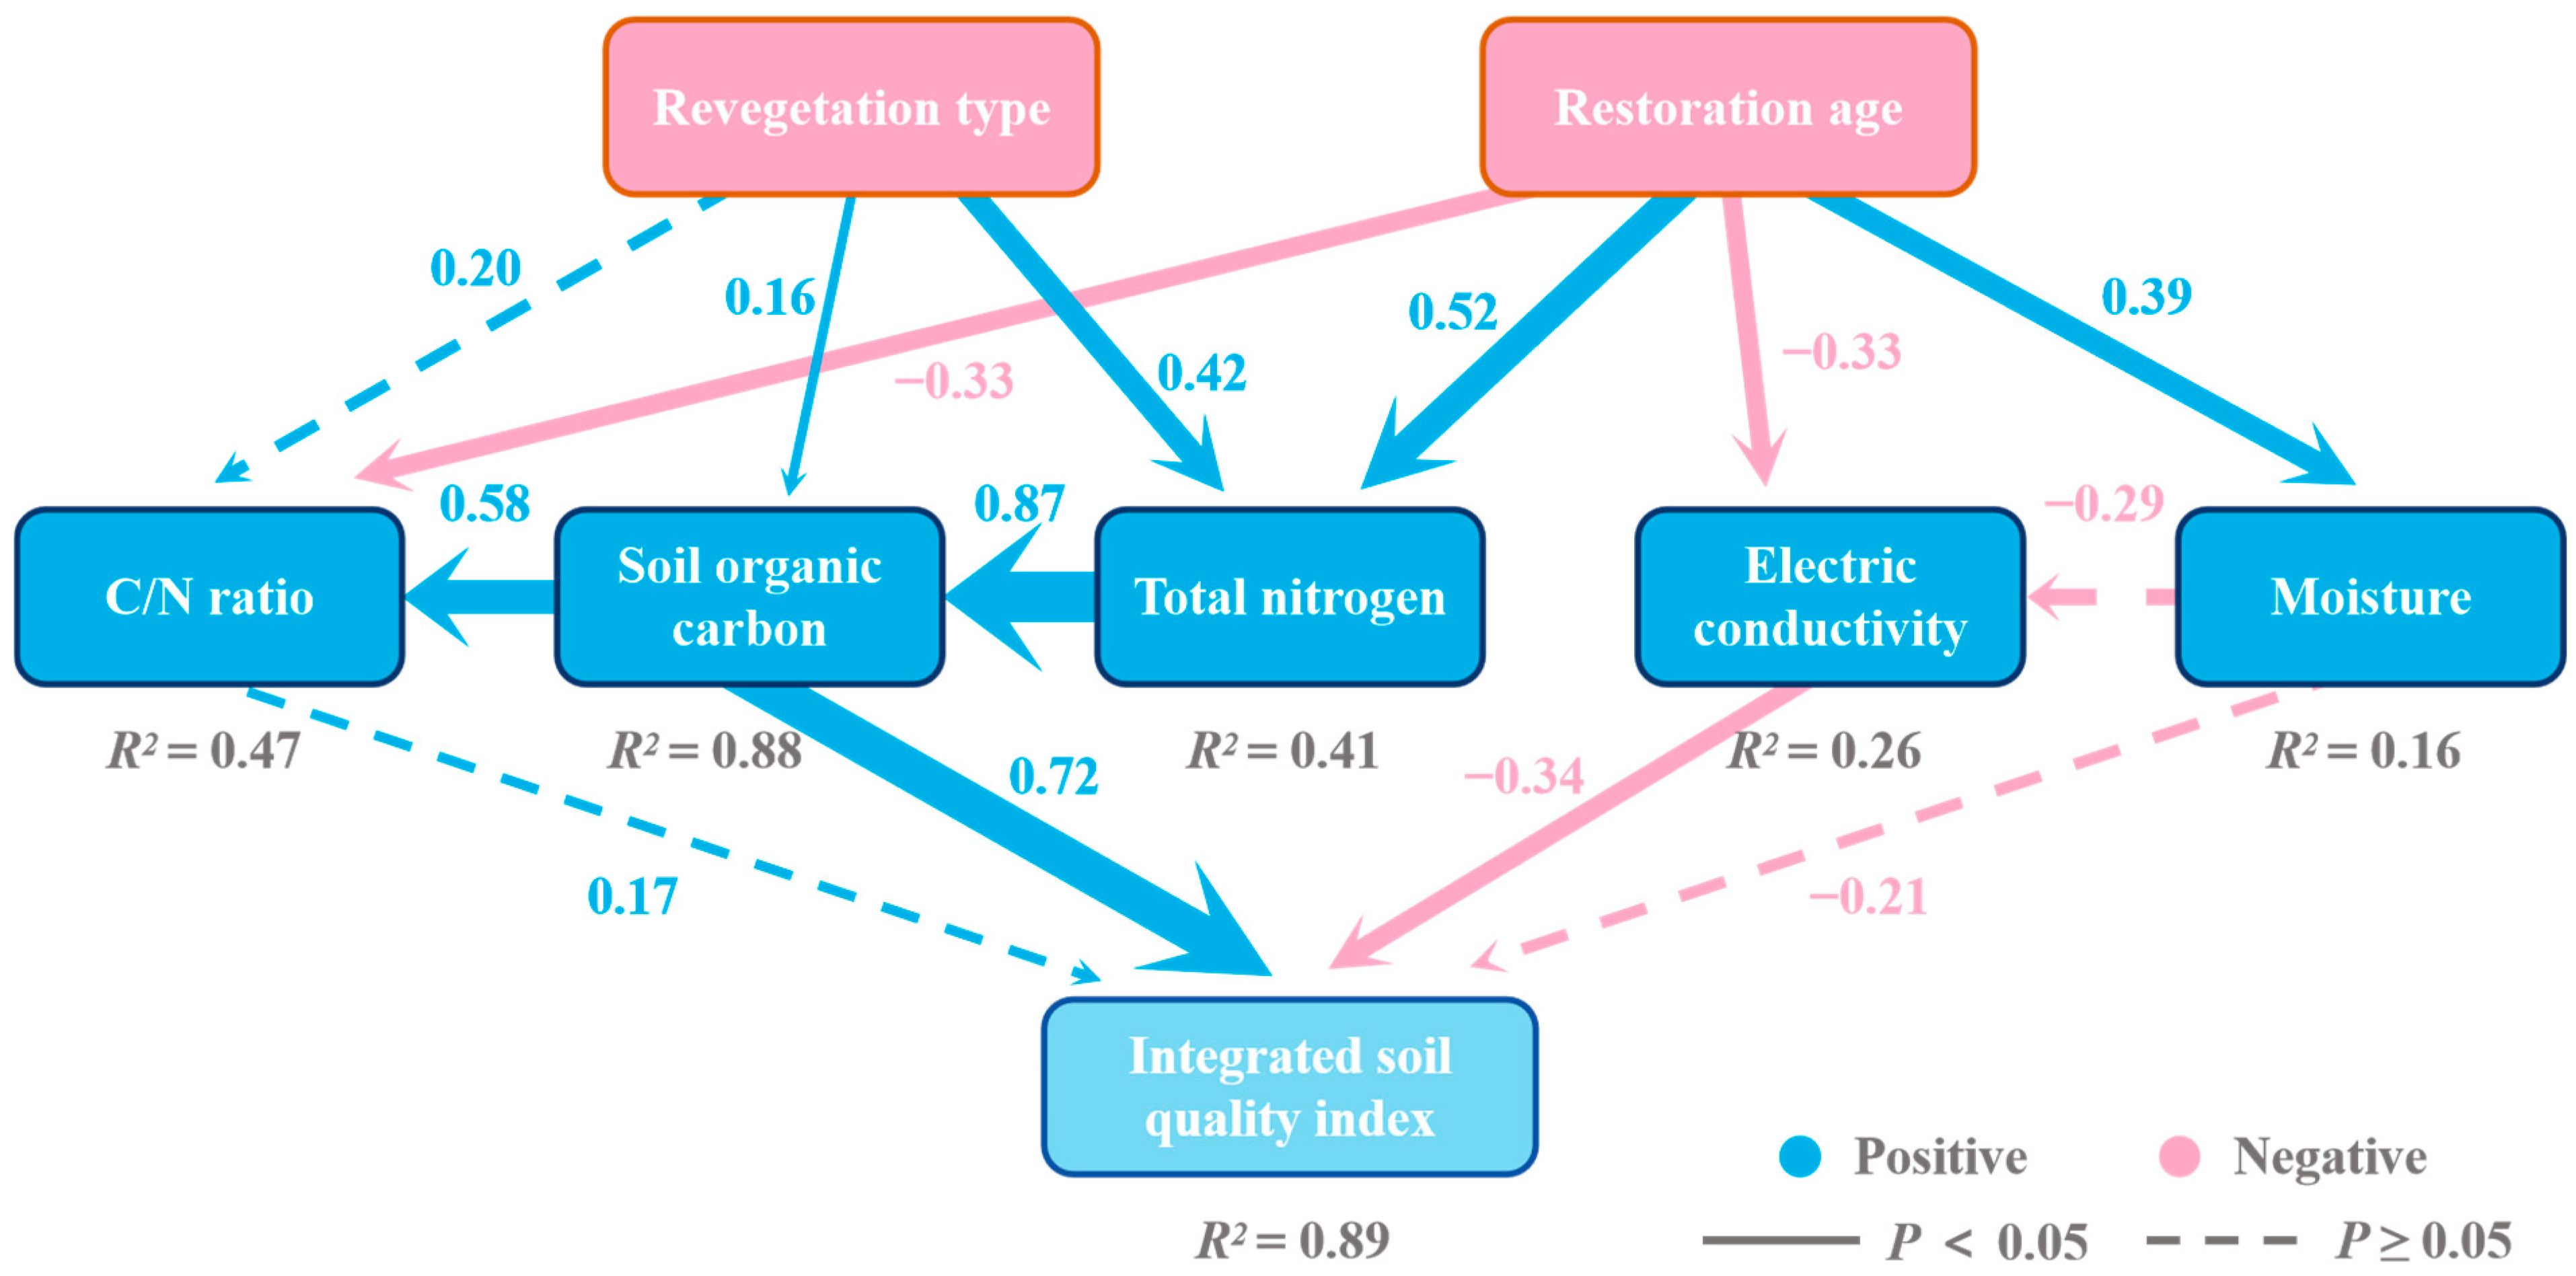
3.3. ISQI and PLS-SEM Analysis

Considering the fact that most of the correlations between the selected soil properties reached significant or highly significant levels, principal component analysis was employed to assess the soil quality of the revegetated chronosequence sites. The result of the PCA can greatly aid in the ranking of different revegetation sites based on an integrated soil quality index, where a higher score corresponds to better soil health. In this paper, two PCs with eigenvalues ≥ 1 (4.068 for PC1, 1.723 for PC2) explained 72.384% of the total variance (Table 4), which could comparatively reflect the full information of soil quality. The explanatory power of PC1 reached 50.845%, suggesting that the high factor loadings for SOC (0.924) and BD (0.824) can impact the results of soil quality evaluation significantly, while soil moisture had the highest loading (0.619) under PC2. The comprehensive ISQI scores of the studied sites were calculated and then ranked in order based on the cumulative scores of 0–30 cm soil layer (Table 5).
Overall, the ISQI scores were in the order of UD (8.579) > 19-RP (3.906) > 19-SJ (0.165) > 1-RP (−1.125) > 1-MS (−1.159) > 1-PT (−1.621) > 19-PT (−1.948) > 19-MS (−3.379) > 1-SJ (−3.419). The results indicated that the site dominated by RP and SJ after 19 years of afforestation showed the greatest improvement in soil quality among the revegetated plots, with both ISQI scores greater than 0. MS exhibited better recovery potential of soil quality compared to PT and SJ in the early stage of restoration. In addition, it can be observed that 19-MS showed poor soil quality, whereas 1-MS performed better. Beyond that, the ISQI observed at the restored sites 1-PT and 19-PT was significantly lower than that of the UD site, which is also dominated by Pinus tabuliformis, corresponding to vegetation characteristics such as tree height, DBH, and crown width (Table 1). The growth of Pinus tabuliformis may be influenced by infertile soil conditions and a thin soil layer in gangue-dumped areas.
To further evaluate the casual relationships among soil influencing factors, a PLS-SEM analysis was performed using the revegetation information and soil variables. Firstly, we analyzed Cronbach’s alpha, the average variance extracted (AVE), and the heterotrait–monotrait ratio (HTMT) to ensure the validity and reliability of the measurement model [41]. Cronbach’s alpha values for all latent variables exceed 0.7, demonstrating good reliability for the measurement model. The AVE values of each testing variable exceeded 0.5, indicating strong convergence of the measurement indicators. Moreover, each HTMT values among the variables fell below 0.85 (Table 6), indicating the strong discriminant validity of this model. Furthermore, the normalized path coefficient is considered as an important parameter to disentangle the direct or indirect effects of selected drivers on soil quality [42]. As shown in Figure 4, TN, which was positively affected by revegetation type (normalized path coefficient, b = 0.42, p < 0.05) and revegetation age (b = 0.52), was also positively and significantly correlated with SOC (b = 0.87). In addition, SOC played the strongest role in shaping integrated soil quality with an influence of 0.72 (p < 0.05), which was consistent with the above-mentioned results of principal component analysis (Table 4). Interestingly, EC was negatively affected by revegetation age (b = −0.33) but also had a negative effect on ISQI (b = −0.34). Overall, these variables can explain 89% of the variations in ISQI (Figure 4), suggesting the reliability of the constructed model with the selected influencing factors. Concurrently, positive effects were mainly observed on soil nutrient indicators under varied revegetation types, while revegetation age contributed positively or negatively to Technosol parameters in terms of C/N ratio, TN, EC, and moisture.

4. Discussion

4.1. Effect of Revegetation in Mine Restoration Areas

Generally, there are two essential components in ecosystems: soil and plants. As a complex whole, the soil system of the reconstruction areas is interrelated with and mutually influenced by multiple factors [6]. Therefore, improved knowledge on the effects of Technosol and revegetation species is needed. Many previous studies have explored the interaction mechanism and the succession patterns between soil and vegetation in forest ecosystem [40,41]. Plants form a whole with the soil through the root network and litter layer. The transformation of substances and root penetration between plant–soil systems affect soil physicochemical and biological indicators [43,44]. Likewise, changes in soil properties through nutrient circulation, in turn, promote or limit the evolution of vegetation communities [45]. For example, Rivas-Pérez et al. [46] pointed out that a bare surface probably leads to a higher stress condition on gangue-dumped areas, aggravating water and soil loss and particle mineralization. In summary, the selection of plant species should be tailored to the adverse conditions of Technosol.
Assessing soil quality serves as a crucial criterion for evaluating the effectiveness of ecological restoration, typically involving three major dimensions: physical, chemical, and biological properties [47]. Due to field conditions and resource limitations, this study focused on eight widely used and ecologically meaningful indicators. For instance, SOC and TN represent the nutrient storage and organic matter dynamics critical for early vegetation establishment, while EC and pH capture the chemical constraints, such as alkalinity and salinization, which are common in post-mining soils [38,48]. BD and moisture describe the physical condition of the soil, affecting water retention and root growth. The C/N ratio serves as an integrated indicator of organic matter quality and potential microbial activity [36]. Such indicators greatly reflect soil fertility, structural integrity, and environmental stress. For example, salinization is a key issue as a controlling factor hindering plant growth and soil development [49]. 1-SJ, characterized by a high pH level (8.35), and EC (493.9 µs cm−1) probably hinder the accretion of aboveground plant biomass, deceasing C input to the soil. The understory with relatively less cover could be one of the reasons, since a bare soil surface is more likely to accelerate soil mineralization and water evaporation [50].
In addition, consistent with previous research [51,52], the results of this research indicated that proper vegetation restoration can effectively improve the soil conditions of coal-gangue hills. For instance, the TN concentration is positively affected by revegetation type and increases along chronosequence, according to the results from PLS-SEM (Figure 4). Notably, RP performed well in the later stage of restoration, with an ISQI value of 3.906, suggesting that such a region could be considered as satisfactorily eco-sustainable in the post-mining stage. From the perspective of plant characteristics, it can be seen that RP is a fast-growing and nitrogen-fixing tree species. It is not only charactered by strong adaptability to harsh surroundings [53], but also has high ornamental value, enhancing the overall aesthetic of the mining area. Therefore, Robinia pseudoacaciaIdaho’ is recommended as a priority species for phytoremediation in arid and semi-arid regions such as Shanxi. Yet, we observed a lack of understory plants in the 19-RP site. This could be due to insufficient light in the forest, caused by high canopy density, which hampers the growth of the herb layer. Considering the strong root-sprout capacity of RP, long-term natural regeneration within the deficiency of timely artificial management (e.g., thinning and pruning), may result in high stand density under single-species dominance. Similarly, related studies have shown that excessive stand density can severely alter the distribution of environmental factors (e.g., light, temperature, and precipitation) and the spatial structure within the forest, which is not conducive to plant growth and indirectly affects soil physicochemical properties [54,55]. In addition, it can be observed that 19-MS exhibited poor soil quality, whereas 1-MS performed better. According to the corresponding engineering documents, the initial species revegetated in 19-MS was Medicago sativa. Over time, the dominance of alfalfa in 19-MS was gradually replaced by certain hardy native species such as Artemisia gmelinii and Leymus chinensis. On the one hand, it is noteworthy that the artificial meadows may deteriorate with the natural colonization of indigenous herbs over a long chronosequence [10]. On the other hand, semi-arid conditions may limit alfalfa’s long-term survival owing to water stress. This finding aligns with studies that demonstrate alfalfa’s sensitivity to drought in arid climates [56]. Consequently, the sustainable management of planted forests is also a meaningful issue for silvan health that ought to be considered.

4.2. Accretion of SOC and TN Stocks

Soil serves as a reservoir of nutrients in terrestrial ecosystems, where SOC is a critical component. As a carbon-intensive industry, mining can be severely detrimental to well-established carbon sinks, i.e., mainly carbon pools of aboveground biomass and soil organic matter [57]. Yet, the fixation of SOC is a long-term and intricate process that depends on many driving factors, such as age, land use type, vegetation pattern, soil microbial activity, and human intervention [58,59]. Beyond those factors, nitrogen availability has been proven to be critical in SOC cycling and sequestration. Effective nitrogen addition to the soil can induce soil carbon deposition, especially from new vegetation-derived carbon [60]. Thus, the accretion of SOC and TN stocks in rearranged soil could act as important indicators of mine ecosystem reestablishment.
On the one hand, owing to the great complexity of soil materials and the fragmentation of the reclaimed habitat, artificial reconstruction soil is generally devoid of soil nutrients, similar to the initial Technosol investigated in this study. It is charactered by a low nutrition level and high salt alkalinity. On the other hand, such a typical artificial ecosystem could be considered as an “empty cup” due to the considerable potential to sequester and store soil nutrients, as stated by Amichev et al. [61]. In this regard, depending on its variability and operability, active human practices can be implemented to augment the carbon sink in such a unique carbon dynamic system. In this research, the undisturbed forest performed greatest in terms of SOC and TN reserves at 0–30 cm topsoil, with values of 104.55 t ha−1 and 4.58 t ha−1, respectively, suggesting that the pre-disturbance ecosystem maintained a stable environment for self-sustainability. In addition, the rich species diversity at the UD site may also be one vital element contributing to the accretion of soil fertility, further resulting in a positive feedback effect on ecosystem development by increasing plant nutrient availability and productivity. This is consistent with the findings of Liu et al. [62], Cai et al. [55], and Kramer et al. [63]. Moreover, as depicted in Figure 3, there is a strong positive relationship between the concentration of SOC and TN, and N-fixers such as Medicago sativa, Styphnolobium japonicum, and Robinia pseudoacaciaIdaho’, utilized for revegetation, exhibit great performance on C and N deposition. One important reason is the effect of biological nitrogen fixation between legumes and rhizobia, which helps maintain a dynamic N balance in the atmosphere–plant–soil system [64]. Specifically, the alfalfa site showed higher levels of SOC and TN sequestration in the early stage of restoration, and the stocks increased by 186.8% (SOC) and 88.5% (TN) compared to bare Technosol at a depth of 0–30 cm. In alignment with the study conducted by Gilmanov et al. [56], alfalfa displayed strong potential for carbon sinking. Hence, as a high-yielding perennial legume forage, alfalfa can be introduced to reclaim the infertile mining land in the early phrase of restoration, facilitating soil stabilization and nutrient amelioration.
In addition, most of the selected soil properties were closely linked to the revegetation age. This aligns with previous studies reporting that extended reclamation durations contribute to the progressive restoration of soil ecological functions. For instance, Bandyopadhyay et al. [25] found that SOC and TN significantly increased over a 25-year restoration chronosequence in a mining area of India. Similarly, Tordoff et al. [65] emphasized the role of vegetation age in enhancing organic matter content and improving soil structure in disturbed lands. These trends were also observed in this study, i.e., reclamation age significantly influenced SOC and TN, and significant interaction effects between vegetation and age were observed for TN and EC, confirming that time-dependent plant–soil interactions are fundamental to the rebuilding of Technosols in post-mining landscapes.

4.3. Evaluation of Soil Quality Based on ISQI Approach

The maturation of reconstruction soil in mining areas is a complex, dynamic, and time-consuming process [66], necessitating the regular monitoring of soil quality. Likewise, the evaluation of soil quality in a mine restoration area is pivotal for assessing the effectiveness of revegetation [67]. Soil properties are highly interconnected with soil functions. The ISQI, based on a combination of soil properties, may therefore provide a clear estimation of reclamation effects.
Based on the data presented in Table 4, the ISQI scores of UD (8.579) and 19-RP (3.906) were much higher than those of other studied sites, suggesting that appropriate plant species with longer restoration periods could effectively enhance soil conditions to a state favorable for vegetation growth. A comparison between 1-MS (−1.159) and 19-MS (−3.379) suggests that soil quality may undergo a reversion to a degraded state along age chronosequence. According to other studies, Wang et al. [68] and Wagle et al. [69] reported that the gross primary productivity of alfalfa is strongly associated with soil carbon fluxes and water fluxes. That is to say, the effectiveness of alfalfa for carbon sequestration may be compromised when water availability is limited [68]. Therefore, in the later stage of restoration, attention should also be paid to the impact of changes in soil conditions on the sustainability of growing alfalfa. It is noteworthy that, despite the fact that soil nutrients at revegetation sites displayed varying degrees of improvement in comparison with the original Technosol, 75% of sites showed poor ISQI values that fell below 0 (Table 4). This indicates that the ecological restoration capacity in mining areas was relatively weak, and it is difficult to achieve a satisfactory recovery in such ecologically excessive disturbance zone in a short term. In view of this, there should be a proper combination between human-induced management and nature-based restoration in practice [70], guiding the rebuilt mine ecosystem towards a novel ecological equilibrium.

5. Conclusions

In this study, integrated soil quality under different revegetation types after short- and long-term ecological restoration was investigated, with an emphasis on the enhancement of SOC and TN in Technosol. In comparison to the undisturbed forest, we found that SOC and TN stocks in initially bare Technosol showed a considerable loss, with reductions of 89.8% and 69.2%, respectively. After revegetation, SOC and TN stocks increased at varying degrees in the reclaimed sites and showed an upward tendency, in line with the increase in reclamation age (except Medicago sativa). Particularly, Robinia pseudoacaciaIdaho’ performed best in improving comprehensive soil quality, as well as in the amelioration of C and N reserves. In addition, according to the results displayed by PLS-SEM, TN was positively affected by revegetation type and revegetation age, while SOC played the strongest role in shaping integrated soil quality. Nevertheless, despite soil restoration, being effectively advanced by phytoremediation, reclaimed sites cannot reach the soil quality level of undisturbed stands. This suggests that recovering the degraded mining land to its original state, or even exceeding it, is still a challenge.

Supplementary Materials

The following supporting information can be downloaded at: https://www.mdpi.com/article/10.3390/su17136130/s1, File S1: The supplemental description of statistical analyses, including Table S1: Basic description of soil indicators across all plots; Table S2: Results for homogeneity of variances among selected soil quality indicators; Table S3: Pearson correlation coefficients among selected soil quality indicators.

Author Contributions

Methodology, Y.M. and S.D.; Investigation, B.L., H.W. and X.W.; Data curation, Y.M.; Writing—original draft, Y.M.; Writing—review & editing, X.S.; Supervision, J.Y. All authors have read and agreed to the published version of the manuscript.

Funding

This research received no external funding.

Institutional Review Board Statement

Not applicable.

Informed Consent Statement

Not applicable.

Data Availability Statement

All data generated or analyzed during this study are included in this published article and its Supplementary Materials.

Conflicts of Interest

Author Bo Lu was employed by the company Shanxi Fenxi Mining (Group) Co., Ltd. The remaining authors declare that the research was conducted in the absence of any commercial or financial relationships that could be construed as a potential conflict of interest.

References

  1. Chi, M.; Zhang, D.; Zhao, Q.; Yu, W.; Liang, S. Determining the Scale of Coal Mining in an Ecologically Fragile Mining Area under the Constraint of Water Resources Carrying Capacity. J. Environ. Manag. 2021, 279, 111621. [Google Scholar] [CrossRef]
  2. Ličina, V.; Akšić, M.F.; Tomić, Z.; Trajković, I.; Antić Mladenović, S.; Marjanović, M.; Rinklebe, J. Bioassessment of Heavy Metals in the Surface Soil Layer of an Opencast Mine Aimed for Its Rehabilitation. J. Environ. Manag. 2017, 186, 240–252. [Google Scholar] [CrossRef] [PubMed]
  3. Zhang, H.; Chu, L.M. Plant Community Structure, Soil Properties and Microbial Characteristics in Revegetated Quarries. Ecol. Eng. 2011, 37, 1104–1111. [Google Scholar] [CrossRef]
  4. Macdonald, S.E.; Landhäusser, S.M.; Skousen, J.; Franklin, J.; Frouz, J.; Hall, S.; Jacobs, D.F.; Quideau, S. Forest Restoration Following Surface Mining Disturbance: Challenges and Solutions. New For. 2015, 46, 703–732. [Google Scholar] [CrossRef]
  5. Zhao, W.; Zhang, R.; Huang, C.; Wang, B.; Cao, H.; Koopal, L.K.; Tan, W. Effect of Different Vegetation Cover on the Vertical Distribution of Soil Organic and Inorganic Carbon in the Zhifanggou Watershed on the Loess Plateau. CATENA 2016, 139, 191–198. [Google Scholar] [CrossRef]
  6. Feng, Y.; Wang, J.; Bai, Z.; Reading, L. Effects of Surface Coal Mining and Land Reclamation on Soil Properties: A Review. Earth-Sci. Rev. 2019, 191, 12–25. [Google Scholar] [CrossRef]
  7. van Breemen, N. Soils as Biotic Constructs Favouring Net Primary Productivity. Geoderma 1993, 57, 183–211. [Google Scholar] [CrossRef]
  8. Zhu, T.; Li, C.; Liu, X.; Zhao, X. Assessing Ecological Restoration in Arid Mining Regions: A Progressive Evaluation System. Sustainability 2024, 16, 2266. [Google Scholar] [CrossRef]
  9. Zhang, P.P.; Zhang, Y.L.; Jia, J.C.; Cui, Y.X.; Wang, X.; Zhang, X.C.; Wang, Y.Q. Revegetation Pattern Affecting Accumulation of Organic Carbon and Total Nitrogen in Reclaimed Mine Soils. PeerJ 2020, 8, e8563. [Google Scholar] [CrossRef] [PubMed]
  10. Lehmann, A. Technosols and Other Proposals on Urban Soils for the WRB (World Reference Base for Soil Resources). Int. Agrophys. 2006, 20, 129–134. [Google Scholar]
  11. Doran, J.W.; Coleman, D.C.; Bezdicek, D.F.; Stewart, B.A.; Haynes, R.J. (Eds.) Defining Soil Quality for a Sustainable Environment; SSSA, American Society of Agronomy: Madison, WI, USA, 1995; ISBN 978-0-89118-807-0. [Google Scholar]
  12. Robertson, W.J.; Kinnunen, P.H.-M.; Plumb, J.J.; Franzmann, P.D.; Puhakka, J.A.; Gibson, J.A.E.; Nichols, P.D. Moderately Thermophilic Iron Oxidising Bacteria Isolated from a Pyritic Coal Deposit Showing Spontaneous Combustion. Miner. Eng. 2002, 15, 815–822. [Google Scholar] [CrossRef]
  13. Dang, J.H. Problems and challenges of ecological environment in coal mine areas of Shanxi. China Coal 2021, 47, 117–121. [Google Scholar] [CrossRef]
  14. Mi, J.; Liu, R.; Zhang, S.; Hou, H.; Yang, Y.; Chen, F.; Zhang, L. Vegetation Patterns on a Landslide after Five Years of Natural Restoration in the Loess Plateau Mining Area in China. Ecol. Eng. 2019, 136, 46–54. [Google Scholar] [CrossRef]
  15. Wong, M.H. Ecological Restoration of Mine Degraded Soils, with Emphasis on Metal Contaminated Soils. Chemosphere 2003, 50, 775–780. [Google Scholar] [CrossRef]
  16. Yuan, Y.; Zhao, Z.; Zhang, P.; Chen, L.; Hu, T.; Niu, S.; Bai, Z. Soil Organic Carbon and Nitrogen Pools in Reclaimed Mine Soils under Forest and Cropland Ecosystems in the Loess Plateau, China. Ecol. Eng. 2017, 102, 137–144. [Google Scholar] [CrossRef]
  17. Misebo, A.M.; Pietrzykowski, M.; Woś, B. Soil Carbon Sequestration in Novel Ecosystems at Post-Mine Sites—A New Insight into the Determination of Key Factors in the Restoration of Terrestrial Ecosystems. Forests 2022, 13, 63. [Google Scholar] [CrossRef]
  18. Forrester, I.D.; Bauhus, J. A Review of Processes Behind Diversity—Productivity Relationships in Forests. Curr. For. Rep. 2016, 2, 45–61. [Google Scholar] [CrossRef]
  19. Lisetskii, F.N.; Buryak, Z.A.; Marinina, O.A.; Ukrainskiy, P.A.; Goleusov, P.V. Features of Soil Organic Carbon Transformations in the Southern Area of the East European Plain. Geosciences 2023, 13, 278. [Google Scholar] [CrossRef]
  20. Xu, H.; Xu, F.; Lin, T.; Xu, Q.; Yu, P.; Wang, C.; Aili, A.; Zhao, X.; Zhao, W.; Zhang, P.; et al. A Systematic Review and Comprehensive Analysis on Ecological Restoration of Mining Areas in the Arid Region of China: Challenge, Capability and Reconsideration. Ecol. Indic. 2023, 154, 110630. [Google Scholar] [CrossRef]
  21. Jang, C.-S.; Chen, S.-K.; Ching-Chieh, L. Using Multiple-Variable Indicator Kriging to Assess Groundwater Quality for Irrigation in the Aquifers of the Choushui River Alluvial Fan. Hydrol. Process. 2008, 22, 4477–4489. [Google Scholar] [CrossRef]
  22. Mutuku, E.A.; Vanlauwe, B.; Roobroeck, D.; Boeckx, P.; Cornelis, W.M. Visual Soil Examination and Evaluation in the Sub-Humid and Semi-Arid Regions of Kenya. Soil Tillage Res. 2021, 213, 105135. [Google Scholar] [CrossRef]
  23. An, Y.; Zhang, L.; Wang, Q.; Han, Y. Soil Quality Assessment of Different Land Use Types Based on TOPSIS Method in Hilly Sandy Area of Loess Plateau, Northern China. Int. J. Environ. Res. Public Health 2022, 19, 17059. [Google Scholar] [CrossRef] [PubMed]
  24. Wang, G.; Dong, Y.; Rong, L.; Yang, W.; Duan, X. The Influence of Vegetation Restoration on Soil Quality in Abandoned Farmlands in the Yuanjiang Dry-Hot Valley. CATENA 2024, 242, 108109. [Google Scholar] [CrossRef]
  25. Bandyopadhyay, S.; Novo, L.A.B.; Pietrzykowski, M.; Maiti, S.K. Assessment of Forest Ecosystem Development in Coal Mine Degraded Land by Using Integrated Mine Soil Quality Index (IMSQI): The Evidence from India. Forests 2020, 11, 1310. [Google Scholar] [CrossRef]
  26. Chen, S.; Wu, S.; Yang, J. Forest Management Has a Mixed Effect on Understory Biomass, but Understory Species Diversity and Stand Structure Are Key. Eur. J. For. Res. 2025, 144, 255–265. [Google Scholar] [CrossRef]
  27. Hair, J.F.; Risher, J.J.; Sarstedt, M.; Ringle, C.M. When to Use and How to Report the Results of PLS-SEM. Eur. Bus. Rev. 2019, 31, 2–24. [Google Scholar] [CrossRef]
  28. Ketchen, D.J. A Primer on Partial Least Squares Structural Equation Modeling. Long Range Plan. 2013, 46, 184–185. [Google Scholar] [CrossRef]
  29. Dong, L.; Hua, Y.; Gao, Z.; Wu, H.; Hou, Y.; Chu, Y.; Zhang, J.; Cui, G. The Multiple Promoting Effects of Suaeda Glauca Root Exudates on the Growth of Alfalfa under NaCl Stress. Plants 2024, 13, 752. [Google Scholar] [CrossRef]
  30. Komba, B.P.; Chattha, M.W.A.; Fatima, A.; Thomson, P.C.; González, L.A.; Hyder, M.F. Assessing the Environmental, Economic, and Social Impacts of Industrial Mining on Agricultural Communities in Sierra Leone: A Sustainable Approach Using PLS-SEM. Clean. Responsible Consum. 2025, 16, 100250. [Google Scholar] [CrossRef]
  31. Zhu, H.; Tong, G.; Duan, N.; Ma, H.; Song, Q.; Wang, J.; Luo, Y.; Zhang, Q.; Yu, X.; Jin, S. Analysis of the Complex Correlations between Land Use and Water Quality Using the PLS-SEM Method Combined with Fluorescence Fingerprinting Data. J. Environ. Manag. 2025, 373, 123688. [Google Scholar] [CrossRef]
  32. Bradshaw, A. The Use of Natural Processes in Reclamation—Advantages and Difficulties. Landsc. Urban Plan. 2000, 51, 89–100. [Google Scholar] [CrossRef]
  33. Yan, M.; Fan, L.; Wang, L. Restoration of Soil Carbon with Different Tree Species in a Post-Mining Land in Eastern Loess Plateau, China. Ecol. Eng. 2020, 158, 106025. [Google Scholar] [CrossRef]
  34. Chen, J.; Jiskani, I.M.; Li, G. Ecological Restoration of Coalmine-Degraded Lands: Influence of Plant Species and Revegetation on Soil Development. Sustainability 2023, 15, 13772. [Google Scholar] [CrossRef]
  35. Ringle, C.M.; Wende, S.; Becker, J.-M. SmartPLS 4; SmartPLS GmbH: Bönningstedt, Germany, 2024. [Google Scholar]
  36. Brown, S.; DeVolder, P.; Compton, H.; Henry, C. Effect of Amendment C:N Ratio on Plant Richness, Cover and Metal Content for Acidic Pb and Zn Mine Tailings in Leadville, Colorado. Environ. Pollut. 2007, 149, 165–172. [Google Scholar] [CrossRef] [PubMed]
  37. Zhang, Y.; Mai, H.; Qiu, Q.; Zhu, Y.; Long, J.; Chen, S.; Chen, Y. The Responses of C, N, P and Stoichiometric Ratios to Biochar and Vermicompost Additions Differ from Alfalfa and a Mine Soil. Agriculture 2023, 13, 1954. [Google Scholar] [CrossRef]
  38. Zhao, Z.; Shahrour, I.; Bai, Z.; Fan, W.; Feng, L.; Li, H. Soils Development in Opencast Coal Mine Spoils Reclaimed for 1–13 Years in the West-Northern Loess Plateau of China. Eur. J. Soil Biol. 2013, 55, 40–46. [Google Scholar] [CrossRef]
  39. Li, N.; Skaggs, T.H.; Ellegaard, P.; Bernal, A.; Scudiero, E. Relationships among Soil Moisture at Various Depths under Diverse Climate, Land Cover and Soil Texture. Sci. Total Environ. 2024, 947, 174583. [Google Scholar] [CrossRef]
  40. Wali, M.K. Ecological Succession and the Rehabilitation of Disturbed Terrestrial Ecosystems. Plant Soil 1999, 213, 195–220. [Google Scholar] [CrossRef]
  41. Wang, S.; Zhang, H. Enhancing SMEs Sustainable Innovation and Performance through Digital Transformation: Insights from Strategic Technology, Organizational Dynamics, and Environmental Adaptation. Socio-Econ. Plan. Sci. 2025, 98, 102124. [Google Scholar] [CrossRef]
  42. Wu, L.; Zhang, Y.; Guo, X.; Ning, D.; Zhou, X.; Feng, J.; Yuan, M.M.; Liu, S.; Guo, J.; Gao, Z.; et al. Reduction of Microbial Diversity in Grassland Soil Is Driven by Long-Term Climate Warming. Nat. Microbiol. 2022, 7, 1054–1062. [Google Scholar] [CrossRef]
  43. Price, K.; Jackson, C.R.; Parker, A.J. Variation of Surficial Soil Hydraulic Properties across Land Uses in the Southern Blue Ridge Mountains, North Carolina, USA. J. Hydrol. 2010, 383, 256–268. [Google Scholar] [CrossRef]
  44. Chang, R.; Fu, B.; Liu, G.; Liu, S. Soil Carbon Sequestration Potential for “Grain for Green” Project in Loess Plateau, China. Environ. Manag. 2011, 48, 1158–1172. [Google Scholar] [CrossRef]
  45. Yang, Y.; Dou, Y.; An, S. Testing Association between Soil Bacterial Diversity and Soil Carbon Storage on the Loess Plateau. Sci. Total Environ. 2018, 626, 48–58. [Google Scholar] [CrossRef]
  46. Rivas-Pérez, I.M.; Fernández-Sanjurjo, M.J.; Núñez-Delgado, A.; Monterroso, C.; Macías, F.; Álvarez-Rodríguez, E. Evolution of Chemical Characteristics of Technosols in an Afforested Coal Mine Dump over a 20-Year Period. Land Degrad. Dev. 2016, 27, 1640–1649. [Google Scholar] [CrossRef]
  47. Karlen, D.L.; Andrews, S.S.; Doran, J.W. Soil Quality: Current Concepts and Applications. In Advances in Agronomy; Elsevier: Amsterdam, The Netherlands, 2001; Volume 74, pp. 1–40. ISBN 978-0-12-000792-9. [Google Scholar]
  48. Mukhopadhyay, S.; Maiti, S.K.; Masto, R.E. Use of Reclaimed Mine Soil Index (RMSI) for Screening of Tree Species for Reclamation of Coal Mine Degraded Land. Ecol. Eng. 2013, 57, 133–142. [Google Scholar] [CrossRef]
  49. Zhang, X.; Shu, C.; Wu, Y.; Ye, P.; Du, D. Advances of Coupled Water-Heat-Salt Theory and Test Techniques for Soils in Cold and Arid Regions: A Review. Geoderma 2023, 432, 116378. [Google Scholar] [CrossRef]
  50. Jin, Y.; Liu, C.; Qian, S.S.; Luo, Y.; Zhou, R.; Tang, J.; Bao, W. Large-Scale Patterns of Understory Biomass and Its Allocation across China’s Forests. Sci. Total Environ. 2022, 804, 150169. [Google Scholar] [CrossRef]
  51. Wang, J.; Wang, H.; Cao, Y.; Bai, Z.; Qin, Q. Effects of Soil and Topographic Factors on Vegetation Restoration in Opencast Coal Mine Dumps Located in a Loess Area. Sci. Rep. 2016, 6, 22058. [Google Scholar] [CrossRef]
  52. Tandy, S.; Healey, J.R.; Nason, M.A.; Williamson, J.C.; Jones, D.L. Remediation of Metal Polluted Mine Soil with Compost: Co-Composting versus Incorporation. Environ. Pollut. 2009, 157, 690–697. [Google Scholar] [CrossRef]
  53. Li, J.; Sun, X.; Li, S. Effects of Garden Waste Compost and Bentonite on Muddy Coastal Saline Soil. Sustainability 2020, 12, 3602. [Google Scholar] [CrossRef]
  54. Zhai, B.; Sun, M.; Shen, X.; Zhu, Y.; Li, G.; Du, S. Effects of Stand Density on Growth, Soil Water Content and Nutrients in Black Locust Plantations in the Semiarid Loess Hilly Region. Sustainability 2023, 16, 376. [Google Scholar] [CrossRef]
  55. Cai, H.; Di, X.; Chang, S.X.; Jin, G. Stand Density and Species Richness Affect Carbon Storage and Net Primary Productivity in Early and Late Successional Temperate Forests Differently. Ecol. Res. 2016, 31, 525–533. [Google Scholar] [CrossRef]
  56. Gilmanov, T.G.; Baker, J.M.; Bernacchi, C.J.; Billesbach, D.P.; Burba, G.G.; Castro, S.; Chen, J.; Eugster, W.; Fischer, M.L.; Gamon, J.A.; et al. Productivity and Carbon Dioxide Exchange of Leguminous Crops: Estimates from Flux Tower Measurements. Agron. J. 2014, 106, 545–559. [Google Scholar] [CrossRef]
  57. Antonelli, P.M.; Fraser, L.H.; Gardner, W.C.; Broersma, K.; Karakatsoulis, J.; Phillips, M.E. Long Term Carbon Sequestration Potential of Biosolids-Amended Copper and Molybdenum Mine Tailings Following Mine Site Reclamation. Ecol. Eng. 2018, 117, 38–49. [Google Scholar] [CrossRef]
  58. Dou, Y.; Yang, Y.; An, S.; Zhu, Z. Effects of Different Vegetation Restoration Measures on Soil Aggregate Stability and Erodibility on the Loess Plateau, China. CATENA 2020, 185, 104294. [Google Scholar] [CrossRef]
  59. Xu, H.; Qu, Q.; Wang, M.; Li, P.; Li, Y.; Xue, S.; Liu, G. Soil Organic Carbon Sequestration and Its Stability after Vegetation Restoration in the Loess Hilly Region, China. Land Degrad. Dev. 2020, 31, 568–580. [Google Scholar] [CrossRef]
  60. Tang, B.; Rocci, K.S.; Lehmann, A.; Rillig, M.C. Nitrogen Increases Soil Organic Carbon Accrual and Alters Its Functionality. Glob. Change Biol. 2023, 29, 1971–1983. [Google Scholar] [CrossRef]
  61. Amichev, B.Y.; Burger, J.A.; Rodrigue, J.A. Carbon Sequestration by Forests and Soils on Mined Land in the Midwestern and Appalachian Coalfields of the U.S. For. Ecol. Manag. 2008, 256, 1949–1959. [Google Scholar] [CrossRef]
  62. Liu, J.; Zhao, C.; Li, C.; Lei, L.; Ta, F.; Lai, S.; Feng, Y.; Zhou, Z.; Jin, M. Mixed Planting Mode Is the Best Measure to Restore Soil Quality in Alpine Mines. Soil Tillage Res. 2024, 244, 106209. [Google Scholar] [CrossRef]
  63. Kramer, K.; Bennett, L.T.; Borelle, R.; Byrne, P.; Dettman, P.; England, J.R.; Heida, H.; Galama, Y.; Haas, J.; van der Heijden, M.; et al. Site-Level Modelling Comparison of Carbon Capture by Mixed-Species Forest and Woodland Reforestation in Australia. Forests 2024, 15, 990. [Google Scholar] [CrossRef]
  64. Ladha, J.K.; Peoples, M.B.; Reddy, P.M.; Biswas, J.C.; Bennett, A.; Jat, M.L.; Krupnik, T.J. Biological Nitrogen Fixation and Prospects for Ecological Intensification in Cereal-Based Cropping Systems. Field Crops Res. 2022, 283, 108541. [Google Scholar] [CrossRef]
  65. Tordoff, G.M.; Baker, A.J.M.; Willis, A.J. Current Approaches to the Revegetation and Reclamation of Metalliferous Mine Wastes. Chemosphere 2000, 41, 219–228. [Google Scholar] [CrossRef] [PubMed]
  66. Mylliemngap, W.; Barik, S.K. Plant Diversity, Net Primary Productivity and Soil Nutrient Contents of a Humid Subtropical Grassland Remained Low Even after 50 Years of Post-Disturbance Recovery from Coal Mining. Env. Monit Assess 2020, 191, 697. [Google Scholar] [CrossRef] [PubMed]
  67. Hancock, G.R.; Duque, J.F.M.; Willgoose, G.R. Mining Rehabilitation—Using Geomorphology to Engineer Ecologically Sustainable Landscapes for Highly Disturbed Lands. Ecol. Eng. 2020, 155, 105836. [Google Scholar] [CrossRef]
  68. Wang, T.; Mallick, K.; Verfaille, J.; Szutu, D.; Baldocchi, D. Water Scarcity in Semi-Arid California Compromises Perennial Alfalfa’s High Yield and Carbon Sinking Potentials. Agric. Water Manag. 2025, 308, 109284. [Google Scholar] [CrossRef]
  69. Wagle, P.; Gowda, P.H.; Northup, B.K. Dynamics of Evapotranspiration over a Non-Irrigated Alfalfa Field in the Southern Great Plains of the United States. Agric. Water Manag. 2019, 223, 105727. [Google Scholar] [CrossRef]
  70. Keesstra, S.; Nunes, J.; Novara, A.; Finger, D.; Avelar, D.; Kalantari, Z.; Cerdà, A. The Superior Effect of Nature Based Solutions in Land Management for Enhancing Ecosystem Services. Sci. Total Environ. 2018, 610–611, 997–1009. [Google Scholar] [CrossRef]
Figure 1. Location of sampling sites within a reclaimed gangue dump in Shanxi Province, China. PT, MS, SJ and RP represent the sites dominated by Pinus tabuliformis, Medicago sativa (i.e., alfalfa), Styphnolobium japonicum, and Robinia pseudoacaciaIdaho’, respectively. The numbers (i.e., 1 and 19) before the abbreviation letters mean 1- and 19-year reclamation ages. UD refers to an undisturbed site. The above expression is used consistently in the following text.
Sustainability 17 06130 g001
Figure 2. Soil physicochemical properties under different revegetation types and restoration ages. Values are presented as mean ± standard deviation (n = 3). The stratified soil data were treated as replicates. A two-way ANOVA was conducted to compare different treatments. Different lowercase letters indicate significant differences according to Duncan’s multiple range test (p < 0.05).
Sustainability 17 06130 g002aSustainability 17 06130 g002b
Figure 3. SOC and TN stocks at reclaimed sites and the undisturbed forest.
Sustainability 17 06130 g003
Figure 4. The partial least squares structural equation model (PLS-SEM). The blue and pink arrows indicate positive and negative relationships, respectively. The solid and dashed lines represent significant (p < 0.05) and non-significant relationships, respectively. The numbers near the pathway arrows indicate the normalized path coefficient, abbreviated as b; the thickness of the arrow indicates the degree of the effect. R2 indicates the proportion of variance explained for each tested variable.
Sustainability 17 06130 g004
Table 1. Plant characteristics of the studied sites.
Study SiteDominant SpeciesOther Species Tree Characteristics
Plant Spacing/Vegetation Coverage (%)Height (m)DBH 1 (cm)Crown Width (m)
1-PTPinus tabuliformis-2.5 m × 2.5 m3.2 ± 1.19.98 ± 4.833.31 ± 1.83
1-MSMedicago sativaAmorpha fruticosa80%---
1-SJStyphnolobium japonicumOphiopogon japonicus3.0 m × 3.0 m4.7 ± 0.611.73 ± 2.143.10 ± 0.50
1-RPRobinia pseudoacaciaIdahoChenopodium album0.5 m × 0.5 m2.7 ± 0.94.19 ± 0.911.80 ± 0.71
19-PTPinus tabuliformisSyringa oblata, Leymus chinensis2.0 m × 2.0 m3.4 ± 0.810.18 ± 2.163.39 ± 0.85
19-MSArtemisia gmeliniiLeymus chinensis, Medicago sativa35%---
19-SJStyphnolobium japonicumArtemisia gmelinii, Leymus chinensis2.0 m × 2.0 m6.1 ± 0.513.60 ± 3.133.66 ± 0.79
19-RPRobinia pseudoacaciaIdaho-1.0 m × 1.0 m4.5 ± 0.94.33 ± 2.941.80 ± 0.63
UDPinus tabuliformisRosa xanthina, Adenophora stricta, Artemisia gmelinii, Linaria vulgaris subsp. Chinensis, Leymus chinensis2.0 m × 2.0 m4.6 ± 0.711.71 ± 1.633.72 ± 0.32
1 DBH refers to diameter at breast height (1.3 m).
Table 2. Two-way analysis of variance on revegetation species and reclamation age.
IndexInfluence FactorsFpEta2
SOCRevegetation species1.1470.3660.203
Reclamation age10.1810.001 **0.531
Revegetation species × Reclamation age1.9930.1650.181
TNRevegetation species1.4850.2480.248
Reclamation age11.2650.001 **0.556
Revegetation species × Reclamation age5.7080.012 *0.388
pHRevegetation species0.5590.6950.111
Reclamation age0.5410.5920.057
Revegetation species × Reclamation age0.5820.5690.061
ECRevegetation species2.6500.0670.371
Reclamation age4.9430.019 *0.355
Revegetation species × Reclamation age4.7420.022 *0.345
MoistureRevegetation species10.8790.000 **0.707
Reclamation age25.5430.000 **0.739
Revegetation species × Reclamation age13.4890.000 **0.600
BDRevegetation species1.4570.2560.245
Reclamation age5.7130.012 *0.388
Revegetation species × Reclamation age0.7310.4950.075
C/N ratioRevegetation species2.4590.0830.353
Reclamation age4.7000.023 *0.343
Revegetation species × Reclamation age2.1240.1490.191
“*” indicates a significant correlation (p < 0.05), and “**” indicates a highly significant correlation (p < 0.01).
Table 3. Pearson correlation coefficients of soil physicochemical variables.
Correlation
Coefficient
SOCTNpHECMoistureBDC/N Ratio
SOC1.000
TN0.864 **1.000
pH−0.593 **−0.559 **1.000
EC−0.193−0.2160.3501.000
Moisture−0.273−0.2170.168−0.3361.000
BD0.594 **0.457 *−0.2060.052−0.504 **1.000
C/N ratio0.826 **0.501 **−0.479 *−0.168−0.1560.548 **1.000
“*” indicates a significant correlation (p < 0.05), and “**” indicates a highly significant correlation (p < 0.01).
Table 4. Principal component (PC) loadings of soil variables.
VariablePC1PC2
SOC0.9240.223
BD0.824−0.421
Porosity−0.8240.421
C/N ratio0.7970.181
TN0.7880.280
pH−0.602−0.494
EC−0.149−0.762
Moisture−0.4670.619
Eigenvalue4.0681.723
Variance explained, %50.84521.539
Total variance explained, %50.84572.384
Table 5. Score and rank of studied sites under different revegetation species based on ISQI.
Restoration TypeSoil Layer Depth (cm)ScoreRank
F1F2ISQI
1-PT0–10−0.7150.533−0.3436
10–20−1.9321.745−0.838
20–30−0.8510.529−0.440
1-MS0–10−0.7900.042−0.5435
10–20−0.232−0.314−0.256
20–30−0.496−0.040−0.360
1-SJ0–10−0.093−4.389−1.3729
10–20−1.490−2.370−1.752
20–30−0.043−0.891−0.295
1-RP0–10−0.001−0.060−0.0194
10–20−0.500−1.515−0.802
20–30−0.4800.114−0.304
19-PT0–10−0.0591.2760.3397
10–20−2.0771.175−1.109
20–30−2.0930.982−1.178
19-MS0–10−0.529−0.282−0.4568
10–20−0.174−1.402−0.539
20–30−3.5490.368−2.384
19-SJ0–100.2232.0290.7603
10–20−0.7380.723−0.304
20–30−0.5250.261−0.291
19-RP0–102.7250.0261.9222
10–200.144−0.1140.067
20–302.1141.4521.917
UD0–106.8120.2984.8731
10–203.7210.0902.641
20–301.629−0.2671.065
Table 6. Heterotrait–monotrait ratio (HTMT) for discriminant validity.
ConstructHTMTConstructHTMT
C/N ratio—ISQI0.573Revegetation age—TN0.480
EC—ISQI0.413Revegetation age—Moisture0.394
SOC—ISQI0.843Revegetation type—C/N ratio0.514
TN—ISQI0.803Revegetation type—EC0.218
Moisture—ISQI0.043Revegetation type—ISQI0.452
Revegetation age—C/N ratio0.128Revegetation type—SOC0.485
Revegetation age—EC0.441Revegetation type—TN0.374
Revegetation age—ISQI0.269Revegetation type—Moisture0.029
Revegetation age—SOC0.372--
Disclaimer/Publisher’s Note: The statements, opinions and data contained in all publications are solely those of the individual author(s) and contributor(s) and not of MDPI and/or the editor(s). MDPI and/or the editor(s) disclaim responsibility for any injury to people or property resulting from any ideas, methods, instructions or products referred to in the content.

