Article

An Enhanced Approach for Urban Sustainability Considering Coordinated Source-Load-Storage in Distribution Networks Under Extreme Natural Disasters

1
School of Electrical Engineering and Telecommunication, University of New South Wales, Sydney, NEW 2033, Australia
2
School of Electrical Engineering, Chongqing University, Chongqing 400044, China
*
Author to whom correspondence should be addressed.
Sustainability 2025, 17(13), 6110; https://doi.org/10.3390/su17136110
Submission received: 6 June 2025 / Revised: 30 June 2025 / Accepted: 1 July 2025 / Published: 3 July 2025
(This article belongs to the Section Sustainable Urban and Rural Development)

Abstract

Frequent extreme natural disasters can lead to large-scale power outages, significantly compromising the reliability and sustainability of urban power supply, as well as the sustainability of urban development. To address this issue, this paper proposes a two-layer resilience optimization method for distribution networks aimed at improving voltage quality during post-disaster power restoration, enhancing the resilience of the power grid, and thus improving the sustainability of urban development. Specifically, the upper-layer model determines the topology of the urban distribution network and dispatches emergency resources to restore power and reconstruct the original topology. Based on this restoration, the lower-layer model further enhances voltage quality by prioritizing the dispatch of flexible resources according to voltage sensitivity coefficients derived from power flow calculations. A larger voltage sensitivity coefficient indicates a stronger voltage optimization effect. Thus, the proposed method enables comparable voltage regulation performance with lower operational cost. Simulation findings on the IEEE-33 bus test system revealed that the proposed strategy minimized the impact of voltage fluctuations by 10.92 percent and cut the cost related to restoration by 31.25 percent, as compared to traditional post-disaster restoration plans, which do not entail optimization of system voltages.

1. Introduction

1.1. Research Background

In recent years, due to increasing concerns over shortages of fossil fuel, climate change, and environmental pollution, countries around the world have increasingly prioritized the sustainability of urban development and energy transition efforts [1,2]. The global energy transition increasingly emphasizes replacing traditional energy sources with renewables. However, as the proportion and penetration of renewable energy in power systems continue to grow, the operational boundaries become more complex, and the interactions among generation, grid, load, and storage become more frequent and intricate [3]. Due to the uncertainty and low inertia associated with renewable energy output, the resilience of power systems tends to decline [4]. The Iberian Peninsula blackout on 28 April 2025 and the major power outage caused by wildfires in the western United States in January 2025 both highlighted the insufficient resilience of current power systems [5]. Enhancing system resilience can significantly improve the ability to withstand extreme events and ensure a reliable power supply, thereby accelerating post-disaster recovery and ensuring the sustainability of urban development. Therefore, researching resilience optimization methods for distribution networks holds substantial practical significance to enhance the sustainability of urban development [6].

1.2. Literature Review

Currently, resilience optimization methods for distribution networks can be categorized into three aspects: enhancing pre-disaster preparedness, improving disaster-time resistance, and accelerating post-disaster recovery [7].

1.2.1. Pre-Disaster Prevention Strategies

To strengthen pre-disaster preparedness, it is essential to improve hardware quality, reinforce infrastructure, and enhance system resilience. Given the uncertainties associated with renewable energy output, as well as failure occurrence and propagation, advanced risk assessment techniques can be employed to predict disaster events and enable the pre-disaster deployment of emergency energy resources, facilitating faster reconfiguration of the distribution network post-disaster. Literature [8] highlights that replacing overhead lines with underground cables can effectively mitigate the impact of natural disasters and improve distribution network resilience; however, the implementation cost remains prohibitively high. Effective asset management and preventive maintenance can also significantly reduce fault probability.
Numerous studies are currently underway. For instance, PG&E has developed transformer fault detection methods based on oil analysis and aging models [5]. Additionally, unmanned aerial vehicles and digital cameras have proven effective for transmission line inspections and can be integrated with machine learning and deep learning techniques for vision-based analysis. Nonetheless, due to data limitations and deployment constraints, large-scale implementation remains a challenge [9]. Southern California Edison’s wildfire mitigation plan incorporates the use of LiDAR to detect vegetation encroachment and assess clearance risks [10]. Furthermore, vegetation management and pre-disaster pruning, informed by fire risk assessments, have demonstrated effectiveness in reducing wildfire hazards. LiDAR is also used to measure tree height and predict outages along transmission lines [11].
Finally, various disaster prediction technologies offer significant promise. By forecasting potential disasters and supporting pre-disaster resource deployment, such technologies can substantially improve post-disaster recovery, mitigate disaster impact, and enhance overall power system resilience [12]. However, due to the rapid propagation of faults, pre-fault measures alone may not fully address all potential failure scenarios. Therefore, it is equally critical to study the resistance and adaptability of power systems during fault conditions.

1.2.2. Resilience Enhancement Strategies in Disasters

To enhance the resilience of power systems during disasters, once faults are localized and risks identified, the impact can be mitigated through measures such as current limiting and appropriate load shedding. Reference [13] proposes that following fault occurrence, real-time monitoring data from systems such as PMU, DMS, and SCADA can be integrated with artificial intelligence algorithms—such as graph neural networks and convolutional neural networks—to enable rapid fault localization. Furthermore, the extent of line damage and the severity of the disaster can be assessed by integrating GIS, remote sensing imagery, and sensor data. Based on this analysis, load shedding can be implemented using circuit breakers and other switching equipment at the moment of fault occurrence to prevent fault propagation and avoid cascading failures [14]. Additionally, current limits can be set according to the disaster type to prevent secondary hazards, such as fires triggered by infrastructure damage from natural disasters [5].

1.2.3. Disaster Recovery Strategies

To enhance post-disaster recovery, Ref. [15] proposes that microgrids can rapidly switch to islanded mode following a fault, allowing distributed energy and storage systems to be flexibly dispatched to maintain an uninterrupted power supply. Automated switching devices and islanding detection algorithms ensure a seamless transition to islanded operation. Coordinated dispatch of microgrids can improve the efficiency of multi-area joint restoration. Countries such as Japan and Australia have successfully adopted microgrids to enhance power system resilience [5].
Ref. [16] introduces a hierarchical recovery model based on load priority, ensuring that critical services such as hospitals and transportation systems are restored first. Multi-objective optimization algorithms are employed to balance load importance, restoration cost, and resource accessibility, thereby enabling prioritized restoration of essential loads. Building on this, Ref. [17] suggests that temporary power can be supplied to fault locations using emergency energy resources, while distributed energy resources (DERs) can be deployed locally to improve self-healing capability and reduce dependence on the main grid.
Ref. [18] proposes that when network topology is compromised, power supply path reconfiguration should be carried out using DERs, energy storage systems, and related equipment to maximize the continuity of power supply. On the user side, encouraging DER owners to participate in restoration efforts and promoting electricity-saving behavior among residents can foster community involvement. These measures collectively enhance power restoration capabilities and improve the resilience of distribution networks [19].

1.3. Research Gaps and Contributions

In previous studies, voltage sensitivity was primarily used to calculate electrical distance and served as the basis for voltage zoning management under conventional operating conditions [20]. However, it has not been considered in the scenario of post-disaster power supply restoration. Moreover, most existing research focuses on restoring the power supply capacity of the distribution system, with limited attention given to voltage quality enhancement following extreme natural disasters. As a result, post-disaster voltage management is either overlooked or addressed through uncoordinated dispatch of flexible resources, potentially leading to inefficient resource utilization, reducing the efficiency of distribution network restoration, and affecting urban sustainability.
  • A power restoration method based on post-disaster topology reconfiguration is proposed. By analyzing damage characteristics of the distribution network, a restoration model is constructed, and a rapid reconfiguration strategy coordinated with source-load-storage is designed to achieve prioritized restoration of critical loads and grid connection of power sources, laying the foundation for subsequent voltage optimization.
  • Based on the power supply, a voltage optimization method for highly resilient distribution networks is proposed. After post-disaster power restoration, the method leverages source-load-storage coordination to flexibly utilize reactive power compensation devices and the remaining flexible resources to optimize voltage, thereby improving power quality and restoration efficiency in the distribution system, which in turn enhances the sustainability of urban development.
  • Based on the voltage sensitivity coefficient, an allocation method for flexible resources is developed. Centered on multi-source heterogeneous resources such as reactive power compensation devices, mobile emergency generators, centralized energy storage, and electric vehicles, differentiated dispatch strategies are designed to enable precise deployment and efficient utilization of flexible resources, further enhancing the voltage regulation capability and economic performance of the post-disaster power system.

2. Two-Stage Dispatch Framework for Distribution Networks Considering Source-Load-Storage Coordination

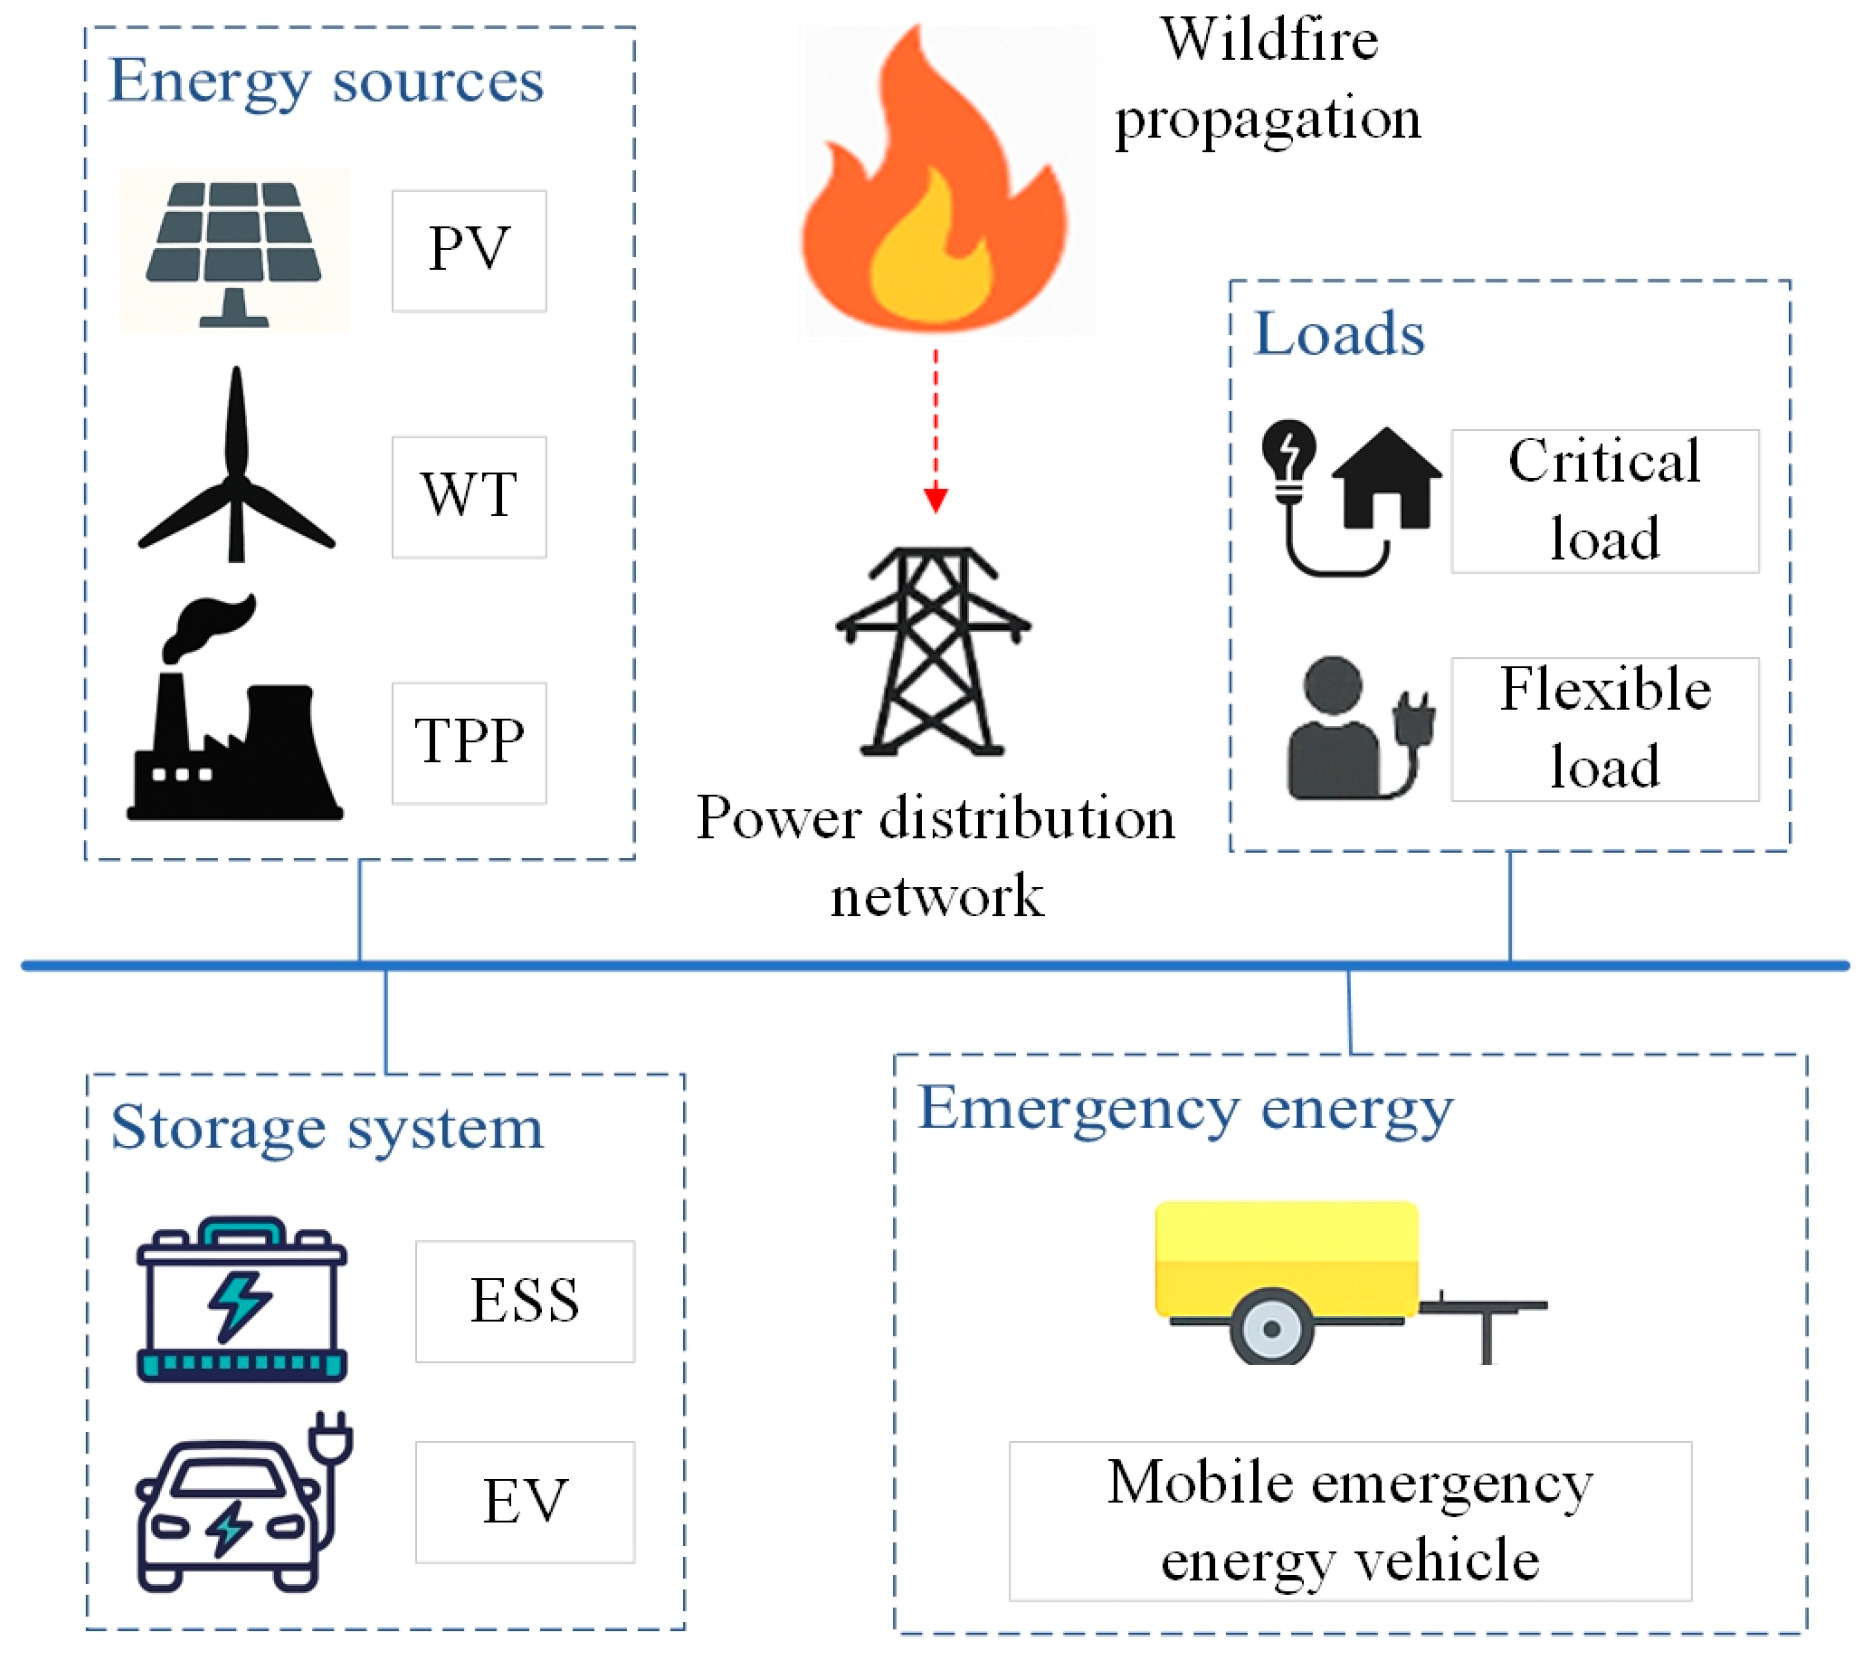
2.1. Optimal Dispatch Scenario of Distribution Networks with Source-Load-Storage Coordination

Source-load-storage coordinated optimization refers to the full utilization of flexible resources from the three terminals: generation, load, and storage, to support power supply and enhance distribution network resilience [21]. Among them, the source terminal includes resources such as photovoltaic, wind power, and thermal power; the load terminal includes critical loads, interruptible loads, and flexible loads [22]; the storage system refers to broadly defined energy storage systems with energy storage capabilities, including traditional centralized storage and electric vehicles [23]. The scenario is illustrated in Figure 1.
In the event of an extreme natural disaster, such as a wildfire, the spread of the fire can lead to elevated temperatures and disconnection of the distribution network [5]. Through source-load-storage coordinated optimization, diverse resource participation can be achieved, enhancing system flexibility and adjustability, while mitigating the uncertainty of distributed energy sources [24]. At the same time, this method enables multi-objective optimization, on the basis of ensuring safety and enhancing resilience, objectives such as minimizing optimization costs can also be achieved [25].

2.2. Optimization Framework for Distribution Network Dispatch with Source-Load-Storage Coordination

The three modules of the optimization framework are responsible for power supply, determining the dispatch priority of flexible resources, and voltage optimization, respectively. In terms of mathematical modeling, the decision output of the upper-level model serves as the input for the lower-level model, thereby simplifying the complexity of the optimization process. The optimization framework is illustrated in Figure 2.
The implementation process of the proposed framework is as follows:
  • Power Supply Module: After an extreme natural disaster occurs, the distribution network is reconfigured based on damage assessment results. Priority is given to restoring power to critical loads and important nodes to ensure the basic operational capability of the system, thereby providing foundational support for subsequent voltage sensitivity analysis and voltage optimization.
  • Voltage Sensitivity Calculation Module: After the power supply is completed, power flow analysis is conducted on the reconfigured topology. Voltage sensitivity coefficients are then calculated using the Jacobian matrix inversion method, which is used to determine the dispatch priority of different flexible resources in the voltage optimization process. Notably, the Jacobian matrix is derived from the Newton–Raphson power flow algorithm. Therefore, when assessing voltage sensitivity, its inverse offers a linear approximation of voltage responses. This method is computationally efficient for large-scale systems due to the matrix’s sparsity, reusability, localized updates, and scalability.
  • Voltage Optimization Module: Based on the established dispatch priorities, resources with higher priority are utilized to perform voltage optimization, with the dual objective of minimizing voltage fluctuations and optimization costs, thereby improving voltage quality and enhancing distribution network resilience.

3. Power Supply Model for Distribution Networks Based on Source-Load-Storage Coordination

3.1. Objective Function of Power Supply Model

This paper aims to minimize the restoration cost; therefore, the objective function is as follows:
min t Ω T Δ t i Ω b c i P i , q i e t + c sub t P sub t + c E S P i , c h t + P i , d c h t + c M E G P i , M E G t
where P i , qie t is the amount of active load shedding; P sub t is the power purchased from the upstream grid; P i , ch t and P i , dch t are the charging and discharging power of the energy storage system, respectively; P i , MEG t is the power output of the mobile emergency generator; c i is the compensation cost for load outage; c sub t is the electricity purchase cost from the upstream grid; c ES is the cost of charging/discharging the energy storage system; c MEG is the operation cost of the mobile emergency generator.

3.2. Constraint Conditions of Power Supply Model

Mobile emergency generator (MEG) constraints:
i Ω MEG σ i t n MEG
σ i t + τ i σ i t + τ i + 1 σ i t = 0 , t τ i
σ i t P MEG min P i , MEG t σ i t P MEG max
σ i t Q MEG min Q i , MEG t σ i t Q MEG max
where Ω MEG is the set of candidate nodes for MEG access in the power system; σ i t is a binary variable (0, 1): if σ i t = 0, it indicates that the MEG has not accessed node i at time t ; n MEG represents the upper limit on the total number of MEG that can be deployed; τ i is the time required for MEG to move to candidate node i ; P MEG min and P MEG max represent the minimum and maximum active power outputs of the MEG, respectively; Q MEG min and Q MEG max represent the minimum and maximum reactive power outputs of the MEG, respectively.
In mobile emergency generator constraints, constraint (1) ensures that at any time, the number of MEGs connected to the power system does not exceed the allowable maximum number. Constraint (2) indicates that if it is decided to dispatch a MEG to node i at time t , then at time t + τ i , the MEG will arrive at node i , and at time t + τ i + 1, the MEG will still be located at node i . Meanwhile, before time τ i , no other MEG can access node i . Constraints (3) and (4) represent the active and reactive power output limits of the MEG, respectively.
Energy storage system constraints:
u i , ch t + u i , dch t 1
0 P i , ch t u i , ch t × P i , ES max 0 P i , dch t u i , dch t × P i , ES max
S O C i t = S O C i t 1 + η c h P i , ch t P i , dch t / η dch Δ t C i , ES
S O C i , ES min S O C i t S O C i , ES max
where u i , ch t and u i , dch t are binary variables (0, 1), representing the charging/discharging status of the energy storage system. If u i , ch t = 1 or u i , dch t = 1, it indicates that the energy storage system is charging/discharging at time t ; P i , ch t and P i , dch t represent the charging and discharging power of the energy storage system, respectively. P i , ES max represents the maximum power capacity of the energy storage system; S O C i t is the state of charge of the energy storage system at node i at time t ; η c h and η dch represent the charging and discharging efficiencies, respectively; C i , ES is the storage capacity of the system; S O C i , ES min and S O C i , ES max denote the minimum and maximum allowable state of charge of the energy storage system, respectively.
In the energy storage system constraints, constraint (5) represents the charging/discharging exclusivity constraint, indicating that the energy storage system cannot charge and discharge simultaneously. Constraint (6) limits the charging/discharging power of the energy storage system. Constraints (7) and (8) impose limits on the state of charge of the energy storage system.
Radial network topology constraints:
β i j t + β j i t = α i j t
β i j t = 0 , j Ω sub
i Ω b β i j t = 1 , j Ω b Ω sub Ω ES Ω MEG
i Ω b β i j t 1 , j Ω ES
1 σ j t i Ω b β i j t 1 + σ j t , j Ω MEG 0 i Ω b β i j t 1 , j Ω MEG
where β i j t , β j i t , and α i j t are all binary variables (0, 1), β i j t and β j i t represent a pair of parent node indicators: if β i j t = 1, then node i is the parent node of node j ; α i j t indicates the switch status of branch i j : if α i j t = 1, branch i j is closed; Ω b is the set of all nodes in the power system; Ω sub is the set of substation nodes; Ω ES denotes the set of nodes where energy storage systems are located; Ω MEG denotes the set of candidate nodes for mobile emergency generators.
In the radial network topology constraints, Constraint (9) is the branch connection constraint, indicating that two nodes cannot be parent nodes of each other; Constraints (10), (11), and (12) ensure radial connectivity of the power system; Constraint (13) indicates that candidate access nodes for mobile emergency power sources can serve as balancing nodes and provide voltage support to other nodes only after the mobile emergency power source has been connected.
The purpose of enforcing radial topology constraints is to ensure that, even after network reconfiguration due to switching operations in the power system, the network structure remains radial. This guarantees that the optimization problem remains tight after applying relaxation to the power flow equations.
For example:
Figure 3 shows a simple power network, where node 1 is a substation node. According to constraint (10), we have β 12 t = 1, indicating that node 1 is the parent node of node 2, and thus β 21 t = 0. According to constraint (11), β 32 t = 0, indicating that node 2 is the parent node of node 3, and therefore β 23 t = 1. Based on constraint (9), α 12 t = 1 and α 23 t = 1, which verifies the connectivity among the three nodes and confirms the validity of the radial network topology.
Power flow constraints:
i u j P i j t + P j t = k v j P j k t i u j Q i j t + Q j t = k v j Q j k t
α i j t M P i j t α i j t M α i j t M Q i j t α i j t M
P j t = P j , PV t + P j , WP t + P j , ES t + P j , MEG t P j , Load t Q j t = Q j , MEG t Q j , Load t
P j , Load t + P j , qie t = P j , Load 0 t Q j , Load t + Q j , qie t = Q j , Load 0 t
r i j P i j t + x i j Q i j t / V N 1 α i j t M V j t V i t r i j P i j t + x i j Q i j t / V N + 1 α i j t M
T i j t T max + 1 α i j t M
V min V i t V max
where P i j t and Q i j t represent the active and reactive power on branch i j at time t ; P j t and Q j t represent the active and reactive power injections, respectively, at node j at time t ; M is a sufficiently large constant, set to 1000 in this paper; P j , PV t is the active power of photovoltaic generation at node j at time t ; P j , WP t is the active power of wind power generation at node j at time t ; P j , ES t is the active power of the energy storage system at node j at time t ; P j , MEG t and Q j , MEG t represent the active and reactive powers of the mobile emergency generator, respectively, at node j at time t ;   P j , Load t and Q j , Load t represent the active and reactive powers of the load, respectively, at node j at time t ; P j , qie t and Q j , qie t represent the active and reactive powers of load shedding at node j at time t , respectively; P j , Load 0 t and Q j , Load 0 t represent the active and reactive power demands of the load at node j at time t , respectively; V N is the rated voltage, set to 12.66 kV in this paper; V i t is the voltage at node i at time t ; T ij t is the temperature of branch i j at time t ; T max is the maximum allowable temperature of the branch.
In the power flow constraints, Constraint (14) represents the relationship between branch power flow and node power injection; Constraint (15) is the branch power constraint, indicating that when branch i j is connected, −∞ P i j t , Q i j t +∞; when branch i j is disconnected, P i j t and Q i j t are set to 0; Constraint (16) is the node power balance equation; Constraint (17) is the load operation constraint; Constraint (18) represents that the model is a linearised Distflow model considering switching states; Constraint (19) is the temperature constraint; Constraint (20) is the node voltage constraint.
Constraint (19) considers the thermal balance equation of the wildfire model in the constraint. During the optimization process, by considering the potential damage caused by extreme wildfires to the distribution network, the model can fully utilize flexible resources through source-load-storage coordination to finally provide an optimal power supply recovery strategy for the distribution network.

4. Priority Determination Method for Flexible Resources Based on Voltage Sensitivity Calculation

To achieve more efficient voltage optimization, this paper adopts voltage sensitivity coefficients as the coordination criterion for flexible resources in the source-load-storage system. After an extreme disaster occurs, resources with a greater contribution to voltage optimization are prioritized for dispatch.

4.1. Power Flow Calculation Method

In this paper, the power flow equations serve as important constraints in both the power supply model and the voltage optimization model [26]. At the same time, solving the power flow equations using the Newton–Raphson iterative method produces the Jacobi matrix, which also forms the basis for voltage sensitivity calculation.
The power flow Equations (21) and (22) are derived from the nodal current balance equations and nodal power balance equations.
Δ P i U , δ = P i s U i j = 1 n U j G i j cos δ i j + B i j sin δ i j = 0  
Δ Q i U , δ = Q i s U i j = 1 n U j G i j sin δ i j B i j cos δ i j = 0
where U i and U j are the voltage magnitudes at nodes i and j , respectively; G i j and B i j are the real and imaginary parts of the i j -th element of the nodal admittance matrix; Y ij = G ij + jB ij . To solve the power flow Equations (21) and (22), the mainstream approach is to apply the Newton–Raphson iterative method to solve equation set (23).
Δ p Δ q 2 n × 1 = p θ p v q θ q v 2 n × 2 n Δ θ Δ v 2 n × 1 = J Δ θ Δ v
where Δ p and Δ q n are the vectors of active and reactive power mismatches, respectively. The solution steps are shown as follows [27]:
(1)
Set the initial values θ (0) and v (0);
(2)
Based on the initial values, calculate the mismatch vectors Δ p and Δ q ;
(3)
Compute the Jacobi matrix J ;
(4)
Solve the correction equation to obtain the corrections Δ θ (0) and Δ v (0);
(5)
Update the variables:   Δ θ (1) = θ (0) + Δ θ (0), Δ v (1) = v (0) + Δ v (0);
(6)
Check convergence: if max| Δ θ (0), Δ v (0)| < ε , stop; otherwise, return to step (2) and repeat the iteration.
Notably, the accuracy of the Newton–Raphson iterative method stems from its use of second-order Taylor series approximations, allowing it to converge quadratically near the solution. This means that, once sufficiently close to the true solution, each iteration approximately squares the number of correct digits, leading to rapid refinement. In power flow calculation applications, the Newton–Raphson iterative method typically achieves solutions with very small residuals, often on the order of 10−6 to 10−12, depending on the tolerance criteria and numerical precision. This level of accuracy is sufficient for voltage sensitivity analysis. However, the Newton–Raphson iterative method can be influenced by several factors, e.g., initial guess, Jacobian conditioning, model simplifications, and floating-point limitations. Nonetheless, the Newton–Raphson method provides highly accurate solutions when applied under appropriate conditions, with its convergence and reliability making it the preferred approach in voltage sensitivity analysis.

4.2. Method for Voltage Sensitivity Calculation and Priority Determination

Based on the Jacobi matrix obtained from single-period power flow calculations, after partitioning it, by removing the node voltages corresponding to submatrices N and L , N and L can be obtained. By inverting N and L , the active and reactive voltage sensitivity matrices Pl and Ql can be obtained [28]. Then, the power flow process is extended to 24 time periods, and the power flow equations are re-solved accordingly. By applying Jacobi matrix inversion again, the 24-period voltage sensitivity matrices P l t (active) and Q l t (reactive) are obtained.
After obtaining the 24-period voltage sensitivity matrices, since none of the flexibility resources used in this paper are shifted after they are identified, the data are averaged directly over the 24 time periods, so the average voltage sensitivity for each node is first calculated. Since a higher voltage sensitivity indicates a stronger impact on voltage regulation, applying the same amount of active/reactive power results in better voltage optimization. Since this paper uses cost as the objective function, the reciprocal of the average voltage sensitivity is first taken to reflect that higher voltage sensitivity corresponds to lower optimization cost. Then, each inverted voltage sensitivity is divided by the sum of all inverted values to obtain the weight coefficients. Finally, these weight coefficients are further divided by their total sum to obtain the final normalized weight coefficients: active power weight w _ Q and reactive power weight w _ P . And the flowchart is shown in Figure 4.
The reason for converting voltage sensitivity into weight coefficients is that voltage sensitivity cannot be directly incorporated into the cost objective function. This approach only reflects the differences in optimization effectiveness caused by the variation in access nodes and does not affect the fairness among different flexibility resources. Thus, introducing weight coefficients enables voltage sensitivity to be indirectly reflected in voltage optimization cost. The greater the voltage sensitivity, the smaller the weight coefficient, indicating lower cost and higher dispatch priority.

5. Voltage Optimization Model for Distribution Networks Based on Source-Load-Storage Coordination

5.1. Objective Function of Voltage Optimization Model

In this paper, a bi-objective function optimization approach is adopted to achieve voltage optimization. Objective function 1 is designed to minimize the average voltage fluctuation at each time step, and is expressed as follows:
min t Ω T Δ t i Ω b V V n 2 / 33
where V represents the node voltage magnitude, and V n is the rated voltage of the distribution network. Notably, the deviation of voltage in objective function 1 is averaged.
Objective function 2 is designed to minimize the voltage optimization cost, and is expressed as follows:
min t Ω T s Ω s Δ t i Ω b ( c g t P g t + c ES P i , ch t + P i , dch t + c BS P x , t , ch BS + P x , t , d ch BS ) × w _ P   + c MEG P y , t , ch MEG + P y , t , d ch MEG × q u a n _ P + c SVC Q SVC t + c CB N + c g t Q g t × w _ Q
where P g t is the power purchased from the upstream grid, and Q g t is the reactive power exchanged with the upstream grid; P i , ch t and P i , dch t are the charging and discharging powers of the energy storage system, respectively; P x , t , ch BS and P x , t , d ch BS are the charging and discharging powers of 5G base stations, respectively; P y , t , ch MEG and P y , t , d ch MEG are the chargingand discharging powers of mobile emergency generators, respectively; Q SVC t is the reactive power of static var compensators; N is the number of capacitor banks in subgroups. c g t is the interaction cost with the upstream grid; c ES is the charging/discharging cost of energy storage systems; c BS is the charging/discharging cost of 5G base stations; c MEG is the charging/discharging cost of mobile energy generators; c SVC is the operating cost of static var compensators; c CB is the operating cost of capacitor banks in subgroups. w _ P is the active power weight coefficient, and w _ Q is the reactive power weight coefficient.

5.2. Constraint Conditions of Voltage Optimization Model

On-load tap changer (OLTC) constraints:
r i min r i , t r i max ,   i Ω sub
σ i , t 1 σ i , t s σ i , t SR j
δ i , t IN + δ i , t DE 1
s σ i , t s s σ i , t 1 s δ i , t IN δ i , t DE SR i
s σ i , t s s σ i , t 1 s δ i , t IN SR i δ i , t DE
t T δ i , t IN + δ i , t DE N i max
r i , t = r i min + s r i s σ i , t s
where node i is a substation node, and Ω sub is the set of substation nodes; r i min and r i max represent the lower and upper bounds of the tap ratio of the on-load tap changer; r i , t represents the tap ratio of the on-load tap changer at time t ; s represents the tap position; σ i , t s , δ i , t IN , and δ i , t DE are binary variables (0, 1); σ i , t s is the indicator of whether the tap position s is activated, when σ i , t s = 1 means the tap is switched on; δ i , t IN and δ i , t IN represent the tap-up and tap-down indicators, respectively; δ i , t IN = 1 indicates that the tap position at time t is higher than that at t   − 1; δ i , t DE = 1 indicates that the tap position at time t is lower than at t   − 1. If δ i , t IN = 0 and δ i , t DE = 0, the tap position at time t remains the same as that at t   − 1.   SR i represents the maximum range of tap position variation; N i max is the maximum number of tap changes allowed per day.
Constraint (24) defines the upper and lower bounds of the squared tap ratio of the on-load tap changer; Constraint (25) represents the tap position logic, indicating that the OLTC tap positions must be activated sequentially—if tap position s is activated, then position s-1 must also be activated; Constraint (26) restricts simultaneous tap-up and tap-down operations at the same time; Constraint (27) limits the total number of tap-up operations to not exceed the maximum tap number; Constraint (28) sets the same upper limit for the number of tap-down operations; Constraint (29) ensures that the total number of tap-up and tap-down operations within a day does not exceed the specified maximum; Constraint (30) defines the tap ratio of the on-load tap changer at time t .
Constraints of discrete reactive power compensation devices:
Q j , t = y j , t Q j ,   j Ω CB
y j , t Y j max
t T y j , t y j , t 1 N j max
where node j is the access node of a discrete reactive power compensation device; Ω CB is the set of access nodes for discrete reactive compensation devices; Q j , t represents the reactive power output of the compensation devices at time t ; y j , t is the number of operating units of the discrete reactive compensation devices at time t ;   Q j is the reactive power provided by each unit of the compensation devices at time t ; Y j max represents the maximum number of discrete compensation device units that can be installed in the distribution network; N j max represents the maximum number of switching operations allowed per day for the discrete reactive power compensation devices.
Constraint (31) is the reactive power constraint; Constraint (32) is the operating unit number constraint; Constraint (33) is the daily switching frequency constraint.
Constraints of continuous reactive power compensation devices:
Q k min Q k , t Q k max ,   k Ω SVC
where node k is the access node of a continuous reactive power compensation device; Ω SVC is the set of access nodes for continuous reactive compensation devices; Q k SVC , min and Q k SVC , max denote the minimum and maximum reactive power output of the continuous reactive power compensation device, respectively;     Q k , t represents the reactive power output of the continuous reactive compensation devices at time t .
Fifth-generation base station constraints:
u x , t , ch BS + u x , t , d ch BS   1 ,   x Ω BS
0 P x , t , ch BS u x , t , ch BS × P x , BS max 0 P x , t , d ch BS u x , t , d ch BS × P x , BS max
S O C x t = S O C x t 1 + η c h P x , t , ch BS P x , t , d ch BS / η dch Δ t C x , BS
S O C x , BS min S O C x t S O C x , BS max
S O C x 1 = S O C x 25
where x denote the access node of a 5G base station; Ω BS is the set of access nodes for 5G base stations; u x , t , ch BS and u x , t , d ch BS are binary variables (0, 1), indicating the charging/discharging status of the 5G base station. If u x , t , ch BS = 1 or u x , t , d ch BS = 1, the 5G base station is charging or discharging, respectively, at time t ; P x , t , ch BS and P x , t , d ch BS represent the charging and discharging powers of the 5G base station, respectively; P x , BS max is the maximum active power of the 5G base station; S O C x t denotes the state of charge of the 5G base station at node x and time t ; η c h and η dch are the charging and discharging efficiencies of the 5G base station, respectively; C x , BS is the energy capacity of the 5G base station; S O C x , BS min and S O C x , BS max denote the minimum and maximum state of charge limits, respectively.
Constraint (35) is the charging/discharging constraint for 5G base stations; Constraint (36) is the charging/discharging power limit constraint for 5G base stations; Constraints (37) and (38) are the state of charge constraints for 5G base stations; Constraint (39) is the state of charge consistency constraint at the start and end of scheduling.
In addition, the constraints on mobile emergency generators, energy storage systems, and power flow are kept consistent with the modeling assumptions in the power supply model to ensure their validity.

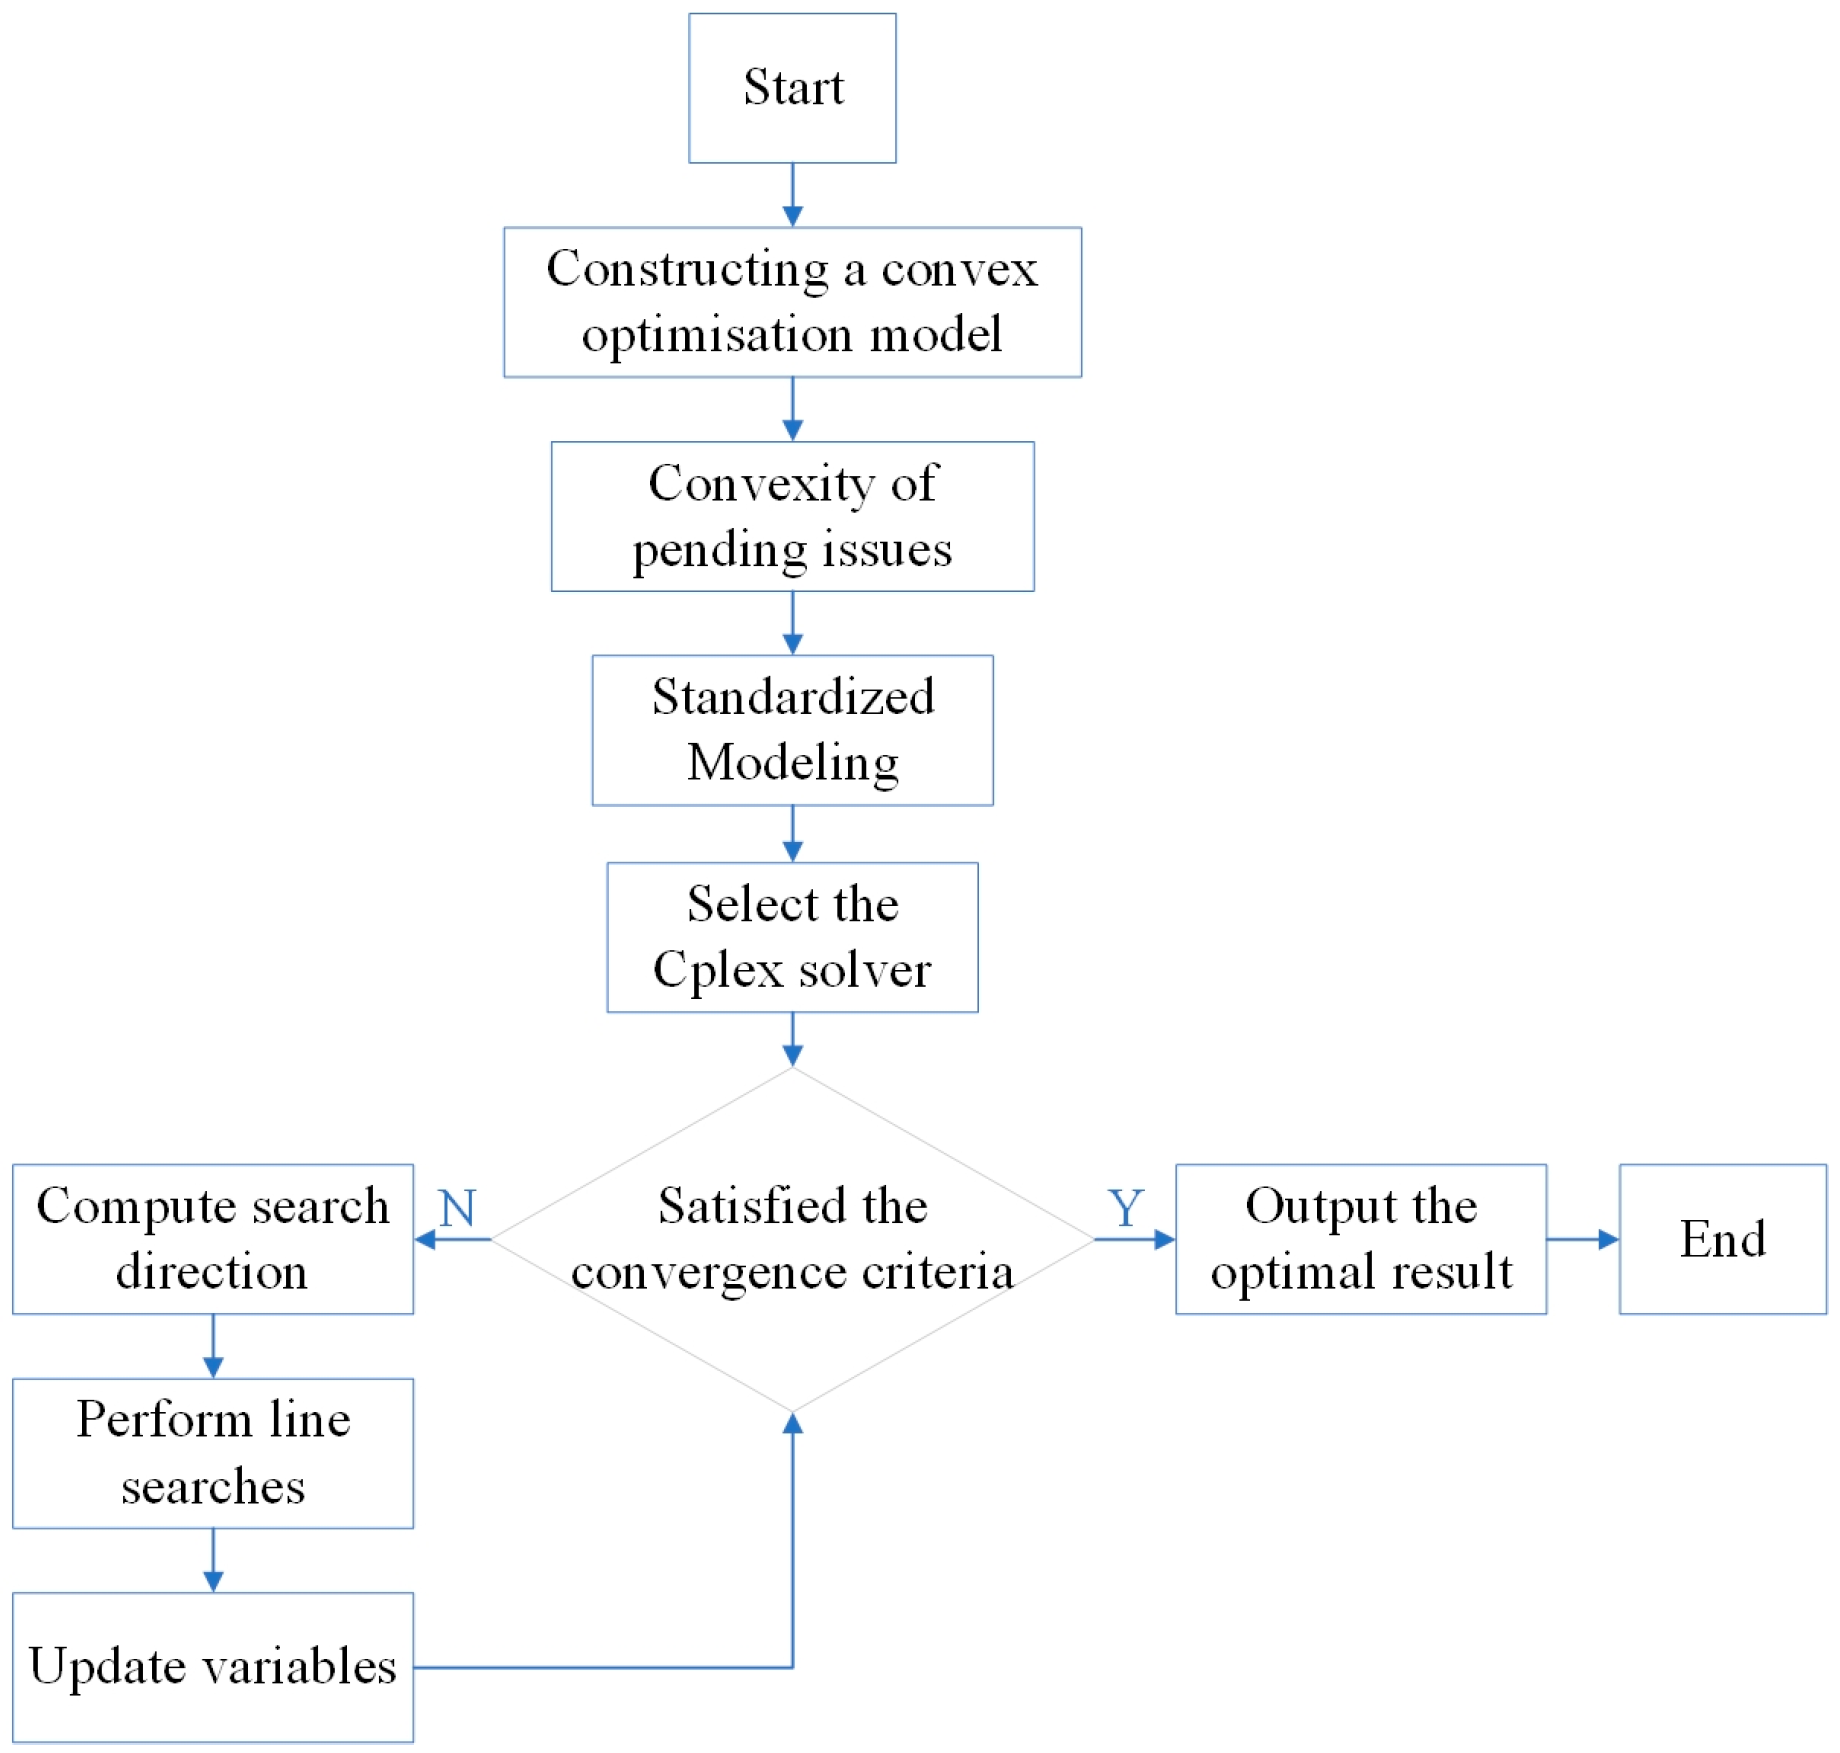
5.3. Solution Process

The source-load-storage coordinated model for the distribution network is a typical mixed integer nonlinear programming problem (MINLP). In theory, it can be solved using heuristic algorithms (e.g., genetic algorithms, particle swarm optimization algorithms), nonlinear solvers (such as APOPT, IPOPT) [29], and machine learning algorithms [30]. However, these methods may fail to obtain the global optimum within acceptable time limits when the model size increases, making it difficult to avoid NP-hard problems. To solve this problem, we need to apply a two-step relaxation method to transform the MINLP problem into a convex problem. From the literature [31], the two-part relaxation method cannot be used in a toroidal network, as the relaxation will lead to the enlargement of the feasible domain of the model while performing the relaxation, which will lead to a non-tight problem. Whereas, in radial networks, both the phase angle relaxation and the second-order cone relaxation are tight problems after performing them. Therefore, in this paper, we set topological constraints on the radial network to guarantee that the power system is radial. Therefore, a second-order cone programming and generalized disjunctive programming are adopted to transform the original MINLP problem into a convex optimization problem [31], which is then solved using the CPLEX solver. The solution process is illustrated in Figure 5:

6. Case Studies

6.1. Parameter Settings

In the optimization problem, the IEEE-33 node test system is widely used [31]; meanwhile, this paper studies a medium voltage distribution network with a 10 kV voltage level, which matches with IEEE-33 node test system. So this paper validates the effectiveness of the proposed optimization method using the IEEE-33 bus test system. The simulation is implemented in MATLAB R2023b with the YALMIP 7.0 platform, and solved using the CPLEX 12.10 solver.
The initial topology of the test system is shown in Figure 6. The system includes five tie switches, which are represented by dashed lines in Figure 4. Considering the severity and spread of the disaster, MEG can move to nodes 7, 11, 14, 20, 24, and 31 within the allowed time. Thus, those nodes are candidate access locations for mobile emergency generators, with their power output ranging from [0, 200] kW [32]. The energy storage system is connected at node 10, with an average charge/discharge efficiency of 0.95, power range [0, 200] kW, and capacity of 1000 kWh. The maximum and minimum state of charge are 0.95 and 0.2, respectively. Photovoltaic generators are connected at nodes 7 and 26, each with a maximum output power of 200 kW; wind turbines are connected at nodes 15 and 30, each also with a maximum output of 200 kW. Two groups of switchable capacitor banks are connected at nodes 12 and 17, with a maximum of five banks per group, each capable of providing 100 kVar reactive power compensation. Three static var compensators are installed at nodes 7, 15, and 20, with a reactive power compensation range of [−100, 300] kVar.
Nodes 7, 11, 14, 20, 24, and 31 are designated as critical load nodes. The cost of load shedding at these critical nodes is set to 10 USD/kWh, while the cost at other nodes is 1 USD/kWh. Notably, resources with higher regulation costs generally exhibit lower regulation effectiveness, while nodes with greater voltage sensitivity (i.e., key nodes) contribute more significantly to voltage regulation. Considering these factors, it is necessary to define parameter settings such that the regulation cost of resources at key nodes is higher than that of resources at other nodes. This approach helps balance the trade-off between voltage regulation effectiveness and economic efficiency. The charge/discharge cost of the energy storage system is 0.1 USD/kWh, and the operating cost of mobile emergency generators is 0.7 USD/kWh. The electricity purchase price from the upper-level grid follows a time-of-use pricing scheme: off-peak (00:00–08:00) is 0.42 USD/kWh, normal hours (08:00–11:00, 17:00–20:00, 22:00–24:00) is 0.6 USD/kWh, and peak hours (11:00–17:00, 20:00–22:00) is 0.7 USD/kWh. The operating cost of static reactive compensators is 0.5 USD/kVar. Switchable capacitor banks incur a cost of USD 50 per hour per group connected.
It is assumed that the ignition point of the hill fire is 500 m from the affected distribution line, only branch 1-2 is affected by the wildfire and the rest of the branches are considered to be at a safe distance from the ignition point, with conductor diameters and maximum allowable temperatures of 28.1 mm and 343 K, respectively.

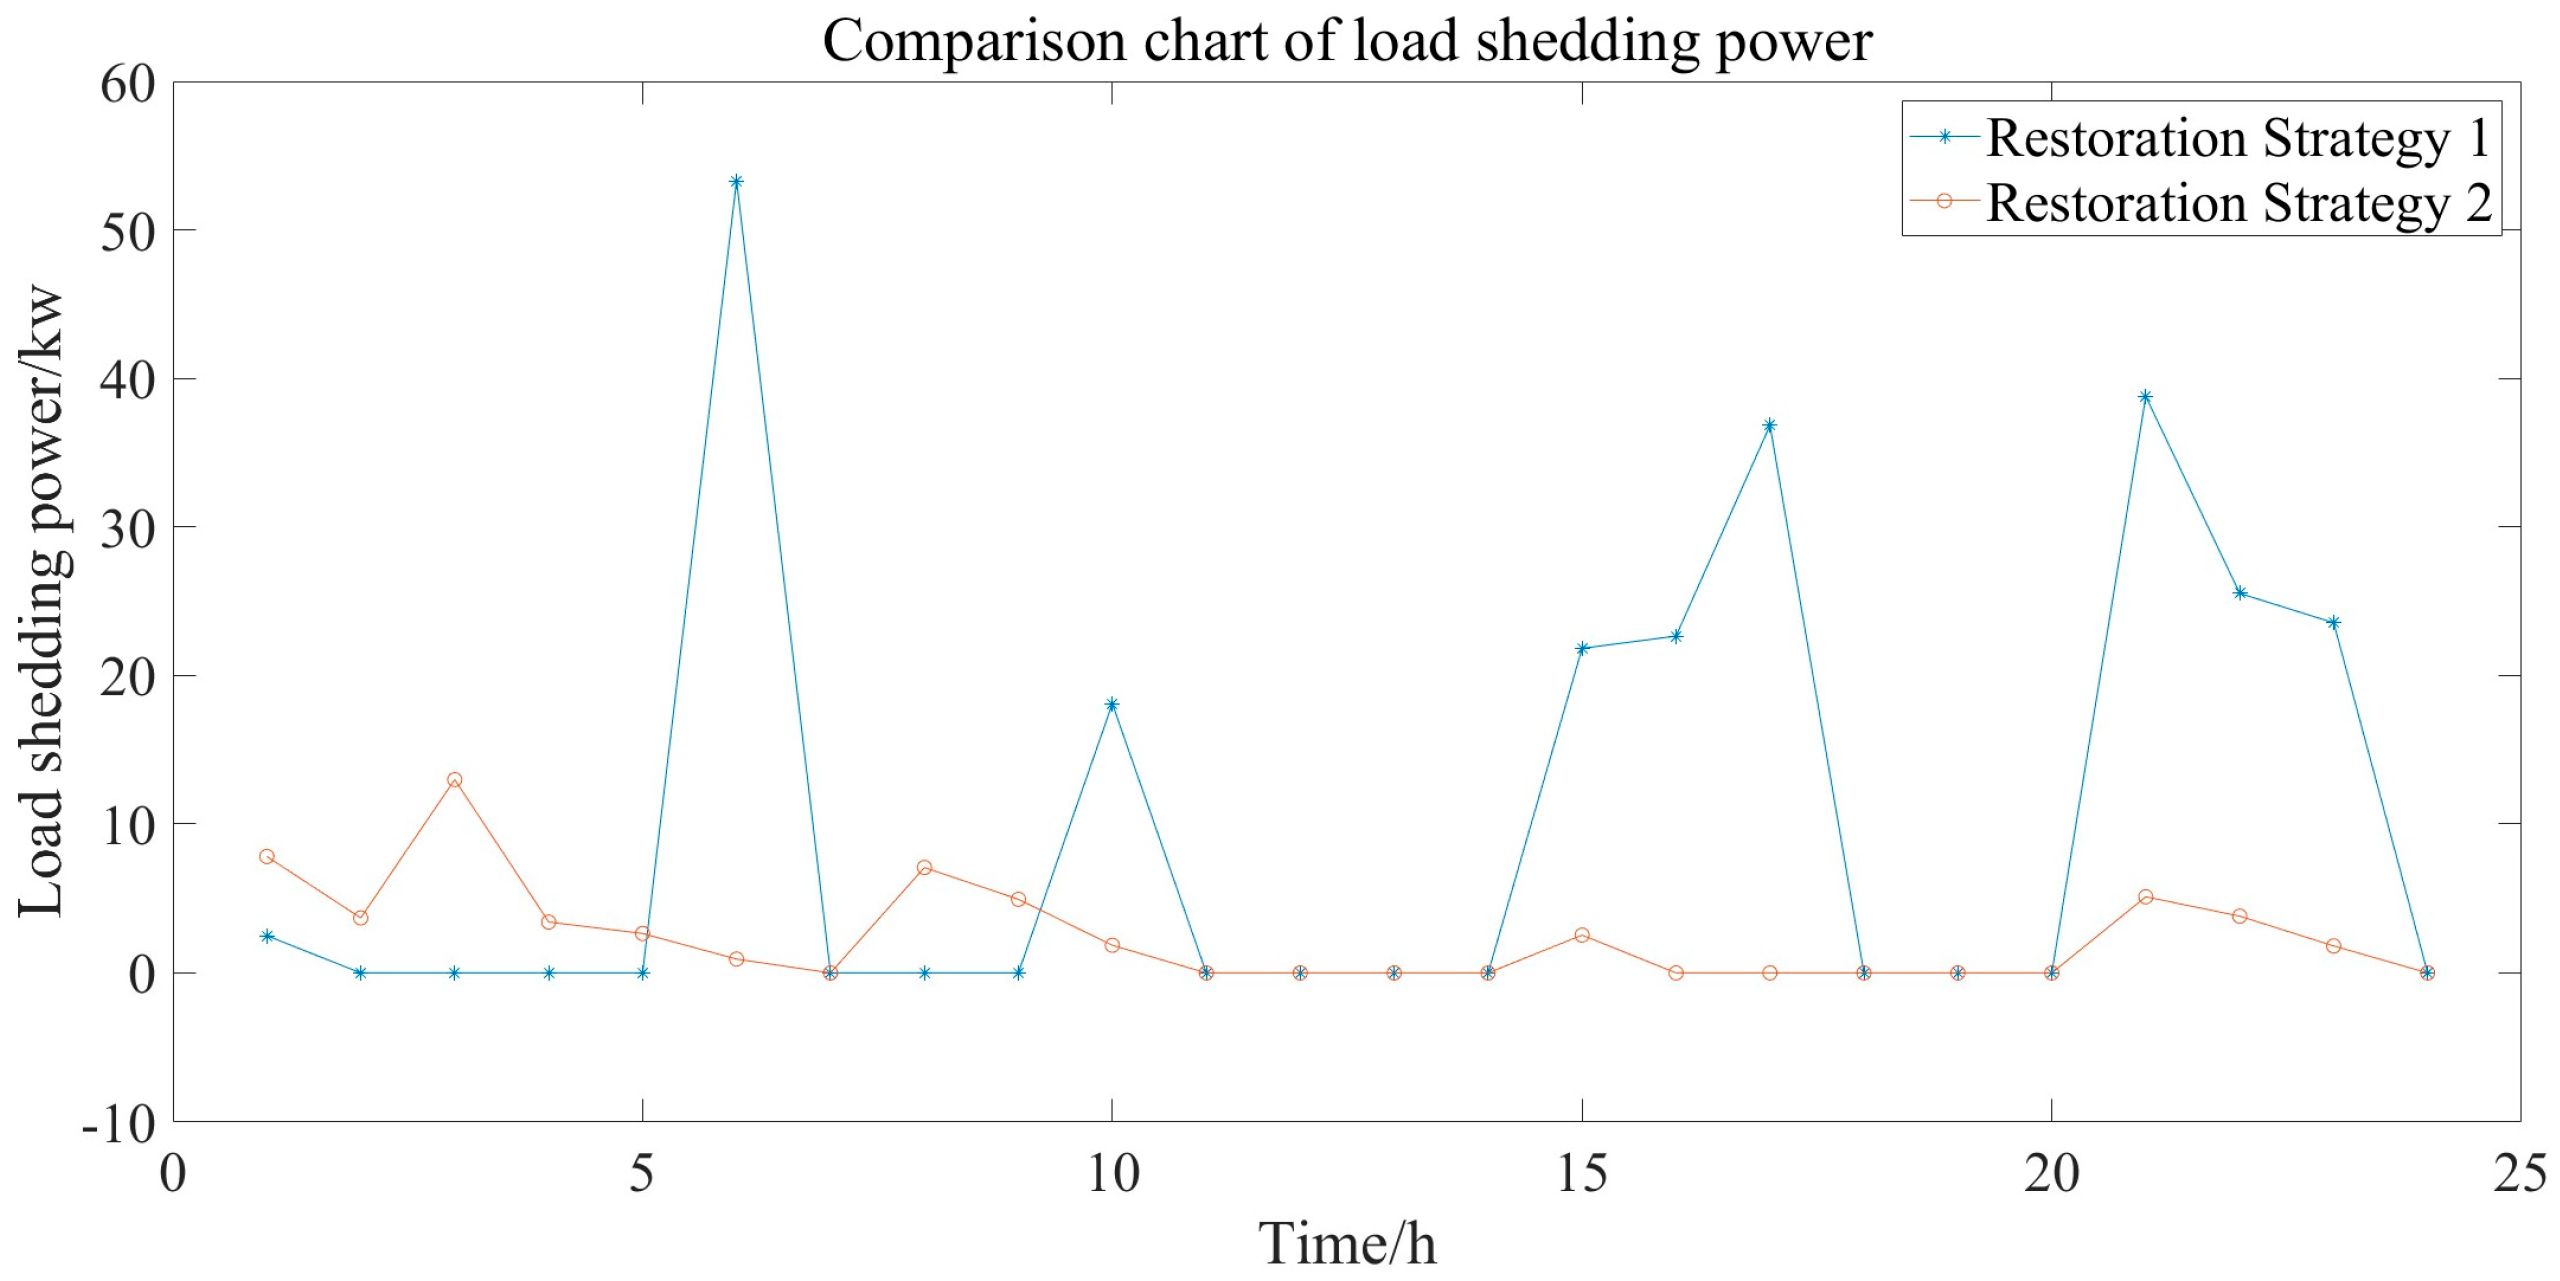
6.2. Comparative Analysis of Power Supply Performance Under Different Strategies

After the power supply, the reconfigured topology is shown in Figure 7.
To analyze the performance of the proposed power supply model, two strategies are employed to solve the OPF problem. These strategies are compared in terms of load shedding and restoration cost. For a fair comparison, all three strategies share the same objective function, which is minimizing restoration cost.
Strategy 1: Power supply is conducted directly after the disaster.
Strategy 2: Power supply is conducted after the disaster using source–load–storage coordination.
Regarding the load shedding, as shown in Figure 8, the x-axis denotes time and the y-axis denotes the load shedding power; curve 1 is the load shedding power curve when using recovery Strategy 1, and curve 2 is the load shedding power curve when using recovery Strategy 2. When Strategy 1 is adopted for direct power supply, a relatively high load shedding is observed. In contrast, the load shedding under Strategy 2 is significantly lower during most time periods, effectively avoiding power outages on the user side. Therefore, it can be used to validate the effectiveness of the power supply model.
As for the restoration cost, compared with Strategy 1, Strategy 2 significantly reduces the cost associated with load shedding. Other costs remain nearly unchanged, resulting in an overall cost reduction of 3.7%. This highlights the significant advantage of source–load–storage coordination in improving restoration efficiency and controlling costs.
In Table 1, Cost 1 is the charging/discharging cost of the energy storage system; Cost 2 is the electricity purchase cost from the upstream grid; Cost 3 is the cost of mobile emergency generators; Cost 4 is the load shedding cost.

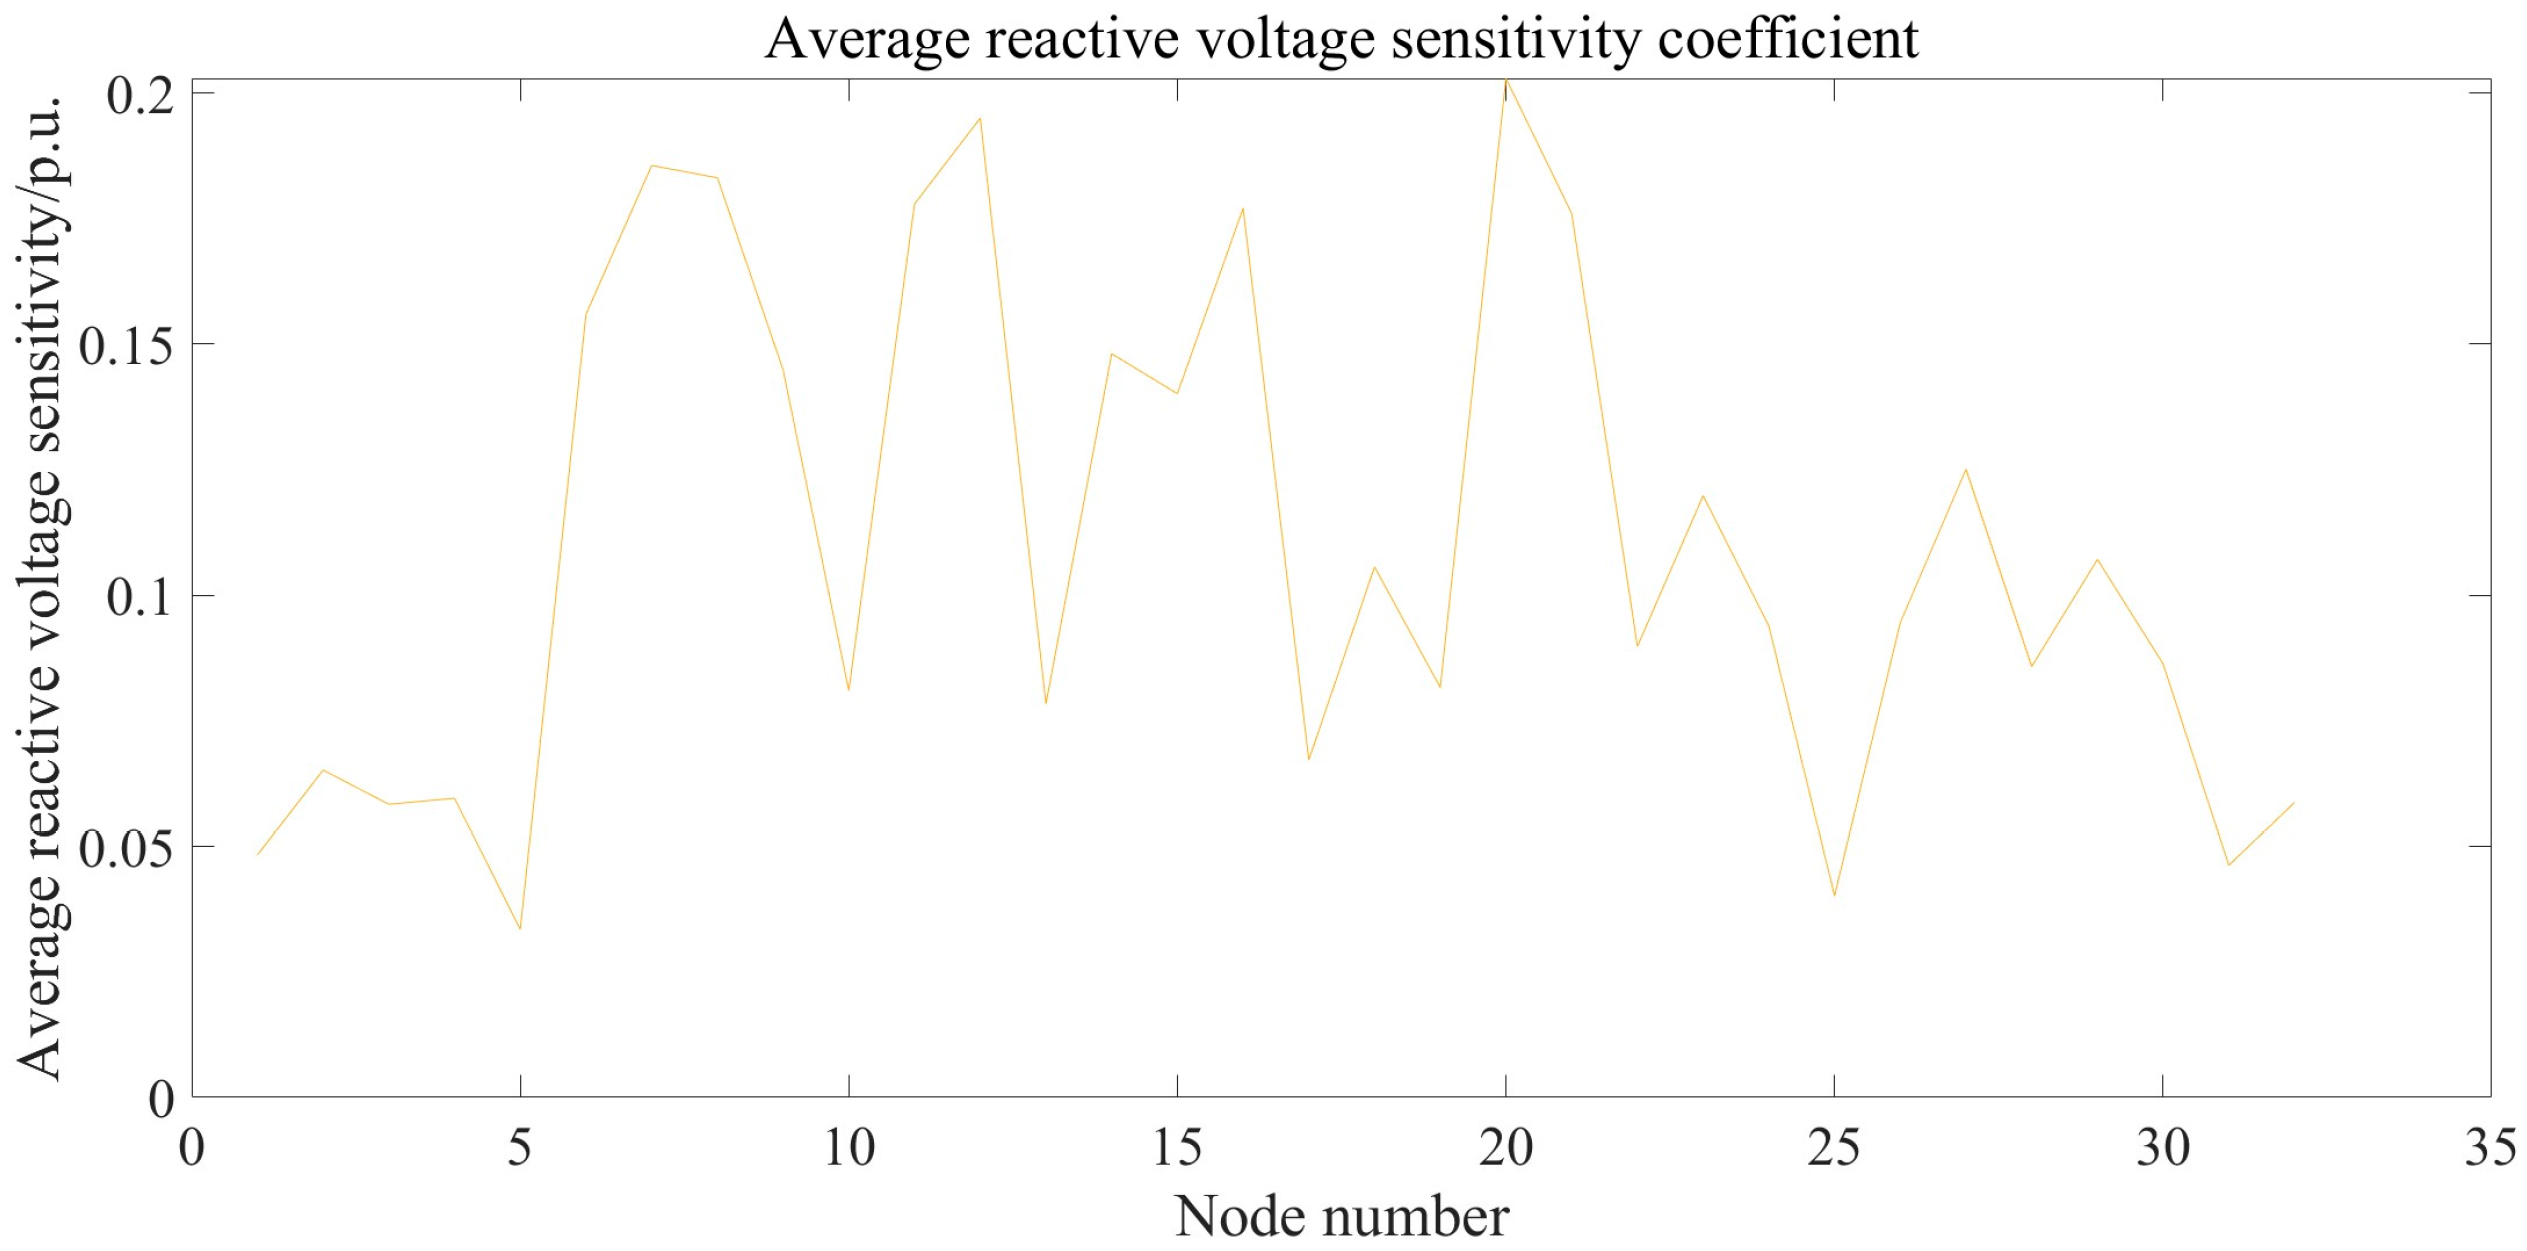
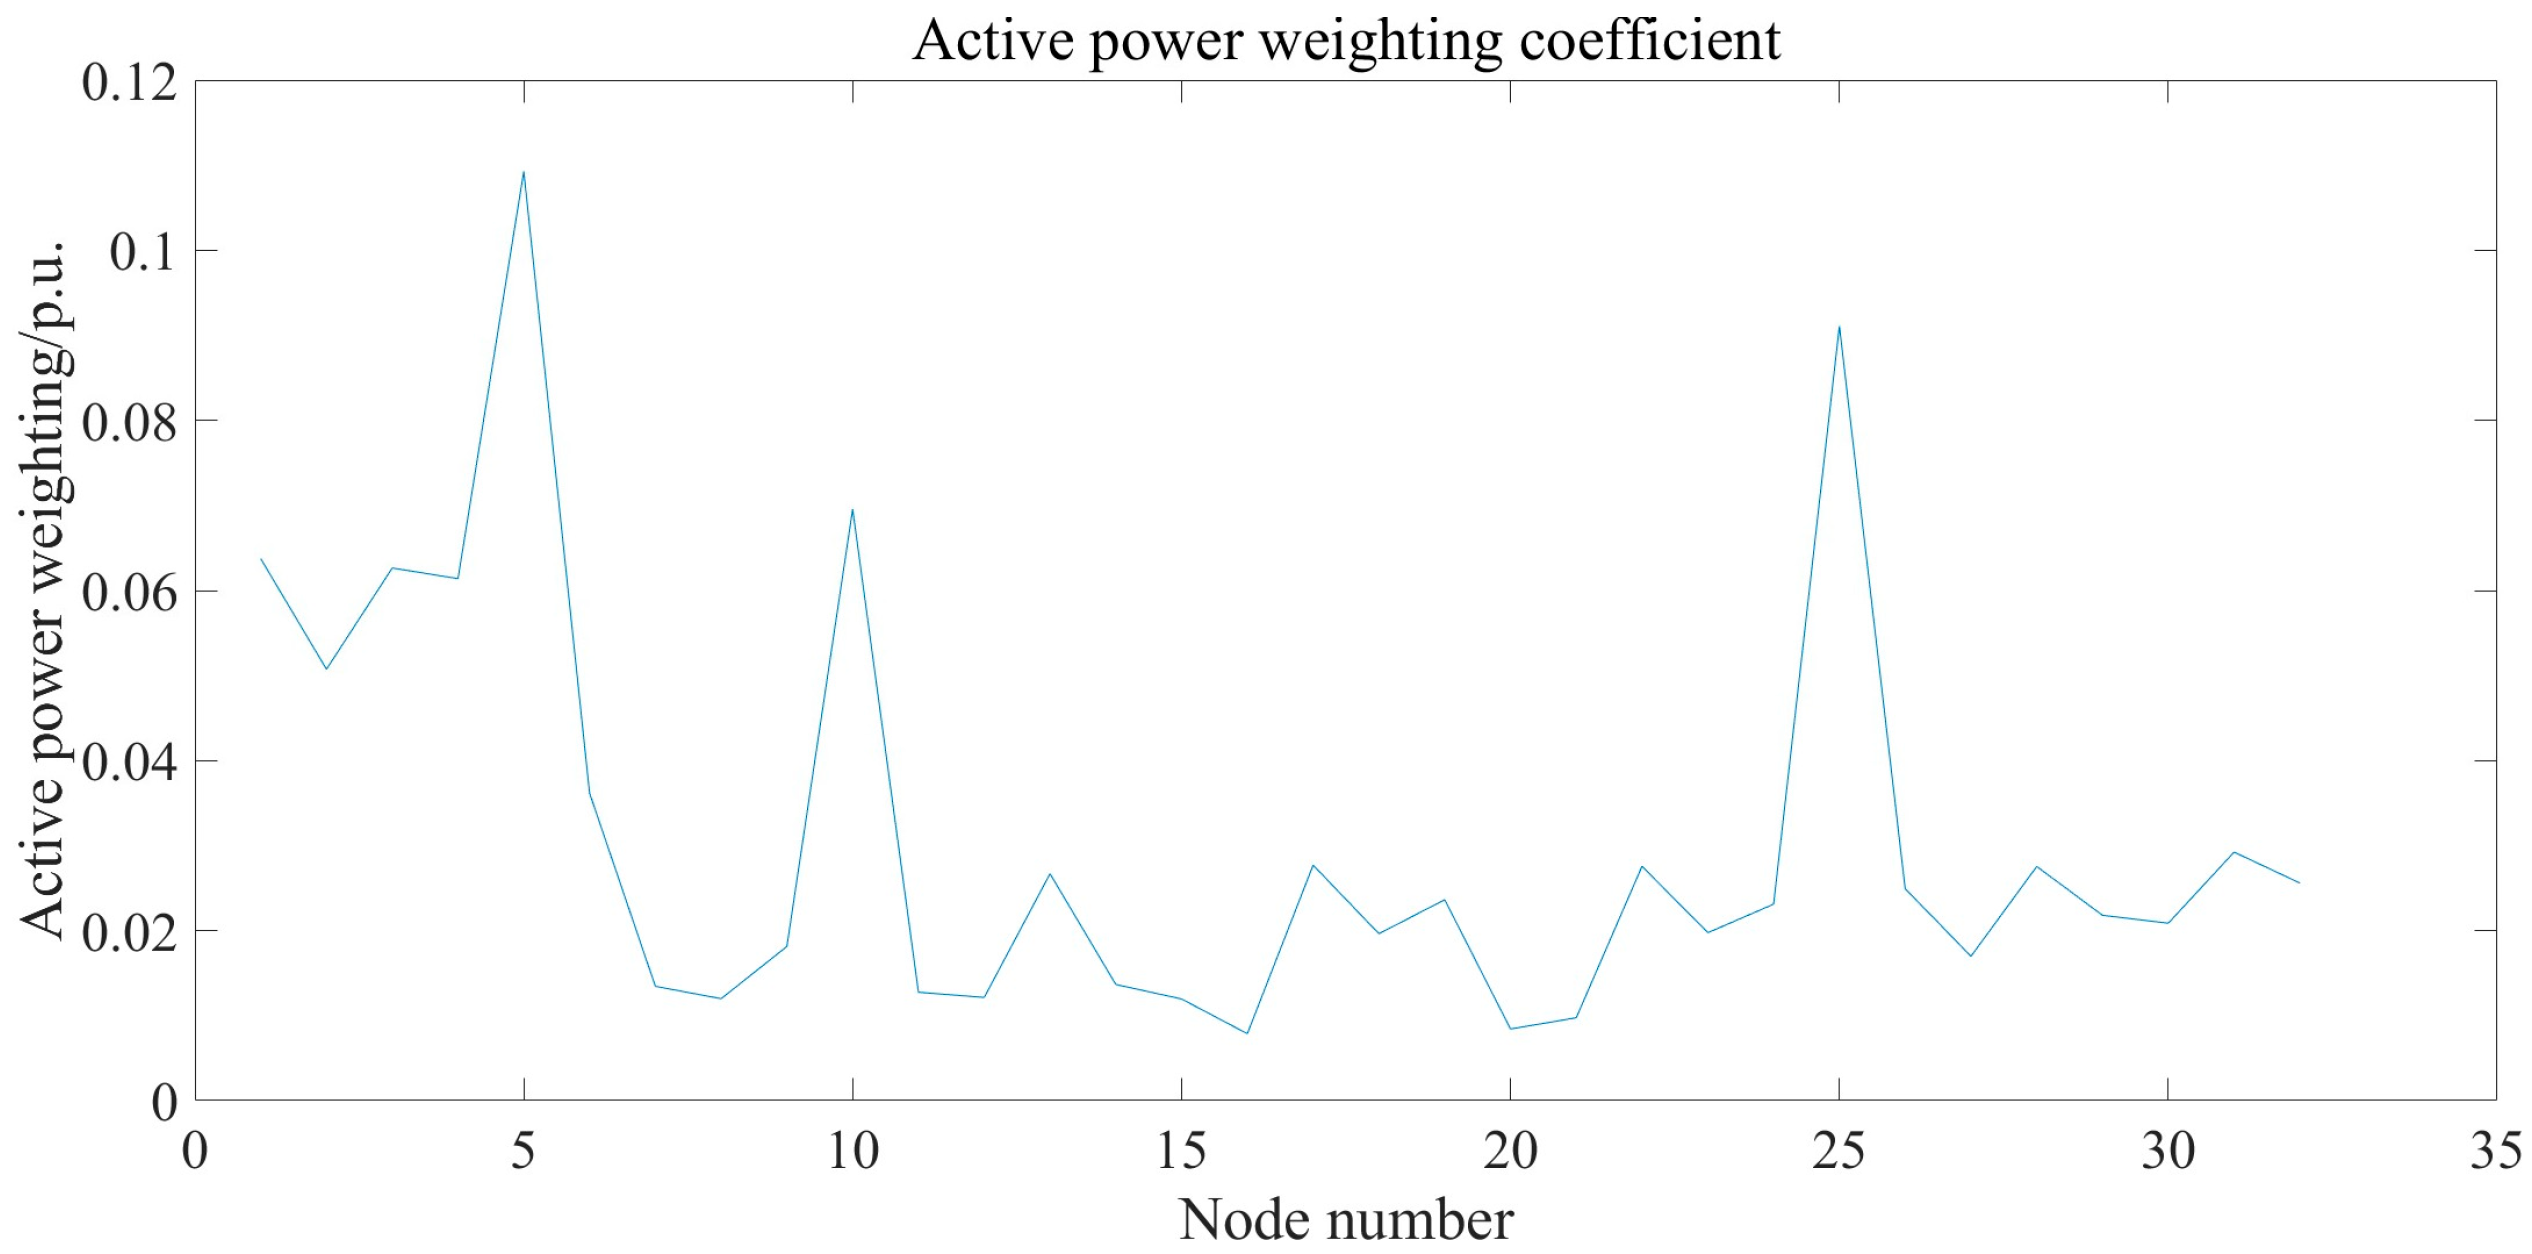
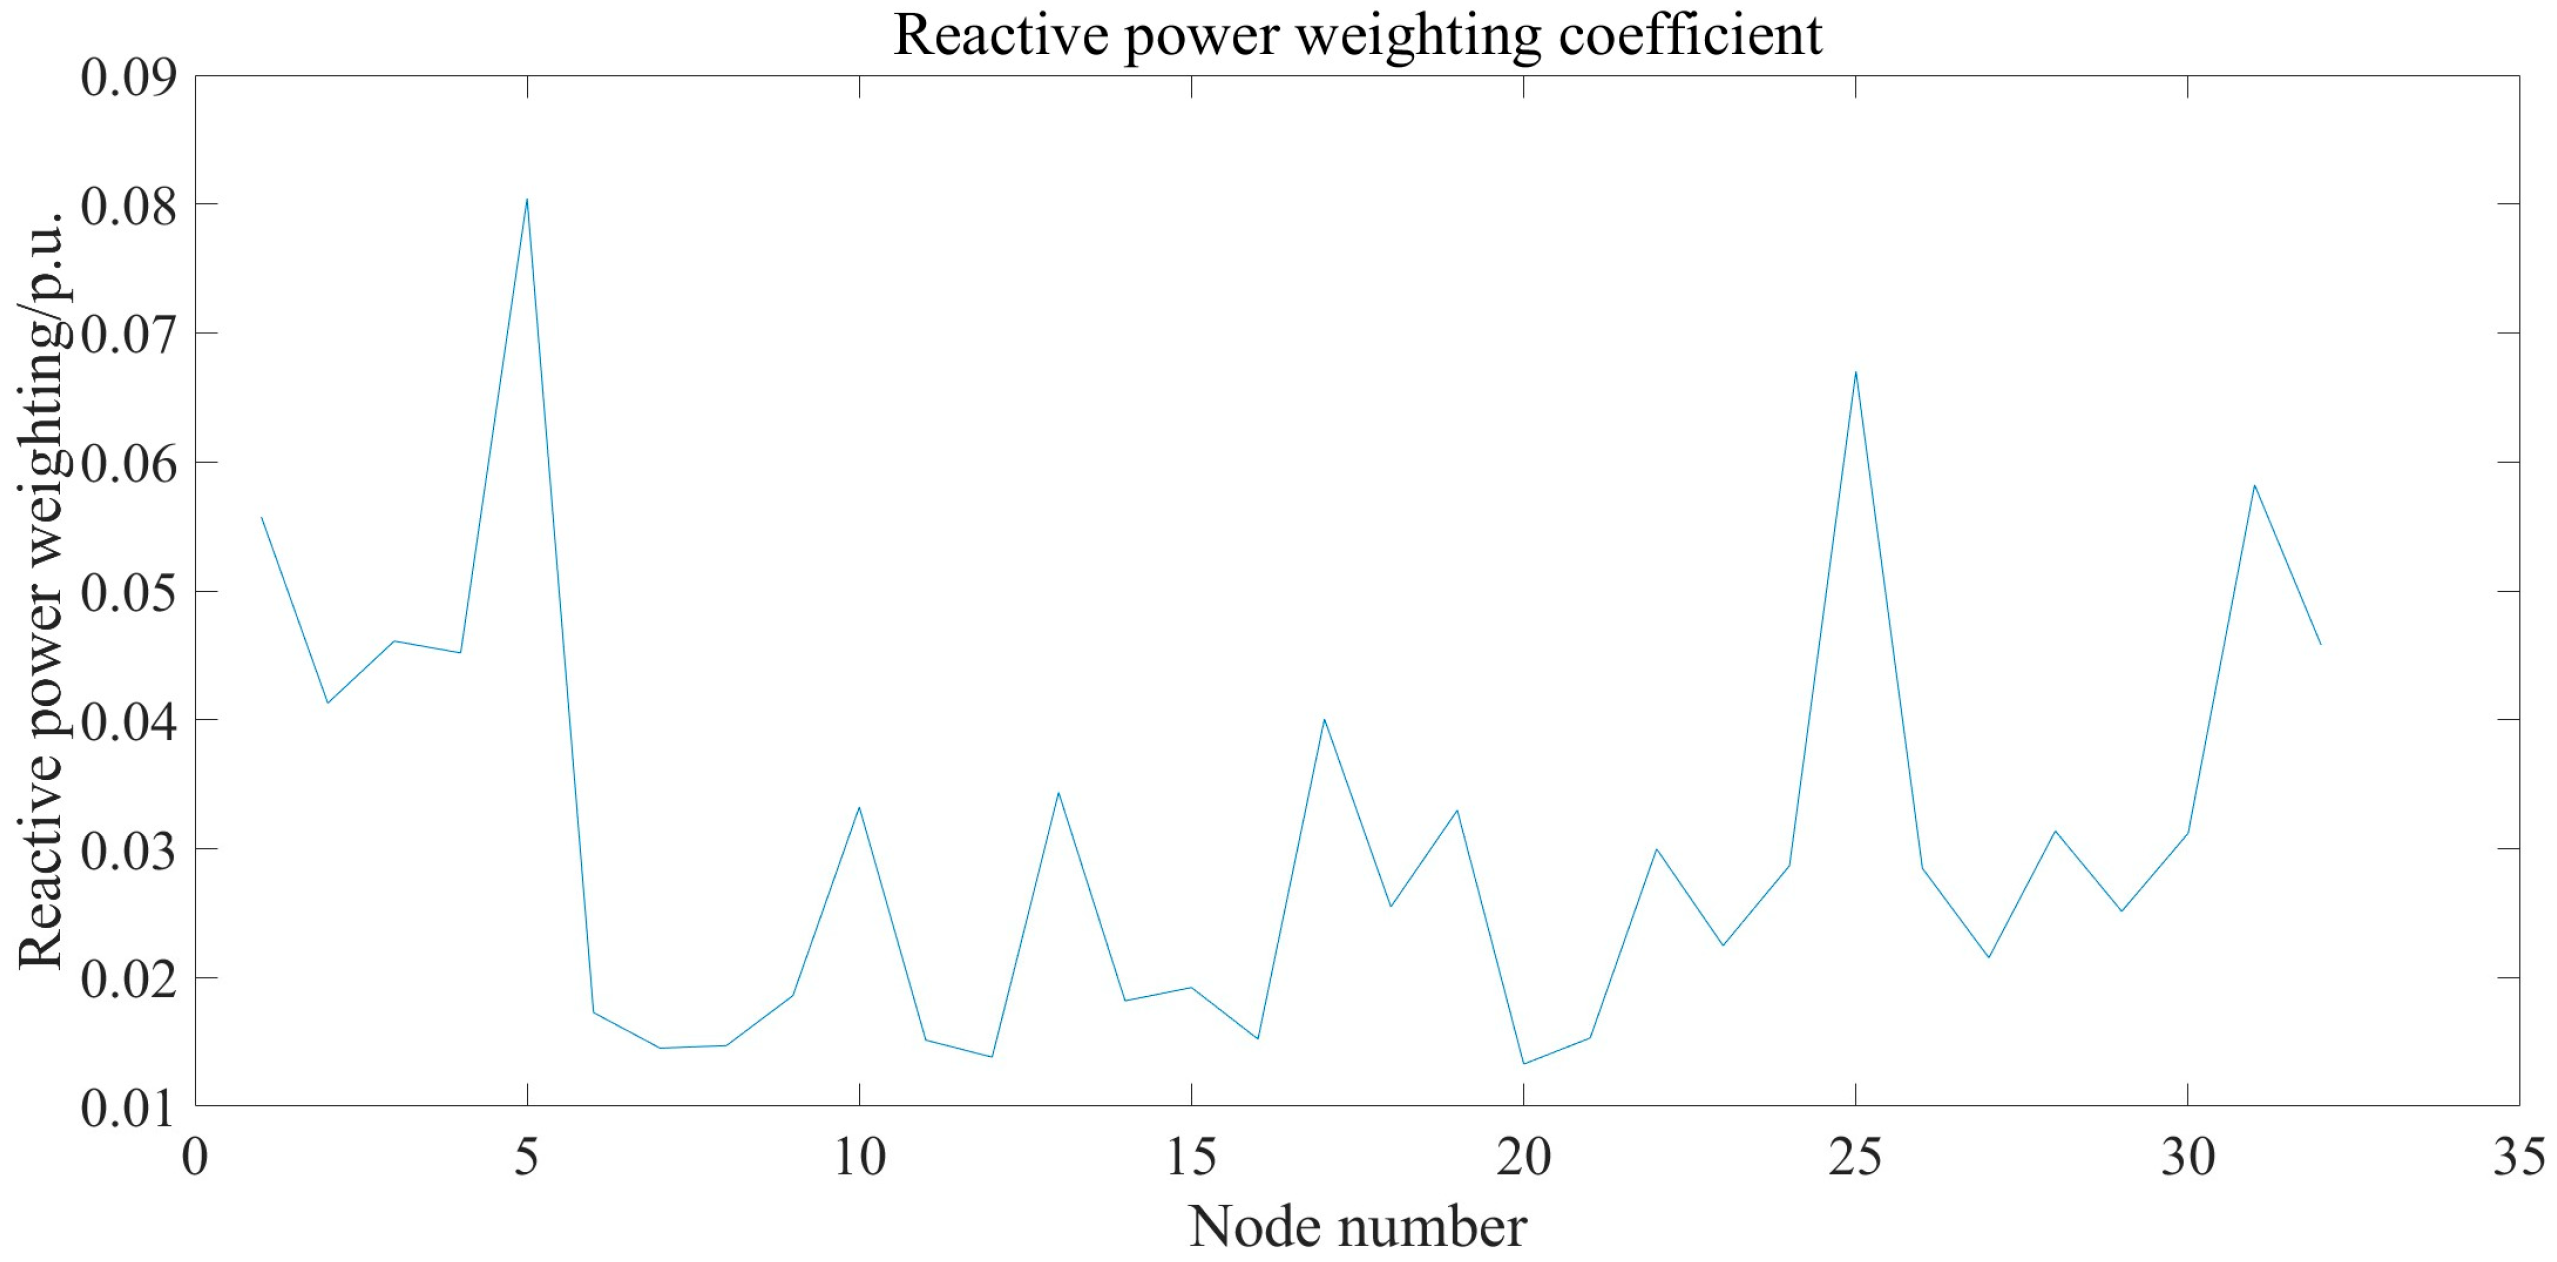
6.3. Determination of Dispatch Priority for Flexible Resources

Based on the reconfigured topology and the power injection of flexible resources, power flow equations are formulated and solved. The convergence threshold ε is set to 0.0001, and convergence is achieved after four iterations. The Jacobi matrix is then inverted and averaged to obtain the average voltage sensitivity coefficients, as shown in Figure 9 and Figure 10. We can observe that nodes 16 and 20 exhibit higher active voltage sensitivity, which is due to the relatively high electrical resistance at these nodes. According to the recent voltage sensitivity estimation method: U I = U 0 P R Q X / U ref , the active voltage sensitivity can be expressed as R/ U ref , which is consistent with the conclusion.
Finally, by taking the reciprocal of the elements in the average voltage sensitivity matrix and normalizing the results, the active power weighting factor w _ Q and reactive power weighting factor w _ P , which characterize the voltage optimization effectiveness of flexible resources at different nodes, are obtained, as shown in Figure 11 and Figure 12.

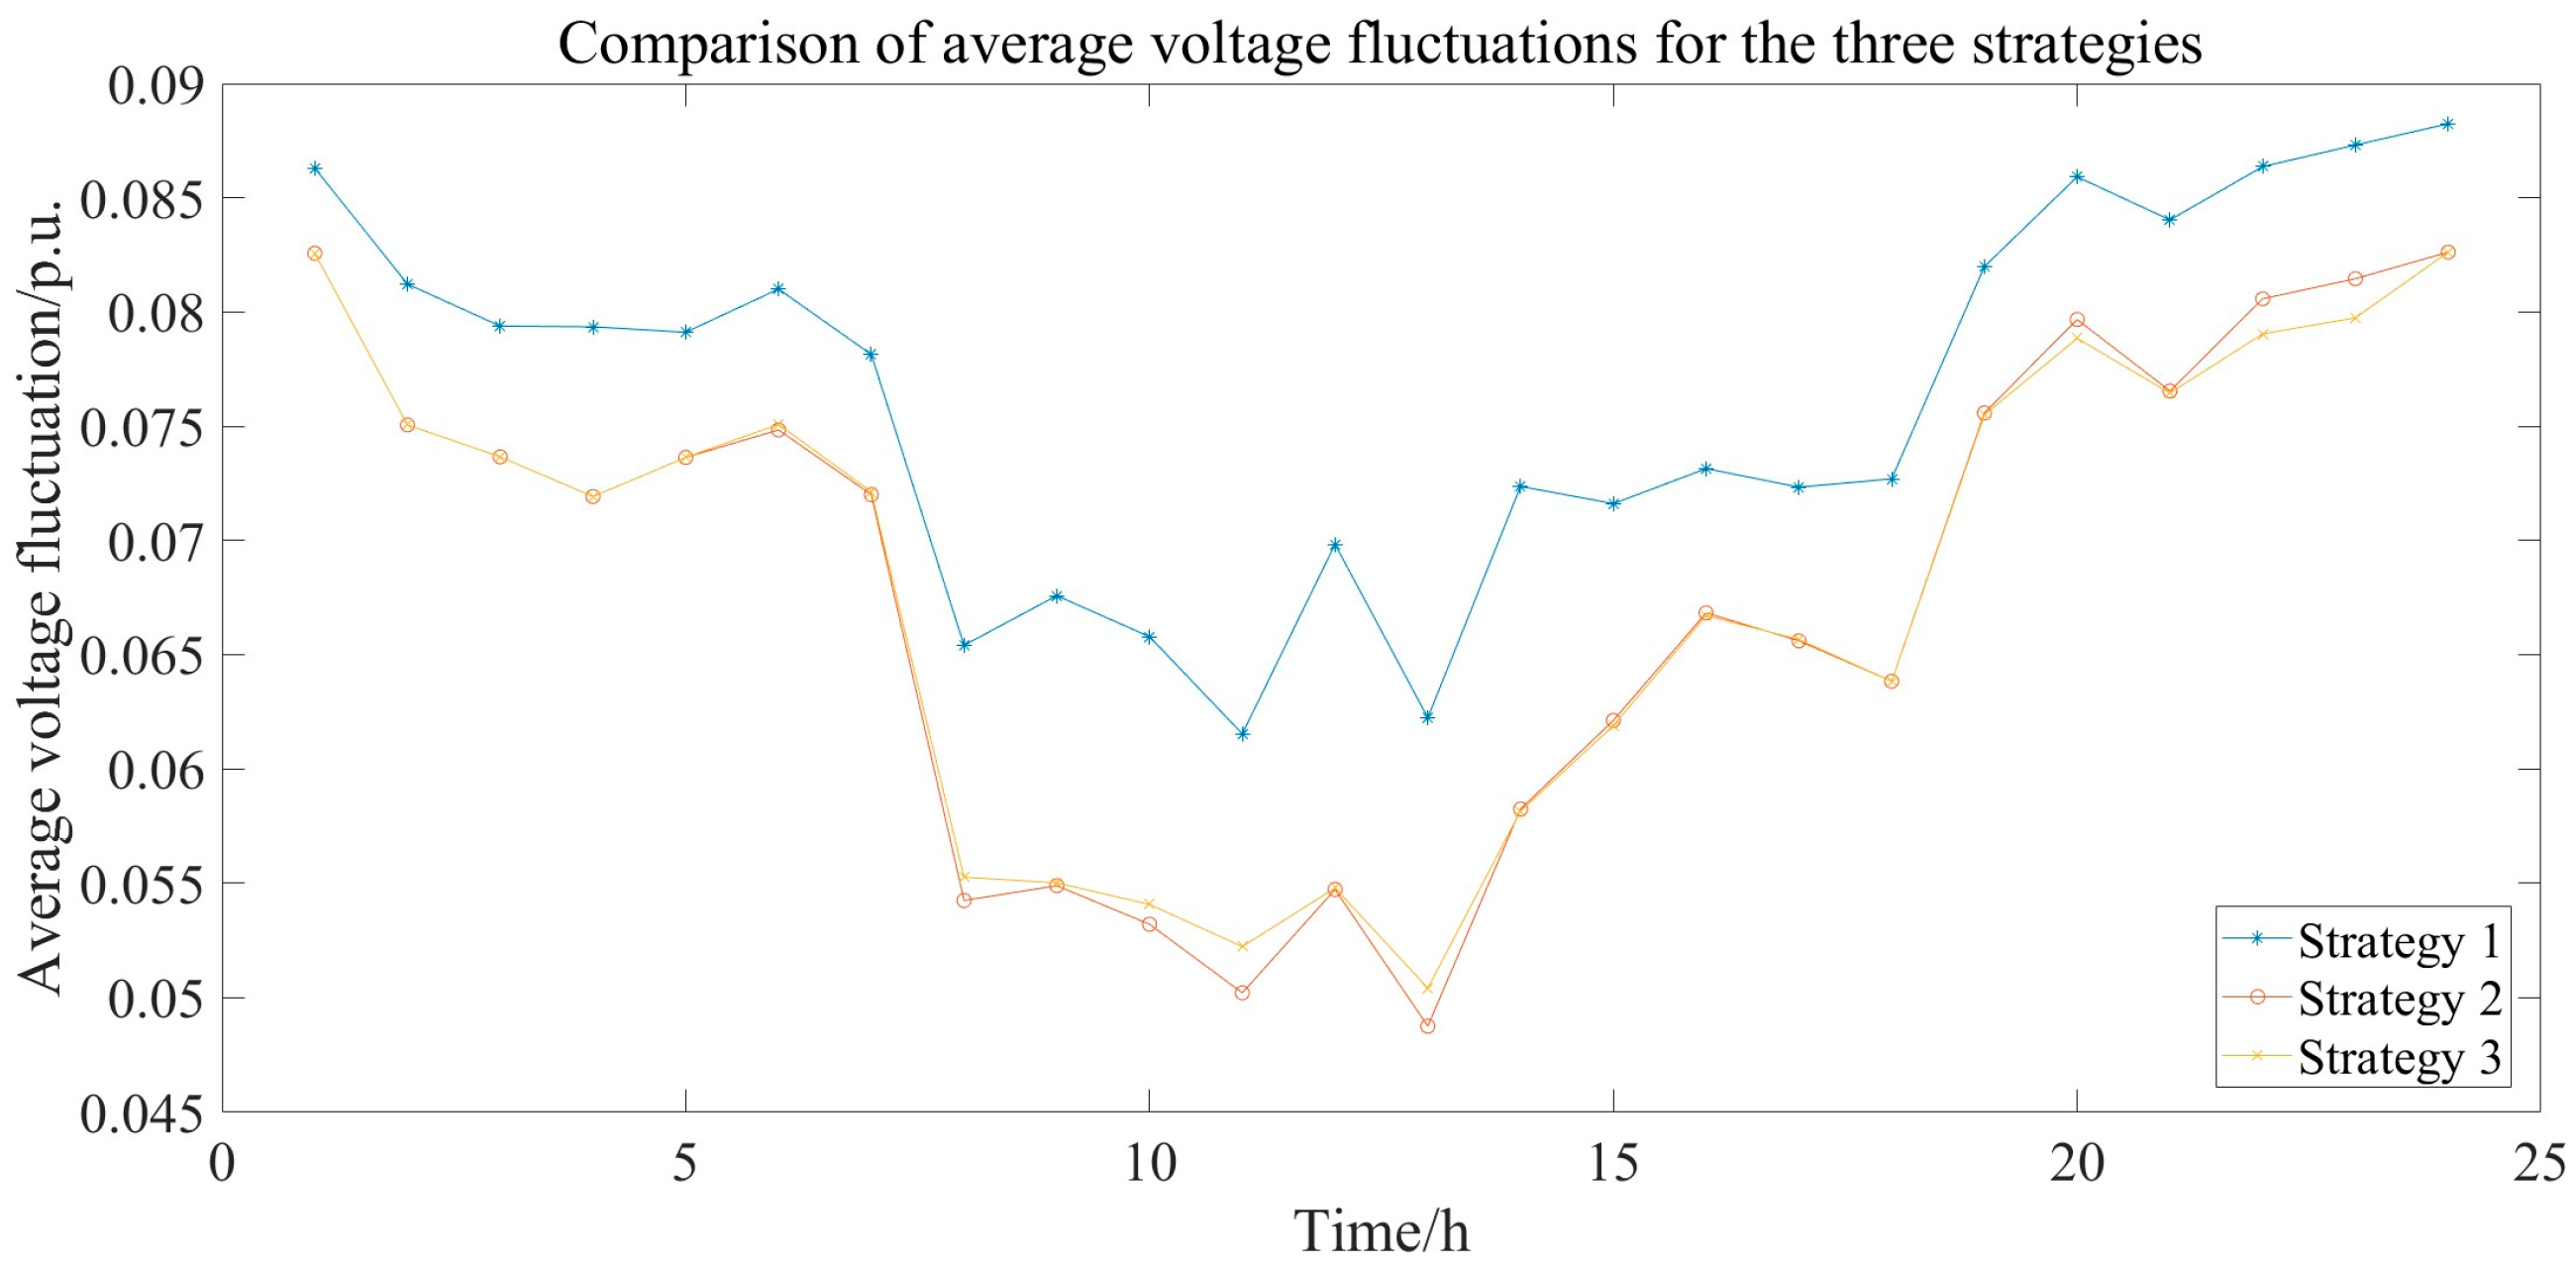
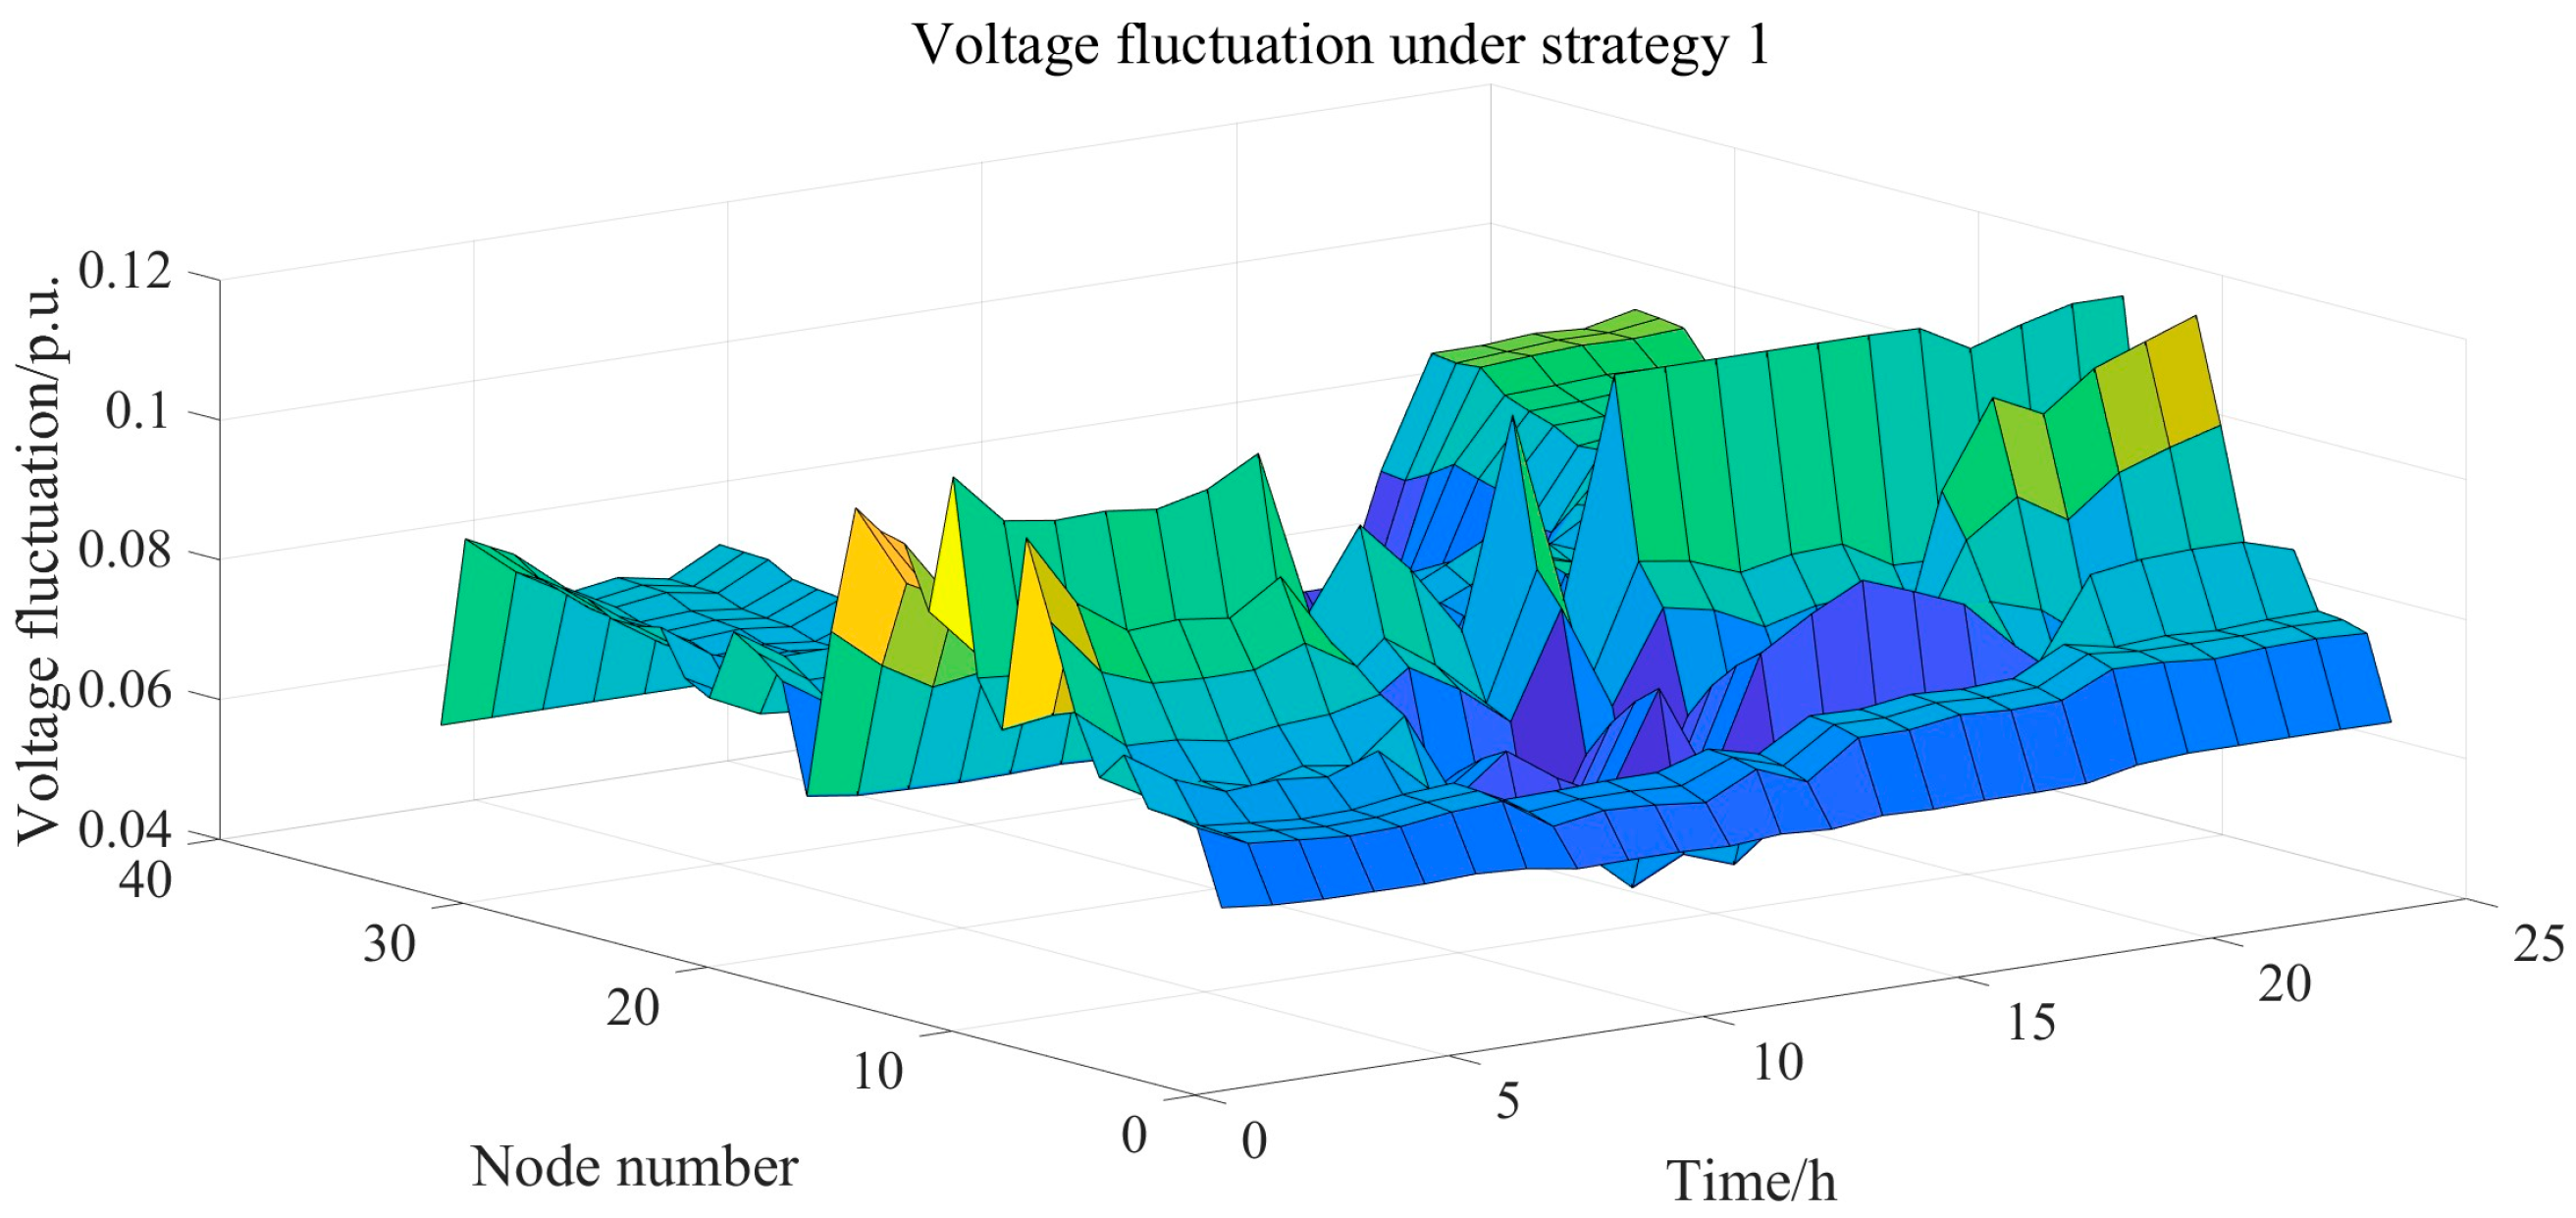
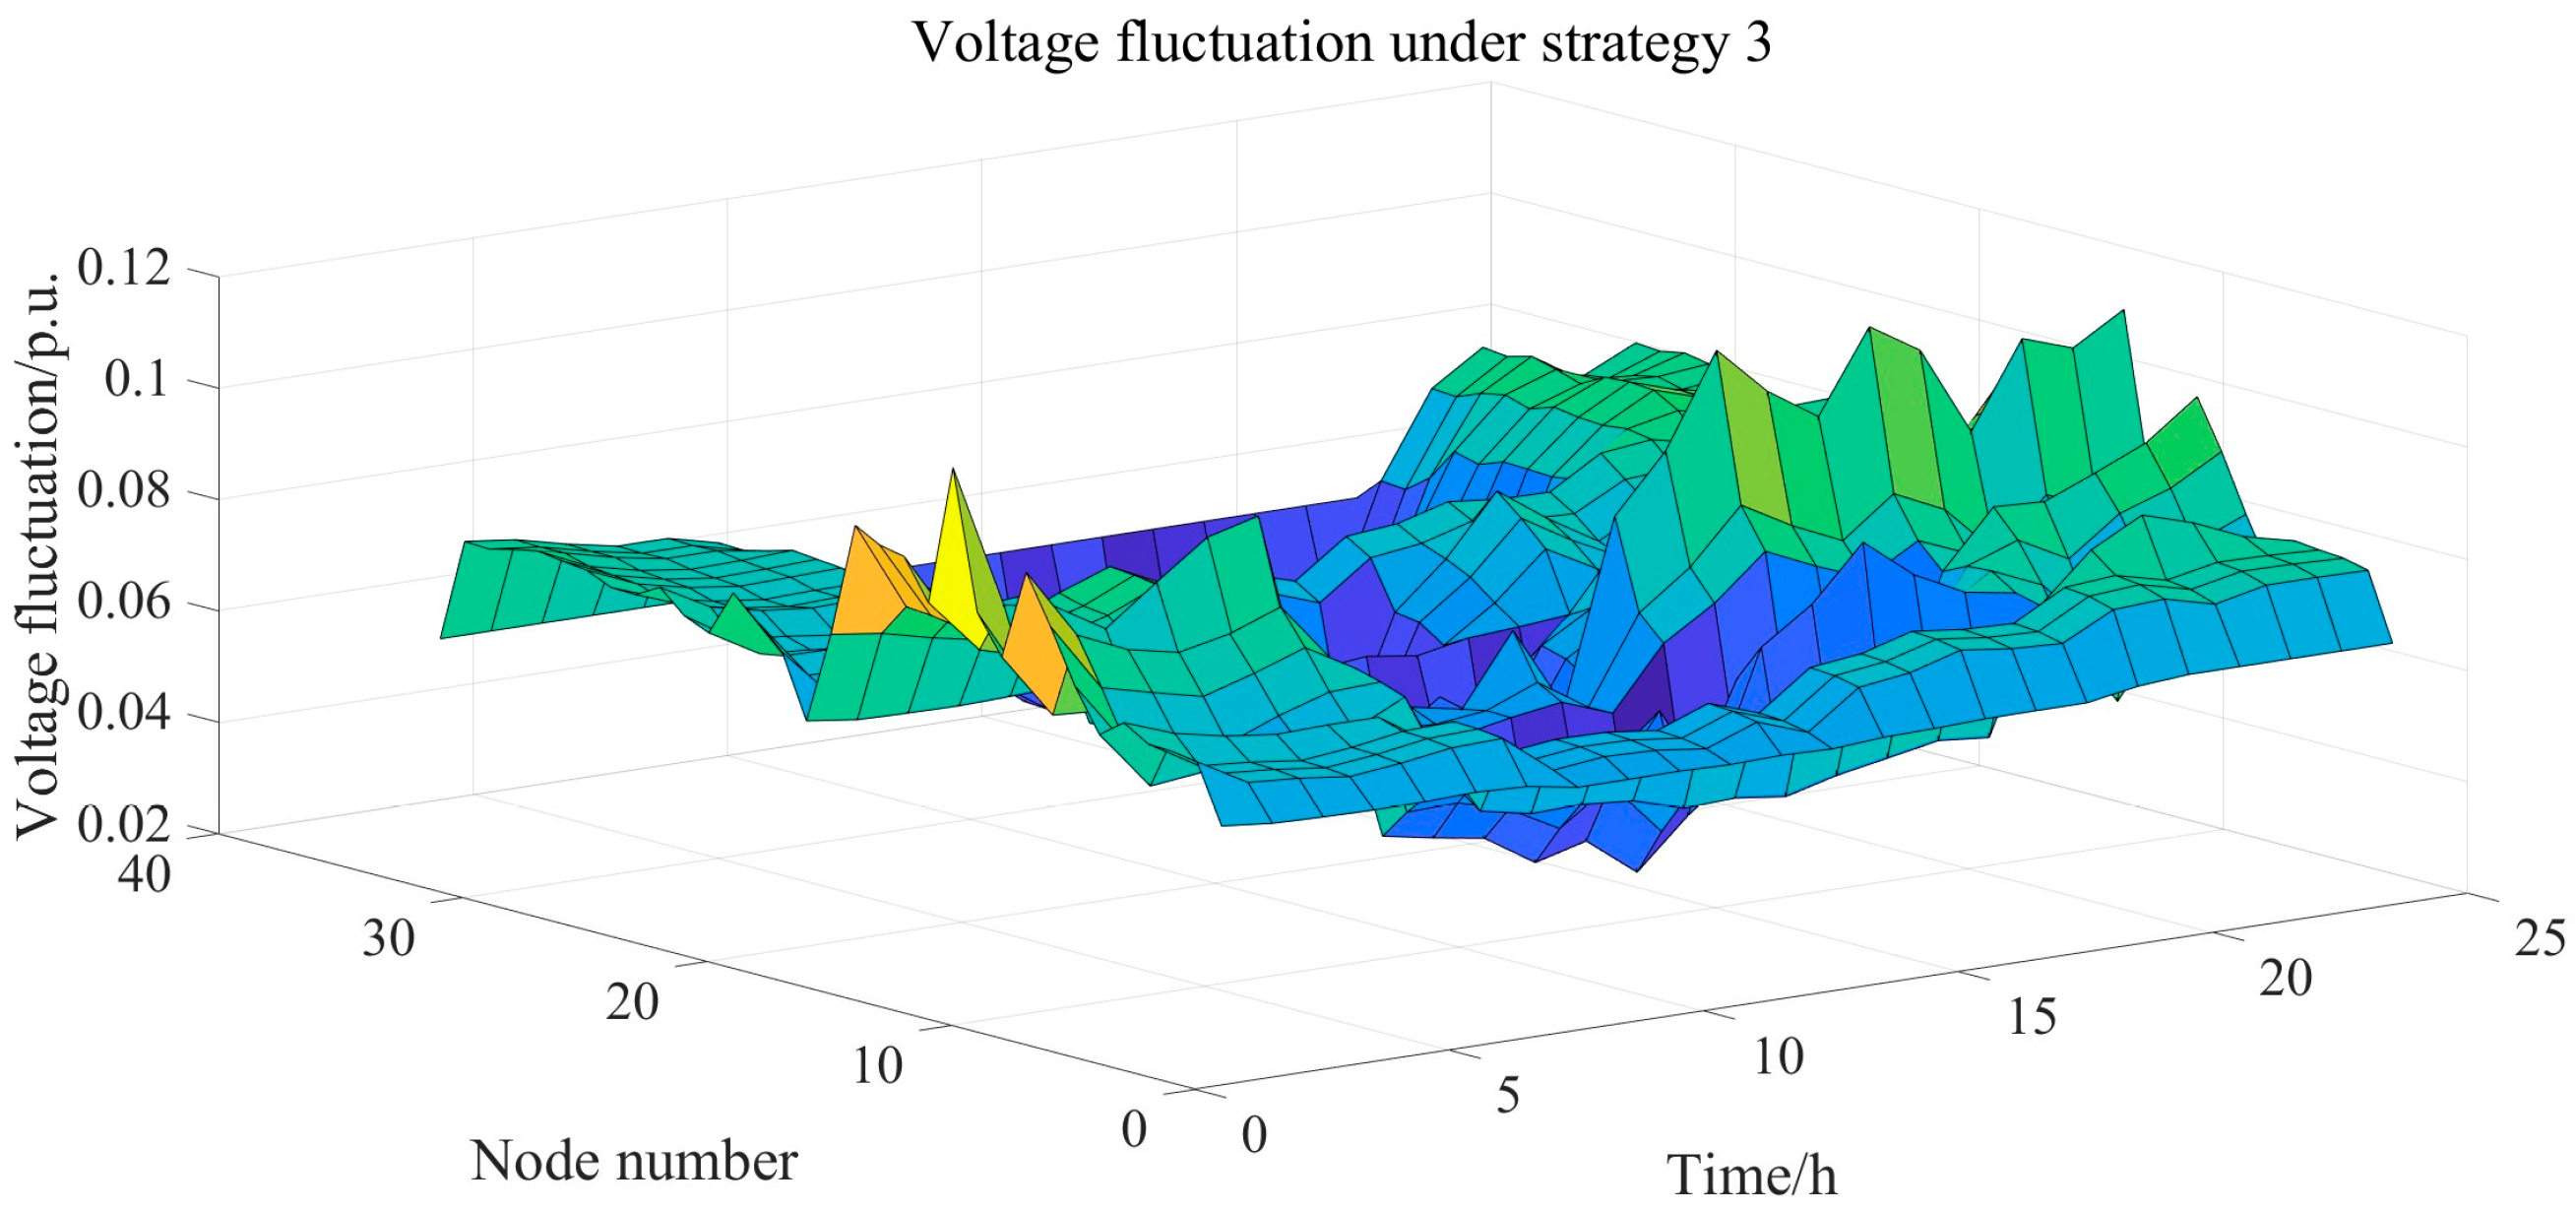
6.4. Comparative Analysis of Voltage Optimization Performance Under Different Strategies

To analyze the performance of the proposed voltage optimization model, three strategies are adopted to solve the OPF problem and compare voltage fluctuations. For a fair comparison, all three strategies share the same objective function: minimizing voltage fluctuations and optimizing cost.
Strategy 1: Only power restoration is performed without voltage optimization [32].
Strategy 2: Based on Strategy 1, voltage optimization is directly carried out.
Strategy 3: Based on Strategy 2, priority coefficients reflecting the voltage regulation capability of resources are introduced to prioritize those with significant optimization effects in voltage regulation.
Regarding voltage fluctuation, Figure 13 shows that under Strategy 1, where only power supply is performed without voltage optimization, the system exhibits relatively large voltage fluctuations across all time periods. In contrast, under Strategies 2 and 3, which include voltage optimization, the overall voltage fluctuation is significantly reduced by 10.92%. Therefore, it can be concluded that utilizing switchable capacitor banks and static var compensators for reactive power compensation significantly reduces voltage fluctuations in the distribution network, effectively improving power quality at the user end and enhancing power system resilience.
Figure 14, Figure 15 and Figure 16, respectively, present the voltage fluctuation curves at 33 nodes over 24 h under the three strategies. By comparison, it is clearly observed that, relative to Strategy 1, the voltage fluctuations at most nodes under Strategy 2 and Strategy 3 are significantly reduced across all time periods. The results indicate that the voltage optimization models are effective on the entire distribution network across all time periods, achieving full-time coverage of the optimization effect.
In terms of optimization cost, as shown in Table 2, under Strategy 1, which only involves power supply, maintaining voltage quality through reactive power interaction with the main grid leads to poor performance and higher cost. Compared with Strategy 1, Strategy 2 incorporates voltage optimization using reactive power compensation devices, effectively reducing the cost. Furthermore, compared with Strategy 2, Strategy 3 introduces voltage sensitivity coefficients to quantify the impact of different flexible resources on voltage regulation, thereby setting dispatch priority and prioritizing the use of resources with more significant voltage optimization effects. On the basis of Strategy 2, Strategy 3 improves optimization efficiency and further reduces the optimization cost. Compared with Strategy 1, the total cost reduction reaches 31.25%, indicating the comprehensive advantages of the proposed method in terms of economic efficiency and control capability.
In Table 2, Cost 1 is the cost of switchable capacitor banks, Cost 2 is the operating cost of static var compensators, Cost 3 is the charging/discharging cost of the energy storage system, Cost 4 is the charging/discharging cost of 5G base stations, Cost 5 is the charging/discharging cost of mobile emergency generators, Cost 6 is the cost of electricity purchased from the upstream power grid, and Cost 7 is the reactive power interaction cost with the upstream power grid.

7. Conclusions

To effectively improve the resilience of power systems and enhance the sustainability of urban development, this paper defines the dispatch priority of resources based on voltage sensitivity coefficients and proposes a two-layer optimization model for post-disaster distribution networks. The model is validated using the IEEE-33 bus test system. The main conclusions are as follows:
  • The proposed two-layer post-disaster optimization model incorporates a voltage regulation stage following power restoration. It enables precise regulation tailored to the voltage quality requirements of critical loads, thereby effectively enhancing system resilience and operational reliability.
  • The voltage optimization model based on voltage sensitivity coefficients demonstrates strong economic performance and adaptability. By prioritizing resources with greater contributions to voltage regulation, the model ensures voltage quality while significantly reducing optimization costs and improving system resilience. It is particularly effective in scenarios with limited reactive power resources.
In future studies, the introduction of reactive resources that may lead to harmonic problems can be discussed in order to further improve the voltage quality. An attempt can also be made to combine the methodology of this paper with a real-time control system to achieve better optimization results. In addition, once further refined, the proposed method has the potential to be integrated into grid dispatch systems to enhance the resilience and reliability of the power system.
Furthermore, this paper addresses operational decisions, service restoration, and voltage optimization, over a short-term (≤24 h) timeframe following extreme events. Economic payback or ROI analysis for investing in devices such as SVCs is a long-term planning problem, requiring investment-level cost models, tariff forecasts, and multi-year horizon simulations, which are not included here. Future work will explore the integration of operational dispatch models with long-term economic assessments to support both immediate recovery and investment planning.

Author Contributions

Conceptualization, Y.Z.; Methodology, J.Z.; Software, J.Z.; Validation, J.Z.; Resources, Y.Z.; Data curation, J.Z.; Writing—original draft, J.Z.; Writing—review & editing, Y.Z.; Visualization, J.Z.; Supervision, Q.W.; Project administration, Q.W.; Funding acquisition, Q.W. All authors have read and agreed to the published version of the manuscript.

Funding

This research received no external funding.

Institutional Review Board Statement

Not applicable.

Informed Consent Statement

Not applicable.

Data Availability Statement

The original contributions presented in this study are included in the article. Further inquiries can be directed to the corresponding author.

Conflicts of Interest

The authors declare no conflict of interest.

References

  1. Lin, X.; Huang, T.; Liu, X.; Bompard, E.F.; Wang, B. A long-term congestion management framework through market zone configuration considering collusive bidding in joint spot markets. IEEE Trans. Power Syst. 2024, 40, 299–313. [Google Scholar] [CrossRef]
  2. Rabiee, A.; Mohseni-Bonab, S.M. Maximizing hosting capacity of renewable energy sources in distribution networks: A multi-objective and scenario-based approach. Energy 2017, 120, 417–430. [Google Scholar] [CrossRef]
  3. Xu, G.; Yu, W.; Griffith, D.; Golmie, N.; Moulema, P. Towards integrating distributed energy resources and storage devices in smart grid. IEEE Internet Things J. 2016, 4, 192–204. [Google Scholar] [CrossRef]
  4. Lin, X.; Zheng, Y.; Xiang, Z.; Wang, B. Optimal market-based battery energy storage system capacity sizing: Considering stra-tegic behavior of collusions in the electricity day-ahead market. J. Energy Storage 2025, 120, 116309. [Google Scholar] [CrossRef]
  5. Vahedi, S.; Zhao, J.; Pierre, B.; Lei, F.; Anagnostou, E.; He, K.; Jones, C.; Wang, B. Wildfire and power grid nexus in a changing climate. Nat. Rev. Electr. Eng. 2025, 2, 225–243. [Google Scholar] [CrossRef]
  6. Lopez, J.; Rubio, J.E.; Alcaraz, C. A resilient architecture for the smart grid. IEEE Trans. Ind. Inform. 2018, 14, 3745–3753. [Google Scholar] [CrossRef]
  7. Chen, C.; Wang, J.; Ton, D. Modernizing distribution system restoration to achieve grid resiliency against extreme weather events: An integrated solution. Proc. IEEE 2017, 105, 1267–1288. [Google Scholar] [CrossRef]
  8. Muhs, J.W.; Parvania, M.; Shahidehpour, M. Wildfire risk mitigation: A paradigm shift in power systems planning and operation. IEEE Open Access J. Power Energy 2020, 7, 366–375. [Google Scholar] [CrossRef]
  9. Sharma, P.; Saurav, S.; Singh, S. Object detection in power line infrastructure: A review of the challenges and solutions. Eng. Appl. Artif. Intell. 2023, 130, 107781. [Google Scholar] [CrossRef]
  10. Sun, C.; Huang, Z.; Wang, B.; Xiao, M.; Leng, J.; Li, J. SCE-LIO: An Enhanced LIDAR Inertial Odometry by Constructing Submap Constraints. IEEE Robot. Autom. Lett. 2024, 9, 10295–10302. [Google Scholar] [CrossRef]
  11. Wanik, D.; Parent, J.; Anagnostou, E.; Hartman, B. Using vegetation management and LiDAR-derived tree height data to improve outage predictions for electric utilities. Electr. Power Syst. Res. 2017, 146, 236–245. [Google Scholar] [CrossRef]
  12. Wei, R.; Yang, D.; Zhang, L.; Huang, Y.; Zhou, E.; Wang, T. An early warning model for damage of power grid under typhoon disaster. In Proceedings of the 2019 IEEE 3rd Conference on Energy Internet and Energy System Integration (EI2), Changsha, China, 8–10 November 2019; IEEE: Piscataway, NJ, USA, 2019. [Google Scholar]
  13. De La Cruz, J.; Gómez-Luna, E.; Ali, M.; Vasquez, J.C.; Guerrero, J.M. Fault location for distribution smart grids: Literature overview, challenges, solutions, and future trends. Energies 2023, 16, 2280. [Google Scholar] [CrossRef]
  14. Pahwa, S.; Scoglio, C.; Das, S.; Schulz, N. Load-shedding strategies for preventing cascading failures in power grid. Electr. Power Compon. Syst. 2013, 41, 879–895. [Google Scholar] [CrossRef]
  15. Stasinos, E.-I.E.; Trakas, D.N.; Hatziargyriou, N.D. Microgrids for power system resilience enhancement. iEnergy 2022, 1, 158–169. [Google Scholar] [CrossRef]
  16. Vita, V.; Fotis, G.; Pavlatos, C.; Mladenov, V. A new restoration strategy in microgrids after a blackout with priority in critical loads. Sustainability 2023, 15, 1974. [Google Scholar] [CrossRef]
  17. Lei, S.; Wang, J.; Chen, C.; Hou, Y. Mobile Emergency generator pre-positioning and real-time allocation for resilient response to natural disasters. IEEE Trans. Smart Grid 2016, 9, 2030–2041. [Google Scholar] [CrossRef]
  18. Kahouli, O.; Alsaif, H.; Bouteraa, Y.; Ben Ali, N.; Chaabene, M. Power system reconfiguration in distribution network for improving reliability using genetic algorithm and particle swarm optimization. Appl. Sci. 2021, 11, 3092. [Google Scholar] [CrossRef]
  19. Fenton, J. Developing Community Resilience to Wildfire Through Emergency Response Management. Ph.D. Thesis, North-Central University, Minneapolis, MN, USA, 2021. [Google Scholar]
  20. Luo, C.; Wu, H.; Zhou, Y.; Qiao, Y.; Cai, M. Network partition-based hierarchical decentralised voltage control for distribution networks with distributed PV systems. Int. J. Electr. Power Energy Syst. 2021, 130, 106929. [Google Scholar] [CrossRef]
  21. Fan, H.; Yu, Z.; Xia, S.; Li, X. Review on coordinated planning of source-network-load-storage for integrated energy systems. Front. Energy Res. 2021, 9, 641158. [Google Scholar] [CrossRef]
  22. Wang, F.; Zhou, L.; Ren, H.; Liu, X.; Shafie-khah, M.; Catalão, J.P.S. Multi-objective optimization model of source-load-storage synergetic dispatch for building energy system based on TOU price demand response. IEEE Trans. Ind. Appl. 2017, 54, 1017–1028. [Google Scholar] [CrossRef]
  23. Xiyong, Y.; Zhang, Y.; Gang, L.; Zhang, Y.; Yunzhan, A.N.; Haotian, Y. Multi-time scale collaborative optimal scheduling strategy for source-load-storage considering de-mand response. Power Gener. Technol. 2023, 44, 253. [Google Scholar]
  24. Huang, Y.; Huang, W.; Huang, T.; Li, C.; Li, R.; Tai, N.; Bompard, E.F. Multiobjective Multistage Distributionally Robust Flexibility Enhancement for Seaport Logistic-Energy Coordination. IEEE Trans. Transp. Electrif. 2024, 11, 693–709. [Google Scholar] [CrossRef]
  25. Zhou, L.; Wang, H.; Jiang, J.; Yang, B.; Shao, Y.; Gan, W.; Feng, X.; Huang, H. Multi-Target Programming Method for Active Distribution Network Considering the Multiple Collaborative Interaction Effect. J. Phys. Conf. Ser. 2022, 2360, 012028. [Google Scholar] [CrossRef]
  26. Garcia, P.; Pereira, J.; Carneiro, S.; da Costa, V.; Martins, N. Three-phase power flow calculations using the current injection method. IEEE Trans. Power Syst. 2000, 15, 508–514. [Google Scholar] [CrossRef]
  27. Tinney, W.F.; Hart, C.E. Power flow solution by Newton’s method. IEEE Trans. Power Appar. Syst. 1967, 11, 1449–1460. [Google Scholar] [CrossRef]
  28. Tao, Q.; Wang, D.; Yang, B.; Liu, H.; Yan, S. Voltage control of distribution network with distributed generation based on voltage sensitivity matrix. In Proceedings of the 2018 IEEE International Conference on Energy Internet (ICEI), Beijing, China, 21–25 May 2018; pp. 298–302. [Google Scholar]
  29. Burer, S.; Letchford, A.N. Non-convex mixed-integer nonlinear programming: A survey. Surv. Oper. Res. Manag. Sci. 2012, 17, 97–106. [Google Scholar] [CrossRef]
  30. Huang, Y.; Huang, W.; Li, R.; Huang, T.; Li, C.; Tai, N. An Adaptive MARL Large model for dispatch strategy generation in logistics-energy spatiotemporal coordination of container seaports. IEEE Trans. Smart Grid 2025, 16, 2261–2277. [Google Scholar] [CrossRef]
  31. Zhou, Y.; Wang, Q.; Zou, Y.; Chi, Y.; Zhou, N.; Zhang, X.; Li, C.; Xia, Q. Voltage profile optimization of active distribution networks considering dispatchable capacity of 5G base station backup batteries. J. Mod. Power Syst. Clean Energy 2023, 11, 1842–1856. [Google Scholar] [CrossRef]
  32. Taheri, B.; Safdarian, A.; Moeini-Aghtaie, M.; Lehtonen, M. Distribution system resilience enhancement via mobile emergency generators. IEEE Trans. Power Deliv. 2020, 36, 2308–2319. [Google Scholar] [CrossRef]
Figure 1. Optimal dispatch scenario of distribution network.
Sustainability 17 06110 g001
Figure 2. Optimization framework for distribution network dispatch.
Sustainability 17 06110 g002
Figure 3. Example of radial network topology constraints.
Sustainability 17 06110 g003
Figure 4. Weighting coefficients solution process.
Sustainability 17 06110 g004
Figure 5. Solution process.
Sustainability 17 06110 g005
Figure 6. The initial topology of IEEE-33 bus test system.
Sustainability 17 06110 g006
Figure 7. The reconfigured topology of IEEE-33 bus test system.
Sustainability 17 06110 g007
Figure 8. Comparison chart of load shedding power.
Sustainability 17 06110 g008
Figure 9. Average active voltage sensitivity coefficient.
Sustainability 17 06110 g009
Figure 10. Average reactive voltage sensitivity coefficient.
Sustainability 17 06110 g010
Figure 11. Active power weighting coefficient.
Sustainability 17 06110 g011
Figure 12. Reactive power weighting coefficient.
Sustainability 17 06110 g012
Figure 13. Average voltage fluctuation of the distribution network over 24 time periods.
Sustainability 17 06110 g013
Figure 14. Voltage fluctuation curves at 33 nodes over 24 h under Strategy 1.
Sustainability 17 06110 g014
Figure 15. Voltage fluctuation curves at 33 nodes over 24 h under Strategy 2.
Sustainability 17 06110 g015
Figure 16. Voltage fluctuation curves at 33 nodes over 24 h under Strategy 3.
Sustainability 17 06110 g016
Table 1. Cost comparison of different restoration strategies.
Restoration StrategyCost/USDTotal Cost/USD
1234
114444,10709078.753,329.7
2154.243,2905411.82526.451,382.4
Table 2. Cost comparison of different optimization strategies.
StrategyCost/USDTotal Cost/USD
1234567
10023.529.9127.71110.8702.81994.7
2207.8143.518.70711097.701538.7
3132.7830751.41098.901373
Disclaimer/Publisher’s Note: The statements, opinions and data contained in all publications are solely those of the individual author(s) and contributor(s) and not of MDPI and/or the editor(s). MDPI and/or the editor(s) disclaim responsibility for any injury to people or property resulting from any ideas, methods, instructions or products referred to in the content.

