
Experimental Study on Impact Responses of Geofoam Reinforced Sand Cushion for Rockfall Hazard Mitigation

Abstract
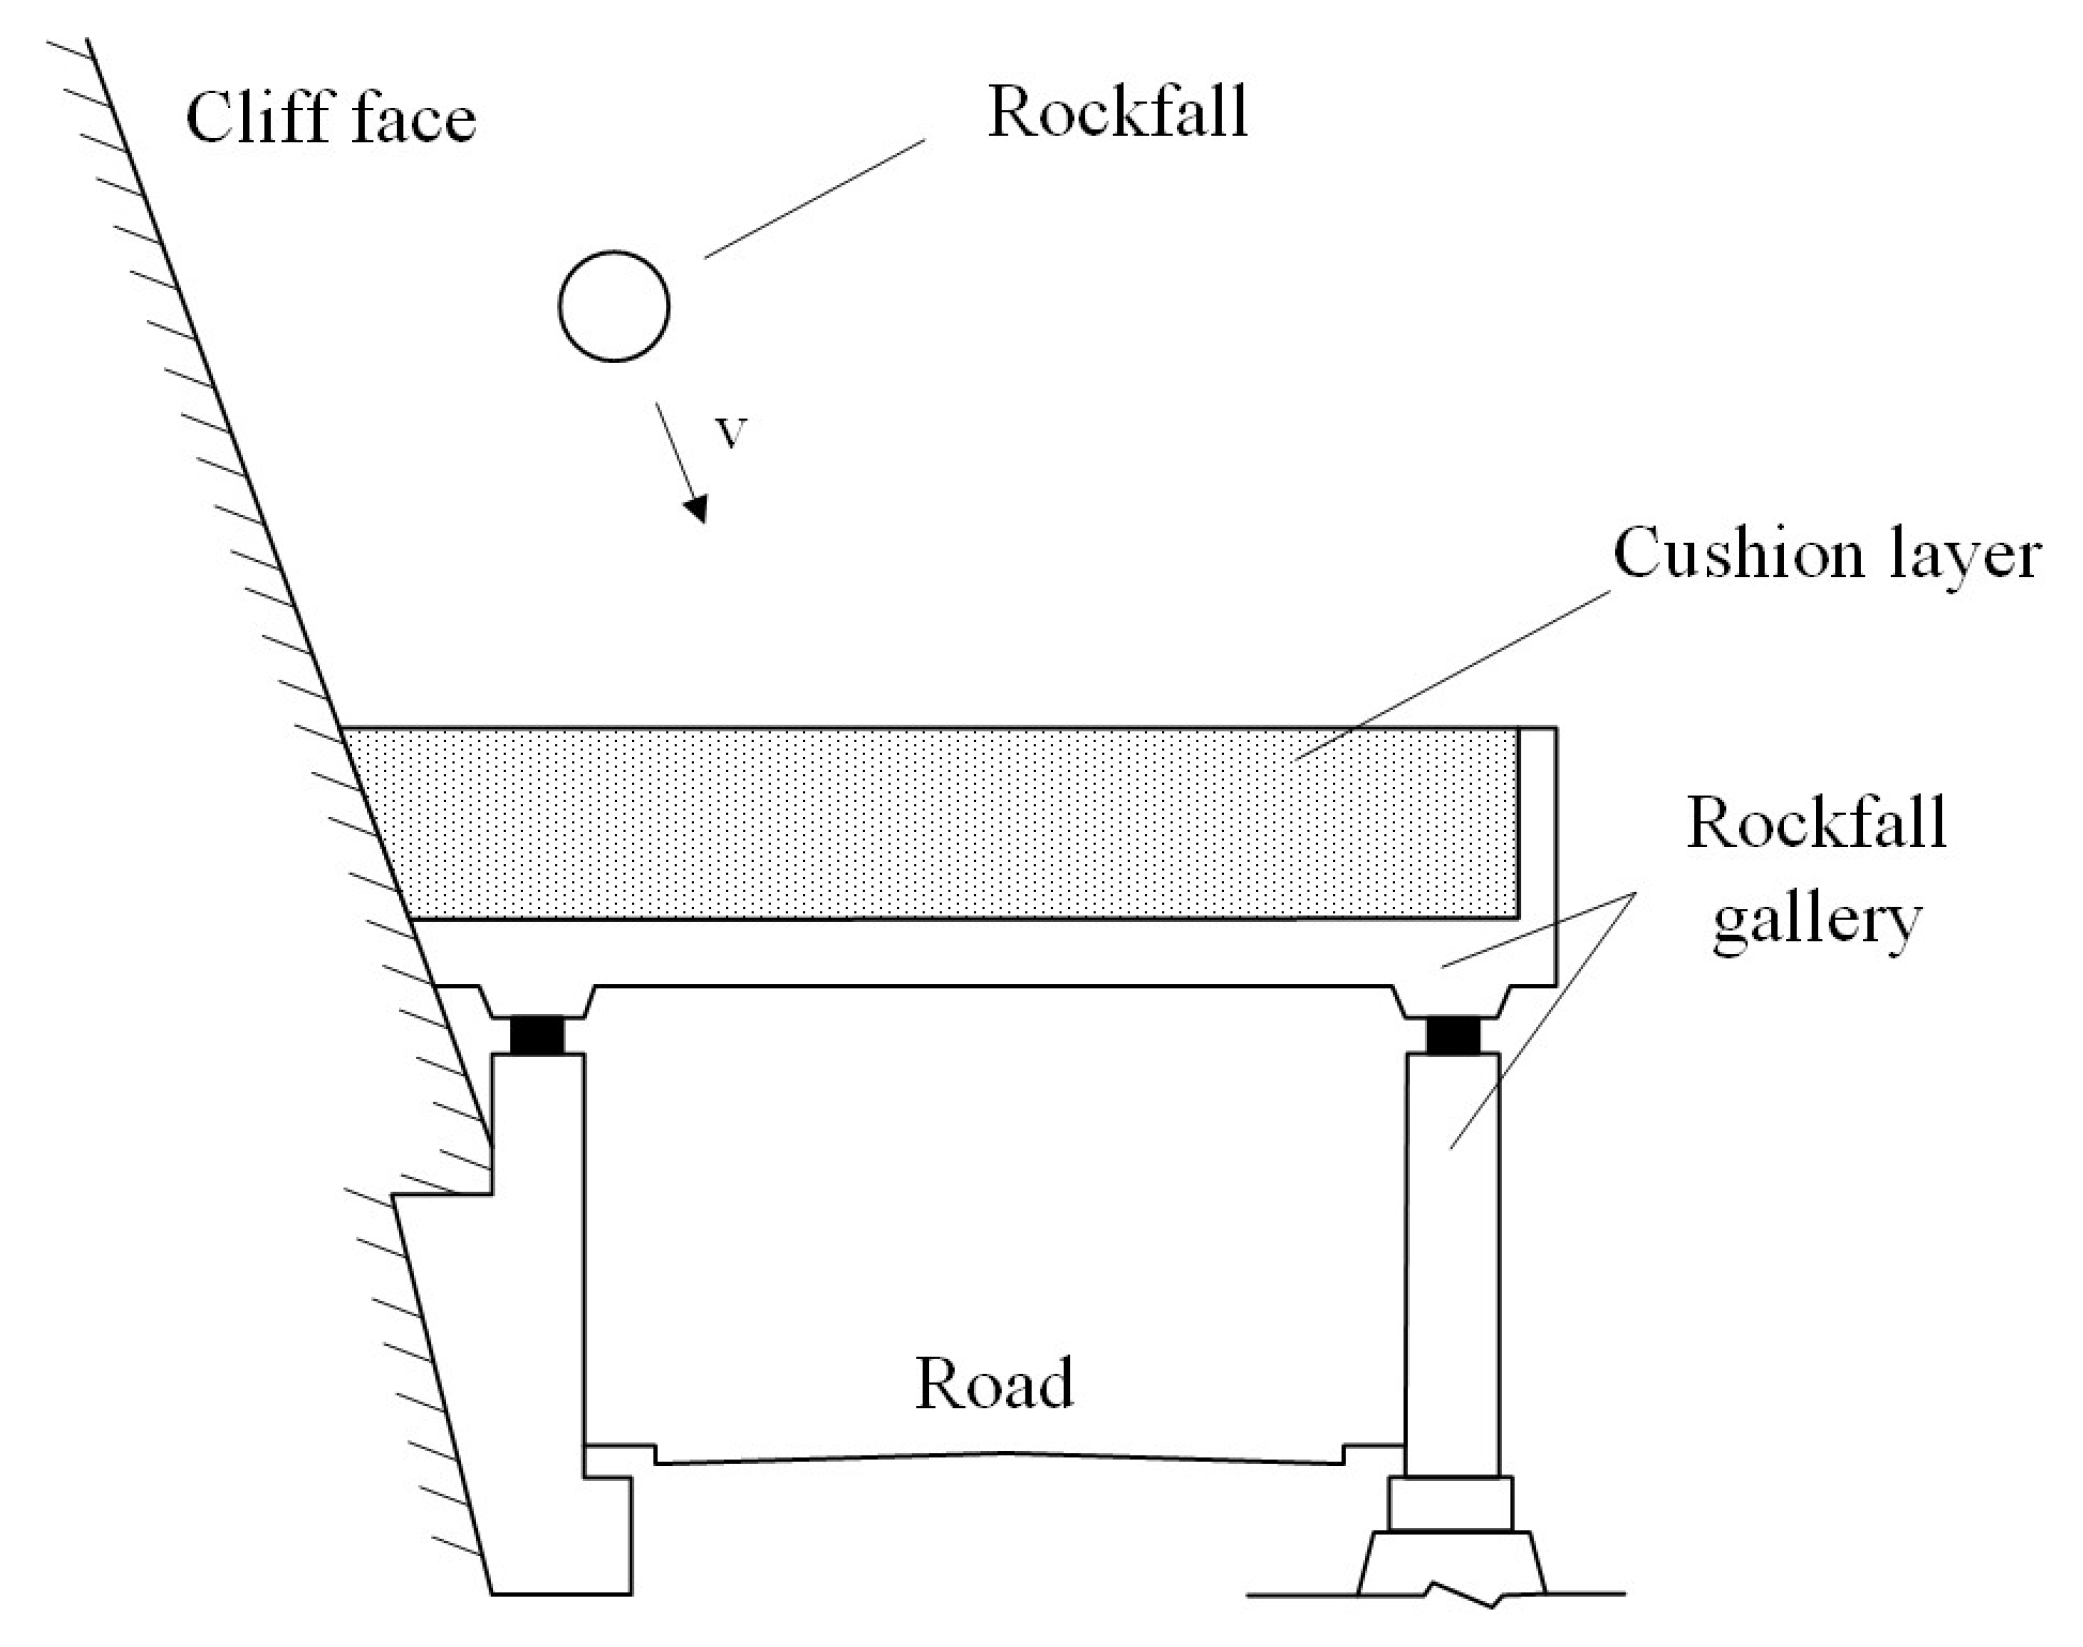
1. Introduction
2. Cushion Materials
2.1. Sand
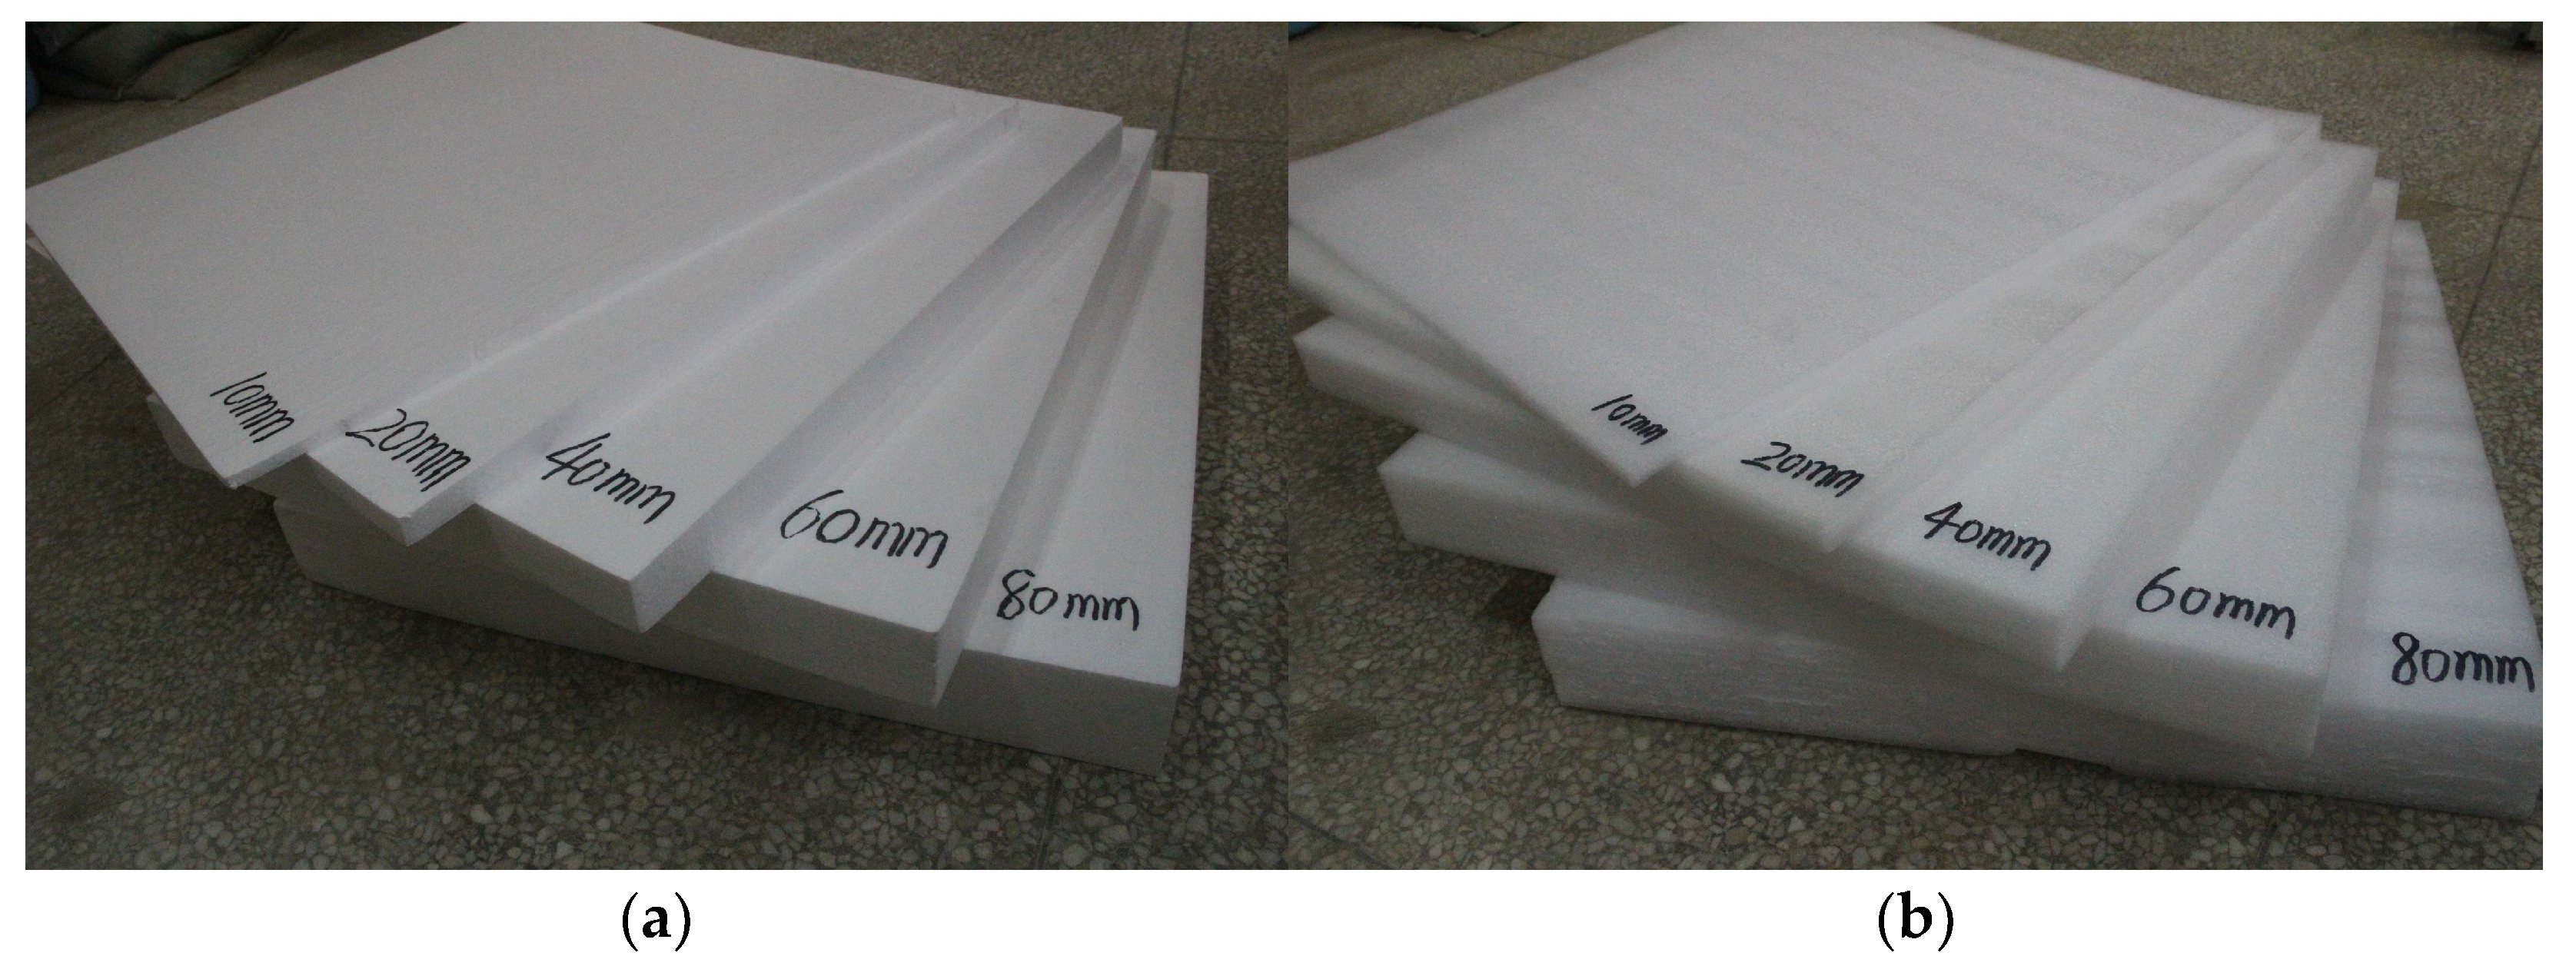
2.2. Geofoam
3. Experimental Procedure
3.1. Scaling Factor Design
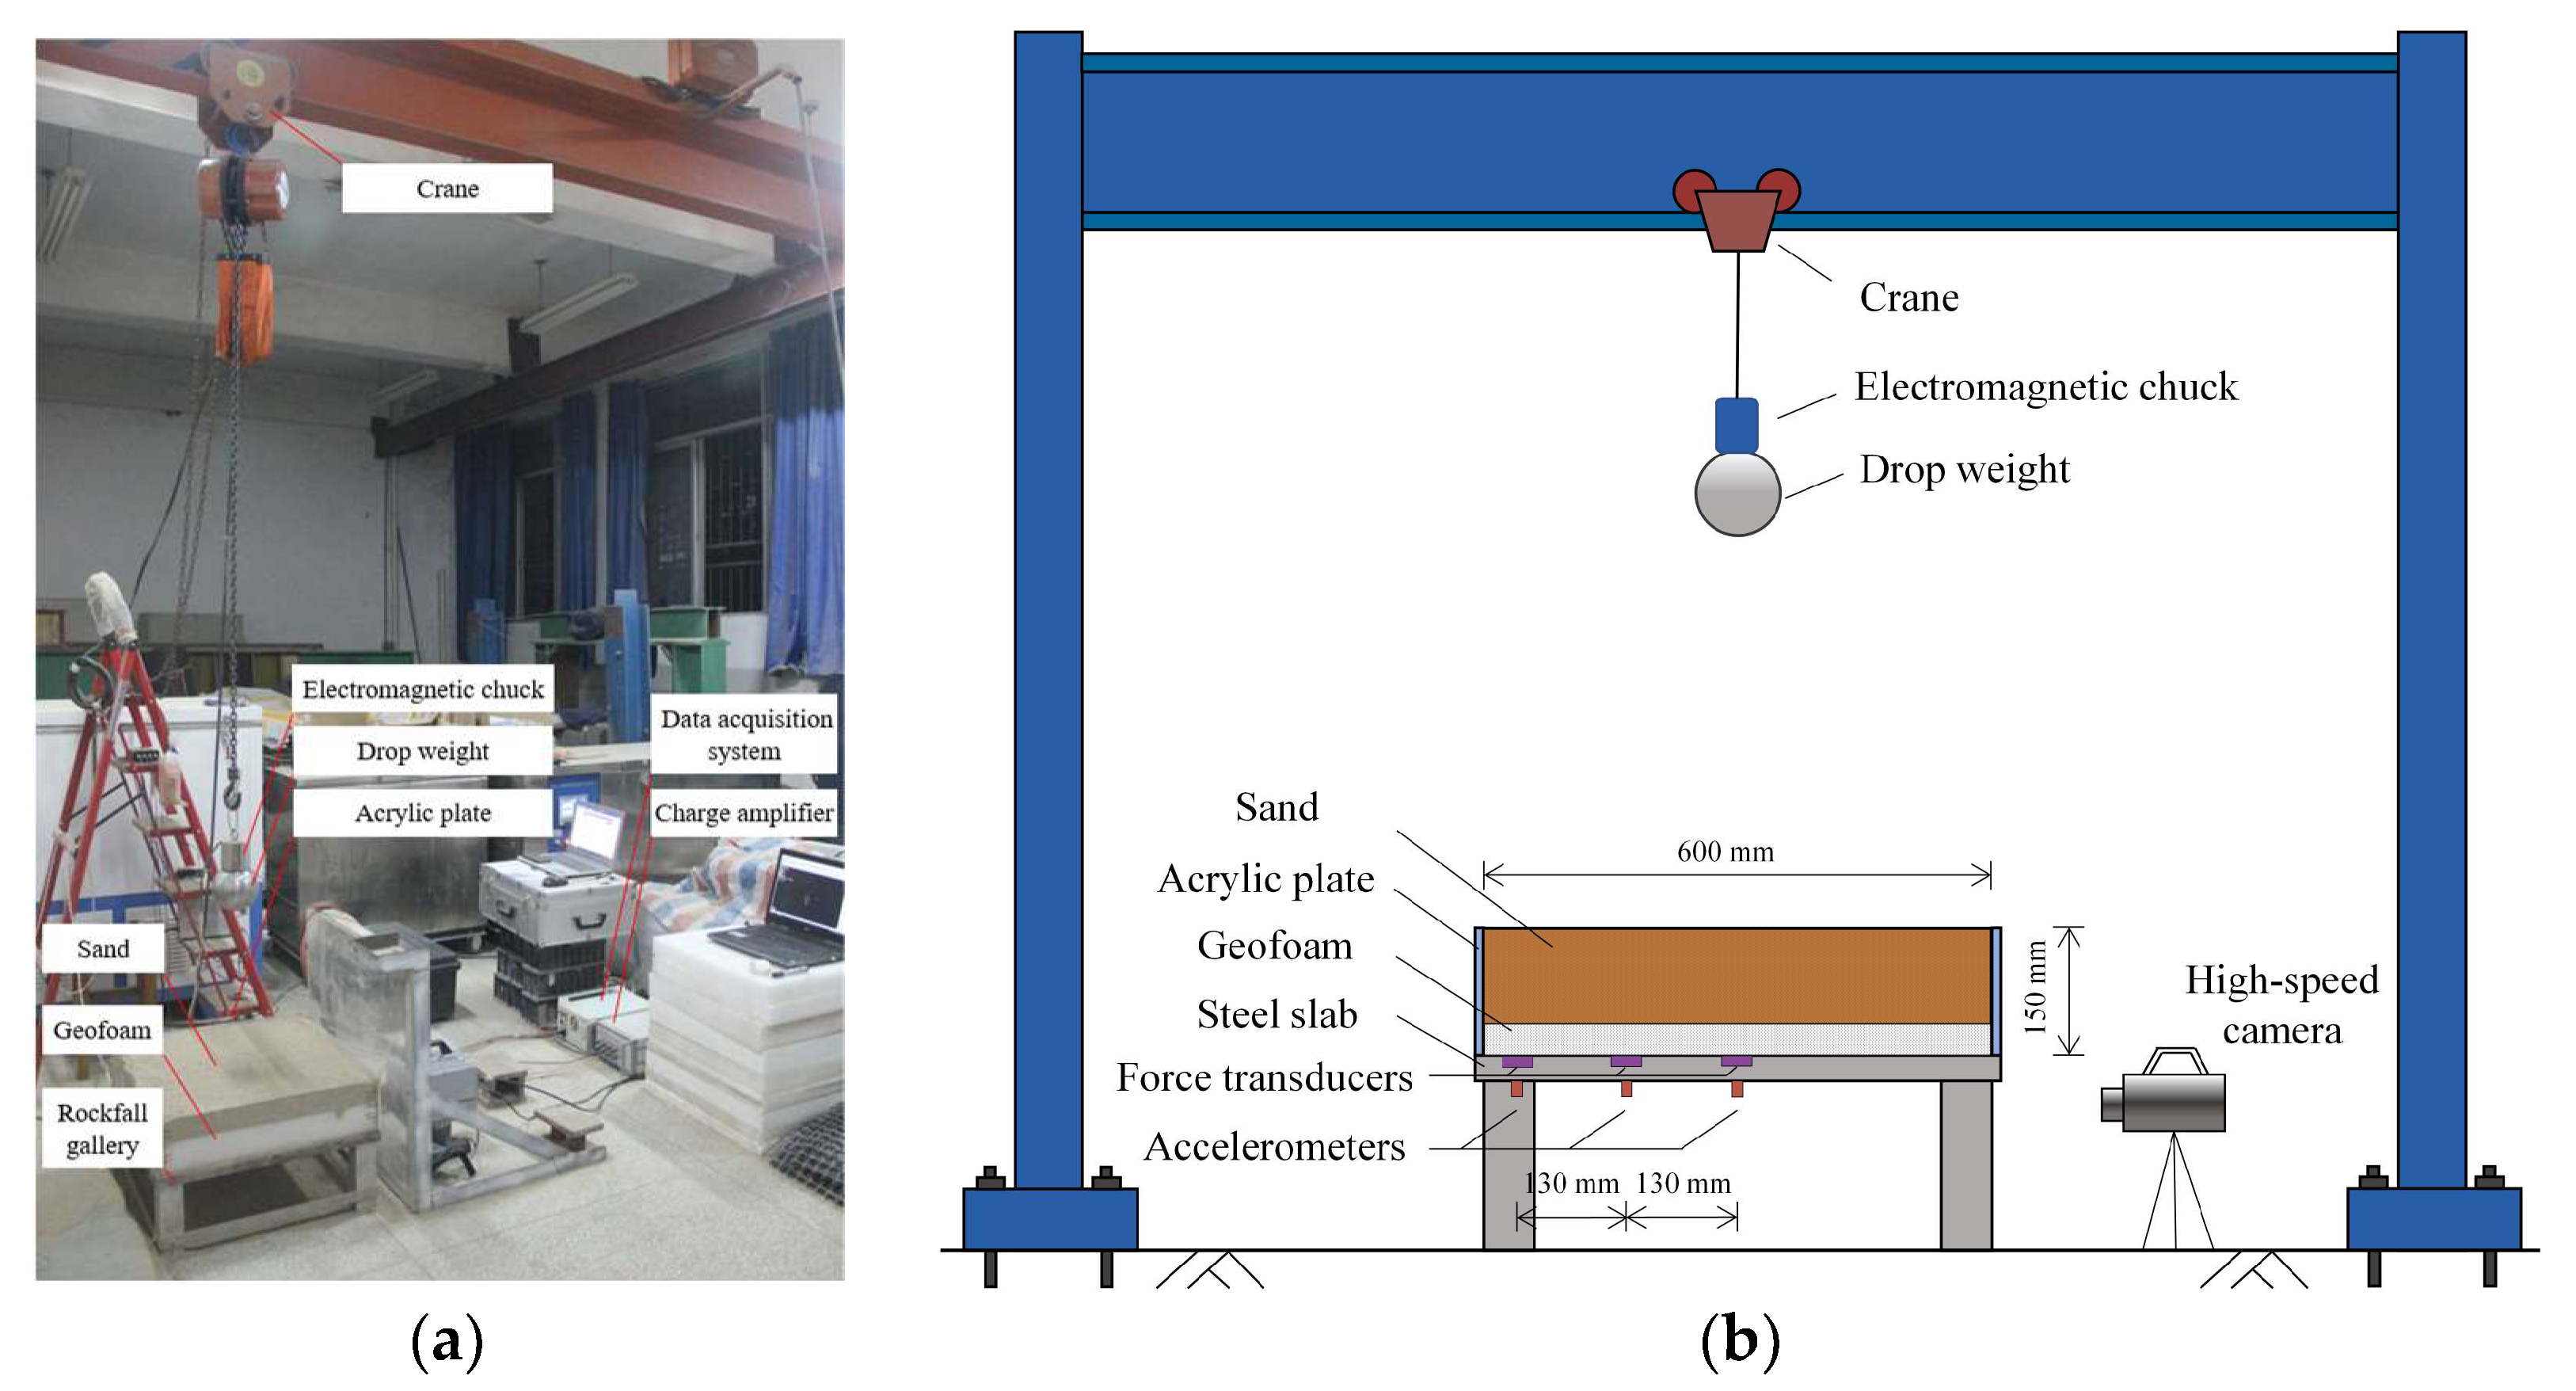
3.2. Setup of Impact Test
4. Test Results
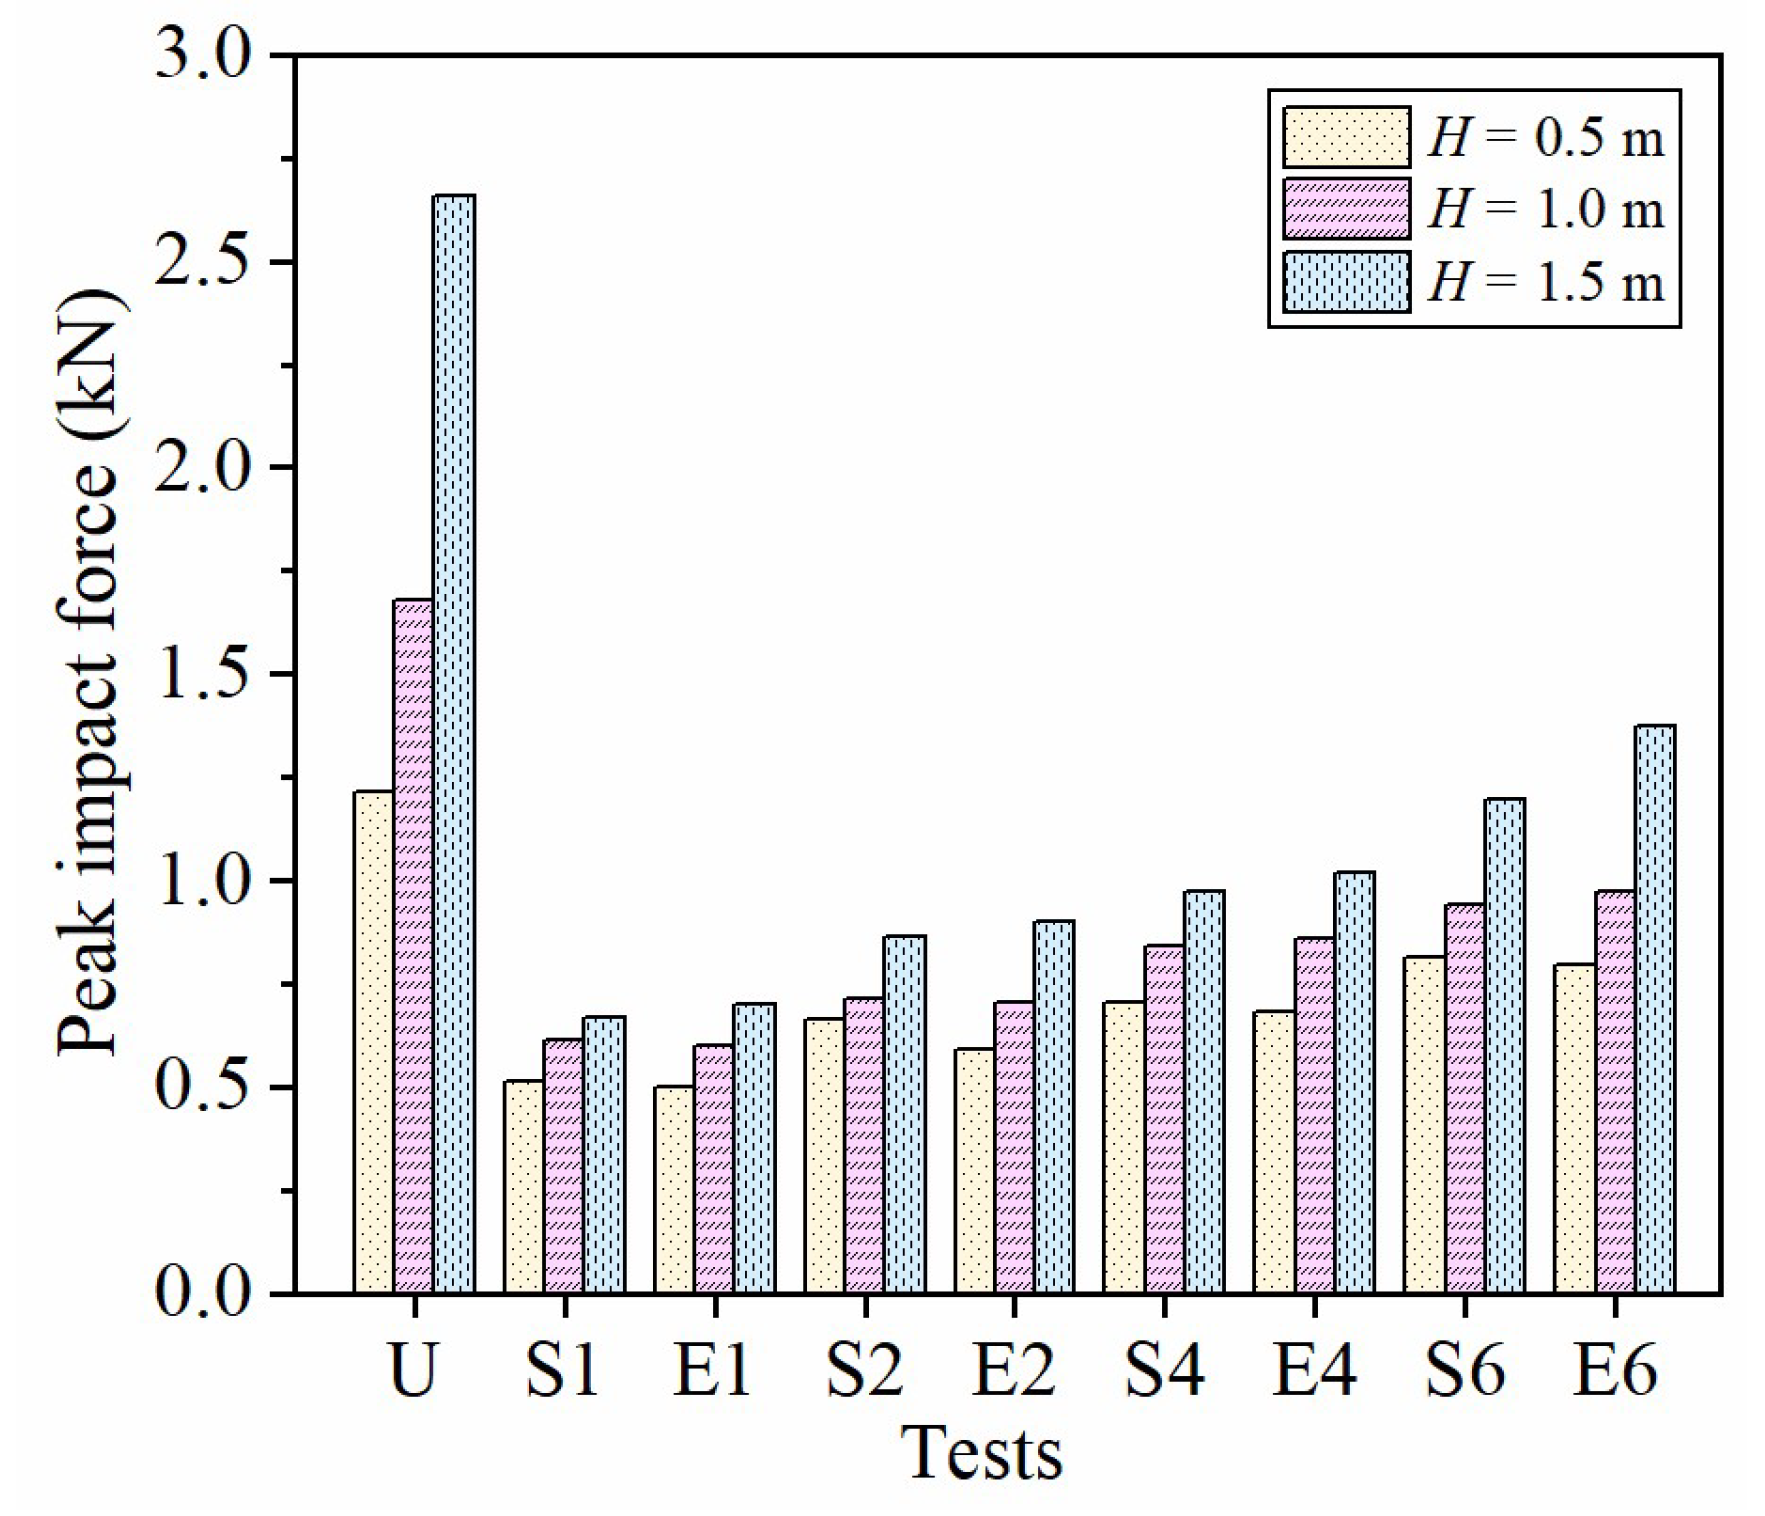
4.1. Impact Responses of the Drop Weight
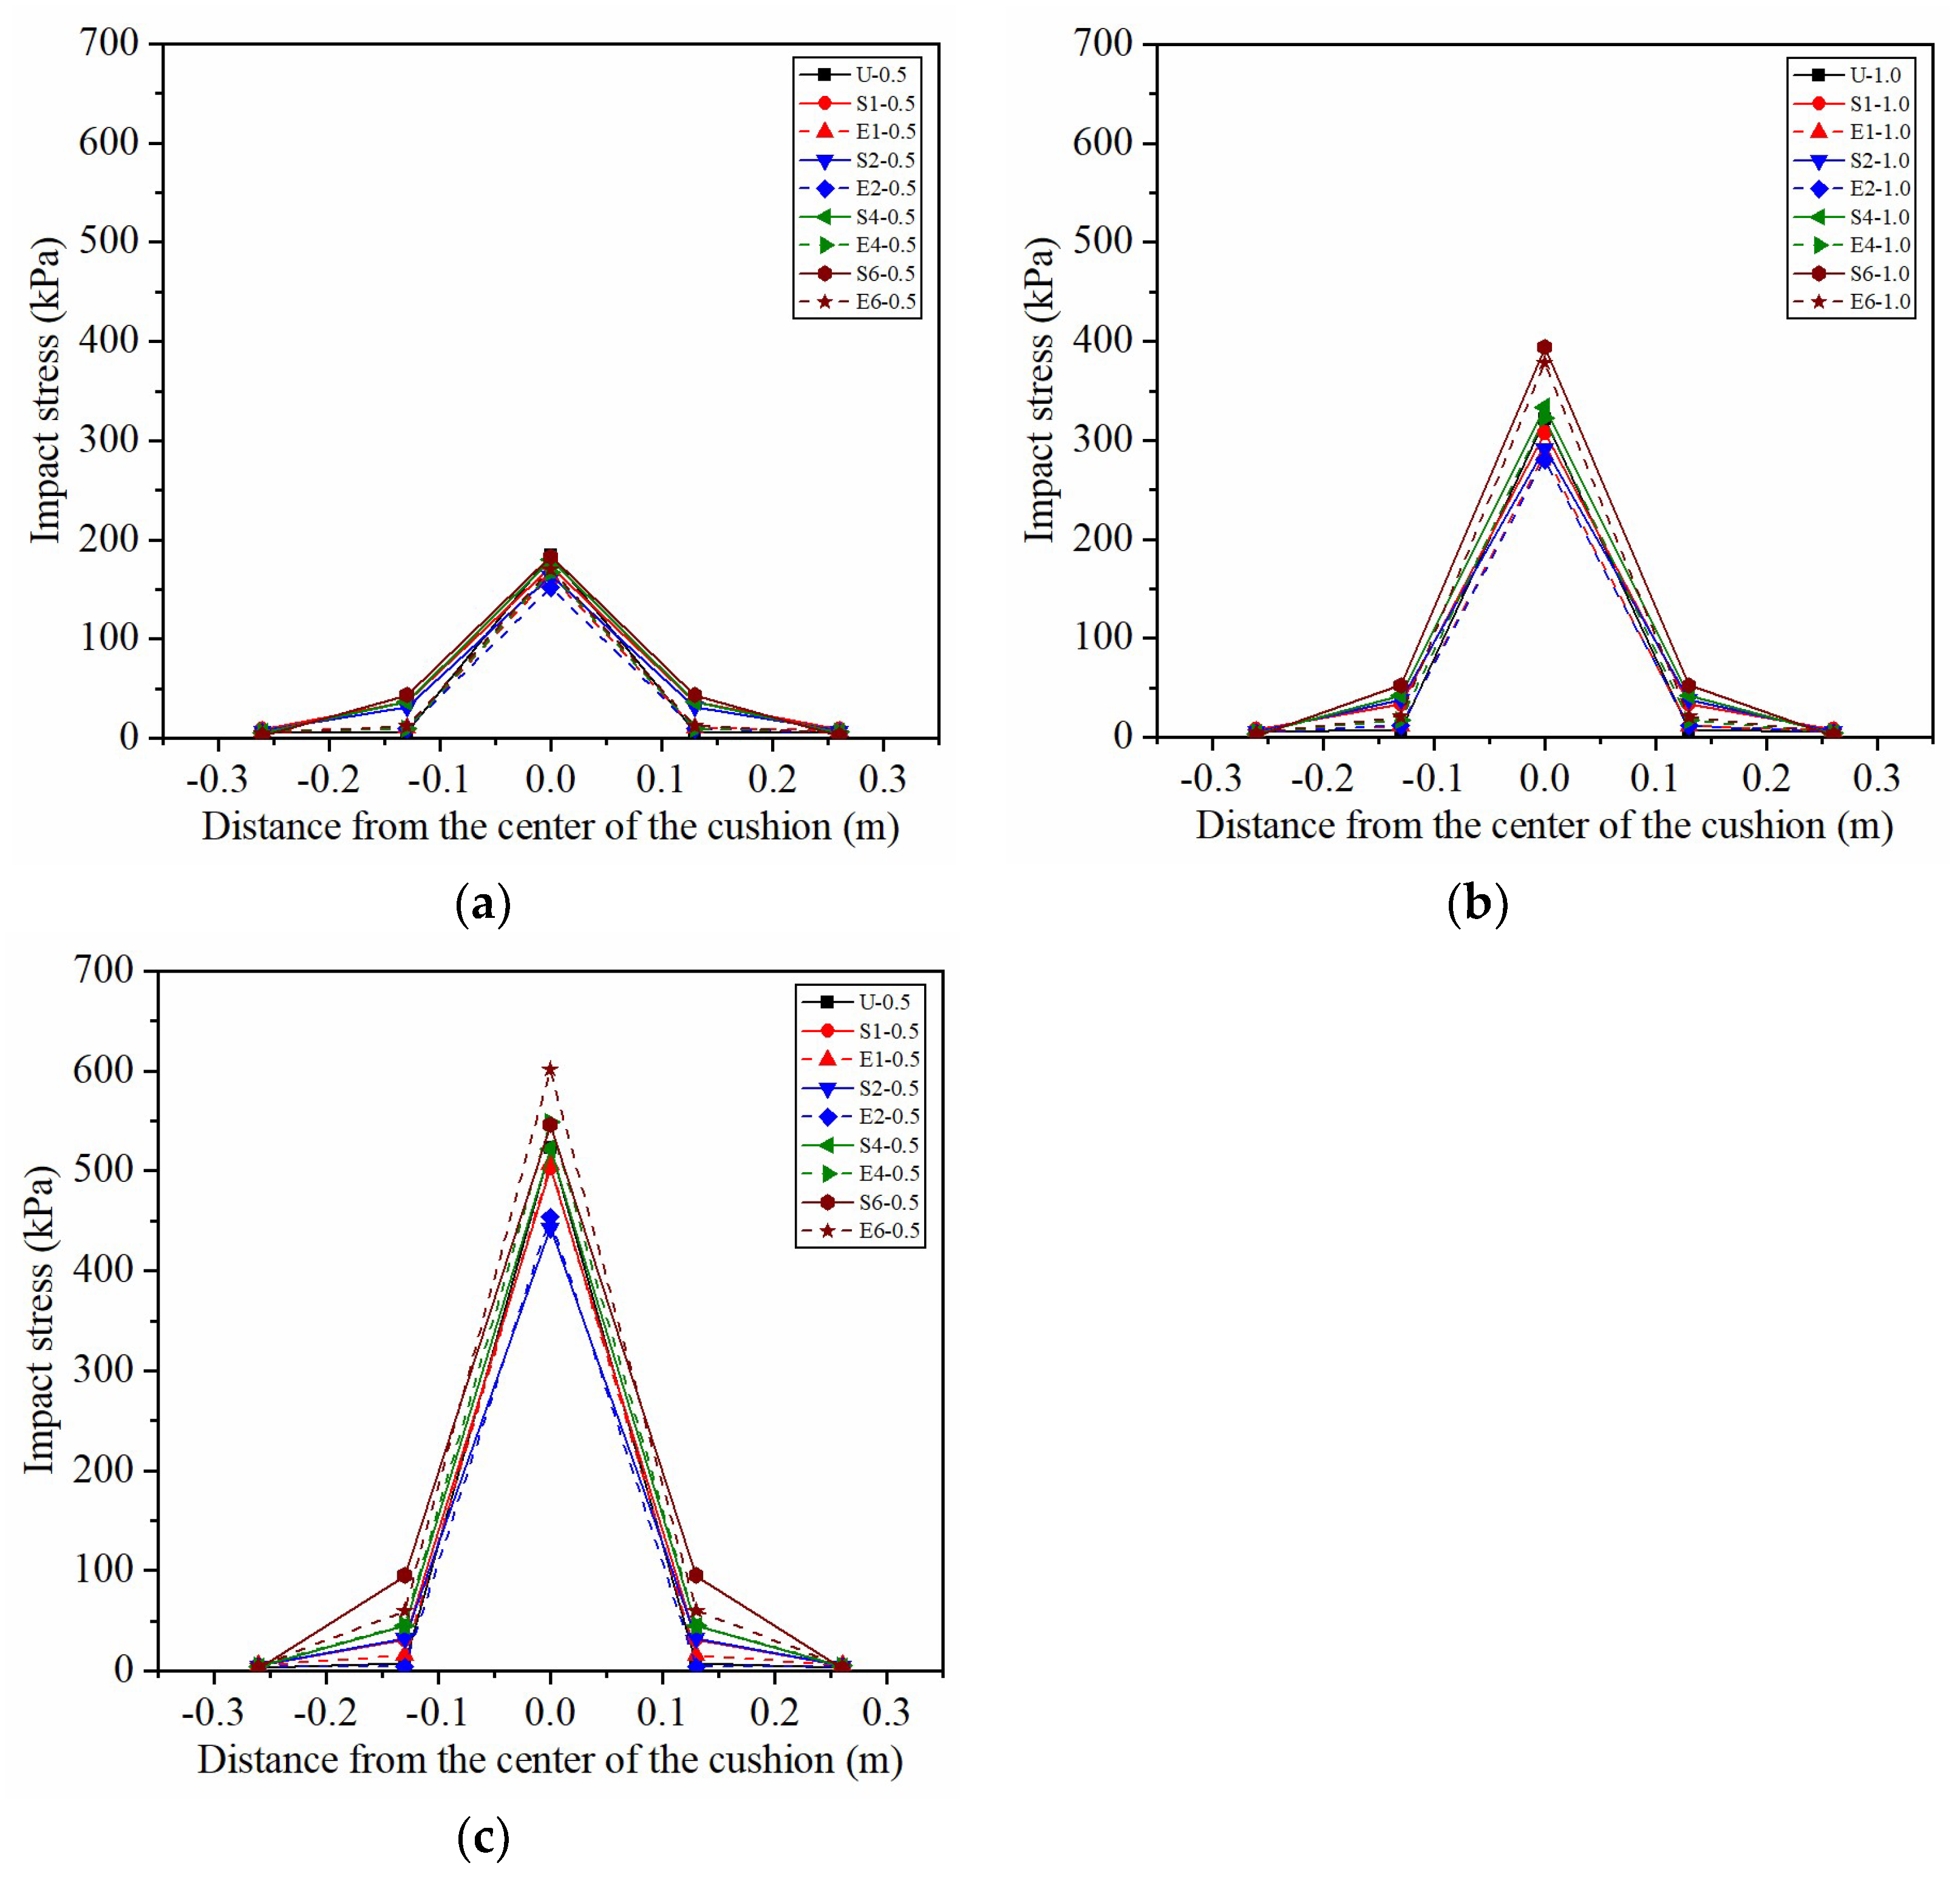
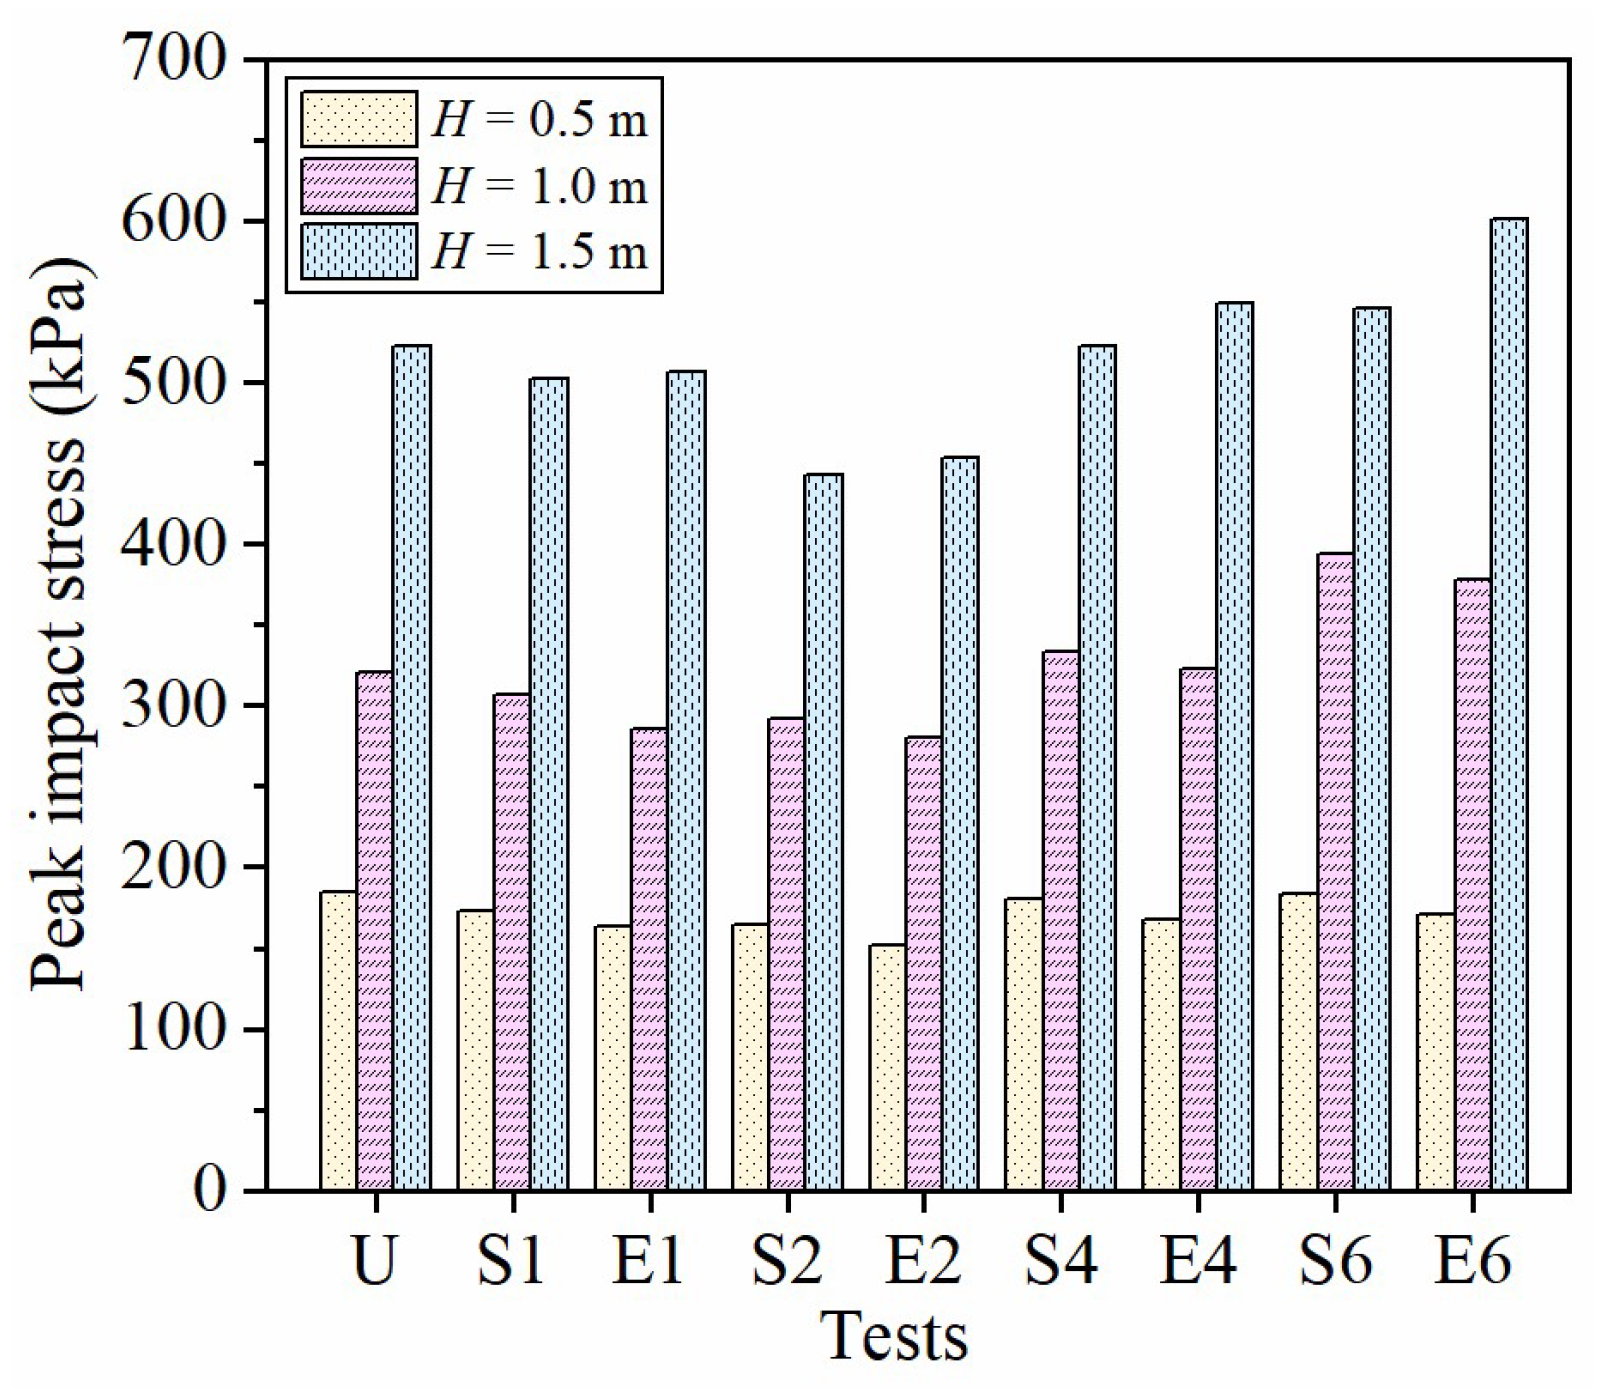
4.2. Stress Distribution at Cushion Bottom
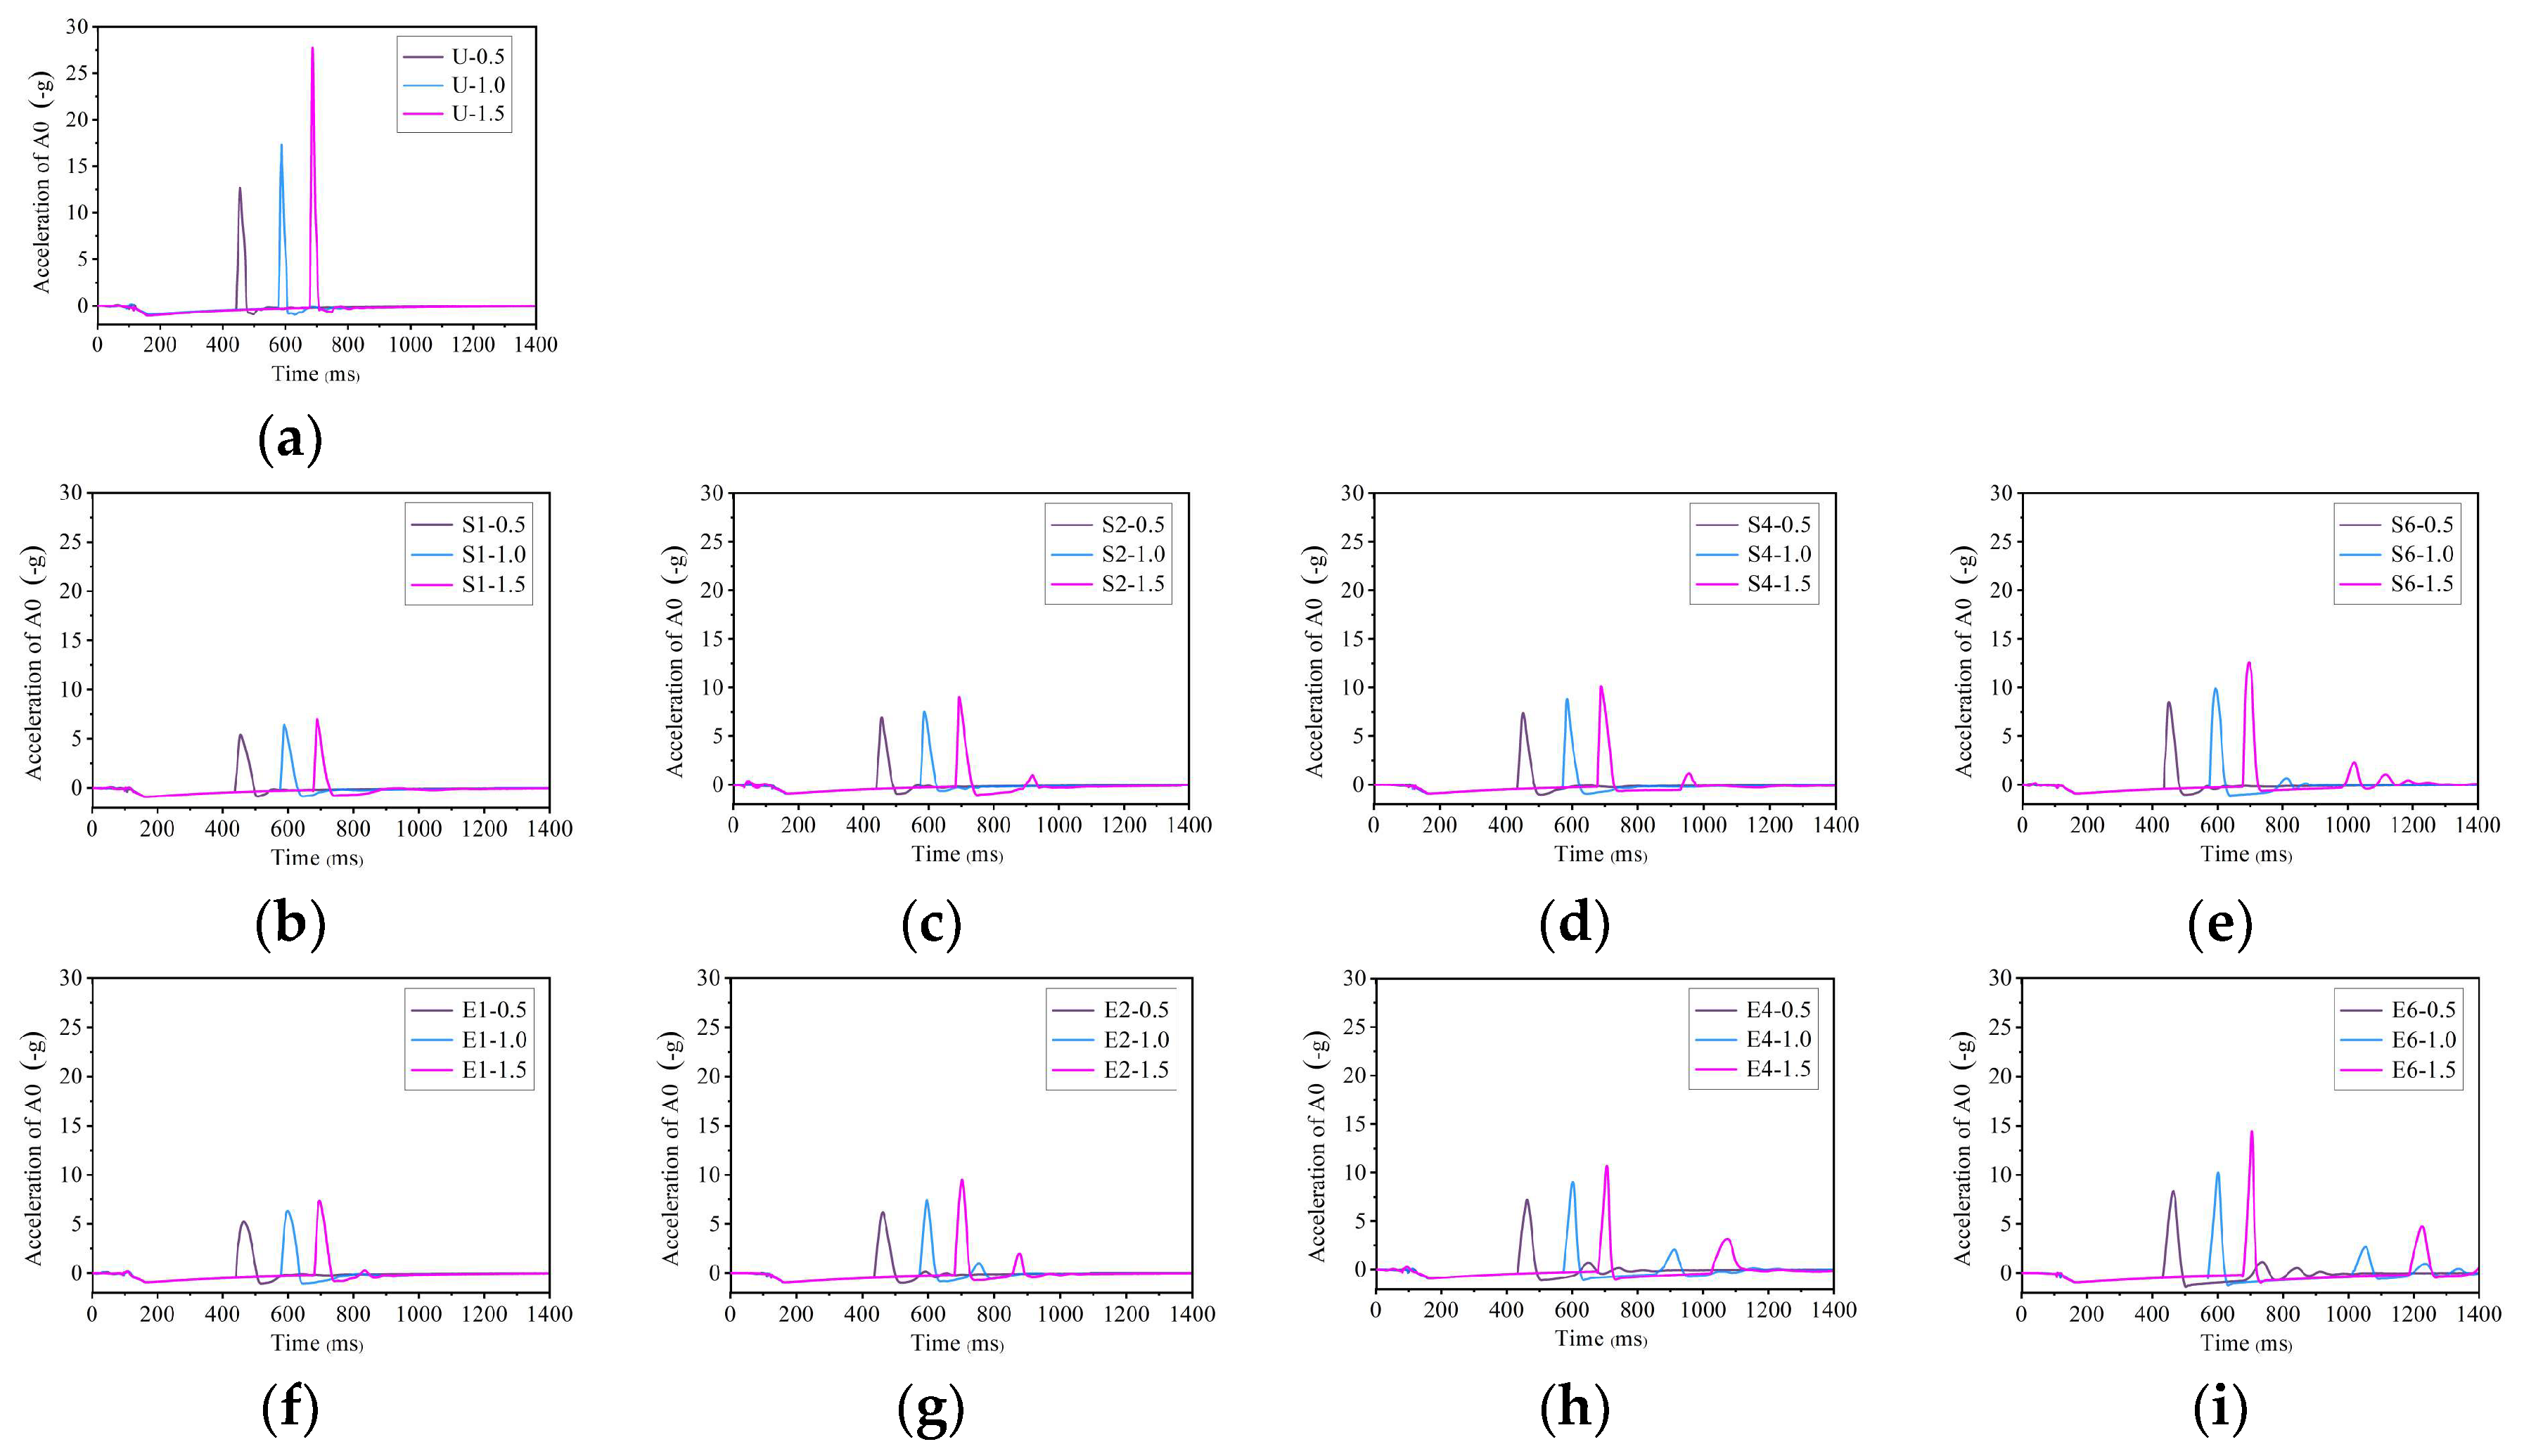
4.3. Vibration of the Gallery Slab
5. Discussion
6. Conclusions
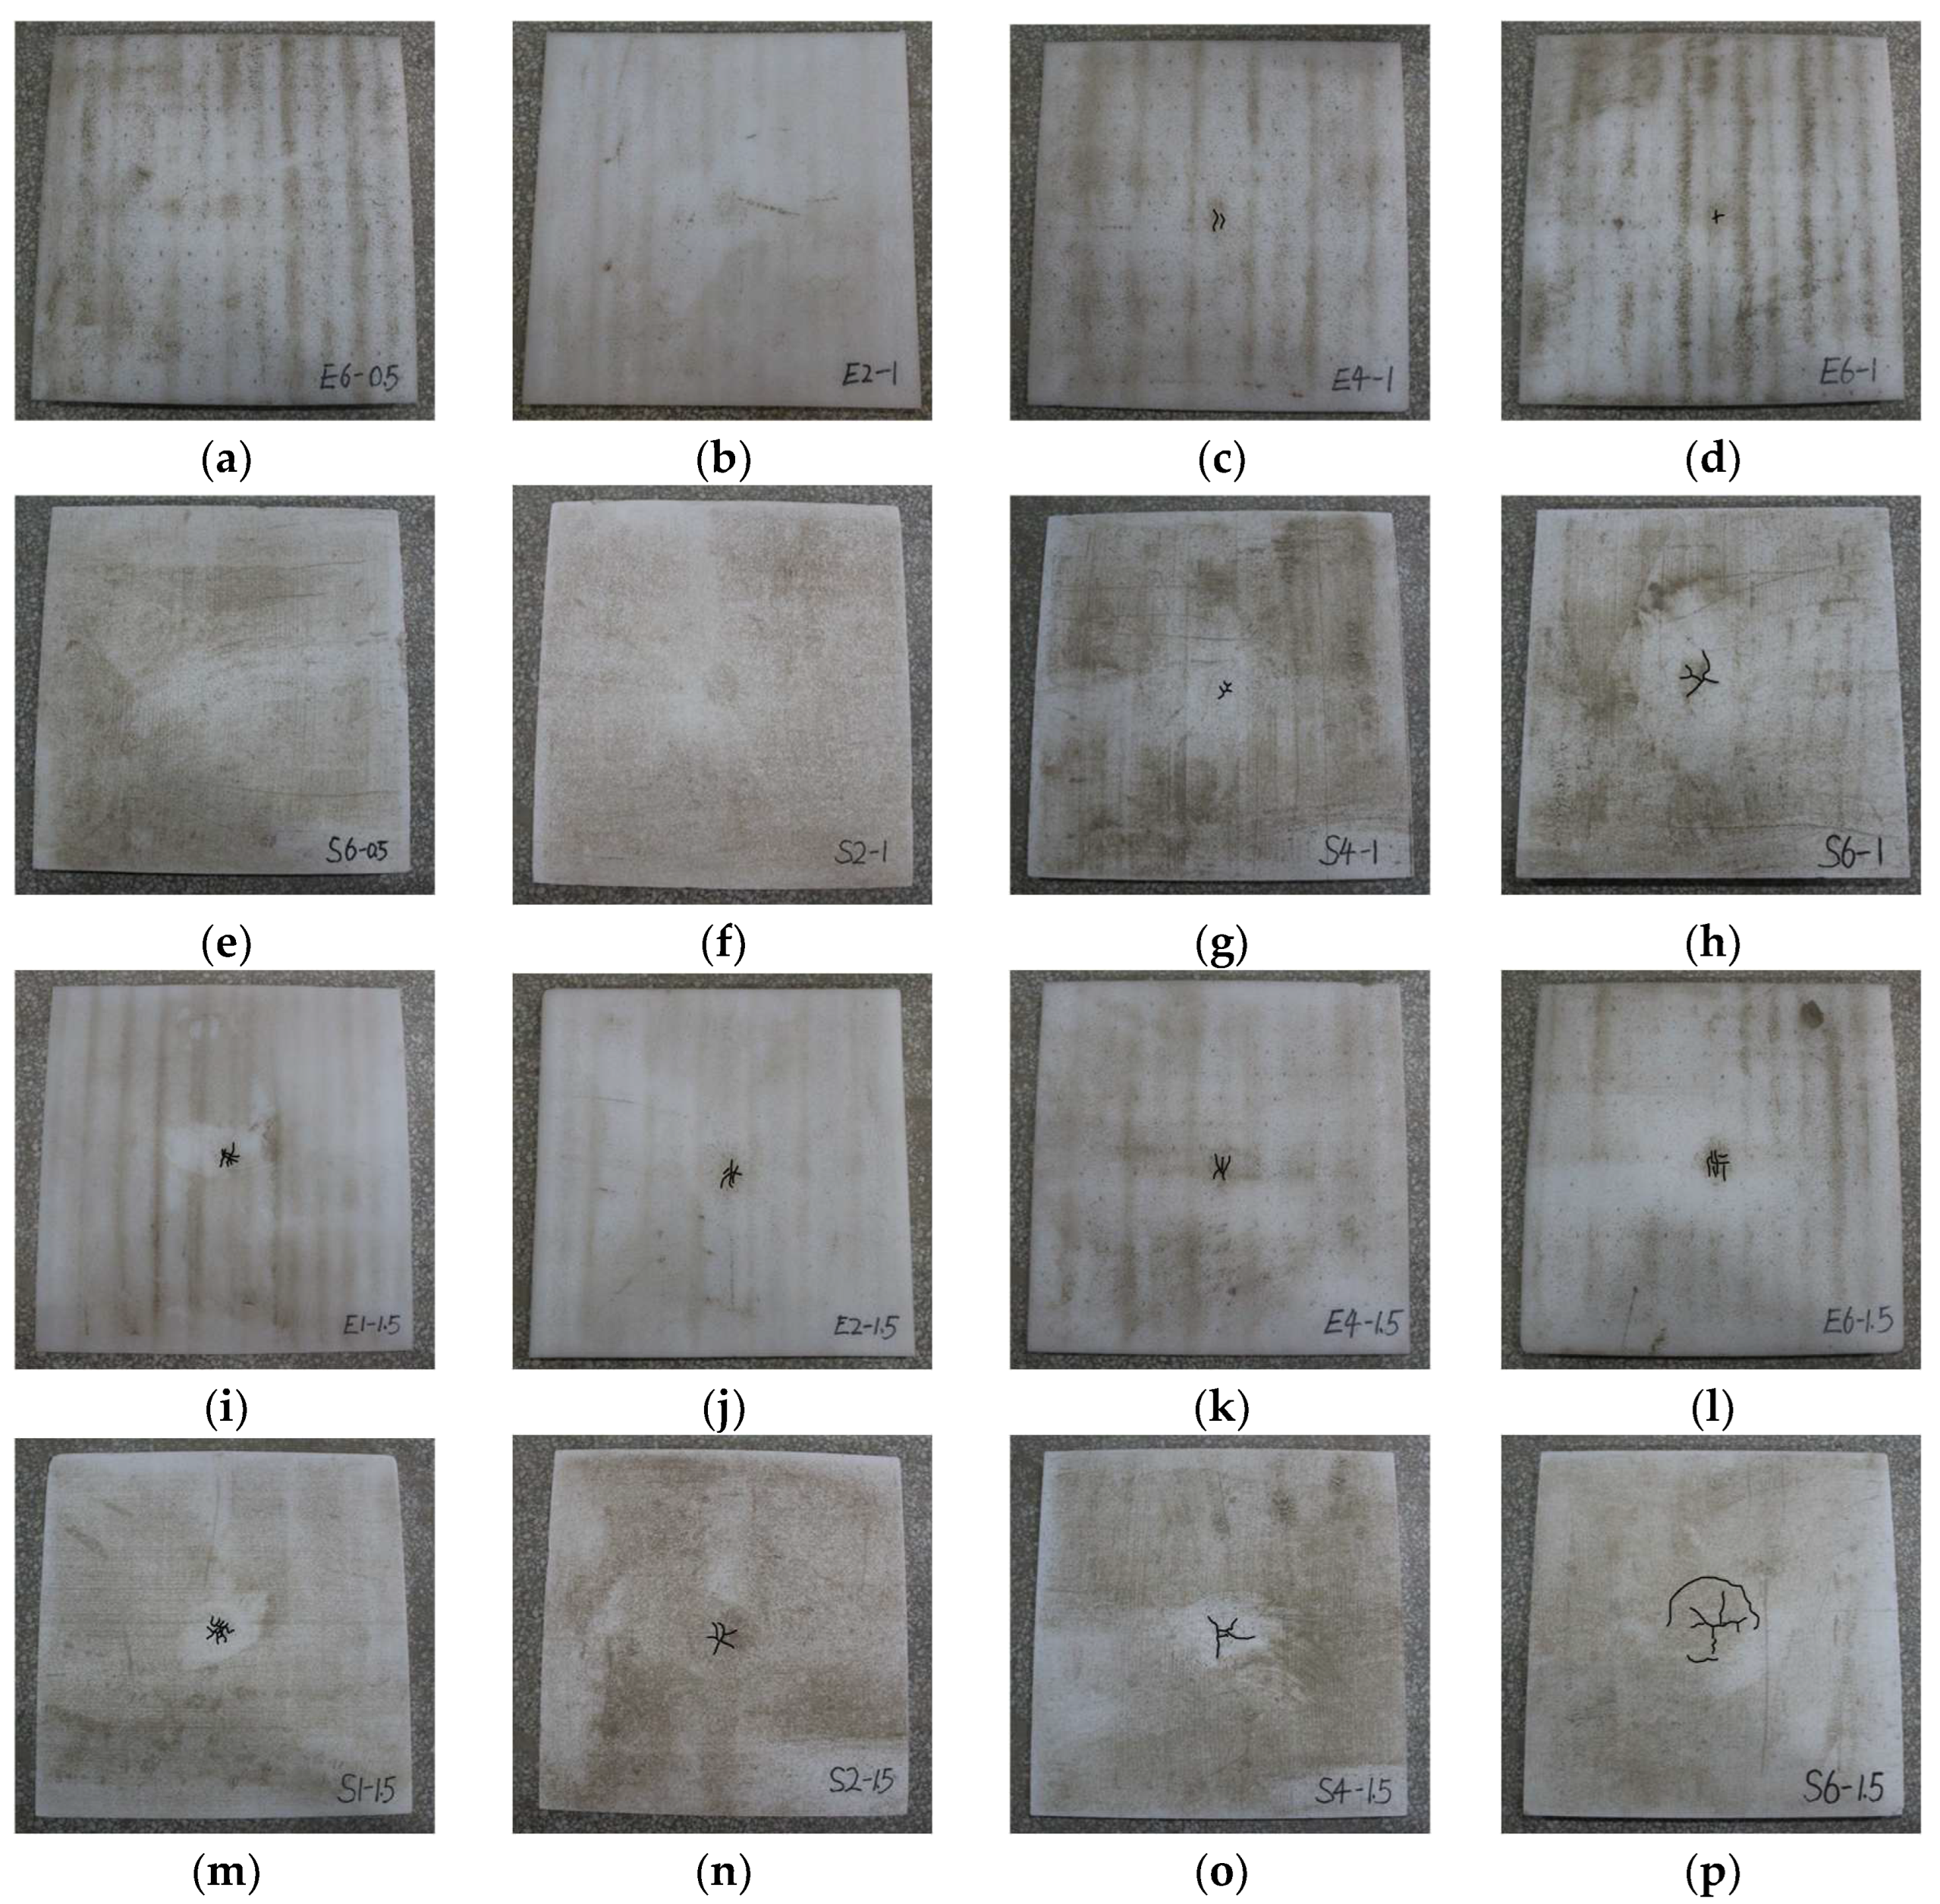
- There was an increased rockfall impact force, impact stress on the cushion bottom, geofoam damage, and vibration level of the gallery slab with the increase in impact energy. The impact stress and slab vibration concentrated on the impact point and decreased with increasing distance from the center of the cushion bottom.
- The geofoam can significantly improve the impact responses of the sand cushion for the rockfall gallery. The rockfall impact force and the acceleration of the gallery slab reduced by 33.1~74.9% and 56.2~86.0%, respectively, when geofoam was placed on the sand cushion bottom. The peak impact stress at the cushion bottom was also reduced by the geofoam against a 47.5 J rockfall impact. However, the sand cushion reinforced with thick geofoam (i.e., 4 and 6 cm) against higher impact energy (i.e., 95.0 and 142.5 J) led to increased impact stress in comparison with the sand cushion without geofoam.
- The impact resistance of the geofoam-reinforced sand cushion increased first and then decreased with increasing foam thickness. A sand cushion with a certain thickness is needed to provide sufficient deformation for the geofoam-reinforced sand cushion to undergo rockfall penetration. Placing geofoam with a thickness below one third of the cushion thickness on the sand cushion bottom could obtain a favorable impact resistance of the cushion layer against rock impact.
- The EPE foam exhibited a better behavior in reducing impact force, impact stress, and slab vibration than the EPS foam did in the sand cushion under low impact energy. However, thick EPE foam may lead to a higher rock impact force than the EPS foam. Compared with the EPE foam, the EPS foam-reinforced sand cushion showed decreased impact force, impact stress, and bounce times as well as an increased slab vibration when the rockfall had high impact energy. Moreover, there was less damage to the EPE foam as compared with the EPS foam thanks to its good resilience.
Author Contributions
Funding
Institutional Review Board Statement
Informed Consent Statement
Data Availability Statement
Conflicts of Interest
References
- Zhang, Y.; Feng, J.; Du, L.; Zhao, P.; Peng, J.; Yang, C.; Fan, H.; Li, L. Numerical Investigation of the Dynamic Response of a Sand Cushion with Multiple Rockfall Impacts. Sustainability 2023, 15, 3554. [Google Scholar] [CrossRef]
- Meng, X.Y.; Ma, Y.L.; Jiang, Q.H.; Li, J. An elastoplastic linear strengthening model to estimate the impact force generated by rockfall on sand cushion. Int. J. Geomech. 2025, 25, 04025106. [Google Scholar] [CrossRef]
- Liu, H.; Zhu, P.; Liu, Q.; Sun, C.; Yang, Y.; He, G.; He, C. Equivalent Nodal Intensity-Based Contact Model for 3D Finite–Discrete Element Method in Rock Fracturing Analysis. Rock Mech. Rock Eng. 2025, 58, 6059–6086. [Google Scholar] [CrossRef]
- Yuan, J.K.; Li, Y.R.; Huang, R.Q.; Pei, X.J. Impact of rockfalls on protection measures: An experimental approach. Nat. Hazard Earth Sys. 2015, 15, 885–893. [Google Scholar] [CrossRef]
- Naito, N.; Maeda, K.; Konno, H.; Ushiwatari, Y.; Suzuki, K.; Kawase, R. Loading rate dependence of granular cushion under rockfall impact and proposal of an analytical model for impact force estimation. Acta Geotech. 2023, 18, 1463–1477. [Google Scholar] [CrossRef]
- Zhong, H.; Hao, C.; Yu, Z.; Lyu, L.; Wu, A. Damage assessment of RC bridge piers under rockfall impact and evaluation of a steel-sand protective structure. Structures 2023, 47, 607–624. [Google Scholar] [CrossRef]
- Kawahara, S.; Muro, T. Effects of dry density and thickness of sandy soil on impact response due to rockfall. J. Terramech. 2006, 43, 329–340. [Google Scholar] [CrossRef]
- Zhu, C.; Wang, D.; Xia, X.; Tao, Z.; He, M.; Cao, C. The effects of gravel cushion particle size and thickness on the coefficient of restitution in rockfall impacts. Nat. Hazard Earth Sys. 2018, 18, 1811–1823. [Google Scholar] [CrossRef]
- Shen, W.; Zhao, T.; Dai, F. Influence of particle size on the buffering efficiency of soil cushion layer against rockfall impact. Nat. Hazards 2021, 108, 1469–1488. [Google Scholar] [CrossRef]
- Perera, J.S.; Lam, N.; Disfani, M.M.; Gad, E. Experimental and analytical investigation of a RC wall with a gabion cushion subjected to boulder impact. Int. J. Impact Eng. 2021, 151, 103823. [Google Scholar] [CrossRef]
- Meng, X.Y.; Jiang, Q.H.; Han, J.; Liu, R.Y. Experimental investigation of geogrid-reinforced sand cushions for rock sheds against rockfall impact. Transp. Geotech. 2022, 33, 100717. [Google Scholar] [CrossRef]
- Yu, B.; Yi, W.; Zhao, H. Experimental study on the maximum impact force by rock fall. Landslides 2018, 15, 233–242. [Google Scholar] [CrossRef]
- Duan, S.Z.; Li, G.L.; Yang, X. Characterization and prediction of the effects of random factors on buffering efficiency in slope-cushion layer collisions through the discrete element method. Comput. Part. Mech. 2024, 12, 599–612. [Google Scholar] [CrossRef]
- Meng, X.Y.; Ma, Y.L.; Jiang, Q.H.; Chen, K.J. The impact responses of pervious concrete wall with sand cushion against rockfall: A full-scale experimental study. Int. J. Geomech. 2024, 24, 04024270. [Google Scholar] [CrossRef]
- JTG/T D70; Guidelines for Design of Highway Tunnel. Ministry of Transport of the People’s Republic of China: Beijing, China, 2010.
- Yoshida, H.; Nomura, T.; Wyllie, D.C.; Morris, A.J. Rock fall sheds-application of Japanese designs in North America. In Proceedings of the 1st North American Landslide Conference, Vail, CO, USA, 3–10 June 2007; pp. 179–196. [Google Scholar]
- Ng, C.W.W.; Su, Y.; Choi, C.E.; Song, D.; Lam, C.; Kwan, J.S.H.; Chen, R.; Liu, H. Comparison of cushioning mechanisms between cellular glass and gabions subjected to successive boulder impacts. J. Geotech. Geoenviron. 2018, 144, 04018058. [Google Scholar] [CrossRef]
- Kwan, J.S.; Sze, E.H.; Lam, C. Finite element analysis for rockfall and debris flow mitigation works. Can. Geotech. J. 2019, 56, 1225–1250. [Google Scholar] [CrossRef]
- Sun, J.; Chu, Z.; Liu, Y.; Luo, W.; Wang, M. Performance of used tire cushion layer under rockfall impact. Shock Vib. 2016, 2016, 8760592. [Google Scholar] [CrossRef]
- Meree, H.; Wang, D.; Yan, S. Numerical and theoretical study of rockfall impact on shed with composite sand-airbag cushion materials. Environ. Earth Sci. 2023, 82, 432. [Google Scholar] [CrossRef]
- Bathurst, R.J.; Zarnani, S.; Gaskin, A. Shaking table testing of geofoam seismic buffers. Soil Dyn. Earthq. Eng. 2007, 27, 324–332. [Google Scholar] [CrossRef]
- Zhang, Z.; Zhong, W.; Li, J.; Luo, J. Mechanical properties and cushioning effectiveness of FPUF-EPS combination materials. Materials 2023, 16, 6886. [Google Scholar] [CrossRef]
- Ouyang, C.; Liu, Y.; Wang, D.; He, S. Dynamic analysis of rockfall impacts on geogrid reinforced soil and EPS absorption cushions. KSCE J. Civ. Eng. 2019, 23, 37–45. [Google Scholar] [CrossRef]
- Bhatti, A.Q. Computational modeling of energy dissipation characteristics of expanded polystyrene (EPS) cushion of reinforce concrete (RC) bridge girder under rockfall impact. Int. J. Civ. Eng. 2018, 16, 1635–1642. [Google Scholar] [CrossRef]
- Yan, S.; Wang, Y.; Wang, D.; He, S. Application of EPS geofoam in rockfall galleries: Insights from large-scale experiments and FDEM simulations. Geotext. Geomembr. 2022, 50, 677–693. [Google Scholar] [CrossRef]
- Zhao, P.; Liu, J.; Zhang, Y. Experimental and numerical investigations on buffer performance of geofoam subjected by the impact of falling rocks with respect to different shapes. Geotext. Geomembr. 2023, 51, 108–124. [Google Scholar] [CrossRef]
- Zhao, P.; Xie, L.; Li, L.; Liu, Q.; Yuan, S. Large-scale rockfall impact experiments on a RC rock-shed with a newly proposed cushion layer composed of sand and EPE. Eng. Struct. 2018, 175, 386–398. [Google Scholar] [CrossRef]
- Yu, B.; Zhou, X.; Tang, J.; Zhang, Y.; Zhang, Y. Impact resistance performance and optimization of the sand-EPE composite cushion in rock sheds. J. Mt. Sci. 2024, 21, 676–689. [Google Scholar] [CrossRef]
- Zhao, P.; Yuan, S.; Li, L.; Ge, Q.; Liu, J.; Du, L. Experimental study on the multi-impact resistance of a composite cushion composed of sand and geofoam. Geotext. Geomembr. 2021, 49, 45–56. [Google Scholar] [CrossRef]
- Ge, Q.; Zuo, W.; Liu, R.; Zhu, B.; Zhao, P.; Wan, L.; Wang, Y.; Zhao, R. Experimental studies for shear and multi-impact resistance performance of sand–geofoam material. Buildings 2022, 12, 633. [Google Scholar] [CrossRef]
- ASTM D2487; Standard Practice for Classification of Soils for Engineering Purpose (Unified Soil Classification System). ASTM: West Conshohocken, PA, USA, 2021.
- Ozturk, U.E.; Anlas, G. Hydrostatic compression of anisotropic low density polymeric foams under mul-tiple loadings and unloadings. Polym. Test. 2011, 30, 737–742. [Google Scholar] [CrossRef]
- Buckingham, E. On physically similar systems: Illustrations of the use of dimensional equations. Phys. Rev. 1914, 4, 345. [Google Scholar] [CrossRef]
- Mougin, J.P.; Perrotin, P.; Mommessin, M.; Tonnelo, J.; Agbossou, A. Rock fall impact on reinforced concrete slab: An experimental approach. Int. J. Impact Eng. 2005, 31, 169–183. [Google Scholar] [CrossRef]
- Peila, D.; Oggeri, C.; Castiglia, C. Ground reinforced embankments for rockfall protection: Design and evaluation of full scale tests. Landslides 2007, 4, 255–265. [Google Scholar] [CrossRef]
- Prisco, C.D.; Vecchiotti, M. Design charts for evaluating impact forces on dissipative granular soil cushions. J. Geotech. Geoenviron. 2010, 136, 1529–1541. [Google Scholar] [CrossRef]


| Type | Physical Quantity | Symbol | Scaling Factor |
|---|---|---|---|
| Geometry property | Length | 1/6 | |
| Displacement | 1/6 | ||
| Material property | Density | 1 | |
| Elastic modulus | 1/6 | ||
| Mass | (1/6)3 | ||
| Dynamic property | Impact energy | (1/6)4 | |
| Impact force | (1/6)3 | ||
| Acceleration | 1 | ||
| Duration time | (1/6)0.5 | ||
| Stress | 1/6 | ||
| Strain | 1 |
| Model Test | Geofoam Type | Geofoam Thickness (m) | Sand Thickness (m) |
|---|---|---|---|
| U | None | None | 0.15 |
| S1 | EPS | 0.01 | 0.14 |
| S2 | EPS | 0.02 | 0.13 |
| S4 | EPS | 0.04 | 0.11 |
| S6 | EPS | 0.06 | 0.09 |
| E1 | EPE | 0.01 | 0.14 |
| E2 | EPE | 0.02 | 0.13 |
| E4 | EPE | 0.04 | 0.11 |
| E6 | EPE | 0.06 | 0.09 |
Disclaimer/Publisher’s Note: The statements, opinions and data contained in all publications are solely those of the individual author(s) and contributor(s) and not of MDPI and/or the editor(s). MDPI and/or the editor(s) disclaim responsibility for any injury to people or property resulting from any ideas, methods, instructions or products referred to in the content. |
© 2025 by the authors. Licensee MDPI, Basel, Switzerland. This article is an open access article distributed under the terms and conditions of the Creative Commons Attribution (CC BY) license (https://creativecommons.org/licenses/by/4.0/).
Share and Cite
Meng, X.; Jiang, Q.; Gao, H.; Feng, H. Experimental Study on Impact Responses of Geofoam Reinforced Sand Cushion for Rockfall Hazard Mitigation. Sustainability 2025, 17, 6057. https://doi.org/10.3390/su17136057
Meng X, Jiang Q, Gao H, Feng H. Experimental Study on Impact Responses of Geofoam Reinforced Sand Cushion for Rockfall Hazard Mitigation. Sustainability. 2025; 17(13):6057. https://doi.org/10.3390/su17136057
Chicago/Turabian StyleMeng, Xiaoyu, Qinghui Jiang, Huajian Gao, and Hanlin Feng. 2025. "Experimental Study on Impact Responses of Geofoam Reinforced Sand Cushion for Rockfall Hazard Mitigation" Sustainability 17, no. 13: 6057. https://doi.org/10.3390/su17136057
APA StyleMeng, X., Jiang, Q., Gao, H., & Feng, H. (2025). Experimental Study on Impact Responses of Geofoam Reinforced Sand Cushion for Rockfall Hazard Mitigation. Sustainability, 17(13), 6057. https://doi.org/10.3390/su17136057