Article

A Rapid Assessment Method for Evaluating the Seismic Risk of Individual Buildings in Lisbon

by
Francisco Mota de Sá
,
Mário Santos Lopes
,
Carlos Sousa Oliveira
and
Mónica Amaral Ferreira
*
CERIS—Civil Engineering Research and Innovation for Sustainability, Department of Civil Engineering, Architecture and Environment, Instituto Superior Técnico, Universidade de Lisboa, Av. Rovisco Pais 1, 1049-001 Lisboa, Portugal
*
Author to whom correspondence should be addressed.
Sustainability 2025, 17(13), 6027; https://doi.org/10.3390/su17136027
Submission received: 17 April 2025 / Revised: 20 June 2025 / Accepted: 24 June 2025 / Published: 1 July 2025
(This article belongs to the Section Hazards and Sustainability)

Abstract

Assessing the seismic performance of buildings from various epochs is essential for guiding retrofitting policies and educating occupants about their homes’ conditions. However, limited resources pose challenges. Some approaches focus on detailed analyses of a limited number of buildings, while others favor broader coverage with less precision. This paper presents a seismic risk assessment method that balances and integrates the strengths of both, using a comprehensive building survey. We propose a low-cost indicator for evaluating the structural resilience of individual buildings, designed to inform both authorities and property owners, support building rankings, and raise awareness. This indicator classifies buildings by their taxonomy and uses analytical capacity curves (2D or 3D studies) obtained from consulting hundreds of studies to determine the ultimate acceleration (agu) that each building type can withstand before collapse. It also considers irregularities found during the survey (to the exterior and interior) through structural modifiers Δ, and adjusts the peak ground acceleration the building can withstand, agu, based on macroseismic data from past events and based on potential retrofitting, Δ+. Although this method may not achieve high accuracy, it provides a significant approximation for detailed analysis with limited resources and is easy to replicate for similar constructions. The final agu value, considered as resistance, is then compared to the seismic demand at the foundation of the building (accounting for hazard and soil conditions at the building location), resulting in a final R-value. This paper provides specificities to the methodology and applies it to selected areas of the City of Lisbon, clearly supporting the advancement of a more sustainable society.

1. Introduction

Mainland Portugal and the Azores archipelago are located near the Azores–Gibraltar fracture, which is the boundary between the Euro–Asian and African tectonic plates and is characterized by significant seismic activity [1]. Therefore, the risk of strong earthquakes occurring in the country is real, and while it is not possible to predict when an event may occur, we can attempt to evaluate the potential consequences if it does happen.
The country’s history is full of seismic events, the most famous of which dates back to 1755. During this event, an earthquake estimated to have had a magnitude between 8.5 and 8.9 on the Richter scale claimed thousands of lives and caused great destruction, particularly in the Lisbon area. The earthquake also had strong effects in Setúbal, the Algarve region, and even in Morocco. More recently, in the early morning of 28 February 1969, an earthquake also felt in Lisbon and the southern regions, reaching M7.9 on the Richter scale, resulted in the death of 13 people [1]. Other regions of the country are also prone to earthquakes, such as the Azores region, where on 1 January 1980, an earthquake with a local magnitude of M7.2 on the Richter scale occurred, resulting in 73 deaths [2].
Lisbon, the capital of Portugal, lies within a seismic zone prone to significant earthquakes, with intensities ranging from VII to IX on the IMM scale, and occurring approximately once every 200 (±50) years. Presently, it boasts a population of around 500,000 inhabitants residing in approximately 50,000 residential buildings, alongside 10,000 other structures, including commercial, historical, industrial, and housing facilities. During working hours, the population inside the city doubles. Over 50% of the buildings predate 1960, when the initial simplified building code was introduced. Constructed primarily from old masonry or a mixture of masonry with reinforced concrete slabs, some of these structures date back more than 250 years (see Figure 1).
Despite the historical event of 1755, current residents of Lisbon have not experienced a strong earthquake in their lifetime. As a result, they remain largely unaware of the seismic risk and hazard, lacking a clear perception of the potential dangers. This lack of awareness diminishes public motivation for preparedness, influencing the government, which is driven by electoral demands, to deprioritize initiatives aimed at addressing seismic risks [3]. However, some building owners are concerned about this risk, feeling that potential losses may be unacceptable. For them, and some decision-makers, having a way to quantify the seismic risk of their buildings could be beneficial for designing options and making decisions on policies and programs.
In the absence of an official “Certification”, evaluating building seismic risk may be beyond the reach of most individuals due to a lack of technical expertise and financially affordable means. For the Lisbon City Council (CML), which owns more than 3000 occupied buildings (20,000 apartments), many built before the first Portuguese earthquake-resistant regulations of the modern age which dates back to 1958, seismic risk has become a concern.

2. Objectives

The purpose of this paper is to describe a cost-effective seismic risk indicator to inform decisions on seismic risk reduction in the city of Lisbon and to disseminate it to the population to raise public awareness and contribute to a sustainable built environment.

2.1. The Initial Request by the Lisbon City Council

The work started following a City Council consultation with Instituto Superior Técnico (IST) to develop a seismic risk assessment survey (Sections S2 and S3 of the Supplemental Materials) for individual buildings belonging to the City Council, aiming to aid in prioritizing rehabilitation interventions. This procedure, to be extended to the entire town building stock (approximately 60,000 housing buildings), should be resource-efficient, requiring only a few hours to inspect each building on-site by a team of two trained personnel. It should generate an index (R) that reflects the resistance of a building, considering the seismic hazard and soil characteristics of its location, as well as vulnerability factors, including penalties for irregularities and pathologies, and bonuses for rehabilitation interventions already completed. This aim had several objectives: to provide a hierarchy of buildings in terms of their potential seismic performance, leading to the establishment of priorities for intervention, and increasing people’s awareness of seismic risk to foster earthquake risk prevention policies.
Therefore, this work supports sustainability goals by promoting safer and more resilient urban environments. Earthquake-related economic losses can take decades to recover from, making their reduction essential for long-term development. Even more significant, however, are the impacts on the cultural and social fabric of affected communities. For instance, Amatrice, severely damaged during the 2016 Central Italy seismic crisis, was fully evacuated and remains largely uninhabited. Prolonged displacement has disrupted the transmission of local traditions and cultural identity, as residents often rebuild their lives elsewhere and may never return. In contrast, nearby Norcia, which had implemented seismic strengthening measures, experienced less damage from a similar event and recovered more quickly. Temporary displacement allowed residents to return, helping to preserve the community’s cultural heritage. These examples illustrate how seismic resilience not only supports economic sustainability but also plays a vital role in safeguarding cultural identity. Early vulnerability assessments and proactive risk mitigation are essential to building sustainable and resilient communities.

2.2. Reevaluation of Objectives

Since Lisbon City Council could only attribute limited resources per building, say, on average, one day of work and a few hundred euros per building, it is not possible to conduct tests on materials to characterize their mechanical properties, to conduct a geometric survey, nor to elaborate mathematical models or structural analysis. Therefore, conducting such assessments comprehensively for all buildings in high seismic risk areas is not feasible, and may also be prohibitive for smaller areas. However, even at a large scale, it would be possible to conduct a visual inspection of each building, both the exterior and interior. This way, a certification of individual buildings becomes impossible, as for the common citizen, the word “certification” is a guarantee, as one can be obtained if the quality of design and construction are assured by checking procedures during the whole design and construction process. As in the case of existing buildings that require knowledge of material properties, dimensions, and details (of reinforcement in reinforced concrete buildings and connections in masonry structures), and in the case of existing buildings and with the available resources, the information would be incomplete., but it is possible to provide political decision-makers and the general public with information that helps distinguish between buildings—similar to the insights an expert would gain when purchasing a flat or office through their knowledge and inspection. Although this information serves as an indicator and is less reliable than a certificate, it represents a significant step forward in seismic risk reduction policies. This is particularly important in countries like Portugal, where seismicity involves very strong events with long return periods, leading to a gradual loss of memory of past events among the population and politicians, and highlighting the need to increase seismic risk awareness. Experience shows that general information about the seismic resistance of building stock is insufficient, as people do not perceive the problem as personal. This is improved when individuals receive information about the potential seismic performance of the specific buildings where they live or work.
In this paper, the methodology and details of this indicator are briefly described. The paper is structured as follows: Following this brief introduction, we examine the seismic risk on both a “macro” (large urban area) and “micro” (individual buildings) scale, focusing on their objectives, challenges, and proposed solutions. We summarize the proposal for conducting “micro” studies in a city like Lisbon, where historic buildings with multiple rehabilitations coexist alongside modern reinforced concrete (RC) structures. Subsequently, we introduce the concept of agu, used to quantify seismic resistance, for masonry and RC building typologies. To distinguish buildings from each other within each typology, considering the state of conservation and irregularities “modifiers Δ” with values between 0 and 1 that, when multiplied by agu, reduce the respective value, were considered, as well as “modifiers Δ+” with values above 1 that increase the value of agu to incorporate the effects of rehabilitation works. Lastly, we compare the results from a detailed analysis with those from the proposed approach, present the main achievements, and outline directions for future research.

3. Assessing Seismic Risk in Urban Areas

3.1. State of the Art
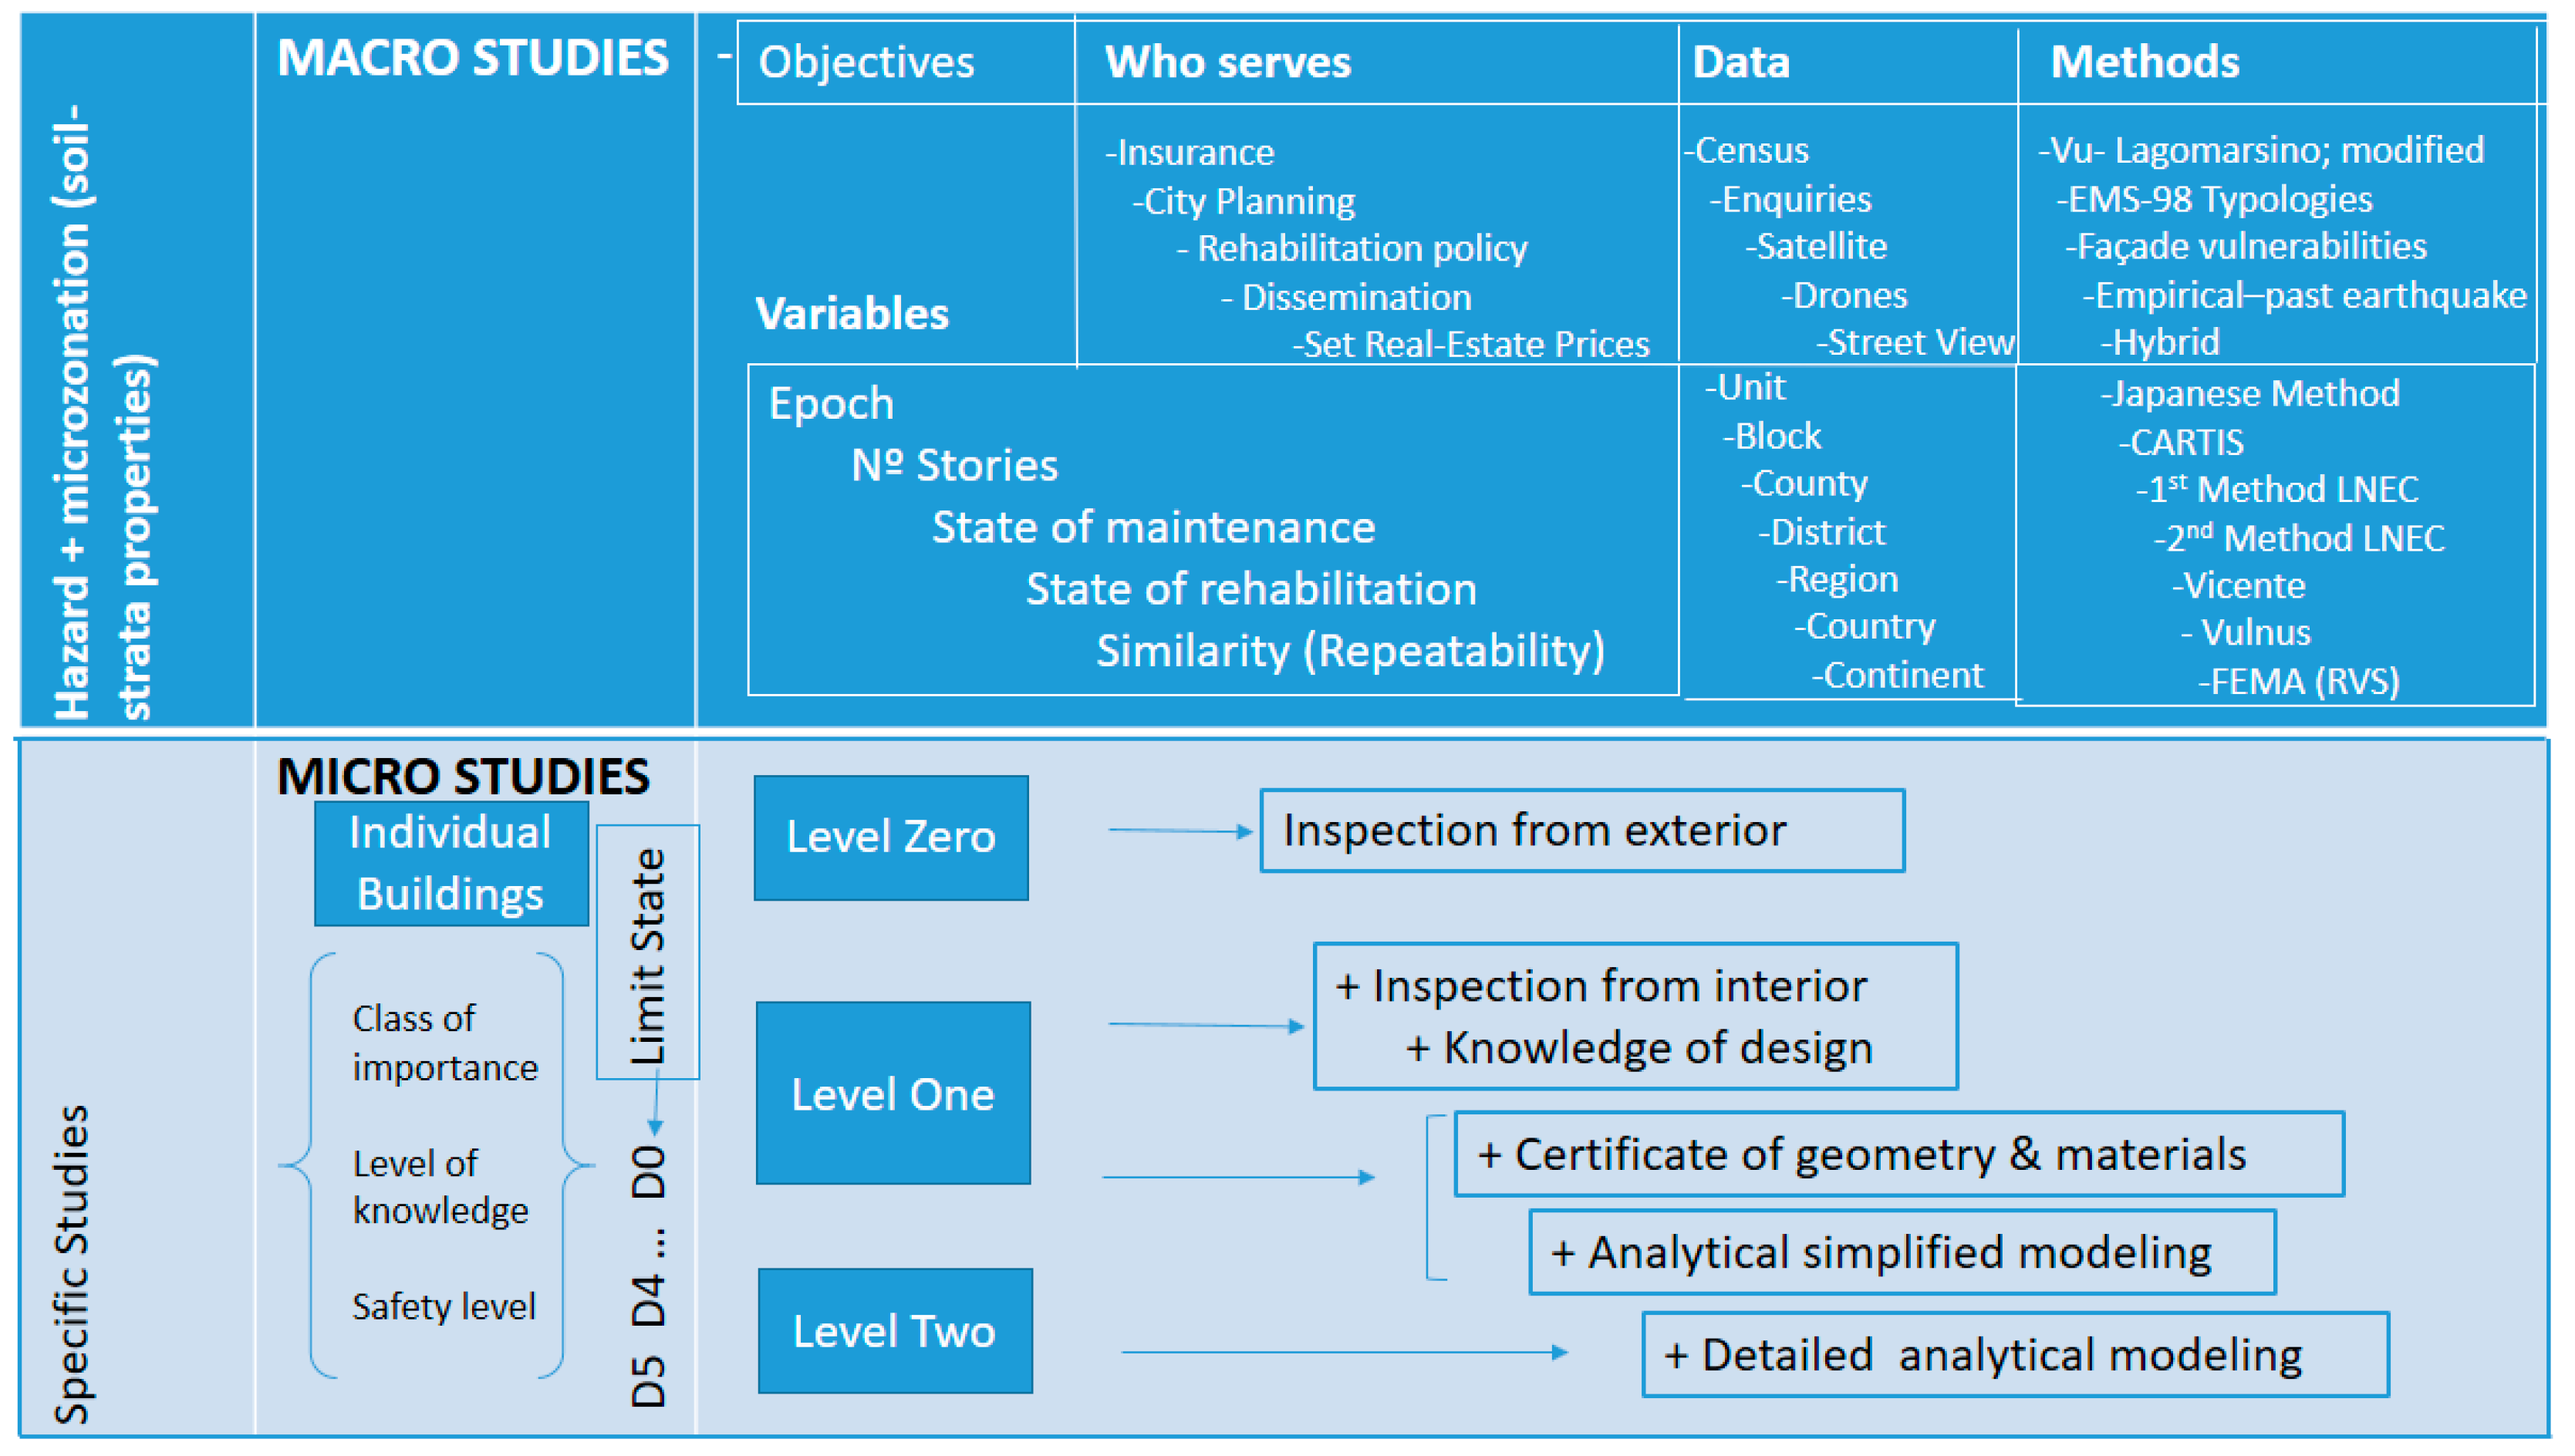
Understanding seismic risk in urban areas is crucial for communities, serving as a vital tool for planning new constructions and aiding decision-makers in preparing for future events, such as promoting retrofitting initiatives. Extensive research has been conducted on this topic, with methods for estimating seismic impacts varying based on the scale of analysis—individual buildings, city blocks, parishes, entire cities, and regions. These approaches also depend on the availability and quality of data and the specific objectives of the study. In resource-limited situations, the scope of the investigation directly influences the level of uncertainty in the results. Consequently, experts often use simplified models for larger areas and more detailed models for smaller-scale analyses. Even when focusing on individual buildings—which represent the smallest unit of analysis—methods differ in terms of the detail of the data collected and, consequently, in the modeling specificity. At broader scales, census data and simplified vulnerability formulations, coupled with large geographical units, may suffice. Conversely, for individual buildings, analyses can range from simplified approaches to highly detailed examinations that incorporate material properties and the application of mechanical methods outlined in modern building codes. While a comprehensive analysis is necessary to certify a building’s seismic safety with an official “stamp” or “certificate of conformity”, a more cost-effective tool can offer an approximate assessment of its earthquake resilience by using simpler, cheaper, and quicker tools.
The reliability of the results depends on the depth of information gathered and the models used to evaluate seismic resistance. By analyzing numerous individual buildings, findings can be aggregated, often employing the principle of “similarity” or “repeatability” to assess risks over a larger number of buildings.
The following section will outline various methodologies for large-scale analyses and will subsequently focus on methods tailored for individual buildings, highlighting their respective advantages and disadvantages.
The approaches mentioned earlier can be succinctly categorized into two key types (Figure 2), as already mentioned: “macro” analysis and “micro” analysis. Macro analysis focuses on large urban areas, prioritizing efficiency over thoroughness. For this purpose, the use of “scores” was proposed at the end of the last century as a solution for the rapid assessment of large sets of buildings through visual exterior inspection, and is now used worldwide [4]. In contrast, micro analysis involves a more thorough examination at the building level. Within the scope of “micro” analysis, we can identify three levels of detail:
(i).
Level Zero: a basic visual inspection conducted from the exterior, often supplemented by tools like StreetView or satellite imagery to identify key parameters;
(ii).
Level One: a more detailed inspection that incorporates both exterior and interior evaluations along with insights into the building design; and
(iii).
Level Two: the most rigorous level, which includes materials characterization and the use of simplified or detailed analytical modelling to assess structural behavior.
Recently, numerous proposals have been developed to address macro-scale analyses. Notable contributions, listed in alphabetical order, include those by [5,6,7,8,9,10,11,12,13,14,15,16,17,18,19,20,21,22,23,24,25,26,27,28,29,30,31,32,33].
These studies explore various methods for analyzing uncertainties in large urban areas, ranging from the CARTIS solution [32] to more holistic appraisal approaches. The CARTIS methodology for assessing the vulnerability of groups of buildings focuses on their similarities, such as being constructed in the same era, within the same neighborhood, by the same contractors, and using similar construction methods. In Italy, a database was developed to analyze these similar buildings.
Macro-level studies heavily rely on census data and a limited set of parameters to characterize building stock, as illustrated in Figure 2. These studies analyze individual buildings within a broader urban context using variables collected in the census, often supplemented by additional information from sources like Street View or exterior observations. For instance, refs. [15,33] employ a table comprising 14 or 15 parameters derived from a simple inspection of façades and the interior organization of masonry walls. Furthermore, classes defined in EMS-98 [34] are commonly employed in macro studies. From the most complex to the least complex methodologies, we can mention several simplified models. The NEHRP [4] and FEMA guidelines [35,36] apply the Rapid Visual Screening (RVS) approach, which assigns “scores” to key parameters to rank their influence and provides guidelines for prioritizing building rehabilitation. Similarly, the Institute of Building Research [37] provides frameworks for retrofitting reinforced concrete buildings in Japan. Proença [38] applied a similar methodology in the assessment of seismic vulnerabilities in Portuguese reinforced concrete healthcare buildings. These approaches demonstrate the adaptability of macro-level methods to varying data availabilities and project goals, offering a spectrum of tools for evaluating seismic risks efficiently in large urban contexts.
While results at the macro scale are suitable for groups of buildings and are presented accordingly (e.g., heat maps and their variations, smoothing, averages, etc.), transitioning to a micro scale with individual buildings requires the consideration of additional parameters. Generally, there are three levels of analysis, as shown in Figure 2, depending on the specificity required. The choice between the alternatives depends on the aims and resources available. The methodology for the indicator described in this paper can be considered between Levels Zero and One or at the most basic level of Level One, as it based essentially on the exterior and interior inspection of buildings and previously gathered information on soil characteristics (information available at the Lisbon Council, gathered from the construction of buildings all over the town and microzonation studies [39]), but without measuring geometry, testing, and analysis. Within Level One, more sophisticated approaches are possible, involving the consideration of more information on design, geometry, materials, and, in some cases, analysis, as discussed in [40]. According to codes and in several instances, a detailed characterization of materials and connections between elements is needed, as well as a comprehensive analytical study, sometimes requiring non-linear analysis.
The upcoming section concentrates on what we term “individual building-micro analysis,” emphasizing the higher degree of detail and rigor required for such assessments. Towards the conclusion, we will explore the relevance of a blended solution (micro and macro approaches) for large urban areas. For a comprehensive understanding of different analyses and methodologies, we recommend consulting [41,42].
The different methodologies require different levels of information and have different objectives, both in terms of the subject of analysis and the accuracy and reliability of the results. Therefore, they are not directly comparable as they serve different purposes.

3.2. An Indicator of Seismic Risk for Lisbon

In order to develop the indicator, we decided not to adopt FEMA’s Rapid Visual Screening (RVS) approach, which has been widely implemented in many countries, as our focus is on buildings in Lisbon and their evolution over the past 270 years. This period encompasses multiple regulatory changes and structural modifications, typically occurring at intervals of approximately 50 years. Adapting the RVS approach to Lisbon would necessitate substantial modifications to account for the city’s distinct building typologies, construction materials, and historical seismic regulations. Instead, we opted for a methodology tailored specifically to Lisbon’s building stock, prioritizing accuracy in capturing the complexities of its architectural evolution and seismic vulnerabilities over time. This decision ensures that the analysis aligns with the local context, providing more reliable insights into the seismic resilience of the city’s structures. In any case, it appeared challenging to develop a methodology that could characterize the potential seismic performance of each building from among tens of thousands based on just a few hours of inspection per building.
The available resources point to a methodology of a level between Zero and One (Figure 2), which does not correspond to any of the existing methods and needs to be tailored for the Lisbon building typologies. Therefore, an innovative concept was developed—introducing a new feature of this methodology—and designed to capture the unique characteristics of each of the tens of thousands of buildings that exist in Lisbon, through a two-step process:
1—To divide the Lisbon building stock into groups characterized by the constructive type and number of floors, assuming average dimensions and the quality of construction for each epoch of construction;
2—To distinguish individual buildings within each group by means of the structural irregularities and state of conservation.
Additionally, we aimed to associate the indicator with a clear physical meaning to convey an easily understandable concept to laypeople: it represents the intensity of the seismic event for which new buildings are designed at the building’s location, according to codes of practice (EC 8 and the Portuguese National Annex), divided by the building’s actual seismic resistance. In simpler terms, it reflects the seismic resistance of the building that should be compared to its current seismic resistance, indicating the level of risk. To express the intensity of the seismic action with a single parameter, the response spectrum is defined by the product of the PGA by a response spectrum defined for PGA = 1, which establishes the shape of the response spectrum. We adopted the shape of the standard response spectrum (return period of 475 years) defined by Eurocode 8 for seismic action type 1, which represents a far-field, large-magnitude event, richer in lower frequencies than the other code-defined seismic action, type 2, as it is considered more critical for the collapse verification of most buildings in Lisbon [43].
Therefore, it can be concluded that the novelty of the proposed methodology lies more in the way different existing tools are put together to provide, in the context of a work with very limited resources, an indicator that is physically intuitive and expresses seismic risk to laypeople. For this purpose, the separation of the calculation of agu between the seismic vulnerability of each typology and the distinction between the vulnerability of different buildings of the same typology is a key concept of the described methodology that allows us to achieve the proposed objective with the available resources.
The first step of the methodology begins with the classification of the building stock into typologies based on attributes such as the epoch of construction, the predominant material, and the number of stories. Each typology is then assigned a Resisting Acceleration Index, agu (the PGA that defines the spectrum for seismic action type 1 at the building location), that quantifies its seismic resistance. Following the field survey, we apply “modifier penalties, Δ” to account for the state of preservation and existing structural irregularities in height and plan that could affect the building’s seismic performance. These essentially penalize the initial Resisting Acceleration Index, agu, by multiplying it by Δ (lower than 1), reflecting the increased vulnerability introduced by such irregularities. The agu methodology does not require the conversion of acceleration to macroseismic intensity or vice versa, a process that typically involves significant variability that even a robust database containing both variables can only reduce up to a certain extent.
Conversely, if the building has undergone rehabilitation or retrofitting works, the initial Resisting Acceleration Index, agu, is adjusted upwards using “positive modifier, Δ+”, based on the type and extent of work executed (Figure 3). Rehabilitation efforts such as structural reinforcements or seismic retrofitting are quantified and incorporated into the assessment to reflect improved seismic resilience. At the end, the value of the risk indicator is calculated as the ratio of demand/resistance (capacity). Both are expressed in terms of the PGA (peak ground acceleration), in which the demand value is calculated as the product of the peak value of the acceleration at the bedrock for the standard response spectrum by the soil factor, defined according to EC 8 for each soil type. The soil type in each location, necessary to calculate the demand value of agu, is defined for each location using a database from the Lisbon Council.
Since the indicator relies on incomplete information, as well as information with uncertainties (in the estimation of agu, information on soil characteristics and ∆ values), making it less reliable than a certificate, a good value does not ensure safety during an earthquake and should not be perceived as such. However, it serves as a valuable tool for increasing public awareness about seismic risk, and as a tool to drive demand for building retrofitting and to apply pressure in the real estate price market, encouraging the valuation of safer construction.
The described methodology and respective algorithm is summarized in the following flowchart (Figure 4).

3.3. Methodology Used in This Study

The value of agu for each typology, considering average characteristics of structural element dimensions and mechanical properties of materials, was calculated by establishing bilinear capacity curves and applying the N2 method, as prescribed for pushover analyses in EC 8 (Eurocode 8). This was performed to determine the agu value for type 1 seismic action (a distant, large-magnitude earthquake), which is considered the most severe for failure situations, thereby taking into account the frequency content of the seismic action. The bilinear capacity curves are expressed in terms of three parameters: (i) the period corresponding to the secant stiffness at the yield point, (ii) the inter-storey displacement at yield, and (iii) displacement ductility.
The determination of the capacity curves was carried out differently for masonry and concrete buildings. For masonry buildings, the parameters defining the capacity curves for various typologies were derived from a statistical and technical analysis of the results from over 100 research studies, including numerous master’s and doctoral theses as well as European research projects based on experimental or mechanistic methodologies, covering a total of 619 cases. For concrete buildings, the capacity curves for the frame typology were derived analytically, assuming average dimensions and mechanical properties for columns and beams [44], and assuming a “strong beam—weak column” behavior, as the buildings under analysis predate the application of capacity design principles and the “weak beam—strong column” criterion. For concrete buildings with mixed or shear-wall structures, the agu values were determined by “expert opinion,” considering the values obtained for the frame typology. For steel structure buildings, almost all of which are very recent in Lisbon, the agu value was calibrated using the HAZUS methodology [45].
For the application of the “modifiers,” we employed a mixed-method approach. This involved reviewing international best practices expressed in Vu macroseismic evaluation obtained from field missions to numerous earthquake occurrences, and consulting with several experts to gain insights into the most appropriate adjustments for our specific context.
Emerging technologies, such as satellite imagery with enhanced accuracy and angled views, drone inspections utilizing UAVs, and AI procedures, hold promise for improving the characterization of building stocks. These advancements provide valuable insights into various variables, enhancing precision and expediting the survey process. However, their current capabilities do not extend to assessing the interior geometries or the material properties of buildings, which are essential for a comprehensive seismic evaluation.
In the context of Portugal, and in particular for the Lisbon Council or the Metropolitan Area of Lisbon, several studies have been conducted both at the “Macro” and “Micro” scales. To name a few, we should mention [15,19,20,31,33,42,44,46,47,48,49] for macro-scale studies. For micro-scale studies, key contributions include [38,43,50,51,52,53].

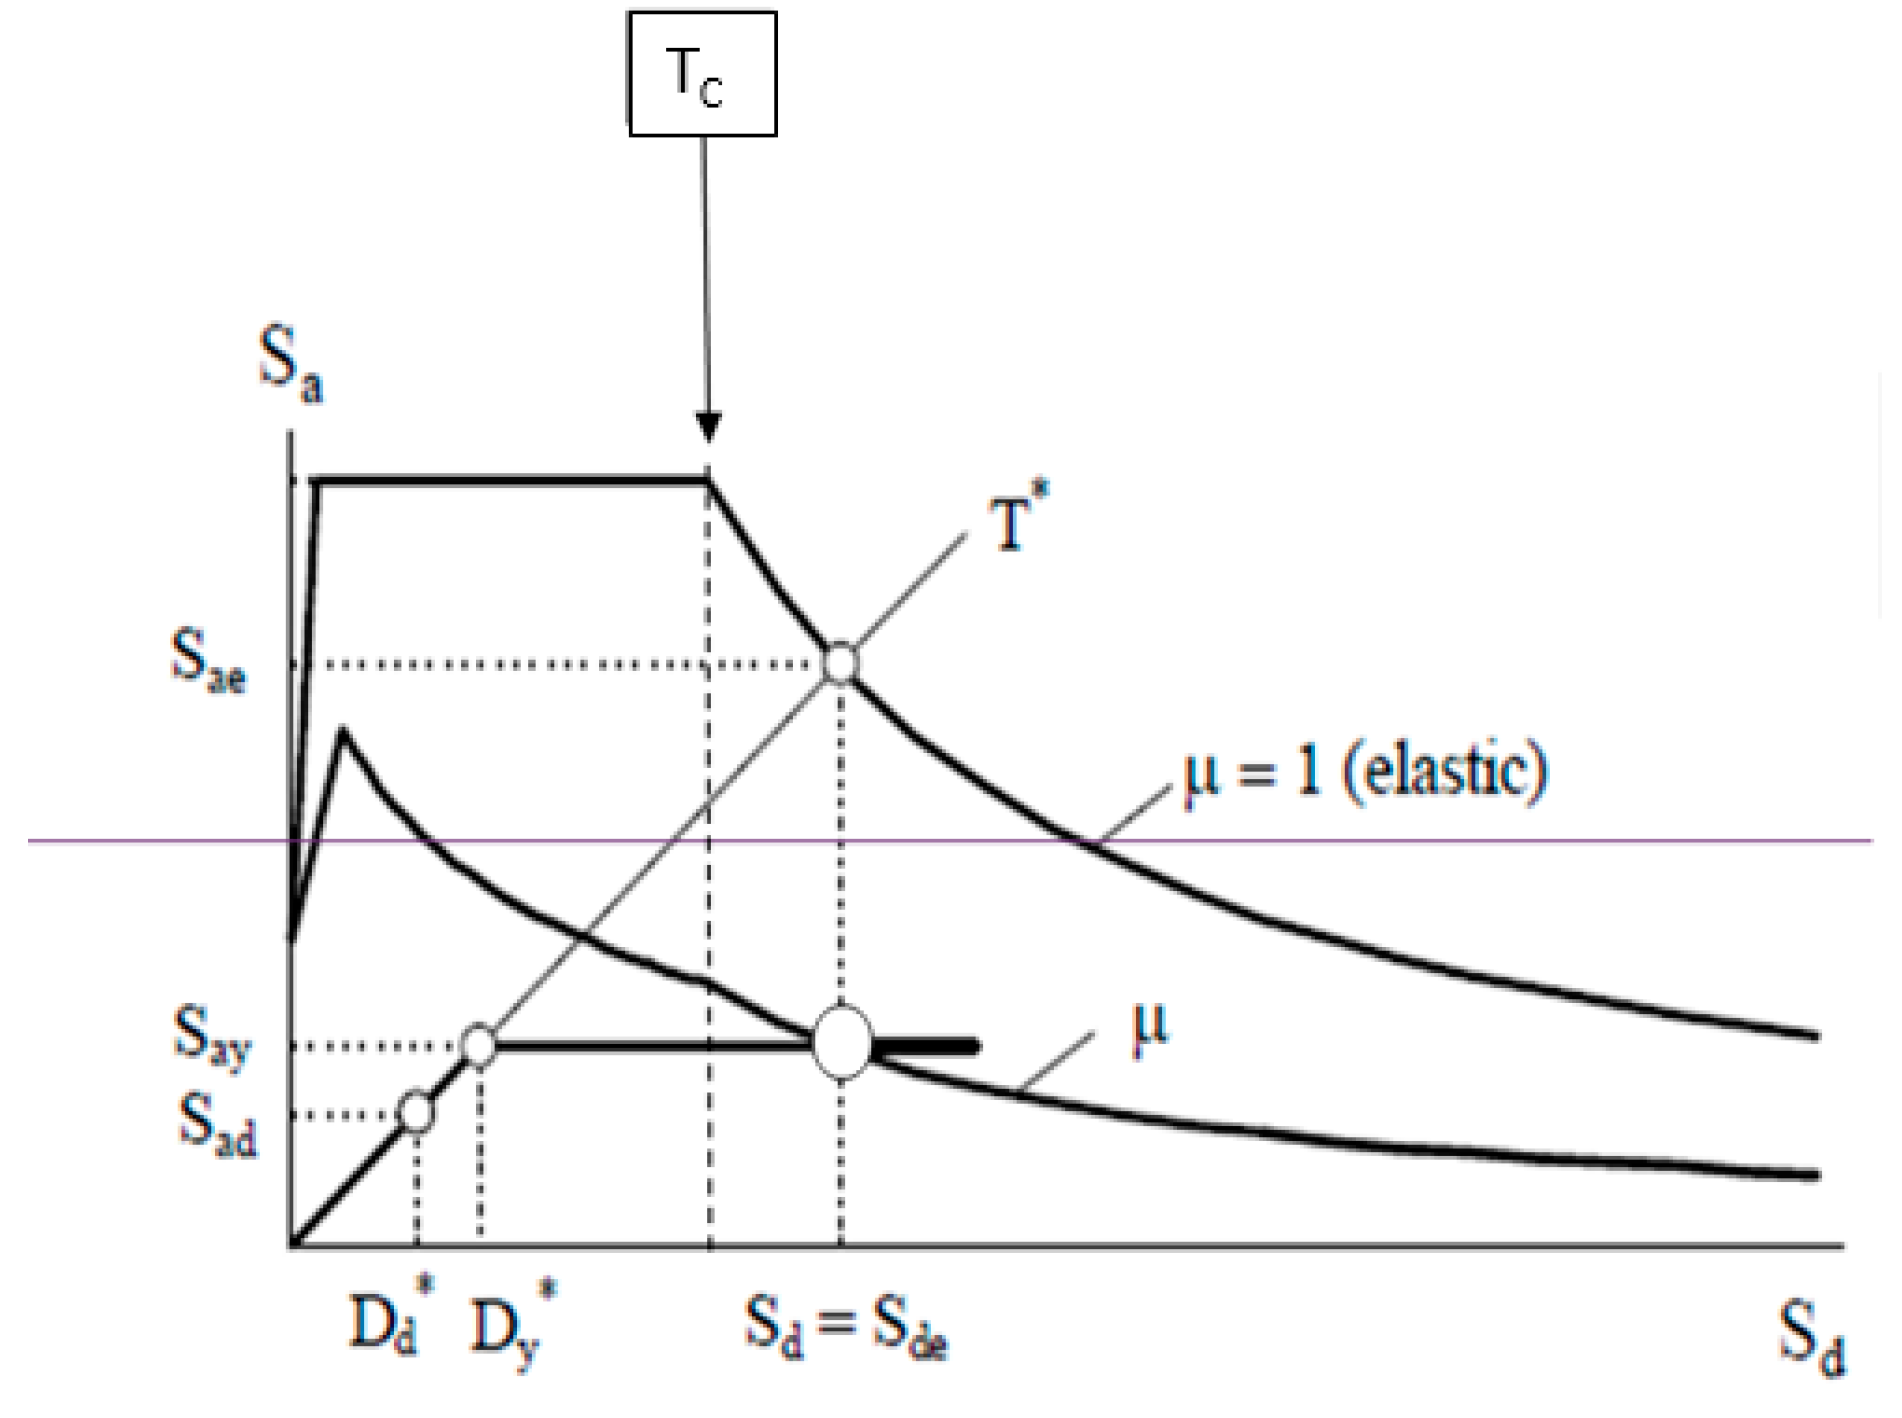
4. The Ultimate Ground Acceleration, AGU (Resisting Acceleration Index)

4.1. Introduction to AGU

We start with agu, which is the core of the methodology. When asked, “How strong is my building in an earthquake?” the answer is not straightforward, both for laypeople and experts. Beyond traditional methods for evaluating the response of buildings to seismic activity, perhaps only the Benedetti and Petrini Vulnerability Index [54], further developed by Giovinazzi and Lagomarsino [55], provides a unique numerical value that conveys seismic vulnerability in a clearly understandable way. However, it lacks a simple physical interpretation and cannot encapsulate, in a single value, a transparent view of the convolution of hazard, vulnerability, and exposure, which are typically proposed when defining risk.
Veletsos and Newmark [56] introduced one of the first formal definitions of the response spectra (RS), a major revolution in Earthquake Engineering that is still used today. This concept, later refined by Newmark and Hall [57], captures most of the information about ground motion. However, the aspect of structural resistance, measured by the Capacity Spectrum, was initially missing. In 1970, the Capacity Spectrum method was first devised by Freeman for a case study for the Puget Sound Naval Shipyard and published subsequently by Freeman and Nicoletti [58] in the US NCEE.
In 1976, Japan’s Ministry of Construction formed a committee to develop a method for assessing the seismic vulnerability of existing low-to-mid-rise reinforced concrete buildings. This resulted in the “Standard for Seismic Vulnerability Assessment of Existing Reinforced Concrete Buildings” (1977). The method, detailed by Okada [37], uses a ratio of Resistant Base Shear (Io) to Demand Base Shear (Iso) to assess safety; a ratio greater than 1.0 indicates that the building is safe. This method was later adapted to EC8 (2004) and extended to masonry buildings by Proença [38].
The term “Vulnerability” was first used in seismic risk assessment in 1984 by Benedetti and Petrini, leading to “The GNDT II method.” This method connects a building’s “Vulnerability Index, Iv” to a “Damage Index, d,” based on the macroseismic intensity using the Mercalli–Cancanni–Sieberg Scale (MCS). In 1988, Fajfar and Fishinger [59] presented, for the first time in the ninth WCEE, the N2 Method for the non-linear seismic analysis of regular buildings. Since then, several other works were published: ATC-40 [60] and FEMA-273 [4] proposed the pushover and non-linear static procedure analyses; and later, Fajfar published a renewed approach to performance-based seismic design [61,62].
Giovinazzi and Lagomarsino [55,63] and Giovinazzi [64] used Fuzzy Set Theory to interpret the linguistics of the EMS-98 scale [34] and presented the Macroseismic Model for the vulnerability assessment of buildings as a modification and improvement of the GNDT method. Lagomarsino and Giovinazzi [65] compared the results of their heuristic methodology with mechanical models. Recently, Lagomarsino et al. [66] introduced a few upgrade issues to the methodology of 2004.
Simultaneously, the New Zealand Society for Earthquake Engineering (NZSEE) published the report “Assessment and Improvement of Structural Performance of Buildings in Earthquakes” [67], where the seismic resistance of some buildings is shown as a percent of the New Building Standard (% NBS) requirements. In his 2016 doctoral thesis, Mota de Sá [22] connected the concepts of demand and capacity in spectral terms. He formally defined and derived the ultimate ground acceleration, agu, and its extension to agk (agk refers to the acceleration leading to limit state k (see Section 4.2)).
The building response to ground shaking involves assessing “Risk” as the ratio of “Demand” to “Capacity.” A building is at “Risk” if this ratio exceeds 1.0. While Japanese and New Zealand methods address this, they are complex and not easily applied quickly. Additionally, the New Zealand procedure is specific to New Zealand, and the % NBS is abstract, making “Demand” and “Capacity” hard to evaluate quickly.
In a time where hazard maps are increasingly accessible, with codes providing similar information about what can be seen as “Demand” at each site, usually in terms of peak ground accelerations (PGA), if a “Capacity” measure could be found for a building, also in PGA units, then a suitable procedure to achieve a similar ratio of demand/capacity translating to some form of risk could be found. This concept led to the development of agu, which, as referred to before, represents the peak ground acceleration (PGA) at the building base (foundation) that causes it to reach its ultimate displacement before collapse or pre-collapse. This concept was already incorporated in the shear capacity at different floor levels of the Japanese method, which are a function of the amplitude of a predefined response spectrum. The key difference with agu is that the former methods both require complete knowledge of the structure under analysis, demanding substantial computational effort. This is a novelty in relation to other methods, and in Section 4.2, a synthesis of the main results for the inversion process is presented, while the full demonstration can be consulted in Section S1 of the Supplemental Materials.
Beyond offering an immediate measure of seismic risk by comparing the values of PGA for the hazard and the action (considering soil influence), here termed agu, this approach incorporates the three traditional components of risk—hazard, vulnerability, and exposure—specifically for an individual building. Furthermore, it provides a convenient way to compare buildings or assess their ability to handle seismic activity after different rehabilitation efforts.

4.2. Definition of agu

If the development of pushover analysis came as a response to the difficulties imposed by non-linear dynamics [60], the N2 method, besides other shortcomings, came as an alternative to the iterative nature of the capacity–spectrum method and its non-convergence problems, as noted by Chopra and other authors [62]. A major advantage of the N2 method lies in its simplicity and closed-form solution, avoiding the above problems and allowing an easy use of its formulae. Figure 5 illustrates the parameters characterizing the capacity curve (CC) of a single degree of the freedom system, while Figure 6 provides a graphical representation of the N2 method, as proposed in EC-8 [68].
In the N2 procedure, an elastic demand spectrum and a bilinear capacity curve are sufficient to determine the expected top displacement of a building under a specific base acceleration. Due to its closed-form solution, the base peak ground acceleration that leads to some top displacement can be calculated by inverting the formulae. Of course, this procedure easily responds to the need to calculate agu, provided that the shape of the response spectrum is known.
Considering the ductility factor μd, in the acceleration–displacement format (Figure 5):
μ d ( % ) = S d / S d y μ = S d / S d y S d u / S d y = S d S d u
where Sd is the spectral displacement, Sdy the yield spectral displacement, and Sdu the ultimate spectral displacement.
μ * = S d u * S d y *
where * is the upper value and
μ = S d u S d y
The following parameters are needed to define the CC curve: Ty, Sdy, and Sdu. Additionally, we need μ for a reduction in spectral values (Figure 6).
Indeed, if one substitutes the displacement response (performance point) by the building’s ultimate displacement, Sdu, the base acceleration that leads to this displacement is agu. Therefore, it can be shown that, by inverting the N2 formulae, agu can be computed by Equations (3) and (4) below. For the full demonstration of these equations, see the Supplemental Materials (Section S1).
(a)
For rigid structures with Ty < Tc:
a g u = S a y S a e ( 1 , T y ) μ 1 T y T C + 1
  • (b) For less rigid structures, with longer periods Ty ≥ TC:
a g u = μ S a y S a e ( 1 , T y )
where f(1;T*) is the demand of an elastic SDOF, with period T*, when subjected to a unitary peak ground acceleration ag = 1.
As an extension of the agu concept, aligned to the D4 state of damage as defined in EMS-98 [34], we can also define other limit states such as ag3 (aligned to D3) or ag2 (aligned to D2). These damage levels (Dk = 0, 1, 2, …, 5) were established according to the EMS-98 damage scale [34] and offer an understanding of the anticipated impacts: D0 (no damage), D1 (negligible damage), D2 (moderate damage), D3 (substantial damage), D4 (near collapse), and D5 (collapse).

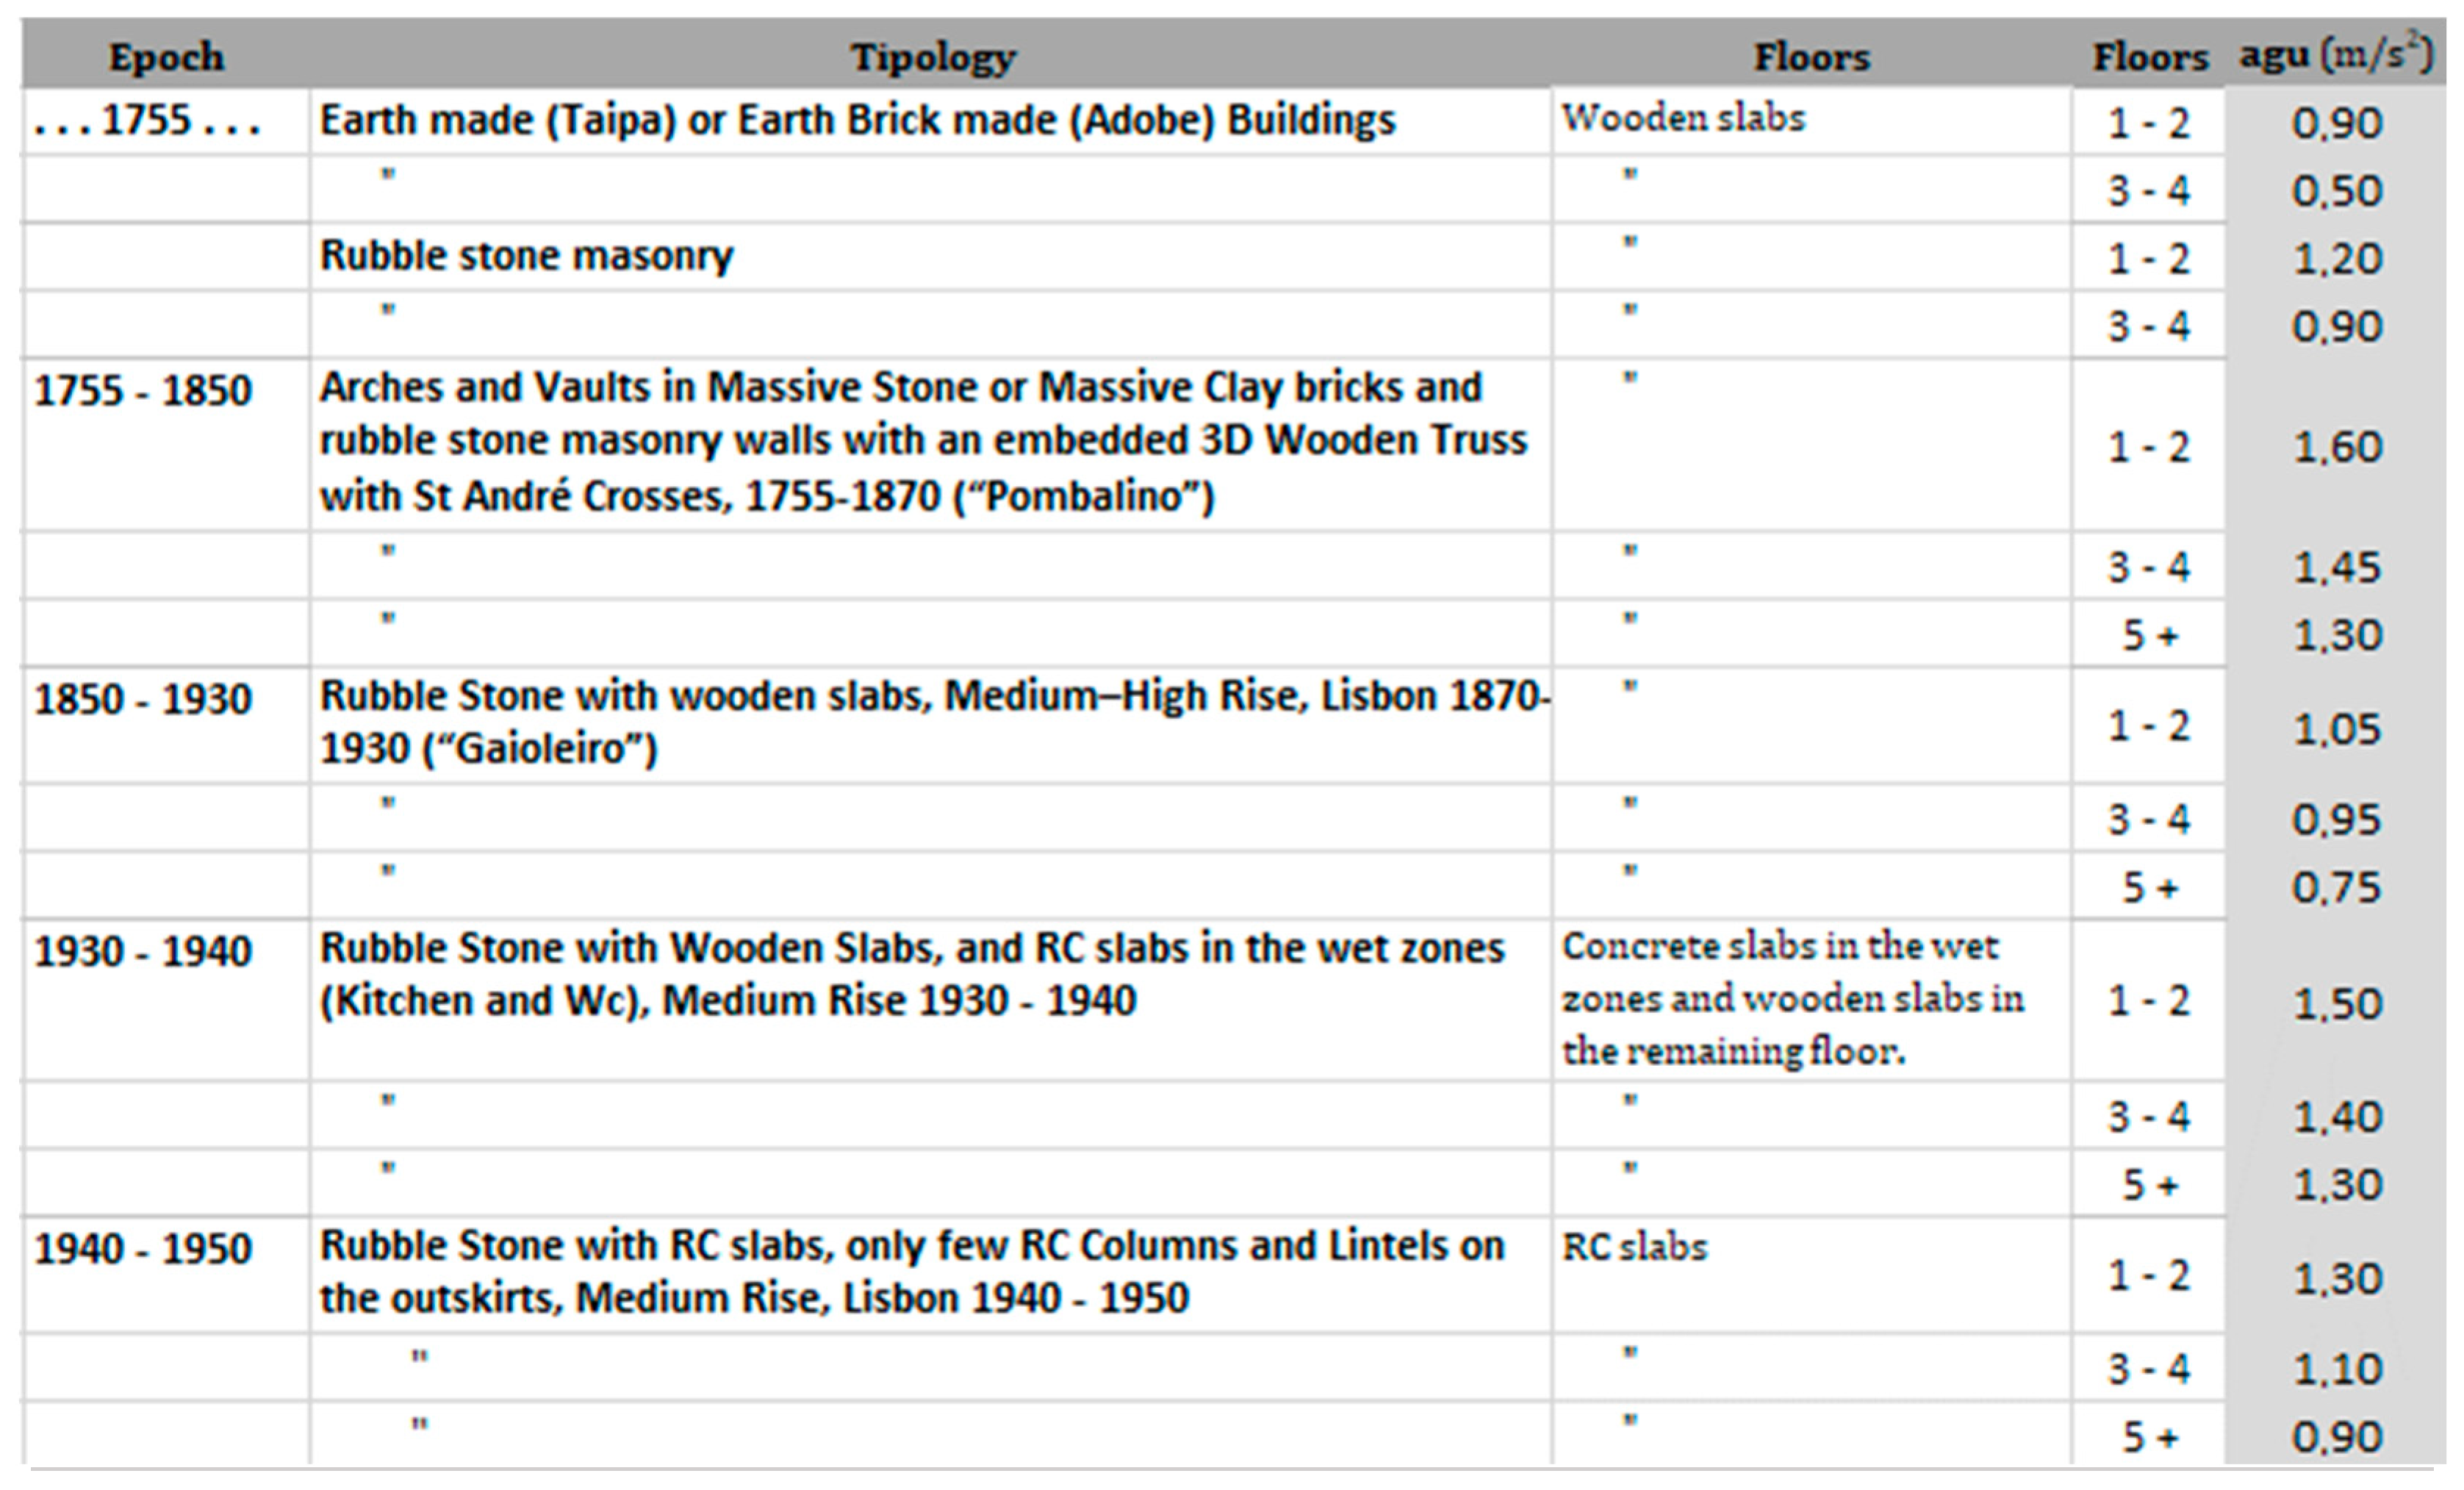
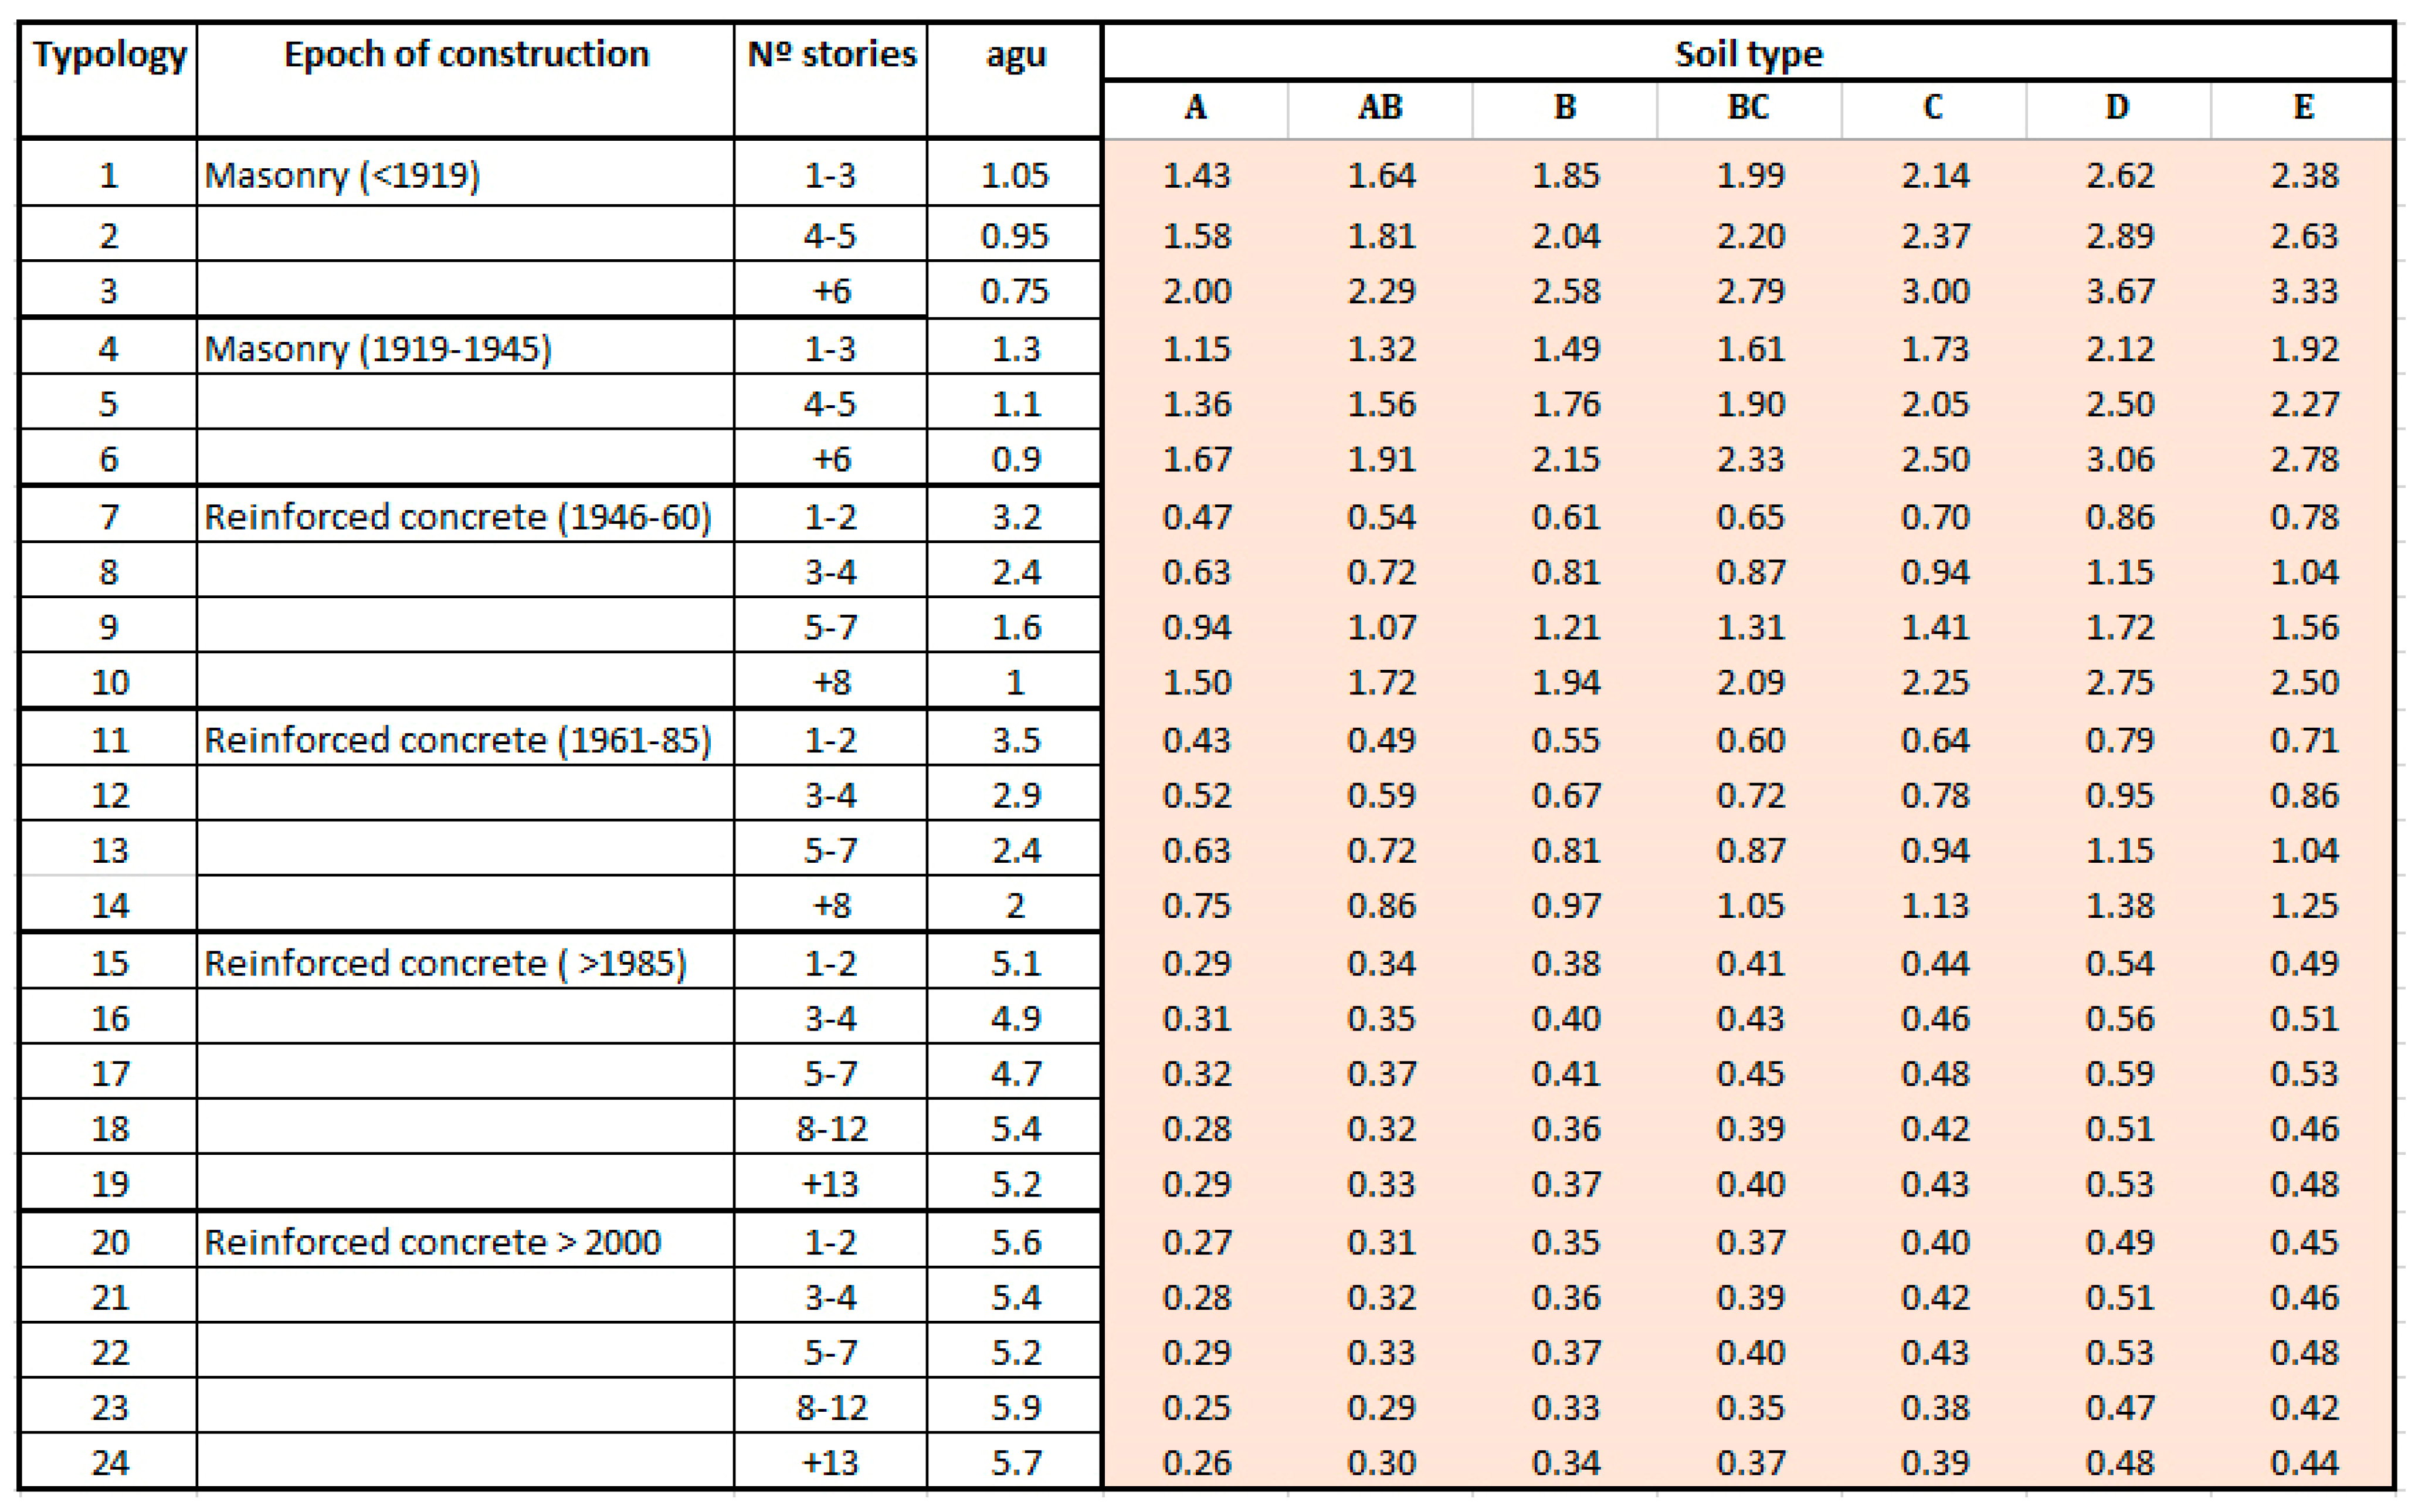
4.3. Capacity Curves and agu Values for the Portuguese Building Stock

Having defined the methodology to derive agu from the demand and the capacity curves (CCs), it is then necessary to find capacity curves representative of the Lisbon building stock. We consider the demand as defined in the code -NP EN 1998-1 [69]. For the capacity curves, two different procedures were followed: one for masonry buildings (M) and the other for reinforced concrete (RC) buildings.
Table 1 presents the adopted eight typologies, which were disaggregated by the number of stories, resulting in a total of 68 distinct categories: 19 dealing with traditional masonry (M) and transition (MT), and 49 with full RC buildings.
All of the so-called masonry buildings were made of poor masonry walls connected at the corners and with timber pavements of varied thicknesses supported at the front and back façades. Lateral walls were built without openings and with narrower thicknesses. These can be subdivided into three groups:
“Joanino Buildings”, the oldest buildings, built before the 1755 earthquake.
“Pombalino Buildings” (1755–1870): constructed after the 1755 earthquake during the city’s reconstruction; usually, the first floor is composed of arches and vaults to open larger spaces for commercial use. Timber crosses, yielding a triangular wood truss structure known as the “Pombalino cage”, are inserted inside resisting walls in the interior of the buildings. This system, very well-conceived for seismic loads, lasted for approximately one century and slowly disappeared during the decades after the mid-19th century.
“Gaioleiro Buildings” (1870–1930): constructed under huge urbanistic pressure due to city expansion; these are of much lower quality and seismic resistance than Pombalino buildings.
The introduction of reinforced concrete started in the early 20th century, but mainly from 1930 onwards. In this period, we can consider the following building types:
“Transition Buildings” (1930–1950): constructed with the development of reinforced concrete (RC), giving rise to a mixed typology of masonry with concrete elements, the “Placa Buildings”, first with wooden slabs and RC on the back side; later with RC slabs in all floor area.
“RC buildings” (1950 to now): several classes of reinforced concrete structures can be considered with the advancement of codes and of the fast technology developments suffered by construction standards.
Transitions between typologies occurred with each new technological advancement. One example is the use of steel columns on the first floor of the “Gaioleiro Buildings” to create larger spaces for commercial use. Steel elements have been utilized since the late 19th century, becoming more prominent in the early 20th century. This is evident in the rear façades, where stairways provide access to upper floors or support balconies that house kitchens and sanitary installations. Other examples include the introduction of reinforced concrete (RC) in beams on the first floor or the use of RC in flooring, replacing timber units.
The RC construction entered slowly as a replacement for the old masonry units, starting with the use of a few beams in the first floor to cope with larger spans, then spreading to the pavements, and finally to replace brick walls with columns. Moment Resisting Frames (MRFs), together with concrete slabs and concrete cores for central stairways and elevator shafts, were the next advancements. The use of shear walls as a resisting element to seismic loads is present only in modern buildings, usually more than 8–10 stories high. The RC construction closely followed the development of codes RSCCS [70], RSEP [71], RGEU [72], REBAP [73], RSA [74], and EC-8 [68] of the 21st century.
The main eight adopted typologies presented in Table 1 were disaggregated by the number of stories, resulting in a total of 68 distinct categories: 19 dealing with traditional masonry (M) and transition (MT), and 49 with full RC buildings.

4.4. Deriving Capacity Curves for Masonry Buildings

Capacity curves for masonry buildings, as identified in Figure 2, were derived from a compilation of studies conducted mainly in Portugal and Italy. These studies focused on various typologies, including the main ones referenced earlier. As previously mentioned, our proposal is supported by the analysis of over 100 studies that used non-linear software or involved experimental work, such as cyclic slow tests and shaking table experiments. For Portuguese structures, we do not have the experience from past earthquakes for calibrating analytical studies, except in the case of the Azores, where two earthquakes occurred in the last 45 years. However, the typologies and materials in the Azores are quite different from those observed in Lisbon. The numerical modelling used for Lisbon buildings is based on material properties derived from tests on elements that are parts of the buildings. We consider as representative geometries for each typology the average observed in typical constructions.
One of the main challenges with masonry buildings is their complex textures, which involve understanding the connections between walls and a wide range of mechanical properties. This complexity leads to significant uncertainties: (i) Analytical models that create capacity curves, considering nonlinear effects, can produce different results depending on the software used [75]. (ii) These models generate multiple outcomes, requiring us to choose one and determine its variability. The challenge is that values in different horizontal directions can vary greatly, especially in older buildings with stiffer transverse (gable) walls making it difficult to decide which value to use. (iii) Additionally, Angiolilli [76] emphasizes the importance of considering aggregates when analyzing old buildings that interact with neighboring structures. Therefore, for each type of masonry buildings, a large amount of experimental and analytical data was gathered, allowing us to calibrate the values of the three variables used to set the pushover curves. However, before the statistical analysis of the data, a qualitative analysis of each data sample was perfored, and a few results that seemed unreliable based on the authors’ sensitivity were excluded. Second, a decision was made on using median and not average values from the data available to avoid very few, less reliable, large or small values having a large effect on the variables that define the pushover curves of each typology. Then, the values of Ty, Sdy, and Sdu were derived from the available data.
For the remaining typologies, such as earth-made, field-stone, simple-stone, and clay brick structures, a database with approximately 130 cases was used, gathered from different national and international works like the RISK-UE (Milutinovic and Trendafiloski) [77] and LessLoss Projects [78]. From these sources, three main parameters for each typology were extracted: the yielding period (Ty) and the displacement ductility (μ). Then, the remaining parameters were derived using Equations (5)–(7).
Γ = 3 n 2 n + 1
S d y = θ y . H t / Γ
S a y = S d y 2 π T y 2
where Γ is the modal participation factor for the first mode; Ht is the total building height; and θ is the chord rotation at yield.
Table S1 of Section S2 of the Supplemental Materials presents the agu of the 23 situations analyzed in the masonry typologies, and Figure 7 gives an extract of Table S1.

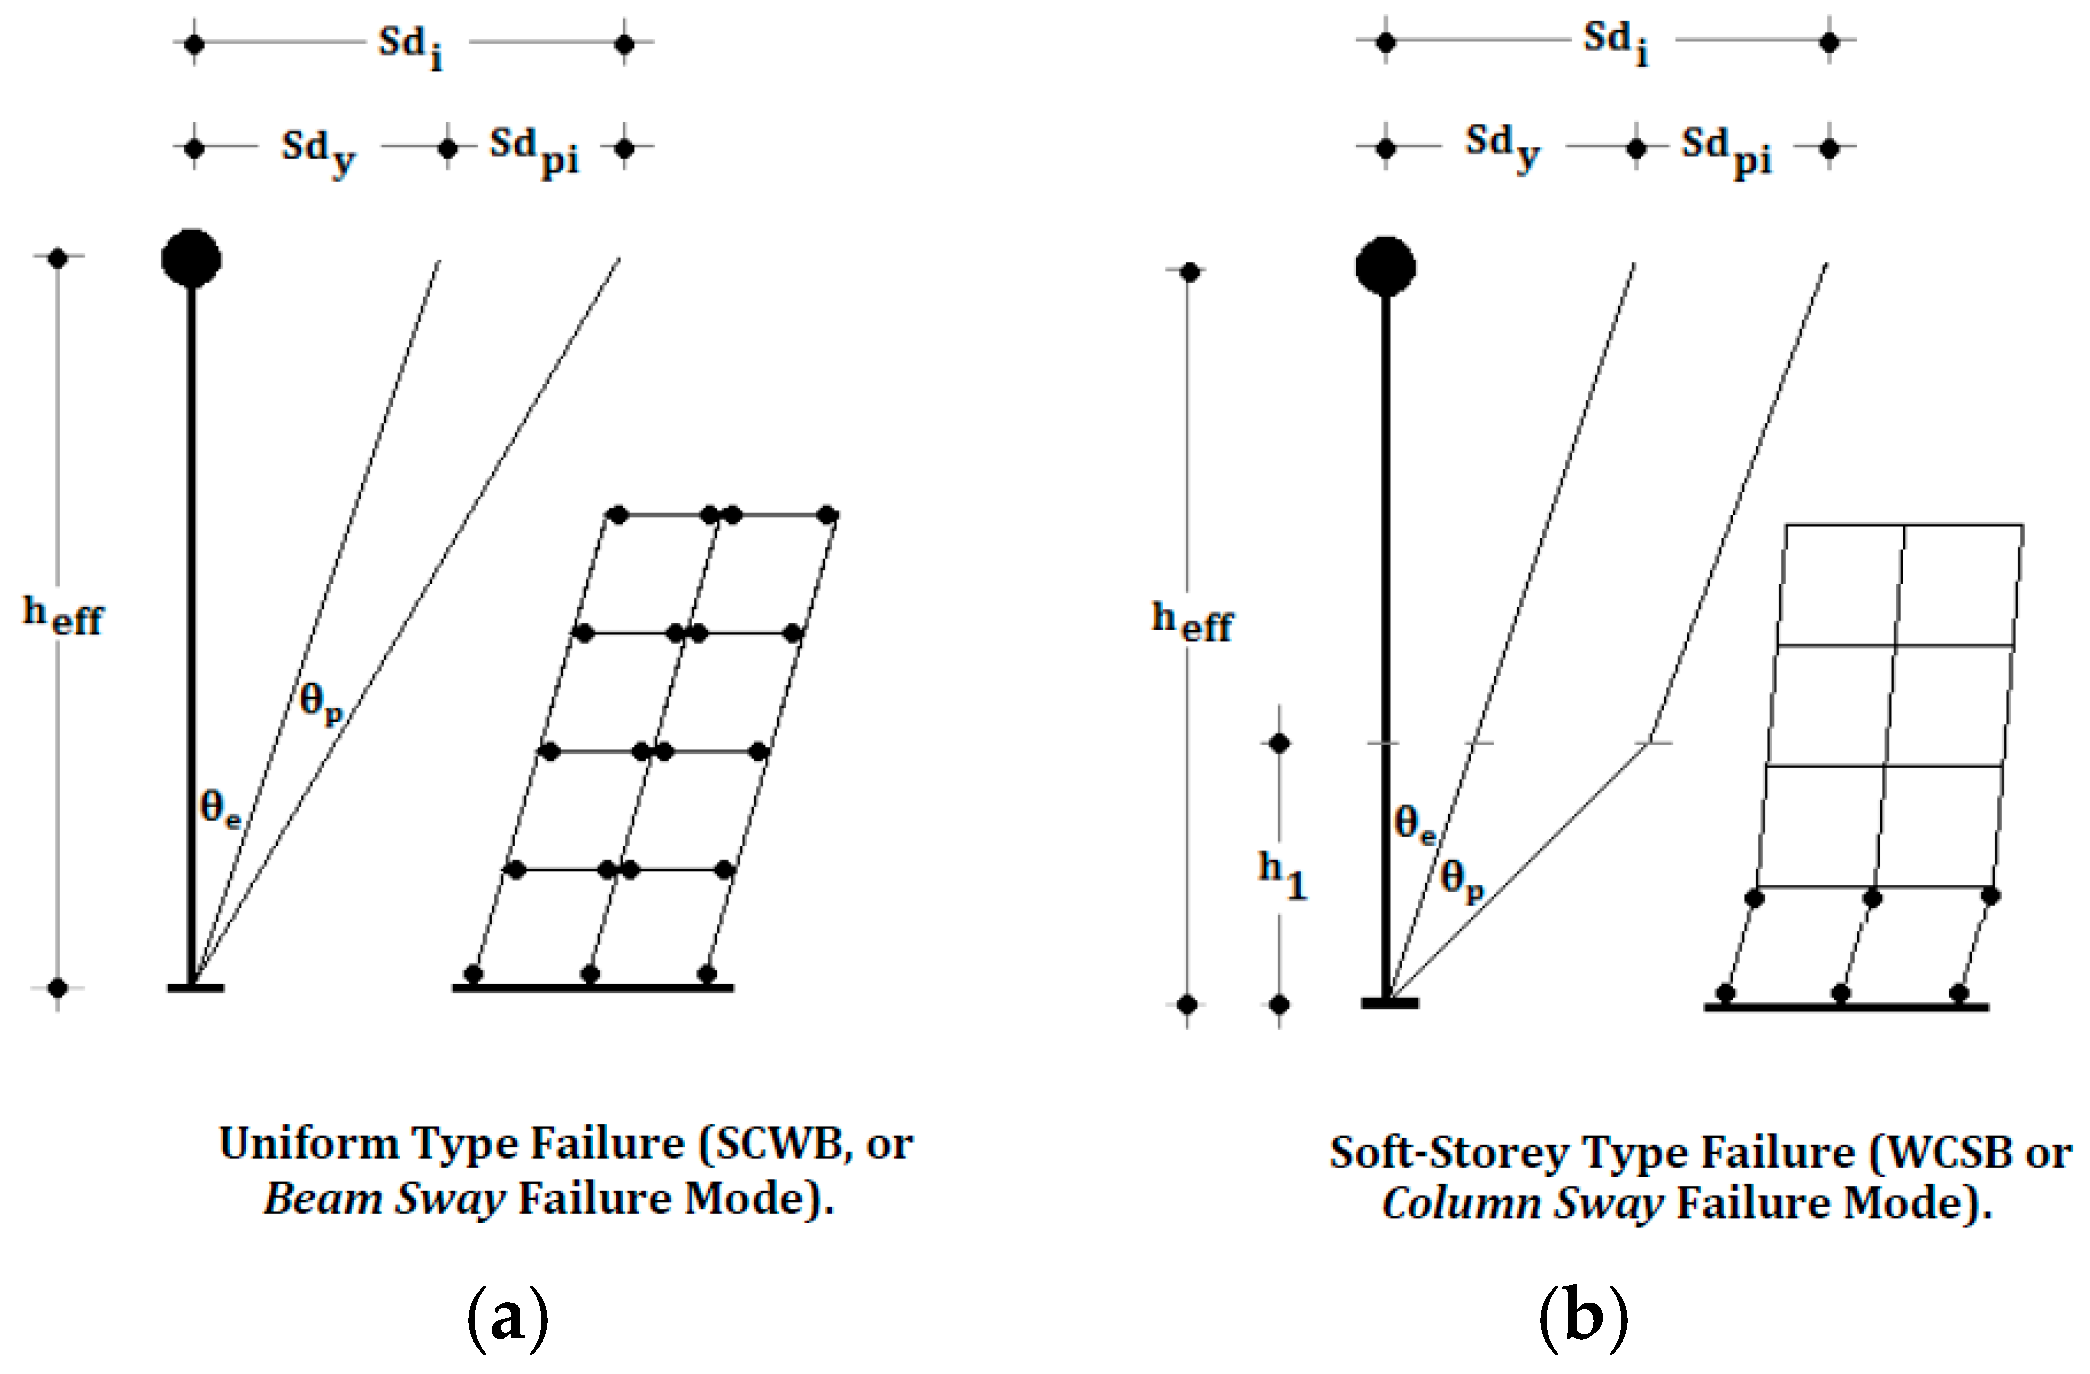
4.5. Deriving Capacity Curves for Reinforced Concrete Frames. The Modified Displacement-Based Method (MDBM)

Between 1960 and 1983, the initial phase of RC earthquake Moment-Resisting Frames began, following the introduction of the first code with basic seismic (RSCCS 1958 [70]) guidelines, and leading up to the 1983 code based on Earthquake Engineering principles. After 1983, RC structures were designed in accordance with this code. For buildings constructed after 2000, some considerations from EC-8 were already being incorporated. EC 8 was only completely enforced in 2022 after a three-year transition period; therefore, the corresponding buildings still do not have statistical relevance.
For RC structures, we employed a hybrid approach: (i) compiling MSc and PhD theses to derive “capacity curves,” and (ii) using an analytical method to obtain the capacity curve based on three parameters: Sdy (yielding displacement), Sdu (ultimate displacement), and μ (ductility), along with Ty (the yielding period). We calculated the average values for Sdy, μ, and Ty using typical building dimensions and cross-sectional resistance. We categorized the RC structures into three main sub-categories: (i) frame buildings, (ii) shear-wall buildings, and (iii) mixed frame–shear-wall buildings. The analytical method was based on Calvi’s Displacement-Based Method [79] and the DBELA method [80,81].
To achieve this objective, an initial assumption about the structure’s deformed shape is necessary. Two scenarios were considered: (i) a weak columns–strong beams (WCSB) structure, where hinges form in the lower columns (the column sway mechanism), and (ii) a strong columns–weak beams (SCWB) structure, where hinges form at the beam ends (beam sway mechanism), as illustrated in Figure 8. For this study, since SCWB structures are primarily associated with capacity designed structures, which are only explicit in Portuguese structural codes from 2019 onwards, the WCSB ultimate mechanism was assumed.
We used average values of geometric sizes of beams and columns and the most common concrete and steel quantities used in the construction “market”, following previous studies [82].
It is worth noting that in the original methods, the natural period of the structure was calculated by resorting to simple empirical formulas such as Ty = c1.Hc2 or Ty = c3.nc4. However, this procedure leads to aberrant results. It can be observed, as an example, that when the dimensions of the structure are increased (increased stiffness), the yield displacement, Sdy, decreases and, if the natural period remains the same, the capacity Say also decreases once Say = Sdy (2π/Ty)2. To solve this anomaly, a modified procedure [22] based on Schultz [83] was used, considering the lateral stiffness of an equivalent frame, with the natural period, Ty, obtained from Equations (8)–(10):
Ω = 1 + I c / L c I b / L b
In Equation (6), Ic represents the column moment of inertia and Ib the beam moment of inertia
β = 1     i f   n = 1 0.6734475 n 1.8886768     i f   n > 1
The yielding period, Ty, is computed as follows:
T y = 2 Π m E b c h c 3 / L c 3 β Ω
where m is the mass at each floor, E is the concrete Young modulus, and hc is the column length.
For reinforced concrete structures, 44 cases were studied for frames, while 62 cases were examined for shear-wall and mixed frame–shear-wall buildings (refer to Table S2 Section S2 of the Supplemental Materials). In this case, a different approach was used. First, steel and concrete mechanical and physical properties, along with more common geometric characteristics of resisting elements (beams, columns, and floors), were gathered as typical of several periods from 1960 until present [44]. These periods were mainly related to Portuguese codes in force at each period, giving rise to 44 different classes. The derivation of their CC was conducted using a formulation based in Calvi’s Displacement-Based Method and Pinho’s DBELA [79,80,84,85,86,87], modified by Mota de Sá [22] with the introduction of (i) the yielding period of the structure, calculated by Equation (7) instead of an empirical formula; and (ii) the derivation of the customized CC.
T y = 2 π m * K *
where m* is the effective mass of the substitute structure and K* is the structure stiffness.

4.6. Comparisons with Expert Opinion

Since the values of agu were calibrated from numerous experimental and analytical studies, and in the absence of a real strong earthquake to calibrate them better, in a second step, the values of agu gathered from these CCs were compared and validated with blind expert opinion gathered at the IST. It was then found that for masonry buildings, the agu from the capacity curves (aguCC) and the agu from expert opinion (aguEO) were very close, with the need for only slight adjustments, with values related by aguCC~1.08× aguEO with a coefficient of determination R2adj~0.60; that is, aguCC was found about 8% higher than aguEO, with a mean relative error of 10%.
For reinforced concrete structures, the values were, again, very close, with a match of aguCC~0.98× aguEO with an adjustment R2adj~0.65; that is, aguCC was found to be about 2% lower than aguEO.
From this, the final agu values for each of the main structural typologies of the Portuguese building stock were derived, with their final values are presented in Section S2 of the Supplemental Materials.

4.7. Influence of Shear on Pre-1970 RC Structures

Lisbon’s reinforced concrete buildings from before the 1970s have significant structural deficiencies [88,89], such as plan and height irregularities, inadequate reinforcement, and poor materials, worsened by poor maintenance. These issues limit ductility, crucial for resisting seismic forces. At the time, designs focused on gravitational loads, neglecting ductility and confinement, resulting in large stirrup spacings and small diameters. In addition, safety assessments under EC8-3 [90] reveal a risk of brittle shear failure in columns, especially in pre-1970 buildings, but this risk is considered overestimated, as code formulas for shear design are overconservative [91] as they are calibrated from experimental data that presents very large variability and are intended to produce safe results for design purposes. This issue was considered through “modifiers Δ”.

5. From Generic Typologies to Unique Buildings

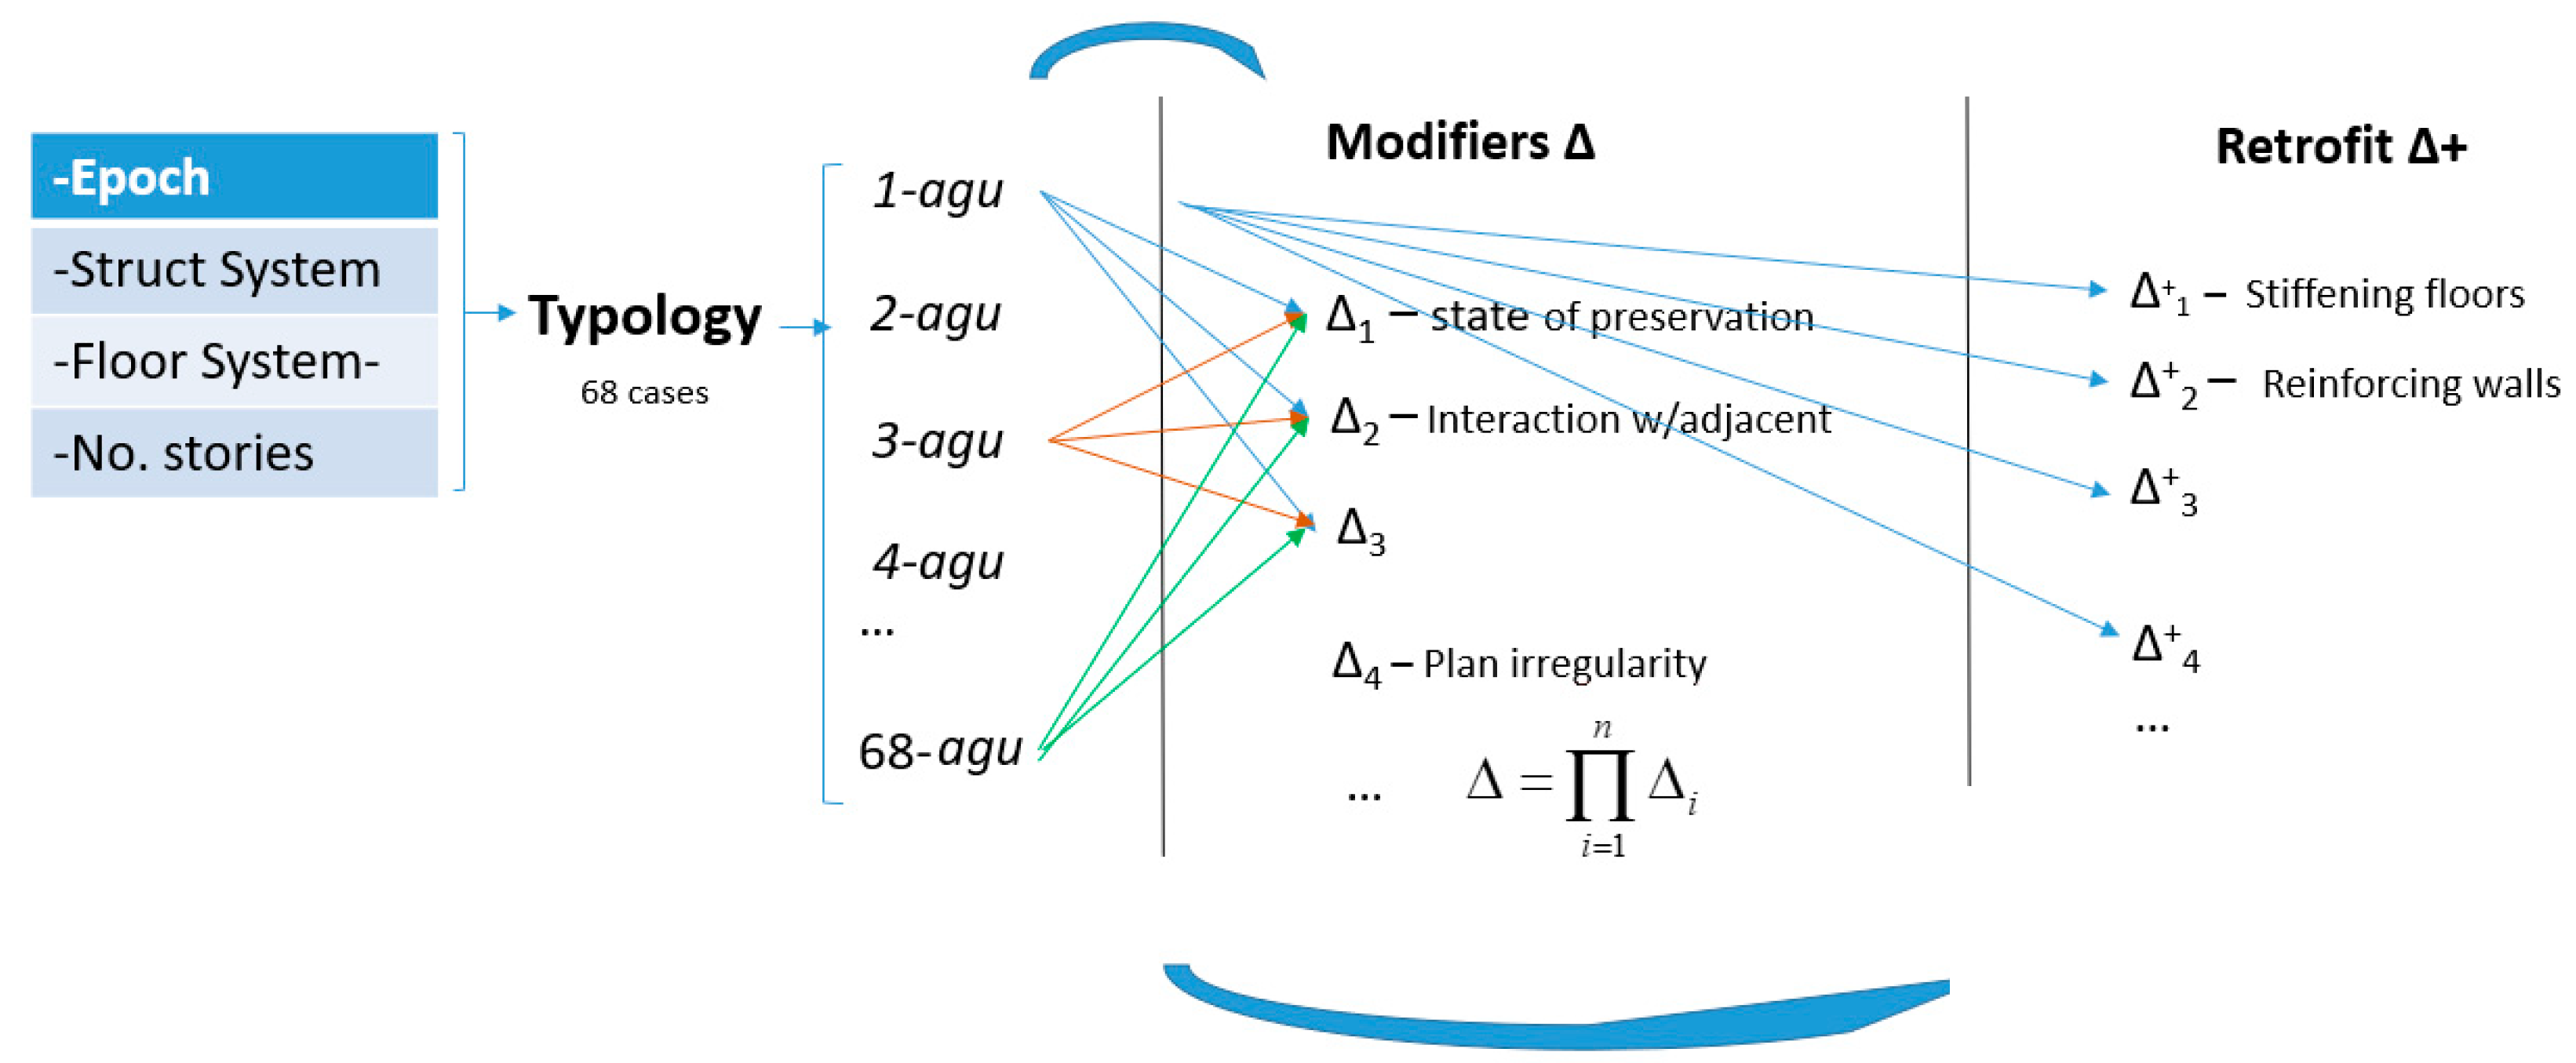
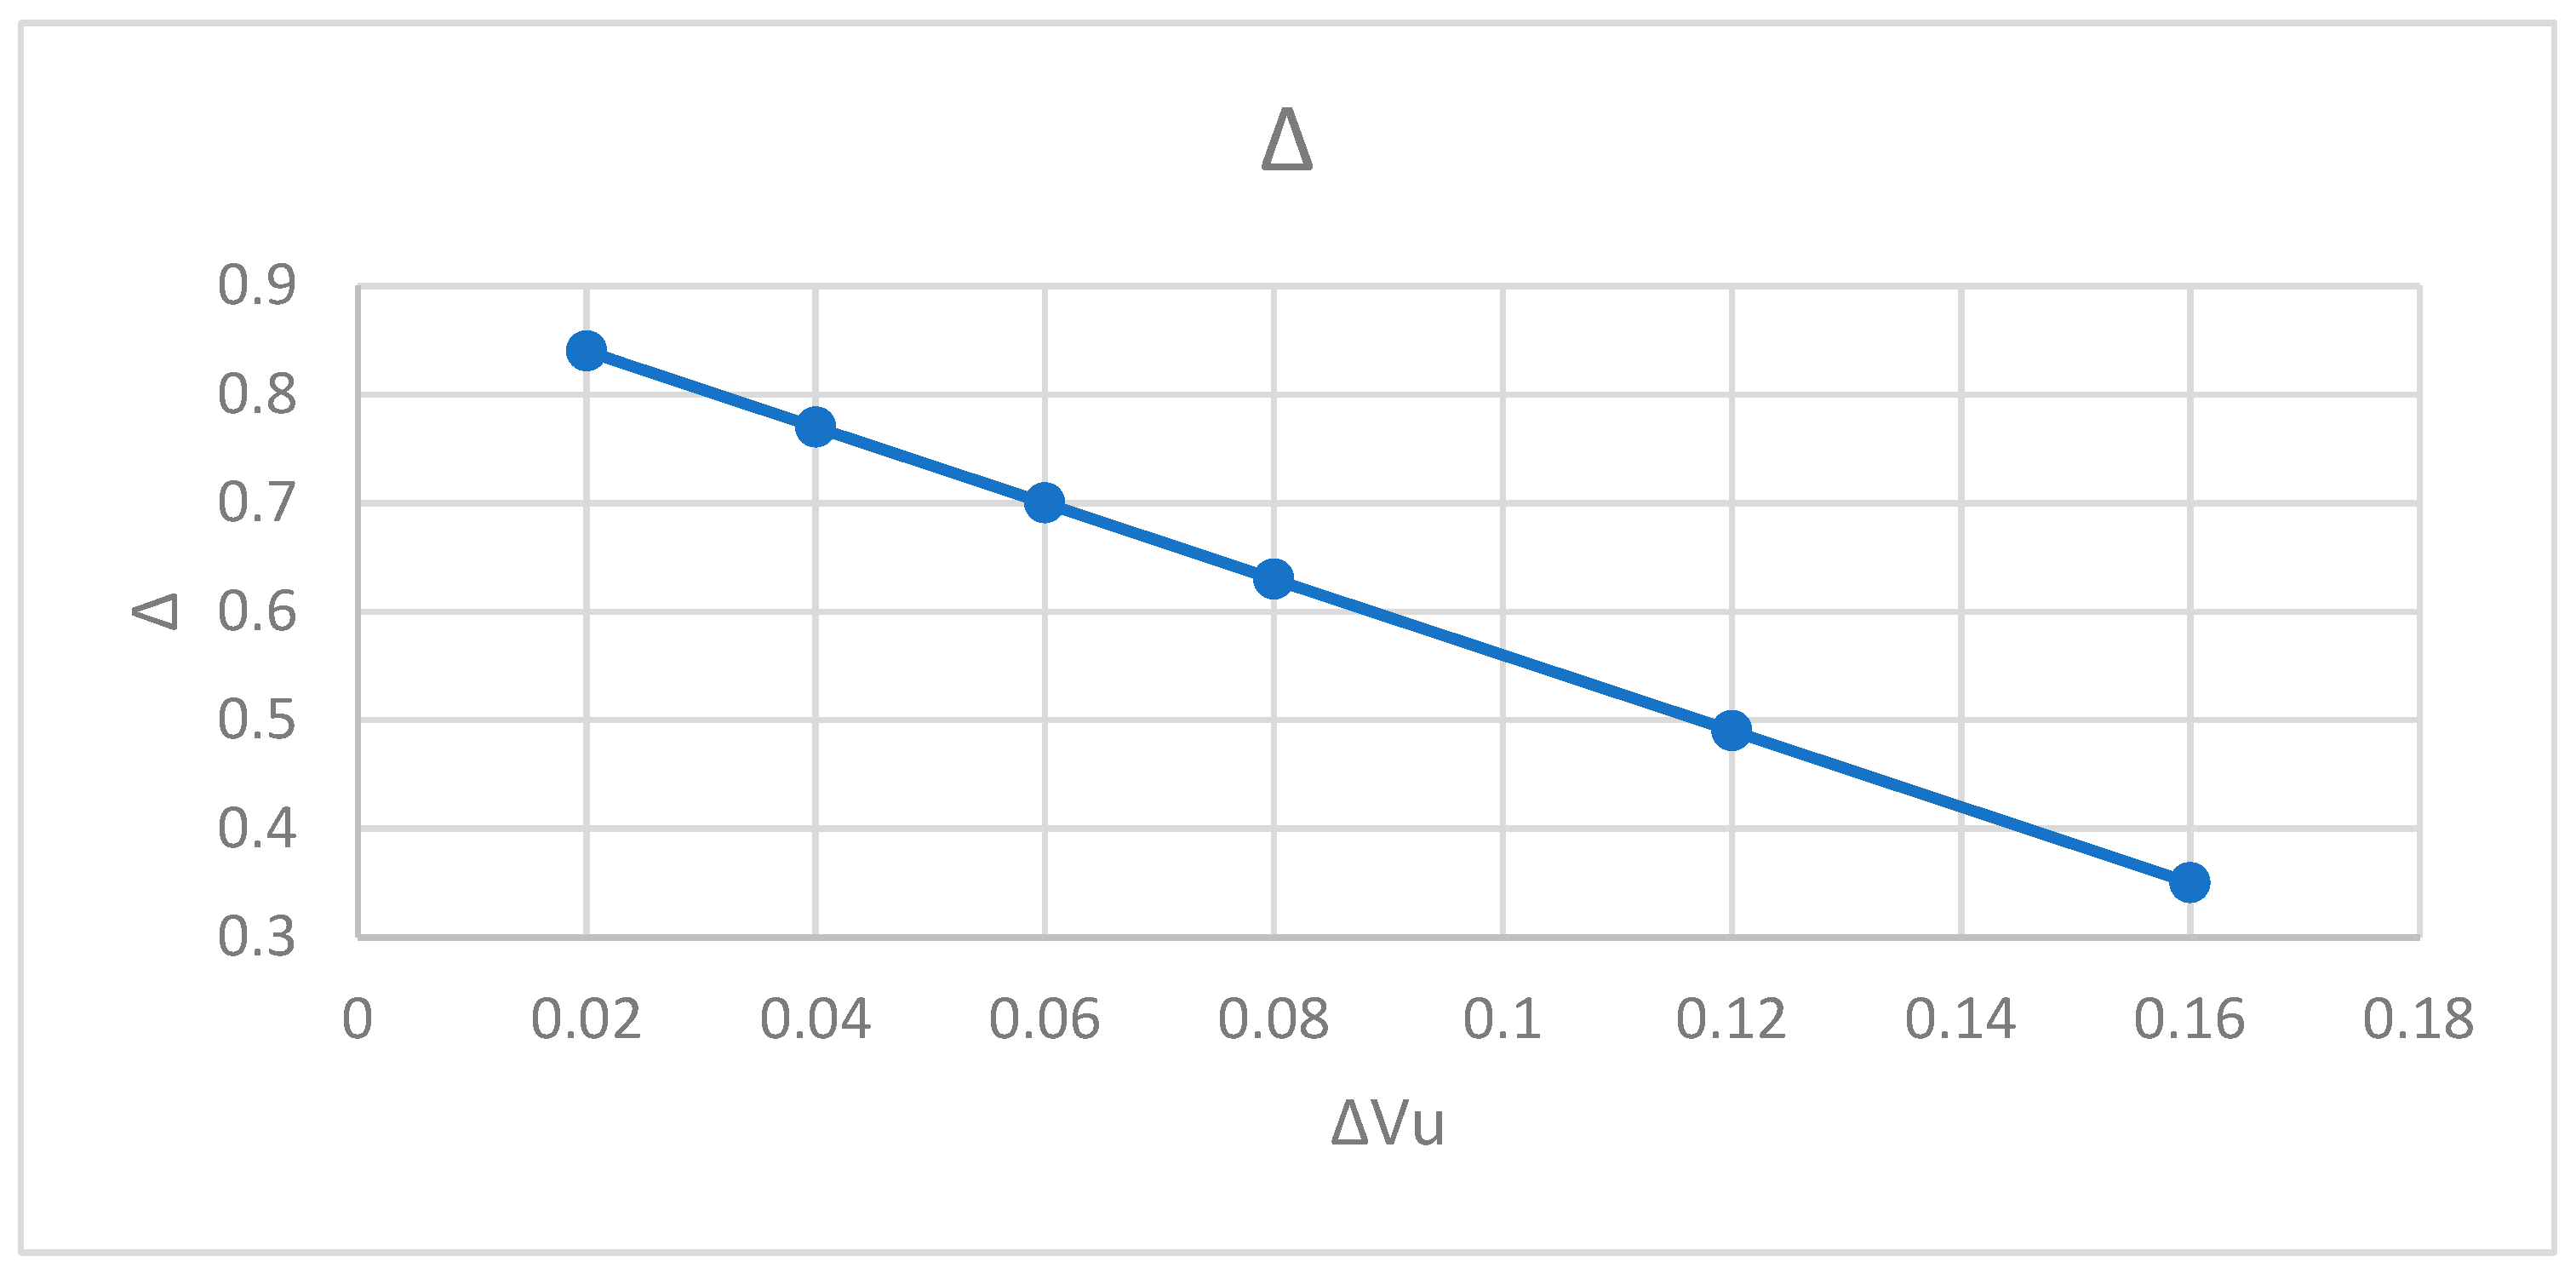
5.1. The Modifier Δ Due to the Uniqueness of Each Building

Since the aim of this work was to identify an indicator of seismic risk for individual buildings, it is essential to account for the unique characteristics that distinguish each building from others of the same typology. This was achieved by introducing “Behavior Modifiers,” Δi, which capture the uniqueness of each building (Figure 3). The values of these modifiers range from 0.40 to 1.0 and reflect the negative impact of certain peculiarities on a building’s resistance to seismic motions. These peculiarities are grouped into six main individual domains:
-
State of preservation;
-
Interaction with adjacent buildings;
-
Foundation and soil conditions;
-
Plan Irregularities;
-
Vertical Irregularities;
-
Others.
Examples of irregularities are given in Figure 9 and Figure 10:
One of the most significant vertical irregularities found in various building typologies in Portugal and other Southern European countries is the “soft-story”. This irregularity arises from the necessity in densely populated areas for ground-level spaces to be utilized for stores, restaurants, or parking facilities. The removal or partial elimination of infills in these spaces creates open areas of various configurations, compromising the building’s resistance to seismic loads. In Figure 8, we illustrate an iconic architectural complex where only reinforced concrete columns are present on the ground floor, exemplifying this irregularity. Despite significant attention given to the prevalence of soft-story buildings and the imperative need for retrofitting, substantive actions have yet to be taken. Figure 9 presents in a brief sketch of (a) the main horizontal and (b) the vertical irregularities.
The values used for these behavior modifiers Δ are presented in Table S3 of Section S3 of the Supplemental Materials. They were adapted from the Japanese Standards [37] and New Zealand Seismic Certification Procedures [67], from the works of Giovinazzi and Lagomarsino [55,63], Vicente [33], RISK-UE [77], and from expert opinion gathered at IST. A full calibration of the model, or of some of its components such as the structural modifiers, can only be conducted after the next strong earthquake hits Lisbon. However, we cannot wait for that, as the whole purpose of the tool described in this paper is to minimize the consequences of such an event, and for this purpose, the current tool, even with its limitations, should be applied before the next strong earthquake takes place.
Initially, all sources were considered. However, upon review, the values recommended by NZSEE were found to be overly aggressive and significantly lower than those suggested by the other sources. Consequently, they were not included in this work, as shown in Figure 8. It is important to note that the additive values recommended by Vicente, Giovinazzi, Lagomarsino, and in RISK-UE were intended as modifiers of the Vulnerability Index, Vu, used in the macroseismic approach, rather than of agu. Therefore, these values needed to be converted into multiplicative modifiers applicable to Say or agu. This conversion was achieved by using the equivalence between Vu and Say, applying Equation (12) when Ty < TC and Equation (13) when TyTC [22].
Δ = 1.78 6.25 × Δ V u   T y < T c
Δ = 1.78 ( 6.25 × Δ V u ) T c T y T y T c
These equations were then simplified after consulting the values of Ty for the Portuguese typologies, and a final simplified conversion, as shown in Figure 11, was then used.
A comparison of values Δi from different authors and the ones proposed by the IST for masonry buildings is made in Table 2.
The individual Δi modifiers, used in a multiplicative rule (Equation (14)), gave rise to a global modifier (Δ < 1.0) that aggravates the value of agu to take into account the building particularities (Equations (12) and (13)). By doing so, one obtains Ro (measured in acceleration units), which represents the building’s capacity to resist earthquakes (as shown in Equation (15)).
Δ = i = 1 n Δ i
R o = Δ . a g u
In cases where ΔV arises from the same origin, instead of using the product of all ΔVi, the largest one is selected. This way, we avoid exacerbating the effects of situations that are not independent of each other and have common causes.
Field inspections brought up a set of minor corrections attributed to either generic typologies or Δi, especially for the cases of successive modifications of the buildings over the years.

5.2. The Modifier (Δ+) Due to Rehabilitation Works

Using a similar argument, we considered the possibility of a building being the subject of retrofitting. This action was assumed to have a positive effect on the function of the type of retrofitting and the number of times that technique was implemented. Technically, we utilized a modifier (Δ+) divided into nine categories, each representing a specific type of intervention. The value of Ro = Δ × agu is then multiplied by the modifier (Δ+), resulting in a value of Rbuild = Ro × (Δ+) if it is confirmed that interventions with significant contributions to the seismic resistance of the building have been conducted, as indicated in the following list.
  • I1—Stiffening floors;
  • I2—Reinforcing walls;
  • I3—Reinforcing columns;
  • I4—The addition of perpendicular walls to strengthen the whole horizontal resisting system;
  • I5—The introduction of steel or wooden ties to increase the connection between walls;
  • I6—The introduction of steel or wooden ties or other elements to avoid out-of-plane of façades;
  • I7—The introduction of lintels and peripheral beams to limit displacements;
  • I8—The introduction of the cover structure of peripheral beams or other devices to avoid the impulse action of roofs;
  • I9—The introduction of steel columns in the first floor of a “Gaioleiro” building, replacing masonry columns to create more space for commercial uses.
As for the “modifiers Δ+” we also employed an algorithm that considers the building’s typology, the number of stories, and the number n of interventions. A few rules were added because not all situations referred to in Table 3 are possible. As an example, we added one of the rules for buildings that have more or less than four floors.
The final resistance value of the building, Rbuild will be obtained by multiplying Ro by the modifier Δ+, resulting in a value of Rbuild = Ro × (Δ+).
Again, in this case, the accuracy of the positive modifiers can only be satisfactorily calibrated after a strong seismic event in Lisbon. Further improvements could only be achieved by enlarging the sample of expert opinions, including more specialists.

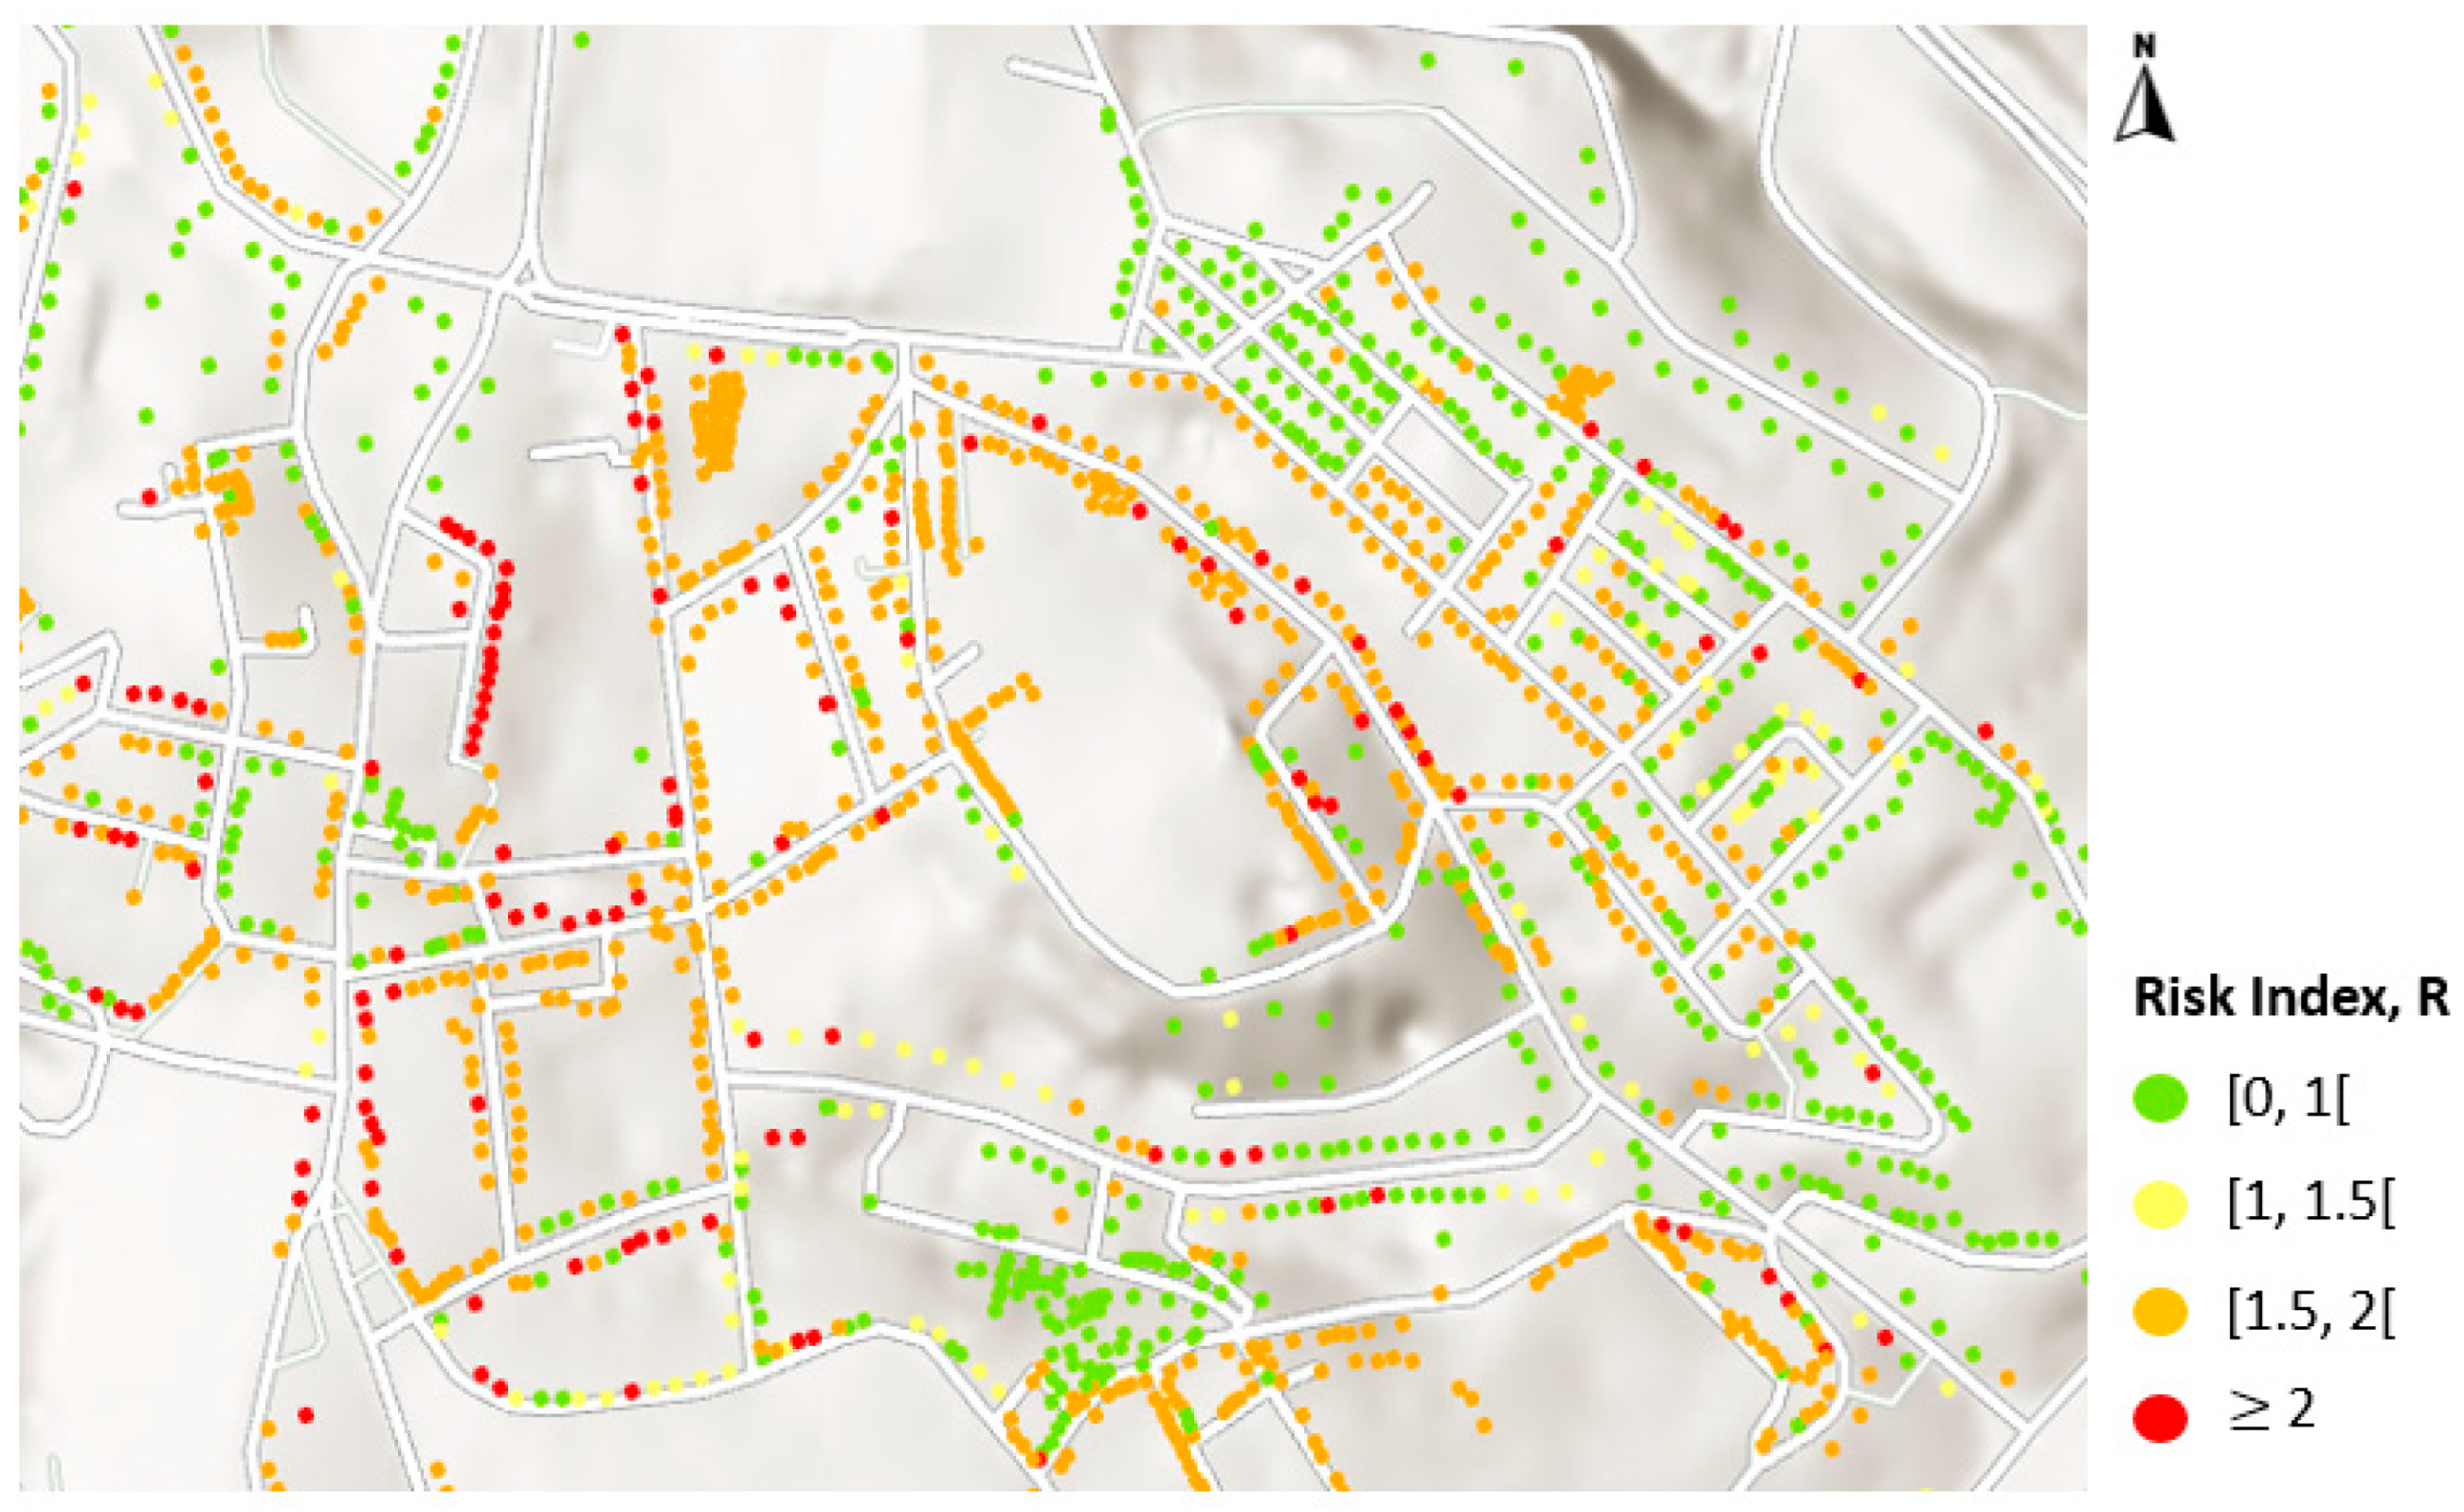
5.3. The Final Building Risk Indicator, R
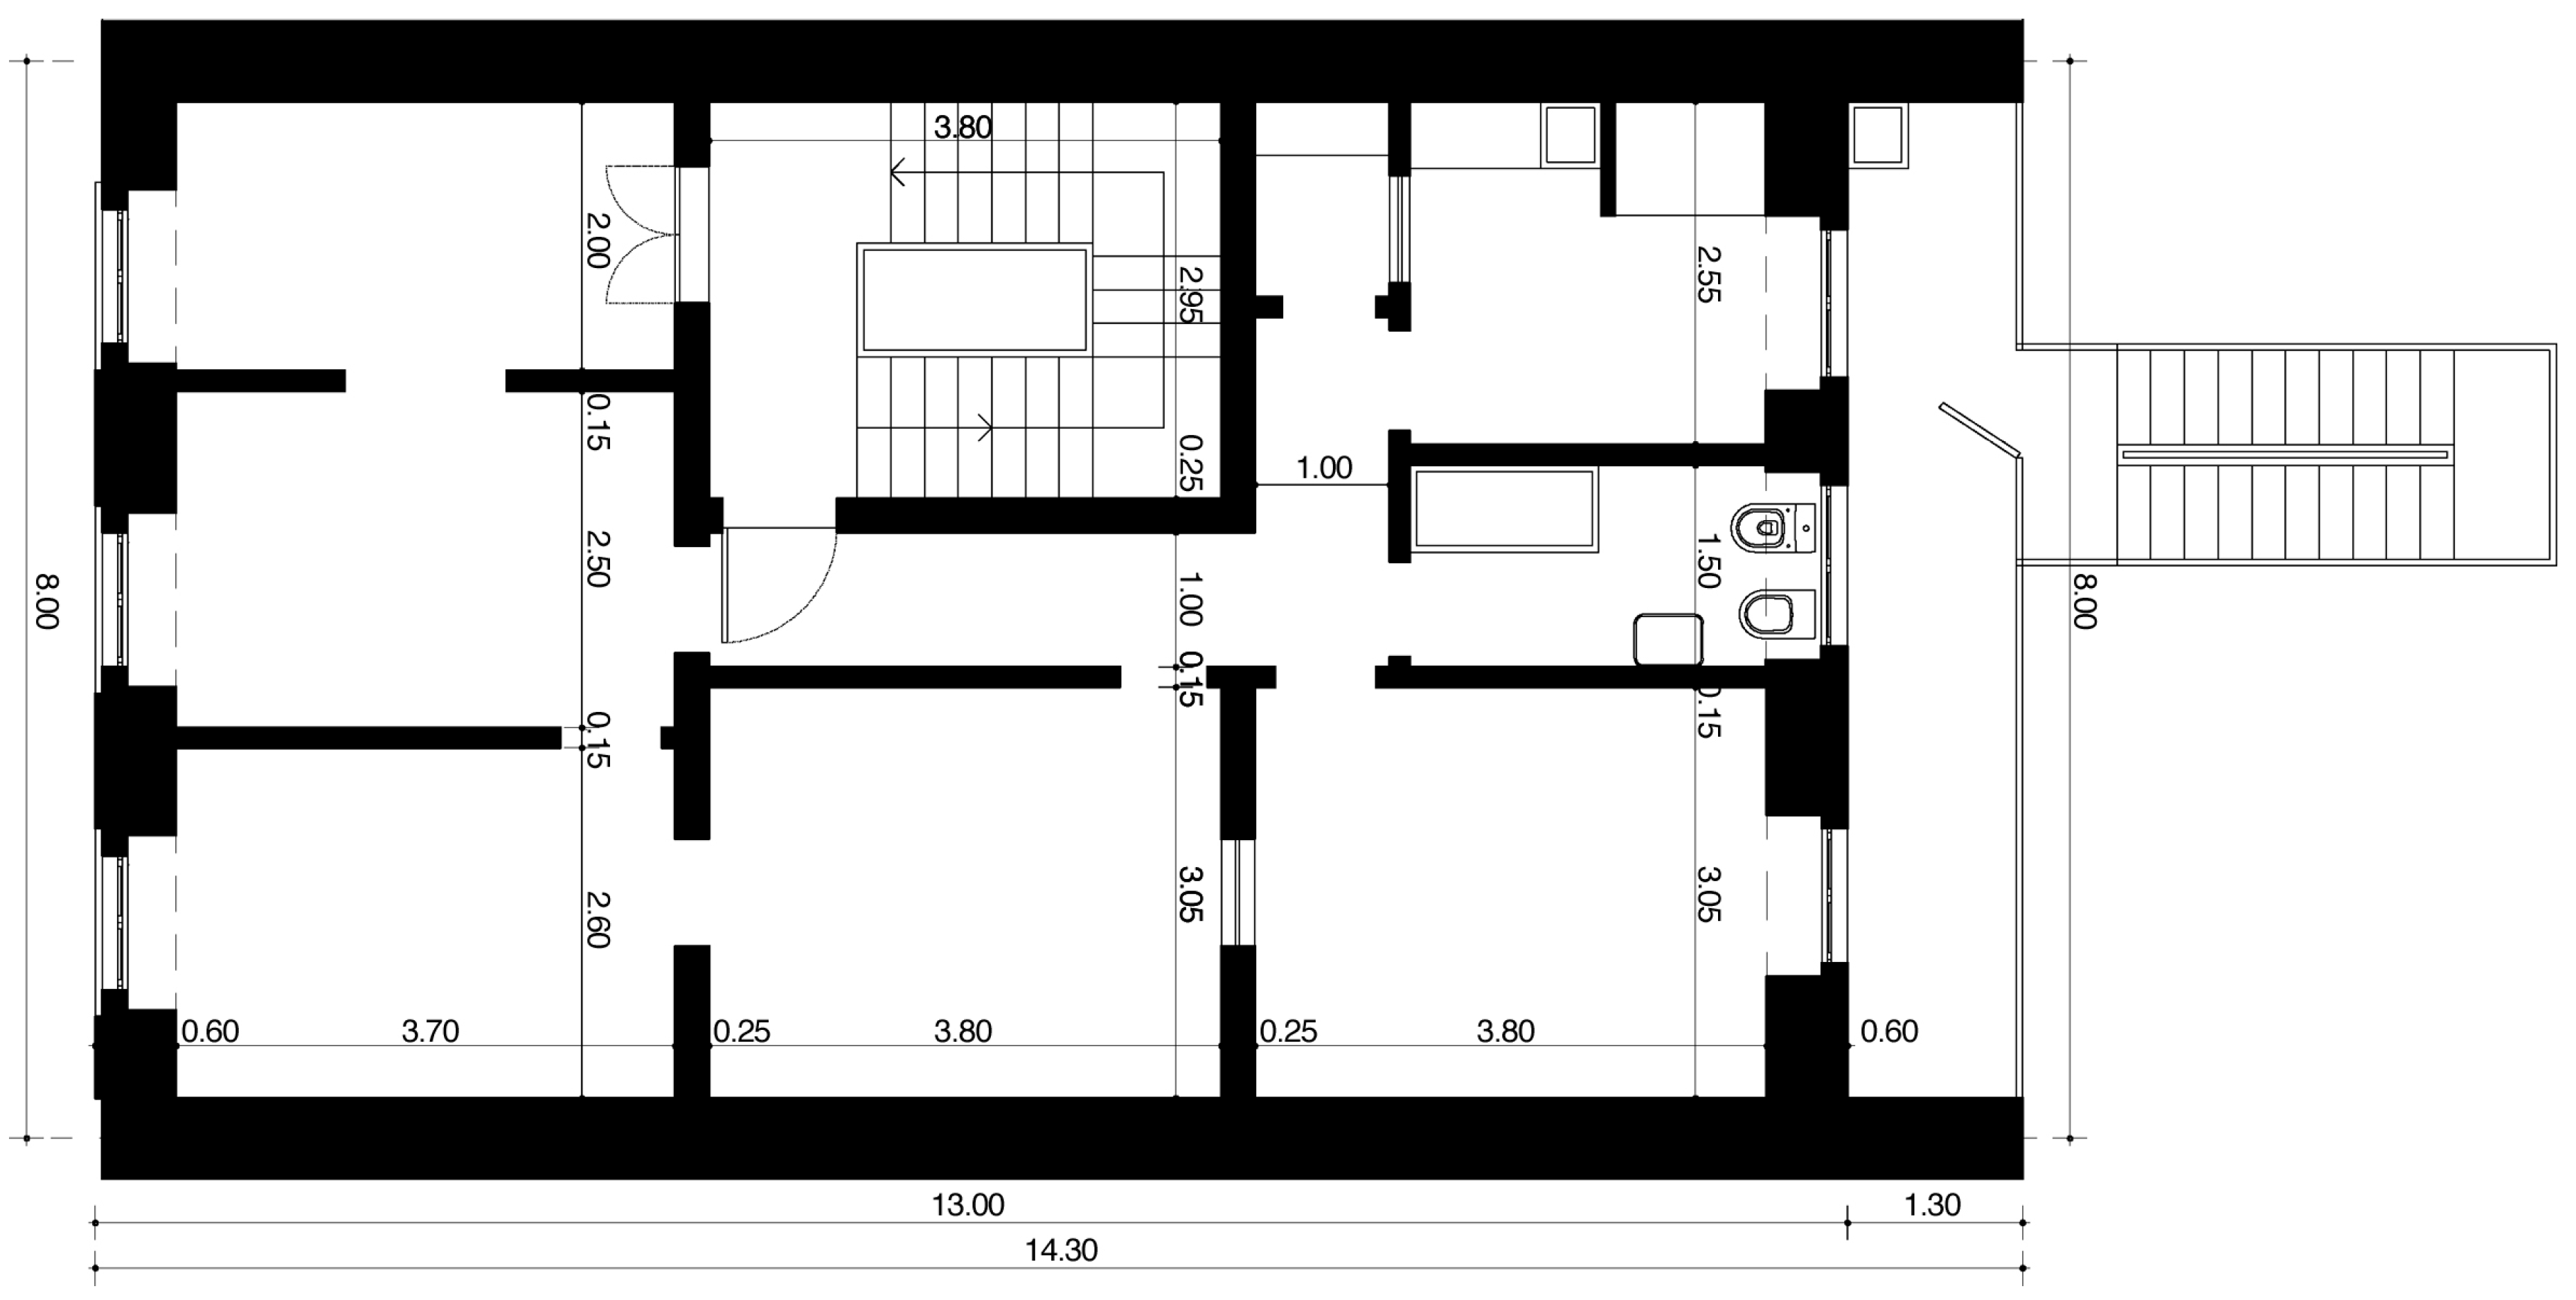
The final building risk indicator R (non-dimensional) is calculated inside the database, in accordance to Equation (15), where S is the soil factor (non-dimensional) used in EC 8 to define the response spectra, and that according to the Portuguese National Annex [69], which ranges from 1.0 to 1.83 in the case of Type I earthquakes (in accordance with EC-8, 2004 [68]), embodied in one of the GIS layers, “The Soils Map”. The value 1.5 (m/s2) is the PGA in Lisbon (constant value) defined in the National Annex, where Type I earthquakes have an exceedance probability of 10% in 50 years (a return period of 475 years).
R = PGA × S/(Rbuild) or R = 1.5 × S/(Δ × (Δ+) × agu)
The influence of the soil foundation type, Factor S, is made according to the Portuguese code EN (2010) [69]. For Lisbon, it is based on the microzonation studies developed by CML [39], following the classification of EC-8 [69] (five zones—A, B, C, D, and E) with the addition of two other new zones (AB and BC). A value Smax, given in Table 4 for each soil zone, was used to compute S according to S = (5 × Smax + 1)/6.
This number—the risk indicator, R—which has a continuous variation, offers quite good accuracy compared to other, much more expensive methods, can be applied in several ways. First, it serves as a good starting point to determine if a building can withstand ground motion as prescribed by the code or if it requires retrofitting to enhance its seismic performance. Second, it provides an effective means of comparing buildings constructed in different eras. Finally, it may help municipal decision-makers understand buildings’ seismic risk and decide on actions to mitigate it. Alongside other socially and urban-relevant parameters, it can help prioritize which buildings need structural intervention. Additionally, it can be adjusted to define the thresholds for which more advanced levels of study (Level One or Level Two—Figure 2) should be conducted. It can also be utilized to enhance public awareness and the perception of seismic risk.
Along this line, when R is above 1.0, it means that the building may not be able to sustain the earthquake action defined in EC-8 [69], whereas below 1.0, it means the opposite. At this point, we created two different approaches to present the risk (Table 5). In the first approach, we considered only the structural limit-states (the ultimate limit capacity), while in the second approach, we made an approximate extrapolation for considering the damage–habitability levels. In other words, while a building may sustain structural integrity (R < 1- first approach), it does not mean that this building can maintain habitability after the earthquake due to damage problems in non-structural elements (only for R < 0.5—in the second approach, the building keeps its habitability).
As will be demonstrated in Section 5.4, this tool enables the generation of maps, statistics, comparisons, and various other resources that are essential for managing the urban fabric and ensuring a more sustainable environment.

5.4. Case Study

In the present case study, we examined a building, constructed in 1933—a four-storey structure made of rubble stone with wooden slab, except in the kitchen where reinforced concrete was used. It is located in Lisbon and is situated on soil type B. Figure 12 presents the main plan view dimensions of the structure under analysis, which is sometimes useful to define building typology. According to Section S2 (Supplemental Materials), the agu assigned to this building typology is 1.4 m/s2.
Data collection was conducted via a mobile field survey using a geographical information system tool such as ArcGIS Survey123®. The building is in a good state of preservation, with no plan irregularities, adjacent buildings of differing heights, or other individual modifiers (Δ), nor rehabilitation works (Δ+) that would increase the agu value. Table 6 summarizes the main parameters to arrive at the risk indicator, R.

5.5. From Scientific Research to Real-World Decision Making

This approach enables the creation of interactive geospatial maps featuring color-coded building footprints based on seismic risk levels. Figure 13 illustrates an example of such an output. It corresponds to a loss scenario, simulating the repetition of the 1755 earthquake. Building data were derived from census information [92], assuming that each structure was designed in accordance with the construction codes in force at the time of its construction. By utilizing two census variables—the epoch of construction and the number of floors, it was possible to determine the typology and the corresponding agu values for each structure. In this case, a synthetic version of Table S1—Section S2 of the Supplemental Materials was developed (Figure 14). These visual tools provide a robust analytical foundation for developing data-driven strategic policies and designing targeted insurance frameworks to enhance seismic risk management at the urban scale.
This enables meaningful analysis at multiple levels of complexity, supporting both rapid assessments and more detailed future studies. Moreover, the use of census data enhances the understanding of population distribution, which is crucial for preliminary estimates of the number and allocation of displaced people, all within a clear framework of sustainability. This method offers flexibility, allowing the use of all 68 parameters or just a few, depending on the information available and the level of resources we can dedicate to the inventory. For example, it can work with a basic two-parameter set, as mentioned earlier, or a five-parameter set based solely on exterior observations—such as differences in height between neighboring buildings or the building’s position on the block. Naturally, the fewer parameters we use, the less accurate the final result is. If parameters related to irregularities and conservation state Δ (<1) are not accounted for, agu is overestimated and R is underestimated. On the contrary, if parameters related to retrofitting, Δ+ (>1), are not accounted for, the effect is the opposite. One of the main innovations of this paper is that the method can be applied to both older buildings, which may have undergone structural changes over time, and newer reinforced concrete buildings designed according to the latest codes.
To ensure a balance between scientific transparency and social responsibility, meaningful consultation with key stakeholders is essential. For instance, following the loss scenario, the Portuguese energy provider was informed that several of its transformer stations were located in buildings classified as moderately to highly vulnerable to seismic events, posing a significant risk to the continuity of power supply. As a result of this engagement, the company has become more aware of the potential threats and is undertaking a more detailed and comprehensive risk assessment.
The risk map produced using this methodology also enabled the identification of Lisbon’s most vulnerable areas. This information was vital in determining the locations of 86 official meeting points distributed across the city, which were publicly announced by the Mayor on 30 October 2024 (https://www.lisboa.pt/temas/seguranca-e-prevencao/protecao-civil/planeamento-de-emergencia/pontos-de-encontro, accessed on 16 April 2025). These designated public spaces have the capacity to accommodate more than 600,000 people in the event of a serious accident or catastrophe.
Furthermore, the methodology and results are being used to support the design of tsunami evacuation routes [93] and to establish priorities for retrofitting critical infrastructures, such as fire stations, schools, or public housing. These steps are essential to encourage policymakers to recognize the urgency of dedicated funding programs for retrofitting and risk reduction. This is in the line of sustainability of urban planning.

6. Final Remarks

The primary aim of this study was to introduce a straightforward and unified indicator for evaluating the seismic risk of individual buildings. This indicator is derived from the demand spectrum at a specific site and the capacity curve of a particular building typology and of the unique geometrical, structural, and conservation characteristics of each building. The identification of the typology relies on the epoch of construction and possible alterations suffered along its lifetime, and on key geometric and mechanical characteristics of its main structural elements. A rapid in situ inspection of the exterior of the building and its interior space helps identify irregularity and rehabilitation actions. This solution corresponds to an intermediate stage (accuracy) between “Level Zero” and “Level 1” surveys, allowing for a ranking of constructions as a function of their potential seismic resistance. Buildings, whose resistance index falls within a region of uncertainty, will require Level 1 or 2 analyses, depending on the importance of the structure.
As mentioned earlier, the concept of agu can be expanded to include other limit states, where base PGA agk corresponds to various damage states (k) beyond the ultimate one (u). For example, instead of using ductility µ, one might use demand ductility at the extensive damage threshold, µ3, to identify buildings needing evacuation for repairs or to assess non-structural elements [94].
Currently, municipal teams are in the process of familiarizing themselves with the initial steps for gathering seismic risk information related to municipal buildings. To enhance the effectiveness of inquiry forms, a comprehensive “User’s Manual” was developed, along with a “Manual for Good Practices” intended for all stakeholders in the rehabilitation industry. As a pilot experiment, a set of 50 “social housing” buildings constructed since 1950 was assessed, serving as a secondary round of corrections to identify any “difficulties” or gaps in the questions and to observe results. Figure 15 presents the distribution of the Risk Index, R, for this set, which was expanded to 1600 buildings using a “replication” of identical buildings and exterior inspections. The plan for 2025–2026 aims to expand these efforts on a larger scale, covering all municipal buildings and those located in the most critical areas of the Lisbon Council, as identified by macro-scale studies (Level Zero).
So far, we have identified several points that deserve our attention:
-
Developing an inquiry that accommodates both old masonry buildings and modern reinforced concrete structures is a complex task.
-
Typology classification poses significant challenges, particularly with older buildings that have undergone numerous alterations over decades or even centuries. These modifications often result in complex structures that differ markedly from their original design. Structural changes—such as the removal of elements, including walls (especially on the first floor for commercial use), additional floors, or conversions from residential to office spaces—require substantial adaptations that add an additional layer of complexity to the analysis.
-
Accessing the building’s interior or the backyard is often challenging due to constraints imposed by occupants. Access may be restricted to only one or two dwellings, and changes may have occurred in other units.
-
The lack or difficulty in obtaining architectural and structural design information, coupled with outdated or inaccurate census data on building characteristics, hinders a re-evaluation of these properties. Assessing the quality of rehabilitation work, especially since the rehabilitation code became available in 2019, is also very challenging.
-
Confidence in analytical models is not consistently high, as advancements in science may lead to changes in results over time. Disparities among different schools of thought, as evidenced in Oliveira [95], contribute to the existing uncertainty.
-
Training engineers, architects, inspectors, and surveyors to fill out the inquiry is also a difficult task. Although several courses have been organized, accompanied by fieldwork inspections carried out on different typologies, difficulties persist in filling out the inquiry.
-
An app, developed using ArcGISSurvey123®, has been created to facilitate the inquiry process. The app is connected to a central database with existing information from the City Council, expediting building identification and utilizing previously compiled data.
All the above topics contribute to the sustainability of urban spaces, and we need the above proposed models to support decision-makers in taking the most adequate steps for a more resilient society, supported through scientific and technical solutions to become more environmentally friendly.
Points on the algorithm:
-
Addressing uncertainties in the variables is complex, with some proving difficult to categorize even by experienced experts. We consider as the, “demand” the official code values for a given location, considering the hazard (475 yr-return period) and soil effect. We consider “capacity” to be the agu for the typology under analysis, corrected by two modifiers, one (Δ) which penalizes the vulnerability due to irregularities, state of conservation, etc., and the other (Δ+) that benefits it if retrofit took place. Both “demand” and “capacity” are random variables with great dispersion. To obtain the reliability of R, we need to convolute the probability of these functions. We have not performed this computation because it really needs a propagation of uncertainties in all variables, and in this paper, our concern was essentially to define this innovative method that deals with an analytical solution that is given a spectral shape. In one case, we made a comparison of modifiers Δ (Section 5.1) from different researchers, and the results were not very different. Future works may consider this issue, together with the comparison of the present proposal with other existing methods mentioned in Figure 2 (Diagram) and in Section 3.1.
-
Regarding the acceptability of R-index values, this is ultimately a political decision, as it depends on subjective judgments about acceptable levels of risk. The purpose of this paper is to provide insight into the meaning of different R-index values, which constitute an important part of the technical information required to support an informed political decision.
-
Scaling the proposed methodology to encompass entire urban areas necessitates the implementation of complementary policies and methodological adaptations. To facilitate this transition into large-scale or “macro” urban studies, we introduced streamlined techniques that preserve the original accuracy levels by exploiting the principle of structural repeatability. This involves the identification and sampling of typologically homogeneous building groups—structures exhibiting consistent usage, design, and construction practices, often attributable to centralized planning efforts. Such conditions are prevalent in urban zones where local governments have executed standardized development programs, particularly for low- to moderate-income populations, resulting in the systematic relocation of residents from substandard housing to uniformly constructed dwellings. Additional examples include institutional or commercial building clusters, such as fire stations, early childhood education centers, and modular hotel or office developments. Partially aligned with the CARTIS methodology [7,32], this hybrid framework enables scalable urban characterization with minimal compromise in data fidelity.
Inventories created using satellite imagery combined with Street View® observations within an AI framework are powerful tools for identifying different building typologies and offer a new approach to keeping building stock information continuously up to date. This reflects a growing trend toward bridging the ”macro-micro” scale gap.
Future work should address the inherent uncertainties in the model, necessitating the allocation of resources aimed at their systematic reduction. Each variable incorporated into the framework carries a degree of uncertainty, particularly given that Portugal has not experienced a major seismic event since 1755. In this context, Monte Carlo simulations emerge as the most appropriate method for generating meaningful confidence intervals. A critical research question involves identifying the minimal set of parameters required to achieve a specified level of confidence, recognizing that not all parameters are consistently available. It is essential to evaluate how these data gaps may affect the reliability of the final outcomes. Additionally, the period from 1980 to 2025—characterized by the widespread use of reinforced concrete—warrants further investigation due to the high variability in structural design practices. In Southern Europe, Asia, and Central and South America, clay brick walls have traditionally been used for partitions and façades. While once considered non-structural elements, recent studies and codes increasingly recognize their role in seismic behavior, as highlighted during the 2008 L’Aquila earthquake [96] and by Purushothama et al., 2023 [97]. These issues may be relevant for assigning agu, especially in cases in which the collapse mode changes due to the effects of the infills. This suggests that further improvements of the methodology should consider new typologies within the RC structures.
After the devastating 1755 earthquake that nearly destroyed Lisbon, followed by the reconstruction and successive urban development until present, this initiative stands as one of the major efforts in Portugal to understand and evaluate seismic risk in a more rigorous way, beyond the seismic macro-simulators developed for National Civil Protection since the 1990s. We hope this initiative will pave the way for preventive measures and informed decisions regarding the need for seismic rehabilitation. Looking ahead, we are eager to continue this work and hope that other Portuguese municipalities will undertake similar initiatives, contributing to a more resilient future and supporting a more sustainable society.

Supplementary Materials

The following supporting information can be downloaded at https://www.mdpi.com/article/10.3390/su17136027/s1. Section S1: Demonstration of Equations 1 and 2 for the computation of agu. Section S2: Values of agu for the 66 main typologies typified in this proposal. Section S3: Values of agu modifiers Δ considered in this proposal. References [98,99,100,101] are cited in Supplementary Materials.

Author Contributions

Conceptualization, C.S.O.; Methodology, F.M.d.S.; Formal analysis, M.S.L.; Investigation, F.M.d.S.; Data curation, F.M.d.S.; Writing—original draft, M.S.L., C.S.O. and M.A.F.; Writing—review & editing, C.S.O. and M.A.F.; Supervision, M.S.L. All authors have read and agreed to the published version of the manuscript.

Funding

Partial funding was provided by the Portuguese Foundation for Science and Technology through project UIDB/04625/2025, under the research unit CERIS. Mónica Amaral Ferreira is supported by the Portuguese Foundation for Science and Technology (DOI: 10.54499/CEECINST/00122/2018/CP1528/CT0025).

Institutional Review Board Statement

Not applicable.

Informed Consent Statement

Not applicable.

Data Availability Statement

The original contributions presented in this study are included in the article. Further inquiries can be directed to the corresponding authors.

Acknowledgments

The authors would like to acknowledge the participation of Engineers Marta Sotto-Mayor, Marta Cardoso, Isabel Genro, Luísa Ribeiro, and Vitorino Esteves, as well as Teresa Pereira and Architect Luís Oliveira Pinto, all from CML, for initiating this project. A special acknowledgement to Rita Bento (IST) for providing information on several MSc Theses completed at IST and for her expert opinion on structural modifiers. Acknowledgment is also due to engineer Rafael Francisco (IST) for performing the Excel® computations and to engineer Carlos Sousa Ferreira (CML) for preparing the Survey123® tool used in the inventory inquiry. The authors are particularly grateful to all members of the ReSist Team-CML, especially its coordinator, Cláudia Pinto, for their unwavering support and dedication to advancing this initiative. Hugo O´Neill and Mafalda Lopes contributed to the preparation of several figures.

Conflicts of Interest

The authors declare no conflicts of interest. The authors have read and agreed to the published version of the manuscript.

References

  1. Bezzeghoud, M.; Adam, C.; Buforn, E.; Borges, J.F.; Caldeira, B. Seismicity along the Azores-Gibraltar region and global plate kinematics. J. Seismol. 2014, 18, 205–220. [Google Scholar] [CrossRef]
  2. Hirn, A.; Haessler, H.; Trong, P.H.; Wittlinger, G.; Mendes-Victor, L.A. Aftershock sequence of the January 1 1980, earthquake and present-day tectonics in the Azores. Geophys. Res. Lett. 1980, 7, 501–504. [Google Scholar] [CrossRef]
  3. Lusa, A. Especialista alerta que um sismo como o de Itália iria ‘arrasar’ Lisboa. Newspaper Diário de Notícias, 1 November 2016. Available online: https://www.dn.pt/arquivo/diario-de-noticias/especialista-alerta-que-um-sismo-como-o-de-italia-iria-arrasar-lisboa-5474198.html (accessed on 16 April 2025). (In Portuguese).
  4. FEMA 273 NEHRP Guidelines for the Seismic Rehabilitation of Buildings; FEMA Publication: Bellaire, TX, USA, 1997; Volume 273.
  5. Babic, A.; Zizmond, J.; Dolsek, M. Bias in the Estimation of Seismic Risk for Municipal Building Stocks Due to Limited Data. Buildings 2023, 13, 2245. [Google Scholar] [CrossRef]
  6. Barbat, A.H.; Carreño, M.L.; Pujades, L.G.; Lantada, N.; Cardona, O.D.; Marulanda, M.C. Seismic vulnerability and risk evaluation methods for urban areas. A review with application to a pilot area. Struct. Infrastruct. Eng. 2010, 6, 17–38. [Google Scholar] [CrossRef]
  7. Brando, G.; Cianchino, G.; Rapone, D.; Spacone, E.; Biondi, S.A. CARTIS-based method for the rapid seismic vulnerability assessment of minor Italian historical centres. Int. J. Disaster Risk Reduct. 2021, 63, 102478. [Google Scholar] [CrossRef]
  8. Cacace, F.; Zuccaro, G.; De Gregorio, D.; Perelli, F.L. Building Inventory at National scale by evaluation of seismic vulnerability classes distribution based on Census data analysis: BINC procedure. Int. J. Disaster Risk Reduct. 2018, 28, 384–393. [Google Scholar] [CrossRef]
  9. Colajanni, P.; D’Anna, J. Seismic risk assessment of residential buildings by the Heuristic vulnerability model: Influence of fragility curve models and inventory scale. Bull. Earthq. Eng. 2023, 22, 877–910. [Google Scholar] [CrossRef]
  10. Dabbeek, J.; Crowley, H.; Silva, V.; Weatheril, L.G.; Paul, N.; Nievas, C. Impact of exposure spatial resolution on seismic loss estimates in regional portfolios. Bull. Earthq. Eng. 2021, 19, 5819–5841. [Google Scholar] [CrossRef]
  11. Di Ludovico, M.; Cattari, S.; Verderame, G.; del Vecchio, C.; Ottonelli, D.; del Gaudio, C.; Prota, A.; Lagomarsino, S. Fragility curves of Italian school buildings: Derivation from L’Aquila 2009 earthquake damage via observational and heuristic approaches. Bull. Earthq. Eng. 2023, 21, 397–432. [Google Scholar] [CrossRef]
  12. Dolce, M.; Prota, A.; Borzi, B.; da Porto, F.; Lagomarsino, S.; Magenes, G.; Moroni, C.; Penna, A.; Polese, M.; Speranza, E. Seismic risk assessment of residential buildings in Italy. Bull. Earthq. Eng. 2021, 19, 2999–3032. [Google Scholar] [CrossRef]
  13. Dolšek, M. Simplified method for seismic risk assessment of buildings with consideration of aleatory and epistemic uncertainty. Struct. Infrastruct. Eng. 2012, 8, 939–953. [Google Scholar] [CrossRef]
  14. Ferreira, M.A.; Mota de Sá, F.; Oliveira, C.S. The Disruption Index (DI) as a tool to measure disaster mitigation strategies. Bull. Earthq. Eng. 2016, 14, 1957–1977. [Google Scholar] [CrossRef]
  15. Ferreira, T.M.; Rodrigues, H.; Vicente, R. Seismic vulnerability assessment of existing reinforced concrete buildings in urban centers. Sustainability 2020, 12, 1996. [Google Scholar] [CrossRef]
  16. Formisano, A.; Florio, G.; Landolfo, R.; Mazzolani, F.M. Numerical calibration of an easy method for seismic behavior assessment on large scale of masonry building aggregates. Adv. Eng. Softw. 2015, 80, 116–138. [Google Scholar] [CrossRef]
  17. Hu, Q.; Xiong, F.; Zhang, B.; Wei, H.-H.; Su, P.; Lu, Y. Developing a novel hybrid model for storey based regional-scale seismic loss prediction. Bull. Earthq. Eng. 2024, 20, 5849–5875. [Google Scholar] [CrossRef]
  18. Šipoš, T.K.; Hadzima-Nyarko, M. Rapid seismic risk assessment. Int. J. Disaster Risk Reduct. 2017, 24, 348–360. [Google Scholar] [CrossRef]
  19. Lamego, P.; Lourenço, P.B.; Sousa, M.L.; Marques, R. Seismic vulnerability and risk analysis of the old building stock at urban scale: Application to a neighborhood in Lisbon. Bull. Earthq. Eng. 2017, 15, 2901–2937. [Google Scholar] [CrossRef]
  20. Sousa, M.L.; Costa, A.C. Evolution of earthquake losses in Portuguese residential building stock. Bull. Earthq. Eng. 2016, 14, 2009–2029. [Google Scholar] [CrossRef]
  21. Masi, A.; Lagomarsino, S.; Dolce, M.; Manfredi, V.; Ottonelli, D. Towards the updated Italian seismic risk assessment: Exposure and vulnerability modelling. Bull. Earthq. Eng. 2021, 19, 3253–3286. [Google Scholar] [CrossRef]
  22. Mota de Sá, F. Seismic Risk—New Instruments for Analysis and Communication. Ph.D. Thesis, Instituto Superior Técnico, Department of Civil Engineering, Architecture and GeoResources, University of Lisbon, Lisbon, Portugal, 2016. [Google Scholar]
  23. Paul, N.; Silva, V. Updates to GEM’s Global Seismic Risk Model. In Proceedings of the Conference of the 12th US National Conference on Earthquake Engineering, Salt Lake City, UT, USA, 27 June–1 July 2022. [Google Scholar]
  24. Puncello, I.; Caprili, S. Seismic Assessment of Historical Masonry Buildings at Different Scale Levels: A Review. Appl. Sci. 2023, 13, 1941. [Google Scholar] [CrossRef]
  25. Rigaa, E.; Karatzetzoua, A.; Mara, A.; Pitilakis, A. Uncertainties in Seismic Risk Assessment at Urban Scale. The case of Thessaloniki, Greece. Procedia Environ. Sci. 2017, 38, 340–347. [Google Scholar] [CrossRef]
  26. Scheingraber, C.; Käser, M.A. The impact of portfolio location uncertainty on probabilistic seismic risk analysis. Risk Anal. 2018, 39, 695–712. [Google Scholar] [CrossRef] [PubMed]
  27. Sousa, M.L.; Tsionis, G.; Dimova, S. Effect of the detail of exposure data in large-scale seismic risk assessment. In Proceedings of the 16th World Conference on Earthquake Engineering, Santiago do Chile, Chile, 9–13 January 2017. [Google Scholar]
  28. Sousa, L.; Silva, V.; Marques, M.; Crowley, H. On the treatment of uncertainty in seismic vulnerability and portfolio risk assessment. Earthq. Eng. Struct. Dyn. 2018, 47, 87–104. [Google Scholar] [CrossRef]
  29. Wieland, M.; Pittore, M.; Parolai, S.; Begaliev, U.; Yasunov, P.; Tyagunov, S.; Moldobekov, B.; Saidiy, S.; Ilyasov, I.; Abakanov, T. A Multiscale Exposure Model for Seismic Risk Assessment in Central Asia. Seismol. Res. Lett. 2014, 86, 210–222. [Google Scholar] [CrossRef]
  30. Xofi, M.; Domingues, J.C.; Santos, P.P.; Pereira, S.; Oliveira, S.C.; Reis, E.; Zêzere, J.M.; Garcia, R.A.C.; Lourenço, P.B.; Ferreira, T.M. Exposure and physical vulnerability indicators to assess seismic risk in urban areas: A step towards a multi-hazard risk analysis. Geomat. Nat. Hazards Risk 2022, 13, 1154–1177. [Google Scholar] [CrossRef]
  31. Xofi, M.; Ferreira, T.M.; Domingues, J.C.; Santos, P.P.; Pereira, S.; Oliveira, S.C.; Reis, E.; Zêzere, J.M.; Garcia, R.A.C.; Lourenço, P.B. On the Seismic Vulnerability Assessment of Urban Areas Using Census Data: The Lisbon Metropolitan Area as a Pilot Study Area. J. Earthq. Eng. 2023, 28, 242–265. [Google Scholar] [CrossRef]
  32. Zuccaro, G.; Dolce, M.; Perelli, L.; De Gregorio, D.; Speranza, E. CARTIS: A method for the typological-structural characterization of Italian ordinary buildings in urban areas. Front. Built Environ. 2023, 9, 1129176. [Google Scholar] [CrossRef]
  33. Vicente, R. Estratégias e Metodologias para Intervenções de Reabilitação Urbana. Avaliação da Vulnerabilidade e do Risco Sísmico do Edificado da Baixa de Coimbra. Ph.D. Thesis, Departamento de Engenharia Civil, Universidade de Aveiro, Aveiro, Portugal, 2008. (In Portuguese). [Google Scholar]
  34. Grünthal, G. European Macroseismic Scale (EMS-98); European Seismological Commission: Luxembourg, 1998; Volume 15, pp. 1–99. [Google Scholar]
  35. FEMA 356: Prestandard and Commentary for the Seismic Rehabilitation of Buildings; Federal Emergency Management Agency: Washington, DC, USA, 1997.
  36. FEMA P-154 Rapid Visual Screening of Buildings for Potential Seismic Hazards, 3rd ed.A Handbook; Applied Technology Council: Washington, DC, USA, 2015.
  37. Institute BR Standard for Seismic Evaluation of Existing Reinforced Concrete Buildings, Guidelines for Seismic Retrofit of Existing Reinforced Concrete Buildings, and Technical Manual for Seismic Evaluation and Seismic Retrofit of Existing Reinforced Concrete Buildings; The Japan Building Disaster Prevention Association: Minato City, Japan, 2001.
  38. Proença, J.M.; Henriques, J.F.; Albuquerque, P. A New Seismic Vulnerability Survey Method for Healthcare Reinforced Concrete Buildings. In Proceedings of the 14th European Conference on Earthquake Engineering, Ohrid, North Macedonia, 30 August–3 September 2010. [Google Scholar]
  39. Oliveira, L.C.; Teves-Costa, P.; Pinto, C.; Gomes, R.C.; Almeida, I.M.; Ferreira, C.; Pereira, T.; Sotto-Mayor, M. Seismic microzonation based on large geotechnical database: Application to Lisbon. Eng. Geol. 2020, 265, 105417. [Google Scholar] [CrossRef]
  40. Ruggieri, S.; Calò, M.; Cardellicchio, A.; Uva, G. Analytical-mechanical based framework for seismic overall fragility analysis of existing RC buildings in town compartments. Bull. Earthq. Eng. 2022, 20, 8179–8216. [Google Scholar] [CrossRef]
  41. Eudave, R.R.; Rodrigues, H.; Ferreira, T.M. Building Survey and Characterization Techniques at Different Scales. In Seismic Vulnerability Assessment of Civil Engineering Structures at Multiple Scales: From Single Buildings to Large-Scale Assessment; Elsevier Science: Amsterdam, The Netherlands, 2022; Chapter 1. [Google Scholar] [CrossRef]
  42. Ferreira, T.M.; Bernardini, G. Methods, Techniques, and Tools for Assessing Vulnerability of Building Stocks. In Seismic Vulnerability Assessment of Civil Engineering Structures at Multiple Scales: From Single Buildings to Large-Scale Assessment; Elsevier Science: Amsterdam, The Netherlands, 2022; Chapter 8. [Google Scholar] [CrossRef]
  43. Cardoso, R.; Lopes, M.; Bento, R. Seismic Evaluation of Old Masonry Buildings. Part I: Method Description and Application to a Case-Study. J. Eng. Struct. 2005, 27, 2024–2035. [Google Scholar] [CrossRef]
  44. Xavier, V.; Couto, R.; Monteiro, R.; Castro, J.M.; Bento, R. Detailed Structural Characterization of Existing RC Buildings for Seismic Exposure Modelling of the Lisbon Area. Buildings 2022, 12, 642. [Google Scholar] [CrossRef]
  45. HAZUS Earthquake Model—Technical Manual. 2020. Available online: https://www.fema.gov/sites/default/files/2020-10/fema_hazus_earthquake_technical_manual_4-2.pdf (accessed on 23 June 2025).
  46. Oliveira, C.S.; Campos-Costa, A.; Sousa, M.L.; Martins, A. Estimativa dos Danos Causados por Sismos no Parque Habitacional do Continente Português. Contribuição para a Definição de uma Política de Seguros. Study for the Associação Portuguesa de Seguradores; Associação Portuguesa de Seguradores: Lisbon, Portugal, 1997. (In Portuguese) [Google Scholar]
  47. Silva, V.; Crowley, H.; Varum, H.; Pinho, R. Seismic risk assessment for mainland Portugal. Bull. Earthq. Eng. 2014, 13, 429–457. [Google Scholar] [CrossRef]
  48. Martins, L.; Silva, V. Development of a fragility and vulnerability model for global seismic risk analyses. Bull. Earthq. Eng. 2021, 19, 6719–6745. [Google Scholar] [CrossRef]
  49. Bernardo, V.; Campos-Costa, A.; Candeias, P.; Carvalho, A.; Costa, A. Seismic Scenario Losses Estimation of Pre-code Masonry Buildings in the Metropolitan Area of Lisbon. J. Earthq. Eng. 2024, 28, 4363–4379. [Google Scholar] [CrossRef]
  50. Cardoso, R.; Lopes, M. Seismic assessment of ‘Pombalino’ buildings. In Proceedings of the 13th World Conference on Earthquake Engineering, Vancouver, BC, Canada, 1–6 August 2004. [Google Scholar]
  51. Couto, R.; Sousa, I.; Bento, R.; Castro, J.M. Chapter 2. Seismic vulnerability assessment of RC structures: Research and practice at building level. In Seismic Vulnerability Assessment of Civil Engineering Structures at Multiple Scales. From Single Buildings to Large-Scale Assessment; Ferreira, T.M., Rodrigues, H., Eds.; Elsevier: Amsterdam, The Netherlands, 2021; ISBN 9780128240724. [Google Scholar]
  52. Simões, A.G.; Bento, R.; Lagomarsino, S.; Cattari, S.; Lourenço, P.B. Fragility Functions for Tall URM Buildings around Early 20th Century in Lisbon, Part 1: Methodology and Application at Building Level. Int. J. Archit. Herit. 2019, 15, 349–372. [Google Scholar] [CrossRef]
  53. Simões, A.G.; Bento, R.; Lagomarsino, S.; Cattari, S.; Lourenço, P.B. Fragility Functions for Tall URM Buildings around Early 20th Century in Lisbon, Part 2: Application to Different Classes of Buildings. Int. J. Archit. Herit. 2019, 15, 373–389. [Google Scholar] [CrossRef]
  54. Benedetti, D.; Petrini, V. On seismic vulnerability of masonry buildings: Proposal of an evaluation procedure. Ind. Constr. 1984, 18, 66–78. [Google Scholar]
  55. Giovinazzi, S.; Lagomarsino, S. Una metodologia per l’analisi di vulnerabilità sismica del costruito. In Proceedings of the X Congresso Nazionale L’ingegneria Sismica in Italia, Potenza-Matera, Italy, 9–13 March 2001. (In Italian). [Google Scholar]
  56. Veletsos, A.S.; Newmark, N.M. Effect of inelastic behaviour on the response of simple systems. In Proceedings of the 2nd World Conference on Earthquake Engineering, Tokyo and Kyoto, Japan, 11–18 July 1960. [Google Scholar]
  57. Newmark, N.M.; Hall, W.J. Earthquake Spectra and Design, Engineering Monographs on Earthquake Criteria. In Structural Design, and Strong Motion Records; Earthquake Engineering Research Institute: Oakland, CA, USA, 1982; Volume 3. [Google Scholar]
  58. Freeman, S.A.; Nicoletti, J.P. Evaluations of existing buildings for seismic risk—A case study of Puget Sound Naval Shipyard, Bremerton, Washington. In Proceedings of the U.S. National Conference on Earthquake Engineering, Berkeley, CA, USA, 18–20 June 1975. [Google Scholar]
  59. Fajfar, P.; Fischinger, M. N2. A method for non-linear seismic analysis of regular buildings. In Proceedings of the 9th World Conference on Earthquake Engineering, Tokyo-Kyoto, Japan, 2–9 August 1988. [Google Scholar]
  60. ATC-40 Seismic Evaluation and Retrofit of Concrete Buildings; Applied Technology Council: Redwood City, CA, USA, 1996.
  61. Fajfar, P. A non-linear analysis method for performance based seismic design. Earthq. Spectra 2000, 16, 573–592. [Google Scholar] [CrossRef]
  62. Fajfar, P. Structural analysis in earthquake engineering—A breakthrough of simplified non-linear methods. In Proceedings of the 12th European Conference on Earthquake Engineering, Keynote Lecture, London, UK, 9–13 September 2002. [Google Scholar]
  63. Giovinazzi, S.; Lagomarsino, S. A macroseismic method for the vulnerability assessment of buildings. In Proceedings of the 13th World Conference on Earthquake Engineering, Vancouver, BA, Canada, 1–6 August 2004. [Google Scholar]
  64. Giovinazzi, S. The Vulnerability Assessment and the Damage Scenario in Seismic Risk Analysis. Ph.D. Thesis, Department of Civil Engineering. Braunschweig, Technical University Carolo-Wilhelmina, Braunschweig, Germany, 2005. [Google Scholar]
  65. Lagomarsino, S.; Giovinazzi, S. Macroseismic and mechanical models for the vulnerability and damage assessment of current buildings. Bull. Earthq. Eng. 2006, 4, 415–443. [Google Scholar] [CrossRef]
  66. Lagomarsino, S.; Cattari, S.; Ottonelli, D. The Heuristic vulnerability model: Fragility curves for masonry buildings. Bull. Earthq. Eng. 2021, 19, 3129–3163. [Google Scholar] [CrossRef]
  67. NZSEE Study Group. Assessment and Improvement of Structural Performance of Buildings in Earthquakes; New Zealand Society for Earthquake Engineering, NZSEE: Wellington, New Zealand, 2006. [Google Scholar]
  68. EN 1998-1; Eurocode 8: Design of Structures for Earthquake Resistance. European Standards. Part 1. The European Union: Brussels, Belgium, 2004.
  69. NP EN 1998-1; Eurocódigo 8—Projecto de Estruturas para Resistência aos Sismos. Parte 1: Regras Gerais, Acções Sísmicas e Regras para Edifícios. Instituto Português da Qualidade: Caparica, Portugal, 2010; Volume 210. (In Portuguese)
  70. RSCCS Decreto No 415658. 31 de Maio. 1958. Available online: https://dre.pt/application/file/353656 (accessed on 16 April 2025). (In Portuguese).
  71. RSEP Regulamento de Solicitações em Edifícios e Pontes (RSEP). Decreto no 44041 de 18 de Novembro; Diário da República: Lisbon, Portugal, 1961. (In Portuguese)
  72. RGEU. Regulamento Geral das Edificações Urbanas; Diário da República: Lisbon, Portugal, 1975. (In Portuguese) [Google Scholar]
  73. REBAP. Decreto-Lei nº 349-C/83—Regulamento de Estruturas de Betão Armado e Pré-Esforçado; Porto Editora: Porto, Portugal, 1983. (In Portuguese) [Google Scholar]
  74. RSA Regulamento de Segurança e Acções para Estruturas de Edifícios e Pontes. Decreto-Lei no. 235/83; Diário da República: Lisbon, Portugal, 1983. (In Portuguese)
  75. Parisse, F.; Cattari, S.; Marques, R.; Lourenço, P.B.; Magenes, G.; Beyer, K.; Calderoni, B.; Camata, G.; Cordasco, E.A.; Erberik, M.A.; et al. Benchmarking the seismic assessment of unreinforced masonry buildings from a blind prediction test. Structures 2021, 31, 982–1005. [Google Scholar] [CrossRef]
  76. Angiolilli, M.; Lagomarsino, S.; Cattari, S.; Degli Abbati, S. Seismic fragility assessment of existing masonry buildings in aggregate. Eng. Struct. 2021, 247, 113218. [Google Scholar] [CrossRef]
  77. Milutinovic, Z.V.; Trendafiloski, G.S. WP4 Vulnerability of Current Buildings. Report on an Advanced Approach to Earthquake Risk Scenarios with Applications to Different European Towns—RISK-UE, EVK4-CT-2000-00014. 2003. 110p. Available online: http://www.civil.ist.utl.pt/~mlopes/conteudos/DamageStates/Risk%20UE%20WP04_Vulnerability.pdf (accessed on 23 June 2025).
  78. LessLoss Project. Risk Mitigation for Earthquakes and Landslides. In Sixth Programme for Research, Technological Development and Demonstration of European Commission, Contract No.: GOCE-CT-2003-505448, 2003. Available online: https://www.copernicus.eu/en/documentation/research-projects/risk-mitigation-earthquakes-and-landslides (accessed on 23 June 2025).
  79. Calvi, G.M. A displacement-based approach for vulnerability evaluation of classes of buildings. J. Earthq. Eng. 1999, 3, 411–438. [Google Scholar] [CrossRef]
  80. Pinho, R.; Bommer, J.J.; Glaister, S. A simplified approach to displacement-based earthquake loss estimation analysis. In Proceedings of the 12th European Conference on Earthquake Engineering, London, UK, 9–13 September 2002. Paper no. 738. [Google Scholar]
  81. Crowley, H.; Pinho, R.; Bommer, J.J. A probabilistic displacement-based vulnerability assessment procedure for earthquake loss estimation. Bull. Earthq. Eng. 2004, 2, 173–219. [Google Scholar] [CrossRef]
  82. Silva, V.; Crowley, H.; Varum, H.; Pinho, R.; Sousa, L. Investigation of the characteristics of Portuguese regular moment-frame RC buildings and development of a vulnerability model. Bull. Earthq. Eng. 2015, 13, 1455–1490. [Google Scholar] [CrossRef]
  83. Schultz, A.E. Approximating lateral stiffness of stories in elastic frames. J. Struct. Eng. 1992, 118, 243–263. [Google Scholar] [CrossRef]
  84. Priestley, M.J.N.; Calvi, G.M. Towards a capacity—Design assessment procedure for reinforced concrete frames. Earthq. Spectra 1998, 7, 413–437. [Google Scholar] [CrossRef]
  85. Priestley, M.J.N. Displacement-based seismic assessment of existing reinforced concrete buildings. In Proceedings of the Pacific Conference on Earthquake Engineering, Melbourne, Australia, 20–22 November 1995. [Google Scholar]
  86. Priestley, M.J.N. Displacement-based seismic assessment of reinforced concrete buildings. J. Earthq. Eng. 1997, 1, 157–192. [Google Scholar] [CrossRef]
  87. Glaister, S.; Pinho, R. Development of a Simplified Deformation-Based Method for Seismic Vulnerability Assessment. J. Earthq. Eng. 2003, 7, 107–140. [Google Scholar] [CrossRef]
  88. Simões, A.L. Modelação Numérica, Avaliação de Segurança e Reforço Sísmico de um Edifício Tipo Porticado de Betão Armado: Modelação Numérica, Avaliação de Segurança e Reforço Sísmico de um Edifício Tipo Porticado de Betão Armado. Ph.D. Thesis, IST/University of Lisbon, Lisbon, Portugal, 2023. (In Portuguese). [Google Scholar]
  89. Di Risi, M.T.; Scala, S.A.; Verderame, G.M. How much code-based shear models affect seismic assessment of pre-code RC buildings? Procedia Struct. Integr. 2024, 64, 959–967. [Google Scholar] [CrossRef]
  90. EN 1993-1-1; Eurocode 3: Design of Structures for Earthquake Resistance. European Standards. Part 3. The European Union: Brussels, Belgium, 2005.
  91. Lopes, M.; Pilakoutas, K. Shear Strength of Plastic Hinges of Reinforced Concrete Walls. Eur. Earthq. Eng. 1997, 3, 45–58. [Google Scholar]
  92. INE. Censos 2021-XVI Recenseamento Geral da População. VI Recenseamento Geral da Habitação-Instituto Nacional de Estatística, IP—Portugal, 2021. (In Portuguese). Available online: https://www.ine.pt/xportal/xmain?xpid=INE&xpgid=ine_publicacoes&PUBLICACOESpub_boui=65586079&PUBLICACOESmodo=2 (accessed on 23 June 2025).
  93. Ferreira, M.A.; Oliveira, C.S.; Francisco, R. Tsunami risk mitigation: The role of evacuation routes, preparedness and urban planning. Nat. Hazards 2024, 121, 6719–6751. [Google Scholar] [CrossRef]
  94. KnowRISK. Know Your City, Reduce Seismic Risk Through Non-Structural Elements. European Commission’s Humanitarian Aid and Civil Protection, Grant Agreement ECHO/SUB/2015718655/PREV2. 2017. Available online: https://knowriskproject.com/ (accessed on 16 April 2025).
  95. Oliveira, C.S. The Main Developments of Seismology and Earthquake Engineering since the early 1700s and the New Challenges for a Sustainable Society. Bull. Earthq. Eng. 2022, 20, 4697–4863. [Google Scholar] [CrossRef]
  96. Furtado, A.; Rodrigues, H.; Arêde, A.; Varum, H. A Review of the Performance of Infilled RC Structures in Recent Earthquakes. Appl. Sci. 2021, 11, 5889. [Google Scholar] [CrossRef]
  97. Purushothama, C.; Mucedero, G.; Perrone, D.; Monteiro, R. Evaluation of rapid visual screening assessment of existing buildings using nonlinear numerical analysis. J. Build. Eng. 2023, 76, 107110. [Google Scholar] [CrossRef]
  98. Bento, R.; Falcão, S.; Rodrigues, F. Avaliação sísmica de estruturas de edifícios com base em análises estáticas não lineares. In Proceedings of the SÍSMICA 2004—6º Congresso Nacional de Sismologia e Engenharia Sísmica, Guimarães, Portugal, 14–15 April 2004. (In Portuguese). [Google Scholar]
  99. Fajfar, P.; Marušić, D.; Peruš, I. The Extension of the N2 Method to Asymmetric Buildings. In Proceedings of the Simposio Luis Esteva, Tendencias y retos de la Ingenieria Sísmica, Mexico, 2005. Available online: https://www.scribd.com/doc/239037846/The-Exstension-of-the-N2-Method-to-Asymmetric-Buildings (accessed on 23 June 2025).
  100. Simões, A.; Bento, R.; Lagomarsino, S.; Cattari, S. Seismic Pushover Analysis of ‘Gaioleiro’ Buildings in Lisbon. In Proceedings of the International Conference on Earthquake Engineering, SE-50EEE, Skopje, North Macedonia, 28–31 May 2013. [Google Scholar]
  101. Vidic, T.; Fajfar, P.; Fischinger, M. Consistent inelastic design spectra: Strength and displacement. Earthq. Eng. Struct. Dyn. 1994, 23, 502–521. [Google Scholar] [CrossRef]
Figure 1. Geographical distribution of housing in Lisbon by typologies. Source: LNEC 1985. Updated by Serviço Municipal de Proteção Civil in 1993.
Sustainability 17 06027 g001
Figure 2. Schematic diagram for “macro” studies and level of analyses for “micro” studies.
Sustainability 17 06027 g002
Figure 3. A sequence expressing the basic methodology used to obtain agu.
Sustainability 17 06027 g003
Figure 4. A flowchart of the algorithm used to compute risk.
Sustainability 17 06027 g004
Figure 5. Parameters characterizing the capacity curve of a single degree of the freedom system (adapted from [22]).
Sustainability 17 06027 g005
Figure 6. N2 method used to invert and obtain agu. (e—elastic; T—period (sec); and y—yielding. (adapted from [22]).
Sustainability 17 06027 g006
Figure 7. An extract of Table S1 of Section S2 of the Supplemental Materials, showing the agu’s for different typologies.
Sustainability 17 06027 g007
Figure 8. (a) SCWB/beam sway and (b) WCSB/column sway mechanisms (after [22]). θ is the chord rotation and heff is the effective height.
Sustainability 17 06027 g008
Figure 9. Example of soft-story vertical discontinuity at ground floor.
Sustainability 17 06027 g009
Figure 10. Examples of irregularities: (a) on the plant—blue interior of block; green corner; red isolated; yellow edge of block; (b) along the height—gray brick infill walls; white—no infill.
Sustainability 17 06027 g010
Figure 11. Conversion of macroseismic modifiers ΔVu to modifiers (agu).
Sustainability 17 06027 g011
Figure 12. An example of a building plan geometry under current analysis. The Department of Buildings Collection, Lisbon Municipal Archives.
Sustainability 17 06027 g012
Figure 13. An example of a risk map of a small area at the city scale.
Sustainability 17 06027 g013
Figure 14. A synthetic version of Table S1 of Section S2 of the Supplemental Materials, showing the agu for different typologies in case of a reduced number of parameters (only two + soil type).
Sustainability 17 06027 g014
Figure 15. The distribution of the risk index (R) for a set of 50 social municipal buildings inspected, “replicated” to a selection of 1600 cases.
Sustainability 17 06027 g015
Table 1. The main typologies, valid essentially for the Lisbon City Council.
MaterialPeriodTypology
MPrior to 1755Joanino
M1755–1860Pombalino
M1860–1930Gaioleiro
MT1930–1950Placa (transition from masonry to RC)
RC1950–19601st phase TC (without seismic calculation)
RC1960–19862nd phase RC (with seismic calculation—equivalent static forces)
RC1986–20003rd phase RC (RSA-1983 code—with dynamic analysis)
RC2020–2025Similar to the previous phase, but with perceived average better-quality control
M—masonry; MT—masonry transition to RC; RC—reinforced concrete.
Table 2. Values of modifier Δi from several sources.
LevelDescriptionJapanNew ZealandS. LagomarsinoR. VicenteIST
IState of preservation0.36--0.770.630.73
IIInteraction w/adjacent buildings0.730.160.410.490.81
IIIFoundations, soil stability0.700.500.590.700.67
IVPlan irregularity0.550.400.770.700.90
VVertical irregularity--0.400.650.540.82
VIOther structural weakness--0.400.460.770.52
Table 3. Individual corrections for modifiers (Δ+) used in the study (n is the number of retrofitting interventions). Examples for n = 2 and n = 3.
nΔ+Special Cases
21.34Add 0.25 to Δ+ if the building is less than 3 floors
31.67Add 0.25 to Δ+ if the building is less than 3 floors
41.91--
52.09--
62.24--
72.37--
82.48--
92.50--
Table 4. Soil parameters for each of the 7 classes, defined as in the EC-8.
SoilSmaxS = (5 × Smax + 1)/6
A1.001.00
AB1.181.15
B1.351.29
BC1.481.40
C1.601.50
D2.001.83
E1.801.67
Table 5. Distinguished levels of the risk index (R) according to “Structural resistance” and “Building habitability”.
Risk Index, RStructural Resistance
[0, 1[Without structural problems
[1, 1.5[Some structural problems (not requiring strengthening) (minor repair work)
[1.5, 2[Some structural problems (requiring strengthening)
≥2High probability of collapse
Risk Index, RBuilding habitability
[0, 0.5[Habitable
[0.5, 1[Temporary uninhabitable
[1, 1.5[Temporary uninhabitable (strengthening required)
≥1.5Uninhabitable
Table 6. Calculation of the risk indicator, R.
SoilSmaxS = (5 × Smax + 1)/6aguΔΔ+R = (1.5 × S/agu)
B1.351.291.4111.38
Disclaimer/Publisher’s Note: The statements, opinions and data contained in all publications are solely those of the individual author(s) and contributor(s) and not of MDPI and/or the editor(s). MDPI and/or the editor(s) disclaim responsibility for any injury to people or property resulting from any ideas, methods, instructions or products referred to in the content.

