Article

The Interactive Coercive Relationship Between Urbanization and Eco-Environmental Quality in China

School of Tourism, Xinyang Normal University, Xinyang 464000, China
Sustainability 2025, 17(13), 6019; https://doi.org/10.3390/su17136019
Submission received: 7 May 2025 / Revised: 20 June 2025 / Accepted: 23 June 2025 / Published: 30 June 2025

Abstract

As China’s economy shifts from rapid development to high-quality development, exploring the harmony between human activities and the ecological environment has become the focus of many scholars. As the center of human activities, urbanized areas have complex and diverse impacts on the ecological environment. Previous studies have mainly focused on highly urbanized areas of importance in China, and there are fewer studies covering all prefecture-level cities across the country. Therefore, this study measured the spatial and temporal characteristics of urbanization and eco-environment quality (EEQ) in all prefecture-level cities in China from 2000 to 2020 and explored the coupling coordination degree (CCD) relationship between urbanization and EEQ through the CCD model. The results showed that the average EEQ showed a fluctuating upward trend, with the southern and northeastern regions scoring significantly higher than the western and northern regions. In terms of spatial evolution, most prefecture-level cities had small changes in EEQ, with changes ranging from −0.05 to 0.05 per decade. The average urbanization showed a rapid increasing trend, spatially distributed with high values in the east and low values in the west. In the North China Plain and along the southeast coast, urbanization was concentrated in high-value areas, showing a trend of rapid growth. From 2000 to 2020, the average CCD between urbanization and EEQ showed a continuous increasing trend, from 0.32 to 0.37, indicating a medium imbalance. However, the proportion of low-coordination and moderate-coordination prefecture-level cities increased continuously, from 31.5% and 1.0% in 2000 to 35.3% and 1.9% in 2020, respectively. This indicates that Chinese urbanization efforts are constantly being optimized and moving toward the goal of sustainable development. The results of the study provide a scientific reference basis for coordinating the relationship between urbanization development and EEQ, and they support the formulation of policies for urbanization planning and high-quality economic development in China.

1. Introduction

In recent decades, China’s urbanization process has advanced rapidly, with the urbanization rate rising from an initial 17.92% in 1978 to 66.16% in 2023 (a level much higher than the global average) [1,2]. The increasing rate of urbanization suggests that more people will move into cities, leading to higher demand for products and services. Urbanization represents, on the one hand, improvements in people’s living standards, including economic growth, better living conditions, and more advanced societal development [3]. However, on the other hand, urbanization has also caused a series of negative impacts on eco-environment quality (EEQ), such as air pollution, water pollution, and soil pollution [4,5]. These negative impacts significantly hinder the sustainable development of human society and the further improvement of human well-being [6]. As a foundation for human survival and development, changes in EEQ will inevitably constrain urbanization progress [7]. Therefore, achieving a balance between urban development and EEQ is essential to ensure the sustainable development of cities, presenting a major challenge for human society [8,9].
With the continuous development of human society, the concept of urbanization has been enriched. Early urbanization was mainly measured by single indicators, such as population urbanization, land urbanization, and urbanization measured by night-time lights. However, with the release of China’s National New Urbanization Plan (2014–2020) in 2014, the concept of new-type urbanization was introduced, which extends beyond traditional notions of population urbanization and economic urbanization [10], also emphasizing urban EEQ [11], public facility distribution [12], and spatial scale [10]. Therefore, academic research on urbanization concepts and an evaluation system has been further improved [10,13]. The evaluation of urbanization has gradually evolved from a single indicator system to a comprehensive one, including factors such as population urbanization, economic urbanization, land urbanization, and social urbanization [5,12,14]. Population urbanization, driven by rural–urban migration, inevitably leads to concentrated demand for resources such as water, energy, and food, thereby exacerbating ecological degradation [15]. The expansion of urban infrastructure through land urbanization inevitably transforms natural habitats into artificial environments, causing habitat loss and fragmentation and further exacerbating ecological degradation [16]. In addition, economic urbanization—driven by continuous urban development—generates substantial waste, including solid waste and wastewater. The treatment of these wastes demands considerable energy and resources, thereby increasing the risk of ecological deterioration. Therefore, a comprehensive framework can better reflect the process and evolutionary patterns of urbanization development [17].
Urbanization is an inevitable stage of human development and brings many conveniences to the good life of human beings. However, rapid urbanization also exerts negative impacts on the human living environment, especially on EEQ [5]. As an essential important foundation for human survival and high-quality development, EEQ provides essential material resources for urbanization development. Therefore, accurate evaluation of EEQ has become a focal point in the current scientific research. Traditional EEQ assessment methods predominantly rely on single evaluation indicators, such as the normalized difference vegetation index (NDVI), leaf area index (LAI), and enhanced vegetation index (EVI), which are insufficient for revealing systematic changes in EEQ [18]. With the rapid development and continuous advancement of remote-sensing technology, this approach has been widely applied in ecological monitoring due to its advantages, including extensive spatial coverage, rapid data acquisition, short revisit cycles, and diverse application scenarios [19,20,21]. Among these methods, the remote-sensing-based ecological index (RSEI) developed by Xu et al. has been widely used for monitoring EEQ across various ecosystem types due to its operational simplicity and reliability [19,20,22,23]. However, the initial version primarily incorporated four evaluation indicators: vegetation index (VI), land surface temperature (LST), wetness component (Wet), and soil index (SI), which limited its assessment scope [19,22]. To enhance the predictive capability and accuracy of EEQ evaluation, particularly for large-scale assessments involving multiple land use types (e.g., at the national scale), subsequent studies have significantly improved the index [24,25,26,27]. These refinements have substantially expanded its applicability, leading to widespread adoption at various spatial scales, including the national [28], watershed [29], provincial [30], and municipal levels [31]. Notably, Xu et al. (2021) enhanced the original four-component RSEI framework by incorporating a land cover abundance index and applied the improved index to re-evaluate EEQ in eastern and central China—an advancement that has gained considerable academic recognition [27]. The National Earth System Science Data Center (NESDC) has officially adopted this refined methodology for nationwide EEQ assessments, establishing it as a reference standard for related research [32]. Consequently, this enhanced RSEI offers particular advantages for comprehensive national-scale ecological quality evaluations.
The relationship between urbanization and EEQ serves as a critical indicator of harmonious human–nature coexistence. Given its significance, research on the urbanization– EEQ interplay has garnered growing scholarly interest in recent years [33,34]. These studies primarily aim to identify the pathways for balancing urban development and ecological preservation during societal progress, thereby ensuring sustainable harmony between anthropogenic activities and natural systems. However, the interactions between urbanization and EEQ are highly complex and context-dependent, as evidenced by the existing literature [27,35]. Early studies mainly focused on the unidirectional impact of urbanization on EEQ, including the deterioration of the ecological environment caused by rapid urbanization and the constraints of EEQ on the urbanization process [36]. With progress in research, attention has turned to the coupling coordination degree (CCD) relationship between the two, giving rise to various theories and models, such as the environmental Kuznets curve (EKC) [37], the double-exponential curve [38], the theory of planetary boundaries [39], the theory of urban metabolism [40], and other theories, as well as the STIRPAT model [41] and the CCD model [27]. For different research subjects, researchers have explored the relationship between urbanization and EEQ from different perspectives, among which the CCD model has been most widely applied [42]. Ye et al. and Wang et al. explored the relationship between urbanization and EEQ in the Yangtze River Basin and the Yellow River Basin, respectively, finding that the CCD relationship between urbanization and EEQ has been increasing [43,44]. Numerous studies conducted on city clusters and key provinces have similarly demonstrated an increasing CCD between urbanization and EEQ in China [7,45,46]. However, fewer studies have examined the CCD relationship between urbanization and EEQ at the prefecture-level city scale. China has a vast territory that includes complex and diverse climate and ecosystem types, resulting in significant differences in ecological environment foundations [47]. Given rapid economic development and pronounced regional disparities [48], achieving harmonious development between economic growth and EEQ protection remains a major challenge for China’s high-quality economic development.
Based on the above reasons, we used the multivariate remote-sensing dataset to evaluate the spatio-temporal change pattern of urbanization, EEQ, and CCD in China from 2000 to 2020. The research objectives were as follows: (1) to study the spatio-temporal change process of urbanization in China from 2000 to 2020 through a comprehensive urbanization index; (2) to study the spatio-temporal change process of EEQ in China from 2000 to 2020 through the EEQ index; and (3) to explore the relationship between urbanization and EEQ through the CCD model.

2. Materials and Methods

2.1. Data Sources

The land use/land cover change datasets for China for the years 2000, 2005, 2010, 2015, and 2020 were obtained from the Resources and Environmental Sciences Data Center (RESDC) [49], with a spatial resolution of 30 m × 30 m [8]. According to the standards of the “National Remote Sensing Monitoring Land Use/Cover Classification System”, the land use data were categorized into seven types: forest, grassland, cultivated land, wetland, water bodies, construction land, and unused land. Additionally, socioeconomic data and population density datasets at a 1000 m resolution were obtained from the RESDC. The administrative division data used in this study were obtained from the National Geomatics Center of China [50].

2.2. EEQ Data

In this study, EEQ data were obtained from the China High-Resolution Eco-Environmental Quality (CHEQ) dataset provided by the NESDC [32]. This dataset represents a new EEQ evaluation index for remote-sensing data, specifically RSEI–2 at the regional scale, which builds upon the original RSEI [27]. The dataset employs principal component analysis (PCA) technology to integrate five indicators: wetness (WET), heat (LST), dryness (NDBSI), greenness (NDVI), and the land cover abundance index (AI), with calculations performed using the Google Earth Engine (GEE) platform. Furthermore, the RSEI–2 shows superior accuracy in monitoring EEQ at both national and regional scales compared to the original RSEI [27,28]. The dataset provides annual EEQ data for the years 2001–2021 at a resolution of 500 m. For this study, we selected EEQ data from 2001, 2005, 2010, 2015, and 2020. To align with urbanization data, the 2001 EEQ data were used as a substitute for the 2000 EEQ data in subsequent analyses (according to Xu et al., China’s EEQ exhibits minimal interannual fluctuation (average of 1.21 × 10⁻¹⁰ a−1), thus having negligible impact on data accuracy) [27]. Additionally, this methodological approach has been widely recognized in the academic community [51,52,53].

2.3. Quantifying Urbanization

Urbanization is a complex and multidimensional concept that involves not only population and spatial distribution but is also closely related to the development status of society and the economy [8,12]. Population growth and urban land expansion are surface manifestations of the urbanization process, while true urbanization reflects the improvement of living standards through economic development, urban construction land expansion, and population growth [18]. Therefore, these three indicators are often used to assess living standards and urbanization levels [8,54]. In our study, we employed these three indicators to measure urbanization levels: population density (POD) to represent population growth, GDP density (GDD) to indicate economic development, and construction land ratio (PCL) to quantify urban land expansion. These indicators (POD, GDD, and PCL) have been widely used to characterize the level of urbanization [54,55,56]. In our study, the raw data were further analyzed to obtain prefecture-level city data by using the zonal statistics tool in ArcGIS v10.8. Considering the magnitude differences among the three indicator groups, this study adopted the commonly used range standardization method for data normalization and assigned equal weights to calculate the urbanization development level [54,55,56].

2.4. Spatial Autocorrelation

Spatial autocorrelation analysis is primarily used to characterize the spatial distribution patterns of aggregation or other spatial anomaly features between urbanization and EEQ, encompassing both global and regional spatial autocorrelation [16,57]. The global spatial autocorrelation analysis is used to explore cluster trends in the spatial distribution of urbanization and EEQ [16]. The global Moran’s I index ranges from −1 to 1. A value greater than zero represents a positive correlation between urbanization and EEQ, while a value less than zero indicates a negative correlation; a value approaching zero represents a random distribution pattern. For more detailed analysis, the local bivariate Moran’s I index was used to examine specific correlation and spatial heterogeneity between urbanization and EEQ [58]. The specific calculation formula is as follows:
M o r a n s   I g l o b a l = n i = 1 n j = 1 n W i j ( x i x ¯ ) ( x j x ¯ ) i = 1 n j = 1 n W i j i = 1 n ( x i x ¯ ) 2
M o r a n s   I l o c a l = Z i j n W i j Z j
where n indicates the number of samples. xi and xj indicate the attribute values of the i and j units, respectively. x ¯ indicates the average of the attribute values. Zi and Zj indicate the normalized values of the observed values in the i and j units, respectively, and wij indicates the spatial weight.

2.5. CCD Model

CCD is a concept originally derived from physics and is often used to reflect the degree of coupling and dynamics between two or more systems [8]. In this study, the CCD is used to measure the relationship between urbanization and EEQ. The specific formula is expressed as
C = U × E ( U + E ) / 2
T = α U + β E
D = C × T
where C represents the coupling degree of urbanization and EEQ, while U and E characterize the normalized urbanization and EEQ level, respectively. T is the comprehensive coordination index measuring urbanization and EEQ. α and β are the pending weight coefficients. But there is no uniform academic assignment regarding the magnitude of α and β values. In this study, we considered urbanization and EEQ to be equally important when their contributions to the growth of the whole system are not very different; therefore, the values of both α and β are set to 0.5. D represents the CCD between urbanization and EEQ, with a value range 0–1. Referring to previous studies [12,59], this study classified D into five categories: severe imbalance (0 < D ≤ 0.2), moderate imbalance (0.2 < D ≤ 0.4), low coordination (0.4 < D ≤ 0.6), moderate coordination (0.6 < D ≤ 0.8), and high coordination (0.8 < D ≤ 1).

3. Results

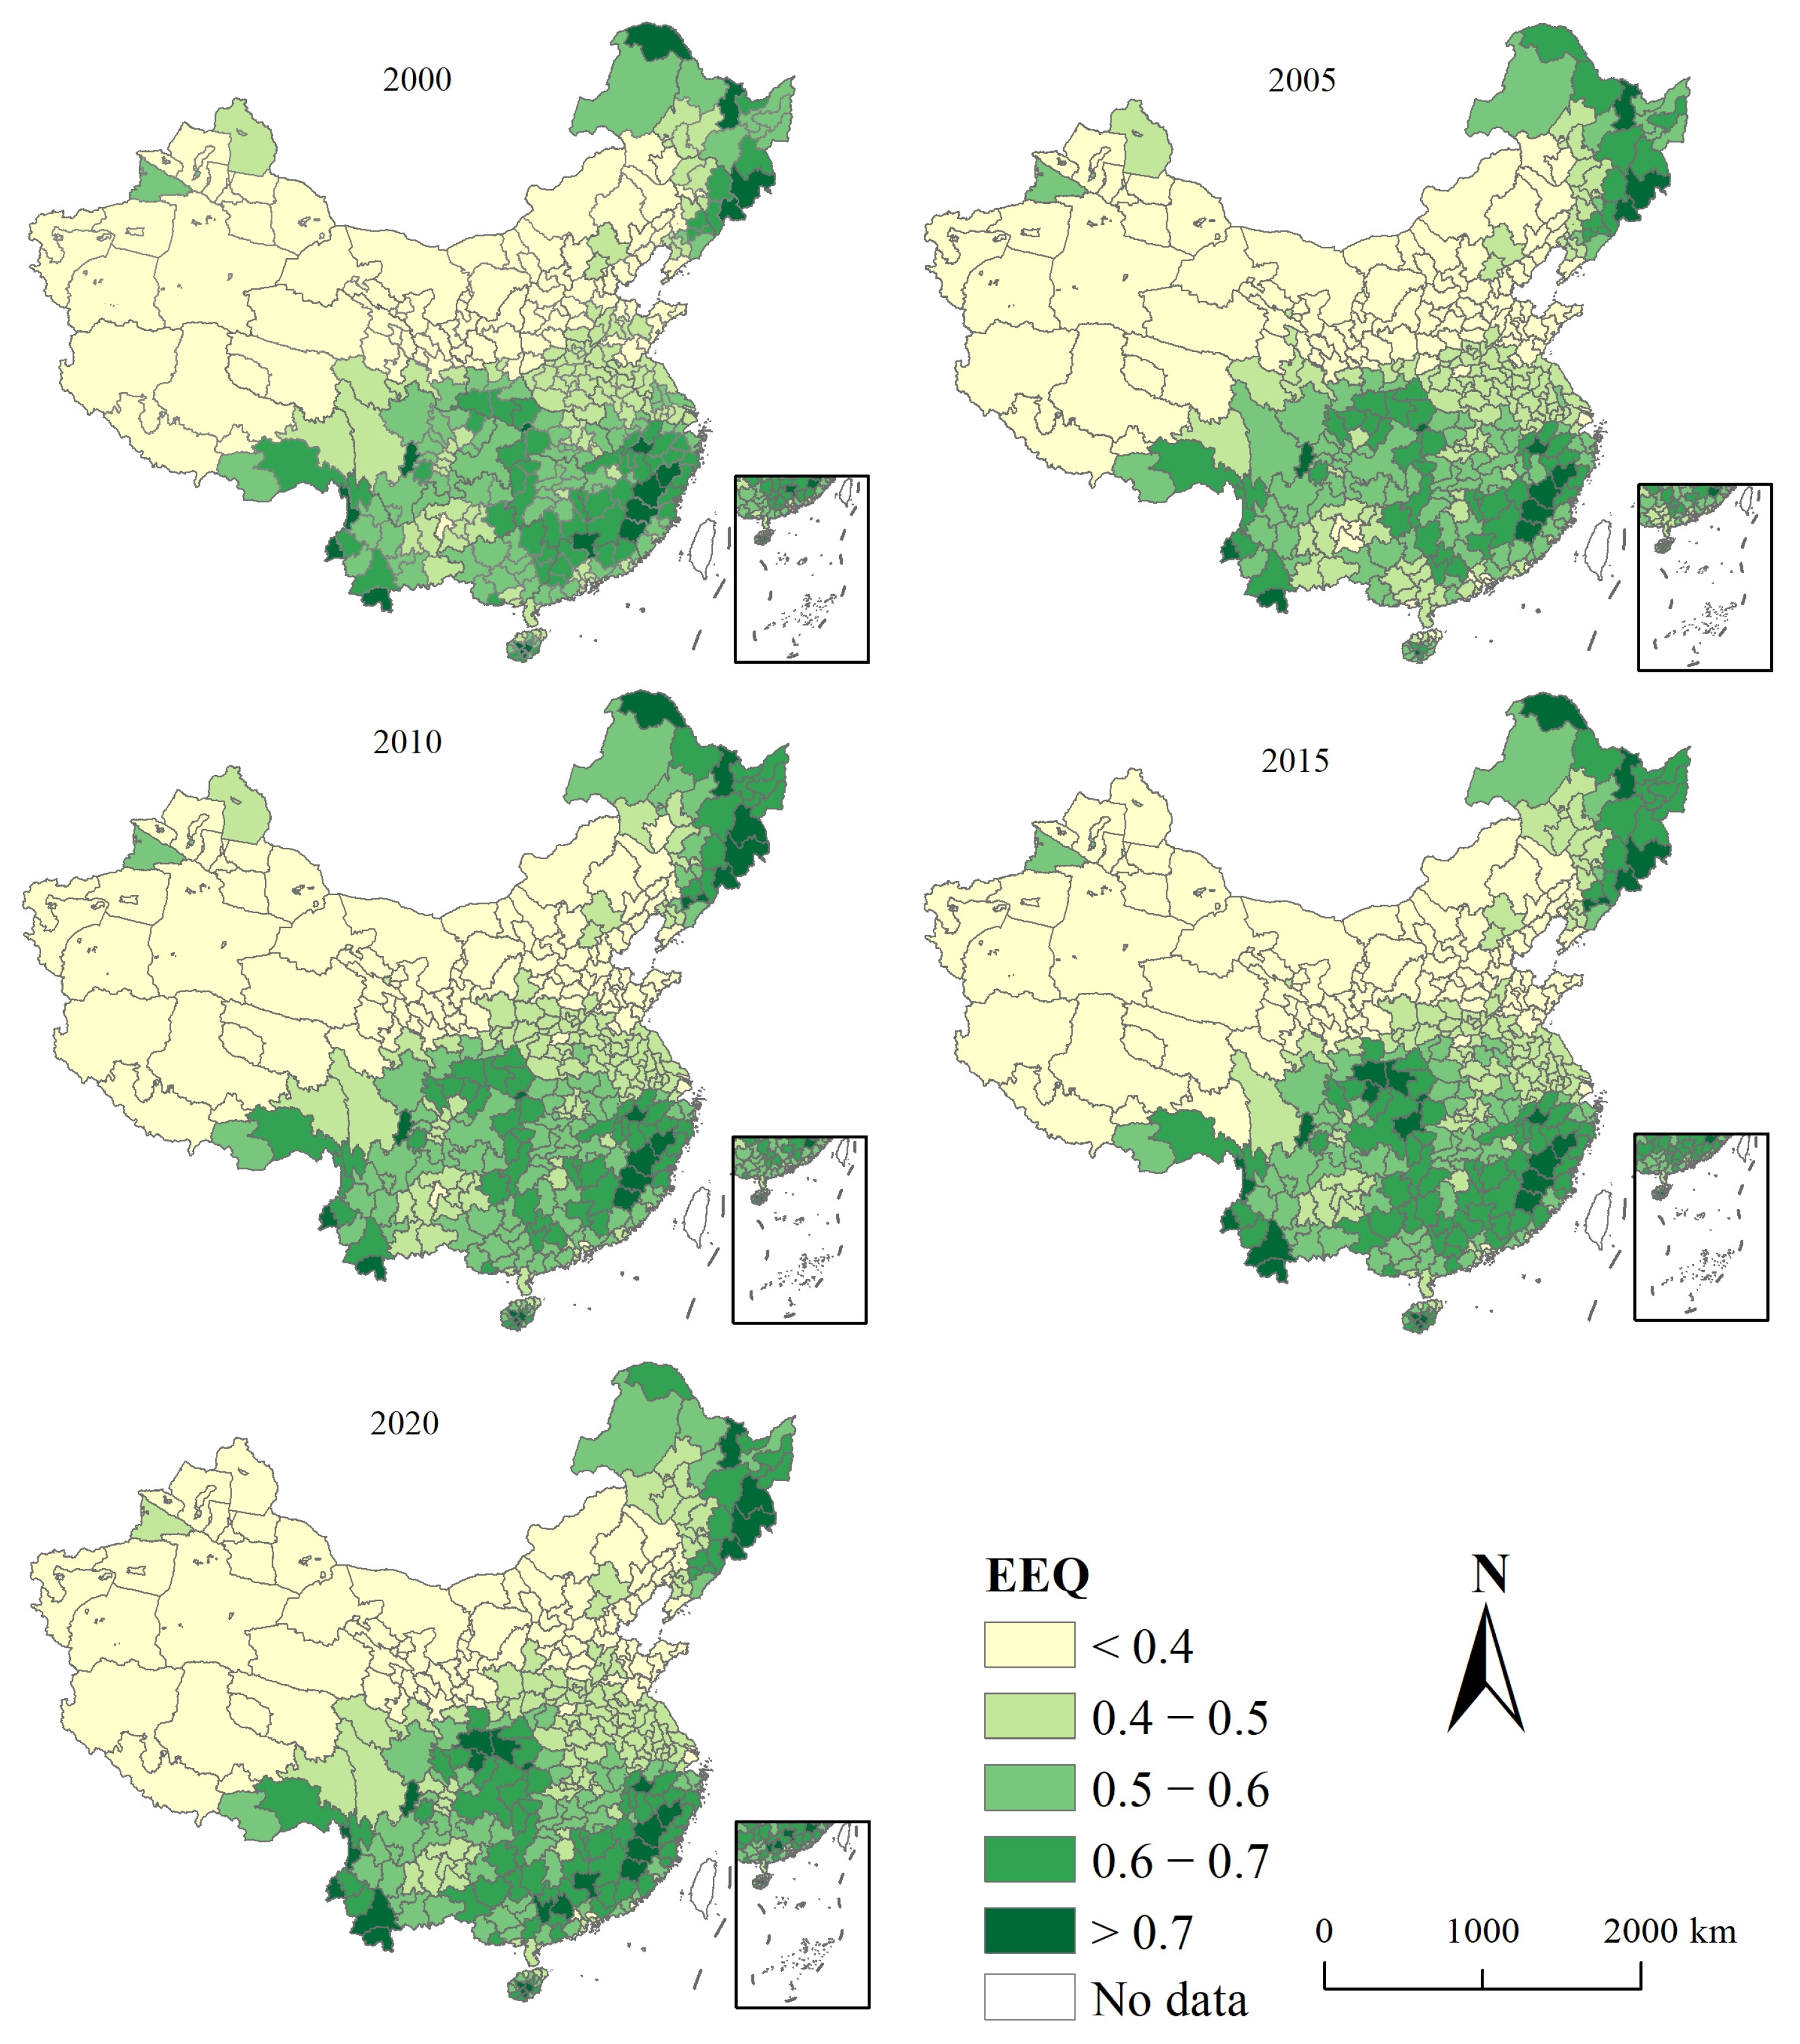
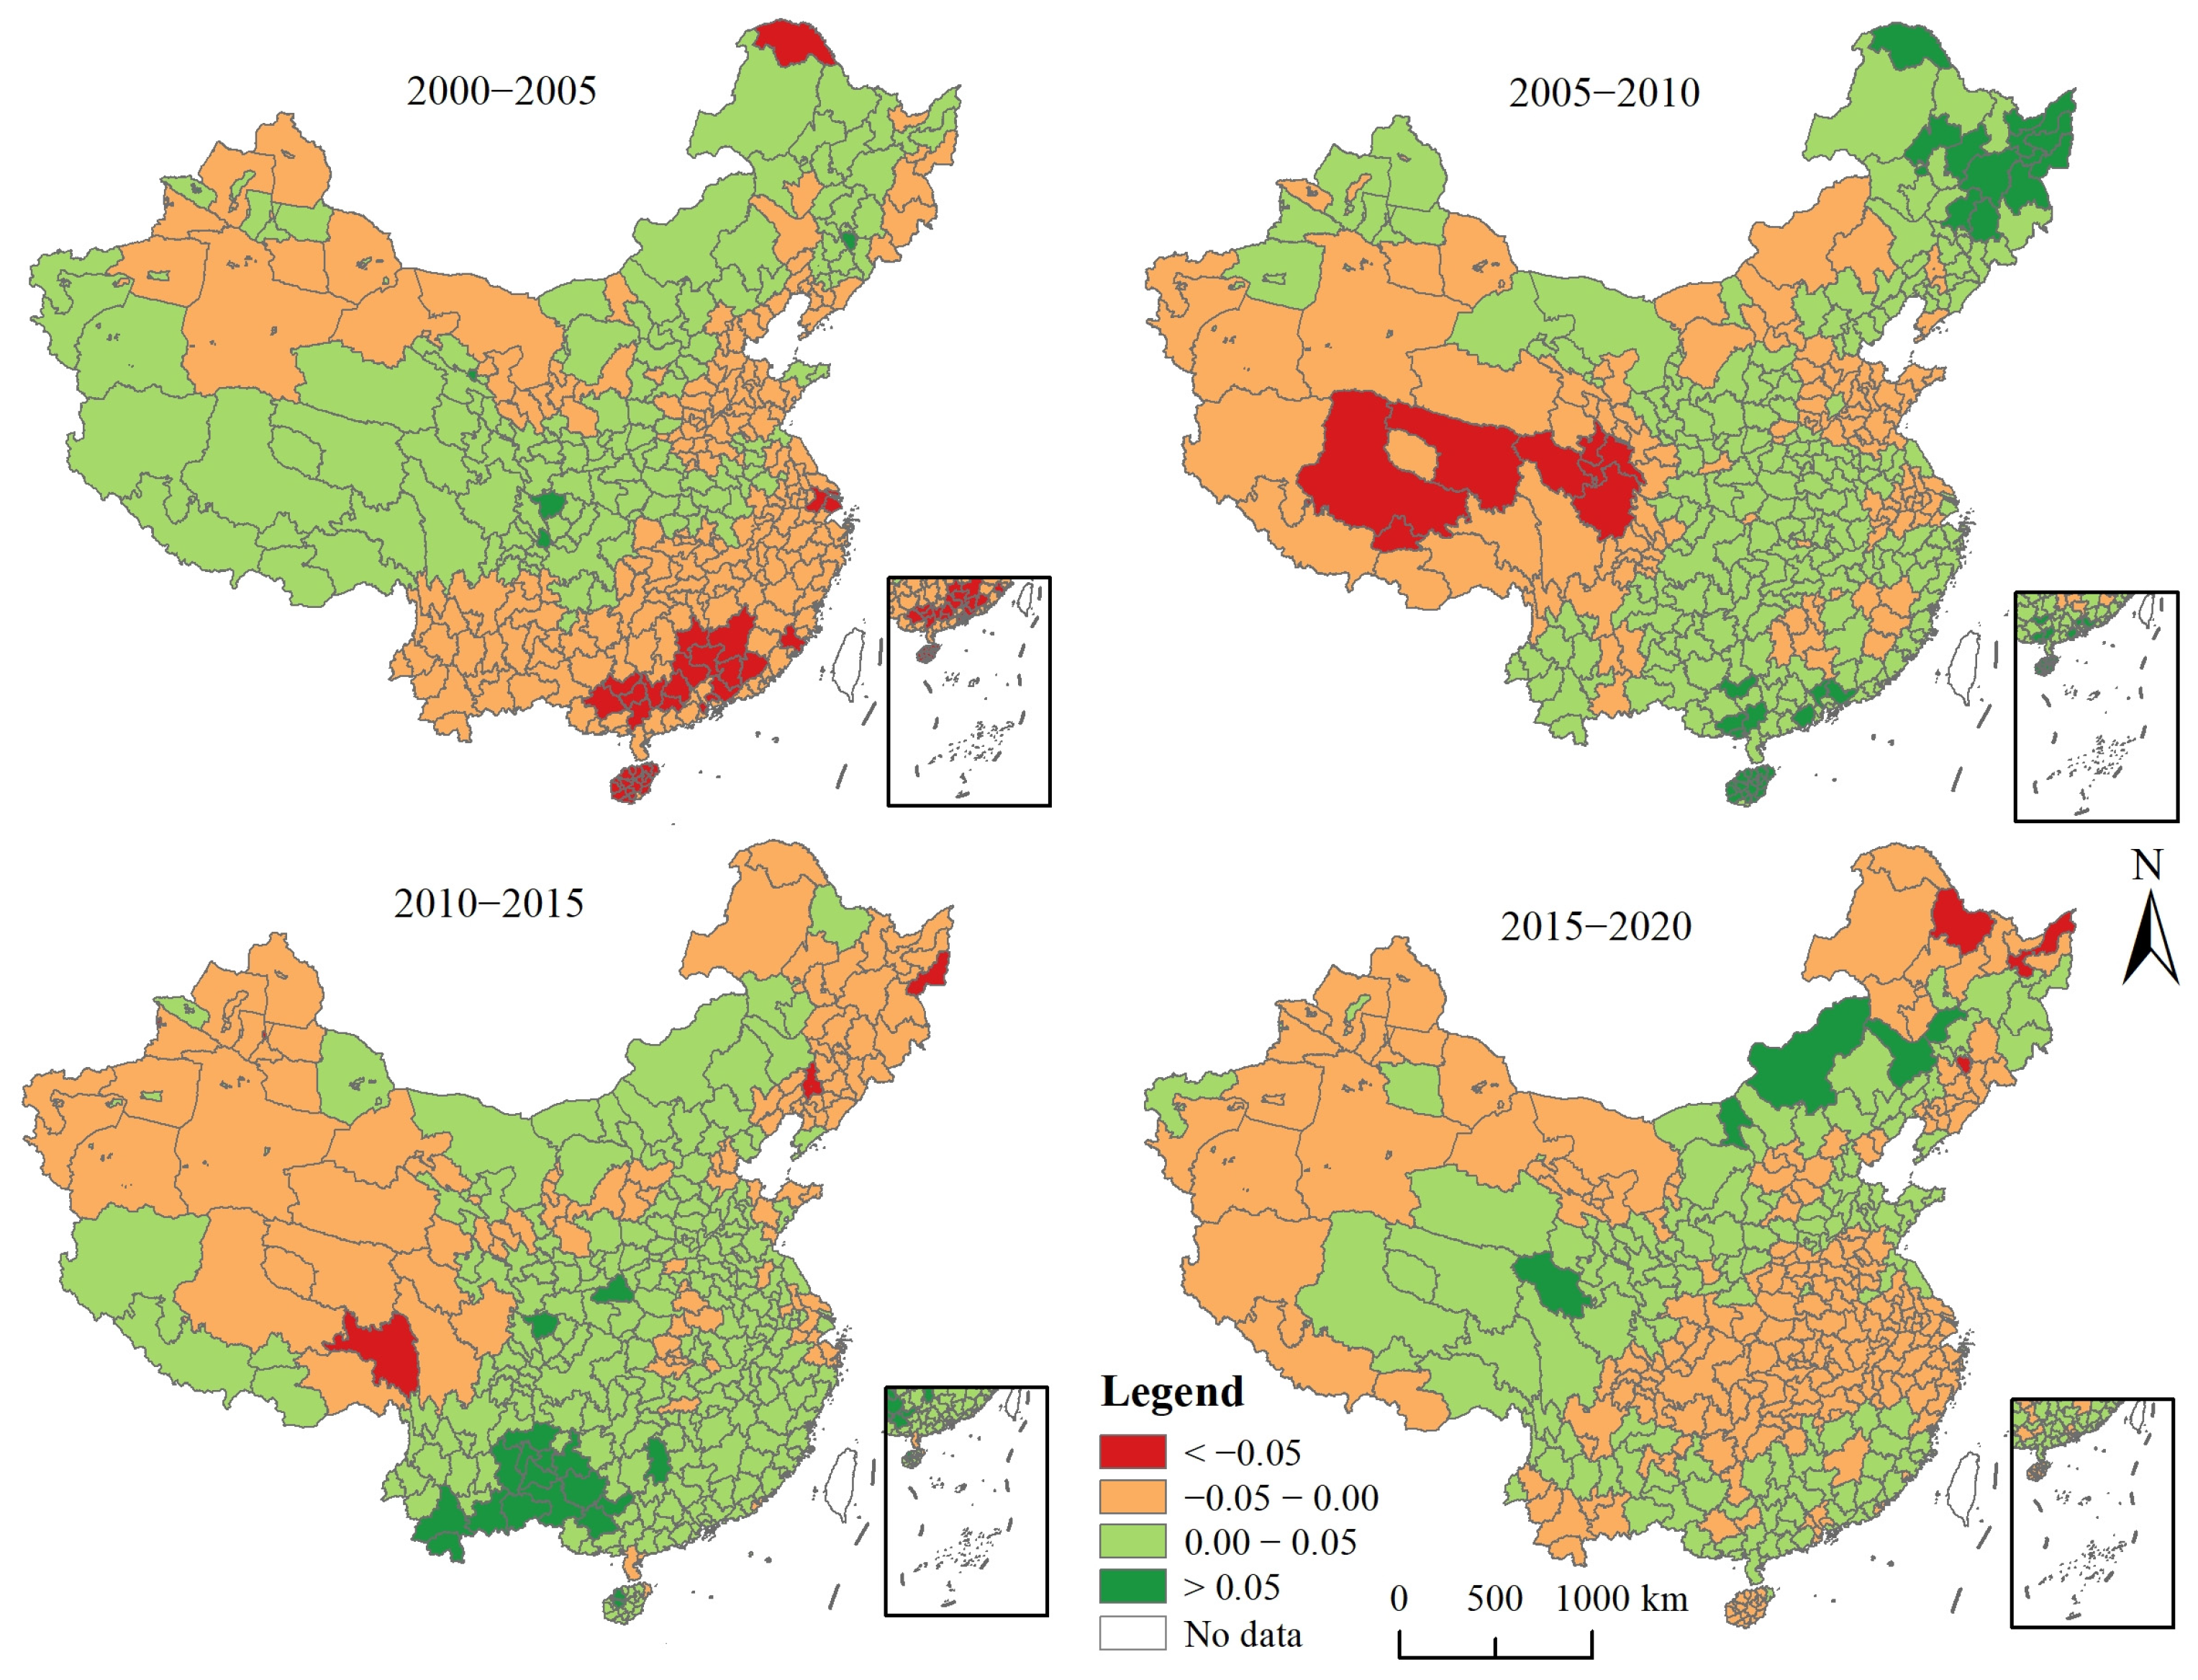
3.1. Spatio-Temporal Characteristics of EEQ

The average EEQ values of all prefecture-level cities were 0.479, 0.467, 0.479, 0.489, and 0.485 in 2000, 2005, 2010, 2015, and 2020, respectively, showing a complex trend of first decreasing, then increasing, followed by a slight decrease. The changes between the periods were −0.012 (2000–2005), +0.12 (2005–2010), +0.01 (2010–2015), and −0.004 (2015–2020). This fluctuation may be related to the increased climate variability in recent years. During the study period, EEQ showed significant spatial differences at the prefecture level (Figure 1). Overall, prefectures in the western and northern regions exhibited lower EEQ values, while those in some southern and northeastern areas showed higher values. However, the temporal variations in EEQ revealed complex regional differences (Figure 2). From 2000 to 2005, EEQ increased in the north (except for the northwest: Shandong Province and neighboring prefecture-level cities) but decreased in the south. Significant EEQ reductions were observed in Fujian, Guangdong, Guangxi, and Hainan Provinces. From 2005 to 2010, the trend reversed, with decreases in the west, eastern Inner Mongolia, and Shandong Province and its vicinity, while increases occurred in most southern and northeastern regions. During 2010–2015, EEQ declines were primarily concentrated in western and northeastern China, while most other regions exhibited improvement. Notably, the southwestern regions demonstrated the most significant enhancement in EEQ. Between 2015 and 2020, a new spatial pattern emerged: some western prefecture-level cities showed increasing EEQ, while the center regions, particularly along the Yangtze River Economic Belt and areas south of the Yellow River, exhibited declines. In the Yangtze River Economic Belt’s southern sections, the EEQ growth rate slowed, with sporadic decreases appearing.

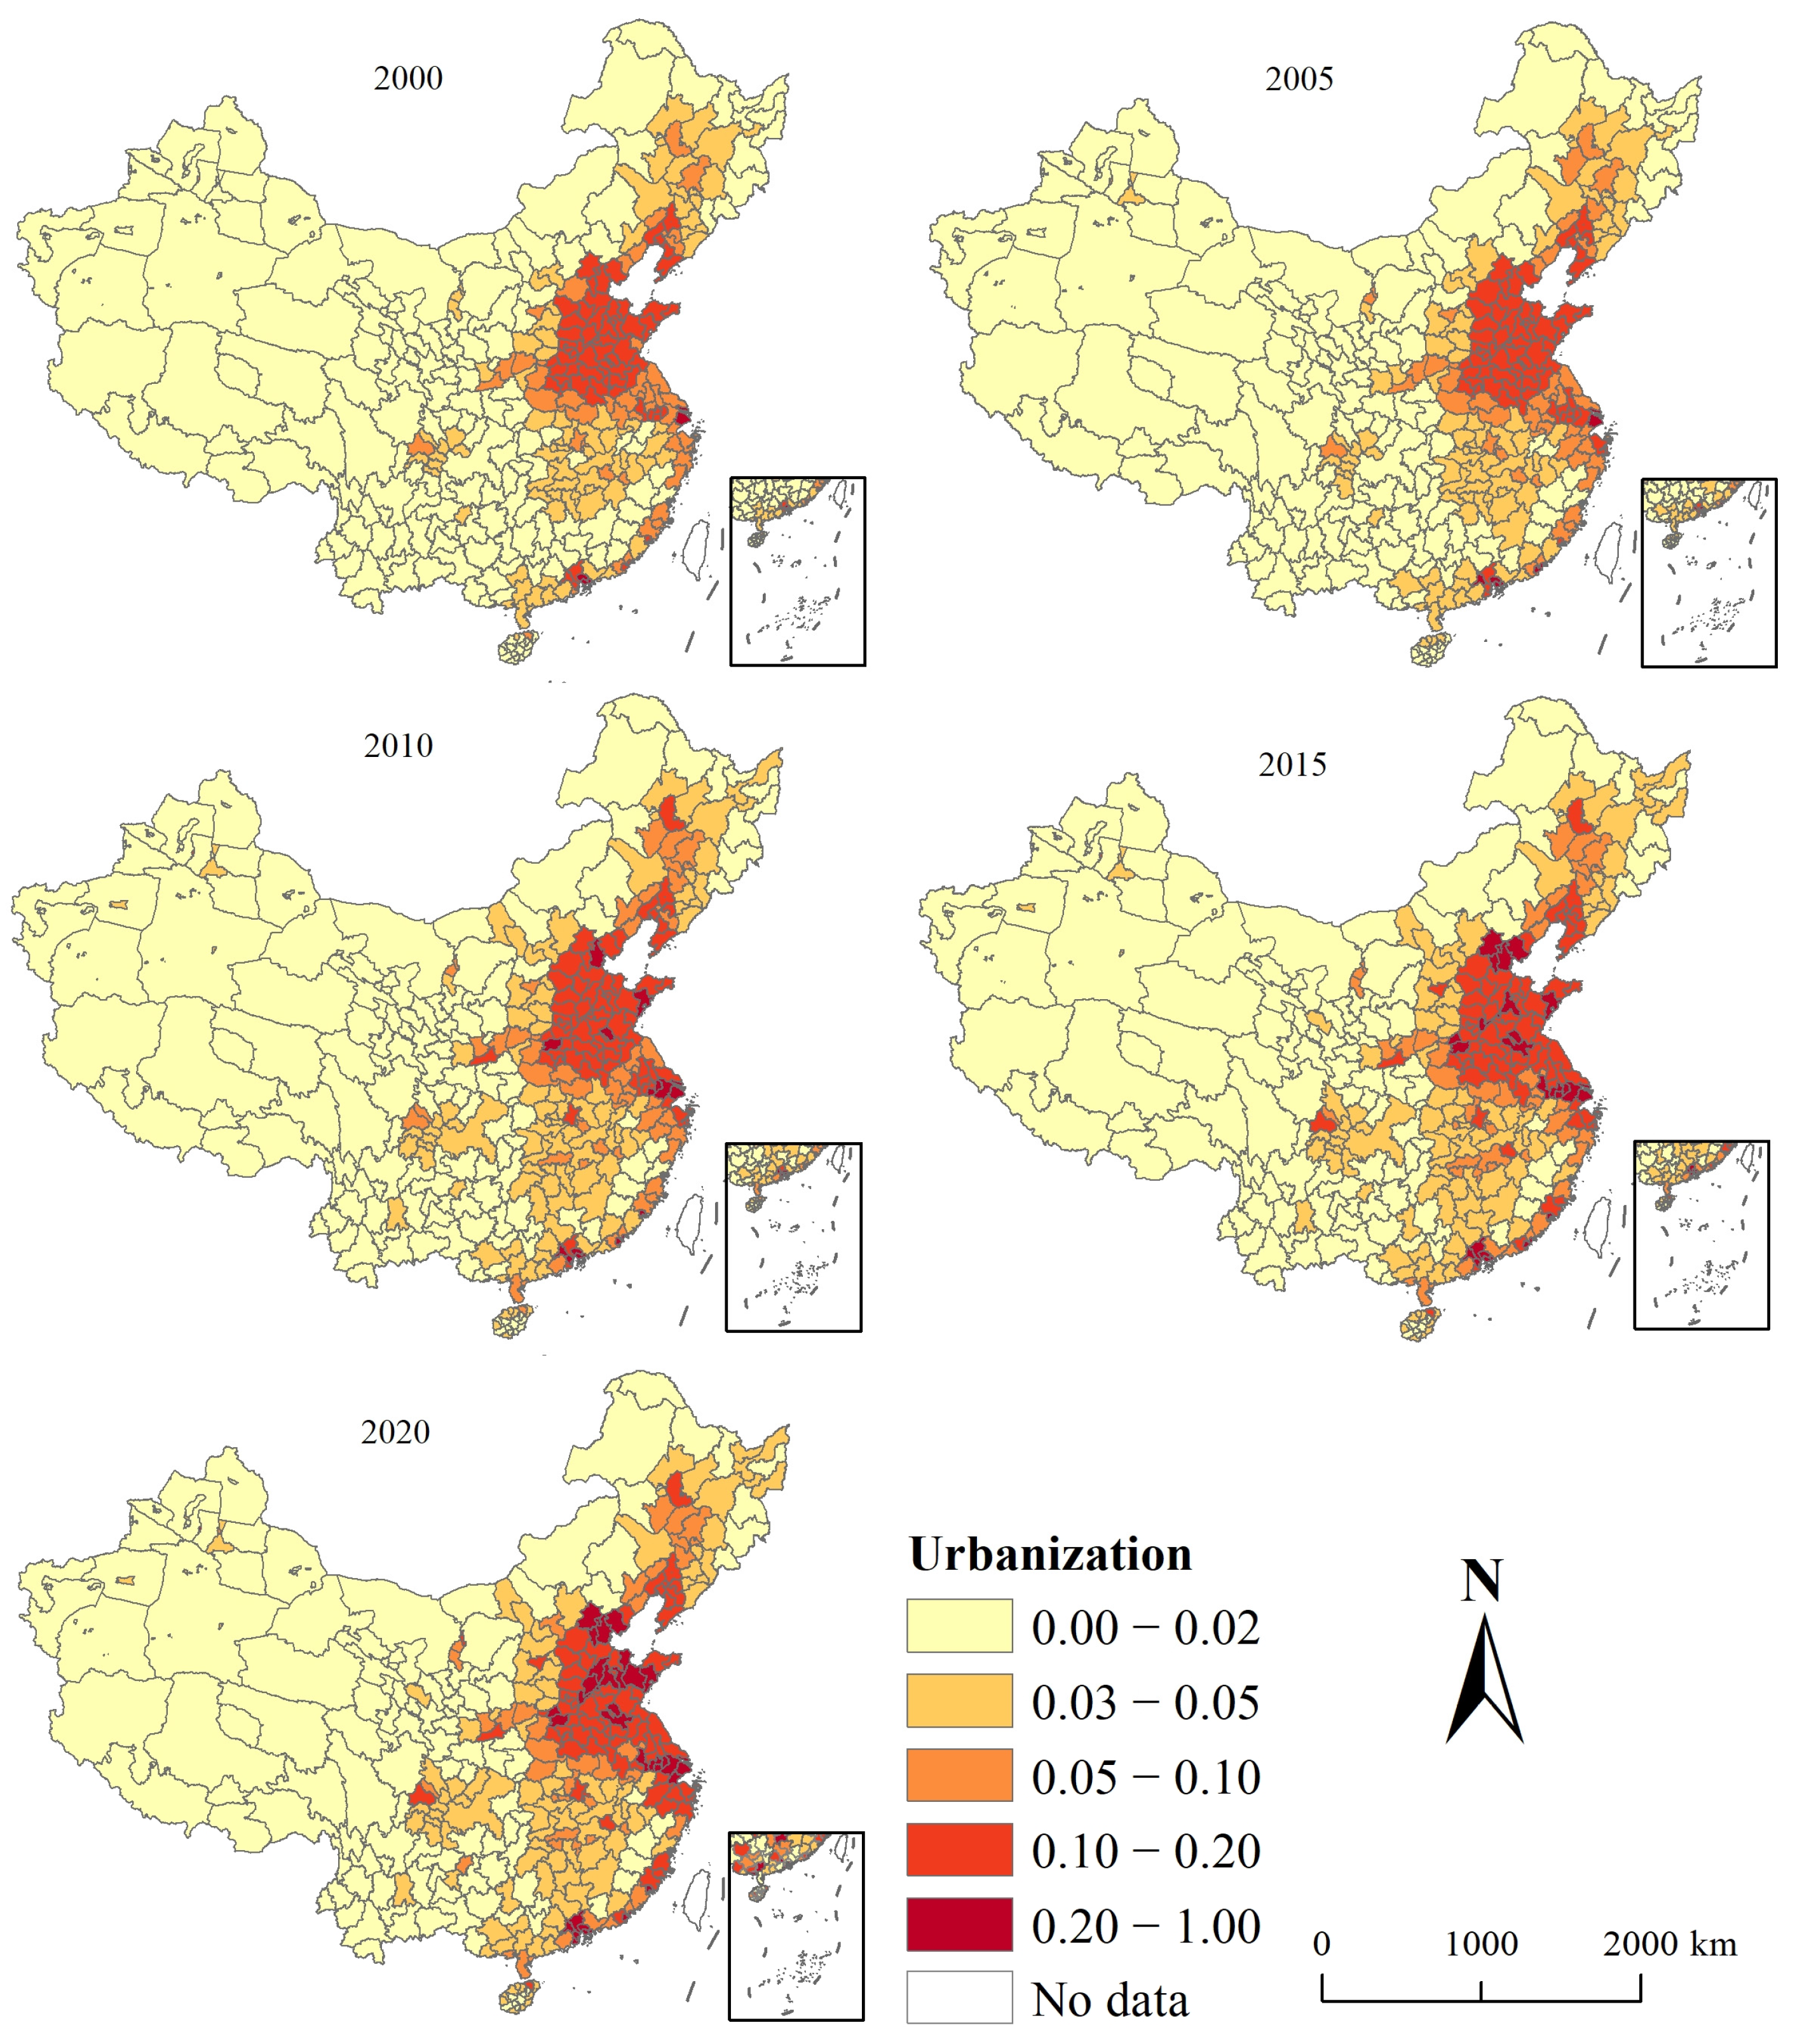
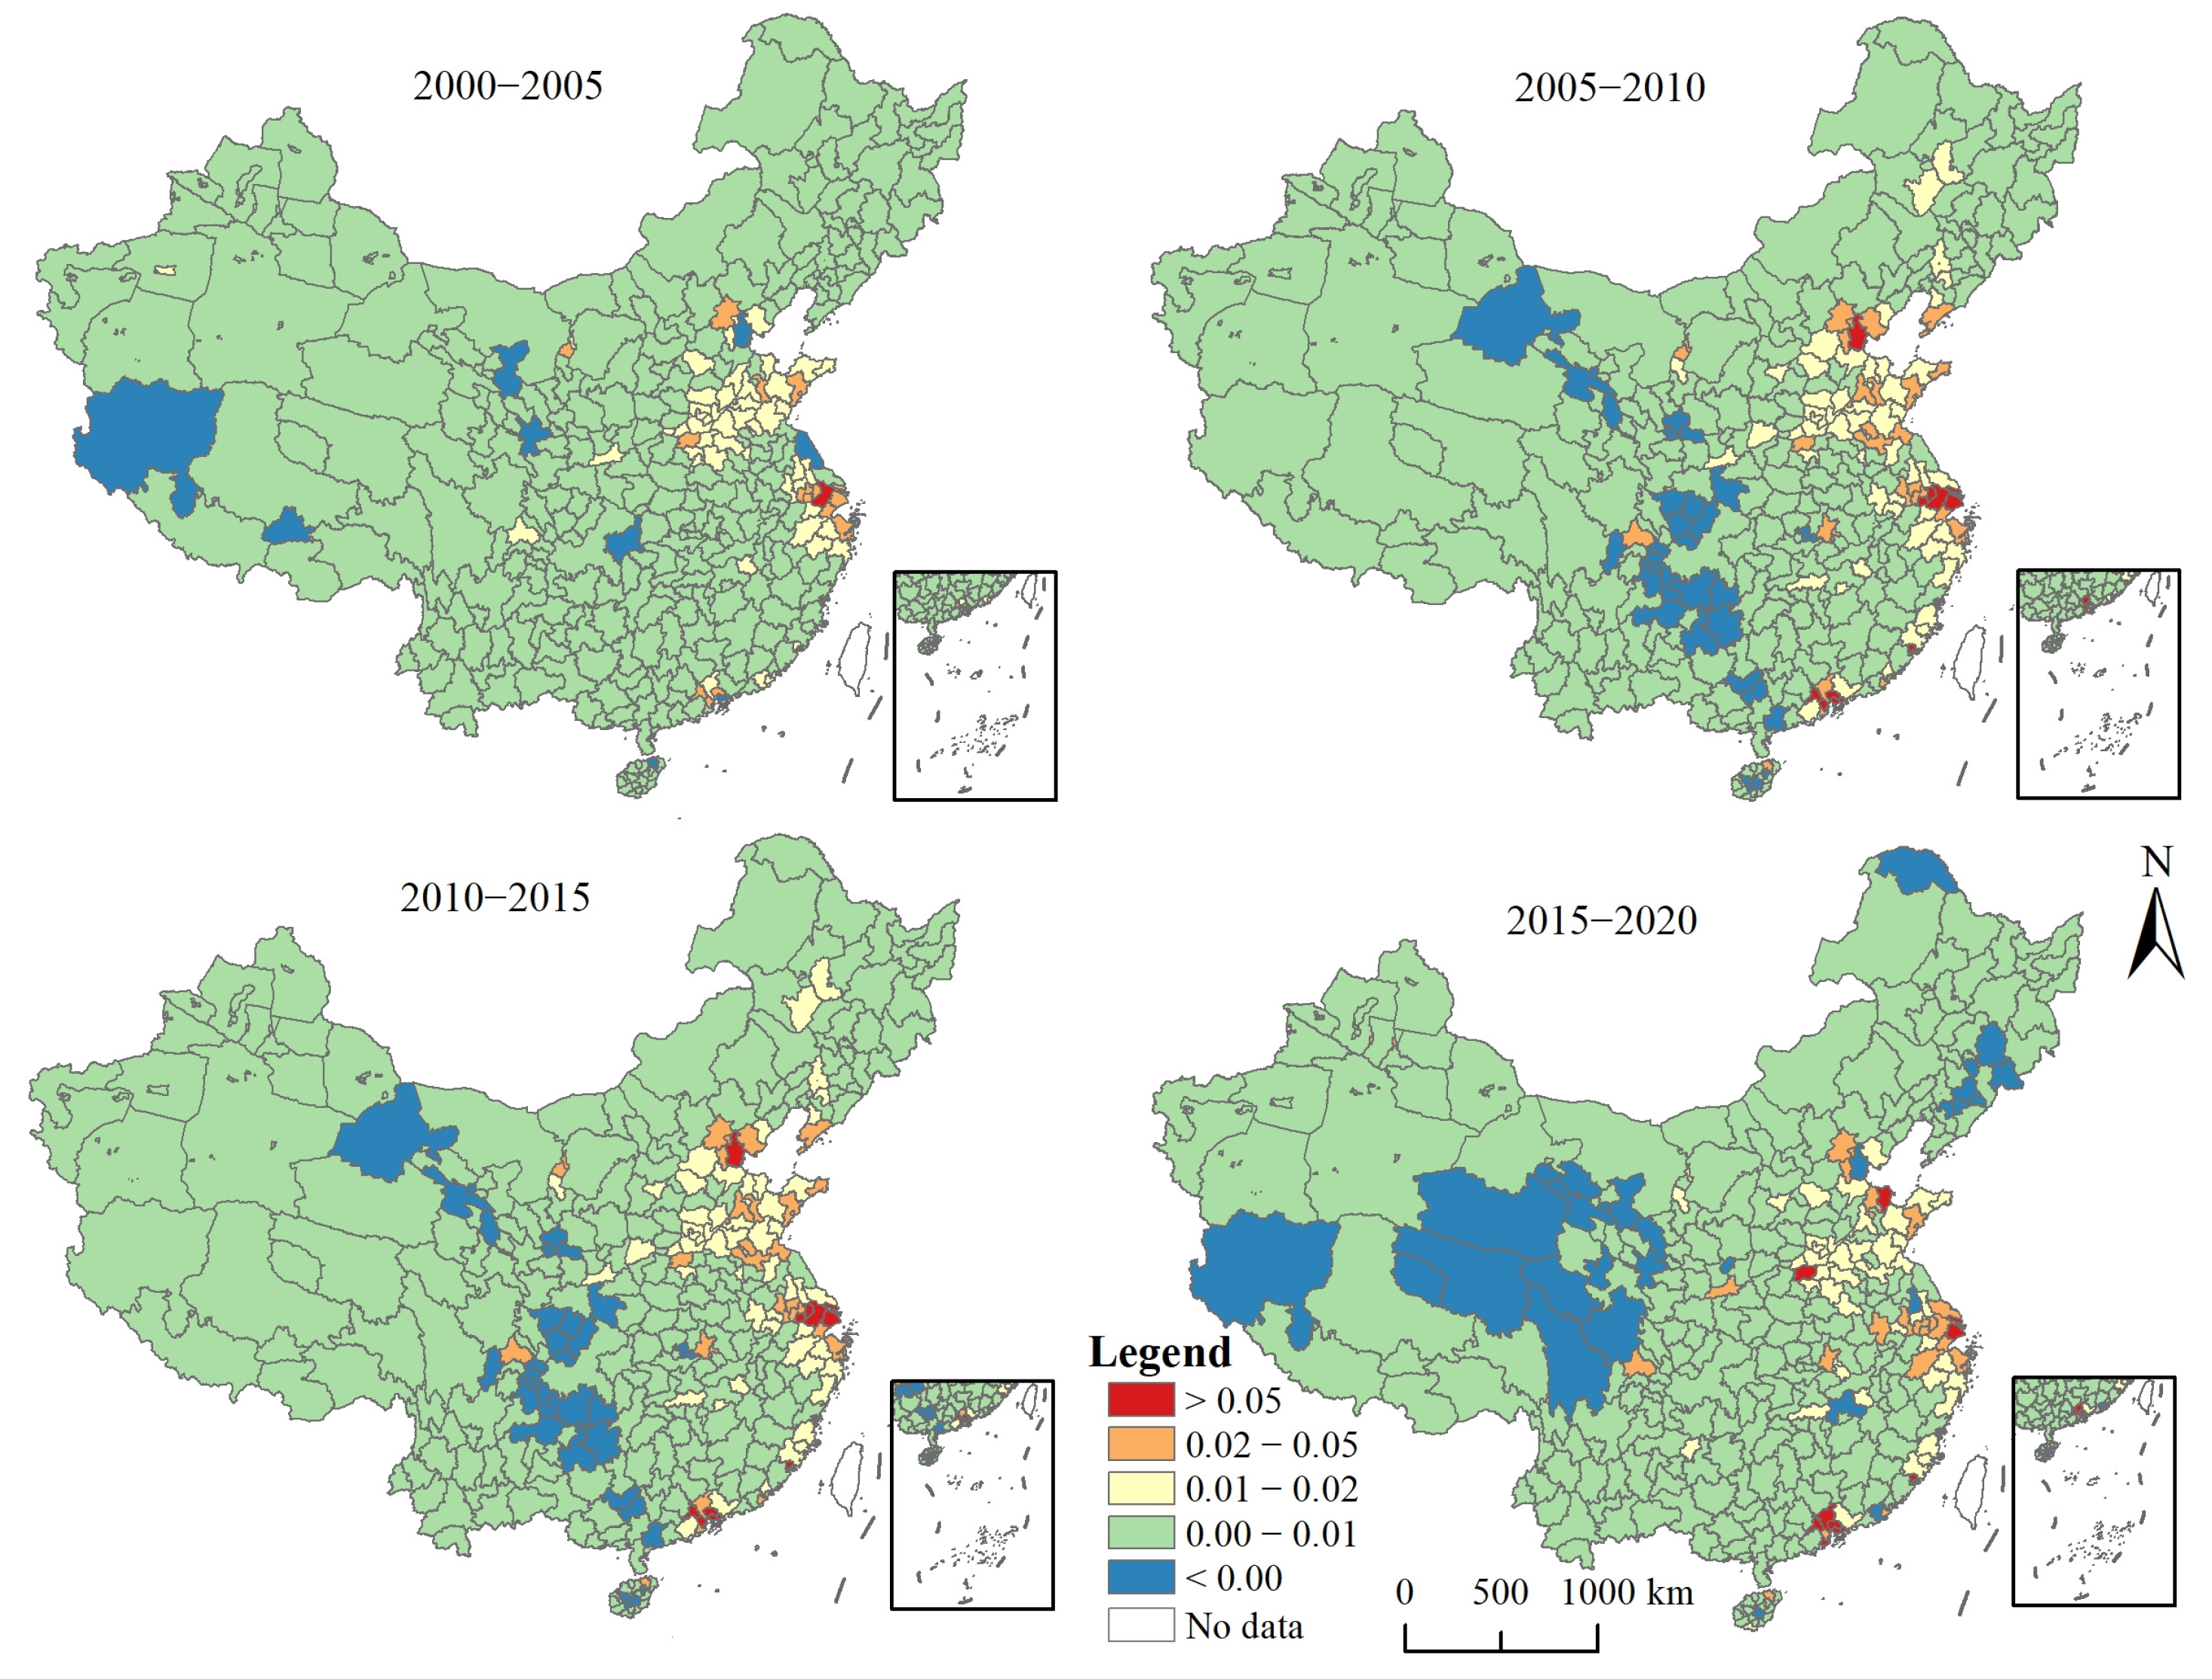
3.2. Spatio-Temporal Characteristics of Urbanization

From 2000 to 2020, China’s average urbanization index was 0.043, 0.048, 0.056, 0.066, and 0.074 in the respective years, showing a significant increasing trend. Urbanization exhibited significant spatial variations across the study period (Figure 3). High urbanization values were mainly concentrated in the North China Plain, as well as some prefecture-level cities in the Yangtze River Delta (YRD) and the Pearl River Delta (PRD) in 2000. The number of highly urbanized prefecture-level cities in these regions increased over time, with urbanization levels continuing to rise. Urbanization grew faster in some YRD and PRD cities, particularly between 2000 and 2005 (Figure 4). However, urbanization declined mainly in western Gansu, eastern Sichuan, and parts of the Yunnan–Guizhou border region during 2005–2010, and in western Sichuan, Qinghai, and parts of Gansu and Ningxia during 2015–2020.

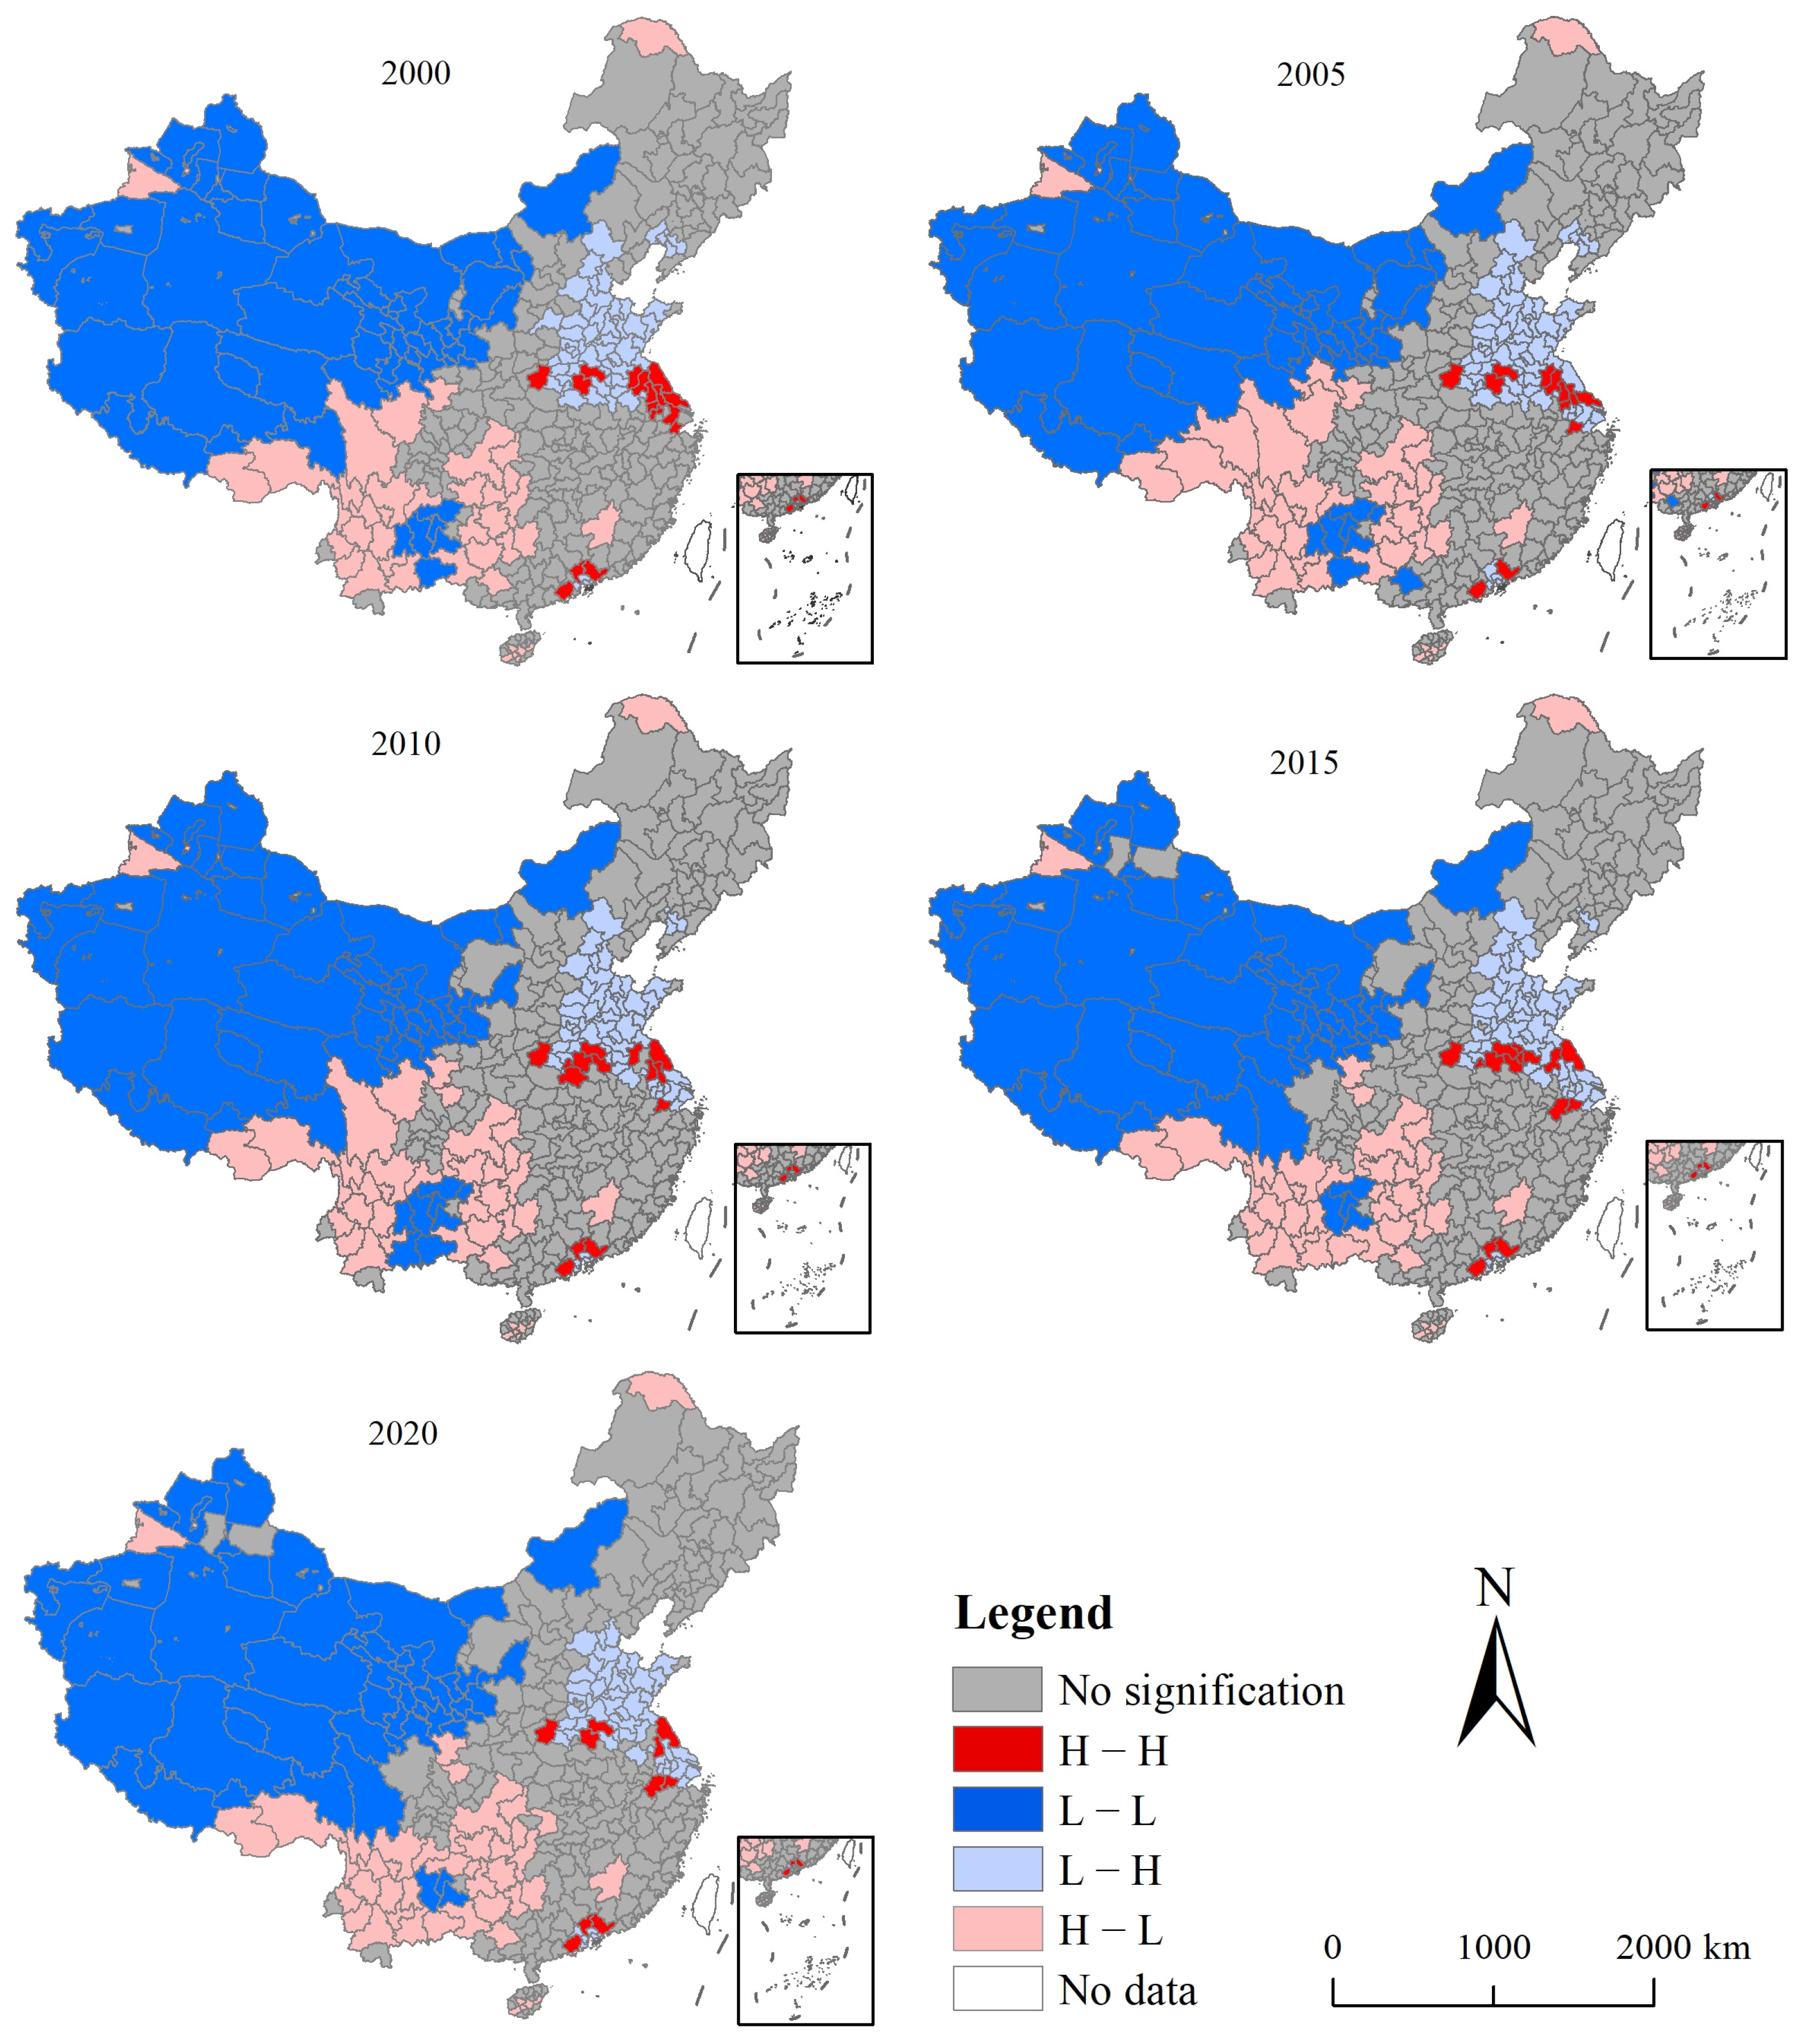
3.3. Spatial Autocorrelation of Urbanization and EEQ

The Moran’s I values of urbanization and EEQ during 2000, 2005, 2010, 2015, and 2020 were −0.049, −0.075, −0.076, −0.075, and −0.068, respectively (Figure 5), with p-values being significant at the 0.001 level and z-values of −1.953, −2.978, −3.035, −2.951, and −2.694, respectively. This showed a significant negative correlation between the spatial distribution of urbanization and EEQ across China’s prefecture-level cities from 2000 to 2020. Moreover, the correlation exhibited a pattern of initial strengthening followed by weakening over time.
Based on the bivariate local spatial autocorrelation (LISA) (Figure 5), the relationship between urbanization and EEQ was categorized as not significant, high–high cluster (H-H), low–low cluster (L-L), low–high cluster (L-H), and high–low cluster (H-L). Between 2000 and 2020, the spatial locations of these clusters remained relatively stable. The H-H clusters were mainly located in Henan, Jiangsu, and parts of the PRD, showing a decreasing trend overall. The L-L clusters were primarily concentrated in western China and along the Guizhou–Yunnan border. Notably, the distribution of L-L clusters along the Guizhou–Yunnan border decreased significantly between 2010 and 2020. The L-H clusters were mainly distributed across northern Henan, Hebei, Shandong, and Anhui (i.e., in the North China Plain) and within the YRD urban agglomeration, with a significant decreasing trend observed between 2005 and 2020. The H-L clusters were mainly located adjacent to L-L clusters near the Guizhou–Yunnan border region. The not significant areas were mainly distributed throughout northeast China, surrounding the North China Plain, and along the central and southern coastal provinces, with their coverage increasing from 2000 to 2020.

3.4. Coupled Coordination Degree of EEQ and Urbanization

During 2000–2020, the average CCD between urbanization and EEQ was 0.32, 0.33, 0.34, 0.36, and 0.37, respectively, showing a consistently increasing trend. When dividing the prefecture-level cities by the CCD level, the results showed that the proportion of severe imbalance and moderate imbalance areas decreased continuously, from 16.7% and 55.8% in 2000 to 10.8% and 51.8% in 2020, respectively (Table 1). Conversely, low-coordination and moderate-coordination areas increased continuously, from 31.5% and 1.0% in 2000 to 35.3% and 1.9% in 2020, respectively. High-coordination areas only appeared in 2020.
Regarding spatial distribution, severe imbalance areas were mainly distributed in western in China and gradually contracted westward over time (Figure 6). Moderate imbalance areas were primarily distributed in the northeast, central, and most southern provinces. Low-coordination areas were mainly distributed in the North China Plain and expanded gradually to coastal cities in both northern and southern regions. Moderate-coordination areas were mainly found in a few prefecture-level cities within the PRD and the YRD.

4. Discussion

4.1. Spatio-Temporal Characteristics of EEQ and Urbanization in China from 2000 to 2020

In terms of spatial distribution, the EEQ at the prefecture-level city in China showed a spatial pattern of higher values in the south and northeast and lower values in the west and north. This pattern was generally consistent with previous studies [28,33]. Based on the indices of EEQ calculation, ecosystem types and climate zones had important effects on EEQ. Previous studies have demonstrated that forest ecosystems exhibit higher EEQ values, while grasslands and deserts show lower values [28]. Since forest ecosystems are mainly distributed in the south and northeast in China, the spatial distribution of EEQ closely follows that of ecosystem types and climate patterns. Temporally, this study found that the average EEQ across Chinese cities exhibited a fluctuating yet increasing trend from 2000 to 2020. These findings were consistent with most domestic studies [23,25,31,60]. However, other studies have reported continuous increases in some areas [61,62] or continuous declines in others [34,63,64]. These changes in EEQ are generally attributed to the combined effects of natural and anthropogenic factors [28,65]. For example, studies in the less anthropogenically disturbed northwestern region have demonstrated that climate-change-induced changes in temperature, precipitation, and soil moisture are the key drivers of ecological degradation [63,66]. Conversely, studies in regions with more intensive human activity have revealed complex impacts of human activities on the ecological environment [32,67]. On the one hand, human activities increase resource consumption and waste production, thereby affecting ecosystems’ self-regulation [15]. On the other hand, human beings try to maintain ecosystem balance for their own sustainable development, e.g., by implementing environmental protection measures [68], which in turn promote EEQ.
This study of urbanization consisted of three main components: population urbanization, land urbanization, and economic urbanization. The results showed that China’s high-value areas of comprehensive urbanization were mainly concentrated in the North China Plain, the YRD, and coastal regions. This finding differs slightly from previous studies [4,69], primarily due to the differences in evaluation index systems. However, the overall spatial pattern of higher values in the east and lower values in the west remained consistent. The prefecture-level cities in the North China Plain are characterized by relatively flat terrain and well-developed agriculture. These factors, combined with dense population and extensive construction land, have contributed to their higher composite urbanization levels. Furthermore, the urbanization growth rate in the east was significantly higher than in the west—a finding that aligns with previous studies [70].

4.2. Spatio-Temporal Differences in the Impact of Urbanization on EEQ

There were coupled interactions between the two systems: urbanization and EEQ [71]. Urbanization is a comprehensive product of economic urbanization, spatial urbanization, and population urbanization [55,56], as measured by POD, GDD, and construction land rate [7,34]. Meanwhile, EEQ, as an important natural resource for sustainable societal development, has garnered increasing attention from scholars [24,59]. It is generally believed that urbanization will lead to the deterioration of the EEQ. Since the reform and opening up in 1978, China has become one of the countries with the fastest urbanization rates in the world. Continuous urbanization has encroached on ecological land, leading to land use transformation and land fragmentation, which in turn has had many negative impacts on the EEQ [72]. Some studies have shown that vegetation coverage serves as both an important indicator of urban sustainable development and a key factor in enhancing EEQ [73]. Luo et al. investigated the dynamic relationship between urbanization and vegetation, revealing the complex impacts of urbanization on vegetation [73]. The results revealed a general negative correlation between urbanization and NDVI in the urban agglomeration, suggesting decreasing vegetation cover with urbanization growth. Thus, rapid urbanization leads to changes in vegetation cover, which ultimately jeopardizes EEQ. Conversely, urbanization drives population and economic agglomeration, resulting in intensified resource demand and waste accumulation. These pressures may exceed the ecological environment’s self-repair capacity [15,74].
However, with advancing technology and civilization, the positive impacts of urbanization on EEQ should not be ignored. Our study revealed an increasing proportion of cities demonstrating moderate and high coupling levels between urbanization and EEQ, particularly in key urbanized regions, such as the YRD and PRD. This trend indicates a developing synergy between urbanization and EEQ. Recent studies suggest that with the rapid development of technology, the development and application of environmental protection technologies may lead to the improvement of the EEQ in urban agglomerations [55]. In addition, green development initiatives and ecological civilization programs have proven effective in raising public awareness of ecological protection and generating positive outcomes [75]. Notably, regions with greater urbanization tend to exhibit stronger commitment to sustainable development practices, resulting in higher CCD scores between urbanization and EEQ. For example, research on the YRD region demonstrated an increase in the average CCD score from 0.512 in 2009 to 0.540 in 2021 [14]. Similarly, studies in Shandong Province showed that the relationship between urbanization and EEQ is becoming more and more harmonious, and the CCD type between the two has gradually developed from a very uncoupled type to a highly coupled type [7]. Our findings corroborate this positive trend, showing consistent CCD growth in the region (Figure 6). While some studies have observed fluctuating EEQ declines in certain regions, the CCD between EEQ and urbanization has maintained an upward trajectory [34,64], indicating sustained improvement in their coordinated development.

4.3. Policy Implications

As the basic unit of urbanization, studying the coupled relationship between urbanization and EEQ at the prefecture-level city scale provides valuable guidance for China’s urban development strategies. Our analysis of spatio-temporal CCD values reveals that regional variations in urbanization pace and EEQ further complicate their interrelationship. To address these challenges, we propose three key recommendations: First, in the future process of urban construction, ecological construction should be incorporated into urban planning; green infrastructure construction should be strengthened; industrial structure transformation and upgrading should be promoted; and the ecological environment should be improved [2]. Second, it is necessary to increase capital investment, research and development or introduction of green production technology, and renovation of existing industrial facilities and equipment, so as to realize the coordinated development of regional economic development and EEQ [76]. Third, considering the complex relationship between the EEQ and vegetation, climate, land use, etc., the invasion of ecological land, such as forest land and farmland, should be circumvented in urban construction and development [16]; the construction and protection of urban wetlands and watersheds should be strengthened [77]; and the area of urban parks and green areas should be increased [78,79], which will in turn improve urban climate and promote ecosystem integrity.

4.4. Limitation and Future Directions

The relationship between urbanization and EEQ exhibits particular complexity. This study aimed to systematically analyze the interactions between urbanization and EEQ at China’s prefecture and city levels. However, we acknowledge several limitations. First, from the perspective of the research period, both urbanization and EEQ represent long-term dynamic processes that are susceptible to various complex factors. Therefore, future research should consider longer time series to better identify and predict this relationship. Second, methodologically, the coupled system of urbanization and EEQ is complex and diverse, making it difficult to form a unified system methodology [62]. Although the selection of indicators and methods in this study was based on the existing literature, the approach retains subjectivity and limited perspective, potentially affecting result interpretation [27]. For example, our measurement of comprehensive urbanization focused on population, economic, and land dimensions while overlooking natural factors (e.g., topography, climate) and sociocultural aspects. Third, for EEQ evaluation, while the enhanced indicator system improves assessment capacity, region-specific environmental factors require consideration. For instance, studies demonstrate that incorporating aerosol optical depth into China’s EEQ evaluation significantly enhances its representativeness [26]. Thus, future research should further investigate these factors.

5. Conclusions

This study explored the CCD relationship between urbanization and EEQ in China from 2000 to 2020 using multi-source data. During the study period, the average EEQ in China showed a fluctuating upward trend and significant regional differences, with the EEQ of some prefecture-level cities in southern and northeastern China being significantly higher than that of other regions. The urbanization levels displayed an east = high/west = low spatial pattern, with the North China Plain maintaining consistently higher values. Temporally, urbanization demonstrated consistent growth throughout the study period. The CCD model analysis revealed improving coordination between urbanization and EEQ across China. Notably, the proportion of prefecture-level cities achieving low-to-medium coupling levels rose significantly in the North China Plain and along the southeast coast. These findings provide the theoretical guidance for achieving coordinated development between urban construction and EEQ in China.

Funding

This research was funded by the Henan Province Science and Technology Research Projects (NO. 242102321157).

Institutional Review Board Statement

Not applicable.

Informed Consent Statement

Not applicable.

Data Availability Statement

The data supporting the findings of this study are available from the corresponding author upon reasonable request.

Acknowledgments

The author would like to thank the anonymous reviewers for their constructive comments on improving this paper.

Conflicts of Interest

The author declares no conflicts of interest.

References

  1. Bi, Y.; Zheng, L.; Wang, Y.; Li, J.; Yang, H.; Zhang, B. Coupling relationship between urbanization and water-related ecosystem services in China’s Yangtze River economic Belt and its socio-ecological driving forces: A county-level perspective. Ecol. Indic. 2023, 146, 109871. [Google Scholar] [CrossRef]
  2. Liao, S.; Wu, Y.; Wong, S.W.; Shen, L. Provincial perspective analysis on the coordination between urbanization growth and resource environment carrying capacity (RECC) in China. Sci. Total Environ. 2020, 730, 138964. [Google Scholar] [CrossRef]
  3. Zhou, T.; Liu, H.; Gou, P.; Xu, N. Conflict or Coordination? measuring the relationships between urbanization and vegetation cover in China. Ecol. Indic. 2023, 147, 109993. [Google Scholar] [CrossRef]
  4. Nie, C.; Li, Y.; Yang, L.; Wang, L.; Zhang, F. Spatio-temporal characteristics and coupling coordination relationship between urbanization and atmospheric particulate pollutants in the Bohai Rim in China. Ecol. Indic. 2023, 153, 110387. [Google Scholar]
  5. Khan, I.; Hou, F.J.; Zakari, A.; Tawiah, V.; Ali, S.A. Energy use and urbanization as determinants of China’s environmental quality: Prospects of the Paris climate agreement. J. Environ. Plan. Manag. 2022, 65, 2363–2386. [Google Scholar] [CrossRef]
  6. Luo, Q.L.; Zhou, J.F.; Zhang, Y.; Yu, B.L.; Zhu, Z.B. What is the spatiotemporal relationship between urbanization and ecosystem services? A case from 110 cities in the Yangtze River Economic Belt, China. J. Environ. Manag. 2022, 321, 13. [Google Scholar] [CrossRef]
  7. Khalid, L.; Hanif, I.; Rasul, F. How are urbanization, energy consumption and globalization influencing the environmental quality of the G-7? Green Financ. 2022, 4, 231–252. [Google Scholar] [CrossRef]
  8. Chen, W.; Zhou, T.; Liang, J. Urbanization, ecosystem services, and their interactive coercive relationship in Hunan Province, China. Environ. Sci. Pollut. Res. Int. 2023, 30, 3416–3431. [Google Scholar] [CrossRef]
  9. Grimm, N.B.; Faeth, S.H.; Golubiewski, N.E.; Redman, C.L.; Wu, J.G.; Bai, X.M.; Briggs, J.M. Global change and the ecology of cities. Science 2008, 319, 756–760. [Google Scholar] [CrossRef]
  10. Chen, W.; Wang, G.; Xu, N.; Ji, M.; Zeng, J. Promoting or inhibiting? New-type urbanization and urban carbon emissions efficiency in China. Cities 2023, 140, 104429. [Google Scholar] [CrossRef]
  11. Wang, C.; Jiang, Q.O.; Shao, Y.; Sun, S.; Xiao, L.; Guo, J. Ecological environment assessment based on land use simulation: A case study in the Heihe River Basin. Sci. Total Environ. 2019, 697, 133928. [Google Scholar] [CrossRef] [PubMed]
  12. Zhang, Q.; Kong, Q.; Zhang, M.; Huang, H. New-type urbanization and ecological well-being performance: A coupling coordination analysis in the middle reaches of the Yangtze River urban agglomerations, China. Ecol. Indic. 2024, 159, 111678. [Google Scholar] [CrossRef]
  13. Chen, M.; Liu, W.; Lu, D.; Chen, H.; Ye, C. Progress of China’s new-type urbanization construction since 2014: A preliminary assessment. Cities 2018, 78, 180–193. [Google Scholar] [CrossRef]
  14. Song, Y.; Gao, Y.; Zhang, S.; Dong, H.; Liu, X. Research on the coupling coordination and driving mechanisms of new-type urbanization and the ecological environment in China’s Yangtze River Delta. Sustainability 2024, 16, 5308. [Google Scholar] [CrossRef]
  15. Loredana, C.; Rehman, A.; Maria Mirabela, F.I.; Pinzon, S.; Cismaș, L.M. What implications do primary energy use, urban population agglomeration, and economic development rendered to Romania’s environmental sustainability? Energy Strategy Rev. 2024, 53, 101399. [Google Scholar] [CrossRef]
  16. Sharma, S.; Nahid, S.; Sharma, M.; Sannigrahi, S.; Anees, M.M.; Sharma, R.; Shekhar, R.; Basu, A.S.; Pilla, F.; Basu, B.; et al. A long-term and comprehensive assessment of urbanization-induced impacts on ecosystem services in the capital city of India. City Environ. Interact. 2020, 7, 100047. [Google Scholar] [CrossRef]
  17. Sarwar, N.; Bibi, F.U.N.; Junaid, A.; Alvi, S. Impact of urbanization and human development on ecological footprints in OECD and non-OECD countries. Heliyon 2024, 10, e38058. [Google Scholar] [CrossRef]
  18. Fatmawati, A.; Aurora, R.M.; Thong, T.D.; Furuya, K. Impact of urbanization on the vegetation dynamic in Tama River Basin. Int. Rev. Spat. Plan. Sustain. Dev. 2024, 12, 119–137. [Google Scholar] [CrossRef]
  19. Guo, B.B.; Fang, Y.L.; Jin, X.B.; Zhou, Y.K. Monitoring the effects of land consolidation on the ecological environmental quality based on remote sensing: A case study of Chaohu Lake Basin, China. Land Use Policy 2020, 95, 13. [Google Scholar] [CrossRef]
  20. Shan, W.; Jin, X.B.; Ren, J.; Wang, Y.C.; Xu, Z.G.; Fan, Y.T.; Gu, Z.M.; Hong, C.Q.; Lin, J.H.; Zhou, Y.K. Ecological environment quality assessment based on remote sensing data for land consolidation. J. Clean. Prod. 2019, 239, 13. [Google Scholar] [CrossRef]
  21. Xu, H. A remote sensing urban ecological index and its application. Acta Ecol. Sin. 2013, 33, 7853–7862. [Google Scholar]
  22. Xu, H. A remote sensing index for assessment of regional ecological changes. China Environ. Sci. 2013, 33, 889–897. [Google Scholar]
  23. Liu, J.; Xie, T.; Lyu, D.; Cui, L.; Liu, Q. Analyzing the spatiotemporal dynamics and driving forces of ecological environment quality in the Qinling Mountains, China. Sustainability 2024, 16, 3251. [Google Scholar] [CrossRef]
  24. Che, L.; Yin, S.; Jin, J.; Wu, W. Assessment and simulation of urban ecological environment quality based on geographic information system ecological index. Land 2024, 13, 687. [Google Scholar] [CrossRef]
  25. Shi, Z.; Wang, Y.; Zhao, Q. Analysis of Spatiotemporal Changes of ecological environment quality and its coupling coordination with urbanization in the Yangtze River Delta Urban Agglomeration, China. Int. J. Environ. Res. Public Health 2023, 20, 1627. [Google Scholar] [CrossRef]
  26. Tang, Q.; Hua, L.; Tang, J.; Jiang, L.; Wang, Q.; Cao, Y.; Wang, T.; Cai, C. Advancing ecological quality assessment in China: Introducing the ARSEI and identifying key regional drivers. Ecol. Indic. 2024, 163, 112109. [Google Scholar] [CrossRef]
  27. Xu, D.; Yang, F.; Yu, L.; Zhou, Y.; Li, H.; Ma, J.; Huang, J.; Wei, J.; Xu, Y.; Zhang, C.; et al. Quantization of the coupling mechanism between eco-environmental quality and urbanization from multisource remote sensing data. J. Clean. Prod. 2021, 321, 128948. [Google Scholar] [CrossRef]
  28. Li, J.; Peng, X.; Tang, R.; Geng, J.; Zhang, Z.; Xu, D.; Bai, T. Spatial and temporal variation characteristics of ecological environment quality in China from 2002 to 2019 and influencing factors. Land 2024, 13, 110. [Google Scholar] [CrossRef]
  29. Yang, H.; Yu, J.; Xu, W.; Wu, Y.; Lei, X.; Ye, J.; Geng, J.; Ding, Z. Long-time series ecological environment quality monitoring and cause analysis in the Dianchi Lake Basin, China. Ecol. Indic. 2023, 148, 110084. [Google Scholar] [CrossRef]
  30. Wang, F.; Han, Y.; Xu, Y.; Zhu, R.; Qu, C.; Zhang, P.; Martin, S.; Zhuang, L.; Liu, Z.; Zhang, J.; et al. Spatial-temporal variation and influencing factors of ecological environment quality in Jilin Province (China). Front. Environ. Sci. 2024, 12, 1446313. [Google Scholar] [CrossRef]
  31. Liu, Y.; Zhou, T.; Yu, W. Analysis of changes in ecological environment quality and influencing factors in Chongqing based on a Remote-Sensing Ecological Index mode. Land 2024, 13, 227. [Google Scholar] [CrossRef]
  32. National Earth System Science Data Center (NESDC). Available online: https://www.geodata.cn/main/face_science_detail?typeName=face_science&guid=190747515712302 (accessed on 15 December 2024).
  33. Sohail, A.; Abbasi, B.N.; Ahmed, Z. New insights into the nexus between international trade, urbanization, nonrenewable energy consumption, and environmental quality in China: Evidence from Multivariate Threshold Regression. Nat. Resour. Forum 2025, 49, 1148–1167. [Google Scholar] [CrossRef]
  34. Xu, D.; Cheng, J.; Xu, S.; Geng, J.; Yang, F.; Fang, H.; Xu, J.; Wang, S.; Wang, Y.; Huang, J.; et al. Understanding the relationship between China’s eco-environmental quality and urbanization using multisource remote sensing data. Remote Sens. 2022, 14, 198. [Google Scholar] [CrossRef]
  35. Lei, X.; Liu, H.; Li, S.; Luo, Q.; Cheng, S.; Hu, G.; Wang, X.; Bai, W. Coupling coordination analysis of urbanization and ecological environment in Chengdu-Chongqing urban agglomeration. Ecol. Indic. 2024, 161, 111969. [Google Scholar] [CrossRef]
  36. Dadashpoor, H.; Azizi, P.; Moghadasi, M. Land use change, urbanization, and change in landscape pattern in a metropolitan area. Sci. Total Environ. 2019, 655, 707–719. [Google Scholar] [CrossRef]
  37. Grossman, G.M.; Krueger, A.B. Economic growth and the environment. Q. J. Econ. 1995, 110, 353–377. [Google Scholar] [CrossRef]
  38. Qiao, B.; Fang, C.; Huang, J. The coupling law and its validation of the interaction between urbanization and eco-environment in arid area. Acta Ecol. Sin. 2006, 7, 2183–2190. [Google Scholar]
  39. O’Neill, D.W.; Fanning, A.L.; Lamb, W.F.; Steinberger, J.K. A good life for all within planetary boundaries. Nat. Sustain. 2018, 1, 88–95. [Google Scholar] [CrossRef]
  40. Beloin-Saint-Pierre, D.; Rugani, B.; Lasvaux, S.; Mailhac, A.; Popovici, E.; Sibiude, G.; Benetto, E.; Schiopu, N. A review of urban metabolism studies to identify key methodological choices for future harmonization and implementation. J. Clean. Prod. 2017, 163, S223–S240. [Google Scholar] [CrossRef]
  41. Yang, S.G.; Cao, D.; Lo, K.V. Analyzing and optimizing the impact of economic restructuring on Shanghai’s carbon emissions using STIRPAT and NSGA-II. Sustain. Cities Soc. 2018, 40, 44–53. [Google Scholar] [CrossRef]
  42. Fang, C.L.; Liu, H.M.; Li, G.D. International progress and evaluation on interactive coupling effects between urbanization and the eco-environment. J. Geogr. Sci. 2016, 26, 1081–1116. [Google Scholar] [CrossRef]
  43. Ye, C.; Pi, J.; Chen, H. Coupling coordination development of the logistics industry, new urbanization and the ecological environment in the Yangtze River Economic Belt. Sustainability 2022, 14, 5298. [Google Scholar] [CrossRef]
  44. Wang, X.; Zhang, S.; Zhao, X.; Shi, S.; Xu, L. Exploring the relationship between the eco-environmental quality and urbanization by utilizing sentinel and landsat data: A case study of the Yellow River Basin. Remote Sens. 2023, 15, 743. [Google Scholar] [CrossRef]
  45. Chen, H.; Liu, L.; Wang, L.F.; Zhang, X.R.; Du, Y.D.; Liu, J. Key indicators of high-quality urbanization affecting eco-environmental quality in emerging urban agglomerations: Accounting for the importance variation and spatiotemporal heterogeneity. J. Clean. Prod. 2022, 376, 14. [Google Scholar] [CrossRef]
  46. Wu, W.; Huang, Y.; Zhang, Y.; Zhou, B. Research on the synergistic effects of urbanization and ecological environment in the Chengdu–Chongqing urban agglomeration based on the Haken model. Sci. Rep. 2024, 14, 117. [Google Scholar] [CrossRef]
  47. Zhang, W.; Liu, Z.; Qin, K.; Dai, S.; Lu, H.; Lu, M.; Ji, J.; Yang, Z.; Chen, C.; Jia, P. Long-term dynamic monitoring and driving force analysis of eco-environmental quality in China. Remote Sens. 2024, 16, 1028. [Google Scholar] [CrossRef]
  48. Yang, W.P.; Huang, R.Y.; Li, D. China’s high-quality economic development: A study of regional variations and spatial evolution. Econ. Change Restruct. 2024, 57, 30. [Google Scholar] [CrossRef]
  49. Resources and Environmental Sciences Data Center (RESDC). Available online: https://www.resdc.cn/DOI/DOI.aspx?DOIID=54 (accessed on 15 December 2024).
  50. National Geomatics Center of China. Available online: https://www.ngcc.cn/dlxxzy/gjjcdlxxsjk/ (accessed on 15 December 2024).
  51. Zheng, L.; Wu, J.; Chen, Q.; Wang, J.; Chen, W.; Pan, S. Identifying the interactive coercive relationships between urbanization and eco-environmental quality in the Yangtze and Yellow River Basins, China. Remote Sens. 2024, 16, 4353. [Google Scholar] [CrossRef]
  52. Yang, L.; Chen, W.; Zeng, J.; Wang, G.; Yuan, T. Gradient differences of the impact of urbanization on habitat quality in the Yangtze River Basin. Acta Ecol. Sin. 2024, 44, 4038–4050. [Google Scholar]
  53. Zhong, M.; Liu, Q.; Hu, X. Understanding the county-level relationship between population change and ecological environment quality dynamic in China, 2000–2020. Front. Environ. Sci. 2025, 13, 1513998. [Google Scholar] [CrossRef]
  54. Peng, J.; Tian, L.; Liu, Y.; Zhao, M.; Hu, Y.; Wu, J. Ecosystem services response to urbanization in metropolitan areas: Thresholds identification. Sci. Total Environ. 2017, 607–608, 706–714. [Google Scholar] [CrossRef] [PubMed]
  55. Chen, W.; Wang, G.; Zeng, J. Impact of urbanization on ecosystem health in Chinese urban agglomerations. Environ. Impact Asses. 2023, 98, 106964. [Google Scholar] [CrossRef]
  56. Wang, K.; Wang, W.; Zha, N.; Feng, Y.; Qiu, C.; Zhang, Y.; Ma, J.; Zhang, R. Spatially heterogeneity response of critical ecosystem service capacity to address regional development risks to rapid urbanization: The case of Beijing-Tianjin-Hebei Urban Agglomeration in China. Sustainability 2022, 14, 7198. [Google Scholar] [CrossRef]
  57. Anselin, L. Local indicators of spatial association—LISA. Geogr. Anal. 1995, 27, 93–115. [Google Scholar] [CrossRef]
  58. Anselin, L. A test for spatial autocorrelation in seemingly unrelated regressions. Econ. Lett. 1988, 28, 335–341. [Google Scholar] [CrossRef]
  59. Zhang, S.; Zhong, Q.; Cheng, D.; Xu, C.; Chang, Y.; Lin, Y.; Li, B. Coupling coordination analysis and prediction of landscape ecological risks and ecosystem services in the Min River Basin. Land 2022, 11, 222. [Google Scholar] [CrossRef]
  60. Zhang, X.M.; Fan, H.B.; Liu, F.; Lv, T.G.; Sun, L.; Li, Z.L.; Shang, W.L.; Xu, G.L. Coupling coordination between the ecological environment and urbanization in the middle reaches of the Yangtze River urban agglomeration. Urban Clim. 2023, 52, 17. [Google Scholar] [CrossRef]
  61. Li, G.; Zhang, N.; Cao, Y.; Xia, Z.; Bao, C.; Fan, L.; Xue, S. Analysis of the temporal and spatial changes of ecological environment quality using the optimization remote sensing ecological index in the middle Yellow River Basin, China. Earth Sci. Inform. 2024, 17, 5107–5122. [Google Scholar] [CrossRef]
  62. Long, T.; Bai, Z.; Zheng, B. Spatiotemporal dynamics and driving forces of ecological environment quality in coastal cities: A remote sensing and land use perspective in Changle District, Fuzhou. Land 2024, 13, 1393. [Google Scholar] [CrossRef]
  63. Airiken, M.; Li, S. The Dynamic monitoring and driving forces analysis of ecological environment quality in the Tibetan Plateau based on the Google Earth Engine. Remote Sens. 2024, 16, 682. [Google Scholar] [CrossRef]
  64. Liu, L.; Guo, Y.; Li, Y.; Zhang, L. Examining the complex relationship between Urbanization and ecological environment in ecologically fragile areas: A case study in Southwest China. Front. Public Health 2024, 12, 1358051. [Google Scholar] [CrossRef] [PubMed]
  65. Bai, T.T.; Cheng, J.; Zheng, Z.H.; Zhang, Q.F.; Li, Z.H.; Xu, D. Drivers of eco-environmental quality in China from 2000 to 2017. J. Clean. Prod. 2023, 396, 15. [Google Scholar] [CrossRef]
  66. Li, P.; Hu, Z.; Liu, Y. Shift in the trend of browning in Southwestern Tibetan Plateau in the past two decades. Agric. For. Meteorol. 2020, 287, 107950. [Google Scholar] [CrossRef]
  67. Li, C.; Chen, T.; Jia, K.; Plaza, A. Coupling analysis between ecological environment change and urbanization process in the Middle Reaches of Yangtze River Urban Agglomeration, China. IEEE J. Sel. Top. Appl. Earth Obs. Remote Sens. 2024, 17, 880–892. [Google Scholar] [CrossRef]
  68. Miao, W.A.; Chao, F.B. The win-win ability of environmental protection and economic development during China’s transition. Technol. Forecast. Soc. Change 2021, 166, 120617. [Google Scholar]
  69. Bai, Y.; Deng, X.; Jiang, S.; Zhang, Q.; Wang, Z. Exploring the relationship between urbanization and urban eco-efficiency: Evidence from prefecture-level cities in China. J. Clean. Prod. 2018, 195, 1487–1496. [Google Scholar] [CrossRef]
  70. He, Z.; Yang, Z.; Ding, Z.; Wang, S.; Li, H. Spatial differentiation and influencing factors of the coupling coordination degree of urbanization and eco-environment in China at city-level from 2010 to 2020. Acta Ecol. Sin. 2024, 44, 5040–5058. [Google Scholar]
  71. Ozturk, I.; Savranlar, B.; Aslan, A.; Al-mulali, U.; Artan, S. The dynamic simulation analysis of the impact of urbanization and globalization on environmental quality. Sustainability 2023, 15, 11764. [Google Scholar] [CrossRef]
  72. Shrestha, M.K.; York, A.M.; Boone, C.G.; Zhang, S. Land fragmentation due to rapid urbanization in the Phoenix Metropolitan Area: Analyzing the spatiotemporal patterns and drivers. Appl. Geogr. 2012, 32, 522–531. [Google Scholar] [CrossRef]
  73. Luo, Y.; Sun, W.Z.; Yang, K.; Zhao, L. China urbanization process induced vegetation degradation and improvement in recent 20 years. Cities 2021, 114, 5. [Google Scholar] [CrossRef]
  74. Chen, W.; Gu, T.; Zeng, J. Urbanisation and ecosystem health in the Middle Reaches of the Yangtze River urban agglomerations, China: A U-curve relationship. J. Environ. Manag. 2022, 318, 115565. [Google Scholar] [CrossRef] [PubMed]
  75. Wang, R.; Qi, R.; Cheng, J.H.; Zhu, Y.G.; Lu, P.X. The behavior and cognition of ecological civilization among Chinese university students. J. Clean. Prod. 2020, 243, 118464. [Google Scholar] [CrossRef]
  76. Zulfiqar, M.; Fatima, A.; Ullah, M.R.; Huo, W.D.; Pervaiz, A.; Ghafoor, S. The triple threat: How green technology innovation, green energy production, and financial development impact environmental quality? Nat. Resour. Forum 2023, 17, 12384. [Google Scholar] [CrossRef]
  77. Pan, Z.; He, J.; Liu, D.; Wang, J.; Guo, X. Ecosystem health assessment based on ecological integrity and ecosystem services demand in the middle reaches of the Yangtze River Economic Belt, China. Sci. Total Environ. 2021, 774, 144837. [Google Scholar] [CrossRef]
  78. Guan, Y.; Li, X.; Li, S.; Sun, H.; Liu, H. Effect of urban fringes green space fragmentation on ecosystem service value. PLoS ONE 2022, 17, e0263452. [Google Scholar] [CrossRef]
  79. Santhanam, H.; Majumdar, R. Quantification of green-blue ratios, impervious surface area and pace of urbanisation for sustainable management of urban lake—land zones in India -a case study from Bengaluru city. J. Urban Manag. 2022, 11, 310–320. [Google Scholar] [CrossRef]
Figure 1. Spatial distribution of EEQ in China from 2000 to 2020.
Sustainability 17 06019 g001
Figure 2. Spatial change trends of EEQ in China during 2000–2005, 2005–2010, 2010–2015, and 2015–2020.
Sustainability 17 06019 g002
Figure 3. Spatial distribution of urbanization in China from 2000 to 2020.
Sustainability 17 06019 g003
Figure 4. Spatial change trends of urbanization in China during 2000–2005, 2005–2010, 2010–2015, and 2015–2020.
Sustainability 17 06019 g004
Figure 5. Spatial autocorrelation of urbanization and EEQ in China from 2000 to 2020.
Sustainability 17 06019 g005
Figure 6. CCD of urbanization and EEQ in China from 2000 to 2020.
Sustainability 17 06019 g006
Table 1. Proportion of prefecture-level cities under different CCD categories.
Categories20002005201020152020
Severe imbalance16.7%15.1%12.9%11.3%10.8%
Moderate imbalance55.8%55.3%55.3%52.3%51.8%
Low coordination27.2%29.6%31.0%34.5%35.3%
Moderate coordination0.3%0.0%0.8%1.9%1.9%
High coordination0.0%0.0%0.0%0.0%0.3%
Disclaimer/Publisher’s Note: The statements, opinions and data contained in all publications are solely those of the individual author(s) and contributor(s) and not of MDPI and/or the editor(s). MDPI and/or the editor(s) disclaim responsibility for any injury to people or property resulting from any ideas, methods, instructions or products referred to in the content.

