Article

A Comparison of the Cost-Effectiveness of Alternative Fuels for Shipping in Two GHG Pricing Mechanisms: Case Study of a 24,000 DWT Bulk Carrier

1
College of Ocean Science and Engineering, Shanghai Maritime University, Shanghai 201306, China
2
Merchant Marine College, Shanghai Maritime University, Shanghai 201306, China
*
Author to whom correspondence should be addressed.
Sustainability 2025, 17(13), 6001; https://doi.org/10.3390/su17136001
Submission received: 14 May 2025 / Revised: 24 June 2025 / Accepted: 28 June 2025 / Published: 30 June 2025

Abstract

The 83rd session of the IMO Maritime Environment Protection Committee (MEPC 83) approved a global pricing mechanism for the shipping industry, with formal adoption scheduled for October 2025. Proposed mechanisms include the International Maritime Sustainable Fuels and Fund (IMSF&F) and a combined approach integrating GHG Fuel Standards with Universal GHG Contributions (GFS&UGC). This study developed a model based on the marginal abatement cost curve (MACC) methodology to assess the cost-effectiveness of alternative fuels under both mechanisms. Sensitivity analyses evaluated the impacts of fuel prices, carbon prices, and the GHG Fuel Intensity (GFI) indicator on MAC. Results indicate that implementing the GFS&UGC mechanism yields higher net present values (NPVs) and lower MACs compared to IMSF&F. Introducing universal GHG contributions promotes a comparatively fairer transition to sustainable shipping fuels. Investments in zero- or near-zero-fueled (ZNZ) ships are unlikely to be recouped by 2050 unless carbon prices rise sufficiently to boost revenues. Bio-Methanol and bio-diesel emerged as the most cost-competitive ZNZ options in the long term, while e-Methanol’s poor competitiveness stems from its extremely high price. Both pooling costs and universal GHG levies significantly reduce LNG’s economic viability over the study period. MACs demonstrated greater sensitivity to fuel prices (Pfuel) than to carbon prices (Pcarbon) or GFI within this study’s parameterization scope, particularly under GFS&UGC. Ratios of Pcarbon%/Pfuel% in equivalent sensitivity scenarios were quantified to determine relative price importance. This work provides insights into fuel selection for shipping companies and supports policymakers in designing effective GHG pricing mechanisms.

1. Introduction

As the global climate crisis intensifies, the formulation of carbon emission reduction policies has become the focus of the shipping industry. The Maritime Silk Road Initiative has contributed to the development of most participating countries and reduced their carbon intensity [1]. The International Maritime Organization (IMO) has implemented short-term measures to enhance the energy efficiency of ships and reduce the average carbon intensity of shipping by approximately one-third in 2023 [2], compared with the reference level in 2008. Nevertheless, promoting energy efficiency alone cannot achieve net-zero GHG emissions. To achieve the goal of reaching net-zero GHG emissions by or around 2050, the IMO adopted the 2023 IMO Strategy on Reduction of GHG Emissions from Ships [3] to promote fuel transition [4,5,6].
The primary alternative fuels for shipping include LNG [7,8,9], methanol [10,11,12], ammonia [13,14,15], bio-diesel [16,17,18], and e-fuels (fuels based on H2) [19,20,21]. However, regardless of which alternative fuel is adopted, shipowners’ costs will increase due to the high price of these fuels [22,23]. Among these options, LNG offers a relative economic advantage for achieving short-term decarbonization, while renewable ammonia and methanol are projected to be more cost-effective in the long term [24,25]. Bio-diesel can be used in existing engines without modification or retrofit costs, but its high fuel cost remains a significant barrier [17]. No single fuel has demonstrated overwhelming economic advantages to dominate the future market alone [26]. Although strategies such as chartering and retrofitting (depending on the ship size), combined with slow steaming and wind assistance, can partially reduce the cost of fuel transition [26,27], they are insufficient to alleviate the shipping industry’s anxiety over rising fuel transition costs. This challenge is further intensified by the heavy reliance of alternative fuels’ economic feasibility on the availability of bunkering infrastructure at ports [28,29,30]. To this end, IMO is establishing a GHG pricing mechanism.
At the 83rd session of the IMO Marine Environment Protection Committee (MEPC 83), a global pricing mechanism for the shipping industry was approved. This mechanism, scheduled for formal adoption in October 2025 and entry into force in 2027 [31], is based on a proposal known as the International Maritime Sustainable Fuels and Fund mechanism (IMSF&F) [32]. Another notable proposal, combining a GHG fuel standard with a universal GHG contribution mechanism (GFS&UGC) [33], had previously received strong support from many countries. Both mechanisms enforce the ‘polluter-pays’ principle and reward ships using zero or near-zero GHG emission fuels (ZNZs) [34].
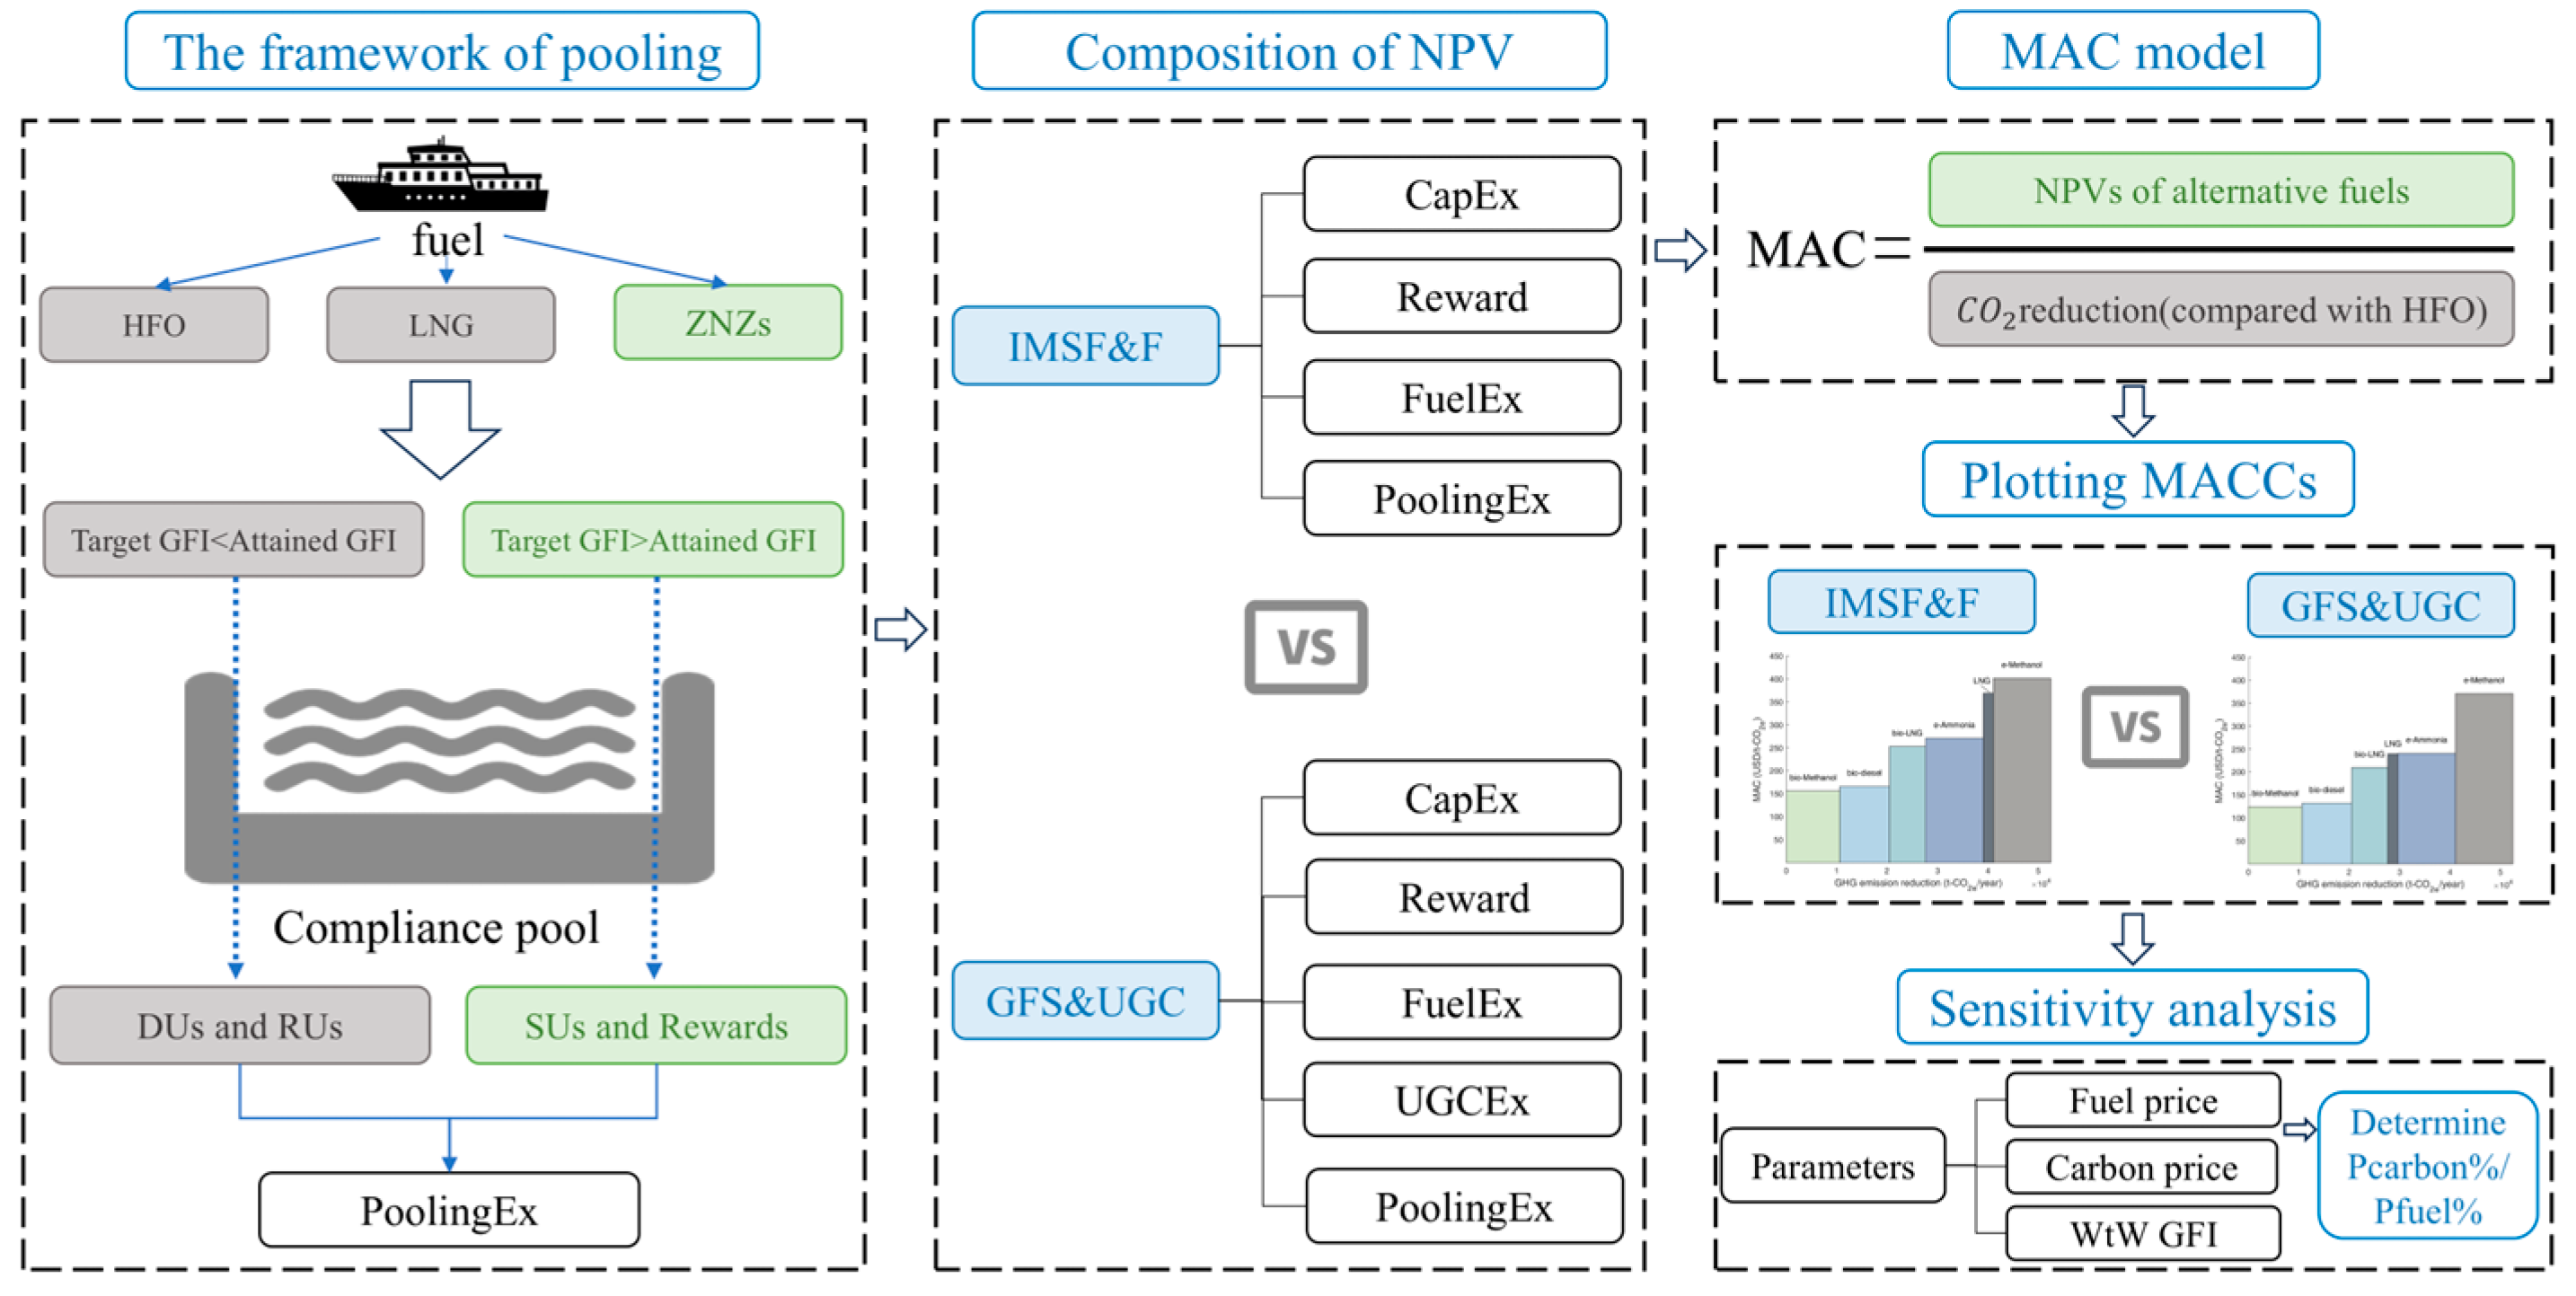
The IMSF&F mechanism’s core is a Flexible Compliance Mechanism (FCM) [32]. Under the FCM, ships meeting their annual GFI target are considered compliant. Those below target earn surplus units (SUs), which are transferable within the compliance pool, bankable, or cancellable. Conversely, ships exceeding their targets incur deficit units (DUs), which must be balanced by acquiring SUs from the pool, using banked SUs, or purchasing remedial units (RUs). Vessels using ZNZs may receive rewards. The GFS&UGC mechanism similarly operates under an FCM framework but uses different parameters, such as the pooling price [4]. Additionally, GFS&UGC imposes a universal GHG contribution (UGC) cost, requiring shipowners to pay a levy based on total vessel GHG emissions [33]. Previous assessments of the economic performance of these two mechanisms have primarily focused on a total cost perspective of fleets, demonstrating that both mechanisms can promote shipping decarbonization and fuel transition, while reducing emissions and lowering maritime logistics costs [4,35,36].
Marginal abatement cost (MAC), represented by the cost per unit of GHG emissions reduced, provides a clearer measure of cost-effectiveness and sustainability in fuel transitions compared to the total cost and is widely used to evaluate the economic efficiency of GHG reduction strategies [34,37,38,39,40]. Uncertainties in such assessments stem primarily from the challenges in forecasting economic mechanisms, carbon prices, fuel GFI, and fuel prices. For instance, fuel prices are influenced not only by production costs and technological innovation but also by national energy policies [23,41]. In addition, inconsistencies in life cycle assessment boundaries affect the accuracy of fuel GFI estimates [34,37]. Consequently, obtaining comparable prediction results from previous studies has been difficult. However, since IMO regulations have now clarified life cycle boundaries, economic mechanisms, and carbon pricing, and an IMO report provides an accepted set of values for fuel GFI and prices [4], it is feasible to conduct comparable assessments using standardized parameters, thereby reducing uncertainty.
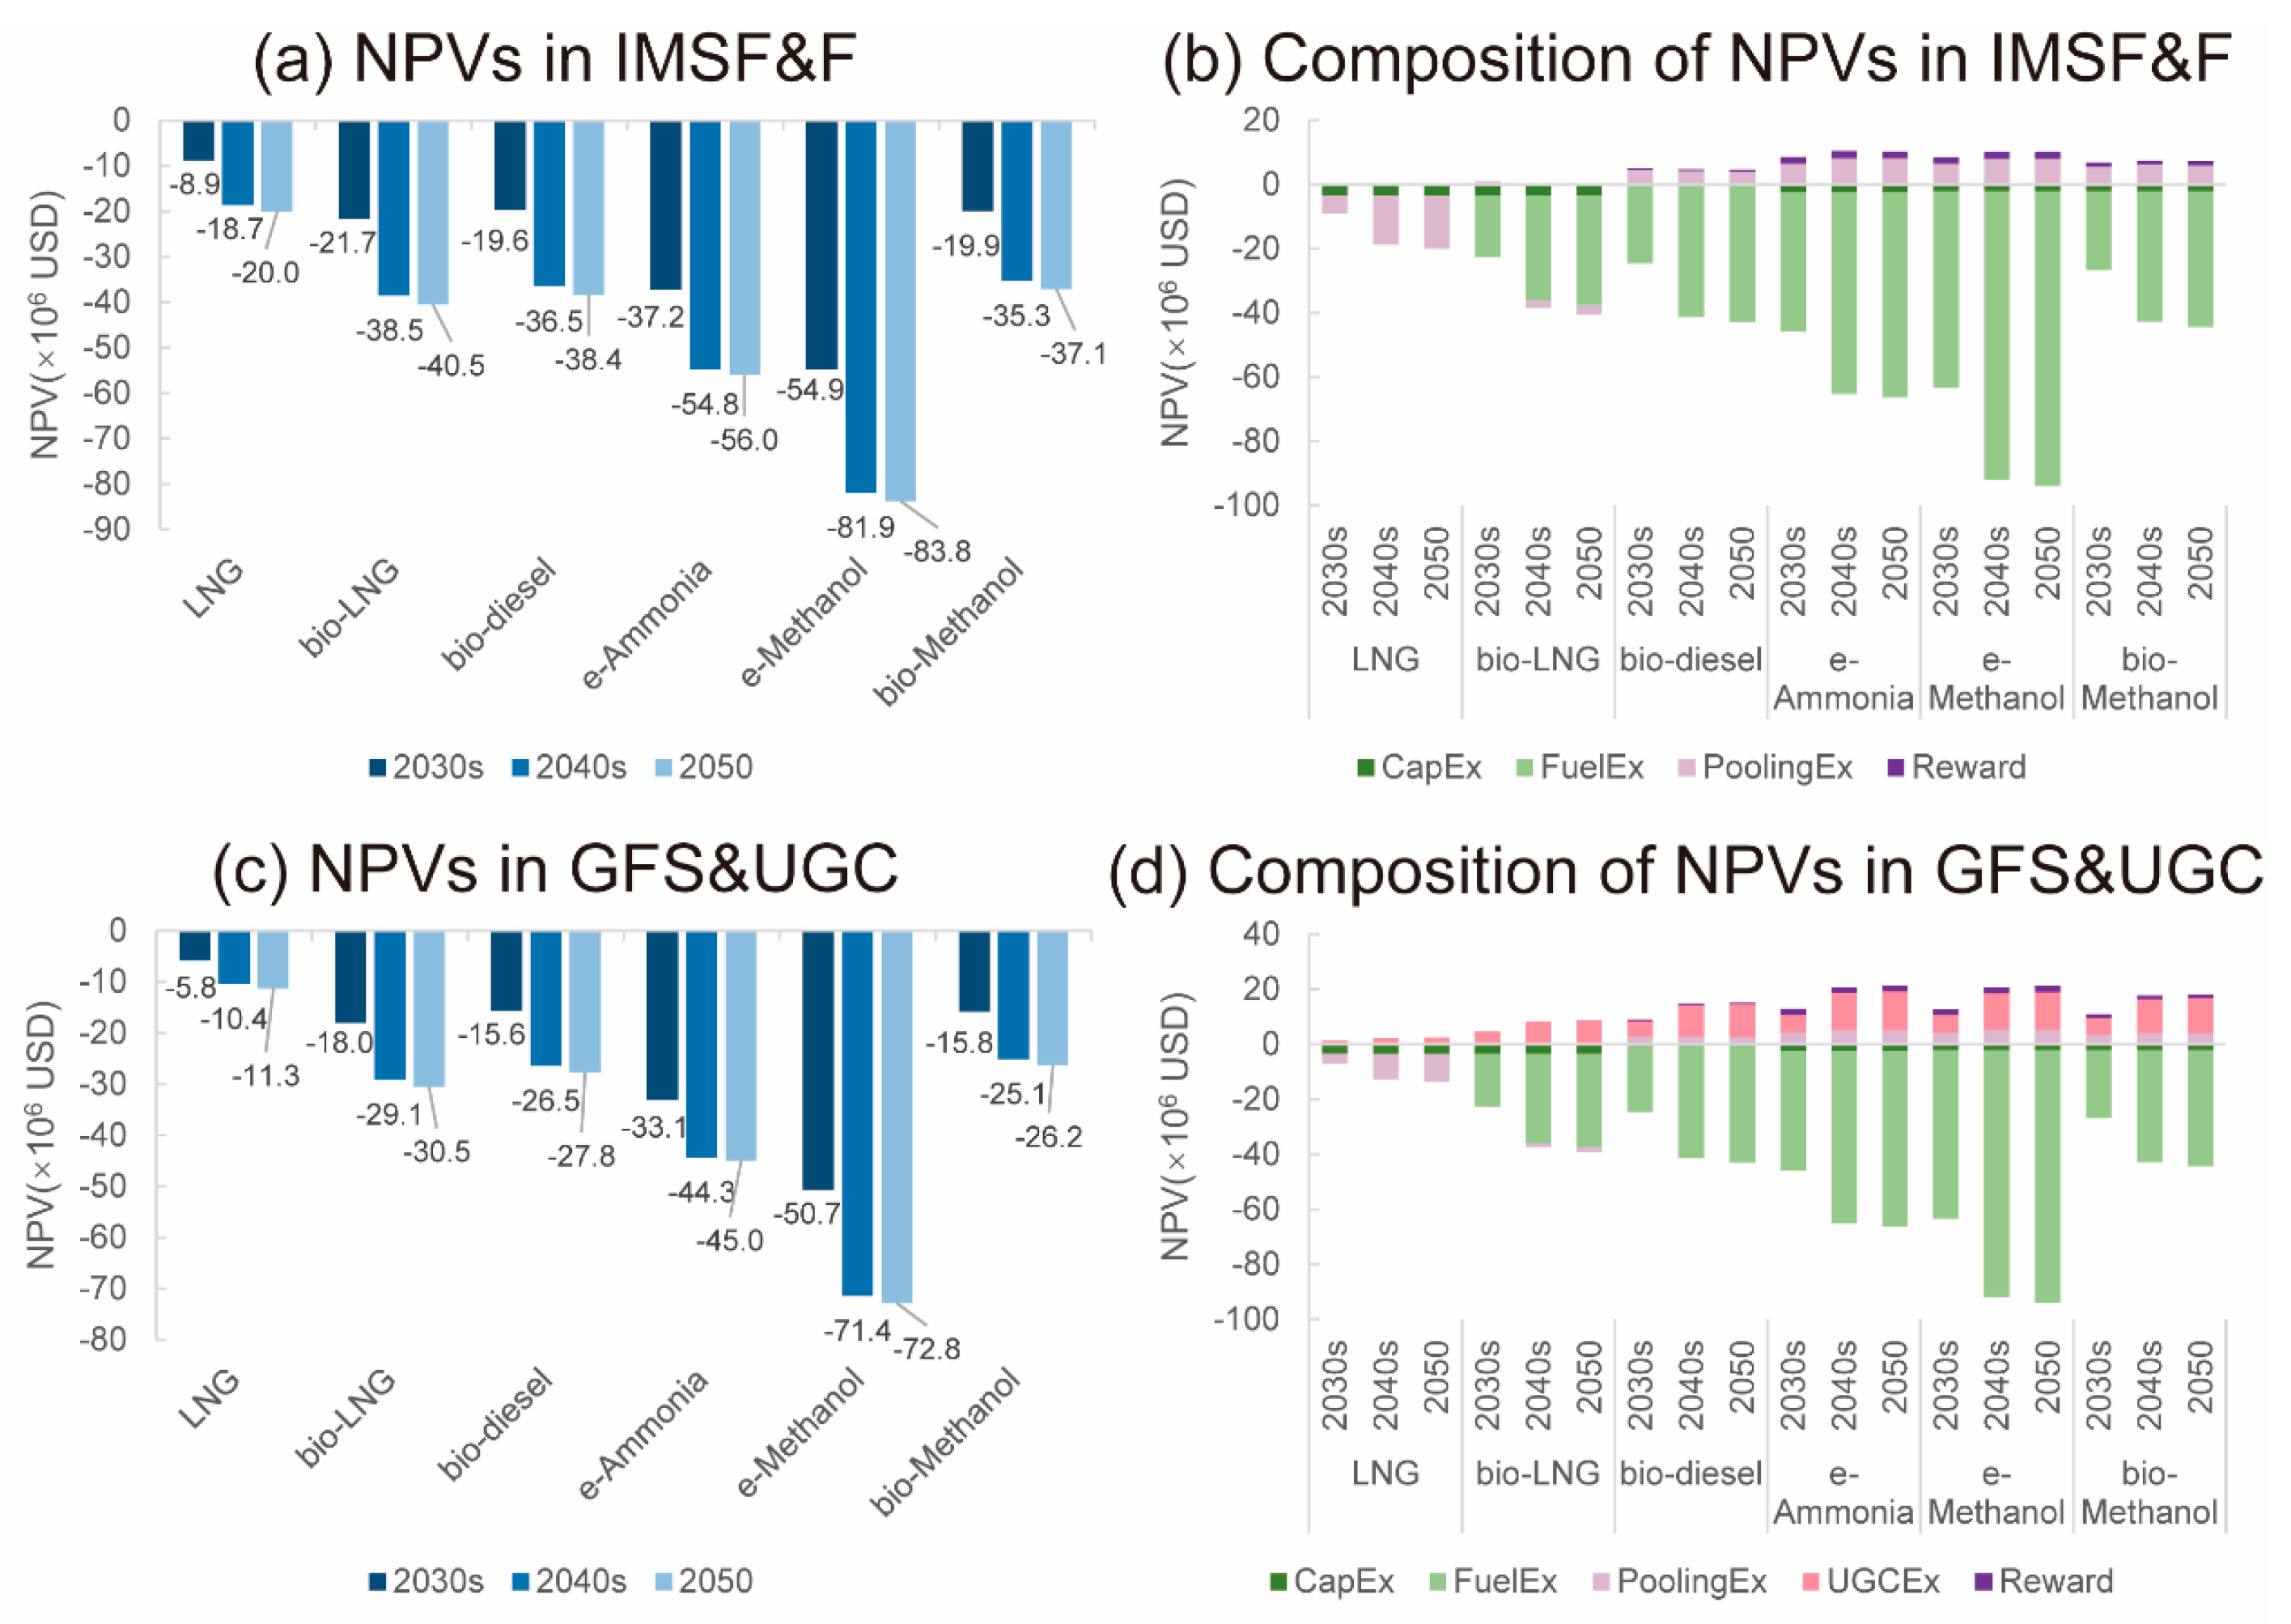
This study develops a model to evaluate the cost-effectiveness of alternative fuels for a 24,000 DWT short-sea bulk carrier using the MACC method. Only fuels with positive MAC values are considered, and the vessel operates on a single fuel type. We assume that standard units (SUs), dedicated units (DUs), and reserve units (RUs) are functionally equivalent and are transferable only within the compliance pool. By simulating carbon and fuel prices across different years, we compare the net present values (NPVs) and MACs of alternative fuels under both the IMSF&F and GFS&UGC mechanisms, determining their cost-effectiveness rankings for the period 2027–2050. Sensitivity analysis assesses the impact of ZNZ fuel price, carbon price, and Well-to-Wake GHG Fuel Intensity (GFIWtW) on MAC. Furthermore, the ratios of Pcarbon%/Pfuel% in equivalent sensitivity scenarios are determined to evaluate the relative importance of carbon price versus fuel price. The results provide insights for alternative fuel selection and GHG pricing policy formulation in shipping.

2. Data and Methods

2.1. Research Procedures

MAC calculations involve assessing each project’s financial data and GHG abatement potential [34]. The flow chart shown in Figure 1 comprises the four steps below:
  • Calculate and compare the net present values of alternative fuels under the two GHG pricing mechanisms;
  • Develop an MAC model and calculate the MACs of alternative fuels under both mechanisms;
  • Rank the alternative fuels in ascending order of MAC and plot MACCs for each mechanism to compare their cost-effectiveness;
  • Perform sensitivity analysis to evaluate the impacts of fuel prices, carbon prices, and GFIWtW on the cost-effectiveness of alternative fuels.

2.2. Net Present Value

The information of the studied ship is shown in Table 1. E (GJ) is the total energy consumed per year, which is assumed to be constant over the years in this study, at 128,640 GJ. CapExi (USD) is the retrofitting cost for a 24,000 DWT bulk carrier powered by alternative fuel i converted from a diesel ICE vessel.
NPV is employed to assess the cost-efficiency of the fuel transition, which is defined as the difference between the capital cost of an investment and the present value of the future flow of profits [44]. A positive NPV indicates a worthwhile investment and the potential benefit to investors is positively correlated with NPV. The NPV (USD) of alternative fuel i in year t can be determined by [4]:
  N P V i , t = C a p E x i F u e l E x i , t + U G C E x i , t + P o o l i n g E x i , t R e w a r d i , t × 1 ( 1 + r ) Δ t r
where FuelExi,t (USD) is the extra fuel cost of alternative fuel i in year t compared to HFO; UGCExi,t (USD) is the universal GHG levy saved by alternative fuel i in year t compared to HFO; PoolingExi,t (USD) is the compliance pooling cost saved by alternative fuel i in year t compared to target GFI, representing that ships can achieve credits in a pool as long as they attain a compliance GFI. The CO2e emission cost in the IMSF&F mechanism only refers to PoolingEx, while in the GFS&UGC mechanism it contains both PoolingEx and UGCEx. Rewardi,t is the reward for the usage of fuel i in year t. r is the discount rate, which is set at 4% in this study [4,5]. ∆t is the investment horizon, with the base year of 2027. This study assumes that the data from 2027 to 2029 are consistent with those of the 2030s and are counted as part of the 2030s.
FuelExi, t in Equation (1) could be calculated by the following:
  F u e l E x i , t = P F u e l , i , t P F u e l , H F O , t × E
where PFuel,i,t (USD/GJ) represents the price of alternative fuel i in year t and PFuel,HFO,t (USD/GJ) is the price of HFO in year t, as shown in Table 2. In particular, as electricity prices decline in the future, the fuel costs of e-fuels are expected to decrease. Conversely, due to the implications of bio-fuels on food security [45], the fuel prices of bio-fuels are likely to rise over time (Table 2).
UGCExi, t in Equation (1) could be calculated by the following:
  U G C E x i , t = P U G C , t × G F I i G F I H F O × E × 0.001
where PUGC,t (USD/t-CO2e) represents the price of universal GHG levy in year t. In the IMSF&F mechanism, UGCExi,t is not included and could be set to zero. GFIi (g-CO2e/MJ) is the GHG intensity of alternative fuel i and GFIHFO (g-CO2e/MJ) is the GHG intensity of HFO. The formula needs to be multiplied by 0.001 to unify the units.
PoolingExi, t in Equation (1) could be calculated by the following:
  P o o l i n g E x i , t = P P o o l , t × G F I i 1 Z × G F I H F O × E × 0.001
where PPool,t (USD/t-CO2e) represents the CO2e price in the compliance pool in year t and it will increase with the stringency of emission reduction requirements, as shown in Table 3. Z is the reduction rate for target GFI compared to the GFI of HFO.
Rewardi,t in Equation (1) could be calculated by the following:
  R e w a r d i ,   t = P R e w a r d , t × G F I R e w a r d G F I i × E × 0.001
where PReward,t (USD/t-CO2e) is the CO2e price for rewarding in year t, which is set at 40% of the gap between the lowest price of e-fuel (e-Ammonia) and the lowest price of biofuel (bio-LNG) in Table 3 until the 2040s and will be cancelled thereafter [4]; i is the specific type of eligible fuel; and GFIReward (g-CO2e/MJ) is the GFI qualification value for reward eligibility.

2.3. The MAC Model

In this study, the marginal abatement cost, MAC (USD/t-CO2e), is defined as the ratio of the NPV of alternative fuels to their GHG emission abatement potentials. The GHG emission abatement potential of alternative fuel i (αi) could be determined by Equation (6):
  α i = 1 G F I i G F I H F O
The MAC of fuel i in year t could be calculated using Equation (7) [5]:
  M A C i , t = N P V i , t α i G F I H F O E Δ t
Since a negative NPV represents a disbursement in this study, which is contrary to the definition of MAC, it should be multiplied by a negative sign when calculating MAC. That is, in the case of a negative MAC, shipowners will achieve profits from fuel transition. Consequently, the curves of MAC (MACC) could be plotted based on MAC, with the most cost-effective fuels arranged on the left.
In this study, the fuels encompass HFO and LNG, classified as fossil fuels; and the remaining fuels, categorized as ZNZs. Their GFIWtW and αi are shown in Table 4.

2.4. Sensitivity Analysis

Carbon prices and fuel prices have been proven to constrain fuel transition [24,48] and it is crucial to figure out their sensitivity to fuel economy. On the other hand, CapExs of new vessels is regarded as constant in this study while Rewards have negligible impact on the results (Figure 2) and thus were excluded from the sensitivity analysis. To assess the sensitivity of the MAC results, the parameters including ZNZs price, UGC price, pooling price, and GFIWtW were altered by 10%, one at a time.

3. Results

3.1. NPVi,t

Figure 2 illustrates the NPVs and their compositions under two mechanisms in the 2030s, 2040s, and the year 2050, with negative values representing disbursements. As shown in Figure 2a,c, the NPVs of the alternative fuels were all negative in both mechanisms by 2050, implying that shipowners would face financial losses in fuel transitions and none of the investments could yield returns over the period. Additionally, the NPVs under the GFS&UGC mechanism are greater than those under the IMSF&F mechanism, which could be attributed to the costs compensated by UGCEx in the GFS&UGC mechanism.
As can be seen in Figure 2b,d, the PoolingEx, UGCEx, and Reward were insufficient to cover the increased costs of fuel transition originating from CapEx and FuelEx. With respect to specific fuels, LNG disbursement was dominated by PoolingEx, which could be attributed to the fact that using LNG alone is insufficient to meet the IMO GHG reduction targets due to the increasingly stringent emission reduction requirements. In contrast, the disbursements of ZNZ fuels were dominated by extra fuel cost (FuelEx) and their revenues were mainly derived from PoolingEx and UGCEx. The exception is bio-LNG, which failed to meet the target after 2040 and requires PoolingEx to achieve compliance. In summary, the investments of ZNZ-powered ships are not expected to be recouped by 2050 unless carbon prices rise dramatically to increase revenues.

3.2. Results of MAC Model

As shown in Table 5, the MACs in the GFS&UGC mechanism were relatively lower compared to those in the IMSF&F mechanism, indicating better cost-effectiveness of alternative fuels in the GFS&UGC mechanism, which results from the joint effects of PoolingEx and UGCEx. The results revealed the effects of the economic mechanism on the cost-effectiveness of fuels, especially of fossil LNG. PoolingEx and UGCEx could significantly reduce the economic viability of LNG over the period. Consequently, introducing economic mechanisms into the model might avoid the likely overestimation of the cost-effectiveness of (fossil) LNG-powered ships that rarely consider carbon price variations [37].
The cost-effectiveness rankings of fuels are illustrated in Figure 3, Figure 4 and Figure 5. In general, bio-methanol and bio-diesel were identified as the most cost-competitive fuels that shipowners can adopt as a priority, which is consistent with the findings of some studies [49,50]. On the contrary, fossil LNG achieved poor cost-effective performance due to its limited emission reduction potential (17%) and the high PoolingEx requirements to be compliant. The poor cost-effectiveness of e-Methanol could be attributed to its extremely high price. In addition, bio-LNG performed better in cost-effectiveness than e-Ammonia in the 2030s while the case reversed in the 2040s and in 2050. The rising fuel price of bio-LNG over the time period, combined with its relative higher GFIWtW and consequently higher PoolingEx and UGCEx, could explain this temporal ranking variation.
For renewable methanol, bio-Methanol had a lower fuel processing cost compared to e-Methanol, resulting in a better cost-effective performance. With respect to e-fuels, e-Ammonia exhibited a better cost-effectiveness than e-Methanol owing to its lower fuel price. According to reports from International Renewable Energy Agency (IRENA), the cost of e-Ammonia is estimated to decrease significantly to USD 18.6/GJ and USD 31.7/GJ by 2050 [23], indicating that its economic feasibility could be better than the results in this study. Nevertheless, significant shares of e-Methanol rather than e-Ammonia may emerge considering that ammonia is deemed as more risky for application in the shipping industry [11,51].
The economic viability of fuel transition for fleets under both a carbon levy and the Emission Trading System (ETS) has been compared [26]. Despite differences in the study mechanisms, our results—obtained under a similar range of parameter settings—are generally consistent with those findings. Both analyses identify bio-Methanol as the most cost-competitive fuel, although it is not profitable in our results due to the exclusion of chartering revenue. Furthermore, our analysis also indicates that bio-LNG is less cost-effective than renewable ammonia under high carbon price scenarios.
Moreover, Table 6 lists the fuel prices, GFIWtW, and economic indicators used in previous studies assessing the economic impact of GHG emission reduction policies on fleets and individual vessels. The parameter settings differ significantly among studies, yielding widely divergent results. This indicates that uncertainties in fuel prices and GFIWtW limit the comparability between studies.

4. Sensitivity Analysis

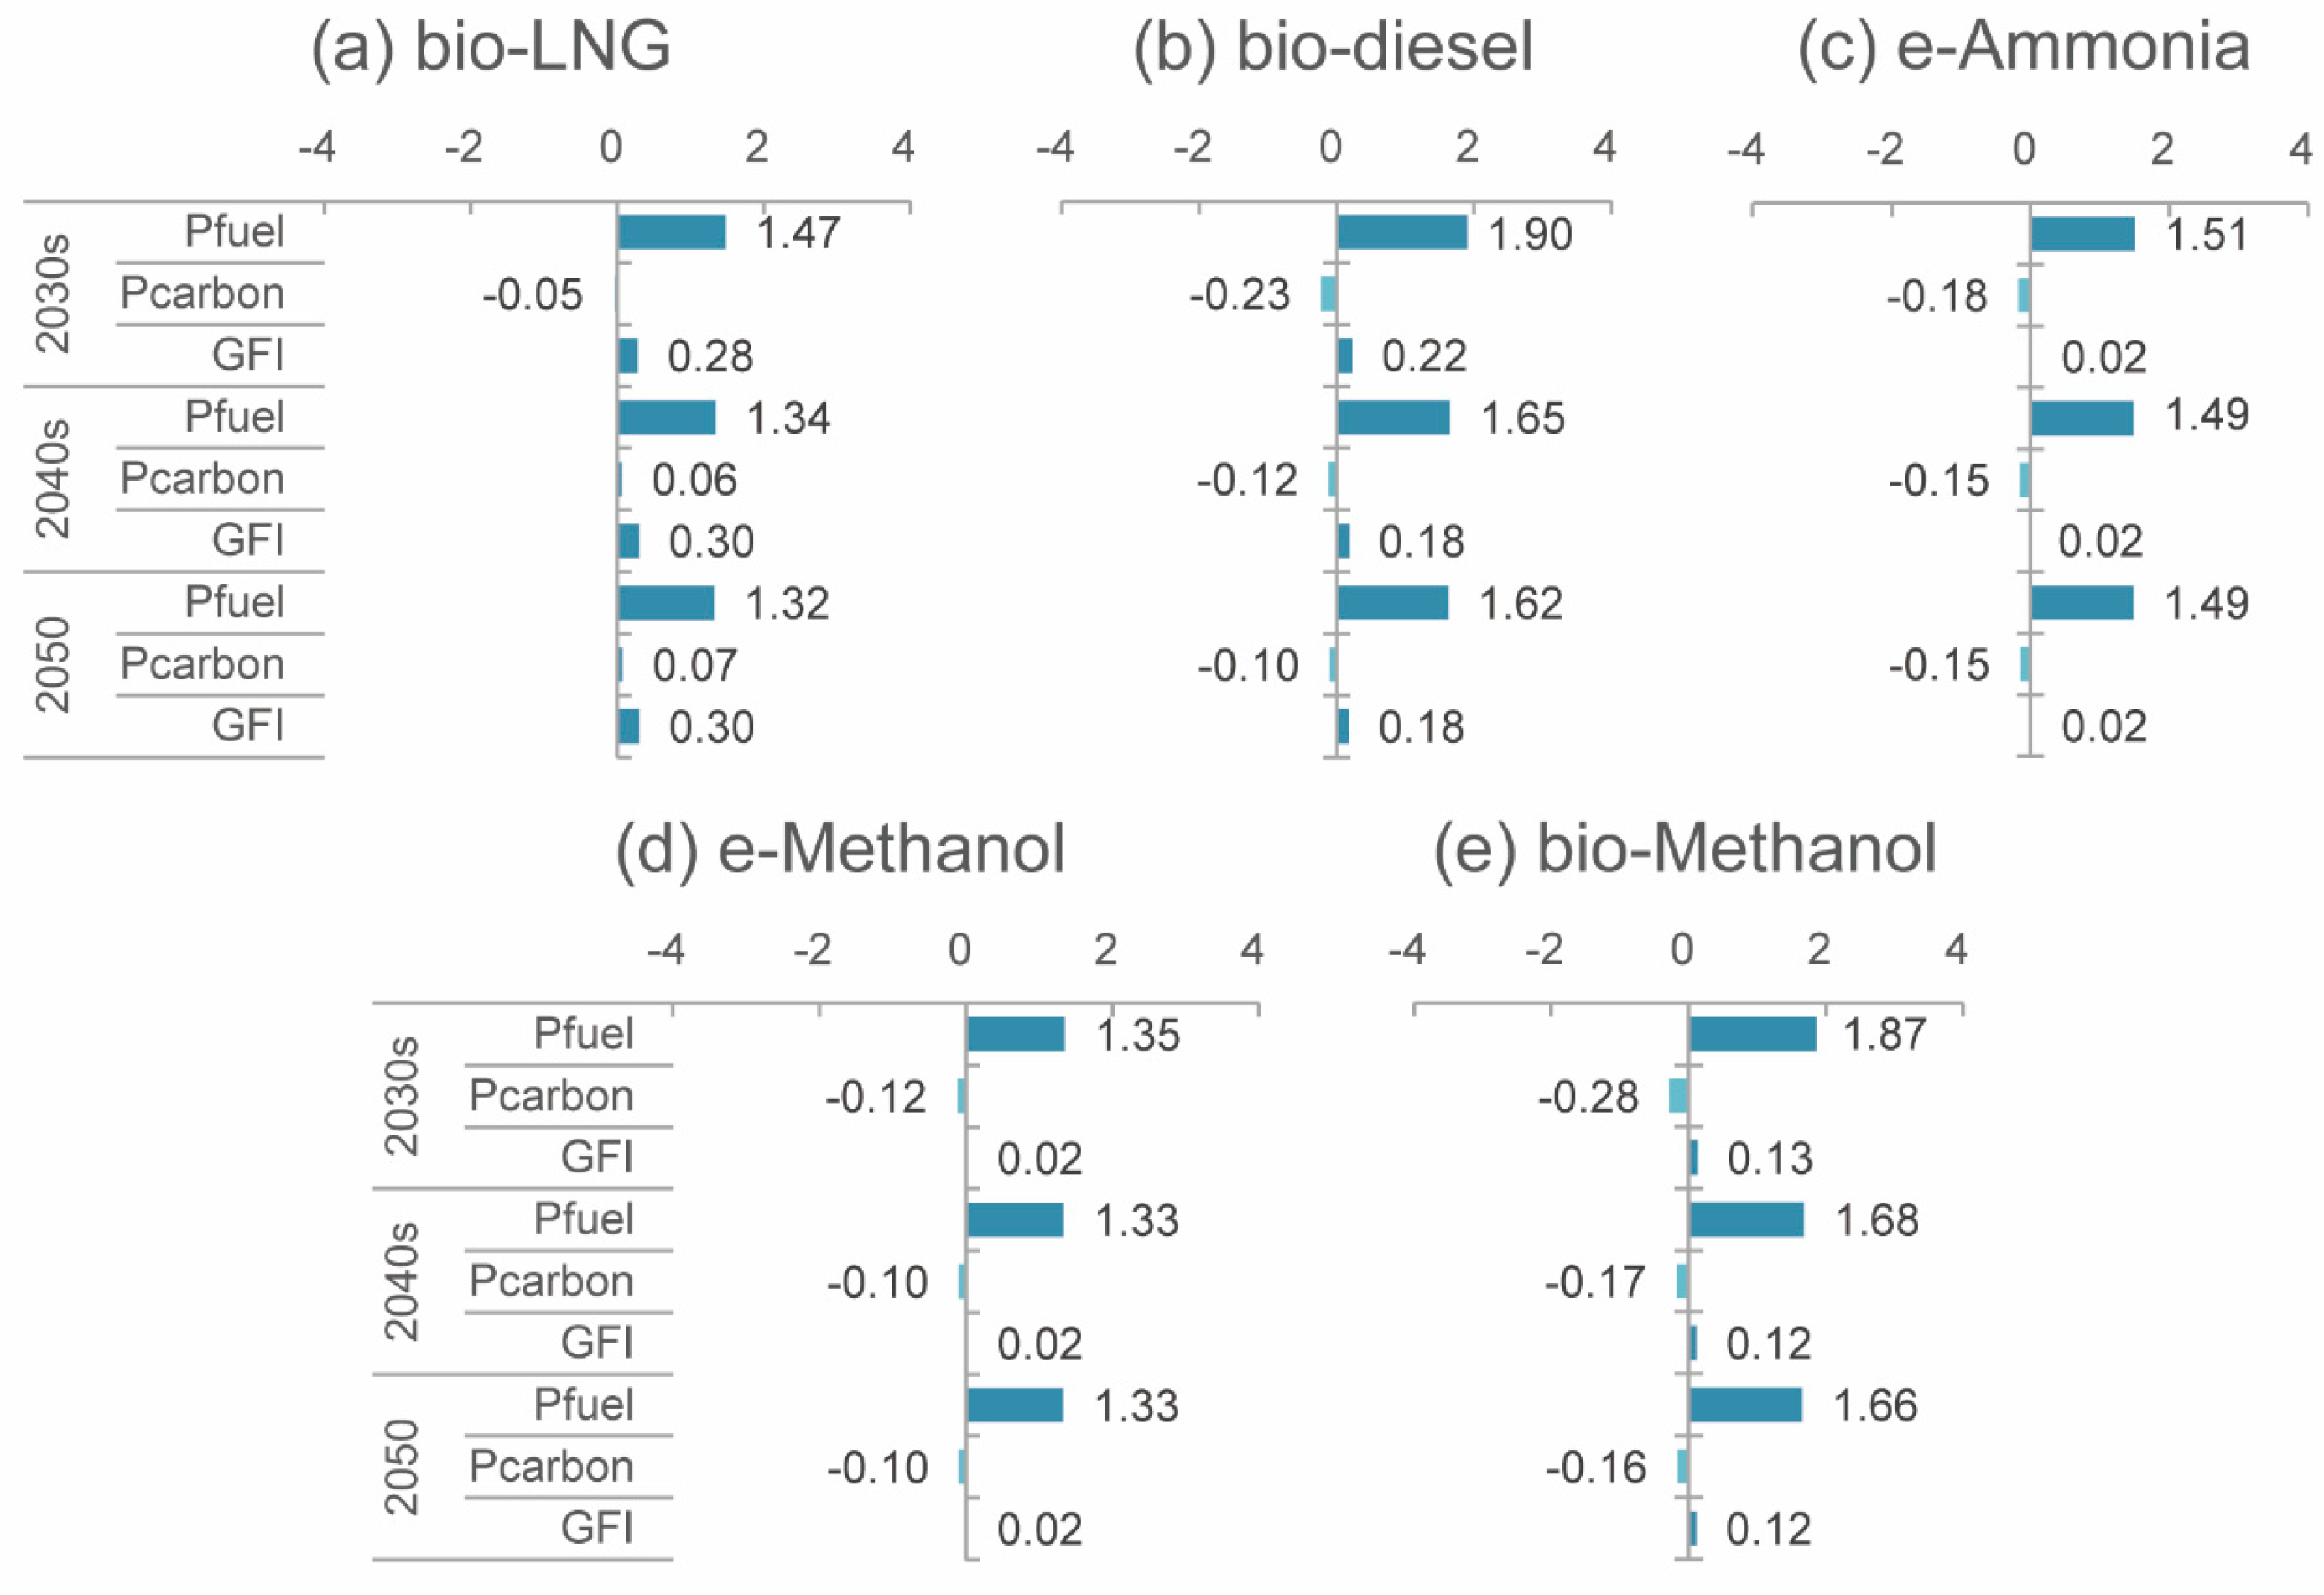
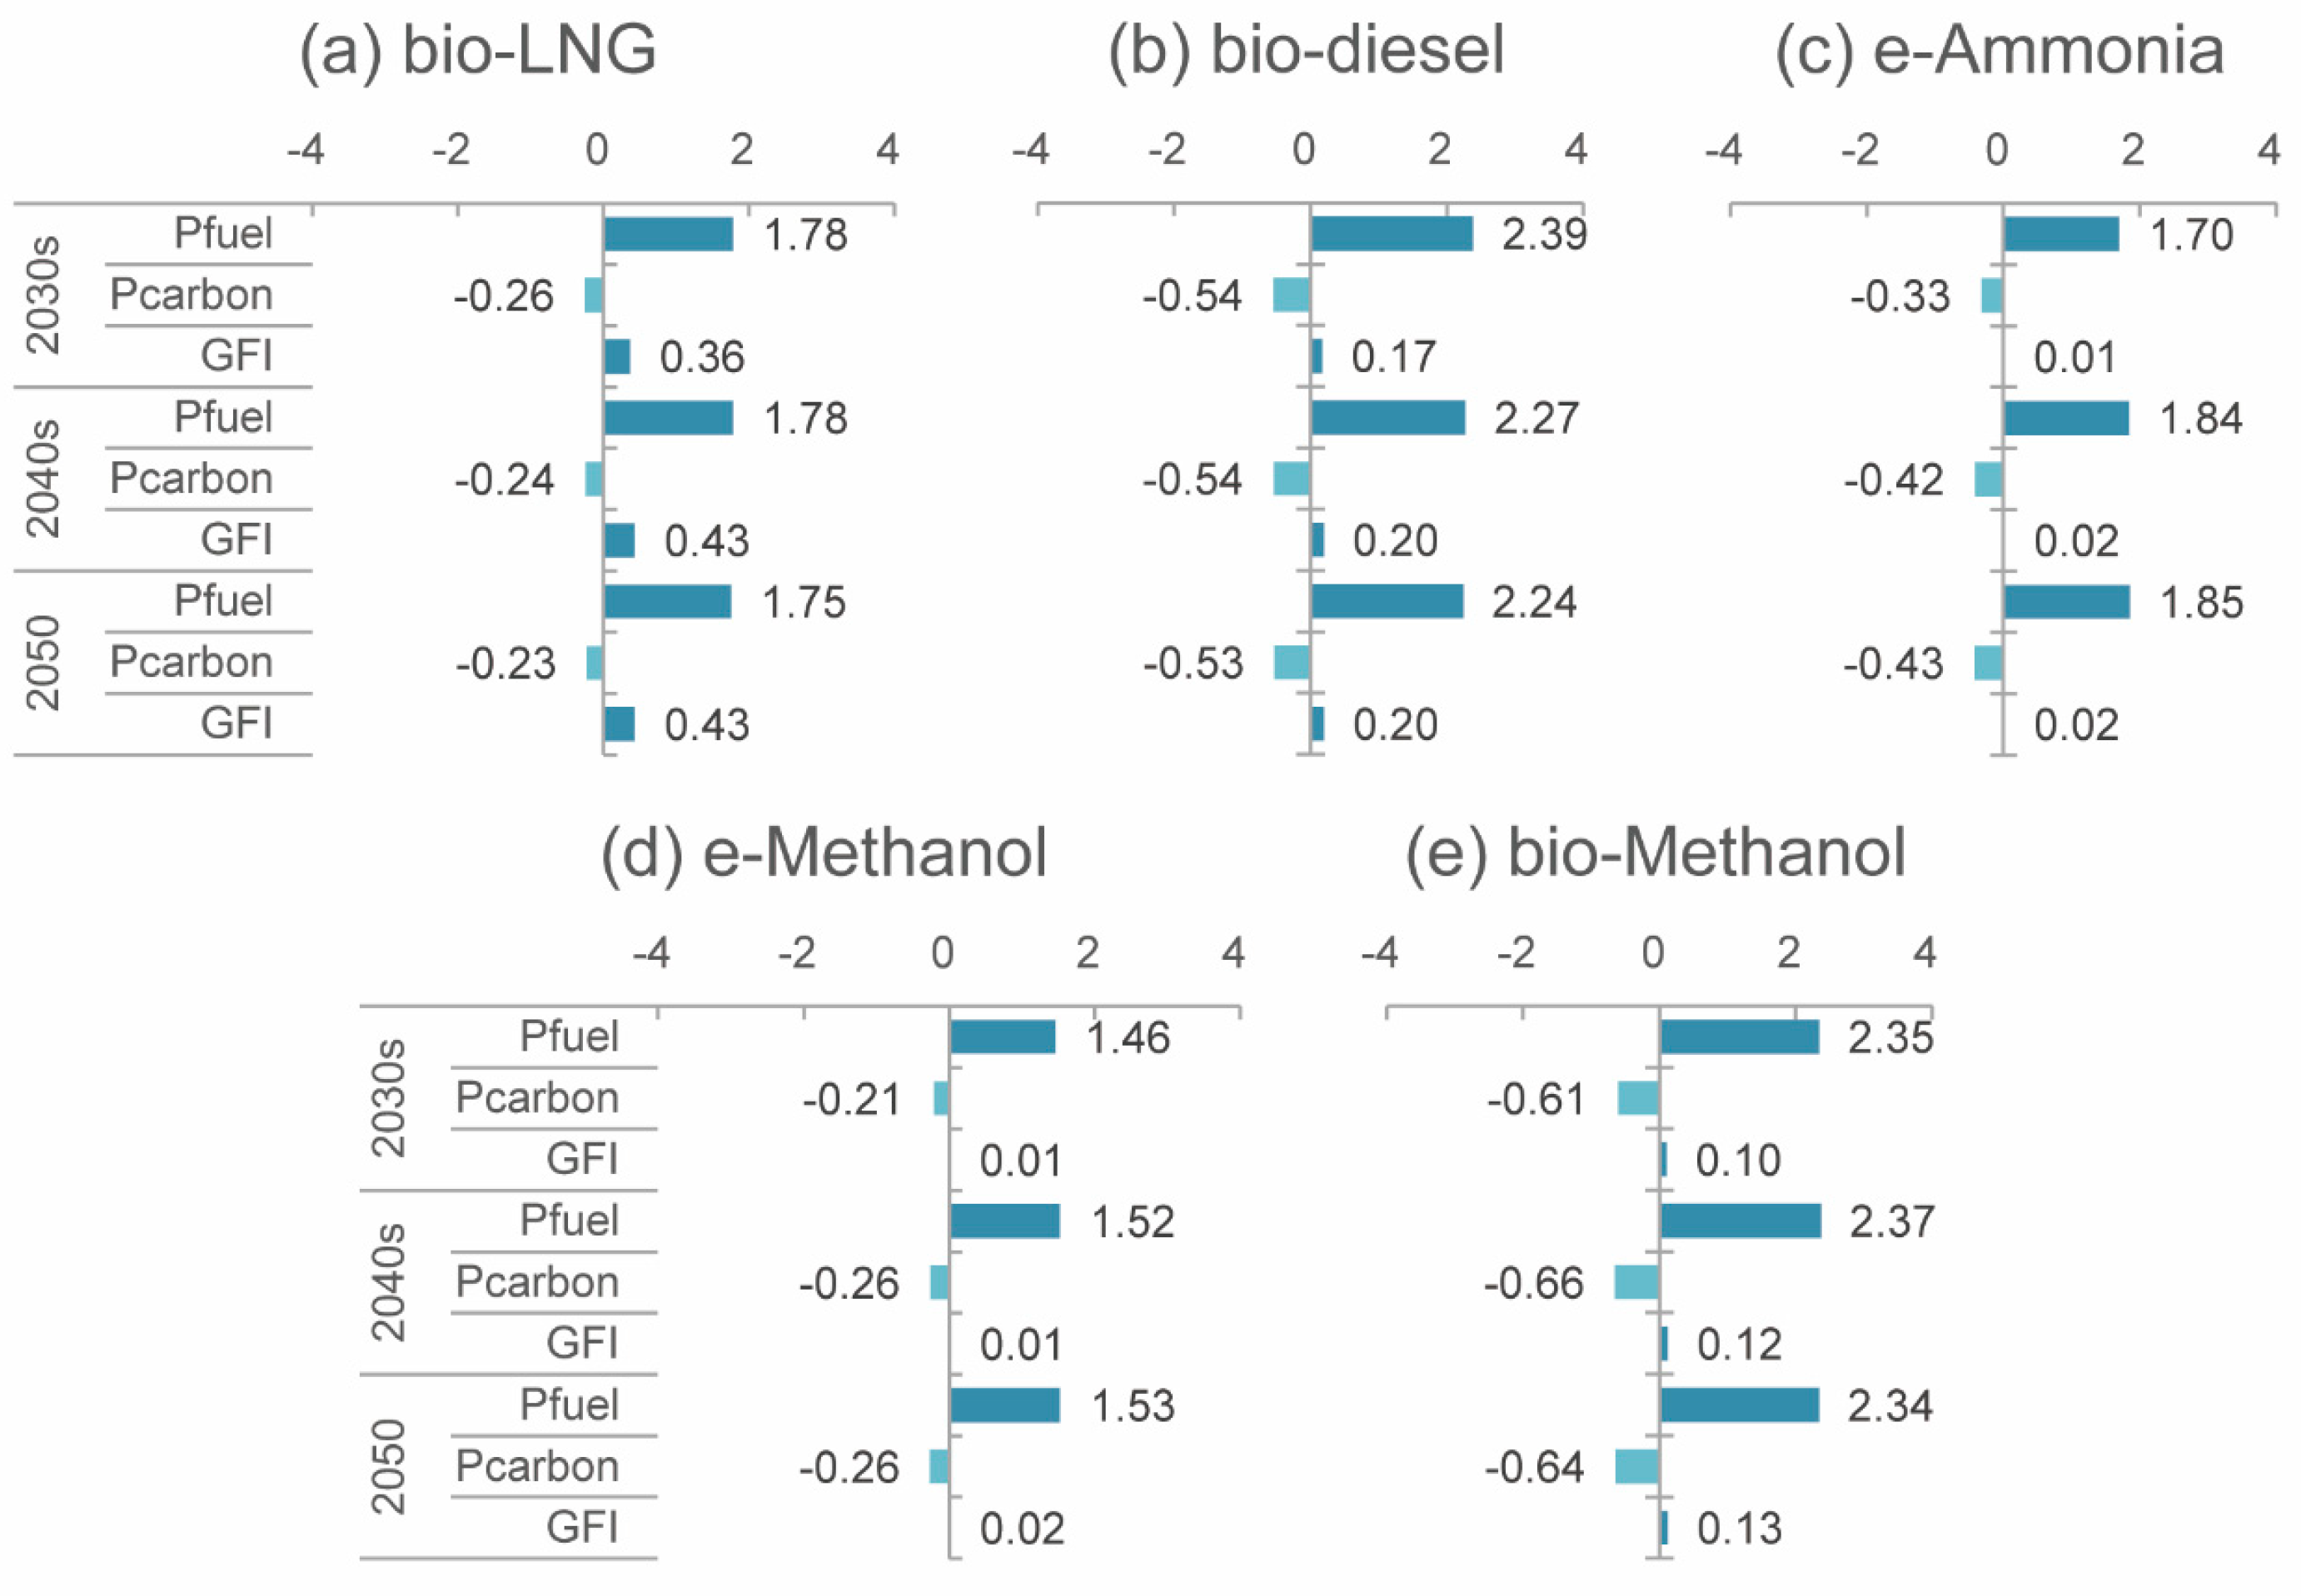
The sensitivities of MAC to fuel price, carbon price, and GFIWtW were presented by the variation rate of MAC with respect to Pfuel (MAC%/Pfuel%), Pcarbon (MAC%/Pcarbon%), and GFIWtW (MAC%/GFIWtW%), respectively. Figure 6 and Figure 7 illustrate that fuel price and GFIWtW are positively correlated with MAC, while carbon price is negatively correlated, indicating that increasing carbon price or reducing fuel price and GFIWtW could improve the cost-effectiveness. MACs were more sensitive to fuel price compared to carbon price and GFIWtW under the price scope of this study, especially under the GFS&UGC mechanism. In addition, the cost-effectiveness of ZNZs with higher GFIWtW had greater sensitivity to GFIWtW such as bio-LNG and bio-diesel.
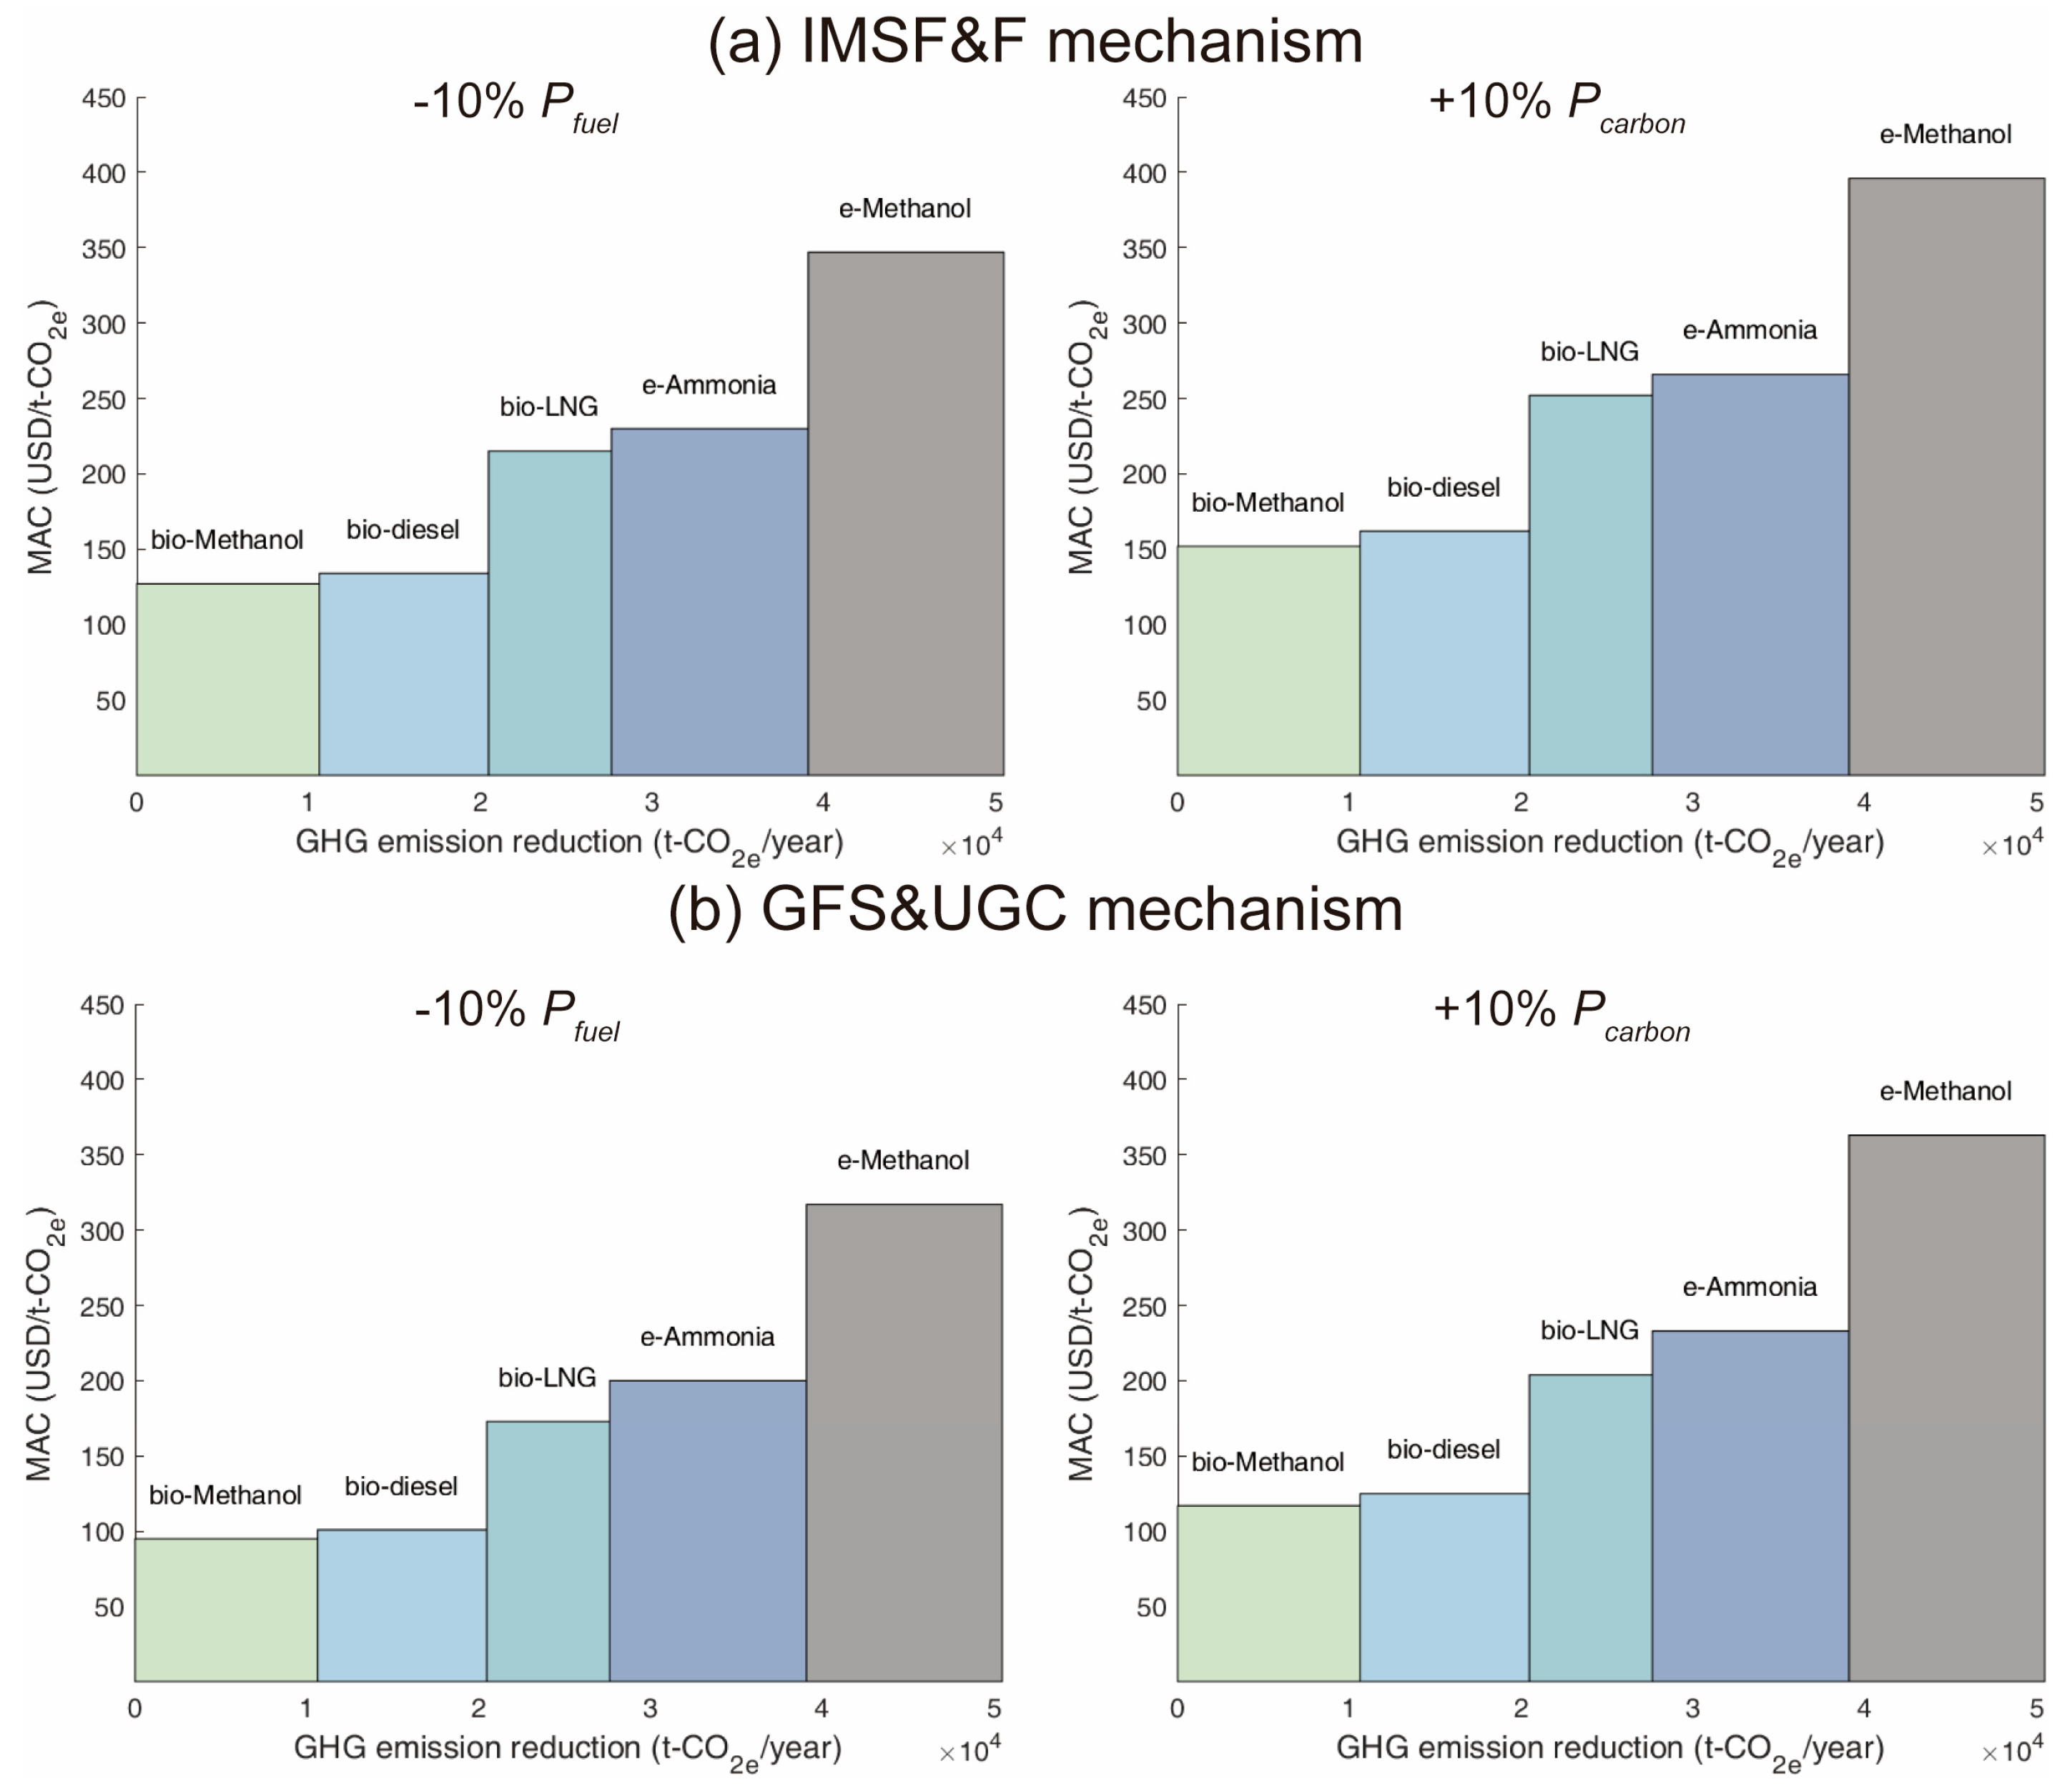
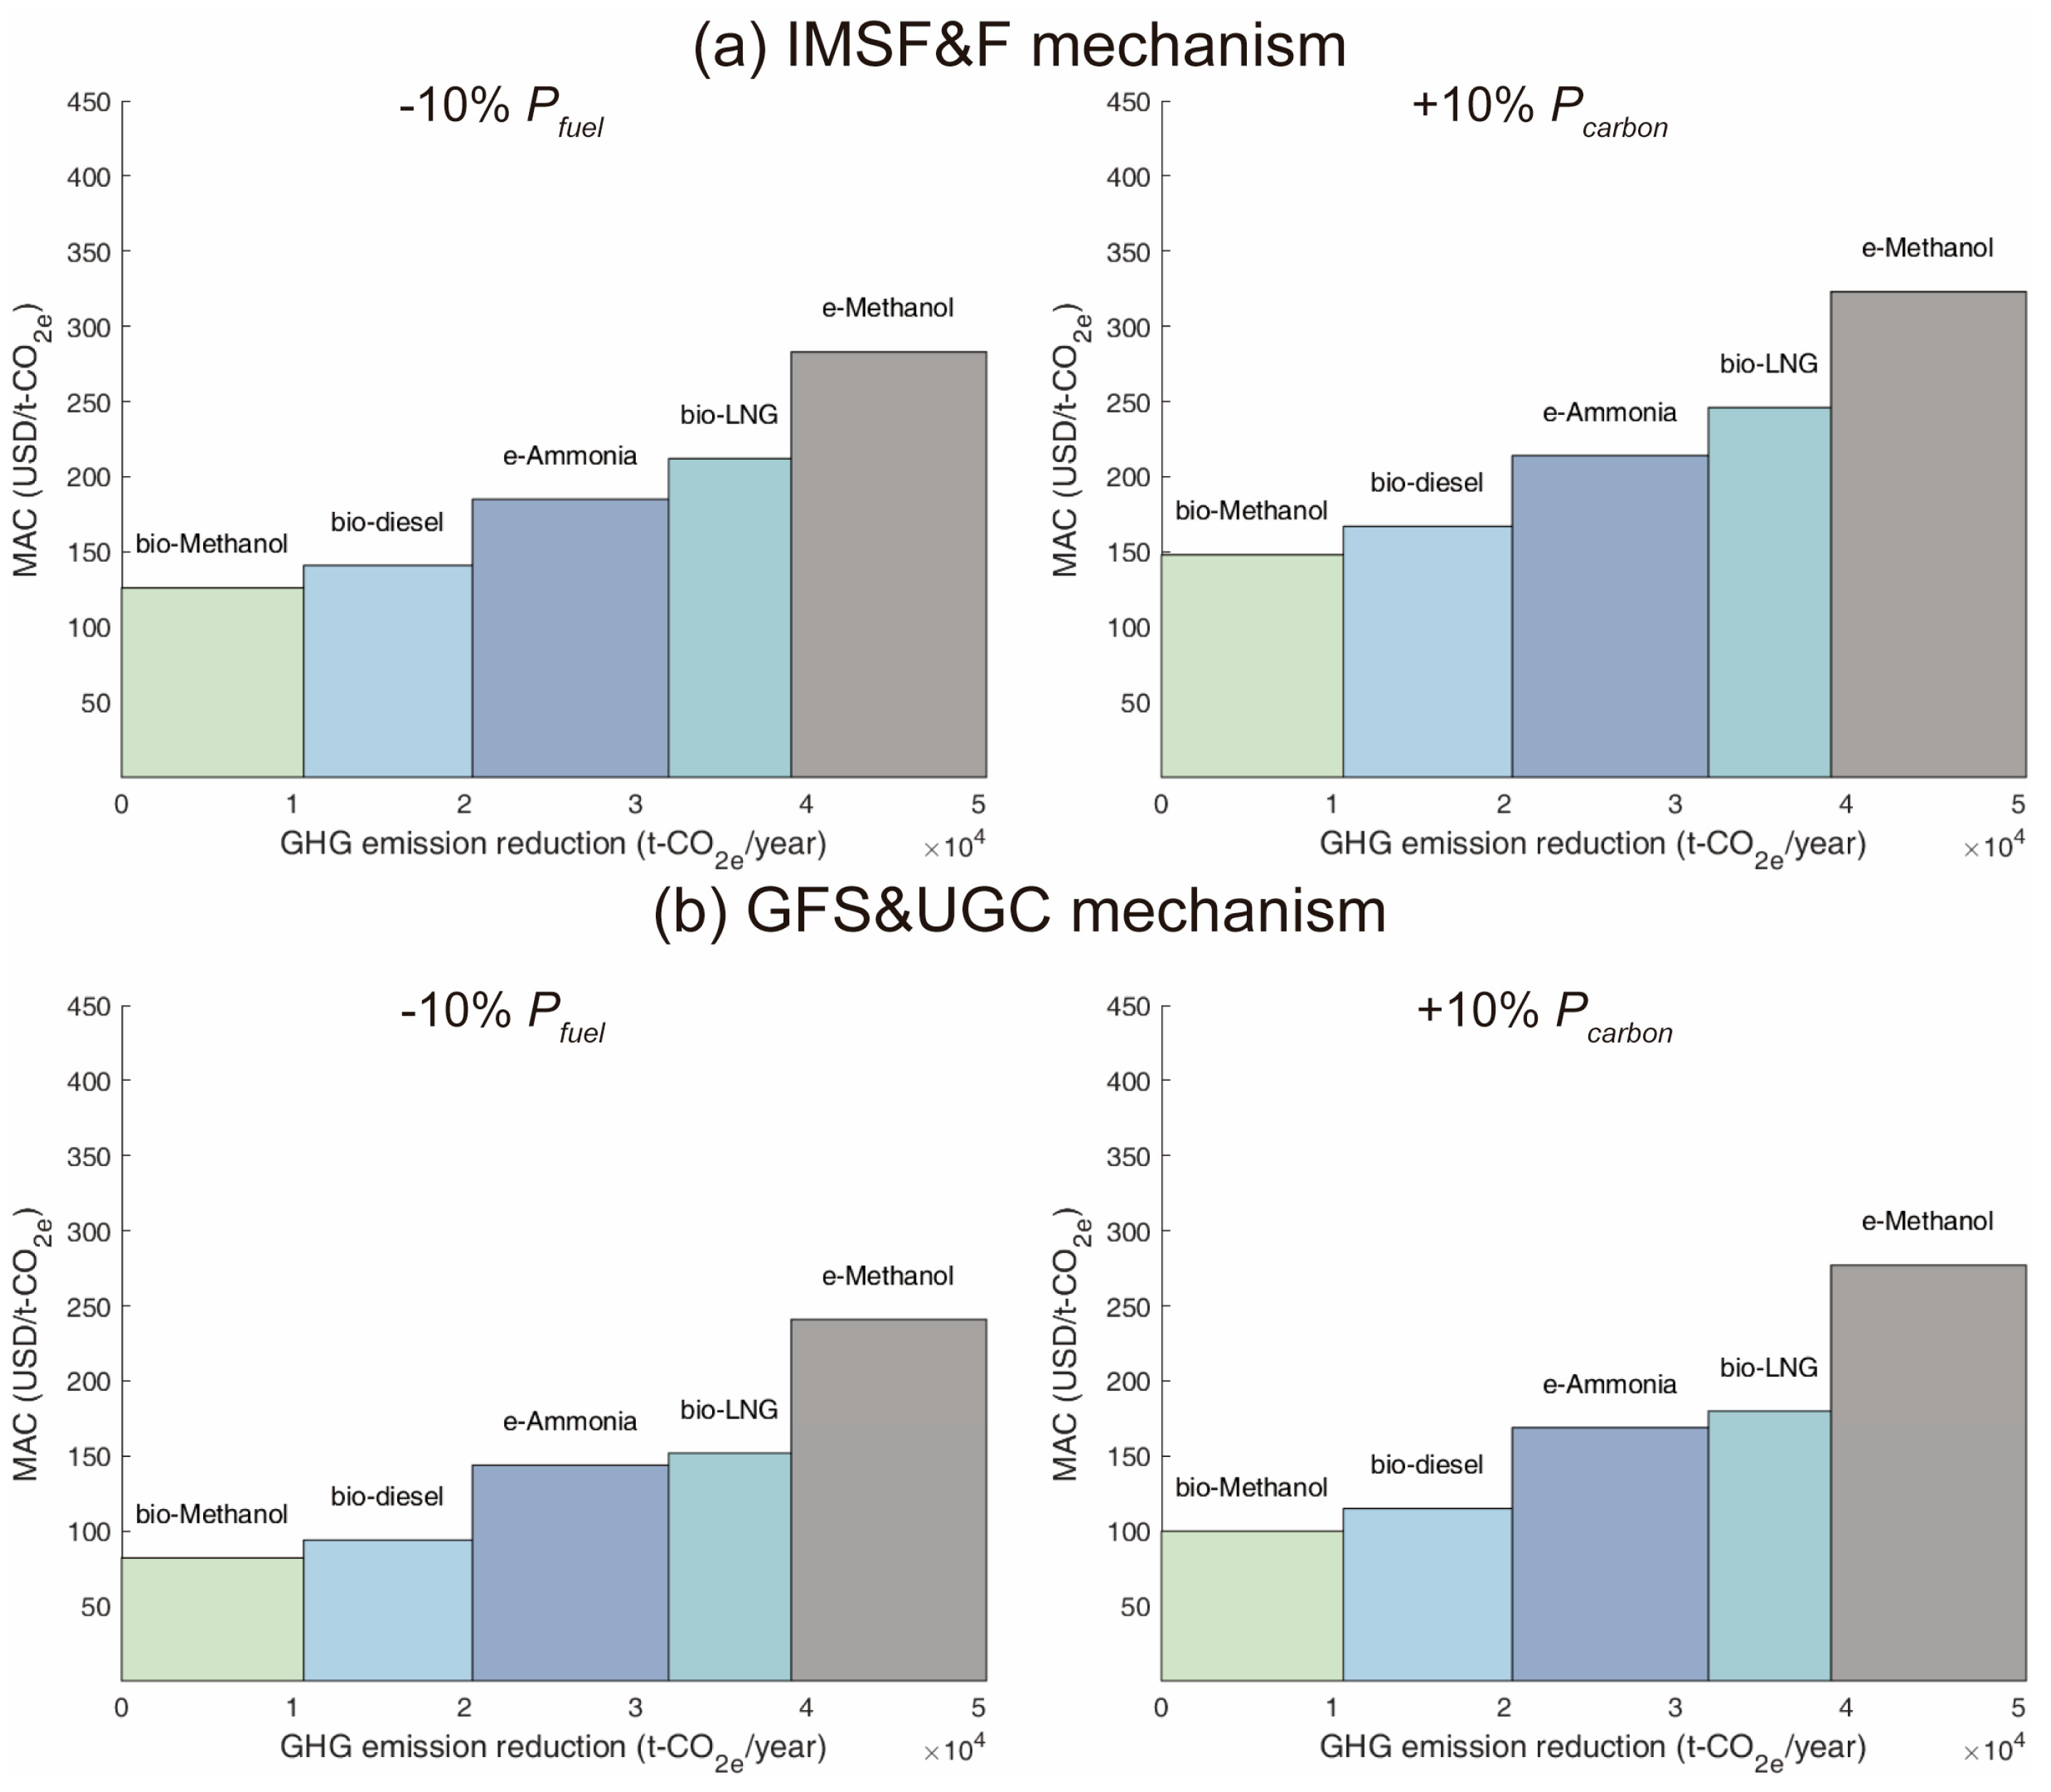
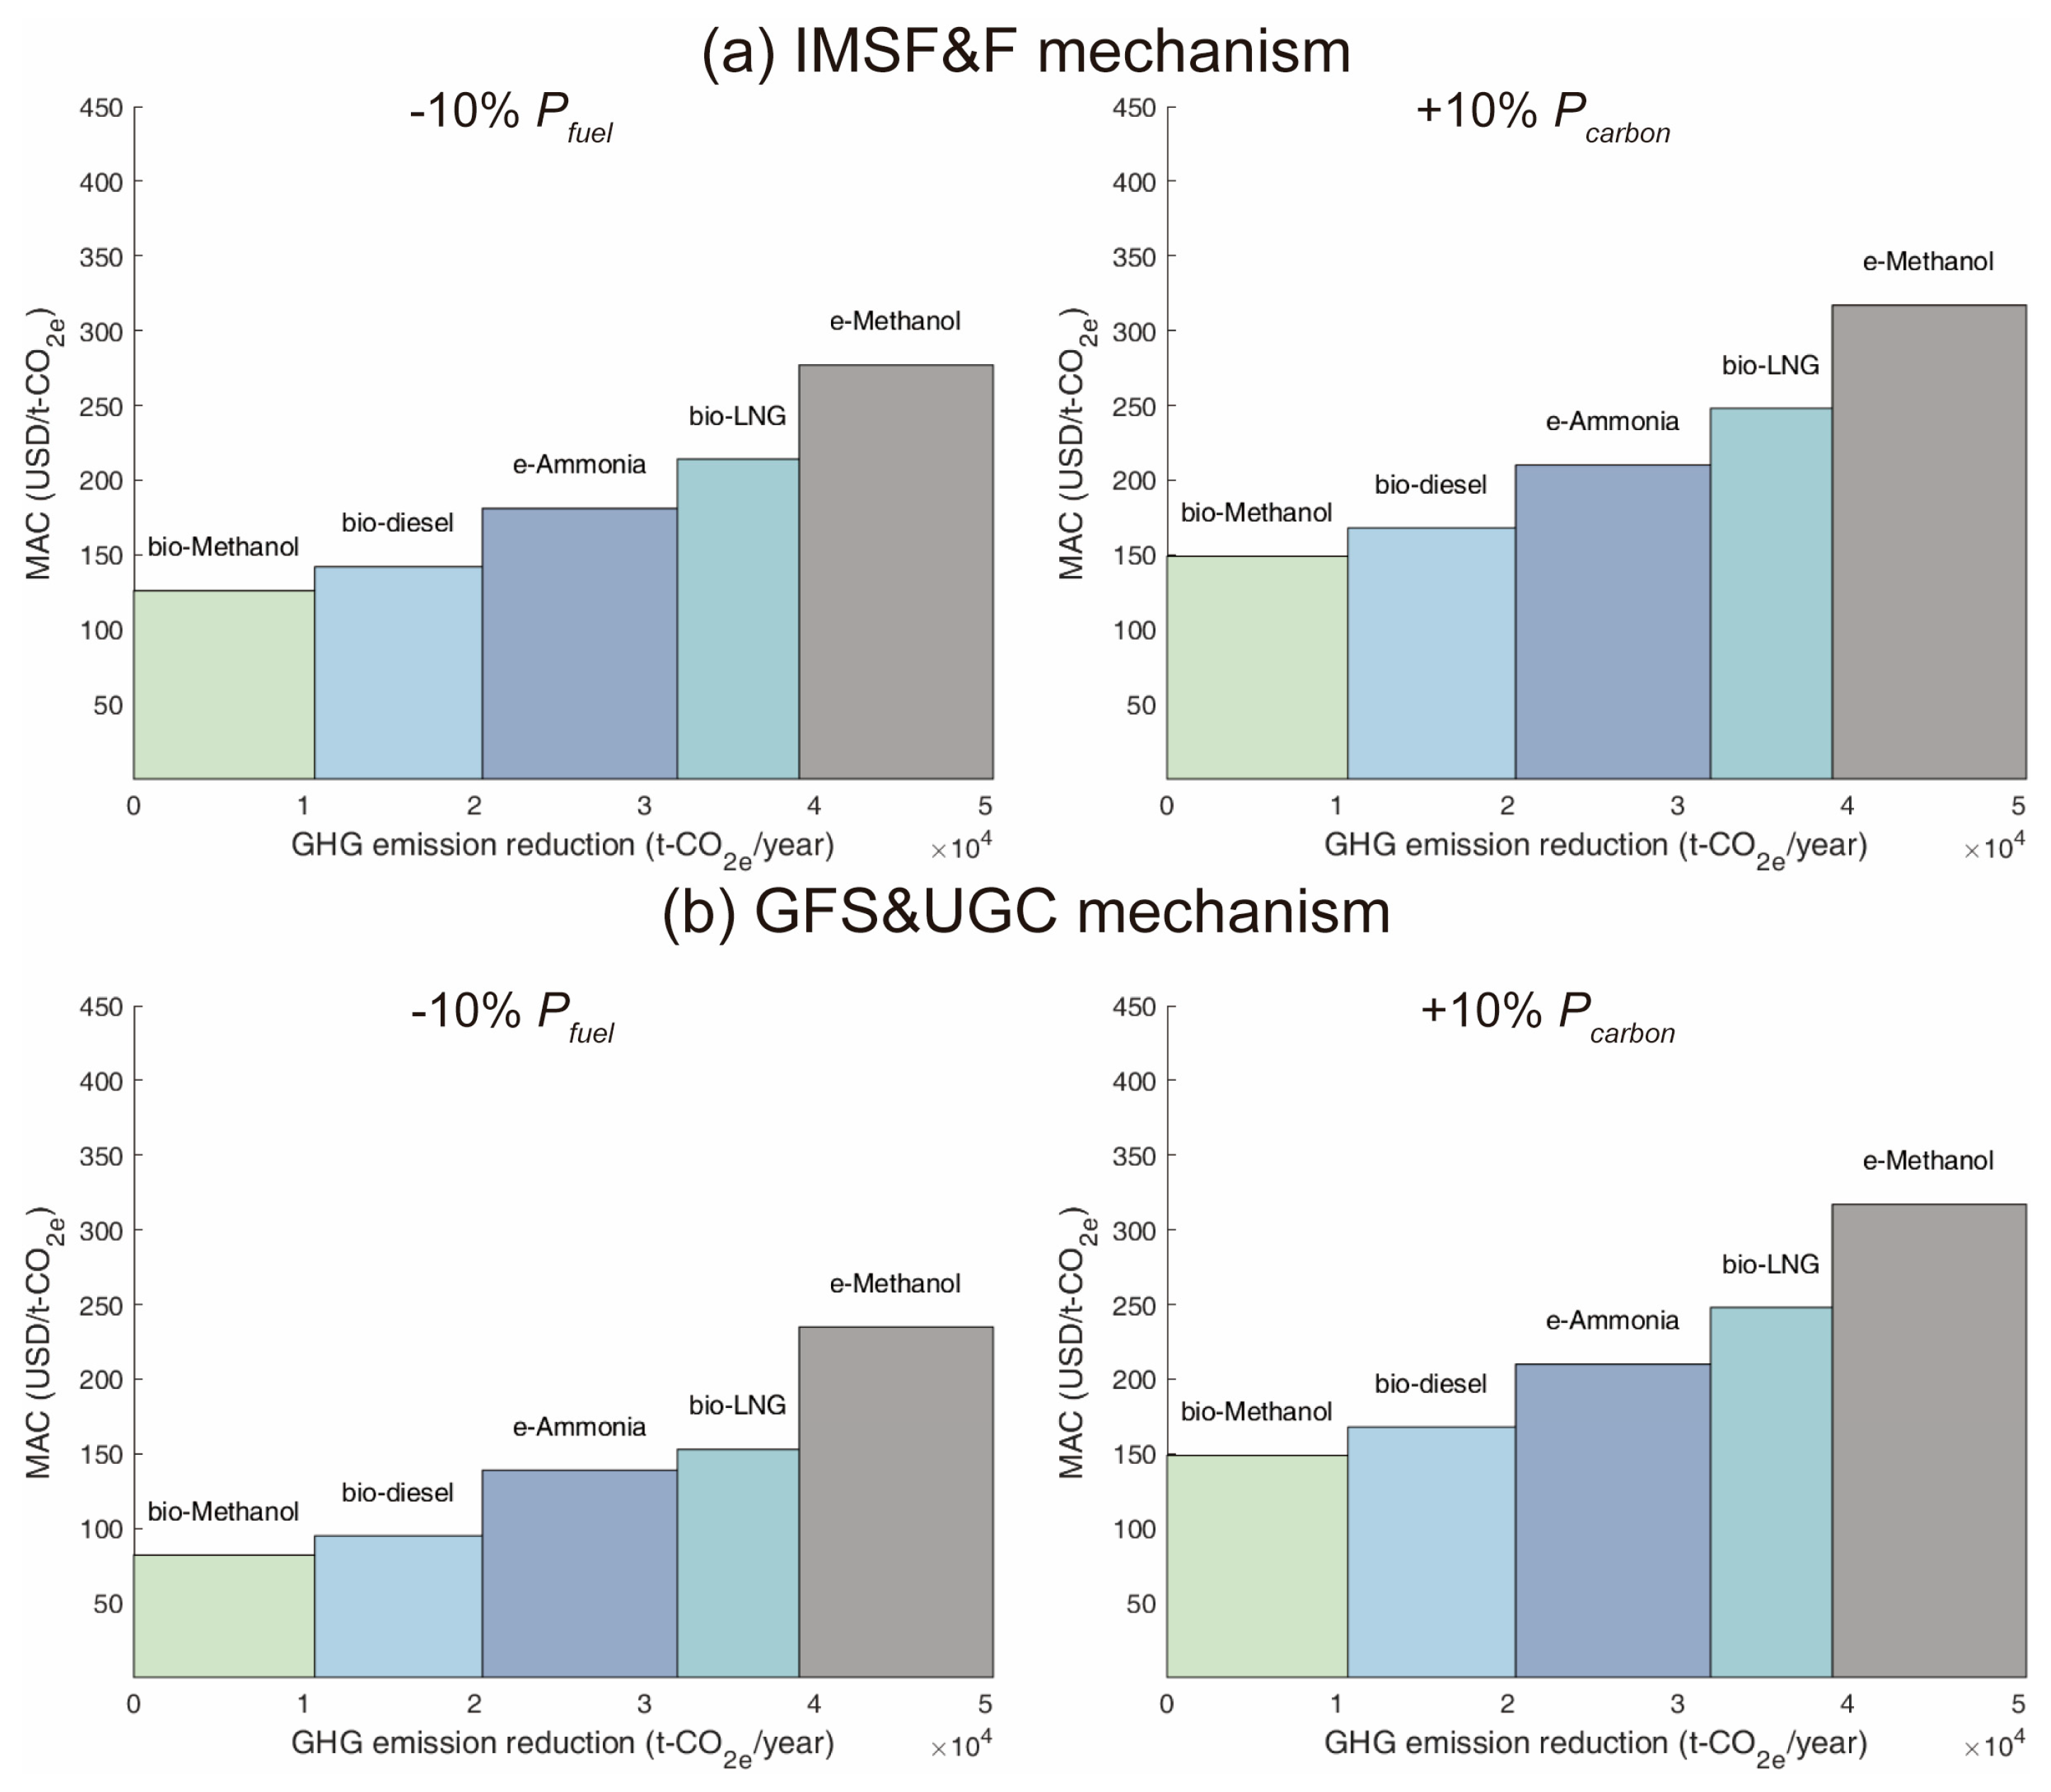
Figure 8, Figure 9 and 
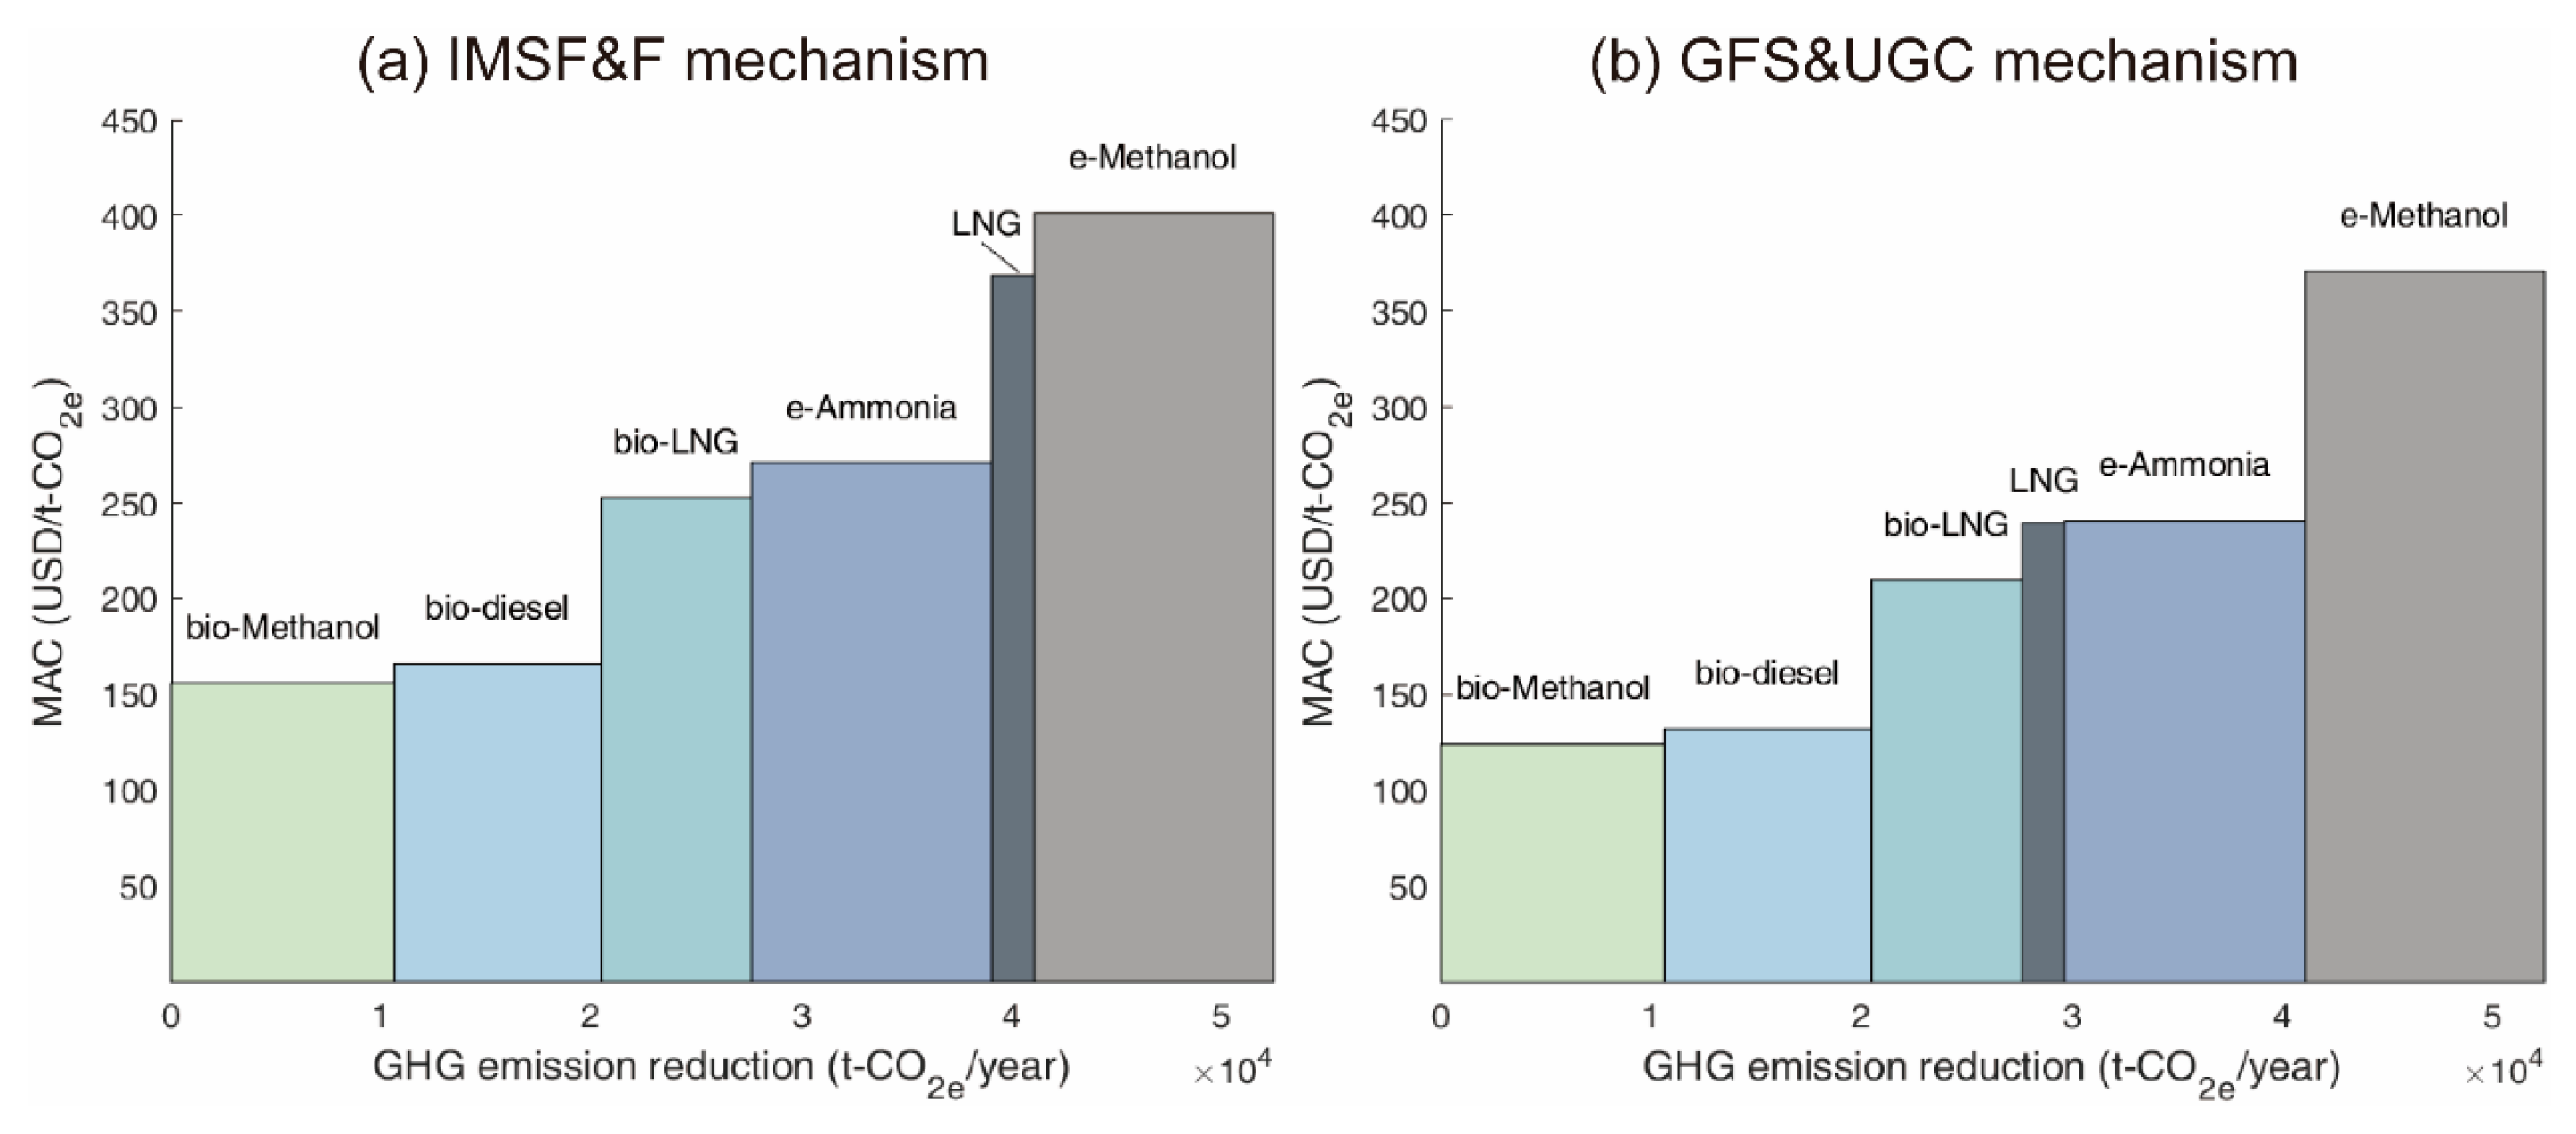
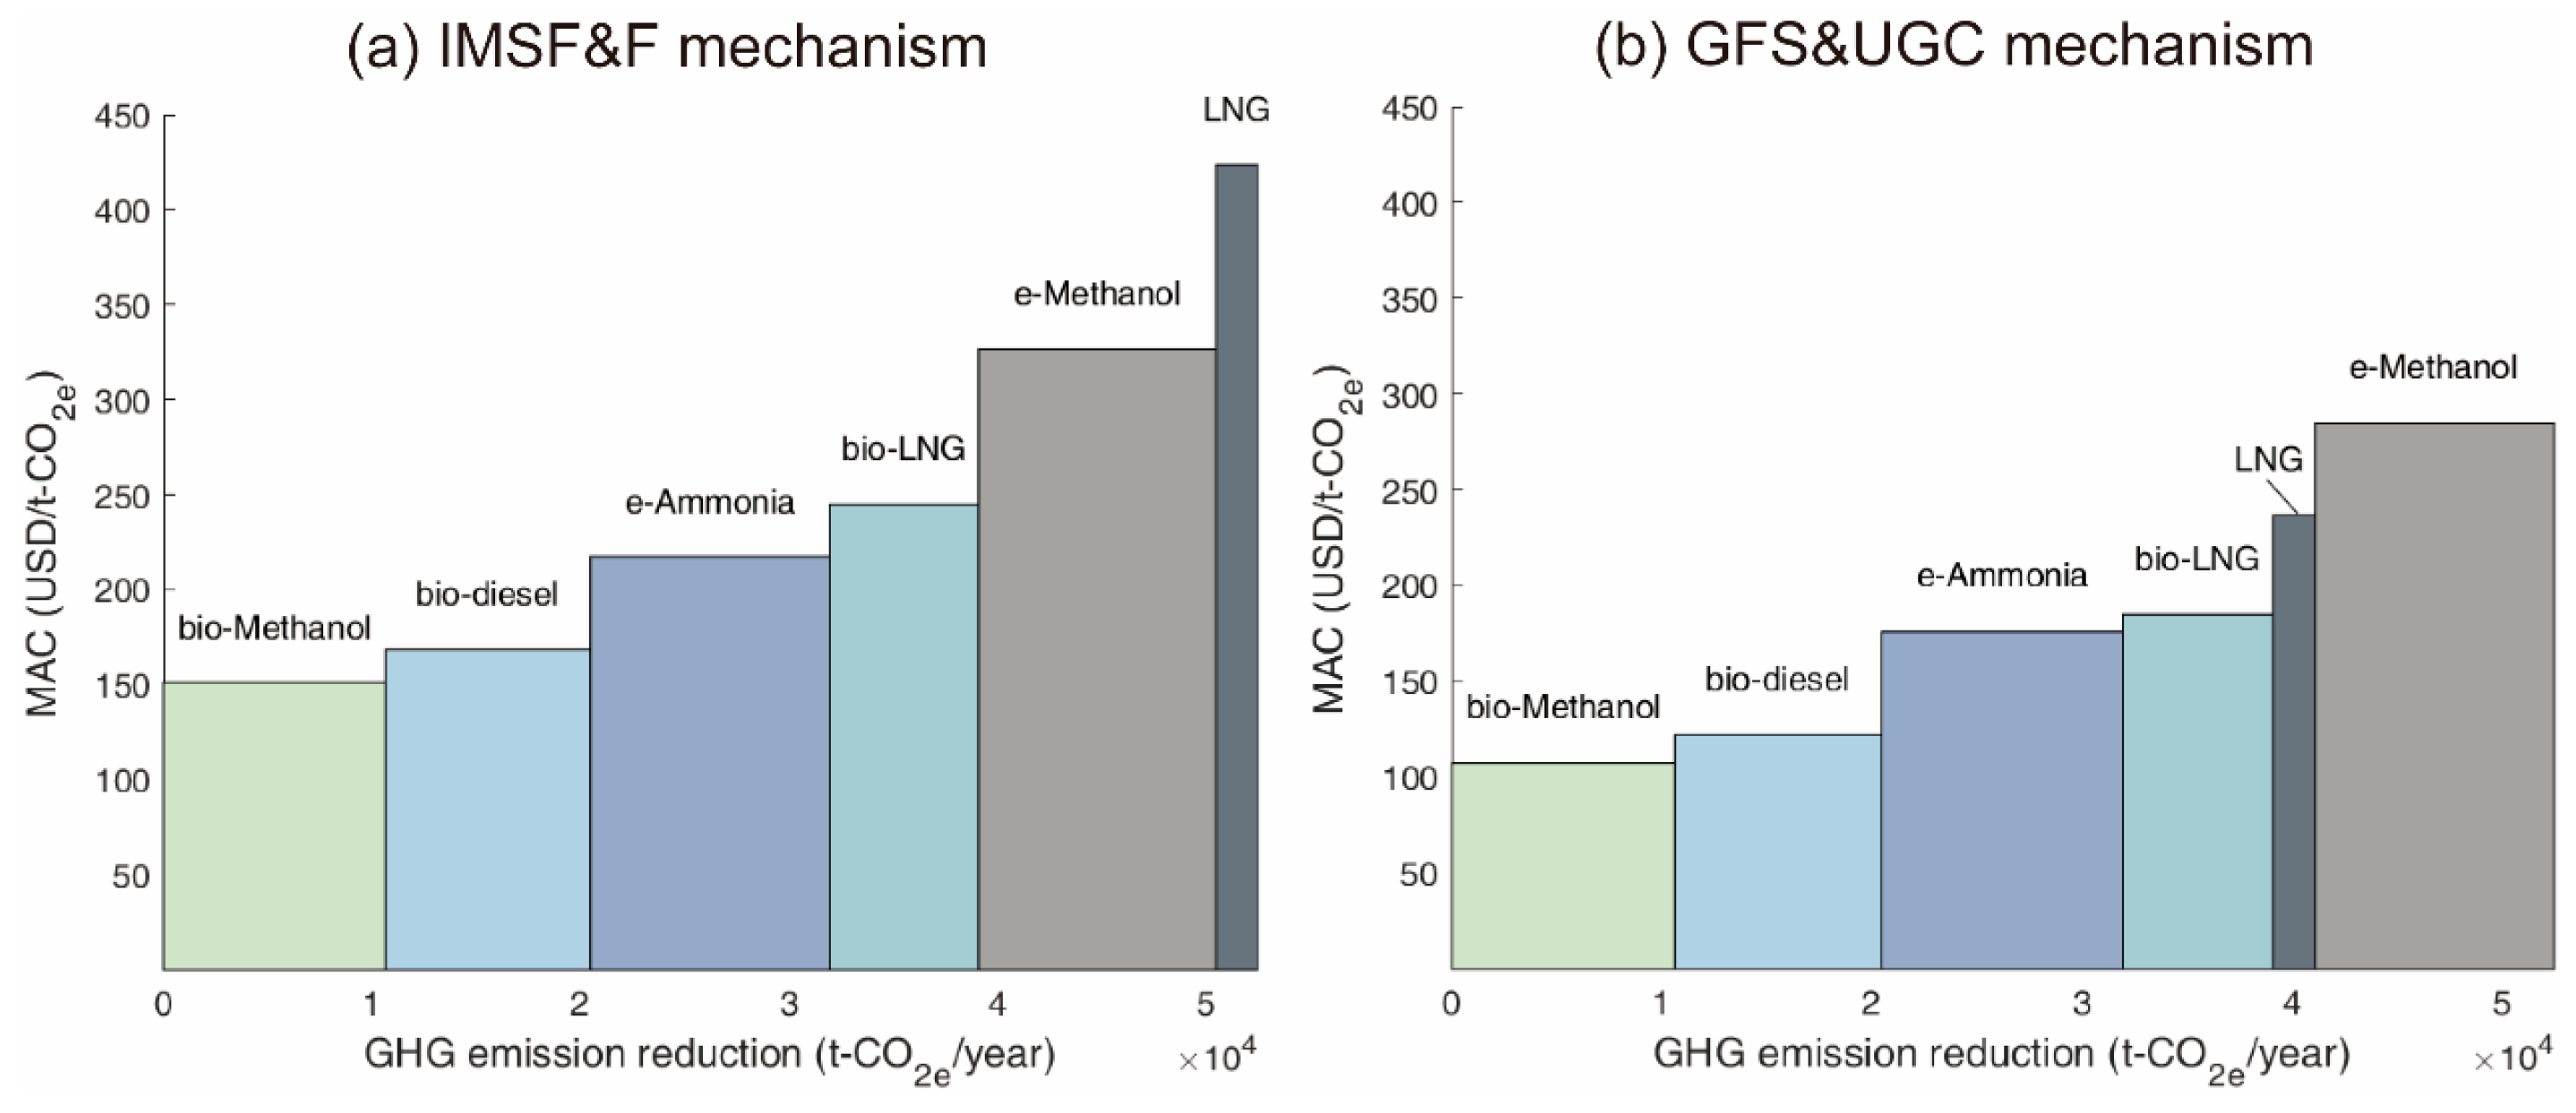
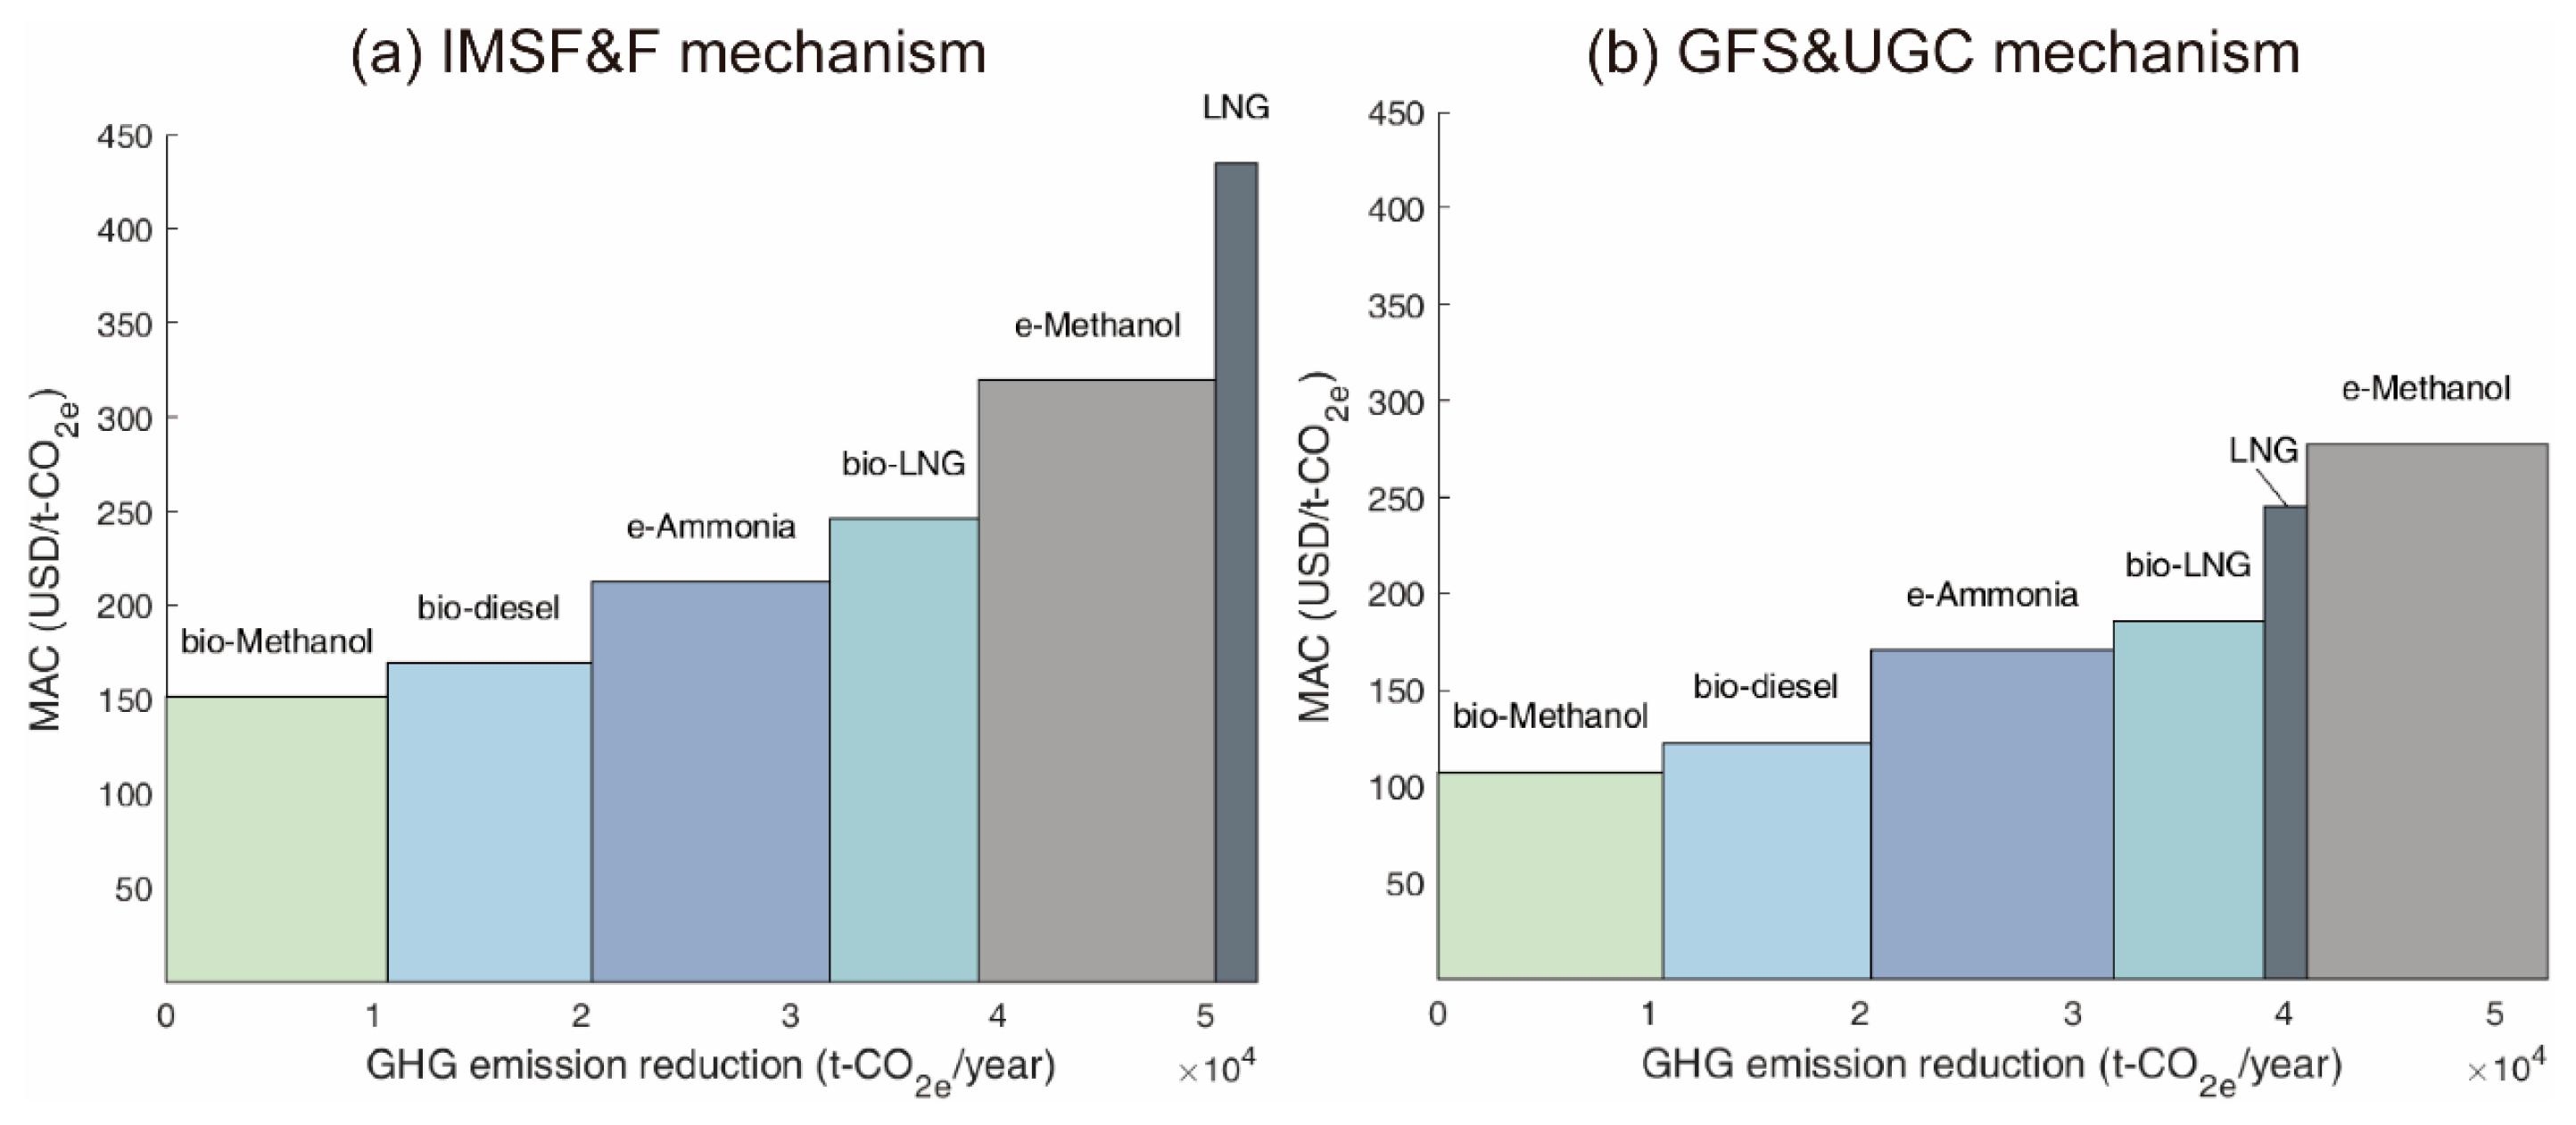
Figure 10 present the marginal abatement costs (MACs) for zero or near-zero (ZNZ) fuels under ±10% fluctuations in fuel price or carbon price. The MACs from the sensitivity analysis align closely with the reference MACs (Figure 3, Figure 4 and Figure 5), and the cost-effectiveness ranking of ZNZ fuels remains unchanged. This consistency confirms the robustness of our MAC model and the reliability of the findings [54]. The consequent variations in MACs resulting from ±10% fluctuations in fuel price or carbon price are listed in Table 7. The greatest variation in MAC was observed as USD −54/t-CO2e for e-Methanol, derived from fuel price fluctuations under both mechanisms in the 2030s.
Furthermore, to assess the relative importance of carbon price and fuel price, the ratios of Pcarbon%/Pfuel% in equivalent sensitivity scenarios (i.e., Pcarbon%/Pfuel% resulting in equivalent variation in MACs) were determined and are listed in Table 8. If Pcarbon%/Pfuel% is higher than the values above, MAC variation is dominated by carbon price, and vice versa. The results also showed that the equilibrium Pcarbon%/Pfuel% ratios under the GFS&UGC mechanism were greater than those under the IMSF&F mechanism, indicating that MACs were more sensitive to the carbon price (in PoolingEx and UGCEx) under the GFS&UGC mechanism.
Although the GHG pricing mechanism approved at MEPC 83 introduces more detailed regulations for pooling under the IMSF&F framework, our results—developed within the broader IMO net-zero framework—remain applicable to the latest mechanism. Given the significantly lower MACs observed under the GFS&UGC mechanism, we demonstrate that incorporating a universal GHG contribution component into the IMO’s GHG pricing mechanism can reduce shipowners’ economic losses and promote a just and equitable transition to sustainable shipping fuels. This finding offers policymakers valuable new insights.

5. Conclusions

This study predicts the cost-effectiveness of alternative fuels under two upcoming GHG pricing mechanisms based on the MACC methodology. By setting the parameters of the two policies for different years, the marginal abatement cost of each fuel was calculated and compared. The conclusions are as follows:
  • Compared to the IMSF&F mechanism, implementing the GFS&UGC mechanism yields higher NPVs and lower MACs, thereby reducing shipowners’ economic losses. Consequently, introducing a universal GHG contribution component into the latest IMO GHG pricing mechanism can promote a just and equitable transition to sustainable shipping fuels;
  • NPVs were all negative under both mechanisms and the investments of ZNZ-powered ships were not expected to be recouped by 2050 unless carbon prices rise dramatically to increase revenues;
  • Bio-Methanol and bio-diesel were the most cost-competitive ZNZs in the long term and the poor cost-effectiveness of e-Methanol could be attributed to its extremely high price. Bio-LNG performed better in cost-effectiveness than e-Ammonia in the 2030s while the case reversed in the 2040s and 2050. PoolingEx and UGCEx could significantly reduce the economic viability of LNG over the period;
  • MACs were more sensitive to fuel price compared to carbon price and GFIWtW under the price scope of this study, especially under the GFS&UGC mechanism;
  • The ratios of Pcarbon%/Pfuel% in equivalent sensitivity scenarios were determined to assess the relative importance of carbon price and fuel price.

Author Contributions

Conceptualization, J.Z. and P.S.; methodology, J.Z. and P.S.; software, J.Z.; validation, J.Z., P.S. and C.Z.; data curation, J.Z.; writing—original draft preparation, J.Z.; writing—review and editing, J.Z., P.S and C.Z.; visualization, J.Z.; supervision, C.Z.; funding acquisition, P.S. and C.Z. All authors have read and agreed to the published version of the manuscript.

Funding

The National Key R&D Program of China (2022YFB4301400).

Institutional Review Board Statement

Not applicable.

Informed Consent Statement

Not applicable.

Data Availability Statement

All data generated during this study are publicly accessible.

Conflicts of Interest

The authors declare no conflicts of interest.

References

  1. Xu, L.; Shen, C.; Chen, J. The impact of the Maritime Silk Road Initiative on the carbon intensity of the participating countries. Marit. Econ. Logist. 2024, 27, 331–349. [Google Scholar] [CrossRef]
  2. IMO. Report of Fuel Oil Consumption Data Submitted to the IMO Ship Fuel Oil Consumption Database in GISIS; IMO: London, UK, 2023. [Google Scholar]
  3. IMO. 2023 IMO Strategy on Reduction of GHG Emissions from Ships; IMO: London, UK, 2023. [Google Scholar]
  4. DNV. Report of the Comprehensive Impact Assessment of the Basket of Candidate GHG Reduction Mid-Term Measures—Full Report on Task 2 (Impacts on the Fleet); DNV: Høvik, Norway, 2024. [Google Scholar]
  5. IMO. Fourth-IMO-GHG-Study-2020-Full-Report-and-Annexes_Compressed; IMO: London, UK, 2020. [Google Scholar]
  6. Zhang, C.; Zhu, J.; Guo, H.; Xue, S.; Wang, X.; Wang, Z.; Chen, T.; Yang, L.; Zeng, X.; Su, P. Technical Requirements for 2023 IMO GHG Strategy. Sustainability 2024, 16, 2766. [Google Scholar] [CrossRef]
  7. Schinas, O.; Butler, M. Feasibility and commercial considerations of LNG-fueled ships. Ocean Eng. 2016, 122, 84–96. [Google Scholar] [CrossRef]
  8. ABS. LNG as Marine Fuel; ABS: Houston, TX, USA, 2022. [Google Scholar]
  9. ICCT. The Climate Implications of Using LNG as a Marine Fuel; ICCT: Washington, DC, USA, 2020. [Google Scholar]
  10. Parris, D.; Spinthiropoulos, K.; Ragazou, K.; Giovou, A.; Tsanaktsidis, C. Methanol, a Plugin Marine Fuel for Green House Gas Reduction—A Review. Energies 2024, 17, 605. [Google Scholar] [CrossRef]
  11. IRENA. Innovation Outlook: Renewable Methanol; IRENA: Abu Dhabi, United Arab Emirates, 2021. [Google Scholar]
  12. Perčić, M.; Vladimir, N.; Fan, A. Techno-economic assessment of alternative marine fuels for inland shipping in Croatia. Renew. Sustain. Energy Rev. 2021, 148, 111363. [Google Scholar] [CrossRef]
  13. Seo, Y.; An, J.; Park, E.; Kim, J.; Cho, M.; Han, S.; Lee, J. Technical–Economic Analysis for Ammonia Ocean Transportation Using an Ammonia-Fueled Carrier. Sustainability 2024, 16, 827. [Google Scholar] [CrossRef]
  14. Schwarzkopf, D.A.; Petrik, R.; Hahn, J.; Ntziachristos, L.; Matthias, V.; Quante, M. Future Ship Emission Scenarios with a Focus on Ammonia Fuel. Atmosphere 2023, 14, 879. [Google Scholar] [CrossRef]
  15. Kim, K.; Roh, G.; Kim, W.; Chun, K. A Preliminary Study on an Alternative Ship Propulsion System Fueled by Ammonia: Environmental and Economic Assessments. J. Mar. Sci. Eng. 2020, 8, 183. [Google Scholar] [CrossRef]
  16. Ahmed, S.; Li, T.; Zhou, X.Y.; Yi, P.; Chen, R. Quantifying the environmental footprints of biofuels for sustainable passenger ship operations. Renew. Sustain. Energy Rev. 2025, 207, 114919. [Google Scholar] [CrossRef]
  17. Sevim, C.; Zincir, B. Biodiesel and Renewable Diesel as a Drop-in Fuel for Decarbonized Maritime Transportation. In Potential and Challenges of Low Carbon Fuels for Sustainable Transport; Agarwal, A.K., Valera, H., Eds.; Springer: Singapore, 2022; pp. 319–345. [Google Scholar]
  18. Mohd Noor, C.W.; Noor, M.M.; Mamat, R. Biodiesel as alternative fuel for marine diesel engine applications: A review. Renew. Sustain. Energy Rev. 2018, 94, 127–142. [Google Scholar] [CrossRef]
  19. Kanchiralla, F.M.; Brynolf, S.; Mjelde, A. Role of biofuels, electro-fuels, and blue fuels for shipping: Environmental and economic life cycle considerations. Energy Environ. Sci. 2024, 17, 6393–6418. [Google Scholar] [CrossRef]
  20. Lindstad, E.; Lagemann, B.; Rialland, A.; Gamlem, G.M.; Valland, A. Reduction of maritime GHG emissions and the potential role of E-fuels. Transp. Res. Part D Transp. Environ. 2021, 101, 103075. [Google Scholar] [CrossRef]
  21. Shi, K.; Guan, B.; Zhuang, Z.; Chen, J.; Chen, Y.; Ma, Z.; Zhu, C.; Hu, X.; Zhao, S.; Dang, H.; et al. Perspectives and Outlook of E-fuels: Production, Cost Effectiveness, and Applications. Energy Fuels 2024, 38, 7665–7692. [Google Scholar] [CrossRef]
  22. Xing, H.; Stuart, C.; Spence, S.; Chen, H. Alternative fuel options for low carbon maritime transportation: Pathways to 2050. J. Clean. Prod. 2021, 297, 126651. [Google Scholar] [CrossRef]
  23. IRENA. A Pathway to Decarbonize the Shipping Sector; IRENA: Abu Dhabi, United Arab Emirates, 2021. [Google Scholar]
  24. Lagemann, B.; Lagouvardou, S.; Lindstad, E.; Fagerholt, K.; Psaraftis, H.N.; Erikstad, S.O. Optimal ship lifetime fuel and power system selection under uncertainty. Transp. Res. Part D Transp. Environ. 2023, 119, 103748. [Google Scholar] [CrossRef]
  25. Kanchiralla, F.M.; Brynolf, S.; Olsson, T.; Ellis, J.; Hansson, J.; Grahn, M. How do variations in ship operation impact the techno-economic feasibility and environmental performance of fossil-free fuels? A life cycle study. Appl. Energy 2023, 350, 121773. [Google Scholar] [CrossRef]
  26. Wang, Y.; Iris, Ç. Transition to near-zero emission shipping fleet powered by alternative fuels under uncertainty. Transp. Res. Part D Transp. Environ. 2025, 142, 104689. [Google Scholar] [CrossRef]
  27. Balcombe, P.; Brierley, J.; Lewis, C.; Skatvedt, L.; Speirs, J.; Hawkes, A.; Staffell, I. How to decarbonise international shipping: Options for fuels, technologies and policies. Energy Convers. Manag. 2019, 182, 72–88. [Google Scholar] [CrossRef]
  28. Iris, Ç.; Lam, J.S.L. A review of energy efficiency in ports: Operational strategies, technologies and energy management systems. Renew. Sustain. Energy Rev. 2019, 112, 170–182. [Google Scholar] [CrossRef]
  29. Zou, Y.; Xiao, G.; Li, Q.; Biancardo, S.A. Intelligent Maritime Shipping: A Bibliometric Analysis of Internet Technologies and Automated Port Infrastructure Applications. J. Mar. Sci. Eng. 2025, 13, 979. [Google Scholar] [CrossRef]
  30. Chen, X.; Wu, S.; Shi, C.; Huang, Y.; Yang, Y.; Ke, R.; Zhao, J. Sensing Data Supported Traffic Flow Prediction via Denoising Schemes and ANN: A Comparison. IEEE Sens. J. 2020, 20, 14317–14328. [Google Scholar] [CrossRef]
  31. IMO. Draft Amendments to MARPOL Annex VI Regulations for the Prevention of Air Pollution from Ships (Revised MARPOL Annex VI); IMO: London, UK, 2025. [Google Scholar]
  32. IMO. Updates on the International Maritime Sustainable Fuels and Fund (IMSF&F) Mechanism and Revised Draft Amendments to MARPOL Annex VI Using the Structure of the “IMO Net-Zero Framework”; IMO: London, UK, 2024. [Google Scholar]
  33. IMO. Proposal on a Combination of a GHG Fuel Standard and a Universal GHG Contribution; IMO: London, UK, 2024. [Google Scholar]
  34. Lagouvardou, S.; Lagemann, B.; Psaraftis, H.N.; Lindstad, E.; Erikstad, S.O. Marginal abatement cost of alternative marine fuels and the role of market-based measures. Nat. Energy 2023, 8, 1209–1220. [Google Scholar] [CrossRef]
  35. IMO. Report of the Comprehensive Impact Assessment of the Basket of Candidate GHG Reduction Mid-Term Measures—Full Report on Task 3 (Impacts on States); IMO: London, UK, 2024. [Google Scholar]
  36. Caprace, J.-D.; Marques, C.H.; Assis, L.F.; Lucchesi, A.; Pereda, P.C. Sustainable Shipping: Modeling Technological Pathways Toward Net-Zero Emissions in Maritime Transport (Part I). Sustainability 2025, 17, 3733. [Google Scholar] [CrossRef]
  37. Tu, H.; Liu, Z.; Zhang, Y. Study on Cost-Effective Performance of Alternative Fuels and Energy Efficiency Measures for Shipping Decarbonization. J. Mar. Sci. Eng. 2024, 12, 743. [Google Scholar] [CrossRef]
  38. Karvounis, P.; Theotokatos, G.; Boulougouris, E. Environmental-economic sustainability of hydrogen and ammonia fuels for short sea shipping operations. Int. J. Hydrogen Energy 2024, 57, 1070–1080. [Google Scholar] [CrossRef]
  39. Longva, T.; Eide, M.S.; Endresen, Ø.; Sekkesæter, Ø.; Helgesen, H.; Rivedal, N.H. Marginal abatement cost curves for CO2 emission reduction from shipping to 2050. Marit. Transp. Res. 2024, 6, 100112. [Google Scholar] [CrossRef]
  40. Martin, J.; Dimanchev, E.; Neumann, A. Carbon abatement costs for renewable fuels in hard-to-abate transport sectors. Adv. Appl. Energy 2023, 12, 100156. [Google Scholar] [CrossRef]
  41. Korberg, A.D.; Brynolf, S.; Grahn, M.; Skov, I.R. Techno-economic assessment of advanced fuels and propulsion systems in future fossil-free ships. Renew. Sustain. Energy Rev. 2021, 142, 110861. [Google Scholar] [CrossRef]
  42. EMSA. Potential of Synthetic Fuels for Shipping; EMSA: Lisbon, Portugal, 2024. [Google Scholar]
  43. Lee, H.; Lee, J.; Roh, G.; Lee, S.; Choung, C.; Kang, H. Comparative Life Cycle Assessments and Economic Analyses of Alternative Marine Fuels: Insights for Practical Strategies. Sustainability 2024, 16, 2114. [Google Scholar] [CrossRef]
  44. IMarEST. Marginal Abatement Costs and Cost Effectiveness of Energy-Efficiency Measures; IMarEST: London, UK, 2011. [Google Scholar]
  45. Koizumi, T. Biofuels and food security. Renew. Sustain. Energy Rev. 2015, 52, 829–841. [Google Scholar] [CrossRef]
  46. ClassNK. Pathway to Zero-Emission in International Shipping; ClassNK: Tokyo, Japan, 2023. [Google Scholar]
  47. Zhao, Y.; Liu, F.; Zhang, Y.; Wang, Z.; Song, Z.; Zan, G.; Wang, Z.; Guo, H.; Zhang, H.; Zhu, J.; et al. Economic Assessment of Maritime Fuel Transformation for GHG Reduction in the International Shipping Sector. Sustainability 2024, 16, 10605. [Google Scholar] [CrossRef]
  48. Wu, Y.; Guo, H.; Qi, J.; Wang, S.; Zhen, L. Ship refueling optimization for dual-fuel ships considering carbon intensity indicator rating limit and uncertain fuel prices. Multimodal Transp. 2024, 3, 100138. [Google Scholar] [CrossRef]
  49. DNV GL. Comparison of Alternative Marine Fuels; DNV GL: Høvik, Norway, 2019. [Google Scholar]
  50. EMSA. Update on Potential of Biofuels in Shipping; EMSA: Lisbon, Portugal, 2022. [Google Scholar]
  51. NABU. Methanol as a Marine Fuel; NABU: Berlin, Germany, 2023. [Google Scholar]
  52. Gore, K.; Rigot-Müller, P.; Coughlan, J. Cost assessment of alternative fuels for maritime transportation in Ireland. Transp. Res. Part D Transp. Environ. 2022, 110, 103416. [Google Scholar] [CrossRef]
  53. Jesus, B.; Ferreira, I.A.; Carreira, A.; Ove Erikstad, S.; Godina, R. Economic framework for green shipping corridors: Evaluating cost-effective transition from fossil fuels towards hydrogen. Int. J. Hydrogen Energy 2024, 83, 1429–1447. [Google Scholar] [CrossRef]
  54. Kesicki, F. What are the key drivers of MAC curves? A partial-equilibrium modelling approach for the UK. Energy Policy 2013, 58, 142–151. [Google Scholar] [CrossRef]
Figure 1. Flow chart of this study.
Sustainability 17 06001 g001
Figure 2. NPVs and compositions in IMSF&F and GFS&UGC.
Sustainability 17 06001 g002
Figure 3. MAC in the 2030s.
Sustainability 17 06001 g003
Figure 4. MAC in the 2040s.
Sustainability 17 06001 g004
Figure 5. MAC in 2050.
Sustainability 17 06001 g005
Figure 6. Sensitivity analysis results under the IMSF&F mechanism.
Sustainability 17 06001 g006
Figure 7. Sensitivity analysis results under the GFS&UGC mechanism.
Sustainability 17 06001 g007
Figure 8. MAC of sensitivity analysis in the 2030s.
Sustainability 17 06001 g008
Figure 9. MAC of sensitivity analysis in the 2040s.
Sustainability 17 06001 g009
Figure 10. MAC of sensitivity analysis in 2050.
Sustainability 17 06001 g010
Table 1. Basic information of the studied ship.
TypeDWTEnergy Consumption (GJ) [42]CapExa (×106 USD)
HFO, bio-dieselLNG, bio-LNGe-Methanol, bio-Methanole-Ammonia
Short-sea bulk carrier24,00012864003.362.162.40
a Obtained by subtracting the newbuilding cost of a diesel ICE vessel from the newbuilding cost of alternative-fuel-powered ships. The newbuilding cost of a diesel ICE vessel is based on [4] and the newbuilding cost of alternative-fuel-powered ships is based on the CapEx ratio in [43].
Table 2. Parameterization of PFuel,HFO,t and PFuel,i,t. Data from [4].
Fuel TypeFuel Price (USD/GJ)
2030s2040s2050
HFO10.59.58.5
LNG10.310.210.1
bio-LNG26.530.234.3
bio-diesel30.935.139.6
e-Ammonia46.539.131.2
e-Methanol61.253.545.0
bio-Methanol30.834.238.6
Table 3. Parameterizations in Equation (1).
ParameterMechanismUnit2030s2040s2050
Z a [6]Both%54.385.3100
PReward,t [4]BothUSD/t-CO2e b102.930.50
GFIReward [31]Bothg-CO2e/MJ199 c0 c
PPool,t d [4]IMSF&F USD/t-CO2e139229324
GFS&UGC USD/t-CO2e91133223
PUGC,t [4]GFS&UGCUSD/t-CO2e60120120
a Z values are the average of minimum reduction rates under the 90% scenario and the 130% scenario [6]. b The unit of reward price is converted to USD/t-CO2e by dividing the reward rate [4]. c GFIReward in the 2040s and 2050 have not yet been determined by IMO and this study assumes that it will decrease gradually. d PPool values in IMSF&F and GFS&UGC correspond to the emission exchange prices in scenario 12 and scenario 14, respectively [4].
Table 4. GHG emission factors for fuels.
Fuel TypeFuel CategoryGFIWtW (g-CO2e/MJ)αi (%)
HFOFossil fuel91.6 [46]Baseline
LNGFossil fuel76.1 [46]17.0%
bio-LNGZNZs36.0 [47]60.7%
bio-dieselZNZs15.0 [47]83.6%
e-AmmoniaZNZs2.6 [46]97.2%
e-MethanolZNZs3.0 [47]96.7%
bio-MethanolZNZs9.0 [47]90.2%
Table 5. The MACs (USD/t-CO2e) under the two mechanisms.
Fuel Type2030s2040s2050
IMSF&FGFS&UGCIMSF&FGFS&UGCIMSF&FGFS&UGC
LNG369240 424237 435245
bio-LNG253210 245185 246186
bio-diesel166132 169122 169123
e-Ammonia271241 217176 213171
e-Methanol401371 327285 320278
bio-Methanol156124 151107 152107
Table 6. The fuel prices, GFIWtW, and economic indicators in different references.
ObjectsParametersUnitsLNGbio-LNGbio-diesele-Ammoniae-Methanolbio-MethanolRef.
FleetFuel priceUSD/GJNull28.9NullNullNull22.6 [26]
GFIWtWg-CO2/MJNull4.0NullNullNull8.0
NPV×109 USD4.44 a
Fuel priceEUR/ton222.7NullNull1069NullNull [52]
GFIWtWg-CO2/MJ114.4NullNull0NullNull
NPV×109 EUR6.166 bNullNullNullNullNull
Fuel priceUSD/GJ8.825.030.429.137.226.5 [39]
GFIWtWt-CO2/t-fuel2.7500000
MACUSD/t-CO2e193.3 c
Fuel priceEUR/GJNull21.6Null33.840.421.9 [19]
MACEUR/t-CO2e1080NullNull290310250
Individual vesselFuel priceUSD/GJ15.828.930.8Null69.622.8 [34]
GFIWtWg-CO2e/MJ84.815.561.1Null1.032.2
MACUSD/t-CO2e−51.0889.82206.59Null628.4324.62
Fuel priceUSD/ton4251416Null7401174612 [37]
GFIWtWg-CO2e/MJ77.520.1Null04.511.0
MACUSD/t-CO2e45303Null352584284
Fuel priceEUR/GJNullNullNull32.1437.18Null [25]
MACEUR/t-CO2eNullNullNull256265Null
Fuel priceUSD/ton692NullNullNullNullNull [53]
GFIWtWt-CO2/t-fuel2.75NullNullNullNullNull
Total cost×109 USD3.4415 aNullNullNullNullNull
Fuel priceEUR/GJNullNull26.4Null33.019.2 [41]
Total cost d×109 EURNullNull0.19Null0.250.15
Fuel priceUSD/GJ8.5Null37.642.856.130.1 [43]
GFIWtWg-CO2/MJ205.0Null62.226.425.649.7
Total cost×109 USD0.285Null0.5290.6220.7480.456
NPV×109 USD0.169Null0.3040.3730.4430.273
a under a carbon levy of USD 150/t-CO2. b under a carbon levy of EUR 154.6/t-CO2. c The data represent the minimum average values calculated over the period 2030–2050. d The values are calculated based on data from the period 2030-2050.
Table 7. The consequent variations in MACs resulted from ±10% fluctuations in fuel price or carbon price.
Fuel Type2030s2040s2050
IMSF&FGFS&UGCIMSF&FGFS&UGCIMSF&FGFS&UGC
−10% Pfuel+10% Pcarbon−10% Pfuel+10% Pcarbon−10% Pfuel+10% Pcarbon−10% Pfuel+10% Pcarbon−10% Pfuel+10% Pcarbon−10% Pfuel+10% Pcarbon
bio-LNG−38−1−37−6−33+1−33−5−32+2−33−5
bio-diesel−32−4−31−7−28−2−28−7−27−1−28−7
e-Ammonia−41−5−41−8−32−3−32−7−32−3−32−8
e-Methanol−54−5−54−8−44−4−44−8−43−3−43−7
bio-Methanol−29−4−29−7−25−3−25−7−26−3−25−7
Table 8. The ratios of Pcarbon%/Pfuel% in equivalent sensitivity scenarios.
Fuel TypeMechanismPcarbon%/Pfuel%
2030s2040s2050
bio-LNGIMSF&F29.422.318.9
GFS&UGC6.97.47.6
bio-dieselIMSF&F8.313.816.2
GFS&UGC4.44.24.2
e-AmmoniaIMSF&F8.410.010.0
GFS&UGC5.24.44.3
e-MethanolIMSF&F11.313.313.3
GFS&UGC7.05.95.9
bio-MethanolIMSF&F6.79.910.4
GFS&UGC3.93.63.7
Disclaimer/Publisher’s Note: The statements, opinions and data contained in all publications are solely those of the individual author(s) and contributor(s) and not of MDPI and/or the editor(s). MDPI and/or the editor(s) disclaim responsibility for any injury to people or property resulting from any ideas, methods, instructions or products referred to in the content.

